Embed Size (px)
Citation preview
_____________________________________________________________________
CREDIT Research Paper
No. 12/01
_____________________________________________________________________
Origins of the Sicilian Mafia: The Market for Lemons
by
Arcangelo Dimico, Alessia Isopi, Ola Olsson
Abstract
Since its first appearance in the late 1800s, the origins of the Sicilian mafia have
remained a largely unresolved mystery. Both institutional and historical explanations
have been proposed in the literature through the years. In this paper, we develop an
argument for a market structure-hypothesis, contending that mafia arose in towns
where firms made unusually high profits due to imperfect competition. We identify
the market for citrus fruits as a sector with very high international demand as well as
substantial fixed costs that acted as a barrier to entry in many places and secured high
profits in others. We argue that the mafia arose out of the need to protect citrus
production from predation by thieves. Using the original data from a parliamentary
inquiry in 1881-86 on all towns in Sicily, we show that mafia presence is strongly
related to the production of orange and lemon. This result contrasts recent work that
emphasizes the importance of land reforms and a broadening of property rights as the
main reason for the emergence of mafia protection.
JEL Classification:
Keywords: mafia, Sicily, protection, barrier to entry, dominant position
_____________________________________________________________________
Centre for Research in Economic Development and International Trade,
University of Nottingham
_____________________________________________________________________
CREDIT Research Paper
No. 12/01
Origins of the Sicilian Mafia: The Market for Lemons
by
Arcangelo Dimico, Alessia Isopi, Ola Olsson
Outline
1. Introduction
2. Background and Literature Review
3. The Model
4. Econometric Specification and Results
5. Empirical Analysis
6. Conclusions
References
Appendices
The Authors
Arcangelo Dimico is Lecturer in Economics at Queens University Belfast, Alessia
Isopi is Lecturer in Economics at the University of Manchester and Ola Olsson is
Professor in Development Economics at the University of Gotheborg.
Corresponding Author: [email protected].
Acknowledgements
We gratefully acknowledge comments from Gani Aldashev, Jean-Marie Baland,
Paolo Casini, Giacomo de Luca, Halvor Mehlum, Kalle Moene, Oliver Morrissey,
Jean-Philippe Platteau, Oleg Shchetinin and from seminar participants in Gothenburg,
Leuven, Namur, and Oslo.
_____________________________________________________________________
Research Papers at www.nottingham.ac.uk/economics/credit/
Origins of the Sicilian Ma�a:The Market for Lemons
Arcangelo Dimico� Alessia Isopi Ola Olsson
May 1, 2012
Abstract
Since its �rst appearance in the late 1800s, the origins of the Sicilian ma�a haveremained a largely unresolved mystery. Both institutional and historical explanationshave been proposed in the literature through the years. In this paper, we develop anargument for a market structure -hypothesis, contending that ma�a arose in towns where�rms made unusually high pro�ts due to imperfect competition. We identify the produc-tion of citrus fruits as a sector with very high international demand as well as substantial�xed costs that acted as a barrier to entry in many places and secured high pro�ts inothers. We argue that the ma�a arose out of the need to protect citrus production frompredation by thieves. Using the original data from a parliamentary inquiry in 1881-86on Sicilian towns, we show that ma�a presence is strongly related to the production oforange and lemon. This result contrasts recent work that emphasizes the importance ofland reforms and a broadening of property rights as the main reason for the emergenceof ma�a protection.
Keywords: ma�a, Sicily, protection, barrier to entry, dominant positionJEL Codes:
1 Introduction
The Sicilian ma�a is arguably the most famous and one of the most successful criminal
organizations in the world. After its birth in Sicily, it soon in�ltrated the economic and
political spheres of Italy and the United States and has at times been considered a serious
threat to the rule of law in both countries. Although outcomes of the ma�a�s actions such
as murder, bombings, and embezzlement of public money have been readily observed since
its initial appearance around 150 years ago, its origins have largely remained a mystery.
In this paper, we provide a study of the origins of the Sicilian ma�a using data from
the later part of the 19th century. The main hypothesis that we explore is that the origins
of the ma�a is associated with unusually high pro�ts in certain sectors characterized by
imperfect competition. We argue that the source of this market imperfection, mainly in the
case of the market for citrus fruits such as orange and lemon, was to be found in high and
geographically varying �xed costs of production. These high barriers to entry implied that
only certain areas could cultivate the most pro�table crops and that producers in these areas
�Corresponding author. Email: [email protected]. We gratefully acknowledge comments from GaniAldashev, Jean-Marie Baland, Paolo Casini, Halvor Mehlum, Kalle Moene, Giacomo de Luca, Jean-PhilippePlatteau, Oleg Shchetinin and from seminar participants in Gothenburg, Leuven, Namur, and Oslo.
1
earned substantial pro�ts.1 The combination of high pro�ts, a weak rule of law, a low level
of interpersonal trust, and a large number of poor men, implied that lemon producers were
natural objects of predation by thieves. Given the impotence of the government in protecting
private property rights, lemon producers tended to hire the ma�a for private protection.
Using historical statistics and a formal model featuring households, producers, and a
ma�a, we develop the argument that the market for citrus faced an exceptionally high de-
mand during the late 1800s and that the high and regionally varying �xed costs of production
implied an imperfect market structure. In the empirical section, we then present data from
Sicilian towns that we have gathered from a parliamentary inquiry from 1881-86 (Damiani,
1886). Our results indicate that ma�a presence is strongly associated with the prevalence
of citrus cultivation, controlling for a number of other potential covariates. No other crop
or industry has a robust impact on ma�a presence. We interpret these �ndings as being
consistent with a market structure-explanation to the origins of the ma�a.
In a broad sense, our paper is related to the literature on the historical emergence of
"extractive" institutions that retard economic development and which can appear at critical
junctures in a country�s history (Acemoglu et al, 2006; Acemoglu and Johnson, 2012). The
ma�a is undoubtedly an example of an extractive institution that appeared during a critical
period in history (Italian uni�cation). Our analysis is however somewhat di¤erent from this
tradition since we emphasize the economic or market structure-related factors behind ma�a
institutions rather than political origins (such as a weak and oppressive Bourbon state in
Sicily with substantial social inequalities, as discussed further below).
Our theory and results further have strong associations with research on the "curse of
natural resources" (see van der Ploeg, 2011, for a recent overview). Our main �nding that the
boom in citrus exports in the late 19th century was a key factor behind the rise of the ma�a,
is well in line with the more recent observation that windfall gains from natural resources
often are associated with intense rent seeking. In this sense, resource windfalls might actually
deteriorate institutions even further if key groups in society believe that predation is more
pro�table than production (Mehlum et al, 2006; Congdon Fors and Olsson, 2007).
Our analysis of the Sicilian ma�a is most closely related to Bandiera (2003). Bandiera�s
main hypothesis is that it was the increase in land fragmentation as a result of the Bourbon-
era land reforms (1816-1860) that provided the breeding ground for ma�a protection. The
increase in the number of land owners increased the need for private protection. In Bandiera�s
model, a key feature is that the protection of one producer has a negative externality on other
producers since it makes them more likely objects of predation. The main explanation for
ma�a origins, according to this view, is thus political reform. In an empirical section where
she uses information from the report that Damiani (1886)2 submitted to the Parliament,
1We argue that citrus production was associated with unusually high barriers to entry due to the high�xed cost of planting trees and waiting several years for them to grow, the need to build protective walls tokeep thieves out, etc. Due to a large regional variation in the climate and soil suitability for growing lemon,the �xed costs for starting up a cultivation was very di¤erent across towns.
2The bill which set up the Parliamentary Inquiry was passed in 1877 but the inquiry in Sicily only startedin 1881. In 1883, Damiani sent surveys to mayors and pretori, and the inquiry was �nally completed in June1885.
2

Bandiera (2003) �nds that a variable capturing land fragmentation is a signi�cant determi-
nant of ma�a presence.
Whilst our analysis also identi�es landowners�demand for private protection as the main
process through which the ma�a was mobilized, our analysis explicitly focuses on market
structure rather than on land fragmentation as the key explanation. In addition, we also
improve in terms of sample size with respect to Bandiera (2003) by using a primary source
of data regarding answers that pretori (lower court judges) provided to questions related
to crimes within the survey that Damiani sent out in 1883 (see Figures A1 and A2 in the
Appendix). Whilst Bandiera (2003) relies on a sample size limited to 70 towns located in the
western part of the island where land was more fractionalized (which considerably reduces
the cross-county variation in the variable), we use information on all available Sicilian towns
(127 in total) for which pretori provided answers. Using this more complete sample, we �nd
that the land fragmentation variables indeed explain some of the variation in ma�a presence
but we also �nd some support for an association of ma�a with the prevalence of large scale
plantations. The latter �nding confounds the interpretation that ma�a appeared as a result
of land reform. Our main result is that the most robust determinant of ma�a activity is
production of citrus fruits.
The information available from the Damiani�s Inquiry has previously been used also by
other scholars studying the origin of the ma�a.3 Cutrera (1900), a police o¢ cer in Palermo,
also provides some �gures on the level of ma�a in almost all Sicilian cities at the beginning of
the 20th century which are based on information from police headquarters. However, these
�gures refer to the situation almost 20 years later (than the Inquiry). Over these twenty
years, ma�a extended its activity to cities which initially were not a¤ected and because of
that, the data from Cutrera is more useful to understand the temporal evolution of ma�a.
This is con�rmed by Gambetta (1996) who argues that in the period between the late 1870s
and late 1890s, ma�a evolved quite markedly as a results of "economic and political con�icts
among local factions, especially in connections with the institutional changes a¤ected by the
Italian state between 1869-1890" (Gambetta, 1996, p 83).
The working paper by Buonanno et al (2012) also studies the importance of export
markets for ma�a appearance and use the data in Cutrera (1900).4 They �nd in particular
that sulphur production had a strong association with ma�a presence in 1900. However,
Buonanno et al. (2012) do not develop an explicit argument for why export revenues were
associated with ma�a revenues in certain sectors. In the current paper, we present a formal
model as well as detailed data to motivate our hypothesis of a link between pro�ts in citrus
production and the emergence of ma�a protection.
Our analysis is related to a long tradition of works in anthropology, sociology and history
on the Sicilian ma�a. The classical contributions include early investigations such as Villari
(1875), Sonnini and Franchetti (1877) and Colajanni (1885, 1895). A more recent author-
itative scholarly work is for instance the political economy treatment in Gambetta (1996)
3See for instance Colajanni (1885, 1895), Hess (1973), Arlacchi (1986), Catanzaro (1992), Gambetta (1996),Dickie (2004), Lupo (2007), etc.
4This paper emerged in parallel with ours without any of us being aware of the other groups�work.
3
who considers the roots of the ma�a to be found in the protection business, a result which
to some measure we are able to con�rm. Dickie (2004) provides a historical treatment of the
ma�a in Sicily and the United States and emphasizes the crucial role of lemon plantations
in the Conca d�Oro area as the birth place of the ma�a.5
In summary, we believe the paper makes the following contributions to the existing
literature: Firstly, it provides a formal model of how market structure and the prevalence of
a cross-sectional variation in �xed costs a¤ect the demand for ma�a protection. Secondly,
we o¤er the most comprehensive empirical analysis to date on the origins of the ma�a in the
1880s and identify a novel explanation for the emergence of ma�a during the period.
The paper is structured as follows: In section 2, we give a brief background to the history
of the ma�a and to the Sicilian economy. In section 3, we outline the formal model. Section
4 includes the econometric speci�cation and a discussion of the data, whereas the main
empirical results are found in section 5. Section 6 concludes.
2 Background and Literature Review
2.1 Organized Crime
According to Gambetta (1996), ma�a can be de�ned as a sort of secret organization which
provides private protection. Its origin is almost impossible to track given the secrecy feature
of its operations. The �rst evidence we have about the presence and way of operating of
this secret sect (cosca) is an account by Dr Galati in 1872 who denounced the presence of
some "man of honor" who made an increasing use of violence and extortion in order to force
him to sell his lemon grove located just outside Palermo (Dickie, 2004). His notes were
the �rst document which brought to light a business which at the time was only known in
Sicily. When the Minister of Home A¤airs came to know about Galati�s notes he soon asked
for a written report from the chief of police in Palermo and then he ordered parliamentary
inquiries (the Bonfadini Inquiry in 1876 and later the Damiani Inquiry in 1881-5) about the
economic conditions and crime in Sicily.
Since 1872, the structure of organized crime organisations in Sicily and in other parts
of Italy have changed considerably. The organization which almost nobody knew about has
become famous throughout the world. In terms of revenues, Ma�a S.P.A.6 can be considered
as one of the largest and most successful business in Italy. In one of the latest reports from
the Italian Minister of Home A¤airs, it has been estimated that revenues from the only
informal sector related to ma�a amount to almost 180 billion of euro (Ru¤olo et al., 2010)7.
In terms of GDP, revenues from ma�a-related businesses represent almost 12 percent of the
total Italian GDP and equal to the sum of Estonia�s, Croatia�s, Romania�s, and Slovenia�s
total GDPs. If we consider the four Southern Italian regions with the highest incidence5See also Lupo (2009) for a general history and Monroe (2009) for a description of the agricultural practices
in Sicily at the time.6S.P.A. is a form of limited liability company and Ma�a S.P.A. is normally used to refer to ma�a-business
not related to criminal activity (i.e. not related to drugs).7Uno¢ cial estimates which also try to consider revenues from criminal activity put the estimates to 750
billion of euro, i.e. almost half of the Italian GDP.
4
of ma�a (Sicilia, Calabria, Campania, and Puglia) then the di¤erent criminal organizations
(Sicilian ma�a, Ndrangheta, Camorra, and Sacra Corona Unita) operate in almost 610 towns
enrolling almost 13 millions of people across businesses accounting for almost 22 percent of
the total Italian population and 77 percent of the population in these four regions (Ru¤olo
et al., 2010). So far the Italian ma�a is the most successful form of organized crime in
Europe and only comparable to the Chinese, Japanese, Russian and South American crime
organizations in terms of business.8 It is not surprising therefore that the Italian ma�a
represents one of the most worldwide debated issues which has attracted the interest of
social scientists, politicians, journalists, and movie makers.
Given the economic and social relevance of the issue, it is natural to wonder why these
forms of organized crime emerged only in a small part of the country and what factors
explain the cross-regional presence of ma�a. Most of the economic analysis on organized
crime focuses on weak institutions, predation, and enforcement of property rights (Fiorentini
1999, Grossman 1995, Anderson, 1995, Skaperdas and Syropoulus, 1995, Skaperdas, 2001).
Grossman (1995) considers ma�a as an alternative enforcer of property rights and he models
the emergence of ma�a using a contest success function in which the state faces a competition
from the ma�a in providing such a public good. Skaperdas (2001) also considers protection
of property rights in presence of a vacuum of power as a main factor of ma�a development.
Using a model with two actors (a self-governing community and ma�a) and potential robbers
he shows that in absence of an enforcer of property rights ma�a can represent a sort of second
best. Skaperdas and Syropoulous (1995), on the other hand, use a simple predation model
where the agent with the lower marginal productivity in military technology invests less in
military expenditure and then the rent is shared accordingly.
The idea of a weak state and private protection is well illustrated by Don Calo Vizzini,
one of the historical bosses of the Villalba ma�a. In an interview with Indro Montanelli
he said that "...the fact is that in every society there has to be a category of people who
straighten things out when situations get complicated. Usually they are functionaries of the
state. Where the state is not present, or where it does not have su¢ cient force, this is done
by private individuals" (Montanelli, 1949).
Related to the weak institutions-hypothesis there is also a loss of social capital and public
trust which may determine the development of a private provider of protection. Putnam
(1993) for example analyses the loss of social capital in Southern Italy due to the several
foreign dominations experienced by the region. Gambetta (1996) also considers the private
trust rather than the public trust important for the development of ma�a in Southern Italy.
Social capital and a loss of public trust may also a¤ect the development of organized crime
because of kinship relations, corruption, etc. (see Fukuyama 2000; Gambetta, 2009; Levi,
2006; Hardin, 1999; Newton, 2001).
Besides the weak state hypothesis, there is also a part of the literature which looks at
regulatory regimes imposed on legal �rms. However this second part of the literature is more
8Senator John Kerry (1997) argues that the �ve most in�uential ma�a organizations (the Italian, theChinese, the Japanese, the Russian and the South American) represent the third largest business in the worldrepresenting a huge threat to common market rules and democracy.
5
likely to explain the evolution of organized crime rather than the origin, even though it may
contribute in some way to the appearance of ma�a. For example, Anderson (1995) argues
that a high regulatory cost may induce �rms to switch activities to irregular markets where
contracts and property rights are enforced by ma�a. Tanzi (1995) and Smith (1976) also
focus on the regulation burden.
Regarding the economic costs of organized crime, Reuter (1987) and Gambetta and
Reuter (1995) consider the e¤ect of organized crime on the enforcement of cartel agreements
in legal markets. By enforcing a cartel, ma�a has a direct e¤ect on individuals� choices
and e¢ cient allocation of resources. Anderson (1979) considers scale e¤ects of developing
business in legal markets in order to increase pro�ts in illegal markets, which then tend to
distort a competitive market. The distortional e¤ect of ma�a-business in legal market is
made clear by the President of the Commission on Law Enforcement and Administration of
Justice (1967) who focuses on the competition disruptive e¤ect of organized crime reached
through the use of predatory practices toward legal business.
Even though the above literature provides plausible explanations for the origin of ma�a
it is still di¢ cult to understand why we observe a huge variation across regions experiencing
very similar conditions. If a weak state, a high regulation burden, and a lack of public trust
are the factors which matter for the development of ma�a, then we should not observe any
local variation within the territory at hand. However this is not true at all. Across counties
and villages exposed to these same conditions there is a huge variation. Actually, organized
forms of crime normally appear only in a small number of localities and then they expand
over the entire region. It is therefore important to understand what is speci�c to these few
localities where ma�a appears. With relation to Sicily, Gambetta (1996) and Bandiera (2003)
focus on land fractionalization policies and the emergence of a private market of protection.
Villari (1875) focuses on hierarchical social relations and the emergence of a greedy middle
class (gabelloti).
2.2 Historical Origins of the Ma�a in Sicily
The Sicilian ma�a represents so far the most passionately debated and represented form of
organized crime. However, the local origins are still not well understood. The heritage of
the Spanish domination, the feudalism, the development of a "greedy" middle class (gabel-
loti), the fractionalization of land are all possible sources which have been discussed in the
literature. Above all there is an institutional absence which allowed a private organization
to provide a typical public good.
Pasquale Villari (1875) is one of the �rst Italian politician/economist who tried to analyse
the origin of the ma�a in Sicily. According to Villari the development of ma�a is mainly
explained by class divisions in Sicily during the 19th century. Villari reckons that in Sicily
there are three classes: 1) landlords, 2) a middle class (gabelloti), 3) peasants which are
normally exploited by the gabelloti. The gabelloti used to lease the land from landlords
and then they rented small pieces of this land to peasants. Peasants worked the land and
then they gave back to the gabelloti a share of the harvest depending on the kind of contract
6
stipulated. These contracts were relatively short and the gabelloti literally exploited peasants
in order to get the maximum out of it. Most of the times, when the yield was not enough,
peasants had to borrow from the gabelloti at interest rates which made it impossible to pay
back the debt. Through the use of usury and the exploitation of peasants they increased
their power and became a private provider of protection and justice.
One year later, in 1876, Sonnino and Franchetti initiated a private Inquiry on the eco-
nomic status of Sicily which was then published in 1877. Apart from the institutional de�-
ciency and the poor economic conditions of peasants they consider the latifund (large scale
plantations almost similar to feudal systems) as one of the main factor of the development
of ma�a. According to Sonnino and Franchetti (1877), the patronage and individualistic
behaviour, that developed in Sicily were the result of the feudal heritage and of the typical
social relationships developed in latifund. Because of the lack of social capital, individuals
preferred to refer to a private form of protection and justice rather than a public one. Simi-
lar arguments are developed by Doria (1710) when he considers the Bourbon domination as
detrimental for the fede pubblica (public trust). As a result, the fede privata (private trust)
was the only one on which individuals could rely on.
Colajanni (1885) also considers the latifund and the related economic under-development
as the main factor for the development of ma�a. From the economic and social point of
view Colajanni (following Damiani, 1886) divides the island in three di¤erent regions: 1)
Catania and Messina where the economic conditions of peasants are good; 2) Siracusa,
Trapani, Caltanissetta, and Palermo where the economic conditions are mediocre; 3) Girgenti
where peasants are very poor. The �rst group of towns is characterized by: i) a higher
fractionalization of the land (maximal in Messina) with peasants owning from 4 to 8 hectares
of land; ii) the largest concentration of lemon gardens, vineyards, and olive groves; iii) the
highest level of literacy. On the other hand, the province of Girgenti is characterized by the
highest concentration of land, non-intensive farming, the lowest level of literacy, and a large
number of sulphur mines. Given that the province of Girgenti ranked the highest in terms
of number of murders, criminal convictions, and share of peasants convicted for robbery,
Colajanni (1885) considers the latifund and the presence of sulphur mines as conditions for
the development of ma�a.
Coming to recent years the origin of ma�a has also been discussed in Gambetta (1996),
Dickie (2004), and Lupo (2009). While Lupo and Dickie consider pro�ts related to the
industry of lemons in the West part of the island as a pre-condition for the development of
the ma�a, Gambetta focuses on the division of land resulting from the abolition of feudalism
and other policies introduced by the Italian government after 1860 (i.e. sale of land owned
by the church and the crown before the uni�cation). These policies opened a market for
private protection in which ma�a acted as an incumbent. The e¤ect of the fractionalization
of the land is also analysed further by Bandiera (2003).
Compared to the existing literature we focus on a market structure-hypothesis which
should explain the cross-regional variation in the appearance of ma�a in Sicily. Our hypoth-
esis is related to the huge pro�ts that in the second half of the 19th century were associated
7
with the production of lemons. This sector was characterized by huge initial �xed costs and
barriers to entry represented by the particular climatic conditions needed by this plant. This
sectorial �xed cost provided to Sicily a natural dominant position in international markets
making the business extremely lucrative. As a consequence, ma�a could extort part of these
pro�ts in order to provide protection. This would have not been possible in a competitive
market with free entry where pro�ts are quite low and therefore with nothing to extort.
We believe our market structure-hypothesis in important ways complement existing the-
ories of ma�a emergence, for instance those focusing on institutional factors. In addition,
our hypothesis is also extremely consistent in terms of the timing of the origin of ma�a. The
lemon production in Sicily started booming in 1840s-50s (when the international demand
started increasing) and by 1880 (the period for which we have data on Ma�a) Sicily became
the largest supplier of lemons and lemon by-product in the world covering more than 78
percent of the total US import lemons which at the time was the largest importer. This
timing consistence reassures us about the identi�cation of pro�ts in the sector as a main
driver of the cross-regional variation in the appearance of ma�a in Sicily.
2.3 The Sicilian Economy
Sicily is the largest island in the Mediterranean and has always been considered as a strategic
location because of its central position within the Mediterranean trade routes. Because of
its importance, its past is marked by continuous foreign dominations. After having been
colonized by Greeks, it was controlled by Romans, followed by Byzantine, Arabs, Normans,
Spanish, French, and then Spanish again. This long period of di¤erent foreign domination
has shaped its long term development. In fact, from the economic and institutional point of
view Sicily has always been one of the most lagging regions in Italy.
Before joining the Reign of Italy in 1860 the island was still under Spanish domination and
the vast majority of the population was employed in agriculture. The production system in
agriculture was still based on a typical feudal system with lords who owned the largest share
of the land and peasants who worked either under a sharecropping, a �xed rent contract,
or on a daily basis. The French who reigned over the island from 1805 to 1815 tried to
modernize this archaic system by introducing a new constitution in 1812 which abolished
the feudal privileges and the primogeniture. However, after Ferdinand I of the Two Sicilies
took back power over the island in 1815 this constitution was abolished (in 1816) and most
of the feudal privileges (including the primogeniture) were re-established. In 1840 there were
still 127 princes, 78 dukes, 130 marquises and an unknown number of earls and barons who
had a complete control over the largest share of the land (Travelyan, 2001).
The situation did not change much after Sicily joined the Reign of Italy. In 1887 the
number of landowners was still the lowest in Italy with an average number smaller than 2.05
owners per hundred citizens compared to 15 owners per hundred in Piedmont (Colajanni,
1885). In addition almost 56 percent of the population employed in agriculture owned less
than one hectare of land and most of these laborers used to work on daily basis for a
landowner who paid an average wage of less than one Lira per day.
8
Despite its underdeveloped economy, Sicily was a leading producer of wheat, olive oil,
wine, and citrus. In particular, the island had a dominant position in the production of citrus
which according to Pescosolido (2010) represented almost 73 percent of the total production
of citrus in Italy. Table 1 reports the distribution of lemon trees in the South of Italy in
1898. Palermo and Messina are the two provinces with the largest absolute number of lemon
trees, accounting for almost 59.5 percent of the total trees in the South of Italy. The number
of lemon trees is also quite large in the province of Catania, accounting for an approximate
12 percent of the total. Outside Sicily, Reggio Calabria is also a large producer of lemons
with an absolute number of trees equal to 1,232,675 (almost 18 percent). Few trees were also
planted in the centre (almost 798,214 trees) and in Northern Italy (almost 564,559), making
a total of almost 8,287,758 trees all over the peninsula. The total number of trees in Sicily
amounts to almost 70 percent of all trees in Italy.
Table 1: Production of Lemons in Italy
The dominant position was consolidated throughout the 19th century as a result of a
signi�cant expansion of the sector which brought the total surface area devoted to the pro-
duction of citrus from the 7,695 hectares in 1853 to the 26,840 hectares in 1880 (Pescosolido,
2010) 9. The expansion was the result of the large returns associated with the production
of citrus which Monroe (1909) estimates to be almost $200 (at current 1908 US dollars) per
acre providing a net pro�t of more than $150 per acre (Monroe, 1909). The importance of
these �gures is made clear by Dickie (2004) when he argues that "citrus cultivation yielded
more than sixty times the average pro�t per hectare for the rest of the island" (Dickie, 2004,
p 39)
With the production of citrus the export also grew for the entire century. In 1850 the
quantity of citrus exported was equal to 250,000 quintals while in the period 1881-85 the
quantity exported became almost equal to 949,000 (Pescosolido, 2010). A large share of
this production was exported abroad mainly to the US which represented one of the largest
importer of Sicilian citrus.
Table 2 provides a preliminary picture of the importance of the USA for the export
of oranges and lemons. The total number of boxes of oranges and lemons exported into
the USA in 1893 is 1,061,624 and 2,595,702 respectively. Given that the total production
of oranges and lemons in 1893 was 933,306,525 oranges and 1,362,975,888 lemons (Di San
Giuliano, 1894) and considering that each box of oranges contained almost 240 fruits and
each box of lemons contained almost 360 lemons, we can estimate that the total boxes of
oranges and lemons in 1893 were equal to 3,888,777 and 3,787,044 respectively. Therefore
almost 28 percent of the production of oranges and 68 percent of the production of lemon
was exported to the USA.
Table 2: Export to the USA9The international demand of lemons and oranges started increasing since the end of the 19 century after
Lind, an o¢ cer and naval surgeon in the British Royal Navy, established the fact that oranges and lemonswere e¤ective in curing scurvy
9
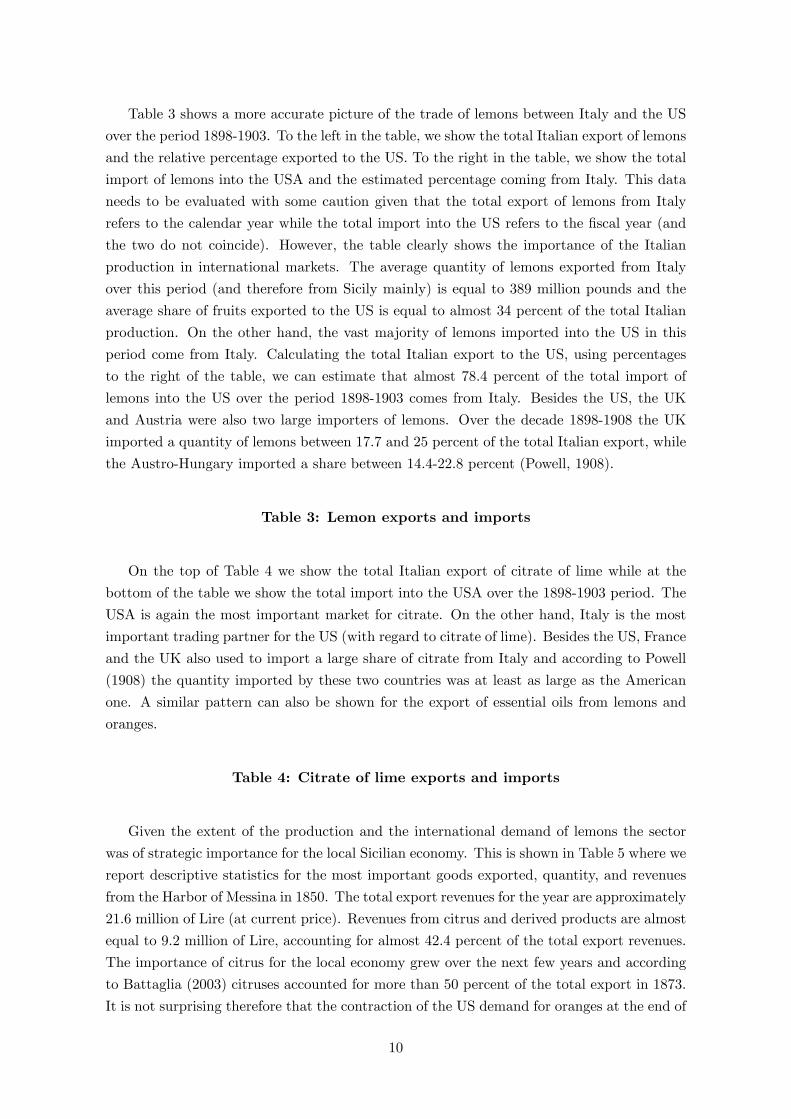
Table 3 shows a more accurate picture of the trade of lemons between Italy and the US
over the period 1898-1903. To the left in the table, we show the total Italian export of lemons
and the relative percentage exported to the US. To the right in the table, we show the total
import of lemons into the USA and the estimated percentage coming from Italy. This data
needs to be evaluated with some caution given that the total export of lemons from Italy
refers to the calendar year while the total import into the US refers to the �scal year (and
the two do not coincide). However, the table clearly shows the importance of the Italian
production in international markets. The average quantity of lemons exported from Italy
over this period (and therefore from Sicily mainly) is equal to 389 million pounds and the
average share of fruits exported to the US is equal to almost 34 percent of the total Italian
production. On the other hand, the vast majority of lemons imported into the US in this
period come from Italy. Calculating the total Italian export to the US, using percentages
to the right of the table, we can estimate that almost 78.4 percent of the total import of
lemons into the US over the period 1898-1903 comes from Italy. Besides the US, the UK
and Austria were also two large importers of lemons. Over the decade 1898-1908 the UK
imported a quantity of lemons between 17.7 and 25 percent of the total Italian export, while
the Austro-Hungary imported a share between 14.4-22.8 percent (Powell, 1908).
Table 3: Lemon exports and imports
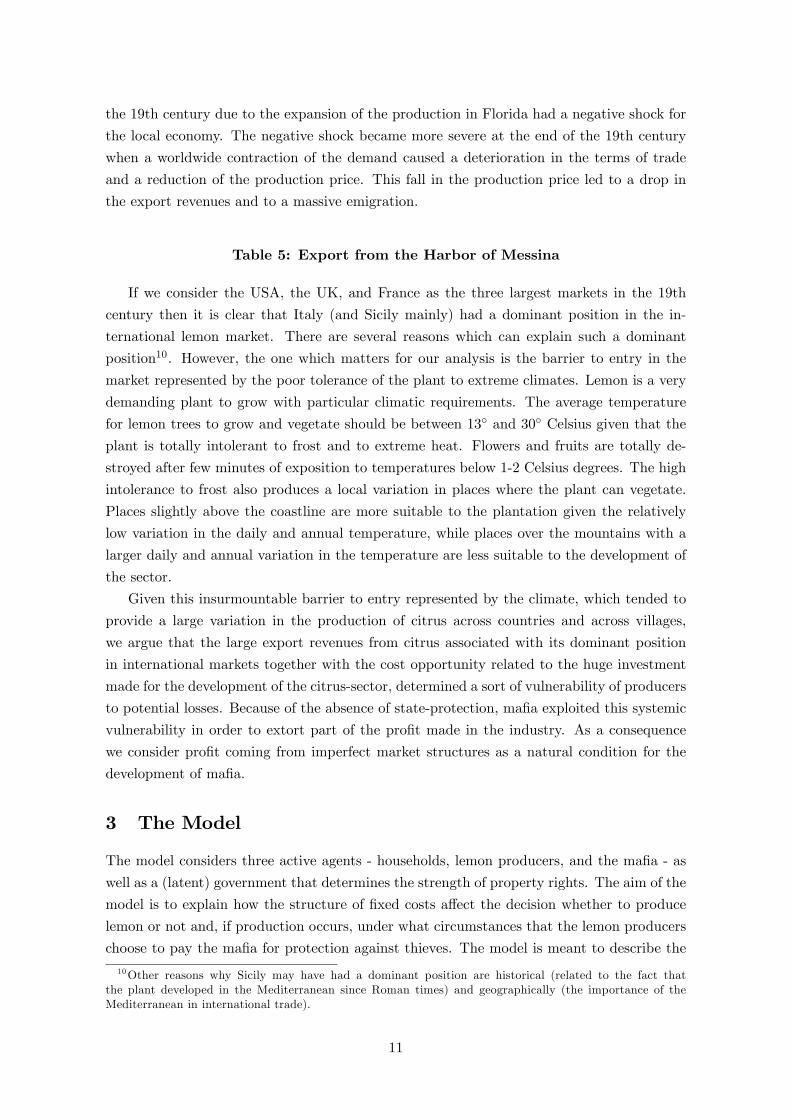
On the top of Table 4 we show the total Italian export of citrate of lime while at the
bottom of the table we show the total import into the USA over the 1898-1903 period. The
USA is again the most important market for citrate. On the other hand, Italy is the most
important trading partner for the US (with regard to citrate of lime). Besides the US, France
and the UK also used to import a large share of citrate from Italy and according to Powell
(1908) the quantity imported by these two countries was at least as large as the American
one. A similar pattern can also be shown for the export of essential oils from lemons and
oranges.
Table 4: Citrate of lime exports and imports
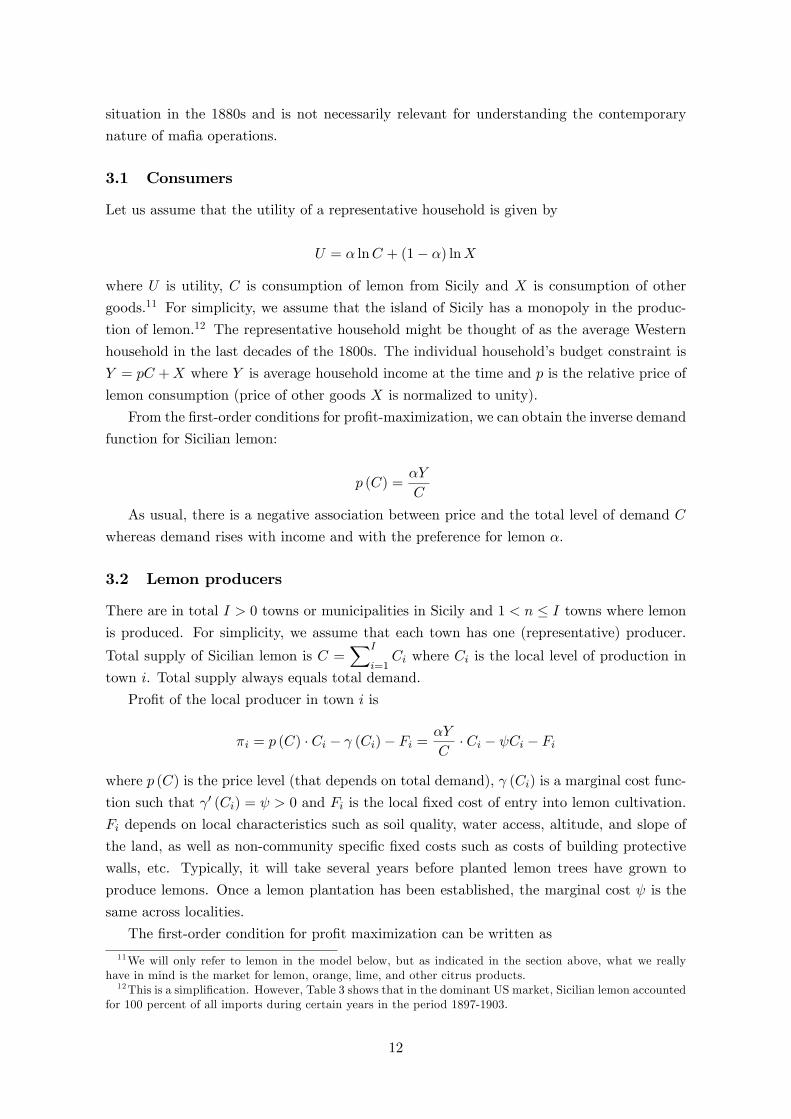
Given the extent of the production and the international demand of lemons the sector
was of strategic importance for the local Sicilian economy. This is shown in Table 5 where we
report descriptive statistics for the most important goods exported, quantity, and revenues
from the Harbor of Messina in 1850. The total export revenues for the year are approximately
21.6 million of Lire (at current price). Revenues from citrus and derived products are almost
equal to 9.2 million of Lire, accounting for almost 42.4 percent of the total export revenues.
The importance of citrus for the local economy grew over the next few years and according
to Battaglia (2003) citruses accounted for more than 50 percent of the total export in 1873.
It is not surprising therefore that the contraction of the US demand for oranges at the end of
10
the 19th century due to the expansion of the production in Florida had a negative shock for
the local economy. The negative shock became more severe at the end of the 19th century
when a worldwide contraction of the demand caused a deterioration in the terms of trade
and a reduction of the production price. This fall in the production price led to a drop in
the export revenues and to a massive emigration.
Table 5: Export from the Harbor of Messina
If we consider the USA, the UK, and France as the three largest markets in the 19th
century then it is clear that Italy (and Sicily mainly) had a dominant position in the in-
ternational lemon market. There are several reasons which can explain such a dominant
position10. However, the one which matters for our analysis is the barrier to entry in the
market represented by the poor tolerance of the plant to extreme climates. Lemon is a very
demanding plant to grow with particular climatic requirements. The average temperature
for lemon trees to grow and vegetate should be between 13� and 30� Celsius given that the
plant is totally intolerant to frost and to extreme heat. Flowers and fruits are totally de-
stroyed after few minutes of exposition to temperatures below 1-2 Celsius degrees. The high
intolerance to frost also produces a local variation in places where the plant can vegetate.
Places slightly above the coastline are more suitable to the plantation given the relatively
low variation in the daily and annual temperature, while places over the mountains with a
larger daily and annual variation in the temperature are less suitable to the development of
the sector.
Given this insurmountable barrier to entry represented by the climate, which tended to
provide a large variation in the production of citrus across countries and across villages,
we argue that the large export revenues from citrus associated with its dominant position
in international markets together with the cost opportunity related to the huge investment
made for the development of the citrus-sector, determined a sort of vulnerability of producers
to potential losses. Because of the absence of state-protection, ma�a exploited this systemic
vulnerability in order to extort part of the pro�t made in the industry. As a consequence
we consider pro�t coming from imperfect market structures as a natural condition for the
development of ma�a.
3 The Model
The model considers three active agents - households, lemon producers, and the ma�a - as
well as a (latent) government that determines the strength of property rights. The aim of the
model is to explain how the structure of �xed costs a¤ect the decision whether to produce
lemon or not and, if production occurs, under what circumstances that the lemon producers
choose to pay the ma�a for protection against thieves. The model is meant to describe the
10Other reasons why Sicily may have had a dominant position are historical (related to the fact thatthe plant developed in the Mediterranean since Roman times) and geographically (the importance of theMediterranean in international trade).
11
situation in the 1880s and is not necessarily relevant for understanding the contemporary
nature of ma�a operations.
3.1 Consumers
Let us assume that the utility of a representative household is given by
U = � lnC + (1� �) lnX
where U is utility, C is consumption of lemon from Sicily and X is consumption of other
goods.11 For simplicity, we assume that the island of Sicily has a monopoly in the produc-
tion of lemon.12 The representative household might be thought of as the average Western
household in the last decades of the 1800s. The individual household�s budget constraint is
Y = pC +X where Y is average household income at the time and p is the relative price of
lemon consumption (price of other goods X is normalized to unity).
From the �rst-order conditions for pro�t-maximization, we can obtain the inverse demand
function for Sicilian lemon:
p (C) =�Y
C
As usual, there is a negative association between price and the total level of demand C
whereas demand rises with income and with the preference for lemon �.
3.2 Lemon producers
There are in total I > 0 towns or municipalities in Sicily and 1 < n � I towns where lemon
is produced. For simplicity, we assume that each town has one (representative) producer.
Total supply of Sicilian lemon is C =XI
i=1Ci where Ci is the local level of production in
town i. Total supply always equals total demand.
Pro�t of the local producer in town i is
�i = p (C) � Ci � (Ci)� Fi =�Y
C� Ci � Ci � Fi
where p (C) is the price level (that depends on total demand), (Ci) is a marginal cost func-
tion such that 0 (Ci) = > 0 and Fi is the local �xed cost of entry into lemon cultivation.
Fi depends on local characteristics such as soil quality, water access, altitude, and slope of
the land, as well as non-community speci�c �xed costs such as costs of building protective
walls, etc. Typically, it will take several years before planted lemon trees have grown to
produce lemons. Once a lemon plantation has been established, the marginal cost is the
same across localities.
The �rst-order condition for pro�t maximization can be written as
11We will only refer to lemon in the model below, but as indicated in the section above, what we reallyhave in mind is the market for lemon, orange, lime, and other citrus products.12This is a simpli�cation. However, Table 3 shows that in the dominant US market, Sicilian lemon accounted
for 100 percent of all imports during certain years in the period 1897-1903.
12
p (C)
�1 + p0 (C) � Ci
p (C)
�= 0 (Ci) :
Since marginal cost and inverse demand p (C) is the same everywhere, Ci must in
optimum be identical in every town. Hence, C = nCi. The expression above can therefore
be written as�Y
nC�i
�1� 1
n
�=
The fact that the number of towns n � I is bounded from above implies that there will
be a positive mark-up over marginal cost and that the market is not fully competitive.
Solving for the Cournot equilibrium supply of lemon from town i gives us
C�i =�Y (n� 1)
n2 : (1)
Not surprisingly, equilibrium supply will increase with the typical income Y and decrease
with marginal cost . Furthermore, it can be easily shown that C�i will decrease with n for
all n > 2.
Inserting C�i back into the pro�t function, we receive after some algebra the optimal
pro�t level
��i =�Y
nC�i� C�i � C�i � Fi =
�Y
n2� Fi:
In this very simple expression, pro�ts increase with income and decrease with the number
of towns producing n. Obviously, lemon will only be produced in community i if ��i =�Yn2� Fi � 0: Hence, �xed costs and the number of other producers are potential barriers to
entry into lemon production.
Let us assume that towns i 2 f1; 2; 3; ; ; Ig are ordered such that F1 < F2 < F3::: < FI .
Let us further assume that �xed costs are uniformly distributed across towns and are simply
given by
Fi = a+ bi
where a > 0 is a component common to all towns and where b > 0 is a parameter describing
the gradient of �xed costs across towns. One might for instance think of a as capturing the
cost of building protective walls, which is roughly the same everywhere, whereas b might
capture the di¤erence in �xed costs that arises due to di¤erences in soil quality that makes
it more costly in terms of time and e¤ort to establish a lemon plantation in some places than
in others. Clearly, a b close to zero would imply small di¤erences between towns. The mean
�xed cost across towns is �F = a+ (I + 1) b=2.
With these assumptions, the last producer who will choose to produce lemon (i = n) will
13
be the one where13
��n =�Y
n2� Fn =
�Y
n2� a� bn = 0: (2)
All potential producers i 2 f1; 2; 3; ; ; ng will thus produce whereas i 2 fn+ 1; :::Ig willnot. By using the implicit function theorem, we can deduce from the equation above that
the equilibrium level of lemon growing towns is a function n = n (a; b) such that
@n
@a= na =
�12�Yn3
+ b< 0;
@n
@b= nb =
�n2�Yn3
+ b< 0:
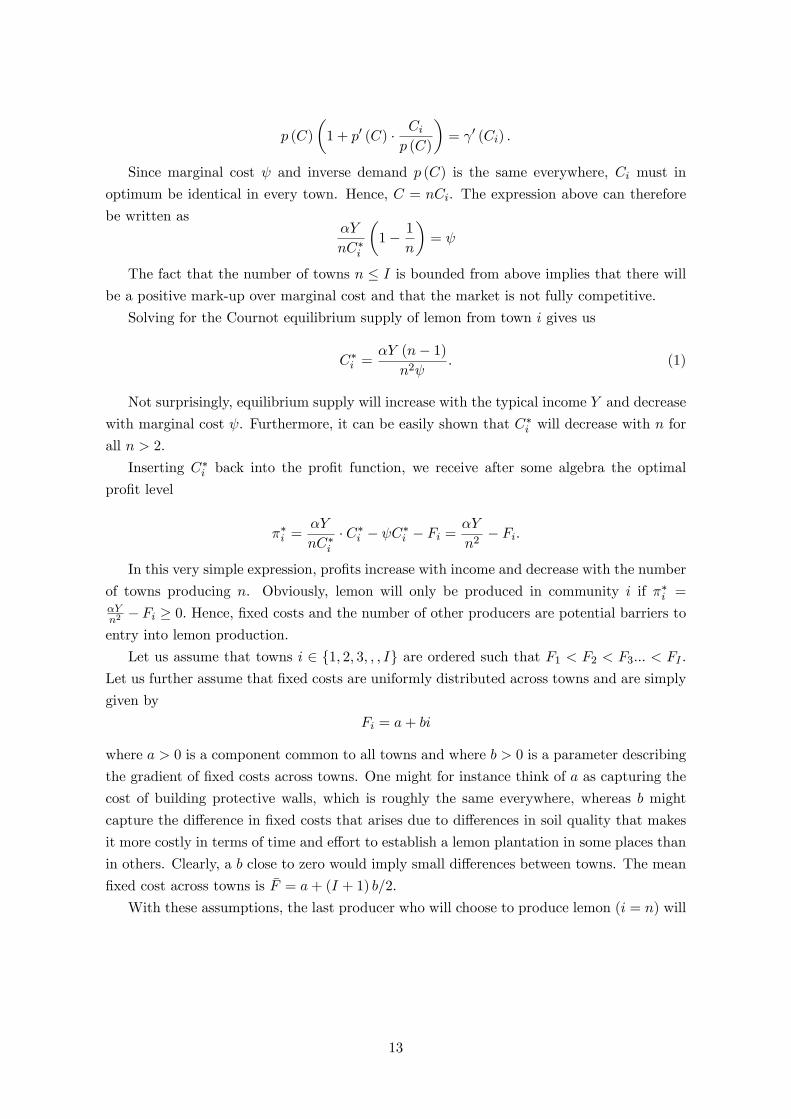
Although the explicit solution to n is mathematically messy, it is easily illustrated in a
graph as in �gure 1. The �gure shows the two components of the pro�t level, �Y=i2 and
a + bi; as a function of i when towns are ordered, starting from that with the lowest �xed
costs to the left. Equilibrium happens at the point where the two lines cross. At n, pro�ts
for the nth �rm is zero whereas it is given by the distance between �Y=n2 and a+ b for the
�rm with the lowest �xed costs.14 The triangle D in the �gure shows the total pro�ts made
by the lemon producing sector in Sicily.
It is clear from the �gure that an increase in a and/or b would shift the Fi-curve to the left
and would result in a lower n. Over time, it is likely that such barriers to entry have varied
in the lemon trade just as in other sectors. As a thought experiment, one might imagine
another agricultural good (perhaps wheat) with the same pro�t function except that it had
lower barriers to entry al < a and bl < b as shown in the bottom of �gure 1. Such low levels
of �xed costs would imply that all towns (n = I) would produce the good and that average
pro�ts would be quite small. Total pro�ts in the sector are given by the distance between
the �xed cost-curve Fi = al + bli and the pro�t level �Y=I (the area E):
Hence, the individual pro�t for an actual producer is
��i =�Y
n (a; b)2� a� bi � 0 for all i � n:
An increase in the �xed cost coe¢ cients a and b thus have two e¤ects on equilibrium
pro�ts: On the one hand, they reduce the equilibrium number of lemon producers, which
has a positive e¤ect on pro�ts in town i. On the other hand, they also lead to an increase in
the �xed costs for all producers, which decreases pro�ts. The sign of the comparative statics
will depend crucially on the level of i.15 In general, for a given n, pro�ts fall with i. Pro�ts
always increase with household demand �Y . We can therefore express ��i = � (�Y; a; b; i).
13 In the expression below, we assume for simplicity that there is always a level of pro�ts where ��n = 0. Inreality, the equilibrium number of lemon producing towns n� would probably rather be de�ned by n� = argminmax
��Yn2� a� bn; 0
.
14The pro�t level for the 1st �rm is equal to b (n� 1) > 0:15We can for instance see from Figure 1 that a rise in b with a unchanged will increase pro�ts for the town
with the lowest �xed costs whereas the previous nth �rm will then have negative pro�ts and should cease toproduce.
14
3.3 Government
As described above, Sicily in the 1880s was characterized by weak property rights institutions
and a substantial number of thieves who predated on agricultural production. An implicit
assumption in this section is that the "predation technology" in the lemon business was
particularly favorable for thieves. Compared to other agricultural goods like grapes or wheat,
lemon are very easy to collect quickly by a prospective thief. The price per stolen bucket
is further very high. These factors contributed to the circumstance that lemon plantations
were in particular need of protection.
Let us assume that in each community, there are d > 0 thieves.16 In the absence of
property rights and other forms of protection, thieves would steal the full pro�t from lemon
production and each thief would obtain an amount ��i =d. Lemon production would then make
zero pro�ts. The government in Rome o¤ers some protection of property rights captured by
the term � 2 [0; 1] where � = 1 implies perfect enforcement of property rights whereas � = 0implies total absence of government protection. For Sicily in 1880, � was presumably closer
to 0.
The total proportion of pro�ts saved from thieves by the individual lemon producer is
given by the "predation success function"
� (mi) =mi
mi + d (1� �)
where mi is the level of private protection o¤ered in i.
The functional form implies that if � = 1 there is no need for private protection since
� (mi) = 1 for any level of mi. If � > 0, then �0 (mi) > 0 and �00 (mi) < 0, i.e. the proportion
of protected pro�ts is a positive, concave function of the level of private protection. Lemon
producers then retain � (mi) � ��i of their pro�ts and lose (1� � (mi)) � ��i to the thieves.Lemon producers cannot provide protection themselves and need to employ people to do
this job for them. This is where the ma�a comes in.
3.4 Ma�a
The nature of the original organization of local ma�a groups (cosca) remains largely a mys-
tery. What we know about such groups is that they formed a secret society of sworn-in
men who managed to overcome the collective action problem through various measures (like
brutal punishments in the case of defection). Ma�oso were recruited among men with very
diverse occupations in society, including peasants, sheep-herders, doctors, and politicians.
In these early days, ma�oso typically performed their daily jobs as an integrated part of
society while also undertaking ma�a activities on the side. The key ma�a activity was the
protection of businesses (Gambetta, 1996).
16 In a richer model, the number of thieves might be endogenized so that individuals self-selected into beinga ma�oso, a thief, or a normal peasant in a process where marginal returns were the same in equilibrium.The number of thieves in Sicily in the 1880s was reportedly very high due to a general release of prisonersafter the Italian uni�cation and the breakup of feudal estates which made many workers redundant.
15
We assume that the local ma�a organization in i has no in�uence over n (there was
no central coordinating ma�a authority in the 1880s) and that a representative ma�oso
considers the choice between allocating e¤ort to either protecting local producers of lemon
or to pursuing normal economic activity. A representative ma�oso�s utility function in town
i is
UMi = !� (mi)��i + (1�mi)A
wheremi 2 [0; 1] is available e¤ort that can be spent on protecting the local lemon producer�spro�ts. The parameter A > 0 re�ects productivity in normal production (farming, �shing,
herding sheep, etc). This type of production is one option available to ma�oso and is the
only available option for the majority of ordinary people. ! 2 (0; 1) is the share of totalprotected pro�ts that the local producers o¤er to the ma�a in return for protection. For
now, let us take ! as given. Note that ! must be somewhere within the interval (0; 1) for
any interaction to occur between the two.
The ma�a maximizes the utility function
maxmi
UM =!mi�
�i
mi + d (1� �)+ (1�mi)A:
After manipulating the �rst-order conditions, we can solve for the optimal (interior so-
lution) level of ma�a activity in town i:
m�i =
r!d (1� �)��i
A� d (1� �) (3)
The expression in (3) implies that we can express the following proposition:
Proposition 1: The ma�a will be active in town i (m�i > 0) only if !�
�i = !
��Y
n(a;b)2� a� bi
�>
d (1� �)A:
This proposition o¤ers some of the key insights of the model. If the opportunity costs
of being a ma�oso A are very large, there will be no ma�a. If the o¤er from the producers
! is very low, the ma�oso will not �nd protection worthwhile.Furthermore, it will obviously
be the case that there will be no ma�a if property rights are fully enforced, i.e. if � = 1.
It can be shown that m�i is a decreasing, convex function of � so that the ma�a shrinks as
government-enforced property rights are strengthened. Similarly, there will be no ma�a if
there are no thieves so that d = 0. All these factors are assumed to be identical throughout
Sicily but might explain the varying presence of ma�a over time.
What distinguishes towns is the level of pro�ts in lemon production ��i . The central result
is of course that the likelihood of ma�a presence increases with ��i . As discussed above, we
argue that one of the key distinguishing features of lemon production at the time was the
relatively high demand �Y and the high barriers to entry due to high and geographically
di¤erentiated �xed costs, represented by the parameters a and b. If these are high, then only
n < I towns will be able to produce and the average pro�t among these producers will be
relatively high. For other goods, we argue that a and b should be fairly low, implying low
16
pro�ts in general and no large geographical variation in pro�ts. The lower part of �gure 1
depicts such a scenario. Pro�ts are then less likely to motivate a ma�a to arise from (3).
The most likely place for ma�a presence would be town i = 1 where �xed costs of lemon
production are lowest and pro�ts are highest. In our empirical investigation, we do not have
data on pro�ts from various types of production. What we do have data on is the presence
of sectors in each town. According to our model and the data discussed above, the presence
of lemon production in some town should be an indicator of pro�tability and of low �xed
costs. Similarly, the presence of other types of production are interpreted as indicating that
pro�ts in that sector were also positive. Holding the presence of other types of production
constant, we hypothesize that the prevalence of lemon production in a town should thus have
a positive association with the probability of ma�a activity.
3.5 Endogenous ma�a contract
A potential concern in the analysis above is that the o¤er to the ma�a ! was assumed to be
exogenously given. In this section, we will extend the analysis and endogenize the o¤er !ithat the local producers make to the ma�a. In doing so, we will also reach a more complete
characterization of the model and demonstrate that the main qualitative implications remain
in place even after this extension.
Firstly, note that the �nal level of pro�t that the lemon producer retains after attacks
by thieves and ma�a "taxation" for protection, is:
~�i = (1� !i) � (m�i )�
�i = (1� !i)��i
1�
sd (1� �)A!i��i
!
A proportion (1� � (mi)) is lost to the thieves and !i� (mi) to the ma�a, summing up
to a total loss of (1� � (m�i ) (1 + !))�
�i for the lemon producers.
What is the optimal compensation that the producers can o¤er to the ma�a? The
expression for the optimal level of ma�a e¤ort in (3) shows that ma�a protection will increase
in a concave manner with !i. Retained pro�ts for the lemon producers ~�i is also a function
of !i and involves an intuitive tradeo¤: On the one hand, a higher !i implies that the level
of retained pro�t decreases directly and in a linear fashion. On the other hand, a higher !iwill induce the ma�a to exert more e¤ort which means that a greater proportion � (m�
i ) will
be saved from the thieves. Clearly, there will be some interior equilibrium since the extreme
points !i = 0 will result in no ma�a protection and thieves taking everything, whereas the
level !i = 1 would imply that the ma�a was allowed to take the whole protected pro�t.
Exactly how the pro�t was shared in Sicily probably varied across time and from town to
town. Let us imagine a Stackelberg type of model where the lemon producers act as leaders
and give an o¤er !i to the ma�a �rst, whereupon the ma�a reacts by setting their level of
mi according to their best response function given by (3). In the �rst stage of such a game,
the lemon producers would anticipate the ma�a�s reaction and internalize the known level
of m�i in their pro�t maximization problem. The optimal contract would then be implicitly
de�ned by the �rst-order condition for maximum:
17
@~�i@!i
= ��i@�(m�
i )
@!i� ��i �(m�
i )� !i��i@�(m�
i )
@!i= 0 (4)
By using the condition in (4), we can reach the following result:
Proposition 2: If !�i is determined in a two-stage game where lemon producers makean initial o¤er to the ma�a, taking into account the ma�a�s best response function, the
equilibrium ma�a contract is !�i = ! (xi) where xi =q
��iAd(1��) and where !
0 (xi) < 0.
Proof: See Appendix.
In other words, if for instance there was an increase in pro�ts ��i , the optimal proportion
!�i o¤ered to the ma�a would decrease. The intuition for this is that ��i and !
�i are sub-
stitutes for the ma�a since a lower ��i can be compensated by a higher !�i , and vice versa.
Furthermore, a strengthening of property rights � would increase xi and would also lead
to a less generous equilibrium o¤er to the ma�a. The reason is that a stronger rule of law
decreases the demand for ma�a protection.
The main implications are described in �gure 2. In the �gure, we have assumed certain
parameter values in order to illustrate the mechanics of the model. The initial situation
is given by the ma�a�s best response function m�i which, as described above, is a concave
function of !. In the example, the lemon producer optimally o¤ers slightly more than
half of the pro�ts saved from thieves to the ma�a (!�i = 0:526). The ma�a responds in the
predicted fashion by exerting a positive but relatively low level of protection to the producers
(m�i = 0:09). For the producers, the net result is that thieves steal nearly 70 percent of total
pro�ts (1� �(m�i ) = 0:69) whereas the ma�a takes roughly 15 percent, leaving merely about
15 percent (0.147) of total pro�ts ��i to the producers.
If we use the same parameter values and assume a substantial increase in pro�ts by 400
percent, then both curves in �gure 2 shift to m�� and !��. The new equilibrium o¤er to the
ma�a is now roughly 30 percent of protected pro�ts (!��i = 0:297) and the level of ma�a
e¤ort increases by around 0:15 to m��i = 0:236: The share of total pro�ts that the lemon
producers now manage to retain is almost 40 percent (~�i=���i = 0:39).
The bottom line of these examples is that even when the ma�a contract is endogenized
in a standard manner, the intensity of ma�a presence will increase with lemon pro�ts.17 The
examples also illustrate a situation in which thieves always steal a certain fraction of pro�ts
and where the ma�a appropriates another substantial fraction. The individual producer
has no alternative but to let the ma�a protect him/her. Many producers, like Dr Galati
referred to above, were surely dismayed at this state of a¤airs and considered ma�a o¤ers of
"protection" to be more like criminal extortion.
17One might of course imagine other mechanisms for determining !i. A plausible alternative process mightbe Nash bargaining.
18
4 Econometric Speci�cation and Data
4.1 Econometric Speci�cation
From the econometric point of view we can consider equation (3) as the latent equation which
will determine the probability of ma�a. In this equation the probability of ma�a depends
on pro�ts, the enforcement of property rights, and the number of thieves. The latter are
considered equally distributed across the region even though there may be a variation in the
e¢ ciency of the state at town level which can explain the presence of ma�a across the region.
For this reason, the e¢ ciency of the enforcement of property rights will represent part of the
control variables.
The model to be estimated can be written as:
M?i = �i + �1�i + �2Xi + �i (5)
where
Mafiai = 1 if M?i � 0
Mafiai = 0 if M?i < 0:
In the latent equation (5), the dependent variable M?i represents the response variable
which will drive the probability of ma�a. A response variable larger than zero will be
associated with towns with a positive level of ma�a. The probability of ma�a will be zero if
the response variable (M?i ) is smaller than zero.
The main independent variable is the pro�t in the industry which we denote by �i. Pro�ts
depend on �xed costs which in our model represent a sort of barrier to entry. As a result, the
smaller is the number of producers in the industry (n) the larger are the pro�ts made which
in turn increase ma�a activity. Even though we do not have data on pro�ts, we can consider
the dominant position in the market of citrus (73 percent of the total Italian production and
almost 78 percent of the total US lemon import) as the result of a �xed cost which prevented
the entry of new competitors in the market. This dominant position generated large pro�ts
for peasants and therefore we expect the probability of ma�a to increase with the production
of citrus.
Xi represents a set of possible control variables which also may a¤ect the probability of
ma�a. This set of variables will include controls for the trust citizens have in the law and
for the peripherality of the town. These measures do not perfectly capture the enforcement
of property rights by the incumbent state, but they should provide an idea of the e¢ ciency
of the state in enforcing property rights. Finally �i represents provincial �xed e¤ects which
may be correlated with the error term.
19
4.2 Data
Data at town level for the entire island are collected from the Damiani Inquiry (1886).18 This
investigation is part of a larger inquiry, approved in March 1877 and proposed by Stefano
Jacini, that aimed at assessing the conditions of the agricultural sector and the conditions
of peasantry in every region of Italy. Abele Damiani was an MP for the region Sicily. The
Damiani Inquiry represents one of the earliest and most important primary sources about
the economic and social conditions of Sicily in the 1880s.19
The section of the Inquiry which matters for our analysis is divided into two parts. The
�rst part regards the condition of agriculture with reference to the kind of crops produced,
tax burden, wages, and relations between peasants and landlord (i.e. tenancy contract,
fractionalization of land, etc.). Questionnaires relative to this �rst part were sent out to
almost 357 mayors but less than half of them provided complete information.
The second part of this section regards the moral and social conditions of peasants. In
this case questionnaires were sent to 179 pretori (lower court judges)20 and the information
delivered by them is summarized in tables which provide a unique picture about the moral
and social conditions of Sicilian peasants at the time. The survey sent to pretori asks
questions regarding the lewdness and religiousness of people, corruption of the clergy, the
rule of law, and the e¤ect of introducing a compulsory military service. However the part
of this survey which matters the most to us is the one regarding the form and level of crime
in the island. The question asked to pretori in the Inquiry is: �What is the most common
form of crime in the town? What are their causes?� There are a range of possible crimes
that pretori considered. Some of these crimes are related to rustling, robbery, murders, but
the alternative that forms our dependent variable is �ma�a�. 21
There are some potential concerns with the data on ma�a presence. Firstly, could ma�a
still be present in a town even though the pretore did not list it as the most common form
of crime? Because of the structure of the question in the Inquiry, it is indeed possible that
some towns had ma�a activity even though the pretore does not reckon it as the main source
of crime. This problem may slightly a¤ect our results.
Second, were pretori themselves ma�oso and hence likely to understate the presence of
ma�a? The answer to this question is most likely no, although it is quite di¢ cult to give a
de�nite answer to this question. Pretori were directly appointed from the Minister of Justice
and their appointment was rati�ed with Regio decreto (Royal order). Their appointment
and any other aspect concerning their career was subject to the evaluation made by a local
committee of experts of the local Court of Appeal. For the �rst 10 years of their career,
pretori used to change town very frequently which may have restricted their connections
18Caltanissetta is the only province missing in our sample because �les for this province were no longeravailable in the archives.19The Inquiry is still available from the Archive of State in Rome, even though the condition of manuscripts
is not perfect and some pages are very hard to read (see �gures in the appendix).20There are much fewer pretori than mayors since the o¢ ce of pretura is only present in larger provinces
so that one pretore often serves several towns.21Samples of these surveys are provided in Appendix 2. Figure A1 shows the table summarizing information
provided by pretori. Figure A2 shows a sample of the survey completed by the mayor of Cefalu.
20
with the environment. From another question of the Inquiry it emerges also that many
experienced di¢ culties to administer justice without the cooperation of local people because
in several trials witnesses did not say the truth because afraid of ma�osi or because of
previous agreement with ma�a.22
Third, did the pretori have a common understanding of what the term "ma�a" implied?
Yes, this appears to have been the case. In 1880, the term "ma�a" already meant a criminal
organization. The term appears to have been used to identify this typical sort of organized
crime in Sicily at least since 1863 when in Palermo a comedy titled "I Ma�usi di la Vicaria�
was shown. In 1865, the prefect of Palermo (Filippo Gualterio) used the term ma�a in
a private document to identify the criminal organization. In addition, since 1871 ma�a
membership has been a public law o¤ence. We therefore regard it as highly unlikely that
the term was misinterpreted.
These sort of problems are common to most of the empirical analysis which uses survey
data causing a sort of measurement error which will be part of the error term. However
as long as the error term is not correlated with independent variables there is no reason
to believe that these problems will a¤ect estimates. This is important for our analysis
given that the possible misenterpretation of the question as well as the collusion between
pretori and ma�a (if this was possible) are likely to be distributed randomly across towns
with ma�a. Because of that it appears fair to assume that our main independent variable
(whether the city produces citrus) should not be correlated with such an error providing
unbiased estimates23.
Table 6 reports descriptive statistics for some of our key variables. The dependent vari-
able, Ma�a, is thus binary a dummy variable for whether the pretore of the town reckons
ma�a as the most important source of crime in the town.24 35 percent of all towns were
strongly a¤ected by ma�a which means that almost 44 out of the 127 towns in our sample
had ma�a listed as the most common form of crime. Girgenti is the province with the highest
incidence of ma�a with almost 14 out of 17 towns having a strong ma�a presence. In Tra-
pani, the ma�a is operative in 6 out of 15 cities. On the other hand, almost one third of the
cities in the province of Palermo are infested with ma�a (mainly those in the Conca d�Oro)
which is the same as in Catania. Messina and Siracusa are the provinces with the lowest
incidence of ma�a. This summary statistics is consistent with the description in Colajanni
(1885) where he divides the island in three macro-regions considering Girgenti as the one
with the highest rate of murders and convictions and therefore the one with the highest level
of Ma�a.
Table 6: Distribution of ma�a and of agricultural production22According to Pezzino (1990), the pretore in Bagheria said �There is a tendency to deny the truth. Not
only people does not answer truthfully, but they deliberately lie either because of ma�a or because of moneyor because they are afraid�.23Assume that the dependent variable is measured with an error and that yi = yi + i. Then we can write
the composed error term in (5) as �i = ui+ i and if i is random it should be uncorrelated with independentvariables.24Data on ma�a is available for 162 cities but when merged with independent variables the largest sample
covers 127 cities.
21
Next, we move to the description of some of the most important independent variables.
We use three sets of independent variables which should control for some of the most impor-
tant sources of ma�a discussed in the previous section. Colajanni (1885), Dickie (2004), and
Lupo (2007), as well as our model, consider the pro�table production of goods like citrus and
sulphur as important determinants of ma�a. Because of that, the �rst set of independent
variables in table 6 are related to production. Citrus, Wheat, Olives, Grape, and Sulphur
are the commodities we consider. In order to assess what dominant crops that were pro-
duced in each town, we use dummy variables which are coded one in case the town is a
dominant producer of these crops. The relevant question in the Damiani Inquiry is: �Which
is the dominant crops produced in the city?�Pretori normally listed few crops (sometime
they also report quantity but just for few cities) and because of that, dummies for crops are
non-mutually exclusive.
Given the hypothesis of this paper, the data for citrus production is of particular rele-
vance. After also having compared with the data in Di Vita (1906), we can con�rm that the
Damiani Inquiry appears to give an accurate description of the local distribution of citrus
production. The production of citrus is the highest in the province of Messina and the low-
est in the province of Siracusa. Data on sulphur mines are also provided by Di Vita (1906).
As argued by Colajanni (1885), sulphur mines are almost exclusively concentrated in the
province of Girgenti (almost in 12 out the 17 cities). Outside Girgenti there are only 5 mines
in the province of Catania, 3 in Palermo, and 1 mine in Messina and Trapani. Wheat is
produced in the entire province of Girgenti and the production is the lowest in the province of
Messina. Grapes and olives are almost equally distributed across the island. These summary
statistics seem to reproduce quite well the description in Colajanni (1885).
The second set of explanatory variables is related to the political status of towns and
other policies aimed at increasing the small-scale ownership of land (i.e. "en�teusi").25 In
Table 7, we show the set of independent variables related to the political status of city-towns
before the uni�cation of Italy, and to the e¤ectiveness of policies aimed at increasing private
ownership of land. Since the 13th century, Sicilian towns could have three di¤erent sorts of
political organization. A typical feudal system was the �rst form of political organization
with a small elite minority owning the land and a large peasant population that lived in
small villages and who passively accepted a subservient role. According to Sonnino and
Franchetti (1877), and Doria (1710), feudal cities were likely to experience a larger loss of
�social capital�.
The second form of political organization was the �ecclesiale� (church-ruled cities) in
which bishops used to act as typical lord. Finally, crown-ruled city towns (�demaniali�)
were the last form of political organization. �Demaniali� towns were independent of local
lords and bishops and had some sort of self-regulation. Using data from Di Vita (1906) we
�nd that feudal cities represent almost 62 percent of our sample which means that 79 out
of the 127 in our sample had a feudal heritage. Crown-ruled (�demaniali�) cities represent
almost one fourth of the sample (32 cities). Finally, we have only 10 �ecclesiale� cities
25"En�teusi" is a sort of perpetual lease which allows a person to use a good which belongs to somebodyelse as if it is its own.
22
(church-ruled).
Table 7: Political organization
The third set of variables is related to the distribution of land and to the length of the
tenancy contract. Damiani (1886) is the source for most of our variables except for a few
cases in which we use data from Di Vita (1906). With the end of the feudalism and the
uni�cation of Italy in 1860, the land in crown- and church-ruled cities were sold to citizens.
The intent of this policy was to increase the private ownership of land among peasants and
according to Gambetta (1996) these policies created a potential market for private protection,
as described in our model.
However, in the majority of cases the policy had an opposite e¤ect. Rich landowners were
the only ones who had enough money to bid in auctions for land and because of that, the
policy failed. In order to capture the e¤ectiveness of these policies on the fractionalization
of land we use a second dummy which we call �Fractionalization policies�, shown in the last
column of table 7.26 The average e¤ectiveness of this policy is 45 percent which means that
according to pretori these policies had some e¤ect on the fractionalization of land in only 54
out of the 119 towns for which we have information. These policies seem to be more e¤ective
in cities which had a feudal heritage (in provinces of Girgenti and Siracusa mainly) and less
e¤ective in provinces (i.e. Messina) which were ruled either by the crown or the church. This
is because land in crown-ruled cities was already quite fractionalized given the absence of
lords.
Table 8 provides descriptive statistics for the scale of the plantation and the fraction-
alization of land. Damiani (1886) is the source for these data. The question asked for the
scale of plantation and fractionalization is: �What is the dominant scale of the plantation?
And what is the fractionalization of land?�Most of the time pretori answered that a large,
a medium, and a small scale are dominant and for this reason the sum of the three vari-
ables is larger than 1. However, the small scale plantation seems to be more frequent while
the large scale is the least frequent. Regarding the fractionalization of land, this is highly
fractionalized in almost 44 towns, and relatively low fractionalized in almost 29 towns. The
small scale plantation is relatively frequent in the province of Messina which on average has
a medium fractionalization of the land. In the province of Catania the small scale plantation
also seems to be prevalent (in almost 16 out of 23 towns) as well as in Trapani and Siracusa.
Girgenti is the province with the lowest frequency of small scale plantations and the second
largest percentage of large scale plantations. Because of that, the fractionalization of land
in this province is the lowest.
Table 8: Land fractionalization and scale of plantations
Finally, in table 9, we show the pairwise correlation among a selected number of variables.
Ma�a seems to be positively correlated with Citrus (0.39 correlation), with the Large scale
26The dummy variable captures any e¤ect of policies and reform following the abolition of the feudal systemon the fractionalization of land.
23
plantation (0.25 correlation), and with the e¤ectiveness of the fractionalization-policy (0.26
correlation). The presence of sulphur mines is also positively correlated with Ma�a (0.19
correlation). A feudal origin and the high fractionalization of land, which also have been
considered important for the di¤usion of organized crime, are weakly correlated with Ma�a
(0.05 and 0.04 correlation respectively). Finally, Population density, capturing the wealth of
a locality, is weakly correlated with Ma�a. All these variables are weakly cross-correlated,
preventing problems of multicollinearity.
Table 9: Pairwise Correlations
5 Empirical Analysis
Table 10 presents probit estimates. We start with a simple model in which the origin of
ma�a only depends on variables capturing the economic activity in the town and then we
enter additional variables in order to control for observables. In column, 1 the di¤usion of
the ma�a only signi�cantly depends on production of citrus and sulphur. At the mean, the
production of citrus increases the probability of ma�a by 45 percent, while the production
of sulphur increases the probability of ma�a by 24 percent. In column 2, we control for
province-dummies in order to capture regional �xed e¤ects and the citrus dummy is the only
variable which keeps signi�cance at a 5 percent signi�cant level at least. The sulphur-mines
dummy is now insigni�cant, while the grape dummy becomes marginally signi�cant at a 10
percent level.
In column 3 we enter some additional controls. We use the fractionalization policy dummy
and population density in order to control for policies which may have a¤ected the private
ownership of land and wealth. Population density is not signi�cant, while the fractional-
ization policy dummy has a marginal and signi�cant e¤ect on the probability of ma�a. In
column 4, we drop variables which are not signi�cant to prevent an excessive reduction of
the degrees of freedom. In addition we enter the dummy for the high fractionalization of
land in order to check whether the fractionalization policy dummy truly captures the e¤ect
of increasing the fractionalization of land (as argued by Bandiera, 2003) or something else.27
The dummy for whether the land is highly fractionalized in column 4 is not statistically
signi�cant which in some sense is more consistent with our hypothesis.
In fact, given the �xed costs that farmer had to incur in order to expand the production of
citrus (and other crops which could generate higher pro�ts i.e. grape), we should expect that
pro�ts were much higher in towns with a relatively low fractionalization. For this reason,
in column 5, we enter a dummy for the prevalence of large scale plantation. The idea is
that investments for the expansion of the sector were more likely in towns with a large scale
plantation (because of the decreasing cost) making producers more vulnerable to a potential
27The fractionalization policy dummy could also capture an increase in the use of the �gabella� giventhat existing landowners bought most of the available land. Therefore, even though mayors consider thesepolicies e¤ective in increasing the fractionalization of land, this still remained quite concentrated in few handspreventing peasants from acquiring any rights on the land.
24
loss due to extortion. The dummy for the scale of the plantation is signi�cant at a 1 percent
signi�cance level and it increases the probability of ma�a by 39 percent. The set of covariates
in column 5 is our preferred speci�cation and in this model ma�a is signi�cantly determined
by the production of citrus, by the e¤ect of policies for private ownership, and by the scale
of the plantation. The production of grape also marginally explains the di¤usion of ma�a
(signi�cant at a 10 percent).
Table 10: Ma�a Probit Model
In table 11, we add to our preferred speci�cation additional controls which are suggested
to have an important e¤ect on ma�a. In column 1, we enter controls for the distance from
Palermo and from Mazzara del Vallo. The �rst variable should capture the distance from a
well-known ma�a-base center and the distance to a key port. The distance from Mazzara del
Vallo is used to capture the possible di¤usion of citrus given that this plant was introduced
by the Arabs in the 10th century who entered Sicily from Mazzaro del Vallo. Both variables
are statistically insigni�cant. In column 2, we enter the altitude of the town in order to
proxy inland cities given that the control of the harbor may have been an important factor
of ma�a di¤usion. Altitude is also not signi�cant.
In column 3, we control for the level of enforcement of the law. We use the distance from
the railway station (collected from Di Vita, 1906) and three dummies for whether citizens
trust, mistrust, or do not care about the law (the excluded group is whether they fear the
law). These dummies are coded using the information in Damiani (1886). Among these
proxies, the only one which is signi�cant at a 5 percent level is the dummy for citizens not
caring about the law. Towns in which citizens do not care about the law have almost 60
percent higher probability of ma�a. Finally, in column 4, we control for the length of the
tenancy contract which also has a signi�cant and negative e¤ect on the probability of ma�a.
The citrus dummy in table 11 still increases the probability of ma�a by a 55 percent, the
scale of the plantation by an average 40 percent, the private ownership policies increase ma�a
by an average 38 percent, while the grape dummy is still marginally signi�cant increasing
the probability of ma�a by almost 25 percent. The average probability of ma�a estimated
in these model is around 31 percent.
Table 11: Ma�a Probit Model: Additional Controls
Finally, in table 12, we control for the robustness of our preferred model to alternative
estimators. In column 1, we use a Linear Probability Model (LPM) and all variables in our
baseline model are statistically signi�cant at least at a 5 percent-level. Also the grape dummy
which was marginally signi�cant in table 10 is now signi�cant at a 5 percent-level. Citrus
increases the probability of ma�a by almost 30 percent, grape by 17 percent, fractionalization
policies by almost 23 percent, and large scale plantations by almost 24 percent.
25
In column 2 we use an OLS-IV estimator. Altitude is the instrument we choose for
Citrus. This instrument is chosen because of the the particular climatic conditions required
by this plant and its in�uence on �xed costs as spelled out in the theoretical model. We can
represent the causality using the simple �ow chart below:
Altitude ! Climate ! Fixed Cost ! Pro�ts ! Ma�a
where altitude a¤ects the climate and its daily and annual variation. The higher variation
and the higher probability of frost represent a sort of �xed cost which is not sustainable for
the production of lemons given that the plant is totally intolerant of frost.28 Because of
that, the development of the lemon production will occur in few cities characterized by a
mild climate with low variation. The production of lemons then a¤ects pro�ts and therefore
the level of ma�a activity. The choice of altitude is also consistent with the division of the
fruit industry made by Monroe (1909) who argues that the fruit industry in the island may
be divided into three zones: �The marine, or lemon belt, from sea-level to �fteen hundred
feet. The middle, or orange zone, from �fteen hundred to three thousand feet. The forest belt
above three thousand feets� (Monroe, 1909, pg 190-91). Therefore we should expect to have
a larger concentration of lemons below �fteen hundred feet.
Of course there is always a potential risk that the exclusion restriction may be violated.
For example it can be argued that the enforcement of law is less e¢ cient in towns over
the mountains because these towns are relatively more di¢ cult to be reached by public
forces. However, in this case we are likely to under-estimate the e¤ect of lemons on ma�a.29
Furthermore, the mountains of Sicily do not appear to be high enough to provide a reliable
shelter to outlaws.
Results from the OLS-IV estimator provide a picture which is quite similar to OLS
estimates, but the e¤ect of citrus on ma�a activity increases by almost 13 percent (with
respect to the OLS estimates). The grape dummy, the scale of the plantation, and the post-
uni�cation e¤ect dummy are still signi�cant at a 5 percent-level or lower. In column 3 we
use an IV-Probit and the only di¤erence with respect to the OLS-IV estimator is that the
grape dummy goes back to be signi�cant at a 10 percent level only.
Finally, in column 4, we use a Spatial Linear Probability Model to control for spatial
autocorrelation in the error term.30 In this model, the citrus dummy signi�cantly increases
the probability of ma�a by 32 percent, the scale of the plantation by 21 percent, and the frac-
tionalization policies dummy by 24 percent. The grape dummy is still marginally signi�cant
at a 10 percent-level only and it increases the probability of ma�a by 14.5 percent.
Table 12: Robustness Check �Alternative Estimators28Of course, a huge investment can be made in order to protect the plant from the frost.29 If we de�ne the asymptotic bias in the IV as: ABias(�̂IV ) =
�Z��ZX�X�
ABias(�̂OLS) then the OLS bias
should be positive while the �rst term should be negative providing a downward bias.30The idea is that ma�a is presence in one town could positively in�uence the probability of ma�a presence
in a neighboring town as a local spillover e¤ect.
26
6 Conclusions
In this paper, we have developed a market structure-hypothesis for understanding the origins
of the Sicilian ma�a. Unlike existing works that emphasize institutional and historical factors,
our analysis studies the importance of the presence of �xed costs as a source of market
imperfections and very high pro�ts in certain towns. We argue that the production of
orange and lemon were associated with a strong international demand as well as substantial
�xed costs during the late 1800s. This pro�tability, combined with a general lack of rule of
law at them time, provided an ideal breeding-ground for a ma�a providing private protection
to lemon producers.
In the empirical analysis, using data from a parliamentary inquiry from the 1880s, we
show that the presence of ma�a is strongly related to the production of citrus fruits. The
e¤ect remains when we include several control variables and use alternative estimators. We
argue that these results are consistent with a market structure-hypothesis as outlined in this
paper.
27
References
[1] Acemoglu, D. and J. Robinson, 2012. Why Nations Fail: The Origins of Power, Prosperity, and
Poverty. New York: Crown Publishing Group.
[2] Acemoglu, D., S. Johnson, and J. Robinson, 2006. "Institutions as a Fundamental Cause of
Long-run Growth" chap 6 in Handbook of Economic Growth, Vol 1, Part A, 385-472.
[3] Anderson A., 1979. The Business of Organized Crime: A Cosa Nostra Family. Stanford, Hoover
Institute Press, Stanford University.
[4] Anderson A., 1995. Organized Crime, Ma�as and Governments, in Fiorentini, Gianluca and
Peltzman, Sam (eds), The Economics of Organized Crime, Cambridge, Cambridge University
Press.
[5] Arlacchi Pino, 1986. Ma�a Business: The Ma�a Ethic and the Spirit of Capitalism, London:
Verso
[6] Bandiera, Oriana, 2003. Land Reform, the Market for Protection, and the Origins of the Sicilian
Ma�a: Theory and Evidence. Journal of Law, Economics, and Organization , 19(1), 218-44
[7] Battaglia, Rosario, 2003. L�ultimo Splendore: Messina tra Rilancio e Decadenza, Rubbettino
Editore
[8] Bonfadini, Romualdo, 1876. Relazione della Commissione Parlamentare, Inchiesta sulle Con-
dizioni Sociali ed Economiche della Sicilia, Roma
[9] Buonanno, Paolo, Ruben Durante, Giovanni Prarolo, Paolo Vanin, 2012. "On the Historical and
Geographical Origins of the Sicilian Ma�a", Munich Personal RePEc Archive.
[10] Catanzaro, Raimondo, 1992. Men of Respect: A Social History of the Sicilian Ma�a, New York:
The Free Press
[11] Colajanni, Napoleone, 1885. La Delinquenza dell Sicilia e le sue Cause, Giornale di Sicilia
[12] Colajanni, Napoleone, 1895. Gli Avvenimenti di Sicilia e le Loro Cause, Palermo Remo Sandrom
[13] Congdon Fors, H. and O. Olsson, 2007. Endogenous Institutional Change After Independence,
European Economic Review 51(8), 1896-1921.
[14] Damiani, Abele 1886. Atti della Giunta per l�Inchiesta Agraria e sulle Condizioni della classe
Agricola, Forzani Tip. Del Senato tomo 2 fasc 4 (Archivio Centrale Roma)
[15] Di San Giuliano, A. 1894. Le condizioni presenti della Sicilia: studii e proposte, Fratelli Treves
[16] Di Vita, Giuseppe, 1906. Dizionario Geogra�co dei Comuni della Sicilia e delle Frazioni Comu-
nali: Con Notizie Storiche, F. Pravatà
[17] Dickie, John, 2004. Cosa Nostra: A History of the Sicilian Ma�a, Palgrave Macmillan
[18] Doria, Paolo Maria, 1710. Della vita civile, Napoli.
[19] Fiorentini, Gianluca; 1999. organized Crime and Illegal Marteks. Dipartimento di Scienze
Politiche. Universita�di Bologna�Wp 8400
28
[20] Franchetti, Leopoldo, 1876. Condizioni politiche e amministrative della Sicilia, Edited in 1926
by Vallecchi Editore.
[21] Gambetta, Diego, 1996. The Sicilian Ma�a: the Business of Private Protection, Harvard Uni-
versity Press
[22] Gambetta Diego, 2009. Codes of the Underworld: How Criminals Communicate. Princeton
University Press
[23] Grossman, Herschel I., 1995. Rival Kleptocracies: The Ma�a versus the State, in Fiorentini,
Gianluca and Peltzman, Sam (eds), The Economics of Organized Crime, Cambridge, Cam-
bridge University Press.
[24] Hardin, Russell, 1999. Social Capital. In Alt, James E., Margaret Levi, Elinor Ostrom: Compe-
tition and Cooperation. New York: Russell Sage Foundation, 170-189.
[25] Hess, Henner, 1973. Ma�a and Ma�osi: The Structure of Power, Farnborough: Saxon House
[26] Levi, M., 1996. Social and Unsocial Capital: a Review Essay of Robert Putnam�s Making
Democracy Work. Politics and Society , 24: 45-55.
[27] Lupo, Salvatore, 2009. History of Ma�a, Columbia University Press
[28] Mehlum, Halvor, K-O Moene, and R. Torvik, 2006. "Institutions and the Resource Curse".
Economic Journal, 116(508), 1-20.
[29] Monroe, Seymour Will, 1905. The Spell of Sicily: The Garden of the Meditarranean, Boston,
The Page company
[30] Montanelli, Indro, 1949. Interview with Don Calo Vizzini. Corriere della Sera, October the 30th
[31] Newton, Kenneth, 2001. Trust, Social Capital, Civil Society, and Democracy, International
Political Science Review April 2001 vol. 22 no. 2 201-2
[32] Pescosolido Guido, 2010. L�Economia Siciliana nell�Uni�cazione Italiana, paper presented in the
Convegno Nazionale di Studi: La Partecipazione della Sicilia al Movimento dell�Uni�cazione
Nazionale.
[33] Pezzino Paolo, 1990. Una certa reciprociti di favori. Ma�a e modernizzazione violenta nella
Sicilia postunitaria. FrancoAngeli.
[34] Powell, Harold G., 1909. Italian Lemons and Their By-Products, Bulletin No. 160, Bureau of
Plant Industry, US Department of Agriculture.
[35] President�s Commission on Law Enforcement and Administration of Justice, 1967. The Challenge
of Crime in a Free Society. Washington
[36] Putnam R., 1993. Making Democracy Work: Civic Tradition in Modern Italy. Princeton Uni-
versity Press. Princeton.
[37] Ru¤olo, G., E. Veltri, F. Archibugi, and A. Masneri, 2010. Rapporto sulla criminalita in Italia.
Analisi, Prevenzione, Contrasto Ministero degli Interni con Stime Aggiornate dal Centro
Studi di Con�ndustria per Ottobre 2010, Ministero Degli Interni
[38] Sonnino, Sidney and Leopoldo Franchetti, 1877. La Sicilia nel 1876, Firenze, Tip. di G. Barbera
29
[39] Skaperdas, S., 2001. The Political Economy of Organized Crime: Providing Protection When
the State Does Not Economic of Governance 2: 173-202
[40] Smith, R., 1976. "The Legal and Illegal Markets for Taxed Goods: Pure Theory and Application
to State Government Taxation of Distilled Spirits", Journal of Law and Economics, 393-435.
[41] Skaperdas, S. and Syropoulos, C. 1995, "Gangs as Primitive States", in Fiorentini, Gianluca and
Peltzman, Sam (eds), The Economics of Organized Crime, Cambridge, Cambridge University
Press.
[42] Travelyan, Raleigh, 2001. Principi Sotto il Vulcano. Storia e Leggenda di una Dinastia id Gat-
topardi Anglosiciliani dai Borboni a Mussolini, Milano BUR
[43] van der Ploeg, Frederick, 2011. "Natural Resources: Curse of Blessing?" Journal of Economic
Literature 49(2), 366-420.
[44] Villari, Pasquale, 1875. Lettere Meridionali, L�Opinione
30
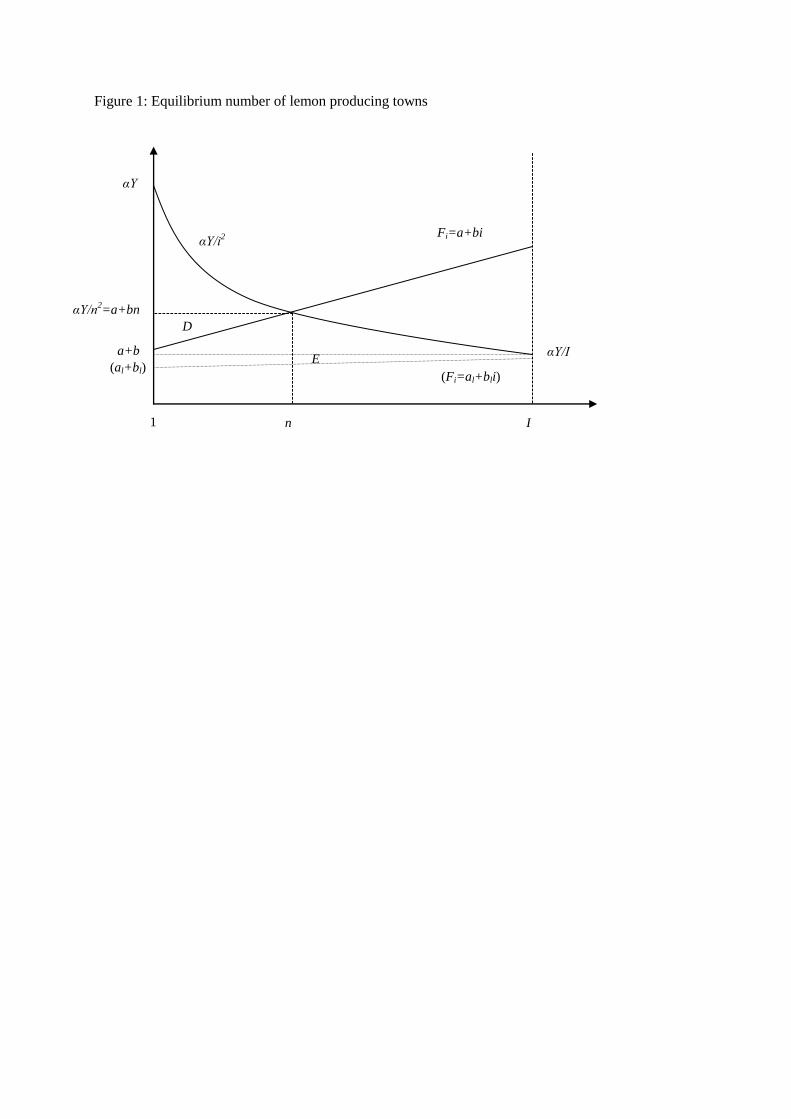
Figure 1: Equilibrium number of lemon producing towns
1 n I
Fi=a+bi αY/i
2
αY
a+b
αY/n2=a+bn
D
(Fi=al+bli) (al+bl)
E αY/I
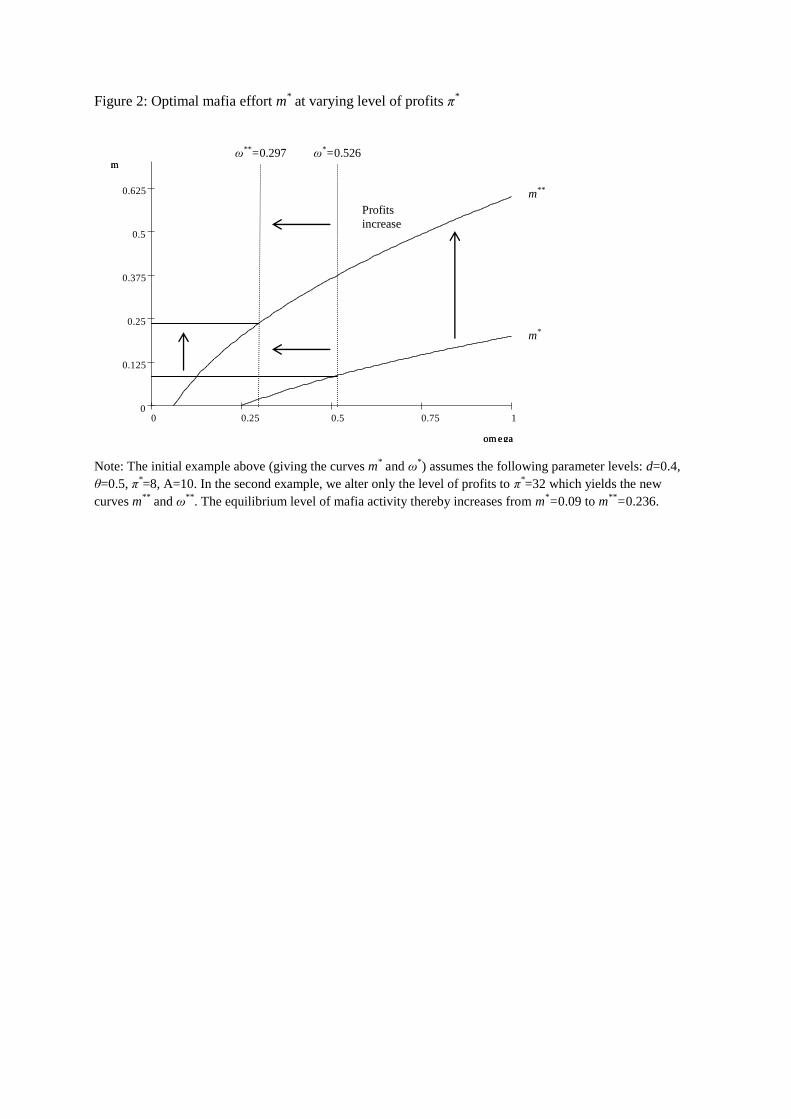
Figure 2: Optimal mafia effort m* at varying level of profits π
*
Note: The initial example above (giving the curves m* and ω
*) assumes the following parameter levels: d=0.4,
θ=0.5, π*=8, A=10. In the second example, we alter only the level of profits to π
*=32 which yields the new
curves m**
and ω**
. The equilibrium level of mafia activity thereby increases from m*=0.09 to m
**=0.236.
10.750.50.250
0.625
0.5
0.375
0.25
0.125
0
om ega
m
om ega
m
Profits
increase
m*
m**
ω*=0.526 ω**=0.297
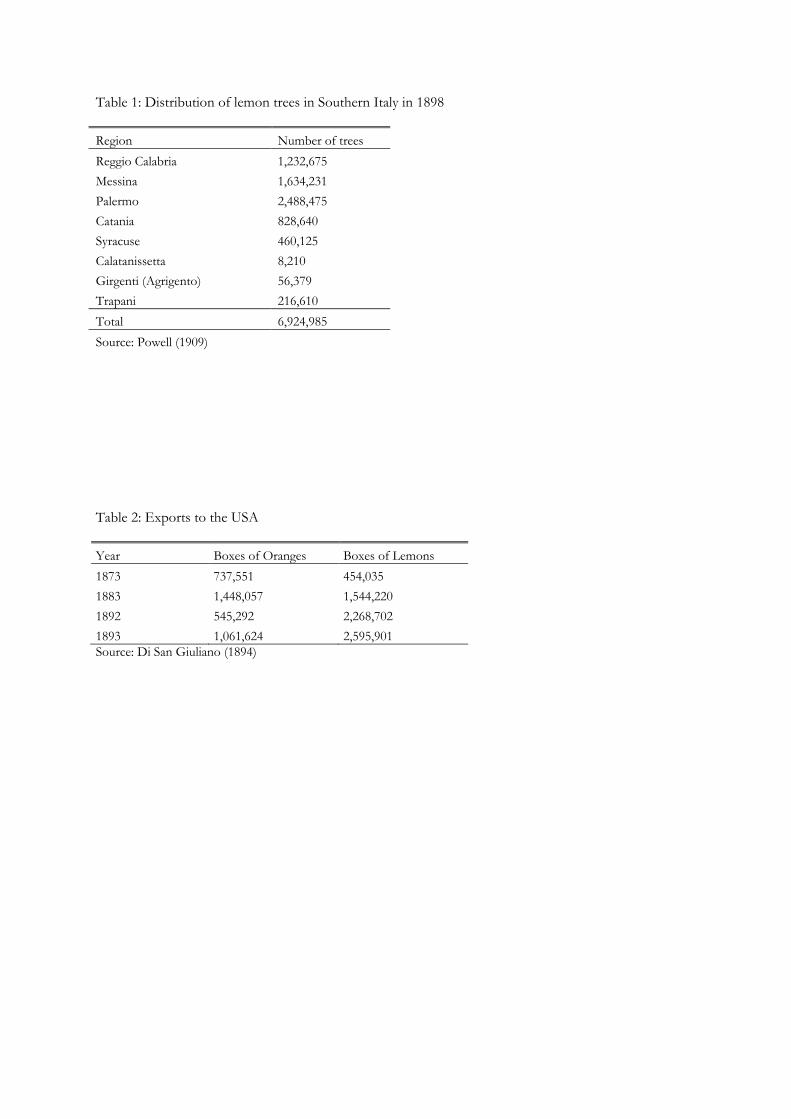
Table 1: Distribution of lemon trees in Southern Italy in 1898
Region Number of trees Reggio Calabria 1,232,675 Messina 1,634,231 Palermo 2,488,475 Catania 828,640 Syracuse 460,125 Calatanissetta 8,210 Girgenti (Agrigento) 56,379 Trapani 216,610 Total 6,924,985 Source: Powell (1909)
Table 2: Exports to the USA
Year Boxes of Oranges Boxes of Lemons 1873 737,551 454,035 1883 1,448,057 1,544,220 1892 545,292 2,268,702 1893 1,061,624 2,595,901 Source: Di San Giuliano (1894)
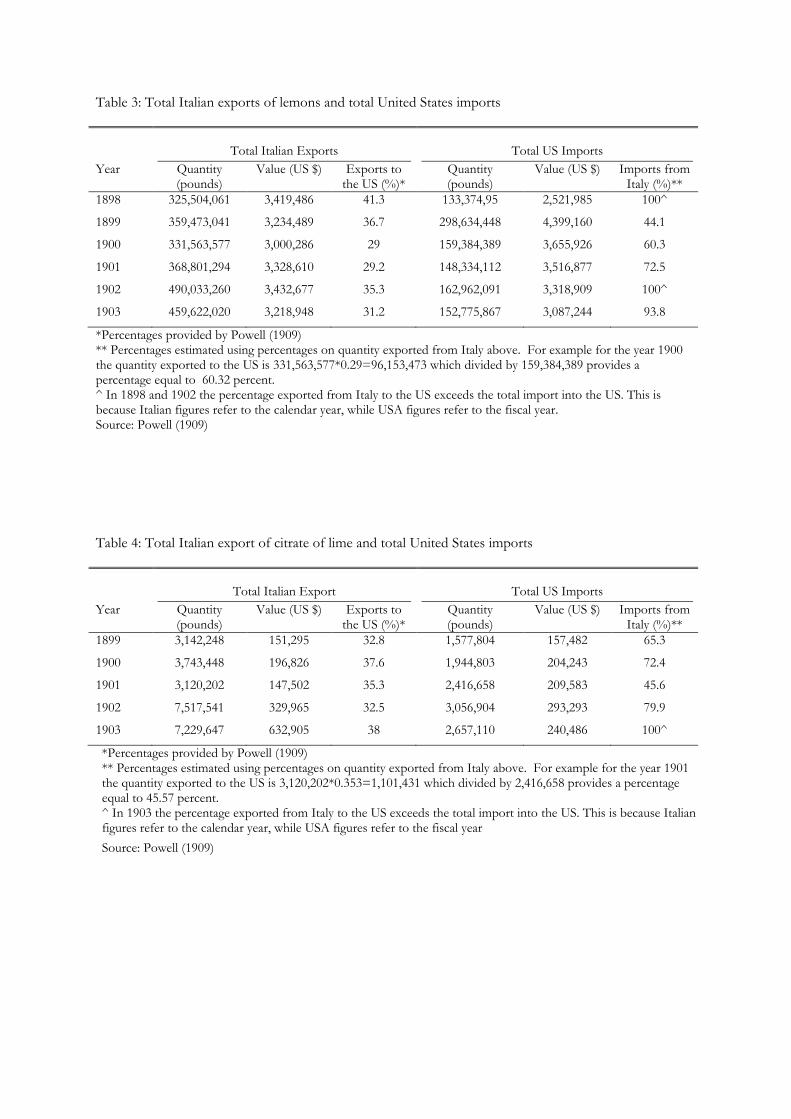
Table 3: Total Italian exports of lemons and total United States imports
Total Italian Exports
Total US Imports
Year Quantity (pounds)
Value (US $) Exports to the US (%)*
Quantity (pounds)
Value (US $) Imports from Italy (%)**
1898 325,504,061 3,419,486 41.3 133,374,95 2,521,985 100^
1899 359,473,041 3,234,489 36.7 298,634,448 4,399,160 44.1
1900 331,563,577 3,000,286 29 159,384,389 3,655,926 60.3
1901 368,801,294 3,328,610 29.2 148,334,112 3,516,877 72.5
1902 490,033,260 3,432,677 35.3 162,962,091 3,318,909 100^
1903 459,622,020 3,218,948 31.2 152,775,867 3,087,244 93.8
*Percentages provided by Powell (1909) ** Percentages estimated using percentages on quantity exported from Italy above. For example for the year 1900 the quantity exported to the US is 331,563,577*0.29=96,153,473 which divided by 159,384,389 provides a percentage equal to 60.32 percent. ^ In 1898 and 1902 the percentage exported from Italy to the US exceeds the total import into the US. This is because Italian figures refer to the calendar year, while USA figures refer to the fiscal year. Source: Powell (1909)
Table 4: Total Italian export of citrate of lime and total United States imports
Total Italian Export
Total US Imports
Year Quantity (pounds)
Value (US $) Exports to the US (%)*
Quantity (pounds)
Value (US $) Imports from Italy (%)**
1899 3,142,248 151,295 32.8 1,577,804 157,482 65.3
1900 3,743,448 196,826 37.6 1,944,803 204,243 72.4
1901 3,120,202 147,502 35.3 2,416,658 209,583 45.6
1902 7,517,541 329,965 32.5 3,056,904 293,293 79.9
1903 7,229,647 632,905 38 2,657,110 240,486 100^
*Percentages provided by Powell (1909) ** Percentages estimated using percentages on quantity exported from Italy above. For example for the year 1901 the quantity exported to the US is 3,120,202*0.353=1,101,431 which divided by 2,416,658 provides a percentage equal to 45.57 percent. ^ In 1903 the percentage exported from Italy to the US exceeds the total import into the US. This is because Italian figures refer to the calendar year, while USA figures refer to the fiscal year Source: Powell (1909)
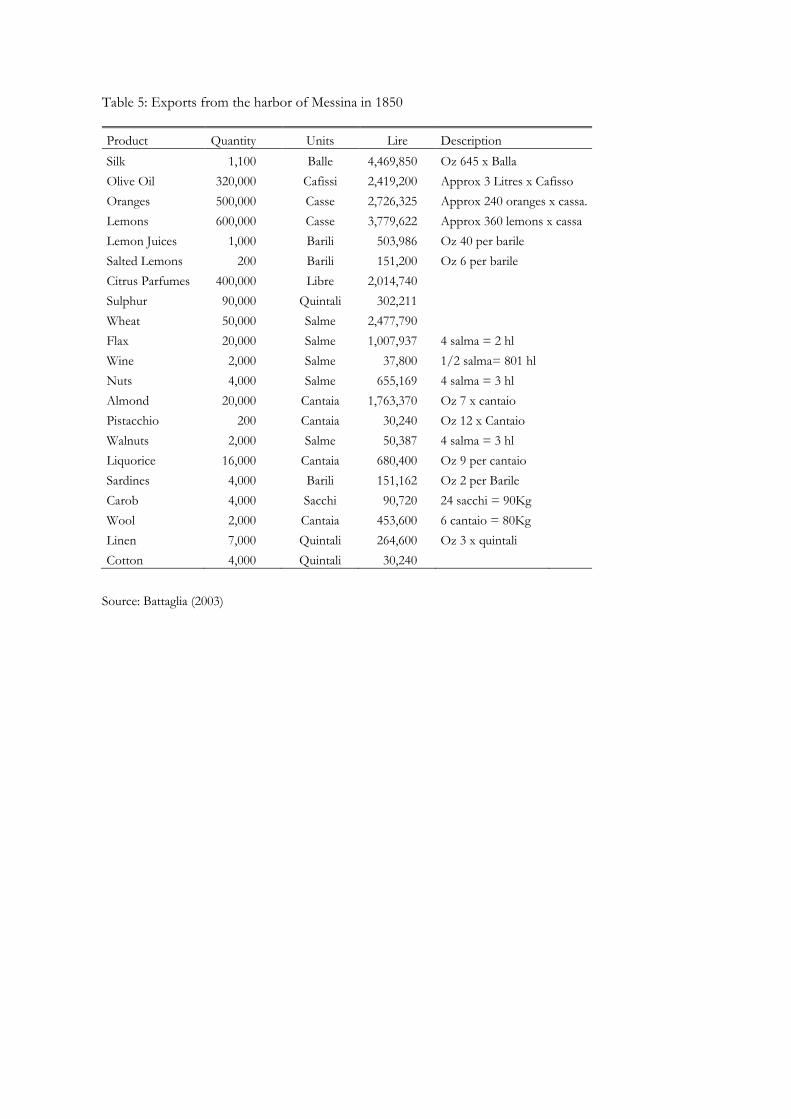
Table 5: Exports from the harbor of Messina in 1850
Product Quantity Units Lire Description Silk 1,100 Balle 4,469,850 Oz 645 x Balla Olive Oil 320,000 Cafissi 2,419,200 Approx 3 Litres x Cafisso Oranges 500,000 Casse 2,726,325 Approx 240 oranges x cassa. Lemons 600,000 Casse 3,779,622 Approx 360 lemons x cassa Lemon Juices 1,000 Barili 503,986 Oz 40 per barile Salted Lemons 200 Barili 151,200 Oz 6 per barile Citrus Parfumes 400,000 Libre 2,014,740
Sulphur 90,000 Quintali 302,211 Wheat 50,000 Salme 2,477,790 Flax 20,000 Salme 1,007,937 4 salma = 2 hl
Wine 2,000 Salme 37,800 1/2 salma= 801 hl Nuts 4,000 Salme 655,169 4 salma = 3 hl Almond 20,000 Cantaia 1,763,370 Oz 7 x cantaio Pistacchio 200 Cantaia 30,240 Oz 12 x Cantaio Walnuts 2,000 Salme 50,387 4 salma = 3 hl Liquorice 16,000 Cantaia 680,400 Oz 9 per cantaio Sardines 4,000 Barili 151,162 Oz 2 per Barile Carob 4,000 Sacchi 90,720 24 sacchi = 90Kg Wool 2,000 Cantaia 453,600 6 cantaio = 80Kg Linen 7,000 Quintali 264,600 Oz 3 x quintali Cotton 4,000 Quintali 30,240
Source: Battaglia (2003)
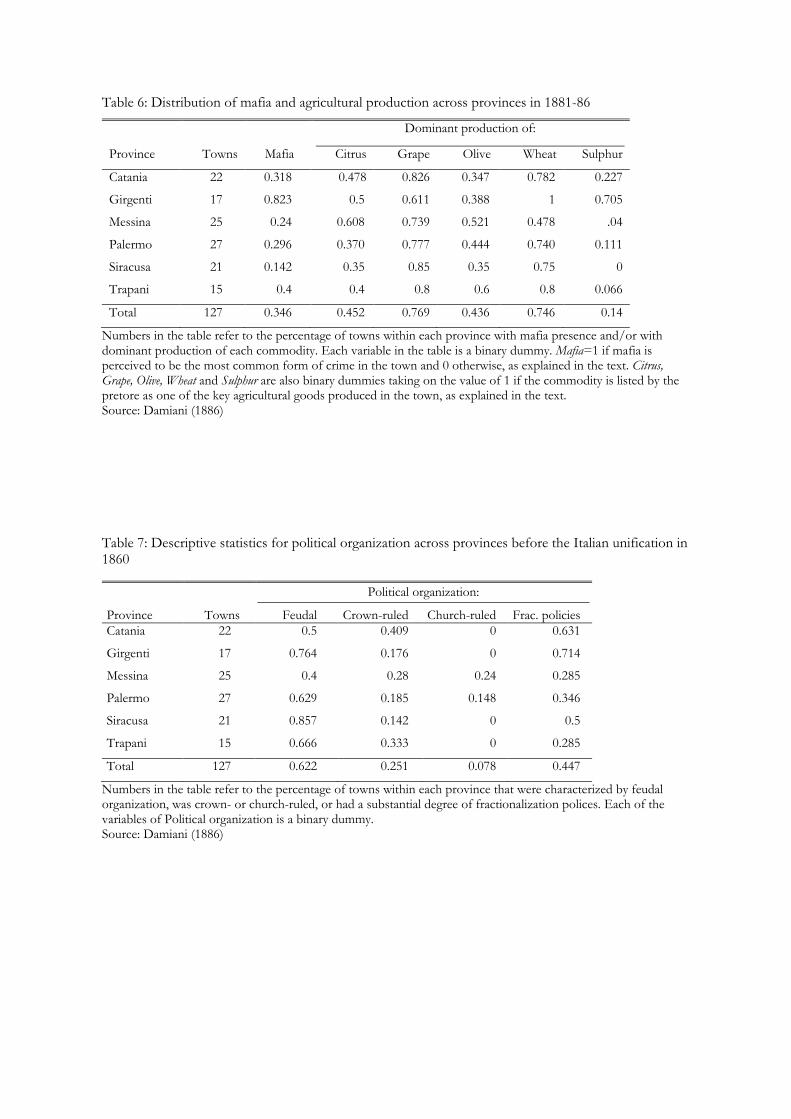
Table 6: Distribution of mafia and agricultural production across provinces in 1881-86
Dominant production of:
Province Towns Mafia Citrus Grape Olive Wheat Sulphur
Catania 22 0.318 0.478 0.826 0.347 0.782 0.227
Girgenti 17 0.823 0.5 0.611 0.388 1 0.705
Messina 25 0.24 0.608 0.739 0.521 0.478 .04
Palermo 27 0.296 0.370 0.777 0.444 0.740 0.111
Siracusa 21 0.142 0.35 0.85 0.35 0.75 0
Trapani 15 0.4 0.4 0.8 0.6 0.8 0.066
Total 127 0.346 0.452 0.769 0.436 0.746 0.14
Numbers in the table refer to the percentage of towns within each province with mafia presence and/or with dominant production of each commodity. Each variable in the table is a binary dummy. Mafia=1 if mafia is perceived to be the most common form of crime in the town and 0 otherwise, as explained in the text. Citrus, Grape, Olive, Wheat and Sulphur are also binary dummies taking on the value of 1 if the commodity is listed by the pretore as one of the key agricultural goods produced in the town, as explained in the text. Source: Damiani (1886)
Table 7: Descriptive statistics for political organization across provinces before the Italian unification in 1860
Political organization:
Province Towns Feudal Crown-ruled Church-ruled Frac. policies Catania 22 0.5 0.409 0 0.631
Girgenti 17 0.764 0.176 0 0.714
Messina 25 0.4 0.28 0.24 0.285
Palermo 27 0.629 0.185 0.148 0.346
Siracusa 21 0.857 0.142 0 0.5
Trapani 15 0.666 0.333 0 0.285
Total 127 0.622 0.251 0.078 0.447
Numbers in the table refer to the percentage of towns within each province that were characterized by feudal organization, was crown- or church-ruled, or had a substantial degree of fractionalization polices. Each of the variables of Political organization is a binary dummy. Source: Damiani (1886)
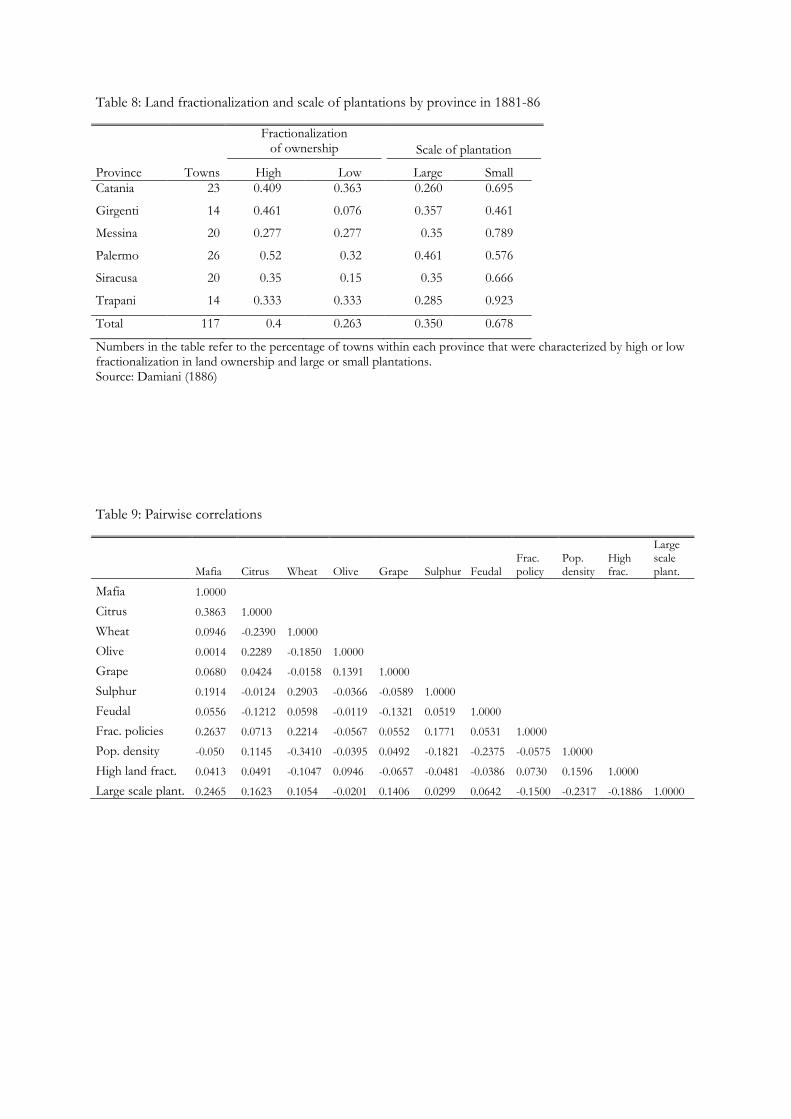
Table 8: Land fractionalization and scale of plantations by province in 1881-86
Fractionalization of ownership Scale of plantation
Province Towns High Low Large Small Catania 23 0.409 0.363 0.260 0.695
Girgenti 14 0.461 0.076 0.357 0.461
Messina 20 0.277 0.277 0.35 0.789
Palermo 26 0.52 0.32 0.461 0.576
Siracusa 20 0.35 0.15 0.35 0.666
Trapani 14 0.333 0.333 0.285 0.923
Total 117 0.4 0.263 0.350 0.678
Numbers in the table refer to the percentage of towns within each province that were characterized by high or low fractionalization in land ownership and large or small plantations. Source: Damiani (1886)
Table 9: Pairwise correlations
Mafia Citrus Wheat Olive Grape Sulphur Feudal Frac. policy
Pop. density
High frac.
Large scale plant.
Mafia 1.0000 Citrus 0.3863 1.0000
Wheat 0.0946 -0.2390 1.0000 Olive 0.0014 0.2289 -0.1850 1.0000
Grape 0.0680 0.0424 -0.0158 0.1391 1.0000 Sulphur 0.1914 -0.0124 0.2903 -0.0366 -0.0589 1.0000
Feudal 0.0556 -0.1212 0.0598 -0.0119 -0.1321 0.0519 1.0000 Frac. policies 0.2637 0.0713 0.2214 -0.0567 0.0552 0.1771 0.0531 1.0000
Pop. density -0.050 0.1145 -0.3410 -0.0395 0.0492 -0.1821 -0.2375 -0.0575 1.0000 High land fract. 0.0413 0.0491 -0.1047 0.0946 -0.0657 -0.0481 -0.0386 0.0730 0.1596 1.0000
Large scale plant. 0.2465 0.1623 0.1054 -0.0201 0.1406 0.0299 0.0642 -0.1500 -0.2317 -0.1886 1.0000
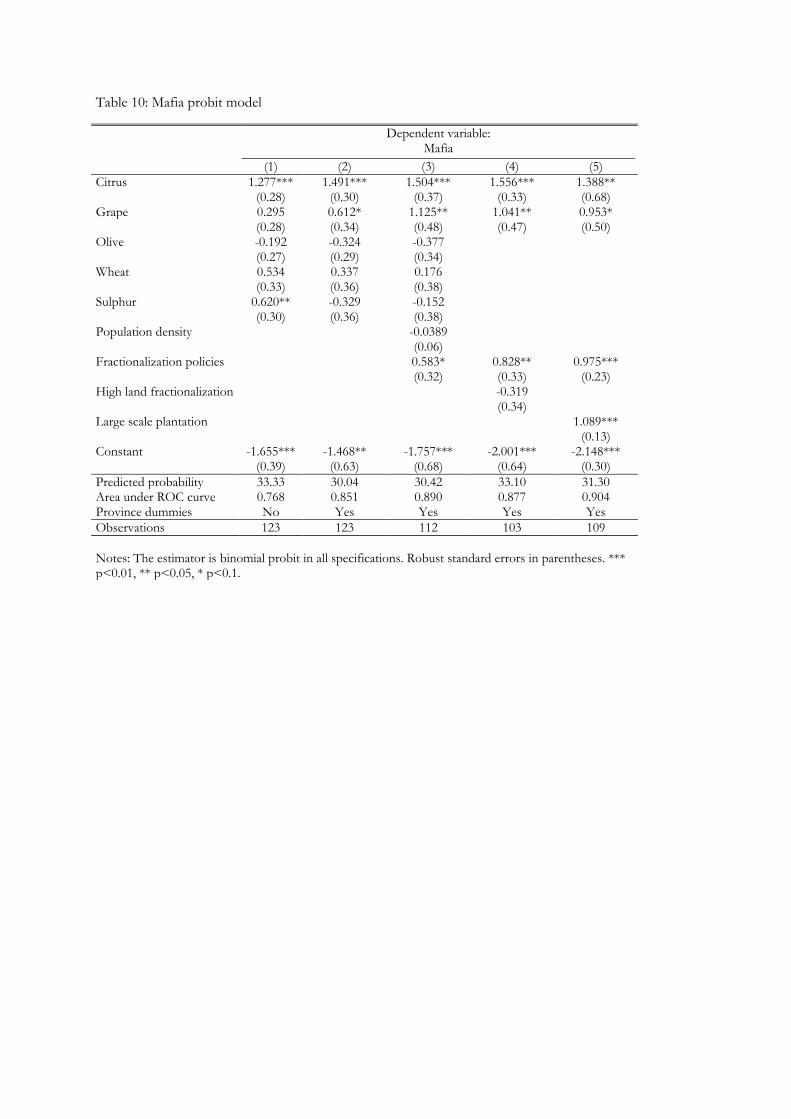
Table 10: Mafia probit model
Dependent variable: Mafia
(1) (2) (3) (4) (5)
Citrus 1.277*** 1.491*** 1.504*** 1.556*** 1.388**
(0.28) (0.30) (0.37) (0.33) (0.68)
Grape 0.295 0.612* 1.125** 1.041** 0.953*
(0.28) (0.34) (0.48) (0.47) (0.50)
Olive -0.192 -0.324 -0.377
(0.27) (0.29) (0.34)
Wheat 0.534 0.337 0.176
(0.33) (0.36) (0.38)
Sulphur 0.620** -0.329 -0.152
(0.30) (0.36) (0.38)
Population density
-0.0389
(0.06)
Fractionalization policies
0.583* (0.32)
0.828** (0.33)
0.975*** (0.23)
High land fractionalization
-0.319 (0.34)
Large scale plantation
1.089***
(0.13)
Constant -1.655*** -1.468** -1.757*** -2.001*** -2.148***
(0.39) (0.63) (0.68) (0.64) (0.30)
Predicted probability 33.33 30.04 30.42 33.10 31.30 Area under ROC curve 0.768 0.851 0.890 0.877 0.904 Province dummies No Yes Yes Yes Yes Observations 123 123 112 103 109 Notes: The estimator is binomial probit in all specifications. Robust standard errors in parentheses. *** p<0.01, ** p<0.05, * p<0.1.
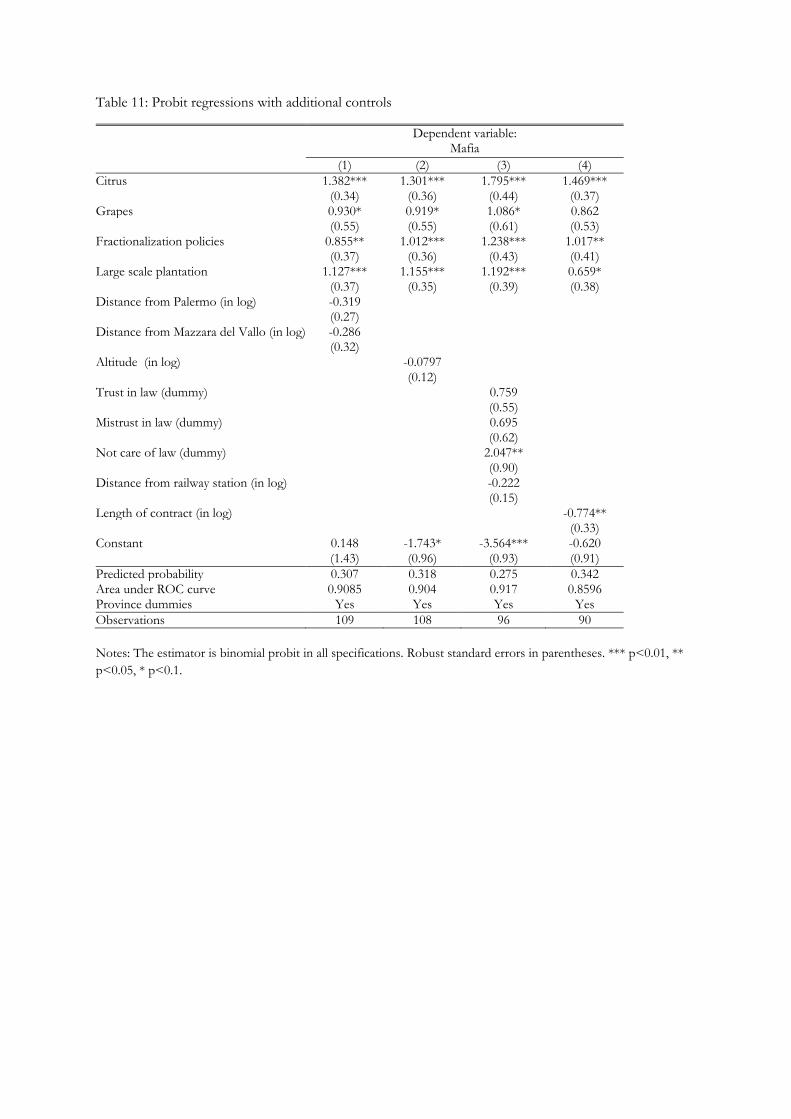
Table 11: Probit regressions with additional controls
Dependent variable: Mafia
(1) (2) (3) (4) Citrus 1.382*** 1.301*** 1.795*** 1.469*** (0.34) (0.36) (0.44) (0.37) Grapes 0.930* 0.919* 1.086* 0.862 (0.55) (0.55) (0.61) (0.53) Fractionalization policies 0.855** 1.012*** 1.238*** 1.017** (0.37) (0.36) (0.43) (0.41) Large scale plantation 1.127*** 1.155*** 1.192*** 0.659* (0.37) (0.35) (0.39) (0.38) Distance from Palermo (in log) -0.319 (0.27) Distance from Mazzara del Vallo (in log) -0.286 (0.32) Altitude (in log) -0.0797 (0.12) Trust in law (dummy) 0.759 (0.55) Mistrust in law (dummy) 0.695 (0.62) Not care of law (dummy) 2.047** (0.90) Distance from railway station (in log) -0.222 (0.15) Length of contract (in log) -0.774** (0.33) Constant 0.148 -1.743* -3.564*** -0.620 (1.43) (0.96) (0.93) (0.91) Predicted probability 0.307 0.318 0.275 0.342 Area under ROC curve 0.9085 0.904 0.917 0.8596 Province dummies Yes Yes Yes Yes Observations 109 108 96 90 Notes: The estimator is binomial probit in all specifications. Robust standard errors in parentheses. *** p<0.01, ** p<0.05, * p<0.1.
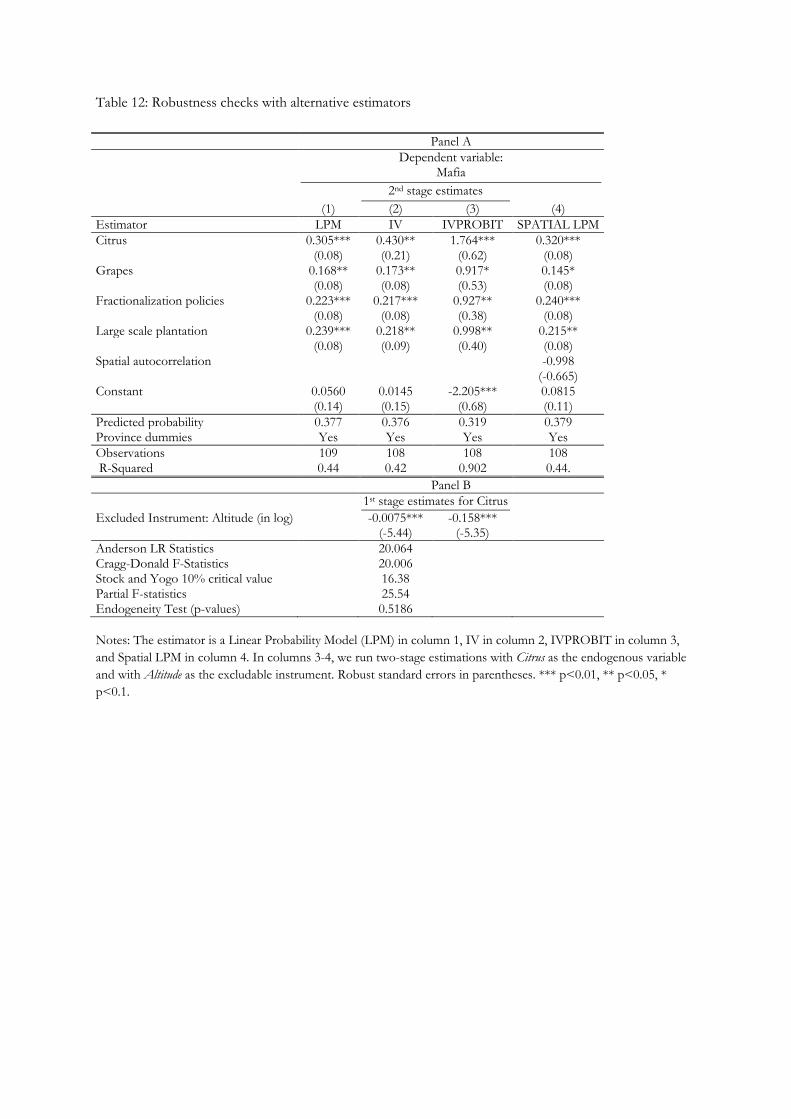
Table 12: Robustness checks with alternative estimators
Panel A
Dependent variable:
Mafia
2nd stage estimates
(1) (2) (3) (4) Estimator LPM IV IVPROBIT SPATIAL LPM Citrus 0.305*** 0.430** 1.764*** 0.320*** (0.08) (0.21) (0.62) (0.08) Grapes 0.168** 0.173** 0.917* 0.145* (0.08) (0.08) (0.53) (0.08) Fractionalization policies 0.223*** 0.217*** 0.927** 0.240*** (0.08) (0.08) (0.38) (0.08) Large scale plantation 0.239*** 0.218** 0.998** 0.215** (0.08) (0.09) (0.40) (0.08) Spatial autocorrelation -0.998 (-0.665) Constant 0.0560 0.0145 -2.205*** 0.0815 (0.14) (0.15) (0.68) (0.11) Predicted probability 0.377 0.376 0.319 0.379 Province dummies Yes Yes Yes Yes Observations 109 108 108 108 R-Squared 0.44 0.42 0.902 0.44. Panel B 1st stage estimates for Citrus Excluded Instrument: Altitude (in log) -0.0075***
(-5.44) -0.158***
(-5.35)
Anderson LR Statistics 20.064 Cragg-Donald F-Statistics 20.006 Stock and Yogo 10% critical value 16.38 Partial F-statistics 25.54 Endogeneity Test (p-values) 0.5186 Notes: The estimator is a Linear Probability Model (LPM) in column 1, IV in column 2, IVPROBIT in column 3, and Spatial LPM in column 4. In columns 3-4, we run two-stage estimations with Citrus as the endogenous variable and with Altitude as the excludable instrument. Robust standard errors in parentheses. *** p<0.01, ** p<0.05, * p<0.1.
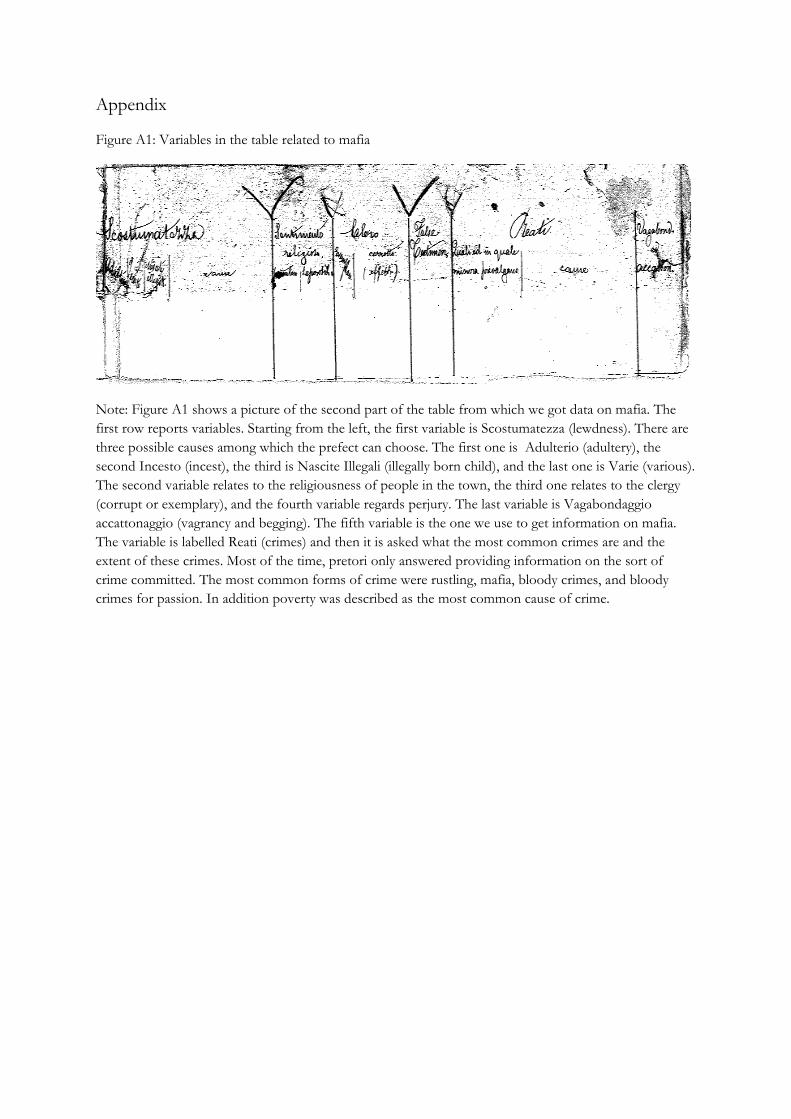
Appendix
Figure A1: Variables in the table related to mafia
Note: Figure A1 shows a picture of the second part of the table from which we got data on mafia. The first row reports variables. Starting from the left, the first variable is Scostumatezza (lewdness). There are three possible causes among which the prefect can choose. The first one is Adulterio (adultery), the second Incesto (incest), the third is Nascite Illegali (illegally born child), and the last one is Varie (various). The second variable relates to the religiousness of people in the town, the third one relates to the clergy (corrupt or exemplary), and the fourth variable regards perjury. The last variable is Vagabondaggio accattonaggio (vagrancy and begging). The fifth variable is the one we use to get information on mafia. The variable is labelled Reati (crimes) and then it is asked what the most common crimes are and the extent of these crimes. Most of the time, pretori only answered providing information on the sort of crime committed. The most common forms of crime were rustling, mafia, bloody crimes, and bloody crimes for passion. In addition poverty was described as the most common cause of crime.
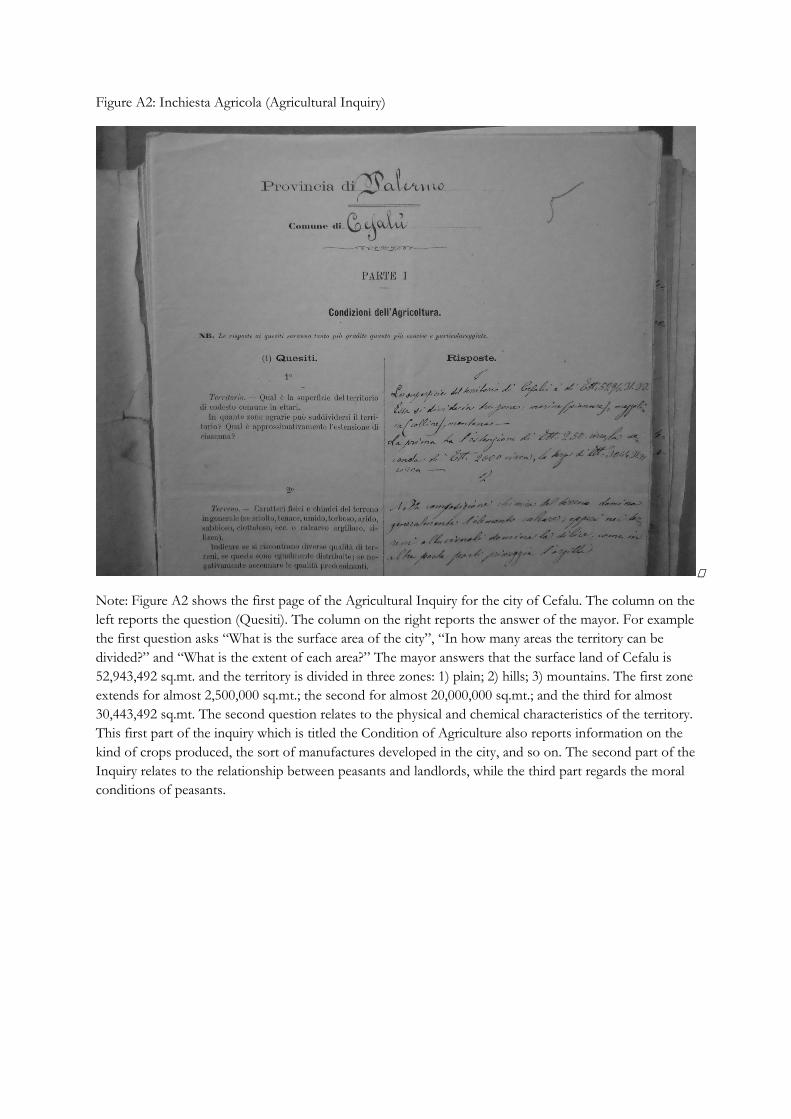
Figure A2: Inchiesta Agricola (Agricultural Inquiry)
Note: Figure A2 shows the first page of the Agricultural Inquiry for the city of Cefalu. The column on the left reports the question (Quesiti). The column on the right reports the answer of the mayor. For example the first question asks “What is the surface area of the city”, “In how many areas the territory can be divided?” and “What is the extent of each area?” The mayor answers that the surface land of Cefalu is 52,943,492 sq.mt. and the territory is divided in three zones: 1) plain; 2) hills; 3) mountains. The first zone extends for almost 2,500,000 sq.mt.; the second for almost 20,000,000 sq.mt.; and the third for almost 30,443,492 sq.mt. The second question relates to the physical and chemical characteristics of the territory. This first part of the inquiry which is titled the Condition of Agriculture also reports information on the kind of crops produced, the sort of manufactures developed in the city, and so on. The second part of the Inquiry relates to the relationship between peasants and landlords, while the third part regards the moral conditions of peasants.
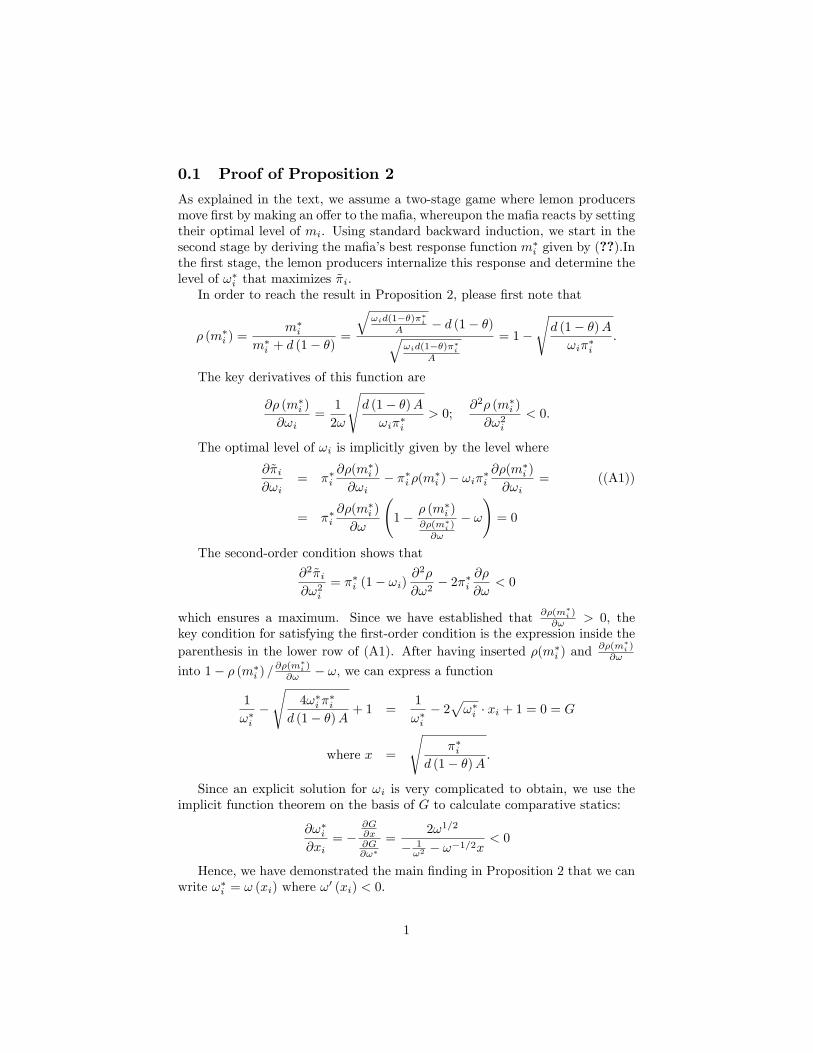
0.1 Proof of Proposition 2
As explained in the text, we assume a two-stage game where lemon producersmove �rst by making an o¤er to the ma�a, whereupon the ma�a reacts by settingtheir optimal level of mi. Using standard backward induction, we start in thesecond stage by deriving the ma�a�s best response function m�
i given by (??):Inthe �rst stage, the lemon producers internalize this response and determine thelevel of !�i that maximizes ~�i.In order to reach the result in Proposition 2, please �rst note that
� (m�i ) =
m�i
m�i + d (1� �)
=
q!id(1��)��i
A � d (1� �)q!id(1��)��i
A
= 1�
sd (1� �)A!i��i
:
The key derivatives of this function are
@� (m�i )
@!i=
1
2!
sd (1� �)A!i��i
> 0;@2� (m�
i )
@!2i< 0:
The optimal level of !i is implicitly given by the level where
@~�i@!i
= ��i@�(m�
i )
@!i� ��i �(m�
i )� !i��i@�(m�
i )
@!i= ((A1))
= ��i@�(m�
i )
@!
1� � (m�
i )@�(m�
i )
@!
� !!= 0
The second-order condition shows that
@2~�i@!2i
= ��i (1� !i)@2�
@!2� 2��i
@�
@!< 0
which ensures a maximum. Since we have established that @�(m�i )
@! > 0, thekey condition for satisfying the �rst-order condition is the expression inside theparenthesis in the lower row of (A1). After having inserted �(m�
i ) and@�(m�
i )@!
into 1� � (m�i ) =
@�(m�i )
@! � !, we can express a function
1
!�i�s
4!�i ��i
d (1� �)A + 1 =1
!�i� 2p!�i � xi + 1 = 0 = G
where x =
s��i
d (1� �)A:
Since an explicit solution for !i is very complicated to obtain, we use theimplicit function theorem on the basis of G to calculate comparative statics:
@!�i@xi
= �@G@x@G@!�
=2!1=2
� 1!2 � !�1=2x
< 0
Hence, we have demonstrated the main �nding in Proposition 2 that we canwrite !�i = ! (xi) where !
0 (xi) < 0.
1