Embed Size (px)
Citation preview

Introduction
Wastewater leads to organic contamination and eutrophication in receiving water. Due to increasingly stringent effluent quality requirements in China, existing wastewater treatment plants (WWTPS) need to modify configurations (such as modified A2/O, JHB, VIP process) or optimize operational parameters in order to guarantee the effluent. The JHB process introduces a pre-anoxic selector prior to the anaerobic zone to eliminate the negative effect of NO3
--N existing in the return
activated sludge (RSS) on anaerobic phosphorus release. Every zone of the VIP process consists of several tanks in order to form a concentration gradient. The modified A2/O process in this study combined both advantages of the JHB and VIP process.
Besides wastewater characteristics, mixed liquid suspended solids (MLSS) and sludge retention time (SRT) are important factors affecting effluent. MLSS is an easy and direct control parameter for biomass, which plays a significant role on the shearing thinning behavior [1] and SVI [2]. SRT is positively related with soluble microbial products (SMP) formation [3]. Actually, MLSS can be adjusted by sludge return ratio and discharge of waste sludge, so it is partially related with SRT. MLSS-based
Pol. J. Environ. Stud. Vol. 27, No. 4 (2018), 1475-1482
Original Research
Integrated Effect of MLSS and SRT on Performance of a Full-Scale Modified
A2/O Process
Jie Fan1*, Jiasong Ye1, Hang Zhang1, Bin Ji1, Wenning Ye2
1College of Urban Construction, Wuhan University of Science and Technology, Wuhan 430065, China2Anqing Wastewater Treatment Plant, Anqing, China
Received: 1 June 2017Accepted: 10 September 2017
Abstract
MLSS and SRT are key parameters in process control. A full-scale modified A2/O process varying with MLSS and SRT was evaluated, and MLSS and SRT effect was distinguished by statistical methods so as to seek early diagnosis and efficient control. Results showed that complete SRT rather than MLSS resulted in considerable effluent SS fluctuation with inert SS accumulation. COD removal was more sensitive to MLSS than SRT. Increasing MLSS until 2,000 mg/L could improve COD, SS, and NH3 removal efficiency, and further increases in MLSS simply enhance stability. MLSS of 2,000 mg/L was also efficient in TP removal. SRT shorter than 30 d was the guarantee for PAOs, while SRT longer than 90 d was equal to complete SRT as TP was removed by assimilation. Prolonged SRT from 30 to 90 days reduced the Yobs from 0.17 to 0.15 g MLSS/g COD. MLSS and SRT had no effect on TN removal. Correlation between MLSS and influent was effective for diagnosing longer SRT. MLSS/RSS could be an indicator for TP removal. The suggested control strategy was SRT-assisted MLSS control.
Keywords: MLSS, SRT, statistical analysis, stability, control strategy
*e-mail: [email protected]
DOI: 10.15244/pjoes/76914 ONLINE PUBLICATION DATE: 2018-03-05
1476 Fan J., et al.
SRT control is able to reduce COD removal variation by 90% [4]. However, in some conditions such as in winter or start-up running with low strength influent, biomass fails to grow, thus wasting sludge is not discharged (complete SRT or infinite SRT) so as to sustain sufficient MLSS, resulting in total independence of SRT and MLSS. In recent years, the high organic load-activated sludge process with complete SRT is reported to be sludge minimization [5] with sedimentation problems [6] and decreased nitrifying bacterial [7].
In view of the complexity of WWTP with many variables, statistical methods can be a useful tool to seek physical explanation of observed facts. For example, Person or Spearman correlation coefficient can reveal correlations between parameters, explaining the phenomenon of phosphorus fluctuation [8] and analyzing the effect of MLSS on bacterial composition [9]. Also, the statistical method is useful for detecting a change in WWTP operation [10] and is effective for early identification of potential problems [11].
In this study, MLSS and SRT were varied in the Anqing WWTP. Through analysis of removal stability, biomass characteristics, and factors analysis by statistical methods, the goal of the study was to evaluate the integrated effect of MLSS and SRT on performance as well as to identify parameters for irregular behavior diagnosis and control.
Material and Methods
Description of Wastewater Treatment Plant
The Anqing WWTP was designed to treat a flow of 12×104 m3/d, including 80% of domestic wastewater and 20% of industry wastewater. The plant consisted of pre-selector, anaerobic, anoxic, three-staged oxic tanks and settler. 90% of influent came into an anaerobic tank while 10% came into a pre-anoxic selector where denitrification of return-activated sludge was accomplished. Oxic tanks were composed of three rectangular tanks and aeration was provided through a porous membrane aerator. Details of process constitutes could be seen in our previous study [12]. Influent wastewater was typically of low-strength. Average concentration of influent COD, BOD5, TN, TP, NH3-N, NO3-N, NO2-N, and SS was 185, 48, 14, 1.26, 7.90, 3.58, 0.011, and 76 mg/L, respectively. The internal recycle ratio was lower than 50% in consideration of low-influent TN and operational cost. The external recycle ratio was 100%.
MLSS and SRT Experiment
The experiment was divided into three periods, with each period operating for several months. In order to eliminate differences caused by temperature, data of November, March, and April with similar water temperature (12-16ºC) were selected for analysis. In period 1, ranging from September to December, MLSS
did not grow, and growth of biomass was equal to decay, therefore no waste activated sludge (WAS) was removed from the system. Then to stimulate growth and activity of biomass, WAS of 420 m3/d (period 2) and 140 m3/d (period 3) were discharged. As a result, the experiment was divided into period 1 (MLSS of 1,062±294 mg/L, complete SRT), period 2 (MLSS of 1,270±176 mg/L, SRT of 30 d), and period 3 (MLSS of 3,694±578 mg/L, SRT of 90 d). It was worth mentioning that initial design MLSS concentration for this WWTP was 3,500 mg/L.
Analytical and Statistical Methods
According to standard methods [13], COD, MLSS, NH3-N, NO3-N, NO2-N, TN, and TP were measured. DO and temperature were measured using a Cellox 325-3 oxygen probe. To evaluate biomass growth, observed yield Yobs was calculated by measuring the amount of WAS and COD removal per day, as shown in Eq. (1):
(1)
The measured results were offered as means ±standard deviation. The statistical significance of difference between operational periods was assessed using the Student’s t-test at the 95% confidence level (P<0.05). Person’s correlation coefficient (r) was calculated to indicate pairwise correlation. Principal component analysis (PCA) was conducted to extract the main factors affecting effluent quality among influent variables and operating parameters. Also, multiple linear regressions were used to quantitatively describe variables. All the statistical analysis was accomplished by SPSS 19.0 software.
Results and Discussion
Operation Results of three Periods
COD removal was shown in Fig. 1a). For periods 1, 2, and 3, COD removal was 70±3% , 77±2%, and 80±1%, respectively. Average BOD5 removal was 64%, 69%, and 73%, respectively. BOD5 removal lower than COD removal reflected the poor biodegradability of the wastewater, and some organics were only absorbed by activated sludge but not biodegraded. COD removal of period 1 with complete SRT was the lowest. COD removal of periods 2 and 3 was statistically different (p<0.01). Effluent COD in periods 1 and 3 was not associated with effluent SS, as shown in Fig. 1f), hence the main constitute of effluent COD was dissolved COD such as soluble microbial product (SMP).
SS removal from periods 1 to 3 (Fig. 1b) was 62±23%, 79±6%, and 83±4%, respectively. In period 1, SS removal fluctuated extremely from 21% to 85%, and effluent SS always exceeded 20 mg/L, which did not meet the

1477Integrated Effect of MLSS and SRT...
discharge limit. The phenomenon of deteriorated effluent SS with complete SRT was also observed by Amanatidou [6], who attributed this phenomenon to high MLSS and flotation of sludge flocs in the clarifier. However, in our study SS fluctuation was observed when MLSS was relatively low, so the explanation for SS fluctuation existed in flocculating and settling property of sludge. Measured SV30 of 5~8% proved the aging of sludge, which made the sludge less cohesive [14]. On the other hand, the main constituent of effluent SS was inorganic or inert substances since no correlation existed among effluent SS and effluent COD, TN, and TP (Fig. 1f) in periods 1 and 3, while in period 2 effluent SS was correlated with effluent TN (r = 0.51). From the above, the reason for fluctuation in SS removal was proved to be sludge aging and inert SS accumulation. Whether the disable removal of inert SS
was caused by complete SRT or relatively low MLSS will be resolved later in the statistical analysis section.
NH3-N removal from period 1 to 3 (Fig. 1c) was 91±6%, 97±3%, and 98±2%, respectively. As it is known that long SRT was beneficial for nitrifers, NH3-N removal of period 3 was improved as compared to period 2 (p<0.05), but NH3-N removal of period 1 was not favored despite complete SRT. With complete SRT, ammonia-oxidizing bacteria (AOB) and nitrite-oxidizing bacteria (NOB) decreased [7]. TN removal (Fig. 1d) was 19±10%, 17±11% and 13±7%, respectively. TN removal of periods 1 and 3 was different (p<0.05), which was mainly correlated with influent NH3 (r = 0.70).
Average TP removal (Fig.1e) was 28%, 53%, 31%, respectively. Phosphorus excessively absorbed by polyphosphate-accumulating organisms (PAOs) was
Fig. 1. Profiles of COD, SS, NH3-N, TN, and TP, for influent ■, effluent ▲, and removal efficiency ○.

1478 Fan J., et al.
removed from the system along with WAS. Without discharge of waste sludge, phosphorus could only be removed for bacterial assimilation. Based on empirical bacterial formula C60H87O23N12P [15], P in wasted sludge could be calculated with 2.3%ΔX, and calculated TP removal through assimilation was 22% in period 3. The calculation result indicated that assimilation was the major reason for TP removal in period 3. In period 1, P release disappeared and P uptake became very weak (data not shown). F/M ratio was 0.06 kg BOD5/kg MLSS.d, which negatively affected PAOs due to carbon starvation [16]. Also, prolonged SRT was not beneficial for PAO recovery of PHA and glycogen [17]. In period 2, TP removal was improved obviously, along with wide fluctuation (SD = 19%).
MLSS and Distribution
Fig. 2 showed the MLSS, MLVSS, ash, and MLVSS/MLSS ratios and observed sludge yield Yobs. From period 1 to 3, average MLSS of 1,062, 1,270, and 3,694 mg/L and MLVSS of 475, 760, and 2,720 mg/L were obtained,
with MLVSS/MLSS ratio of 0.48, 0.60, and 0.78. In period 1 the MLVSS/MLSS ratio dropped straight from 0.60 to 0.30. From day 15 to day 30, the increasing MLSS was absolutely due to the accumulation of ash in activated sludge (r = 0.85). Compared with period 1, both MLVSS and ash were more stable in period 2. Although influent COD increased from 180 mg/L (in periods 1 and 2) to 220 mg/L (period 3), influent BOD5 increased from 50 to 60 mg/L, and it seemed inadequate for supporting the rapid increase of the MLVSS/MLSS ratio from 0.60 to 0.80. The reason for the increased MLVSS/MLSS ratio was unclear and could be further researched through stored polymers and EPS. Yobs of periods 2 and 3 was 0.17 and 0.15 g MLSS/g COD. The decline in Yobs was supported by the finding that prolonged SRT from 10 to 110 days reduced Yobs from 0.31 to 0.13 [18].
It was very occasional to find that MLSS distribution in three-stage aerobic tanks was uneven. In period 1, the difference of MLSS in three oxic tanks was not obvious (Fig. 2b), while in periods 2 and 3 MLSS in three aerobic tanks increased. Correlation analysis between influent SS and MLSS of each tank found that the Person coefficient gradually increased with three oxic tanks (r1 = 0.41, r2 = 0.49, r3 = 0.64), the opposite of usually expected and thus increasing MLSS did not result from influent SS but was caused by sedimentation of MLSS in the bottom of the tank. With increased DO in three tanks (DO1 = 3.15, DO2 = 5.55, and DO3 = 5.73 mg/L) and mixing conditions [12], biomass became well mixed and sedimentation of MLSS in the bottom was reduced. Unbalanced distribution of MLSS was also reported by Pai [19], who simulated biomass using ASM. 2 d biomass concentration was increased slightly in two aerobic tanks, and a similar result was reported by You [20] in which MLSS concentration in anaerobic/anoxic/aerobic tanks was gradually increased.
Effect of MLSS and SRT on Pollutant Removal
The scatter plot was helpful for obtaining optimum MLSS and SRT. In Fig. 3a), when MLSS increased from 1,000 to 2,000 mg/L, COD and NH3 removal linearly increased while SS and TP removal gradually increased with great fluctuation. It was obvious that high TP removal of 60~80% with maximum removal of COD, NH3, and SS of 80%, 99%, and 82% were observed with MLSS of 2,000 mg/L. When MLSS increased from 2,000 mg/L to 4,000 mg/L, though COD, NH3, and SS removal did not increase further, it was more stable than those with lower MLSS. TP removal dropped. TN removal was hardly affected by MLSS. Although high MLSS led to absolutely low BOD loading of 0.015 kg BOD5/kg MLSS.d; endogenous denitrification favored by starvation [21] was not observed in this study. The results of pollutant removal indicated optimum MLSS was 2,000 mg/L.
In Fig. 3b), SRT of period 1 was considered the same as the operating days. COD and NH3-N removal
Fig. 2. a) MLSS and Yobs b) average MLSS of three-staged oxic tanks.

1479Integrated Effect of MLSS and SRT...
was stable at SRT less than 120 d, while dropping 10% and 7% at complete SRT. In terms of SS removal, SRT of 90 d was optimal since the lower SRT of 30 d and complete SRT both contributed to fluctuation of SS removal. SS removal at SRT of 30 d varied from 60% to 80%, and the fluctuation was aggravated at complete SRT. TP removal at SRT of 90 d was equal to those at complete SRT. This result confirmed that TP in periods 1 and 3 was removed by assimilation as previously calculated. Since TN removal did not respond to SRT, optimum SRT should be kept lower than 30 d.
Correlation between MLSS, SRT, Influent, and Effluent
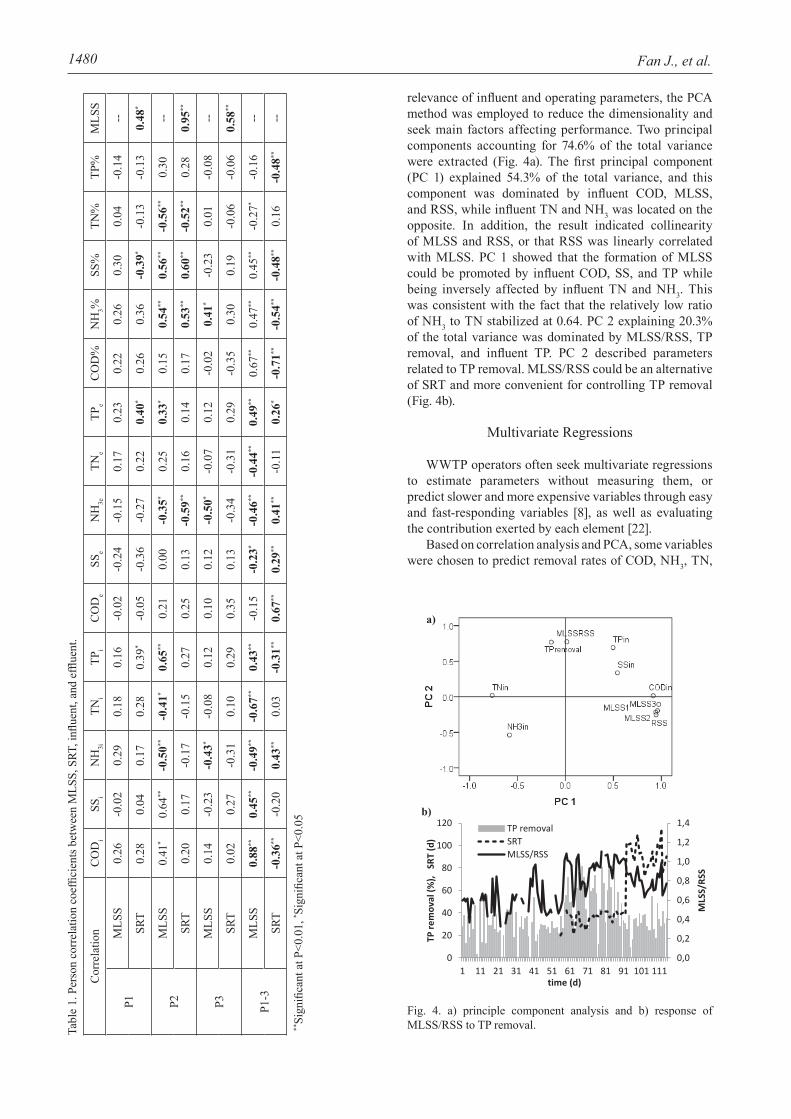
Potential correlation between operating parameters and water quality proved to be important for early identification of system failures. A strong relationship was identified when the Pearson coefficient was closer to the absolute value of 1. Pearson correlation analysis (Table 1) was conducted among influent, effluent, and operating parameters (MLSS, SRT) to identify bivariate relationships.
MLSS of period 2 was correlated with each influent parameter and the removal rates of NH3, SS, and TN, but in periods 1 and 3 the correlation disappeared, thus a change of this correlation could be used to detect the
change of longer SRT. Moreover, in period 2, MLSS was positively correlated with influent TP, SS, and COD, while it was inversely correlated with influent NH3-N. This correlation indicated that bacterial growth was affected by a shortage of influent TP (0.5-1.5 mg/L), and higher MLSS was favorable for adapting shock loading of influent SS and COD, and nitrifying bacteria growth favored by influent NH3 hampered an increase of MLSS. On the other hand, closer correlation between MLSS and SRT (r = 0.95) was observed in period 2. Decreasing r with increasing SRT (r = 0.58 in period 3, r = 0.48 in period 1) indicated a separation of MLSS and SRT (in periods 1 and 3). Based on good correlation between MLSS and SRT, MLSS could be a proxy of SRT, and thus SRT-assisted MLSS control was suggested.
The correlation between SS removal and SRT revealed that the fluctuation of SS removal in period 1 was correlated with complete SRT rather than MLSS. With whole analysis of the data of periods 1-3, it can be seen that MLSS had positive effect on COD, NH3, and SS removal, while SRT exerted a negative effect on COD, NH3, SS, and TP removal.
Main Factors Affecting Performance
Influent variables and operating parameters were factors of process performance. Due to the complexity and
Fig. 3. a) effect of MLSS on removal of pollutants and b) effect of SRT on removal of COD, SS, NH3, TN, and TP.
1480 Fan J., et al.
relevance of influent and operating parameters, the PCA method was employed to reduce the dimensionality and seek main factors affecting performance. Two principal components accounting for 74.6% of the total variance were extracted (Fig. 4a). The first principal component (PC 1) explained 54.3% of the total variance, and this component was dominated by influent COD, MLSS, and RSS, while influent TN and NH3 was located on the opposite. In addition, the result indicated collinearity of MLSS and RSS, or that RSS was linearly correlated with MLSS. PC 1 showed that the formation of MLSS could be promoted by influent COD, SS, and TP while being inversely affected by influent TN and NH3. This was consistent with the fact that the relatively low ratio of NH3 to TN stabilized at 0.64. PC 2 explaining 20.3% of the total variance was dominated by MLSS/RSS, TP removal, and influent TP. PC 2 described parameters related to TP removal. MLSS/RSS could be an alternative of SRT and more convenient for controlling TP removal (Fig. 4b).
Multivariate Regressions
WWTP operators often seek multivariate regressions to estimate parameters without measuring them, or predict slower and more expensive variables through easy and fast-responding variables [8], as well as evaluating the contribution exerted by each element [22].
Based on correlation analysis and PCA, some variables were chosen to predict removal rates of COD, NH3, TN,
Cor
rela
tion
CO
Di
SSi
NH
3iTN
iTP
iC
OD
eSS
eN
H3e
TNe
TPe
CO
D%
NH
3%SS
%TN
%TP
%M
LSS
P1M
LSS
0.26
-0.0
20.
290.
180.
16-0
.02
-0.2
4-0
.15
0.17
0.23
0.22
0.26
0.30
0.04
-0.1
4--
SRT
0.28
0.04
0.17
0.28
0.39
*-0
.05
-0.3
6-0
.27
0.22
0.40
*0.
260.
36-0
.39*
-0.1
3-0
.13
0.48
*
P2M
LSS
0.41
*0.
64**
-0.5
0**-0
.41*
0.65
**0.
210.
00-0
.35*
0.25
0.33
*0.
150.
54**
0.56
**-0
.56**
0.30
--
SRT
0.20
0.17
-0.1
7-0
.15
0.27
0.25
0.13
-0.5
9**0.
160.
140.
170.
53**
0.60
**-0
.52**
0.28
0.95
**
P3M
LSS
0.14
-0.2
3-0
.43*
-0.0
80.
120.
100.
12-0
.50*
-0.0
70.
12-0
.02
0.41
*-0
.23
0.01
-0.0
8--
SRT
0.02
0.27
-0.3
10.
100.
290.
350.
13-0
.34
-0.3
10.
29-0
.35
0.30
0.19
-0.0
6-0
.06
0.58
**
P1-3
MLS
S0.
88**
0.45
**-0
.49**
-0.6
7**0.
43**
-0.1
5-0
.23*
-0.4
6**-0
.44**
0.49
**0.
67**
0.47
**0.
45**
-0.2
7*-0
.16
--
SRT
-0.3
6**-0
.20
0.43
**0.
03-0
.31**
0.67
**0.
29**
0.41
**-0
.11
0.26
*-0
.71**
-0.5
4**-0
.48**
0.16
-0.4
8**--
**Si
gnifi
cant
at P
<0.0
1, * S
igni
fican
t at P
<0.0
5
Tabl
e 1.
Per
son
corr
elat
ion
coef
ficie
nts b
etw
een
MLS
S, S
RT, i
nflue
nt, a
nd e
fflue
nt.
Fig. 4. a) principle component analysis and b) response of MLSS/RSS to TP removal.

1481Integrated Effect of MLSS and SRT...
TP, and SS. The multivariate linear regression model in this study attempted to forecast removal rate and evaluate the important degree of MLSS and SRT on performance. Given the complexity of full-scale WWTP, prediction accuracy of multiple regressions with R2 greater than 0.7 was acceptable [23], and then removal rates of COD, NH3, TP, and RSS were identified to be well predicted as Eqs. 2-6 (each parameter included in the model was significant, p<0.05). The regressions suggested that COD removal could be improved by increasing MLSS and decreasing SRT, with MLSS being more efficient than SRT because the standardized regression coeffi-cient of MLSS and SRT was 0.55 and -0.23. TP removal could be enhanced with the increasing MLSS/RSS. Also, the regression-verified MLSS/RSS could be an indicator for TP removal as PCA showed. The inclusion of MLSS and SRT did not result in greater R2 for NH3 removal, so it was deleted from the regression, demonstrating that MLSS and SRT had little impact on NH3 removal.
(2)
(3)
(4)
(5)
(6)
Conclusions
Complete SRT resulted in obvious fluctuation of COD and SS removal and declining NH3-N removal. The reason for fluctuation of SS removal was disabled inert SS removal associated with complete SRT rather than MLSS. Increasing MLSS until 2,000 mg/L could improve COD, SS, and NH3 removal, while further increasing MLSS could not improve removal efficiency but enhance removal stability. Maximum TP removal of 80% with fluctuations also can be obtained at MLSS of 2,000 mg/L. COD removal was more sensitive to MLSS than SRT, and SRT of lower than 30 d was required for PAOs, and SRT longer than 90 d was equal to complete SRT regarding TP removal. As for COD, SS, and NH3 removal, SRT lower or higher than 90 d both led to fluctuations. The formation of MLSS was positively correlated with influent of COD, SS, and TP, and negatively affected by influent of TN and NH3. Correlation between MLSS
and influent could be used to diagnose the change of longer SRT. The separation of MLSS and SRT could be recognized through Person correlation coefficient. MLSS/RSS could be an alternative of SRT to control TP removal. SRT-assisted MLSS control was suggested and could be realized by parameters of MLSS/RSS and MLSS.
References
1. DURAN C., FAYOLLE Y., PECHAUD Y., COCKX A., GILLOT S. Impact of suspended solids on the activated sludge non-netonian behavior and on oxygen transfer in a bubble column. Chemical Engineering Science, 141, 154, 2016.
2. ZHANG X.Y., LIU F.Y., ZHENG S.K. Energy saving and higher volumetric loading rate achieved in the conventional anoxic-oxic process for sewage treatment by enhancing biomass retention in the secondary clarifier. Bioresource Technology, 233, 322, 2017.
3. XIE W.M., NI B.J., SHENG G.P., SEVIOUR T., YU H.Q. Quantification and kinetic characterization of soluble microbial products from municipal wastewater treatment plants. Water Research, 88, 703, 2016.
4. MILLER M.W., ELLIOTT M., DEARMOND J., KINYUA M., WETT B., MURTHY S., BOTT C.B. Controlling the COD removal of an A-stage pilot study with instrumentation and automatic process control. Water Science and Technology, 75, 2669, 2017.
5. AMANATIDOU E., SAMIOTIS G., TRIKOILIDOU E., TSIKRITZIS L. Particulate organics degradation and sludge minimization in aerobic, complete SRT bioreactors. Water Research, 94, 288, 2016.
6. AMANATIDOU E., SAMIOTIS G., TRIKOILIDOU E., PEKRIDIS G., TAOUSANIDIS N. Evaluating sedimentation problems in activated sludge treatment plants operating at complete sludge retention time. Water Research, 69, 20, 2016.
7. LI H.Y., YANG M., ZHANG Y., YU T., KAMAGATA Y. Nitrification performance and microbial community dynamics in a submerged membrane bioreactor with complete sludge retention. Journal of Biotechnology, 123 (1), 60, 2006.
8. AVELLA A.C., GORNER T., YVON J., CHAPPE P., GUINOT-THOMAS P., DEDONATO P. A combined approach for a better understanding of wastewater treatment plant operation: statistical analysis of monitoring database and sludge physic-chemical characterization. Water Research, 45, 981, 2011.
9. JO S.J., KWON H., JEONG S.Y.,LEE C.H., KIM T.G. Comparison of microbial communities of activated sludge and membrane biofilm in 10 full-scale membrane bioreactors. Water Research, 101, 214, 2016.
10. PASQUINI L., MUNOZ J.F., PONS M.N., YVON J., DAUCHY X., FRANCE X., LE N.D., FRANCE-LANORD C., GORNER T. Occurrence of eight household micropollutants in urban wastewater and their fate in a wastewater treatment plant. Statistical evaluation. Science of the Total Environment, 481, 459, 2014.
11. AGUADO D., ROSEN C. Multivariate statistical monitoring of continuous wastewater treatment plant. Engineering applications of artificial intelligence, 21, 1080, 2008.

1482 Fan J., et al.
12. FAN J., TAO T., ZHANG J., YOU G.L. Performance evaluation of a modified anaerobic/anoxic/oxic (A2/O) process treating low strength wastewater. Desalination, 249 (2), 822, 2009.
13. APHA; AWWA. Standard methods for the examination of water and wastewater, 20th ed. Washington D.C., USA: American Public Health Association, 2005.
14. LIANG F.L., SAUCEAU M., DUSSERRE G., ARLABOSSE P. A uniaxial cyclic compression method for characterizing the rheological and textural behaviors of mechanically dewatered sewage sludge. Water Research, 113, 171, 2017.
15. HENZE M., VAN LOOSDRECHT M.C.M., EKAMA G.A. Biological Wastewater Treatment: Principles, Modeling, and Design. IWA Publishing, United Kingdom, 2008.
16. VARGAS M., YUAN Z., PIJUAN M. Effect of long-term starvation conditions on polyphosphate- and glycogen-accumulating organisms. Bioresource Technology, 127, 126, 2013.
17. LI D., LV Y.F., ZENG H.P., ZHANG J. Effect of sludge retention time on continuous-flow system with enhanced biological phosphorus removal granules at different COD loading. Bioresource Technology, 219, 14, 2016.
18. NA J.H., NAM D.H., KO B.G., LEE C.Y., KANG K.H. Reduced sludge production in a membrane bioreactor
by uncoupling metabolism and its effect on phosphorus accumulation in the biomass. Environmental Technology, DOI:10.1080/ 09593330.2017.1285964, 2017.
19. PAI T.Y., TSAI Y.P., CHOU Y.J., CHANG H.Y., LEU H.G., OUYANG C.F. Microbial kinetic analysis of three different types of EBNR process. Chemosphere, 55, 109, 2004.
20. YOU S.J., OUYANG C.F. Simultaneous wastewater nutri-ent removal by a novel hybrid bioprocess. Journal of Envi-ronmental Engineering, 131 (6), 883, 2005.
21. WANG Y.Y., ZHOU S., WANG H., YE L., QIN J., LIN X. Comparison of endogenous metabolism during long-term anaerobic starvation of nitrite/nitrate cultivated denitrifying phosphorus removal sludges. Water Research, 68, 374, 2015.
22. BELLA G.D., TORREGROSSA M. Foaming in membrane bioreactors: identification of the causes. Journal of Environmental Management, 128, 453, 2013.
23. WANG X.D., RATNAWEERA H., HOLM J.A., OLSBU V. Statistical monitoring and dynamic simulation of a wastewater treatment plant: A combined approach to achieve model predictive control. Journal of Environmental Management, 193, 1, 2017.