Embed Size (px)
Citation preview
Introduction
Dust storms are a common phenomenon worldwide – especially in arid and semi-arid regions. Dust storms are natural events that occur frequently in the Arabian Peninsula that have been reported on previously [1-2]. Most of the present interest in dust storms is related to their possible role in the earth system [3]. Directly through altering the earth radiation budget, absorbing
solar and thermal radiation and indirectly by acting as cloud condensation nuclei, they change the microphysical properties of clouds, thus affecting the hydrological cycle [4]. Desert dust particles may also attenuate ultraviolet (UV) and visible radiation [5], thus causing cooling at the earth’s surface [6]. The rates of the falling dust in the Arabian Gulf region were evaluated by [7], who found that the average amount of dust falling on Kuwait was 191 tons km-2 year-1.
The Kingdom of Saudi Arabia is one of the major sources of aerosols in the world, including natural and anthropogenic components. Dust storms could also have
Pol. J. Environ. Stud. Vol. 26, No. 4 (2017), 1599-1605
Original Research
Characterizations of Deposited Dust Fallout in Riyadh City, Saudi Arabia
Abdullah Modaihsh, Adel Ghoneim*, Fahad Al-Barakah, Mohamed Mahjoub, Mahmoud Nadeem
Department of Soil Sciences, College of Food and Agricultural Sciences, King Saud University, P.O. Box 2460, Riyadh 11451, Saudi Arabia
Received:8 December 2016Accepted: 18 January 2017
Abstract
Dust and sand storms are a persistent problem in the Kingdom of Saudi Arabia. We monitored dust fallout samples from 15 sampling sites on a monthly basis for the entire year of 2012 and analyzed them for the various chemical and physical characteristics. Results revealed that dust deposition rates across the city were high, with sites located near construction activities and those located in northeastern Riyadh being the worst. The annual average amount of dust fallout for all stations during this period was 454.1 tons km-2. Compared to other cities, the total annual dust deposition observed in Riyadh was among the highest in the world. The average monthly amounts of dust deposited at 15 sites across Riyadh were highly variable, ranging from 14.5 tons km-2 at Riyadh airport to 178.6 tons km-2 at the Al-Aqiq site. Dust deposition rates varied significantly in April to August and ranged from 74.6 to 54.9 tons km-2 month-1. The dry deposition during November to December 2012 was significantly lower, with an average of 30.1 tons km-2 month-1. Silt fraction was the dominant fraction in almost all of the dust fallout and it ranged from 49.5% in Al-Aqiq to 70% in Al-Olya. The sand fraction ranged from 48.4% at Al-Aqiq to 26.2% at Al-Olya. All of the dust samples had a high CaCO3 content, ranging from 16.9 to 48.5%. Appreciable amounts of heavy metals such as Pb, Ni, Co, Cu, Mn, Zn, and V were detected in the dust samples.
Keywords: dust deposition rates, heavy metals, Riyadh city, Saudi Arabia, grain size distribution
*e-mail: [email protected]
DOI: 10.15244/pjoes/68565
1600 Modaihsh A.S., et al.
a considerable impact on human society if highly populated regions are on the transport pathway. Dust transport can bring pollutants into residence areas [8]. Improving our understanding of dust fall properties and characterization is imperative – especially over mega- and highly populated cities where aerosols have major impacts on human health. Yet it still lacks for better characterization of its atmospheric aerosol properties with a significant shortage of in-situ observations. Dust sources, transport, and their impact on the global environment have received considerable attention in recent years. In the Arabian Peninsula, information on the spatial and temporal variations of dust properties were recently investigated in Kuwait city and in Al-Ahsa Osasis, Saudi Arabia [9-11]. The impact of dust events on local air quality and public health are now becoming of great concern in the Kingdom
of Saudi Arabia after the frequent and severe dust storms in recent years [12]. Despite the major efforts focused on measurements of falling dust, the spatial and temporal distribution of mineral dust remains uncertain. Therefore, the current research is aimed at investigating the temporal and spatial variation of the dust fall deposition rates, and to systematically characterize chemical and physical properties of falling dust in Riyadh city.
Material and Methods
Study Area and Climate
Riyadh, the capital of the Kingdom of Saudi Arabia, is located in the central region (24°30'N, 46°34'E) with an
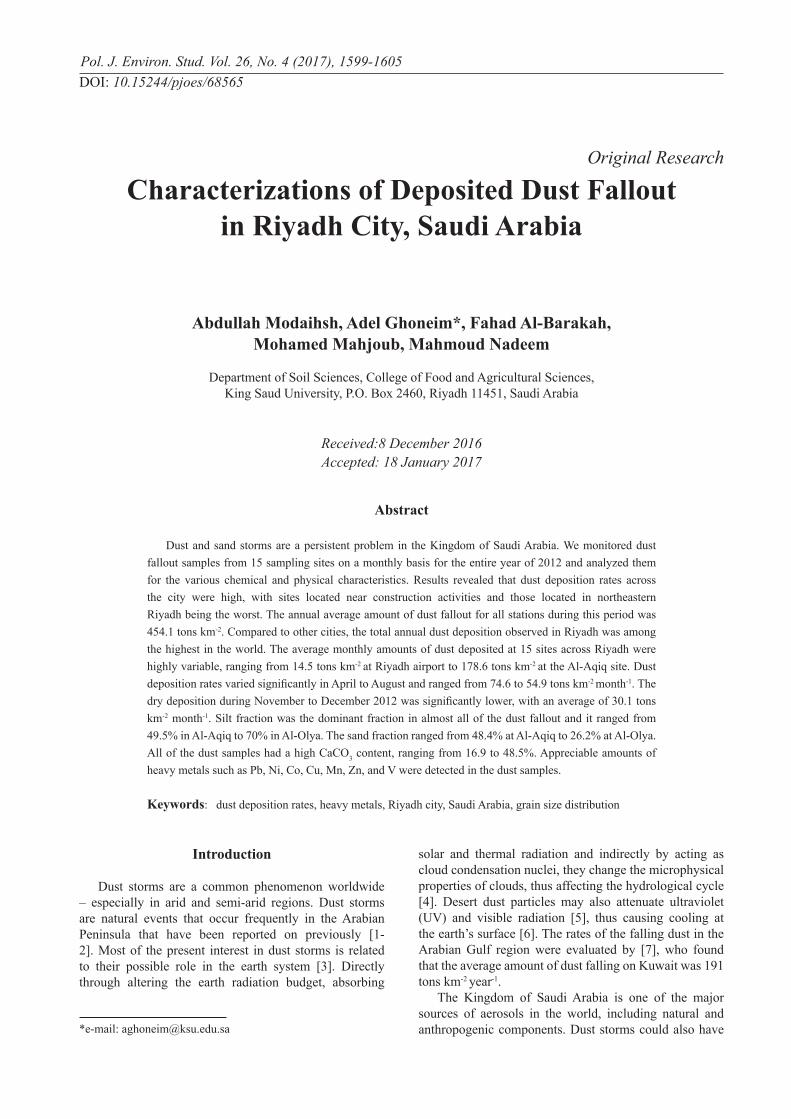
Fig. 1. Map of Saudi Arabia with study locations
1601Characterizations of Deposited Dust...
average elevation of 600 m above the sea. It is located on Wadi Hanifa in the central part of the country and east of Tuwayq Mountain, a limestone outcrop dipping eastward that creates a spectacular west-facing escarpment. Riyadh city made its constructional renaissance to turn from a small town surrounded with fences to a modern city with an area of 1,800 km2. Riyadh and its continental climate is hot and dry in the long summer months and moderate during the day and cold at night in the short winter season. According to the Holdridge life zones system of bioclimatic classification, Riyadh is close to the subtropical desert biome. The annual average temperature is around 25.7ºC, but they frequently exceed 45ºC in the summer (June to August). Total annual precipitation averages 101.3 mm, unusually dust falling during the winter and spring months (January to April).
Falling Dust Samples
Dust fallout samples were collected from 15 different locations across Riyadh (Fig. 1), with detailed coordinates in Table 1. Dust samples were collected on a monthly basis for the entire year of 2012. Dust samples were collected using a marble dust collector (MDCO). The MDCO is based on an original concept by [13], who used glass marbles to collect settling dust. The collector consists of a rectangular plastic tray 52.5 cm long, 31.5 cm wide, and 10.0 cm high with a marble filter at the top. The filter is made of two layers of marbles 1.50 cm in diameter, which are stored in a sieve container on top of the plastic tray (diameter of the sieve opening: 0.50 cm). The great advantage of the marble filter is that, due to the extremely low micro roughness of the marbles, there is no out splash of dust from the collector (for higher velocity winds the marbles protect the settled particles from suspension). The amount of dust collected by the dust sampler was determined by weighing the dust residue after evaporating the moisture in an oven.
Methodology
For total element analysis, 1.0 g of collected dust sample was wet-digested by mixtures of concentrated HNO3, HCl, and HF acids following the method described by [14]. The mixture was left overnight and then heated on a hot plate at 100ºC. The residue was then dissolved
into 20 ml deionized water. After that, the solution was filtered and transferred into a 25 ml volumetric flask. Total Cd, Ni, Pb, Cu, Zn, Fe, Cr, Mn, and V were determined using induction-coupled plasma mass spectrometry (ICP_MS, PerkinElmer, USA). The dust samples were analyzed for particle size distribution using a Mastersizer 2000 (Malvern Instruments UK), and CaCO3 content was assayed using a Collin’s Calcimeter. Dust EC were determined in 1:5 (soil:water) extract using an EC meter as described by [14]. Dust pH was measured in 1:2.5 (soil: water) suspension using a pH meter according to a method by [14].
Results and Discussion
Dust Deposition in Selected Local, Regional, and Global Cities
The annual amount of dust deposited at 15 sites in Riyadh in tons km-2 during 2012 is given in Table 2. The total annual deposition varied from 176.2 to 1,386.5 tons km-2. The average annual amount of dust fallout for all stations during this period was 454.1 tons km-2. We noticed that the Al-Azizyah site has the maximum deposition rate throughout the year. The exceptional abundance of the dust deposition may be attributed to the acquisition of fine-grained particles originating from anthropogenic activities in this site, which was signified by a cement kiln, refinery marble, and stones [15]. Table 3 shows average annual fallout (tons km-2) in regional and global regions. In general, the average dust fallout in the current study is significantly higher in comparison to surrounding regional and worldwide areas [16-23]. Compared to other cities, the total annual dust depo- sition observed in Riyadh is almost the highest globally. For example, the annual deposition rates in Kuwait, Libya, and Iraq (Baghdad) were 39.1, 155, and 220 tons km-2 year-1, respectively. However, much lower values of dust deposition rates were recorded in Nevada and California, USA. The discrepancies of dust fall rates among these areas showed variation in their industrial activities, traffic composition, and different geographic location. Recently, [24] showed that the annual average rate of dust deposition for Kuwait city reached 0.59 kg m-2 year-1 with minimum and maximum
Location North East Location North East Location North East
Ghirnatah 24 47 47.0 46 45 11.0 Al-Azizah 24 36 33.1 46 46 48.5 Al-Aqiq 24 47 34.7 46 37 41.0
Al-Naseem 24 44 30.5 46 48 53.8 New Industrial 24 38 41.3 46 44 11.5 K.S
University 24 43 27.1 46 37 05.8
Al-Nadhim 24 48 38.8 46 54 00.4 Al-Batha 24 38 08.0 46 43 13.0 Al-Badiah 24 37 11.0 46 41 31.55
Al-Sullay 24 39 58.5 46 47 24.7 Al-Murslat 24 45 10.7 46 40 38.1 Al-Olya 24 40 21.0 46 41 32.5
Old Industrial 24 33 08.2 46 53 19.0 Riyadh
Airport 24 55 29.9 46 43 18.0 Al-Waha 24 44 43.3 46 43 20.6
Table 1. The co-ordinates of the study locations.
1602 Modaihsh A.S., et al.
deposition rates of 0.34 and 0.94 kg m-2 year-1, respecti-vely. They pointed out that this value ranked first among 57 dust deposition rates observed throughout the world, with values ranging from 0.00005 (for remote areas) to 0.45 (for desert) kg m-2 year-1 [25-26]. Based on this study, Riyadh, with an average deposition rate of 454.1 tons km-2 year-1, would rank first worldwide. Saudi Arabia
has many dust sources, some of which are geographically large. Dust activity is visible over most of the Arabian Peninsula throughout the year but is especially strong from March to July and low in winter. Riyadh is surrounded by the Ad-Dhna Desert, whose corridor of sandy terrain forms a bow-like shape that connects the An-Nafud Desert in the north to the Rub Al-Khali Desert in the south. Oriented northwest to southeast, it favours a continuous supply of dust south-east across the Arabian Peninsula [27]. Rub Al-Khali is the largest sand desert in the world and one of the most arid and hottest in Saudi Arabia.
Monthly Seasonal and Temporal Variations
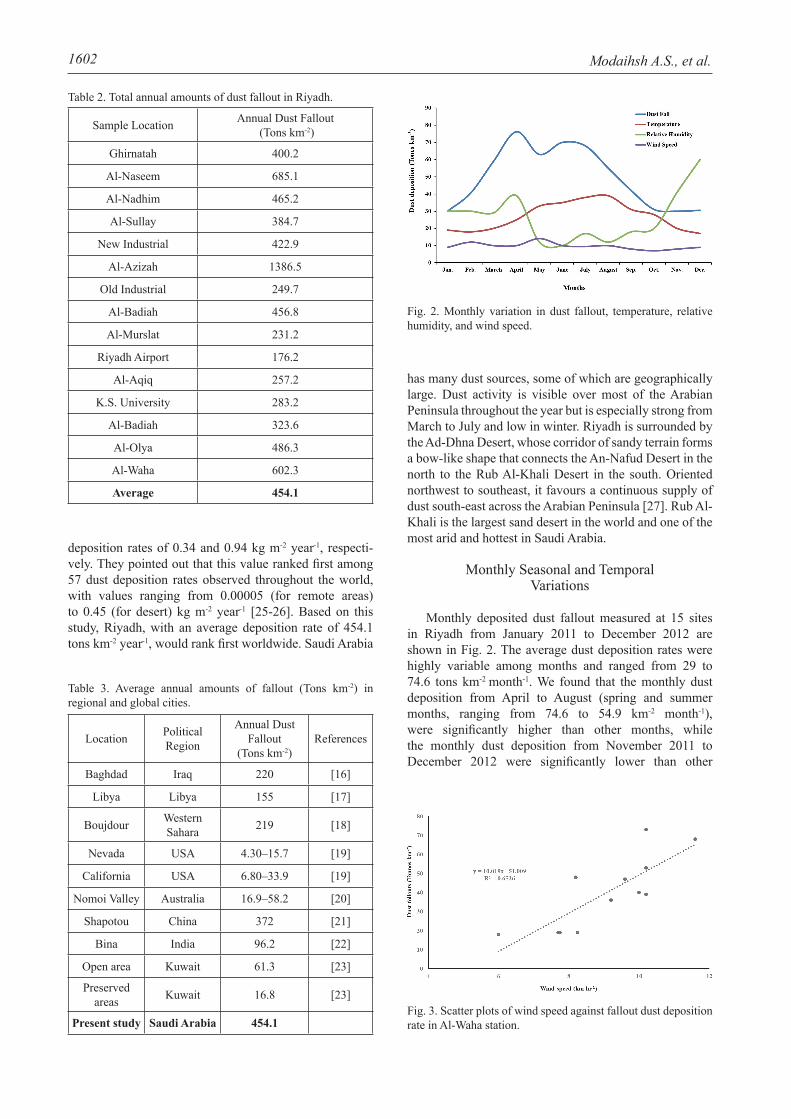
Monthly deposited dust fallout measured at 15 sites in Riyadh from January 2011 to December 2012 are shown in Fig. 2. The average dust deposition rates were highly variable among months and ranged from 29 to 74.6 tons km-2 month-1. We found that the monthly dust deposition from April to August (spring and summer months, ranging from 74.6 to 54.9 km-2 month-1), were significantly higher than other months, while the monthly dust deposition from November 2011 to December 2012 were significantly lower than other
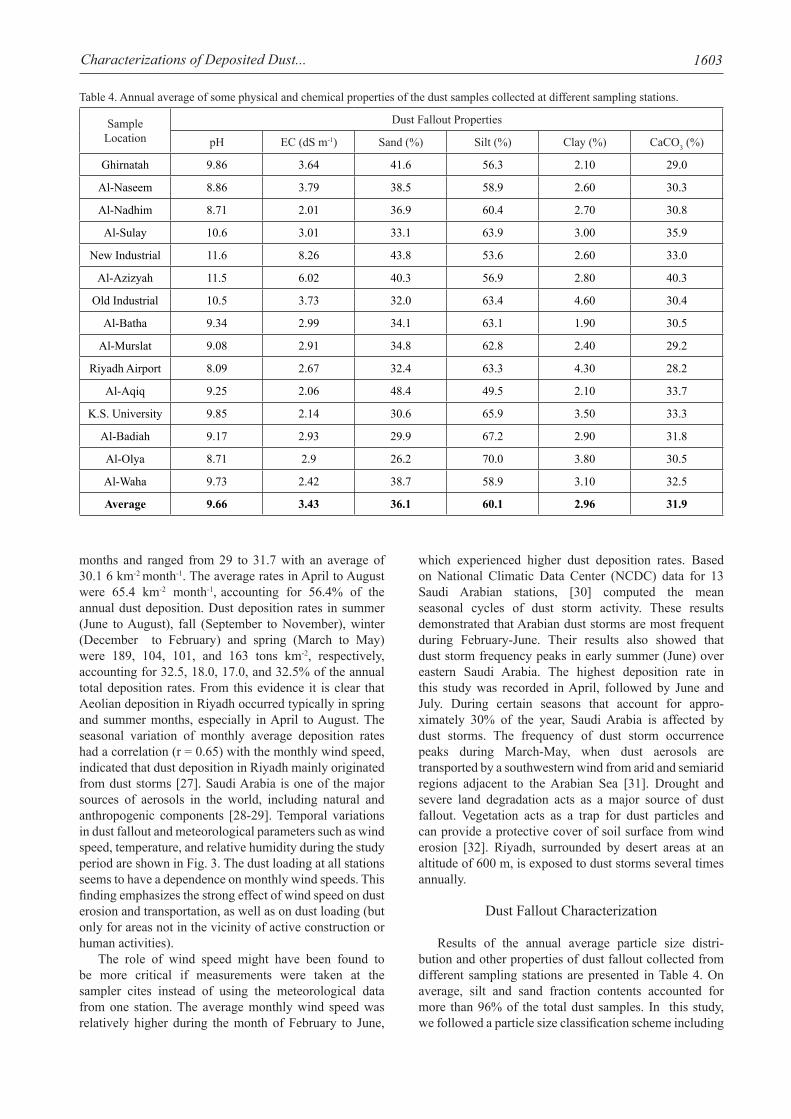
Fig. 3. Scatter plots of wind speed against fallout dust deposition rate in Al-Waha station.
Fig. 2. Monthly variation in dust fallout, temperature, relative humidity, and wind speed.
Sample Location Annual Dust Fallout (Tons km-2)
Ghirnatah 400.2
Al-Naseem 685.1
Al-Nadhim 465.2
Al-Sullay 384.7
New Industrial 422.9
Al-Azizah 1386.5
Old Industrial 249.7
Al-Badiah 456.8
Al-Murslat 231.2
Riyadh Airport 176.2
Al-Aqiq 257.2
K.S. University 283.2
Al-Badiah 323.6
Al-Olya 486.3
Al-Waha 602.3
Average 454.1
Table 2. Total annual amounts of dust fallout in Riyadh.
Location Political Region
Annual Dust Fallout
(Tons km-2)References
Baghdad Iraq 220 [16]
Libya Libya 155 [17]
Boujdour Western Sahara 219 [18]
Nevada USA 4.30–15.7 [19]
California USA 6.80–33.9 [19]
Nomoi Valley Australia 16.9–58.2 [20]
Shapotou China 372 [21]
Bina India 96.2 [22]
Open area Kuwait 61.3 [23]
Preserved areas Kuwait 16.8 [23]
Present study Saudi Arabia 454.1
Table 3. Average annual amounts of fallout (Tons km-2) in regional and global cities.
1603Characterizations of Deposited Dust...
months and ranged from 29 to 31.7 with an average of 30.1 6 km-2 month-1. The average rates in April to August were 65.4 km-2 month-1, accounting for 56.4% of the annual dust deposition. Dust deposition rates in summer (June to August), fall (September to November), winter (December to February) and spring (March to May) were 189, 104, 101, and 163 tons km-2, respectively, accounting for 32.5, 18.0, 17.0, and 32.5% of the annual total deposition rates. From this evidence it is clear that Aeolian deposition in Riyadh occurred typically in spring and summer months, especially in April to August. The seasonal variation of monthly average deposition rates had a correlation (r = 0.65) with the monthly wind speed, indicated that dust deposition in Riyadh mainly originated from dust storms [27]. Saudi Arabia is one of the major sources of aerosols in the world, including natural and anthropogenic components [28-29]. Temporal variations in dust fallout and meteorological parameters such as wind speed, temperature, and relative humidity during the study period are shown in Fig. 3. The dust loading at all stations seems to have a dependence on monthly wind speeds. This finding emphasizes the strong effect of wind speed on dust erosion and transportation, as well as on dust loading (but only for areas not in the vicinity of active construction or human activities).
The role of wind speed might have been found to be more critical if measurements were taken at the sampler cites instead of using the meteorological data from one station. The average monthly wind speed was relatively higher during the month of February to June,
which experienced higher dust deposition rates. Based on National Climatic Data Center (NCDC) data for 13 Saudi Arabian stations, [30] computed the mean seasonal cycles of dust storm activity. These results demonstrated that Arabian dust storms are most frequent during February-June. Their results also showed that dust storm frequency peaks in early summer (June) over eastern Saudi Arabia. The highest deposition rate in this study was recorded in April, followed by June and July. During certain seasons that account for appro-ximately 30% of the year, Saudi Arabia is affected by dust storms. The frequency of dust storm occurrence peaks during March-May, when dust aerosols are transported by a southwestern wind from arid and semiarid regions adjacent to the Arabian Sea [31]. Drought and severe land degradation acts as a major source of dust fallout. Vegetation acts as a trap for dust particles and can provide a protective cover of soil surface from wind erosion [32]. Riyadh, surrounded by desert areas at an altitude of 600 m, is exposed to dust storms several times annually.
Dust Fallout Characterization
Results of the annual average particle size distri- bution and other properties of dust fallout collected from different sampling stations are presented in Table 4. On average, silt and sand fraction contents accounted for more than 96% of the total dust samples. In this study, we followed a particle size classification scheme including
Sample Location
Dust Fallout Properties
pH EC (dS m-1) Sand (%) Silt (%) Clay (%) CaCO3 (%)
Ghirnatah 9.86 3.64 41.6 56.3 2.10 29.0
Al-Naseem 8.86 3.79 38.5 58.9 2.60 30.3
Al-Nadhim 8.71 2.01 36.9 60.4 2.70 30.8
Al-Sulay 10.6 3.01 33.1 63.9 3.00 35.9
New Industrial 11.6 8.26 43.8 53.6 2.60 33.0
Al-Azizyah 11.5 6.02 40.3 56.9 2.80 40.3
Old Industrial 10.5 3.73 32.0 63.4 4.60 30.4
Al-Batha 9.34 2.99 34.1 63.1 1.90 30.5
Al-Murslat 9.08 2.91 34.8 62.8 2.40 29.2
Riyadh Airport 8.09 2.67 32.4 63.3 4.30 28.2
Al-Aqiq 9.25 2.06 48.4 49.5 2.10 33.7
K.S. University 9.85 2.14 30.6 65.9 3.50 33.3
Al-Badiah 9.17 2.93 29.9 67.2 2.90 31.8
Al-Olya 8.71 2.9 26.2 70.0 3.80 30.5
Al-Waha 9.73 2.42 38.7 58.9 3.10 32.5
Average 9.66 3.43 36.1 60.1 2.96 31.9
Table 4. Annual average of some physical and chemical properties of the dust samples collected at different sampling stations.
1604 Modaihsh A.S., et al.
clay <2 µm, fine silt 2-20 µm, coarse silt 20-50 µm, fine sand 50-125 µm, and medium sand 125-256 µm. From the particle size distribution curves we found that most of the particle clusters were 20-100 µm. The results indicated that the silt fraction was the dominant fraction in almost all of the dust samples and ranged from 49.5 in the Al-Aqiq site to 70 in Al-Olya (Table 4). The sand average ranged from 26.2% at Al-Olya to 48.4 at Al-Aqiq. The main bulk of the dust fallout was distributed within a size fraction ranging from 0.20 to 0.02 mm (coarse silt, fine silt, and fine sand). This indicated that the coarse silt and the fine sand were the dominant components of the dust fallout. According to [33] classification, the dust grain size analysis indicated unimodal grain distribution with two dominant size fractions (sand and silt). The grain size distribution curves shift to larger particle size ranges, thus supporting the idea that the coarse fraction dust materials in Riyadh originated from local surface soils due to traffic. The sand particles move in the form of saltation or short-term suspension [34]. On the other hand, the finer grain dust size is mostly obtained from regional sources.
Results indicate that all of the dust samples collected at different sampling locations had a high CaCO3 content ranging from 16.9 to 48.5%, with an average of 31.9% (Table 4). The high content of CaCO3 was suggested to have originated from soils rich in limestone and dolomite, which are abundant in Saudi Arabia (Arabian shelf), as the
rainfall is not enough to leach out the CaCO3 [35-36]. Analysis of dust fallout reveled that most samples were
alkaline in reaction, with pH values ranging from 8.09 to 11.6 with an average of 9.66 (Table 4). The higher pH range could be attributed to high Na and CaCO3 content in the dust fallout samples. The EC value in the dust samples ranged from 2.01 to 8.26 with an average of 3.43 dS m-1 (Table 4). This high value of salts is attributed to the saline soils from which the dust originated from coastal Sabkha in northern and eastern parts of Saudi Arabia, where the soils are saline and have a salt crust on the surface [37].
Heavy Metals Concentration
Table 5 lists the total concentrations of the heavy metals in the dust fallout. Appreciable amounts of heavy metals such as Cr, Mn, Ni, V, Zn, and Pb were detected in all dust samples. The average content of Mn in dust samples collected ranged from 150 to 509 mg kg-1
(average±Stdev) with the Al-Sulay site having the higher content where Ghirnatah showed the lowest. The overall average concentration of Mn was 269 mg kg-1, which was the second highest among all the observed heavy metals (Table 5). Zn showed its presence in all samples with a range of 67.2 to 754 mg kg-1 (average±Stdev) – the highest value recorded at a new industrial site, while the Ghirnata site showed the lowest. Toxic metal Pb ranged from 22.7 to
Sample LocationHeavy Metal Type (average±Stdev)
Cd Co Cr Cu Mn Ni Pb V Zn
Ghirnatah 1.38 7.23 44.3 26.9 150 20.2 27.9 44.7 67.2
Al-Naseem 0.89 9.42 52.9 35.8 220 33.5 28.5 50.2 133
Al-Nazeer 1.25 7.46 53.1 27.8 211 29.6 28.7 46.1 120
Al-Sulay 1.20 9.68 106 96.0 509 69.8 37.6 103 259
New Industrial 1.21 8.69 52.5 61.3 233 32.3 77.1 42.1 754
Al-Azizah 1.29 8.94 46.3 39.9 226 26.2 38.5 42.4 106
Old Industrial 1.19 9.79 68.5 35.4 281 34.5 27.1 53.4 111
Al-Batha 0.79 11.8 62.9 41.0 265 36.6 27.3 55.1 126
Al-Murslat 1.36 11.7 63.8 163 236 40.8 29.7 51.8 144
Riyadh Airport 0.88 11.7 57.8 32.1 226 33.9 40.7 49.6 79.9
Al-Aqiq 0.99 10.1 57.3 29.2 252 32.4 23.6 51.5 75.7
K.S. University 1.72 11.9 89.7 37.7 336 47.9 25.8 64.2 84.2
Al-Badiah 1.36 11.4 77.1 51.2 273 43.3 26.2 55.4 157
Al-Olya 0.89 14.4 95.8 49.5 349 49.9 35.6 65.2 136
Al-Waha 1.28 11.3 70.3 38.3 270 39.9 22.7 53.4 87.6
Max. 1.72 14.4 106 163 509 69.8 77.1 103 754
Min. 0.79 7.23 44.3 26.9 150 20.2 22.7 42.1 67.2
Mean 1.18 10.4 66.6 51.0 269 38.0 33.2 55.3 163
Table 5. Annual average of some heavy metals content (mg kg-1) in the dust fallout samples.
1605Characterizations of Deposited Dust...
77.1 mg kg-1 (average±Stdev) in all the dust samples. The highest contents of Pb were recorded at a new industrial site, while the minimum was found at the Al-Waha site. The Ni concentration was found to be between 20.2 and 69.8 mg kg-1 (average±Stdev) in all dust samples.
The average heavy metals contents in the dust fallout in the present study were compared with other cities around the world (Table 6). Differences in concentration of the heavy metals may be attributed to the sampling location and contribution from anthropogenic sources. In the current study, the concentrations of Pb, Cu, Zn, and Mn in the collected dust fallout were lower than those reported in Nanjing, Hong Kong, Ottawa, Oslo, and Kuwait cities [38-42]. However, the concentrations of Pb, Ni, Cu, and Zn in dust samples were higher than their soil background values reported in Saudi Arabia [43]. The distribution of the heavy metals in dust falling samples seems to be controlled mainly by the land uses and the volume of traffic emissions. Riyadh is a large city and has dense traffic, and the elevated levels of the heavy metals could arise from automobile emissions. With such high deposition rates of dust that contain elevated levels of toxic elements, actions should be taken to reduce emissions and more studies are needed to assess the potential impacts of falling dust on human health in Riyadh.
Conclusion
In this study, the rate of dust fall and its chemical and physical composition were thoroughly investigated during the entire year of 2012 in Riyadh, Saudi Arabia. The results provide a valuable and complementary baseline data on falling dust in the city. Dust fallout rates have been shown to be spatially and temporary variable with diverse sources ranging from local to distant. With high deposition rates of dust particles that contain elevated levels of toxic heavy metals, actions should be taken to reduce emissions, and more studies are needed to assess the role of local and regional sources on long-term trace element enrichment of soils and its environmental impacts. Vehicle emission controls extending the green belt around the city and
leaving a protective plant cover on the soil surface of Riyadh by restricting grazing could be vital management practices for reducing the input of trace elements from anthropogenic and natural sources.
Acknowledgements
The authors thank the College of Food and Agricultural Sciences, Research Center and Deanship of Scientific Research, King Saud University, Saudi Arabia, for financial support of this research. This study was also supported by the NSTIP strategic technology program, (No. 08 ENV319-02) under the title “Characteristics and composition of falling dust and particulate matter and its health hazards in Riyadh City, Saudi Arabia.”
References
1. AL-DOUSARI A.M. Recent studies on dust fallout within preserved and open areas in Kuwait. In: Bhat NR Al-Nasser A, Omar, S. (Eds) Desertification in arid lands. Institute for Scientific Research, Kuwait, 137, 2009.
2. AL-MUHANNA A. Dust fall Associated with dust storms in the Al Ahsa Oasis of Saudi Arabia. Open Journal of Air Pollution, 4, 65, 2015.
3. GOUDIE A.S., MIDDLETON N.J. Desert dust in the global system, Springer. 2006.
4. LOHMANN U., FEICHTE J. Global Indirect Aerosols Effects: A Review. Atmos. Chem. Phys. 5, 715, 2005.
5. BADARINATH K.V.S., KHAROL S.K., KASKAOUTIS D.G. KAMBEZIDIS H.D. Influence of atmospheric aerosols on solar spectral irradiance in an urban area, J. Atmos. Solar Terr. Phys. 69, 589, 2007.
6. DI SARRA A., CACCIANI M., CHAMARD P., CORNWALL C., DELUISI J. J., DI IORIO T., DISTERHOFT P., FIOCCO G., FUA` D., MONTELEONE F. Effects of desert dust and ozone on the ultraviolet irradiance the Mediterranean island of Lampedusa during PAUR II, J. Geophys, 2002.
7. FUNG I.Y., MEYN S.K., TEGEN I., DONEY S.C., JOHN J.G., BISHOP J.K.B. Iron supply and demand in the upper ocean. Global Biogeochemical Cycles, 14, 281, 2000.
Heavy Metal Nanjing (China)38
Hong Kong (China)39
Ottawa (Canada)40 Oslo (Norway)41 Kuwait City
(Kuwait)42 Current study
Pb 213 120 39.1 180 32.1 33.2
Ni 55.4 28.6 152 41.0 193 38.0
Co 15.9 9.50 8.40 19.0 24.0 10.4
Cu 141 110 65.8 123 97.0 51.0
Mn ND 594 431 833 341 269
Zn 576 384 112 412 213 163
V 116 36.6 34 ND 56.3 55.3
ND: not determined
Table 6. Comparison of heavy metals content in different urban dust fallout (mg kg-1).
1606 Modaihsh A.S., et al.
8. GAO H., WASHINGTON R. Transport trajectories of dust originating from the Tarim Basin, China. Int. J. Climatol. 30, 291, 2010.
9. HEINRICH J., SLAMA R. Fine particles, a major threat to children. International Journal of Hygiene and Environmental Health, 210 (5), 617, 2010.
10. FETOH B.E.S.A., AL-SHAMMERY K.A. Acaricidal Ovicial and Repellent Activities of Some Plant Extracts on the Date Palm Dust Mite, Oligonychus afrasiaticus Meg. (Acari: Tetranychidae). International Journal of Environmental Science and Engineering (IJESE), 2, 45, 2011.
11. SPRIGG W.A., NICKOVIC S., GALGIANI J.N. Regional dust storm modeling for health services: the case of valley fever. Aeolian Research. 14, 53, 2014.
12. MODAIHSH A.S., MAHJOUB M.S., MAHMOUD E.A. NADEEM GHONEIM A.M., AL-BARAKAH F. The air quality, characterization of polycyclic aromatic hydrocarbon, organic carbon, and diurnal variation of particulate matter over Riyadh City. Journal of Environmental Protection, 7, 1198, 2016.
13. GANYOR E. Atmospheric dust in Israel. Sedimentological and meteorological analysis of dust deposition. PhD thesis, Hebrew University of Jerusalem, Israel, 1975.
14. JACKSON M.L. Soil Chemical Analysis. pp. 178-182. Prentice-Hall of India Private Limited, New Delh, 1973.
15. MODAIHSH A.S., MAHJOUB M.O. Falling dust characteristics in Riyadh City, Saudi Arabia during winter months. APCBEE Procedia 5, 50, 2013.
16. AL-DABBAS M.A., ABBAS M.A, AL-KHAFAJI R.M. Dust storms loads analysis-Iraq. Arab J. Geosci. 5 (1), 121, 2010.
17. OHARA S., CLARKE L., ELATRASH S. Field measurements of desert dust deposition in Libya. Atmospheric Environment 40, 3881, 2006.
18. LEUNG A.O.W, DUZGOREN-AYDIN N.S., CHEUNG K.C., WONG M.H. Heavy metals concentrations of surface dust from waste recycling and its human health implications in southeast China. Environ. Sci. Technol. 42, 2674, 2008.
19. ROTT C. Saharan sand and dust characterization, deposition rates and implications. MSc. dissertation, Royal Holloway Uni., of London, 2001.
20. BADARINATH K.V.S., KHAROL, S.K., KASKAOUTIS, D.G. KAMBEZIDIS H.D. Influence of atmospheric aerosols on solar spectral irradiance in an urban area, J. Atmos. Solar Terr. Phys., 69, 589, 2007.
21. REHEIS M.S. A16-year record of Aeolian dust in Southern Nevada and California, USA: controls on dust generation and accumulation. J. of Arid Environment 67 (3), 487, 2006.
22. CATTLE S.R., MCTAINSH GH., WAGNER S. Aeolian dust contribution to soil of the Namoi Valley, Northern NSW, Australia. Catena 47, 245, 2002.
23. AL-AWADHI J., ARAFAT A. ALSHUAIBI Dust fallout in Kuwait city: Deposition and characterization. Science of the Total Environment, 139, 2013.
24. CAO Z., YANG Y., LU J., ZHANG C. Atmospheric particle characterization, distribution, and deposition in Xi’an, Shaanxi Province, Central China. Environ Pollution, 159, 577, 2011.
25. LAWRENCE C.R., NEFF, J.C. The contemporary physical and chemical flux of Aeolian dust: a synthesis of direct measurements of dust deposition. Chemical Geology, 267, 46, 2009.
26. TA W., XIAO H., QU J., XIAO Z., YANG G., WANG T., ZHANG X. Measurements of dust deposition in Gansu Province, China, 1986-2000. Geomorphology, 57, 41, 2004.
27. MAHMOUD E.K., GHONEIM A.M. Effect of polluted water on soil and plant contamination by heavy metals in El-Mahla El-Kobra, Egypt. Solid Earth 7 (2), 703, 2016.
28. ZHANG R., WANG M., SHENG L., KANAI Y., OHTA A. Seasonal characterization of dust days, mass concentration and dry deposition of atmospheric aerosols over Qindao, China. China Particuol. 2 (5), 196, 2004.
29. AL-AWADHI J. Dust fallout and characteristics in Kuwait: a case study. Kuwait J. Sci. Eng. 32, 135, 2005.
30. AL-DABBAS M., ABBAS M.A., AL-KHAFAJI R. The mineralogical and microorganisms effects of regional dust storms over Middle East region. Int. J. Water Res. Arid Environ. 12, 129, 2011.
31. MODAIHSH A.S., MAHJOUB O., SALLAM A., GHONEIM A.M. Evaluation of Soil Degradation In Al-Kharj Centre, Saudi Arabia Using Remote Sensing. International J. of Remote Sensing & Geoscience, 4, 1, 2015.
32. RUSHDI A.I., AL-MUTLAQ M., AL-OTAIBI A., EL-MUBARAK H., SIMONEIT B.R.T. Air quality and elemental enrichment factors of aerosol particulate matter in Riyadh City, Saudi Arabia. Arabian Journal of Geosciences, 6 (2), 585, 2013.
33. NOTARO M., ALKOLIBI F., FADDA E., AND BAKHRJY F. Trajectory analysis of Saudi Arabian dust storms, J. Geophys. Res. Atmos. 118, 6028, 2013.
34. AL-DOUSARI A.M., AL-WADHI J. Dust fallout in northern Kuwait, major sources and characteristics. Kuwait J. Sci. 39, 171, 2012.
35. AL-DOUSARI A.M., AL-ELAJ M., AL-ENEZI E., AL-SHAREEDA A. Origin and characteristics of yardangs in the Um Al-Rimam depressions (N Kuwait). Geomorphology, 104, 93, 2009.
36. CROUVI O., AMIT R., ENZEL Y., PORAT N., SANDLER A. Sand dunes as a major proximal dust source for late Pleistocene loess in the Negev Desert, Israel. Quaternary Res. 70, 275, 2008.
37. RASMUSSEN P.E. A multi-element profile of house-dust in relation to exterior dust and soils in the city of Ottawa, Canada. Science of the Total Environment, 267, 125, 2001.
38. AL-AWADHI J., ARAFAT A. AL-SHUAIBI Dust fallout in Kuwait city: Deposition and characterization. Science of the Total Environment, 139, 2013.
39. DI SARRA A., CACCIANI M., CHAMARD P., CORNWALL C., DELUISI J.J., DI IORIO T., DISTERHOFT P., FIOCCO G., FUA` D., MONTELEONE F. Effects of desert dust and ozone on the ultraviolet irradiance the Mediterranean island of Lampedusa during PAUR II, J. Geophys. 2002.
40. AL-HARBI M. Characteristics and composition of the falling dust in urban environment. Int. J. Environ. Sci. Technol. 12, 641, 2013.
41. LI X., HAN Z., CHEN Y., CAI Y., YANG D. The characteristic and source of a deposited incident in March 11th 2006 in Nanjing. Quat Sci. 29, 43, 2009.
42. YEUNG Z.L., KWOK R.C.W., YU K.N. Determination of multi-element profiles of street dust using energy dispersive X-ray fluorescence (EDXRF). Appl. Radiat. Isot. 58, 339, 2003.
43. MODAIHSH A.S., SALLAM A., GHONEIM A.M., MAHJOUB M.O. Assessing salt- affected degraded soils using remote sensing. Case study: Al-Qassim region, Saudi Arabia. Journal of Food, Agriculture& Environment 12 (3&4), 383, 2014.


![Design of Reinforced Concrete Structure - Volume 1 - DR[1]. Mashhour a. Ghoneim](https://img.pdfslide.us/doc/110x75/56d6bf171a28ab301694d703/design-of-reinforced-concrete-structure-volume-1-dr1-mashhour-a-ghoneim.jpg)