Embed Size (px)
Citation preview

Original Research Article 1
Monetarization of Ecosystem Services of 2
Oasean Biome (Case Study: Provisioning 3
Services of Middle Draa Valley Oases) 4
5
ABSTRACT 6
Numerous studies have evaluated the monetarization of the ecosystem services throughout 7 the world, but few have showed the oasean ecosystem services (Desert oasis). The purpose 8 of this research is to identify and quantify ecosystem services as a tool to provide useful 9 information for the management of arid lands. This study can serve as a reference to 10 measure future changes in the oasean ecosystem mainly under the impact of extreme 11 events. In this paper, we examine the economic value of the ecosystem services provided by 12 the oases of Middle Draa Valley (MDV), which is part of Biosphere Reserve of southern 13 Moroccan Oasis (UNESCO). The economic values are standardized to US$ per hectare per 14 year (2008-2010 period prices). The total value is found to be 15 64445Dhs/ha/year (7733,4 US$/ha/year) in the arable area (for 26 000ha) and 16 1117dh/ha/year (134,04$/ha/year) for the total area (1500 000ha). The study can be applied 17 to other oases of the pre-Saharan part of Morocco because of the similarity of lifestyle, 18 climate, and water requirements etc... 19 20 Keywords: Economic value, provisioning services, oasean ecosystem 21 22
1. INTRODUCTION 23
Ecosystem services are the material and nonmaterial benefits that humans derive from 24 nature [1]. Analysis of ecosystem services is an increasing feature of such undertakings and 25 has prompted a rapidly expanding literature regarding the implementation of such analyses 26 [2, 3, 4, 5, 6, 7, 8, 9, 10, 11]. Recently, the analysis of ecosystem services is oriented from a 27 qualitative analysis to quantitative analysis. In fact the economic analysis is used to clarify 28 the real contribution of the natural heritage in the community richness. Climate change 29 poses new and significant challenges, not only for the adaptation of economic systems, but 30 also within the scientific community of «ecological economy» [12], because it changes the 31 quantity and location of services provided by natural systems. Adaptation to climate change 32 involves the protection and management of natural resources, based on quantitative 33 analysis of ecosystem services. From here comes the idea to quantifying oasean 34 ecosystem. The purpose of this study is to quantify the provisioning services provided by the 35 oasean ecosystem in Middle Draa Valley (MDV) that have a positive impact on local human 36 well-being and food security. MDV is located in the Biosphere Reserve of southern 37 Moroccan Oasis (UNESCO) of the Moroccan pre-Sahara region, which is an indicator of 38 major climatic trends in the Mediterranean region, is currently, experiencing climatic 39 degradation and rapid desertification [13]. This situation threatens the oasean ecosystems 40 already fragile. The need for such study is both for the environmental vulnerability [14] and 41 for the importance of this ecosystem. Indeed, we can list seven major sites of interest: two 42 RAMSAR sites [15], one national parks [16], three Moroccan Observatories of Sahara and 43 Sahel (Issougui, Oued Mird and Fezouata Observatories) [17] and a solar complex of 44 Ouarzazate [18]. 45
UNDER PEER REVIEW

In fact, Middle Draa Valley is located between the Moroccan High Atlas Mountains (north) 46 and the Saharan desert in the south. As a result of its location, the region is characterized by 47 [19]: 48
• High temperatures, especially between June and September (43 to 50°C); 49 • Strong thermal amplitudes (20 °C in Tagounite near to Zagora city about 60km) 50 • Long hours of sunshine (between 3055 and 3078 hours/year) 51 • High rates of evapo-transpiration particularly during summer. 52
The oases of Draa get the water from the peaks of High Atlas. Extensive agriculture and 53 pastoralism dominates more than 70% of the local economy, these activities are unprofitable 54 and does not always allow people meet their needs [20]. Agriculture is a major activity in the 55 Draa region of both for food security and for income supplementation. As agricultural 56 production strongly depends on irrigation, water scarcity is a principal problem [21]. The 57 environmental vulnerability is accelerated by social vulnerability, as shown in the table 1, that 58 makes the oasean communities of Middle Draa valley often at the periphery of society, 59 geographically, politically and economically. 60 61
Table 1: Middle Draa Valley [22] 62 Urban area Rural area
Human Development Indicators (HDI) 0.65 0.52
Illiteracy 34.75% 55%
Rate of access to drinking water 86% 63%
Poverty rate 12.75% 37.64%
The degradation of the ecosystem in general and the oasis in particular due to climate 63 change, combined today’s with human activities constitute a major obstacle to development 64 in this region. The major issue identified in the area is: reduced number of palm trees 65 especially because of Bayoud [23]. The Bayoud disease (Fusarium oxysporum F. sp. 66 Albedinis) is a soil fungus that affects the palms. In fact, the region suffers from the 67 extension of Bayoud disease. This fungus attacks the best varieties of palm trees. Over the 68 past decades, Moroccan production of dates decreased by 34% [24], partly due to the 69 spread of this fungus. The rate of expansion of Bayoud in an experimental zone in Nebch 70 (MDV) is 4-15% [25]. In addition to this problem, there are other problems like soil and water 71 salinization, youth migration, degradation of acacia forests, overgrazing and lack of drinking 72 water and so on and so forth. All these factors contribute to widespread poverty in rural 73 areas and the dependence of the poor on a sensitive climate of the ecosystems that are 74 fragile for their livelihood. The rural community is among the poorest areas of the country 75 and its environment undergoes several processes of disintegration, which makes such study 76 very essential. 77 78 2. MATERIAL AND METHODS 79
2.1. Study Area 80
81
82
83
84
85
UNDER PEER REVIEW

Fig. 1. Middle Draa Valley Area. 86 Figure 2 shows the extrapolation of the most productive part of the study area represented 87 by six oases aligned as a necklace. These oases are located along the Draa Wadi 88 (temporary river) fed by Mansour Eddahbi Reservoir. 89
90 91
Fig. 2. Six aligned oases along Draa Wadi (Temporary River) 92
The Middle Draa Valley is characterized by a 200 km belt of six aligned oases with a width 93 that varies from 100 m to 10 km. The total surface of the six Draa oases are nearly forty 94 thousand hectare of which 26,118 hectare are arable land and irrigated [26]. Here, we will 95 be analyzing the six oases of the MDV which are displayed in figure 2 and 3 in the focus 96 area. Oasis Structure is schematically based on the interdependence of man, water and 97 palm trees. Agriculture, livestock and tourism are the main economic activities. 98
99 Fig. 3. Satellite images of the six aligned oases: A, Mezguita and Tinzouline oases; B, 100 Ternata and Fezouata; Tagounite and M’Hamid. Source: Sensors: TM, ETM+ and OLI. 101
01 November 2011. USGS (www. landsatlook.usgs.gov) 102 103 Within each oasis, we distinguish between three types of farms, as described in table 2. 104
105 106 107 108 109 110
A B C
UNDER PEER REVIEW

Table 2: Types of oasean farmers of Middle Draa Valley 111 Farm type Description
Farms of government in Bni zouli (Ternata oasis:Figure3)
N30°26’42.72” W5°54’40.32 • 0,3% of the oasean area • High quality palm varities • Surface water • Submersion irrigation • Large infestation of bayoud
disease • Low production
Modern farms private Feija (Fezouata oasis : Figure3)
N30°17’38.4” W5°55’19. 2” • <1% of the oasean area • High quality palm varities • Groundwater • Economic irrigation • No infestation of bayoud
disease • High production
Traditional farms Bni zouli
N30°26’16.8” W5°54’40.32” • 92% of the oasean area • Mixed varities • Water surface and
groundwater • Submersion irrigation • Low to moderate
infestation of bayoud disease.
• High production
2.2. Methodology 112
Services provided by ecosystems contribute much to the well-being of individuals, of 113 communities and of the economy. The monetization of non-market natural assets is growing 114 in popularity. Monetary unrepresentative contributes to the degradation of the natural 115 heritage. Unfortunately, the research on the issue of ecosystem services (monetary 116 characterization), in the study area and even nationally, is inexistent. Monetary 117 unrepresentative cause’s malfunctions in incentives associated with their use and 118 contributes to the degradation of the natural heritage. In recent scientific literature there are 119 a variety of methods for estimating the value of ecosystem services. The selection of 120 appropriate valuation methods is in part determined by the type of ecosystem service being 121 valued. The term ‘primary valuation’ refers to methods and studies that produce a new or 122
UNDER PEER REVIEW

original value estimate for a specific ecosystem. It is important to note that different valuation 123 methods produce different measures of economic value that are not equivalent and cannot 124 necessarily be directly compared 125
The appendix 2 provides a brief explanation of each primary economic valuation method, 126 setting out the approach, applicability to different ecosystem services, example applications, 127 and limitations. We collect the data from a variety of sources, including bibliographic data, 128 government ministries, and environmental organizations. Information was also gathered and 129 classified in ecosystem services categories. The data gathered pertained to the particular 130 indicator to be calculated and represented the 5 last years; a program of field trips and a 131 socio-economic and ecological survey supplemented by unstructured interviews in the study 132 area. Figure 4 gathers some methods and approached to valuing ecosystem services. 133
134 Fig. 4. Estimating total economic value (TEV) of benefits [27] 135
The Total Value (V) of Ecosystem Services ES in $/ha/year for ecosystem type k is V (ES)k 136 [27]: 137
138 139 Where : 140
• A (LUi) = Area of i (Land Use in hectares) 141 • V (ESki) = Annual value of k ES (Ecosystem Services) for each i LU (in $/ha/yr). 142
143
3. RESULTS 144
In most studies, the monetization of provisioning services is made using the method of the 145 market price. The results of the monetization are divided into three levels; vegetal, animal 146 and a third category that we'll call 'other products' including services such as water, soil and 147 wood. 148
I. Vegetal products: 149
In the six oases of Middle Draa Valley; the vegetal products are classified in the following 150 tables (3). The main vegetable productions at the Middle Draa Valley play an important 151
UNDER PEER REVIEW

socio-economic role, with the added value they generate in rural areas. The major products 152 (Table 3) are Common wheat and alfalfa for horticulture, and palm and almond for fruit trees. 153
Table 3: Average of last 5 years of Areas and Productions 154 Source of data : Monographie agricole de Zagora, 2009 155
Horticulture Area In Ha.
Production In Q
Fruit Trees
Effective (Trees)
Production In Tonnes
Durum Wheat 50 1300 Almond 32800 164 Common Wheat 16850 589910 Olive 6850 158 Barley 1400 29300 Apple 31500 630 Maize 330 6675 Palm 1421870 34125 Alfalfa 3600 190000 Apricot 40400 760 Vegetable Gardening 1445 260920
We calculated the average unit price of cultivated products in Dh/kg (1Dh=1MAD = 0.12 US 156 $; www.oanda.com; Sept. 28, 2013) based on data from the years 2004 to 2008 (Table 4). 157
Table 4: Average price of cultivated products (Dh/ kg). Source of data:[22] 158 2003/04 2004/05 2005/06 2006/07 2007/08 Average
Durum wheat 2,61 2,79 2,44 3,05 4,03 2,984 Common wheat 2,39 2,52 2,21 2,74 3,16 2,604 Barley 1,61 1,95 1,61 2,36 2,99 2,104 Maize 1,97 2 1,86 2,47 3,09 2,278 Broad beans 3,29 3,39 3,14 3,92 5,06 3,76 Lentils 4,31 6,32 4,27 5,89 8,83 5,924 Olives 3,22 4,26 4,95 4,72 5,06 4,442 Shelled almonds 46,17 53,5 57,77 52,3 48,02 51,552
Economic values of vegetal services are summarized in Table 5, which brings together, 159 ecosystem services, the size and quantity of each product and the unit price and the total 160 value of these services. 161
Table 5: Summary of the economic value of vegetal services 162
Ecosystem Service Area
/Number Quantity/
Production Unit Price Total In Dh Total In $
Durum Wheat 50 Ha 1300 Qx 4dh/Kg 520000 62400 Common Wheat 16850 Ha 589910 Qx 4dh/Kg 235964000 28315680 Barley 1400 Ha 29300 Qx 4dh/Kg 11720000 1406400 Maize 330 Ha 6675 Qx 4dh/Kg 2670000 320400 Alfalfa 3600 Ha 190000 Qx 2dh/Kg 38000000 4560000 Vegetable Gardening 1445 Ha 260920 Qx 4dh/Kg 104368000 12524160 Watermelon (2013) 1130 Ha 671287qx 2.5dh/Kg 167821750 20138610 Almond Tree 32800 Trees 164 Tonnes 60dh/Kg 9840000 1180800 Olive Tree 6850 Trees 158 Tonnes 4dh/Kg 632000 75840 Apple Tree 31500 Trees 630 Tonnes 5dh/Kg 3150000 378000 Palm Tree 1421870trees 34125 Ton. 15dh/Kg 511845000 61421400 Apricot Tree 40400 Trees 760 Tonnes 5dh/Kg 3800000 456000 Total 1090330750 130839690
Note: 1 US $ = 8.26; 1MAD = 0.12 US $; www.oanda.com; Sept. 28, 2013 163
The whole plant services produce a total economic value as we considered very important, 164 which is of the order of 1 090 330 750Dhs/year (130839690$/year). 165
UNDER PEER REVIEW

II. Animal products 166
Livestock has always been an important activity besides trade. Pastures have been largely 167 altered because to the years of drought and the construction of Mansour Eddahbi dam in 168 upstream of the study area. Despite these constraints, livestock plays a vital role in the daily 169 life of the farming community. This activity is a central element of the agricultural sector. In 170 terms of the importance of animal production (Table 6) sheep is in the lead, followed by 171 goats, then cattle and camels. However, for local consumption, the most important 172 agricultural product is bovine milk, followed by beef, chicken, and eggs. For small farmers, 173 livestock is a ready source of cash for the purchase of inputs (seeds, fertilizers and 174 pesticides) for agricultural production. Table 6 shows the number of livestock in the study 175 area in the following 3 years (2008, 2009 & 2010), while table 7 illustrate the milk production 176 and Honey in this area. 177
Table 6: Change of the number of livestock in the oasis ecosystem and its 178 surrounding areas. Source of data : Monographie agricole de Zagora, 2009 179
2008 2009 2011 Average Cattle 4770 5538 5540 5282,7 Ovine 70120 82994 83000 78704,7
Caprine 75130 59721 59720 64857 Camels 7950 9079 9080 8703 Equine 7620 7796 7795 7737
Beehives 886 1370 1128
180
Table 7: Oasean animal Products in the middle valley of Draa. Monographie agricole 181 de Zagora, 2009 182
2008 2009 Average
Milk 1442700.436 1773220 1607960,2 Honey 1580 1772 1676
183 The industrialized milk cooperative varies between 800 000 and 1 000 000 liters. The total 184 production of red meat, is about 785 tonnes. Talking about jobs, this sector, offres about 185 3547 jobs (Table 8). 186
Table 8: Agricultural Cooperatives. Source: Monographie agricole de Zagora, 2009 187 Type of coperatives Effectiveness Number of adherents Jobs offered
Procurement 8 969 969
Henna 4 554 554
Dates 4 1740 1740
Dairy 2 112 112
Livestock 4 158 158
Use of agricultural equipment 1 12 12
Total 23 3547 3547
To calculate the economic value offered by job creation, we multiply the minimum 188 guaranteed wage or “SMIG=2300Dh” with the number of jobs created: (3547*2300 Dh 189 (2012) =8158100/month) and 97897200Dh/year (11747664$/year). 190
UNDER PEER REVIEW

Industry, in the Middle Draa Valley occupies a rather secondary in economic activity in the 191 region. This is largely due to the remoteness and inaccessibility of the region. The only 192 industrial unit is the Coperative of milk processing (Table 9), which saves an added value of 193 524 000 Dh/year (62 880 $/year). 194
Table 9: Existing industrial units. Source: Annual Survey of processing industries 195 2009 edition 196
Company Name Production Investment Added Value
Halib Draa Cooperative 3.538.000,00 483.000,00 524.000,00
The economic value of the animals services are summarized in table 10, which includes, 197 ecosystem services derived from animal production, production in terms of number of cattle, 198 and the unit price and the total value of these services . 199
Table 10: Summary of the economic value of animal products 200
Ecosystem Service
Area /Number
Quantity/ Production
Unit Price Total In Dh/Year
Total In $/Year
Cattle 5540 4000dh 21130800 2535696 Ovine 83000 800dh 62963760 7555651,2 Caprine 59720 600dh 38914200 4669704 Ccamels 9080 6000dh 52218000 6266160 Equine 7795 500dh 3868500 464220 Beehives 1370 1000dh 1128000 135360 Milk 1773220 Lit. 4dh 6431840,87 771820,9 Milk Transformation
Added Value 524.000 524.000
62 880 Honey 1772 Kg 200dh 335200 40224 Agrifood Jobs 3547 Pers. SMIG 2300 97897200 11747664 Total 285411501 34249380,12
Ecosystem services of animal products therefore generate a value of 285411501Dhs/year 201 (34249380,12$/year). 202
III. Other products 203
Such products, means products other than agricultural food products like firewood and 204 construction wood… 205
III.1. Firewood 206
In 1993, the annual fuel consumption for one pottery in Tamgroute was 96.25 tonnes of 207 which only 10% of palms, about 86 tonnes of bushes from the plain Feija corresponding to a 208 destructive exploitation of 860 ha / year [28]. In rural areas, firewood represents about (90%) 209 of the energy consumed. Indeed, it is intended to meet the needs of households and 210 commercial purposes. Benchekroune [29] (1990) reports that Ighrem (Province of 211 Ouarzazate in border with the study area) consumption of firewood in winter ranges from 65 212 to 120kg per household per week. According to a study in Aït Zekri (Province of Ouarzazate) 213 consumption of wood in the tribe is estimated at 1kg/capita/day [30]. The study area houses 214 240 566 inhabitants (rural population), consuming 1kg/capita/day, which corresponds to a 215 value of 384905,6/day and 138566016 Dh/year (16627921,92 $/year), see table 11. 216
UNDER PEER REVIEW

Table 11: Economic value of the firewood in 1 year in Middle Draa Valley 217 Unit Quantity Unit Price Total
Inhabitant One Day Dh/Year $/Year
Firewood 1kg/Capita/Day 1,6dh/1kg 240 566 384905,6 138566016 16627921,9 Coal: 1,6dh /1 kg= 0,192$/1kg. 218
III.2. Construction wood 219
In the basin of the Draa, the habitat is usually "Moroccan house" or "rural category. The type 220 of habitat is important because the resource requirements of the wood are very large. 221 Indeed, the consumption of wood for a rural home is higher than another. This type of 222 accommodation occupies 66% of the type of habitat in the basin of Draa [31]. To build a 223 house (rural construction 300m
2 average), we need 7 palms (trees) and 300m
2 reeds like 224
shown in table 12. 225
Table 12: Economic value of the wood for 1 household 226 Price Unit Number/Quantity Total In Dh Total In $
Palm Tree 500 DH 7 3500 420
Reeds 7.5DH 300m2 2250 270
Total 5750 690
Note: 1 US $ = 8.26; 1MAD = 0.12 US $; www.oanda.com; Sept. 28, 2013 227
The total households in Middle Draa Valley are 33000; 66% is rural type (22000 228 households). The construction of 22000 households required (22000*5750):126500000Dh 229 (15.180.000$), provided by Oasis. To calculate the annual need of timber, we need to 230 calculate the evolution of the number of houses/year in the study area, which is shown in 231 table 13. 232
Table 13: Evolution of households in MDV [31] 233 2004 2030 2050
Population 278398 338239 391775
Number Of Households 33143 47977 62986
From the table, changing household at the rate of 648,8/year which corresponds to 3% of 234 22000. Therefore 660/year * 5750 (price in Dh of Construction wood for a household) = 235 3795000 Dhs (455400$/year) wood of construction/year. This value is added to the value of 236 the wood used for the renewal of homes per year. In fact, renewal of 80% of houses is done 237 in 50 years (survey 2012-2013), which allows us to calculate the value offered by Oasis for 238 timber. 80% of 22000: 17600/50= 352 households /year; therefore 352*5750=2024000Dhs 239 (242880$ /year). Table 14 summarizes the economic value of construction wood/ year. 240
Table 14: Summary of economic value of Construction wood/year 241 Use New Building (Construction Wood) Renewal (Construction Wood)
Unit Total In Dh/Year Total In $/Year Total In Dh/Year Total In $/Year
Total Price 3795000 455400 2024000 242880 242
III.3. Surface water and groundwater irrigation 243
In Middle Draa Valley, we can report in one hand small water resources like the humidity of 244 the air and soil that some plants and animals benefit. And other large water resources: 245
UNDER PEER REVIEW
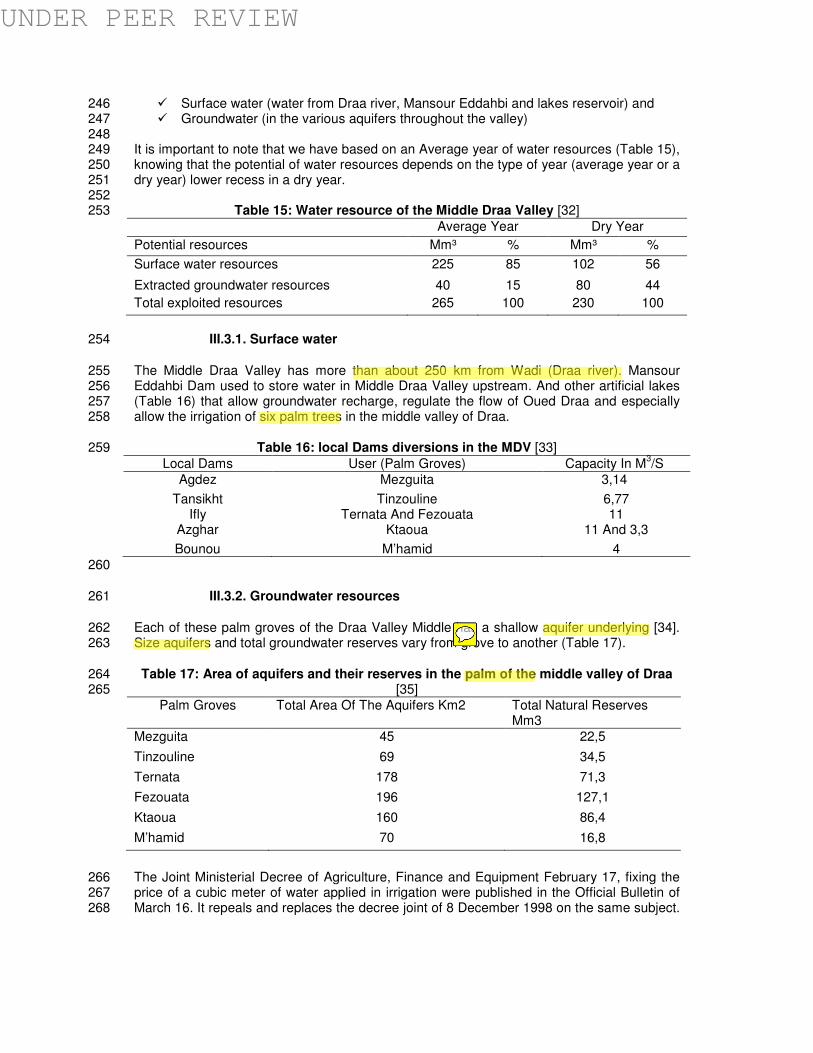
� Surface water (water from Draa river, Mansour Eddahbi and lakes reservoir) and 246 � Groundwater (in the various aquifers throughout the valley) 247
248 It is important to note that we have based on an Average year of water resources (Table 15), 249 knowing that the potential of water resources depends on the type of year (average year or a 250 dry year) lower recess in a dry year. 251 252
Table 15: Water resource of the Middle Draa Valley [32] 253 Average Year Dry Year
Potential resources Mm³ % Mm³ %
Surface water resources 225 85 102 56
Extracted groundwater resources 40 15 80 44
Total exploited resources 265 100 230 100
III.3.1. Surface water 254
The Middle Draa Valley has more than about 250 km from Wadi (Draa river). Mansour 255 Eddahbi Dam used to store water in Middle Draa Valley upstream. And other artificial lakes 256 (Table 16) that allow groundwater recharge, regulate the flow of Oued Draa and especially 257 allow the irrigation of six palm trees in the middle valley of Draa. 258
Table 16: local Dams diversions in the MDV [33] 259 Local Dams User (Palm Groves) Capacity In M
3/S
Agdez Mezguita 3,14
Tansikht Tinzouline 6,77 Ifly Ternata And Fezouata 11
Azghar Ktaoua 11 And 3,3
Bounou M’hamid 4 260
III.3.2. Groundwater resources 261
Each of these palm groves of the Draa Valley Middle has a shallow aquifer underlying [34]. 262 Size aquifers and total groundwater reserves vary from grove to another (Table 17). 263
Table 17: Area of aquifers and their reserves in the palm of the middle valley of Draa 264 [35] 265
Palm Groves Total Area Of The Aquifers Km2 Total Natural Reserves Mm3
Mezguita 45 22,5
Tinzouline 69 34,5
Ternata 178 71,3
Fezouata 196 127,1
Ktaoua 160 86,4
M’hamid 70 16,8
The Joint Ministerial Decree of Agriculture, Finance and Equipment February 17, fixing the 266 price of a cubic meter of water applied in irrigation were published in the Official Bulletin of 267 March 16. It repeals and replaces the decree joint of 8 December 1998 on the same subject. 268
UNDER PEER REVIEW

So-called "balanced rate" prices are set to 0.18 DH/m3 for irrigation perimeters Draa 269
(provinces of Ouarzazate and Zagora). The National average price of drinking water 270 (production and distribution) is 1,26dh/m
3. The table 18 shows of water resources in Middle 271
Draa Valley. 272
Table 18: Economic value of water resource in Middle Draa Valley (M=Million) 273 Number/Quantity Unit Price Total In Dh Total In $
Water Surface Irrigation
225 MM3 (85%) 0,18 DH/M3 40500000 4860000
Groundwater Irrigation 40 MM3 (15%) 0,75DH/M3 30000000 3600000
Drinking Water 9417363 M3
1,26DH/M3 11865877,38 1423905,28
People use water from traditional wells and water from the dam for domestic and agricultural 274 uses. The wells are the main source of supply of most villages with drinking water. The total 275 consumption of drinking water from the oasis and its surrounding area population is 276 estimated at 9417363 m
3 per year. 277
III.3.3. Water power 278
The Mansour Eddahbi Dam in upstream is 63 m high, 15 m wide at the base, and 285 m in 279 length. The capacity of the reservoir is 536 million m3 and helps regulate some 250 million 280 m
3 per year. A hydro-electric plant with a production capacity of 10,000 kW installed at the 281
foot of the dam [36]. Table 19 shows the economic value of this reservoir Mansour Eddahbi 282 dam produce 32385, 91MW/year. 283
Table 19: Economic value of water energy 284 Numbre/Quantity Unit Price Total In Dh/An Total In $
Water Energy 32385,91mw 0,674dh/Kw 21828103,34 2619372,40
285 III.4. Use of soil for construction 286
On the soil level, soil texture of the valley is generally sandy clay. In depth, clay content 287 increase and porosity decreases [36]. 288 The physical characteristics, construction techniques and environmental benefits of land 289 (soil) make it an ancient building material on all continents. The land is recyclable, non-290 polluting, cheap, controlling moisture, absorbing heat. This saves energy and gain comfort. 291
III.4.1. Saving Energy 292
How many kilowatt hours in 1 Celsius heat unit? The answer is 0.000527527916667. 293 (www.convertunits.com). Rural housing saves at least 5°C temperature
1 compared to 294
Moroccan cement habitat. So one hose saves 0.000527527916667 (5 times), which gives a 295 saving 0.00263764583335 kwh (1hour). In one year we will have a saving of 50687, 75 Dh 296 (Table 20). 297
298
299
1 The value of 5 ° C was estimated from measurements made in the Bni Zouli village
UNDER PEER REVIEW
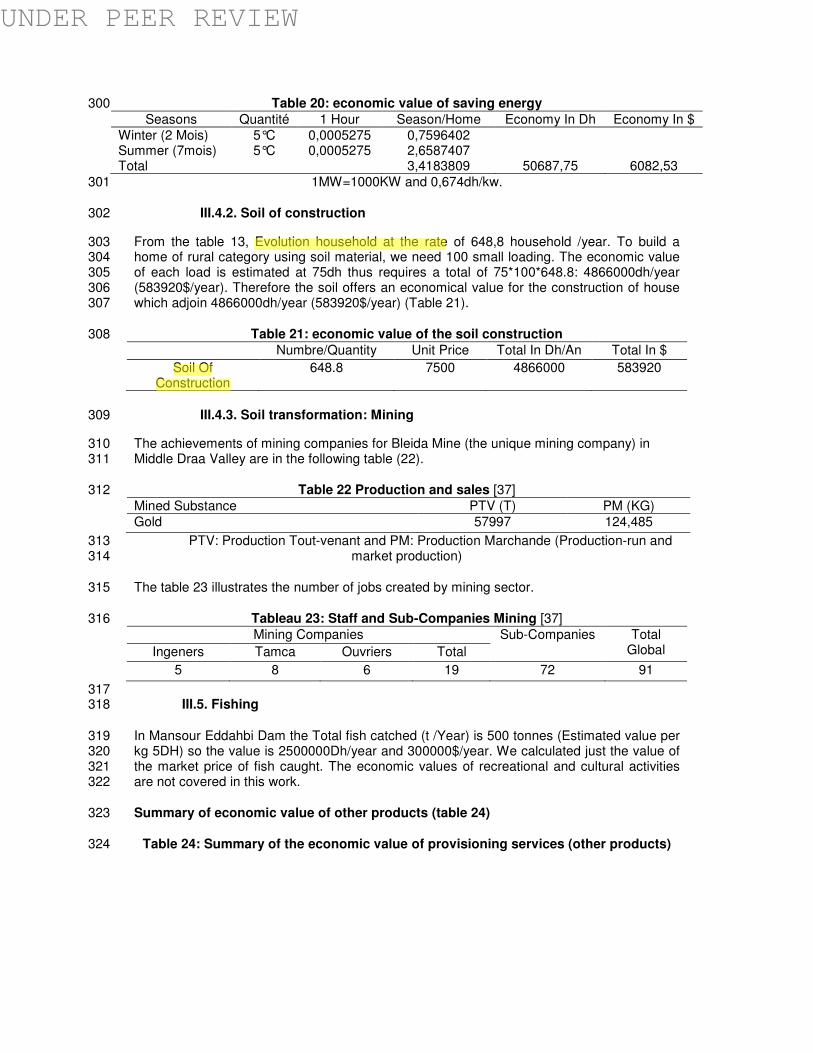
Table 20: economic value of saving energy 300 Seasons Quantité 1 Hour Season/Home Economy In Dh Economy In $
Winter (2 Mois) 5°C 0,0005275 0,7596402
Summer (7mois) 5°C 0,0005275 2,6587407 Total 3,4183809 50687,75 6082,53
1MW=1000KW and 0,674dh/kw. 301
III.4.2. Soil of construction 302
From the table 13, Evolution household at the rate of 648,8 household /year. To build a 303 home of rural category using soil material, we need 100 small loading. The economic value 304 of each load is estimated at 75dh thus requires a total of 75*100*648.8: 4866000dh/year 305 (583920$/year). Therefore the soil offers an economical value for the construction of house 306 which adjoin 4866000dh/year (583920$/year) (Table 21). 307
Table 21: economic value of the soil construction 308 Numbre/Quantity Unit Price Total In Dh/An Total In $
Soil Of Construction
648.8 7500 4866000 583920
III.4.3. Soil transformation: Mining 309
The achievements of mining companies for Bleida Mine (the unique mining company) in 310 Middle Draa Valley are in the following table (22). 311
Table 22 Production and sales [37] 312 Mined Substance PTV (T) PM (KG) Gold 57997 124,485
PTV: Production Tout-venant and PM: Production Marchande (Production-run and 313 market production) 314
The table 23 illustrates the number of jobs created by mining sector. 315
Tableau 23: Staff and Sub-Companies Mining [37] 316 Mining Companies Sub-Companies Total
Global Ingeners Tamca Ouvriers Total
5 8 6 19 72 91
317 III.5. Fishing 318
In Mansour Eddahbi Dam the Total fish catched (t /Year) is 500 tonnes (Estimated value per 319 kg 5DH) so the value is 2500000Dh/year and 300000$/year. We calculated just the value of 320 the market price of fish caught. The economic values of recreational and cultural activities 321 are not covered in this work. 322
Summary of economic value of other products (table 24) 323
Table 24: Summary of the economic value of provisioning services (other products) 324
UNDER PEER REVIEW

Ecosystem Service Area
/Number Quantity/
Production Unit Price
Total In Dh/Year
Total In $
Firewood 240 566 1kg/Capita/Day 1.6dh/Kg 138566016 16627921,9 Wood Construction 22000 number 5819000 698280 Water Surface Irrigation
225 Mm3 (85%) 0,18 Dh/m3 40500000 4860000
Groundwater Irrigation
40 Mm3 (15%) 0,75dh/m3 30000000 3600000
Drinking Water 9417363m3 1,26dh/m3 11865877,38 1423905,28
Water Energy 32385,91mw 0,674dh/Kw 21828103,34 2619372,40 Soil Of Construction
648.8 7500
4866000 583920
Soil Energy 0,67dh/Kw 50687,75 6082,53 Soil Transformation (Gold Production)
124,485 Kg 41342735,8 4961128,29
Mining Sector Jobs 2300 2511600 301392 Fishing 500 Tonnes 100 Fishermen 5dh 2500000 300000 Total
325
The latter category of services (other products) generates economic value of around 326 2998500200Dhs/year (359820024$/year). From the data compiled in the calculations of the 327 economic value of plant procurement, animals and other products supplied by the Draa 328 Valley, the total value became 1675592271 Dhs / year (201071072,52 $ / year )(Table 25). 329
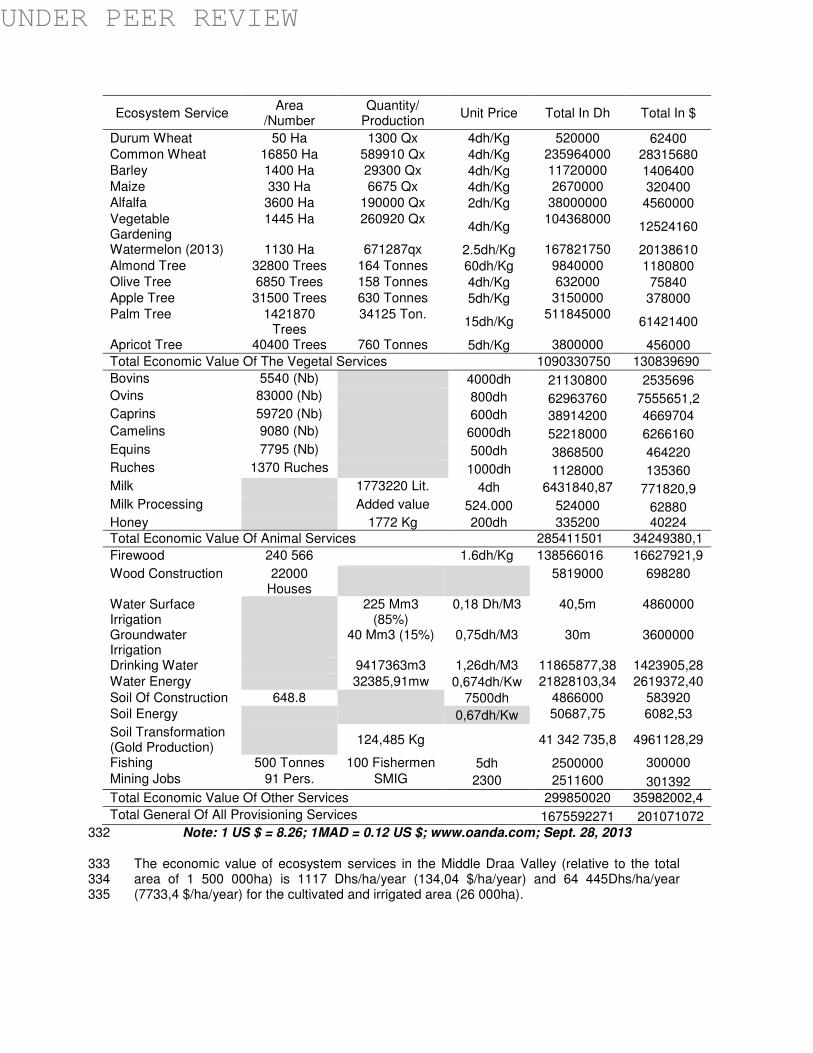
330 Table 25: Summary of the economic provisioning services 331
UNDER PEER REVIEW
Ecosystem Service Area
/Number Quantity/
Production Unit Price Total In Dh Total In $
Durum Wheat 50 Ha 1300 Qx 4dh/Kg 520000 62400 Common Wheat 16850 Ha 589910 Qx 4dh/Kg 235964000 28315680 Barley 1400 Ha 29300 Qx 4dh/Kg 11720000 1406400 Maize 330 Ha 6675 Qx 4dh/Kg 2670000 320400 Alfalfa 3600 Ha 190000 Qx 2dh/Kg 38000000 4560000 Vegetable Gardening
1445 Ha 260920 Qx 4dh/Kg
104368000 12524160
Watermelon (2013) 1130 Ha 671287qx 2.5dh/Kg 167821750 20138610 Almond Tree 32800 Trees 164 Tonnes 60dh/Kg 9840000 1180800 Olive Tree 6850 Trees 158 Tonnes 4dh/Kg 632000 75840 Apple Tree 31500 Trees 630 Tonnes 5dh/Kg 3150000 378000 Palm Tree 1421870
Trees 34125 Ton.
15dh/Kg 511845000
61421400
Apricot Tree 40400 Trees 760 Tonnes 5dh/Kg 3800000 456000 Total Economic Value Of The Vegetal Services 1090330750 130839690
Bovins 5540 (Nb) 4000dh 21130800 2535696 Ovins 83000 (Nb) 800dh 62963760 7555651,2 Caprins 59720 (Nb) 600dh 38914200 4669704 Camelins 9080 (Nb) 6000dh 52218000 6266160 Equins 7795 (Nb) 500dh 3868500 464220 Ruches 1370 Ruches 1000dh 1128000 135360 Milk 1773220 Lit. 4dh 6431840,87 771820,9 Milk Processing Added value 524.000 524000 62880 Honey 1772 Kg 200dh 335200 40224 Total Economic Value Of Animal Services 285411501 34249380,1
Firewood 240 566 1.6dh/Kg 138566016 16627921,9
Wood Construction 22000 Houses
5819000 698280
Water Surface Irrigation
225 Mm3 (85%)
0,18 Dh/M3 40,5m 4860000
Groundwater Irrigation
40 Mm3 (15%) 0,75dh/M3 30m 3600000
Drinking Water 9417363m3 1,26dh/M3 11865877,38 1423905,28 Water Energy 32385,91mw 0,674dh/Kw 21828103,34 2619372,40 Soil Of Construction 648.8 7500dh 4866000 583920 Soil Energy 0,67dh/Kw 50687,75 6082,53
Soil Transformation (Gold Production)
124,485 Kg 41 342 735,8 4961128,29
Fishing 500 Tonnes 100 Fishermen 5dh 2500000 300000 Mining Jobs 91 Pers. SMIG 2300 2511600 301392 Total Economic Value Of Other Services 299850020 35982002,4
Total General Of All Provisioning Services 1675592271 201071072 Note: 1 US $ = 8.26; 1MAD = 0.12 US $; www.oanda.com; Sept. 28, 2013 332
The economic value of ecosystem services in the Middle Draa Valley (relative to the total 333 area of 1 500 000ha) is 1117 Dhs/ha/year (134,04 $/ha/year) and 64 445Dhs/ha/year 334 (7733,4 $/ha/year) for the cultivated and irrigated area (26 000ha). 335
UNDER PEER REVIEW

4. DISCUSION 336
The oasean ecosystem provides a set of varied benefit for local populations, which include: 337 provisioning, regulation, cultural and supporting services. Their status and trend vary 338 depending on the type and intensity of the pressures to which they are exposed. These 339 pressures lead to loss of ecosystem services, and cause negative impacts on livelihoods. 340 This degradation is induced by climatic factors, exacerbated by the socio-economic context 341 marked (especially extreme poverty). Successive droughts in recent years have also limited 342 the primary production in Middle Draa Valley. Moreover, the intensification of agriculture 343 illustrates the pressures facing the oasis system. The provisioning services of oasean 344 ecosystem include a wide range of food products derived from plants and animals. Forests 345 are exploited for many reasons: timber for local construction, for the manufacture of charcoal 346 local collecting wood for heating and cooking. The main tree species existing in their natural 347 state are 90194 ha of Acacia Radiana and 20985 ha of Tamarix Aphyla [37]. The 348 contribution of forests to the local economy of the area is important. The products of these 349 forests help meet the needs of the population in cattle feed, firewood, timber. Furthermore 350 the use of wood as an energy source, local people before various products manufactured 351 from wood fibers or spontaneous plants. The surface water of this ecosystem leads the 352 irrigation of arable area, and fed the oasean aquifers. More water in upstream Draa is a 353 source of energy through Mansour Eddahbi Dam. Data was collected, compiled and 354 analyzed to give the approximate monetary value of provisioning services. This quantitative 355 assessment was conducted using information provided by the public services of the Draa 356 Valley. For the vegetal production, we used the annual production multiplied by the average 357 price. Assessment of livestock production is possible thanks to the presence of data on milk 358 production, and the number of livestock. Because of lack of data on the pharmacopoeia and 359 wild foods, we did not assess monetarily these services. To estimate the consumption of 360 wood, we relied on the results of the field survey. Based on household consumption, we 361 estimated global consumption in which we applied current prices. It is essential to note the 362 importance of the economic value of agricultural expenses in the oases of the Draa Valley as 363 fertilizer, the cost of irrigation, tillage and seed. From the synthesis of the Table 25, 364 agricultural production (vegetal and animal) generates 285411501Dhs 365 (34249380,12$/ha/year) reported to the productive area (26 000ha), giving 10977.4 Dhs/ha 366 /year (13172,88 $/ha/year) for animal products and 41 936 (1090330750 / 26000) or 367 (5032,32$/ha/year) for vegetal products. The total is approximately 52913.7 Dhs/ha/year 368 (63496,44$/ha/year). Expenses spent annually by farmers are about 7123 Dhs/ha/year 369 (854,76$/ha/year), they are estimated in 2005 by a survey conducted as part of the 370 IMPETUS project, conducted by Heidecke [32] (2009). So the net annual value of 371 agricultural products in the area of six palm groves is estimated at 45790.7 Dhs/ha/year 372 (54948,84$/ha/year). It should be recalled that, in the present study, we aim to provide an 373 approximate value of provisioning services. The most part of the economic value comes 374 from the six palm groves, knowing although the area of the palm represents only 0.017% of 375 the total area of the Middle Draa valley. The final value obtained from MDV is 1117 376 Dhs/ha/year (134,04 $/ha/year), which is very low, because we have not estimated the value 377 of the immaterial wealth as the value of biodiversity, tourism, pollination, Folklore and 378 Moussems, etc. 379
The comparison of results in table 26 with result of economic value of provisioning services 380 of at global scale (Inland wetlands, rivers/lakes, woodlands, Grass lands) developed by De 381 Groot in 2012 [38] showed in table 26. The economic value of the most productive part of the 382 Draa valley (six palm) is greater than the value of wetland ecosystems, rivers / lakes and 383 grasslands; while the whole Draa Valley generates the lowest economic value compared to 384 previous ecosystems. 385
386
UNDER PEER REVIEW

Table 26: Summary of monetary values for each service per biome (values in Int. 387 $/ha/year, 2007 price levels) [38] 388
Where * : Estimated values from the vegetal and animal production of the six palm groves 389 of the Middle Draa Valley. 390
** : Estimated values of all components of the whole Draa Valley 391 392 The low economic value of the entire MDV is justified by the arid climate and the poor quality 393 of the complex water-soil. While the economic value of six palm groves is very important, 394 given the potential of the structure and function of these palm groves and consequently their 395 ecosystem services. It is a knowledge accumulated over thousands of years which the oasis 396 Man knew how to value the groundwater, which is an important aspect of the development of 397 agricultural production, keeping the soil fertile enough, and also controlling surface water 398 from of temporary streams. 399
5. CONCLUSION 400
Oases are agricultural landscapes of pre-Saharan Morocco and contribute to the well-being 401 of the local population by provisioning ecosystem services (fibers, water ...), regulation 402 services (air, climate, sewage ...), cultural services (biodiversity, tourism ...) and supporting 403 services (soil, nutrients...). But the surface of the oases has been declining for more than fifty 404 years. This may seem alarming in view of the contribution of these areas to human well-405 being. Economic evaluation helps preserve ecosystems, revealing the challenges they are 406 associated. A better scientific understanding of the economic value of these services reveals 407 important. This article reports monetary values of some ecosystem services of the oases. 408 The values are standardized to US$ per hectare per year in 2008-2010 period prices. The 409 mean values are found to be 64 445 Dhs/ha/year (7733,4 $/ha/year) in arable area (for 410 26 000ha) and 1117Dhs/ha/year (134,04 $/ha/year) for total area (1500 000ha). In order to 411 complete this evaluation, we recommend expanding this study: 412
• For all other ecosystem services than provisioning services 413 • At the level of national ecosystems for which data from similar ecosystems are 414
available. 415
The lack of revelation of the value of these services frequently leads people to behave as if 416 the value was zero, whereas in reality it is simply not apparent. The study can be applied to 417 other oases of the pre-Saharan part of Morocco because of the similarity of lifestyle, climate, 418 and water requirements etc... 419
The estimated value of the annual production was made on the basis of bibliographic data, 420 supplemented by field surveys. The degradation of oasean ecosystem of Middle Draa valley 421 leads to the loss of ecosystem services, and causes negative impacts on livelihoods. The 422 losses amount to some 7733,4 $/ha/year. 423
Inland wetland
Rivers/lakes Woodlands Grass lands
Oases* VDM**
Provisioning services 1659 1914 253 1305 7733,4 134,04 1 Food 614 106 52 1192 5895,3 102,18 2 Water 408 1808 60 380,16 6,6 3 Raw materials 425 170 53 2429,8 25,2 4 Genetic resources 5 Medicinal resources 99 1 6 Ornamental resources 114 32
UNDER PEER REVIEW

REFERENCES 424
425 1. Melinium Ecosystem Assessment –MEA- Ecosystems and Human Well-being: Current 426
State and Trends. Dryland Systems, David Niemeijer et al; 2005. 427 2. De Groot RS., Wilson MA & Boumans RM.. A typology for the classification, description 428
and valuation of ecosystem functions, goods and services, special issue on the 429 dynamics and value of ecosystem services: integrating economic and ecological 430 perspectives. Ecol Econ. 2002. 41:393–408. 431
3. Howarth Farber. Accounting for the value of ecosystem services. Ecol Econ. 432 2002.41:421–429 433
4. Heal, Barbier, Boyle, Covich, Gloss, Hershner, Hoehn, Pringle, Polasky, Segerson, 434 Shrader-Frechette. Valuing ecosystem services: toward better environmental 435 decision making. The National Academies Press, Washington. 2005. 436
5. Barbier EB. Valuing ecosystem services as productive inputs. Econ Policy 2007; 22:177–437 229. 438
6. Boyd, Banzhaf, 2007. What are ecosystem services? The need for standardized 439 environmental accounting units. Ecol Econ 63:616–626. 440
7. Wallace KJ. Classification of ecosystem services: problems and solutions. Biol Cons 441 ;139:235–246. 442
8. Fisher, Turner, Zylstra, Brouwer, De Groot, Farber, Ferraro, Green, Hadley, Harlow, 443 Jefferiss, Kirkby, Morling, Mowatt, Naidoo, Paavola, Strassburg, Yu D, Balmford,. 444 Ecosystem services and economic theory: integration for policy-relevant research. 445 Ecol Appl 2008; 18(8):2050–2067. 446
9. Mäler KG, Aniyar S, Jansson A. Accounting for ecosystem services as a way to 447 understand the requirements for sustainable development. PNAS 105(28):9501–448 9506. www.pnas.org/cgi/doi/10.1073/ pnas. 0708856105.2008. 449
10. Tschirhart. Integrated ecological-economic models. Ann Rev Resour Econ. 2009 ; 450 1:381–407. Version provisoire. 451
11. Liu S, Costanza R, Farber S, Troy A. Valuing ecosystem services. Ann N Y Acad Sci 452 1185:54–78. doi:10.1111/j.1749-6632.2009.05167.x. 2010. 453
12. Anderson B et M'Gonigle M. Does ecological economics have a future?: Contradiction 454 and reinvention in the age of climate change. Ecological Economics, Volume 84, 455 Pages 37–48. 2012. 456
13. Biosphere Reserve of South Morocco Oasis -RBOSM- Plan Reserve Management 457 Framework Biosphere Oasis of southern Morocco. 2008. 458
14. Karmaoui, Messouli, Yacoubi, Ifaadassan, 2014. Environmental Vulnerability to Climate 459 Change and Anthropogenic Impacts in Dryland, (Pilot Study: Middle Draa Valley, 460 South Morocco). J Earth Sci Clim Change S11: 002.doi:10.4172/2157-7617.S11-002 461
15. Information Sheet on Ramsar Wetlands -FDR- By El Ayachi Sehhar, GREPOM 462 Mohamed and Ahmed EL Dakki HASSANI. 2004. 463
16. High Commission for Water and drill and fight against desertification -HCEFLCD-. 464 Planning Study National Park Iriqui, Synthesis Report. HCEFLCD-dref so. 2007. 465
17. Observatory of the Sahara and the Sahel-OSS- Evaluation study of the National 466 Environmental Monitoring Devices in Morocco and Tunisia. Long-term 467 Environmental Monitoring in Circum-Saharan Network Mr. Mohammed Messouli, 468 2012. 469
18. Moroccan Agency for Solar Energy, Environmental and Social Impact Assessment 470 (ESIA). Central Solar Project On Ouarzazate. Central Solar Ouarzazate C172 / A631 471 / R188a. 2012. 472
19. Ait Hamza A, Elfaskaoui B & Fermin A. “Migration and environmental change in 473 Morocco: The case of rural oasis villages in the Middle Drâa Valley”. EACH-FOR. 474 Environmental Change and Forced Migration Scenarios. Deliverable reference 475 number and title: D 2.5.2.3. 2009. 476
UNDER PEER REVIEW

20. Reichert, 2008. Introduction into the Draa catchment. International conferences in 477 Ouagadougou. Burkina Faso, 2008. Global change and water resources in west 478 africa. the German-african GLOWA projects. 479
21. Goldbach H, Hecklelei, Kuhn, Heidecke, Abdelrazek, Gresens, Roth, Gaiser and Kirscht. 480 Agricultural production and income security under increasing water uncertainty in 481 Draa valley. International conferences in Ouagadougou. Burkina Faso. Global 482 change and water resources in west africa. the German-African GLOWA projects. 483 2008. 484
22. Vulnerability assessment and impacts of climate change in the oases of Morocco and -485 EVICCa- structuring territorial adaptation strategies. Mission 1.1: Total Diagnostic 486 climate vulnerabilities and current situation adaptability Basin oasis of Dades, Draa. 487 2011. 488
23. Aanjarne M et al 2001. In vitro propagation of date palm: a Moroccan palm development 489 tool devastated by disease Bayoud. Rabat: National Institute of Agronomic 490 Research. 2001. 182P. 491
24. Adaptation to Climate Change Project -PACC-. Oasis and Arid Resilient Territories 492 Committed. www.oasisadaptation.com) .2011. 493
25. D. Fernandez, Heavy M., Ouinten M., A. Tantawi and JP. .. Geiger Bayoud The date 494 palm: a threat to date palm? Phytoma. 1995. 469: 36-39. 495
26. Regional commissioning of Ouarzazate Agricuole Value Study -ORMVAO- exploitation 496 improvement of irrigation and drainage systems of ORMVAO- Phase 1: Diagnosis of 497 the current situation. Report details of the diagnosis Vol 1. Ouarzazate. Morocco. 498 1995. 499
27. Glaves P & Egan D. Some Methods and Approached to Valuing Ecosystem Services, 500 March 2013. 501
28. Benmohammadi A, Benmohammadi L, Ballais J.L et Riser J.. Analysis of anthropogenic 502 and natural interrelations: their impact on sanding up and desertification in 503 southeastern Morocco (Drâa and Ziz valleys); Science et changements planétaires / 504 Sécheresse. 2000. Volume 11, Number 4, 297-308. 505
29. Benchekroune F. forest in the economic and social development of the average 506 Moroccan Atlas. PhD Thesis State Agronomic Are Sciences. I.A.V.Hassan II, Rabat. 507 1990. 508
30. Cameleo, 1998. Annual progress report, project report. 1998.187p. 509 31. Vulnerability assessment and impacts of climate change in the oases of Morocco -510
EVICCb-. and structuring of local adaptation strategies. Mission 1.2: Prospective 511 evaluation of climate vulnerabilities and risks to the horizons 2030 and 2050. 2011. 512
32. Heidecke C. Economic analysis of water use and management in the Middle Drâa 513 valley in Morocco vorgelegt am 22. 2009. page 16-25. 514
33. Regional commissioning of Ouarzazate Value Agricuole -ORMVAO- Establishment of a 515 master plan for agricultural development in the valley of the Draa. Ouarzazate. 1981. 516
34. A. Klose Soil Salinity - Case Study of Ouled Yaoub; IMPETUS Project, 2008. 978-3-517 9810311-7-1. 518
35. Heidecke C and Roth A. Drought Effects on Livestock Husbandry” in IMPETUS Atlas 519 Morocco. Research Results 2000–2007. 3rd Edition, edited by Schulz, Oliver and 520 Judex, Michael, Department of Geography, University of Bonn, Germany. 2008 521
36. Zainabi A, 2003. The Draa Valley. Developement Community Action Alternative and 522 September, 2001. Background paper WDR 2003 Page 9. 523
37. Monograph Zagora province -MPZ- Kingdom of Morocco Ministry of Interior Province Of 524 Zagora. 2011 525
38. De Groot R, Brander L, van der Ploeg S, Costanza R, Bernard F, Braat L ... & van 526 Beukering P. Global estimates of the value of ecosystems and their services in 527 monetary units. Ecosystem Services, 2012. 1(1), 50-61. 528
529
UNDER PEER REVIEW