Embed Size (px)
Citation preview
ORIGINAL PLAN PREPARED BY: NANA Regional Corporation
REVISON ENDORSED BY: Northwest Arctic Leadership Team
OVERSIGHT BY: Northwest Arctic Energy Steering Committee
August 2015 FINAL DRAFT

Northwest Arctic Regional Energy Plan
Serving the communities of:
Ambler ~ Ivisaappaat
Buckland ~ Nunachiaq
Deering ~ Ipnatchiaq
Kiana ~ Katyaak
Kivalina ~ Kivalieiq
Kobuk ~ Laugviik
Kotzebue ~ Qikiqtabruk
Noatak ~ Nautaaq
Noorvik ~ Nuurvik
Selawik ~ Akulibaq
Shungnak ~ Issingnak
Original Plan Prepared by:
NANA Regional Corporation
Revision Endorsed by:
Northwest Arctic Leadership Team
Oversight by: Northwest Arctic Energy Steering Committee
Revision Funded by:
Alaska Energy Authority
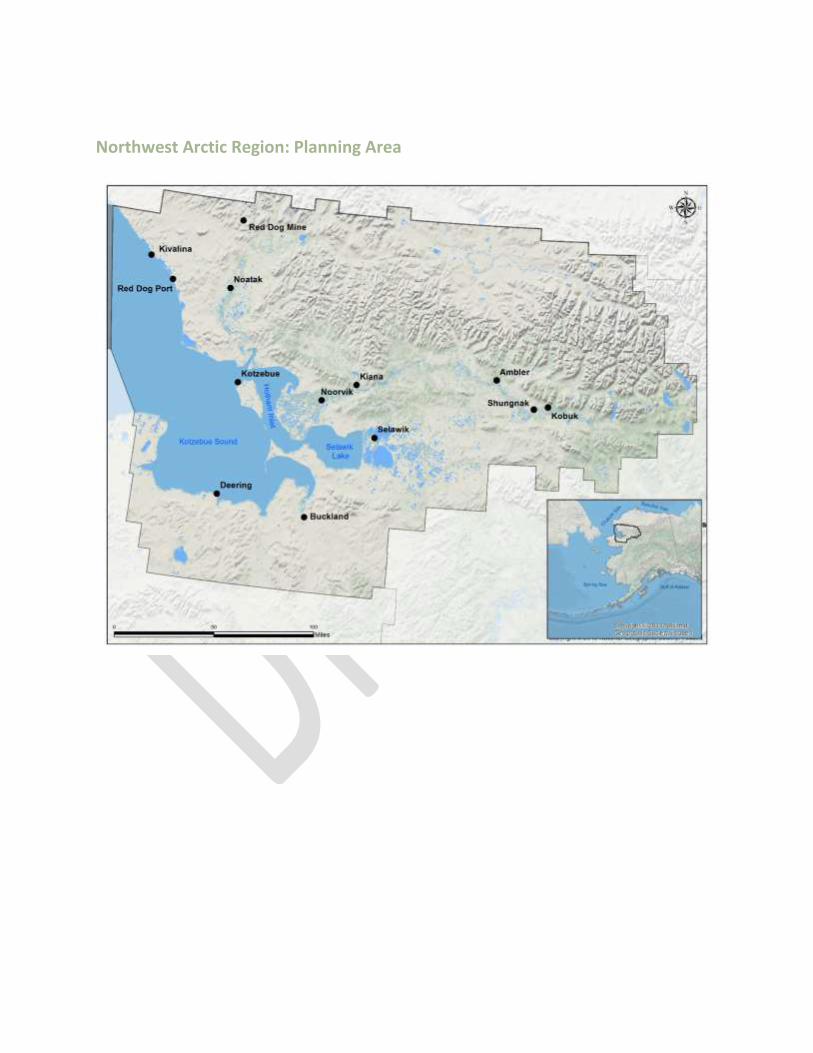
Northwest Arctic Region: Planning Area
i
Acknowledgements
NANA Regional Corporation (NANA) developed the first Northwest Arctic Strategic Energy Plan which
was endorsed by the Northwest Arctic Leadership Team (NWALT, and was funded by the Alaska Energy
Authority for revision and Phase II and III. In this plan, NANA and NWALT continue to play an important
role along with other individuals and groups as shown below:
Northwest Arctic Regional Energy Plan Preparation
NANA Regional Corporation Sonny Adams, NANA, Director of Energy
Northwest Arctic Leadership Team
Timothy Scheurch, President/CEO, Maniilaq Association
Guy Adams, Board Chair, Maniilaq Association
Wayne Westlake, President/CEO, NANA
Linda Lee, Board Chair, NANA
Mayor Reggie Joule, Northwest Arctic Borough
Walter Sampson, Assembly President, Northwest Arctic Borough
Ann-Marie Martin, Superintendent, NWABSD
Sandy Shroyer-Beaver, Board Chair, Northwest Arctic Borough School District
Northwest Arctic Energy Steering Committee Community Members
Morgan Johnson, Ambler
Representative
Ernest Barger, Sr., Buckland
Representative
Daisy Weinard, Deering Representative
John Horner, Kobuk Representative
Mark Moore., Noatak Representative
Be Atoruk, Kiana Representative
Marilyn Swan, Kivalina Representative
Derek Martin, Kotzebue Representative
Kirk Sampson, Noorvik Representative
Raven Sheldon, Selawik Representative
James Commack, Shungnak Representative
Community Alternate Members
Eunice Hadley, Alternate, Buckland
Raymond Ballot, Alternate, Selawik
Clyde Ramoth, Sr., Alternate, Selawik
Edward Gooden, Alternate, Kobuk
Eileen Barr, Kiana Representative
Miles Cleveland, Alternate, Kobuk
Scott Jones, Alternate, Ambler
Colleen Swan, Alternate, Kivalina
Leslie D. Burns, Alternate, Noatak
Utility Representatives
Meera Kohler, AVEC
Brad Reeve, KEA
Matt Bergen, KEA
Daisy Weinard, IEC, Deering
Dean Westlake, Director VEDC, NANA
ii
Other Members
Craig McConnell, Maintenance Director,
NWAB School District
Guy Adams, Director, Northwest Inupiat Housing Authority
Fred Smith, NWAB Economic Development Director
Eugene Smith, Maniilaq
Northwest Arctic Regional Plan coordinator
Ingemar Mathiasson, NWAB Energy & Resource Coordinator
Northwest Arctic Regional Energy Plan Contributors
Alaska Energy Authority
Sandra Moller, Director, Project Implementation
Robert Venables, Consultant, Southeast Conference Energy Coordinator
Jed Drolet, Energy Information Analyst
Alaska Native Tribal Health Consortium
Mike Black, Director, Rural Utility Management Services
Chris Mercer, P.E., Energy Program Engineer
Eric Hanssen, P.E., DEHE
Vitus Marine
Mark Smith
Justin Cherron, President
Cameron Libby, Sales Manager
Crowley Maritime Corporation
Royal Harris, Director, Customer Service
Denali Commission
Mark Spafford, Project Manager
RurAL CAP
David Hardenbergh, Executive Director
iii
Teck Alaska, Inc.
Wayne Hall, Manager, Community and Public Relations
WHPacific, Inc.
Suzanne Taylor, Project Manager
Nicole McCullough, Senior Planner
Jackie Qataliña Schaeffer, Energy
Specialist
Other Potential Stakeholders
NANA Oilfield Services, Inc.
Brad Osborne, President J.D. Palin, General Manager
National Park Service, Kotzebue
Frank Hayes, Superintendent
Cover designed and produced by NANA Corporate Communications.
iv
Acronyms and Abbreviations
ACEP Alaska Center for Energy and Power
AEA Alaska Energy Authority
AHFC Alaska Housing Finance Corporation
AIDEA Alaska Industrial Development and Export Authority
AMR systems Automated Meter Reading systems
ANCSA Alaska Native Claims Settlement Act
ANGDA Alaska Natural Gas Development Authority
ANTHC Alaska Native Tribal Health Consortium
APT Alaska Power and Telephone
ARDOR Alaska Regional Development Organizations
ARECA Alaska Rural Electric Cooperative Association
ARIS Alaska Retrofit Information System
ARRA American Recovery and Reinvestment Act
ARUC Alaska Rural Utility Collaborative
AVEC Alaska Village Electric Cooperative
BIA Bureau of Indian Affairs
BLM Bureau of Land Management
CETF Community Energy Task Force
CIAP Coastal Impact Assistance Program
CFL compact fluorescent light
EfW Energy From Waste
DCCED Department of Commerce, Community and Economic
Development
DOE U.S. Department of Energy
DOL Alaska Department of Labor (and Workforce Development)
DOT&PF Alaska Department of Transportation and Public Facilities
EPA U.S. Environmental Protection Agency
ETF Emerging Technology Fund
FERC Federal Energy Regulatory Commission
FHWA Federal Highway Administration
HUD U.S. Department of Housing and Urban Development
HVDC High Voltage Direct Current
ICDBG Indian Community Development Block Grant
IPP Independent Power Producer
ISER Institute for Social and Economic Research
KEA Kotzebue Electric Association
kW Kilowatt
kWh Kilowatt hour
MWh Megawatt hours
NAB Northwest Arctic Borough
v
NAHASDA Native American Housing and Self Determination Act
NANA or NRC NANA Regional Corporation
NDC NANA Development Corporation
NIST National Institute for Standards and Technology
NOAA National Oceanic and Atmospheric Administration
NOSI NANA Oilfield Services, Inc.
NRECA National Rural Electric Cooperative Association
NREL National Renewable Energy Laboratory
NWABSD Northwest Arctic Borough School District
NWALT Northwest Arctic Leadership Team
ORC Organic Rankine Cycle
PFD Permanent Fund Dividend
PCE power cost equalization
PD&R Policy Development and Research
PV Photovoltaic
REAP
REF
Renewable Energy Alaska Program
Renewable Energy Fund
RUBA Rural Utility Business Advisor
TED The Energy Detective
UAF University of Alaska Fairbanks
UCG Underground Coal Gasification
VED (NANA) Village Economic Development
WtE Waste to Energy
WTP Water Treatment Plant

vi
vii
Table of Contents
Executive Summary ....................................................................................................................................... 1
Current Conditions .................................................................................................................................... 4
Vision ......................................................................................................................................................... 4
Issues, Goals and Recommendation ......................................................................................................... 4
2014 Capital Project List for Energy ........................................................................................................ 10
1. Introduction ........................................................................................................................................ 11
1.1. Vision ........................................................................................................................................... 13
1.2. Regional Issues and Challenges .................................................................................................. 14
1.2.1. Cost of Energy ..................................................................................................................... 14
1.2.2. Maintenance and Operations ............................................................................................. 14
1.2.3. Inadequate Infrastructure ................................................................................................... 14
1.2.4. Education ............................................................................................................................ 14
1.2.5. Financing ............................................................................................................................. 15
1.2.6. Stakeholder Collaboration .................................................................................................. 15
1.3. Goals ........................................................................................................................................... 15
1.4. Methodology ............................................................................................................................... 16
1.5. Stakeholders ............................................................................................................................... 17
2. Regional Background .......................................................................................................................... 19
2.1. Physical Conditions ..................................................................................................................... 21
2.1.1. Location ............................................................................................................................... 21
2.1.2. Geology ............................................................................................................................... 22
2.1.3. Hydrology ............................................................................................................................ 22
2.1.4. Climate ................................................................................................................................ 22
2.2. Demographics ............................................................................................................................. 24
2.2.1. Current Population .............................................................................................................. 25
2.2.2. Trends ................................................................................................................................. 26
2.2.3. Economy .............................................................................................................................. 29
2.3. Energy Use .................................................................................................................................. 30
2.3.1. Electricity ............................................................................................................................. 30
2.3.2. Propane ............................................................................................................................... 32
viii
2.3.3. Diesel Fuel ........................................................................................................................... 32
2.3.4. Heat ..................................................................................................................................... 34
2.3.5. Transportation Access ......................................................................................................... 34
3. Regional Resources ............................................................................................................................. 36
3.1. Energy Efficiency and Conservation Opportunities .................................................................... 38
3.1.1. Smart Meters ...................................................................................................................... 40
3.1.2. Smart Grids ......................................................................................................................... 41
3.1.3. Weatherization ................................................................................................................... 41
3.1.4. Benchmarking ..................................................................................................................... 42
3.1.5. Water and Sewer Improvements ........................................................................................ 42
3.2. Interties ....................................................................................................................................... 45
3.3. Oil and Gas .................................................................................................................................. 46
3.4. Coal ............................................................................................................................................. 46
3.5. Geothermal ................................................................................................................................. 47
3.6. Hydroelectric ............................................................................................................................... 48
3.7. Biomass ....................................................................................................................................... 49
3.8. Wind ............................................................................................................................................ 51
3.9. Solar ............................................................................................................................................ 53
3.10. Emerging Technology .............................................................................................................. 55
4. Subregional Summaries, Community and Energy Profiles .................................................................. 58
4.1. Upper Kobuk Subregion: Ambler, Kobuk, Shungnak .................................................................. 61
4.1.1. Demographics ..................................................................................................................... 62
4.1.2. Economy .............................................................................................................................. 62
4.1.3. Community Plans ................................................................................................................ 63
4.1.4. Infrastructure ...................................................................................................................... 63
4.1.5. Energy Issues ....................................................................................................................... 64
4.1.6. Energy Improvement Opportunities/Alternatives .............................................................. 65
4.1.7. Priority Energy Actions ........................................................................................................ 66
4.2. Lower Kobuk Subregion: Kiana, Noorvik, Selawik ....................................................................... 81
4.2.1. Demographics ..................................................................................................................... 82
4.2.2. Economy .............................................................................................................................. 82
4.2.3. Community Plans ................................................................................................................ 83
ix
4.2.4. Infrastructure ...................................................................................................................... 83
4.2.5. Energy Issues ....................................................................................................................... 84
4.2.6. Energy Improvement Opportunities/Alternatives .............................................................. 84
4.2.7. Priority Energy Actions ........................................................................................................ 85
4.3. Noatak Valley Subregion: Kivalina & Noatak ............................................................................ 101
4.3.1. Demographics ................................................................................................................... 101
4.3.2. Economy ............................................................................................................................ 102
4.3.3. Community Plans .............................................................................................................. 102
4.3.4. Infrastructure .................................................................................................................... 102
4.3.5. Energy Issues ..................................................................................................................... 103
4.3.6. Energy Improvement Opportunities/Alternatives ............................................................ 105
4.3.7. Priority Energy Actions ...................................................................................................... 106
4.4. Buckland & Deering Subregion ................................................................................................. 117
4.4.1. Demographics ................................................................................................................... 117
4.4.2. Economy ............................................................................................................................ 118
4.4.3. Community Plans .............................................................................................................. 118
4.4.4. Infrastructure .................................................................................................................... 119
4.4.5. Energy Issues ..................................................................................................................... 120
4.4.6. Energy Improvement Opportunities/Alternatives ............................................................ 121
4.4.7. Priority Energy Actions ...................................................................................................... 122
4.5. Kotzebue Subregion ................................................................................................................. 133
4.5.1. Demographics ................................................................................................................... 133
4.5.2. Economy ............................................................................................................................ 134
4.5.3. Community Plans .............................................................................................................. 134
4.5.4. Infrastructure .................................................................................................................... 134
4.5.5. Energy Issues ..................................................................................................................... 135
4.5.6. Energy Improvement Opportunities/Alternatives ............................................................ 136
4.5.7. Priority Energy Actions ...................................................................................................... 137
5. Implementation Plan ........................................................................................................................ 142
5.1. Regional Priorities ..................................................................................................................... 144
x
Exhibits
Exhibit 1: Vision of Local Renewable and Non-Renewable Energy vs. Imported Diesel by Percentage .... 13
Exhibit 2: Timeline ....................................................................................................................................... 17
Exhibit 3: Northwest Arctic Regional Population by Age ............................................................................ 26
Exhibit 4: Population Growth 1970-2010 ................................................................................................... 27
Exhibit 5: Population Change 2000-2010 .................................................................................................... 27
Exhibit 6: Changes in School Population, 2000-2010 .................................................................................. 28
Exhibit 7: Projected Population Growth 2010-2030 ................................................................................... 28
Exhibit 8: Heat Recovery System Illustration .............................................................................................. 43
Exhibit 10: ORC Process .............................................................................................................................. 56
Exhibit 11: WtE Process .............................................................................................................................. 57
Exhibit 12: Upper Kobuk Subregion 20-Year Population Change ............................................................... 62
Exhibit 13: Lower Kobuk Subregion 20-year Population Change ............................................................... 82
Exhibit 14: Noatak Valley Subregion 20-year Population Change ............................................................ 102
Exhibit 15: Buckland/Deering Subregion 20-year Population Change ..................................................... 118
Exhibit 16: Kotzebue Subregion 20-year Population Change ................................................................... 134
Figures
Figure 1: Northwest Arctic Region .............................................................................................................. 21
Figure 2: Potential Coal Resources ............................................................................................................. 47
Figure 3: Map of Hot Springs in Northwest Alaska ..................................................................................... 48
Figure 4: Northwest Arctic Region and Subregions .................................................................................... 60
Figure 5: Upper Kobuk Community Subregion ........................................................................................... 61
Figure 6: Lower Kobuk Subregion ............................................................................................................... 80
Figure 7: Noatak Valley Subregion ............................................................................................................ 100
Figure 8: Buckland/Deering Subregion ..................................................................................................... 116
Figure 9: Kotzebue Subregion ................................................................................................................... 132
Tables
Table 1: Energy Project Priority Summary .................................................................................................... 5
Table 2: 2014 Energy Capital Projects ......................................................................................................... 10
Table 3: Climate Data in the Northwest Arctic ........................................................................................... 23
Table 4: Average Heating Degree Days ....................................................................................................... 24
Table 5: Demographic Statistics for the Northwest Arctic Region ............................................................. 25
Table 6: 2010 Population by Community .................................................................................................... 25
Table 7: 2011 Northwest Arctic Region Workers by Industry..................................................................... 29
Table 8: Power Generation Comparison, FY 2010/11*............................................................................... 31
Table 9: September 2013 Fuel and Power Costs in the Northwest Arctic Region ...................................... 33
Table 10: Fuel Delivery and Costs, September 2013 .................................................................................. 33
Table 11: Regional Entities Serving the Northwest Arctic .......................................................................... 38
Table 12: Average Annual Household Residential Energy Consumption, kWh .......................................... 40
Table 13: Heat Recovery Project Energy Savings ........................................................................................ 44
xi
Table 14: Heat Recovery Studies and Energy Audits .................................................................................. 44
Table 15: Acres per Vegetation Type in Upper Kobuk Valley ..................................................................... 49
Table 16: Northwest Arctic Region Community Wind Power Class Ratings ............................................... 52
Table 17: Energy Produced: Ambler Water Plan Solar Array ...................................................................... 54
Table 18: Solar array data from five villages, June 2, 2014 ........................................................................ 55
Table 19: Northwest Arctic Region Community Solar Installation ............................................................. 55
Table 20: Upper Kobuk Local and Regional Contacts ................................................................................. 62
Table 21: Upper Kobuk Subregion Quick Facts ........................................................................................... 63
Table 22: Upper Kobuk Subregion Energy Improvement Opportunities .................................................... 65
Table 23: Upper Kobuk Subregion Priority Energy Actions......................................................................... 66
Table 24: Lower Kobuk Local and Regional Contacts.................................................................................. 81
Table 25: Lower Kobuk Subregion Quick Facts ........................................................................................... 84
Table 26: Lower Kobuk Energy Improvement Opportunities ..................................................................... 85
Table 27: Lower Kobuk Subregion Priority Energy Actions ......................................................................... 86
Table 28: Noatak Valley Local and Regional Contacts .............................................................................. 101
Table 29: Noatak Valley Subregion Quick Facts ........................................................................................ 103
Table 30: Noatak Valley Energy Improvement Opportunities .................................................................. 105
Table 31: Noatak Valley Subregion Priority Energy Actions ..................................................................... 106
Table 32: Buckland/Deering Local and Regional Contacts ........................................................................ 117
Table 33: Buckland/Deering Subregion Quick Facts ................................................................................. 120
Table 34: Buckland/Deering Energy Improvement Opportunities ........................................................... 121
Table 35: Buckland/Deering Subregion Priority Energy Actions ............................................................... 122
Table 36: Kotzebue Local and Regional Contacts ..................................................................................... 133
Table 37: Kotzebue Quick Facts ................................................................................................................ 135
Table 38: Kotzebue Energy Improvement Opportunities ......................................................................... 136
Table 39: Kotzebue Subregion Priority Energy Actions ............................................................................ 137
Table 40: Short Term Priority Energy Actions for the Northwest Arctic Region....................................... 145
Table 41: Medium and Long Term Priority Energy Actions for the Northwest Arctic Region .................. 152
Appendices
A. Funding Opportunities for Energy Projects

xii
1
Executive Summary
EXECUTIVE SUMMARY

2
This section provides a
condensed version of the
Northwest Arctic Energy
Plan
EXECUTIVE SUMMARY
3
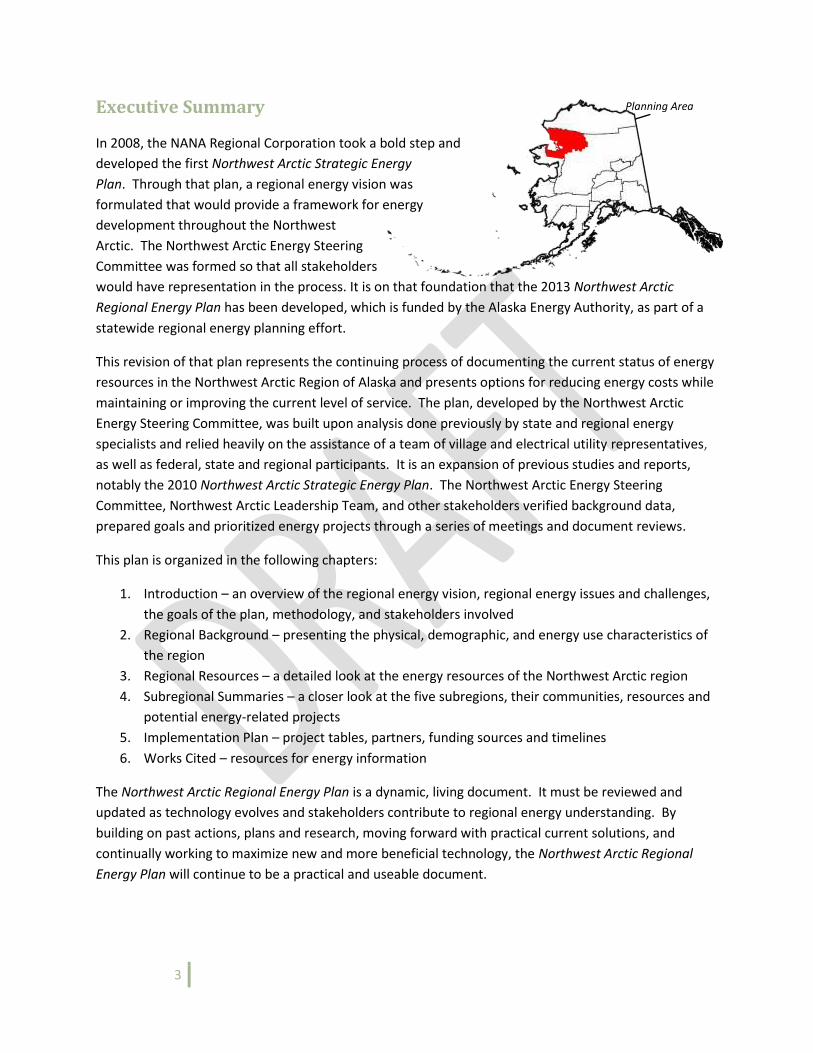
Executive Summary
In 2008, the NANA Regional Corporation took a bold step and
developed the first Northwest Arctic Strategic Energy
Plan. Through that plan, a regional energy vision was
formulated that would provide a framework for energy
development throughout the Northwest
Arctic. The Northwest Arctic Energy Steering
Committee was formed so that all stakeholders
would have representation in the process. It is on that foundation that the 2013 Northwest Arctic
Regional Energy Plan has been developed, which is funded by the Alaska Energy Authority, as part of a
statewide regional energy planning effort.
This revision of that plan represents the continuing process of documenting the current status of energy
resources in the Northwest Arctic Region of Alaska and presents options for reducing energy costs while
maintaining or improving the current level of service. The plan, developed by the Northwest Arctic
Energy Steering Committee, was built upon analysis done previously by state and regional energy
specialists and relied heavily on the assistance of a team of village and electrical utility representatives,
as well as federal, state and regional participants. It is an expansion of previous studies and reports,
notably the 2010 Northwest Arctic Strategic Energy Plan. The Northwest Arctic Energy Steering
Committee, Northwest Arctic Leadership Team, and other stakeholders verified background data,
prepared goals and prioritized energy projects through a series of meetings and document reviews.
This plan is organized in the following chapters:
1. Introduction – an overview of the regional energy vision, regional energy issues and challenges,
the goals of the plan, methodology, and stakeholders involved
2. Regional Background – presenting the physical, demographic, and energy use characteristics of
the region
3. Regional Resources – a detailed look at the energy resources of the Northwest Arctic region
4. Subregional Summaries – a closer look at the five subregions, their communities, resources and
potential energy-related projects
5. Implementation Plan – project tables, partners, funding sources and timelines
6. Works Cited – resources for energy information
The Northwest Arctic Regional Energy Plan is a dynamic, living document. It must be reviewed and
updated as technology evolves and stakeholders contribute to regional energy understanding. By
building on past actions, plans and research, moving forward with practical current solutions, and
continually working to maximize new and more beneficial technology, the Northwest Arctic Regional
Energy Plan will continue to be a practical and useable document.
Planning Area
4
Funding is always a critical aspect in accomplishing a project. An additional benefit of the plan is that it
can be used to support grant applications and to show community and regional support for energy
projects.
Current Conditions Alaska's Northwest Arctic villages’ energy prices are much higher than the national average and among
the highest in Alaska. Residents purchase diesel fuel – the primary heat source – for an average of
about $9.00 per gallon, according to the Northwest Arctic Borough. With the soaring cost of energy,
many villagers find themselves in a position of having to choose between heating their homes and
feeding their families.
The leadership in the region has been proactive in seeking alternative sources of energy and formed an
energy steering committee which has been active since 2008. Northwest Alaska has many options when
it comes to producing renewable energy including wind, biomass (wood), solar, hydroelectric and
geothermal potential. The region’s leaders are working together with state and federal organizations to
explore and develop alternative sources of energy to reduce the energy costs in the Northwest Arctic
(NRC, 2010).
Vision The vision is for the Northwest Arctic region to be 50 percent reliant on regionally available energy
sources, both renewable and non-renewable, for heating and generation purposes by the year 2050.
The progression is planned as follows:
10 percent decrease of imported diesel fuels by 2020
25 percent decrease of imported transportation diesel fuels by 2030
50 percent decrease of imported diesel fuels by 2050
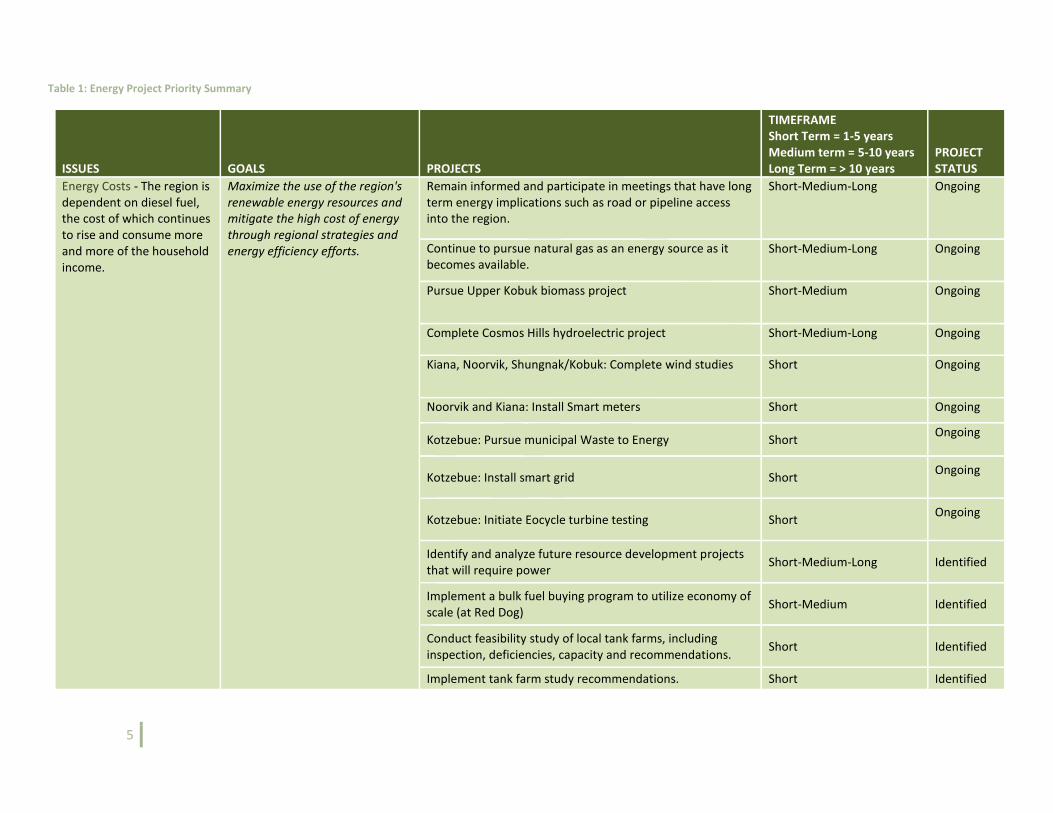
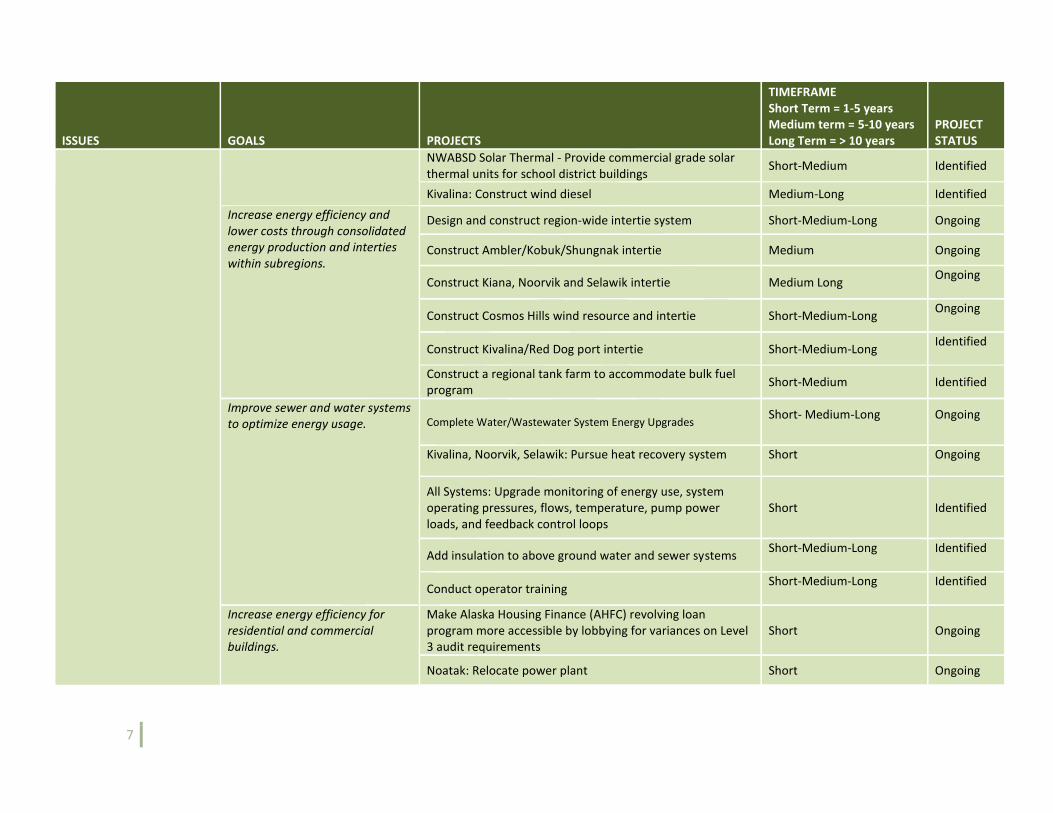
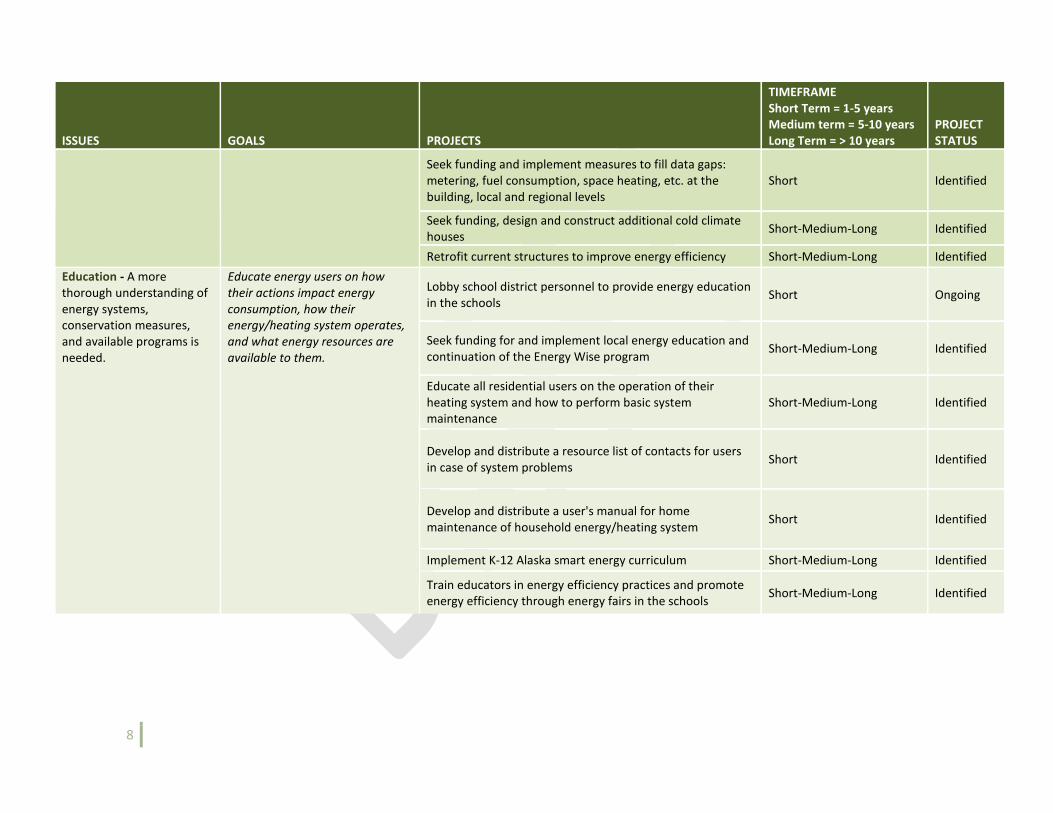
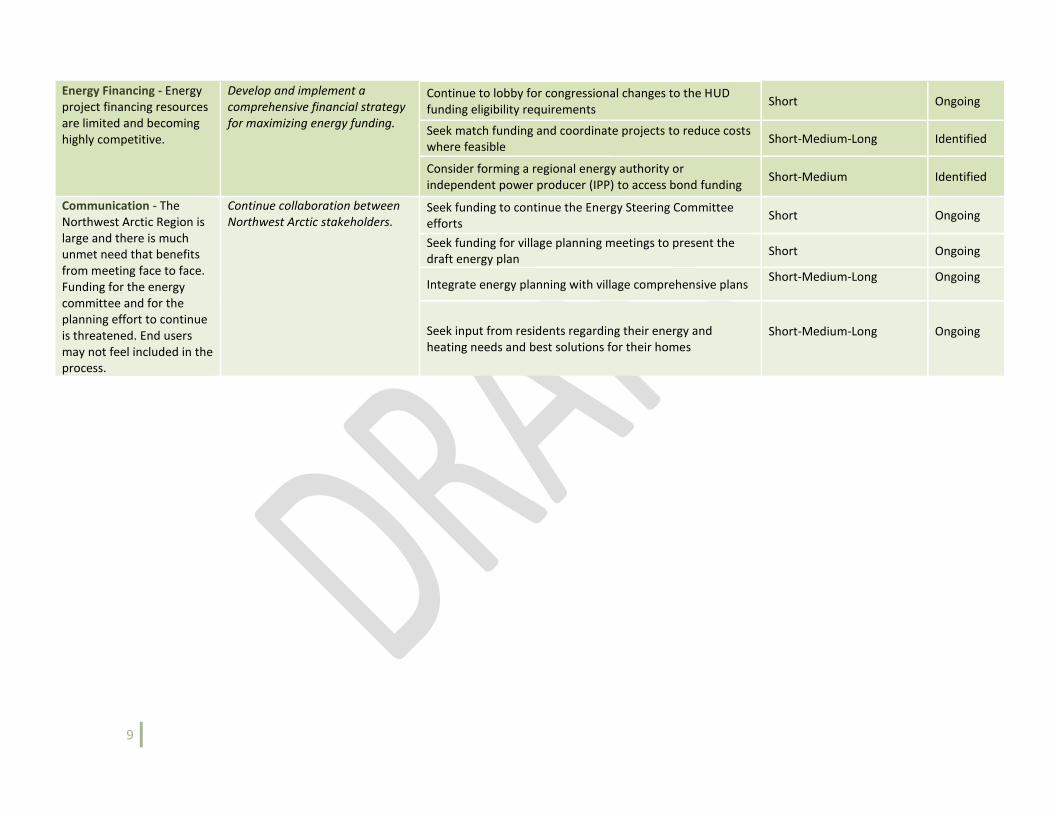
Issues, Goals and Recommendation Table 1 summarizes the issues and goals that drive energy planning in the Northwest Arctic, as well as
the proposed projects and timeframe for action related to them. The projects include both ongoing
projects and those that have been identified by the Energy Steering committee or stakeholders.
Identified projects are not yet funded and additional investigation and planning may be needed before
they can be advanced. A more detailed list of projects is available in Table 40: Short Term Priority
Energy Actions for the Northwest Arctic Region and Table 41: Medium and Long Term Priority Energy
Actions for the Northwest Arctic Region.
5
Table 1: Energy Project Priority Summary
ISSUES GOALS PROJECTS
TIMEFRAME Short Term = 1-5 years Medium term = 5-10 years Long Term = > 10 years
PROJECT STATUS
Energy Costs - The region is dependent on diesel fuel, the cost of which continues to rise and consume more and more of the household income.
Maximize the use of the region's renewable energy resources and mitigate the high cost of energy through regional strategies and energy efficiency efforts.
Remain informed and participate in meetings that have long term energy implications such as road or pipeline access into the region.
Short-Medium-Long Ongoing
Continue to pursue natural gas as an energy source as it becomes available.
Short-Medium-Long Ongoing
Pursue Upper Kobuk biomass project Short-Medium Ongoing
Complete Cosmos Hills hydroelectric project Short-Medium-Long Ongoing
Kiana, Noorvik, Shungnak/Kobuk: Complete wind studies Short Ongoing
Noorvik and Kiana: Install Smart meters Short Ongoing
Kotzebue: Pursue municipal Waste to Energy Short Ongoing
Kotzebue: Install smart grid Short Ongoing
Kotzebue: Initiate Eocycle turbine testing Short Ongoing
Identify and analyze future resource development projects that will require power
Short-Medium-Long Identified
Implement a bulk fuel buying program to utilize economy of scale (at Red Dog)
Short-Medium Identified
Conduct feasibility study of local tank farms, including inspection, deficiencies, capacity and recommendations.
Short Identified
Implement tank farm study recommendations. Short Identified
6
ISSUES GOALS PROJECTS
TIMEFRAME Short Term = 1-5 years Medium term = 5-10 years Long Term = > 10 years
PROJECT STATUS
Kotzebue: Complete hydrokinetic study (tidal device in trench – estimated cost $150,000)
Short-Medium Identified
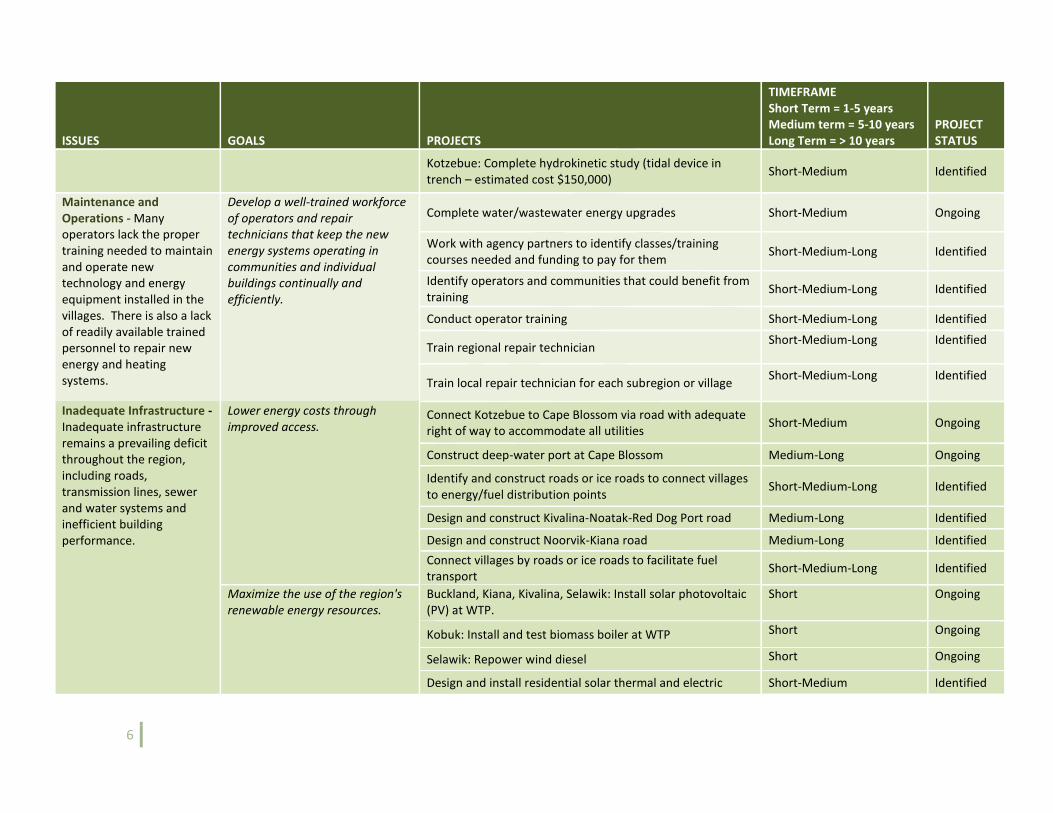
Maintenance and Operations - Many operators lack the proper training needed to maintain and operate new technology and energy equipment installed in the villages. There is also a lack of readily available trained personnel to repair new energy and heating systems.
Develop a well-trained workforce of operators and repair technicians that keep the new energy systems operating in communities and individual buildings continually and efficiently.
Complete water/wastewater energy upgrades Short-Medium Ongoing
Work with agency partners to identify classes/training courses needed and funding to pay for them
Short-Medium-Long Identified
Identify operators and communities that could benefit from training
Short-Medium-Long Identified
Conduct operator training Short-Medium-Long Identified
Train regional repair technician Short-Medium-Long Identified
Train local repair technician for each subregion or village Short-Medium-Long Identified
Inadequate Infrastructure - Inadequate infrastructure remains a prevailing deficit throughout the region, including roads, transmission lines, sewer and water systems and inefficient building performance.
Lower energy costs through improved access.
Connect Kotzebue to Cape Blossom via road with adequate right of way to accommodate all utilities
Short-Medium Ongoing
Construct deep-water port at Cape Blossom Medium-Long Ongoing
Identify and construct roads or ice roads to connect villages to energy/fuel distribution points
Short-Medium-Long Identified
Design and construct Kivalina-Noatak-Red Dog Port road Medium-Long Identified
Design and construct Noorvik-Kiana road Medium-Long Identified
Connect villages by roads or ice roads to facilitate fuel transport
Short-Medium-Long Identified
Maximize the use of the region's renewable energy resources.
Buckland, Kiana, Kivalina, Selawik: Install solar photovoltaic (PV) at WTP.
Short Ongoing
Kobuk: Install and test biomass boiler at WTP Short Ongoing
Selawik: Repower wind diesel Short Ongoing
Design and install residential solar thermal and electric Short-Medium Identified
7
ISSUES GOALS PROJECTS
TIMEFRAME Short Term = 1-5 years Medium term = 5-10 years Long Term = > 10 years
PROJECT STATUS
NWABSD Solar Thermal - Provide commercial grade solar thermal units for school district buildings
Short-Medium Identified
Kivalina: Construct wind diesel Medium-Long Identified
Increase energy efficiency and lower costs through consolidated energy production and interties within subregions.
Design and construct region-wide intertie system Short-Medium-Long Ongoing
Construct Ambler/Kobuk/Shungnak intertie Medium Ongoing
Construct Kiana, Noorvik and Selawik intertie Medium Long Ongoing
Construct Cosmos Hills wind resource and intertie Short-Medium-Long Ongoing
Construct Kivalina/Red Dog port intertie Short-Medium-Long Identified
Construct a regional tank farm to accommodate bulk fuel program
Short-Medium Identified
Improve sewer and water systems to optimize energy usage. Complete Water/Wastewater System Energy Upgrades
Short- Medium-Long Ongoing
Kivalina, Noorvik, Selawik: Pursue heat recovery system Short Ongoing
All Systems: Upgrade monitoring of energy use, system operating pressures, flows, temperature, pump power loads, and feedback control loops
Short Identified
Add insulation to above ground water and sewer systems Short-Medium-Long Identified
Conduct operator training Short-Medium-Long Identified
Increase energy efficiency for residential and commercial buildings.
Make Alaska Housing Finance (AHFC) revolving loan program more accessible by lobbying for variances on Level 3 audit requirements
Short Ongoing
Noatak: Relocate power plant Short Ongoing
8
ISSUES GOALS PROJECTS
TIMEFRAME Short Term = 1-5 years Medium term = 5-10 years Long Term = > 10 years
PROJECT STATUS
Seek funding and implement measures to fill data gaps: metering, fuel consumption, space heating, etc. at the building, local and regional levels
Short Identified
Seek funding, design and construct additional cold climate houses
Short-Medium-Long Identified
Retrofit current structures to improve energy efficiency Short-Medium-Long Identified
Education - A more thorough understanding of energy systems, conservation measures, and available programs is needed.
Educate energy users on how their actions impact energy consumption, how their energy/heating system operates, and what energy resources are available to them.
Lobby school district personnel to provide energy education in the schools
Short Ongoing
Seek funding for and implement local energy education and continuation of the Energy Wise program
Short-Medium-Long Identified
Educate all residential users on the operation of their heating system and how to perform basic system maintenance
Short-Medium-Long Identified
Develop and distribute a resource list of contacts for users in case of system problems
Short Identified
Develop and distribute a user's manual for home maintenance of household energy/heating system
Short Identified
Implement K-12 Alaska smart energy curriculum Short-Medium-Long Identified
Train educators in energy efficiency practices and promote energy efficiency through energy fairs in the schools
Short-Medium-Long Identified
9
Energy Financing - Energy project financing resources are limited and becoming highly competitive.
Develop and implement a comprehensive financial strategy for maximizing energy funding.
Continue to lobby for congressional changes to the HUD funding eligibility requirements
Short Ongoing
Seek match funding and coordinate projects to reduce costs where feasible
Short-Medium-Long Identified
Consider forming a regional energy authority or independent power producer (IPP) to access bond funding
Short-Medium Identified
Communication - The Northwest Arctic Region is large and there is much unmet need that benefits from meeting face to face. Funding for the energy committee and for the planning effort to continue is threatened. End users may not feel included in the process.
Continue collaboration between Northwest Arctic stakeholders.
Seek funding to continue the Energy Steering Committee efforts
Short Ongoing
Seek funding for village planning meetings to present the draft energy plan
Short Ongoing
Integrate energy planning with village comprehensive plans Short-Medium-Long Ongoing
Seek input from residents regarding their energy and heating needs and best solutions for their homes
Short-Medium-Long Ongoing
10
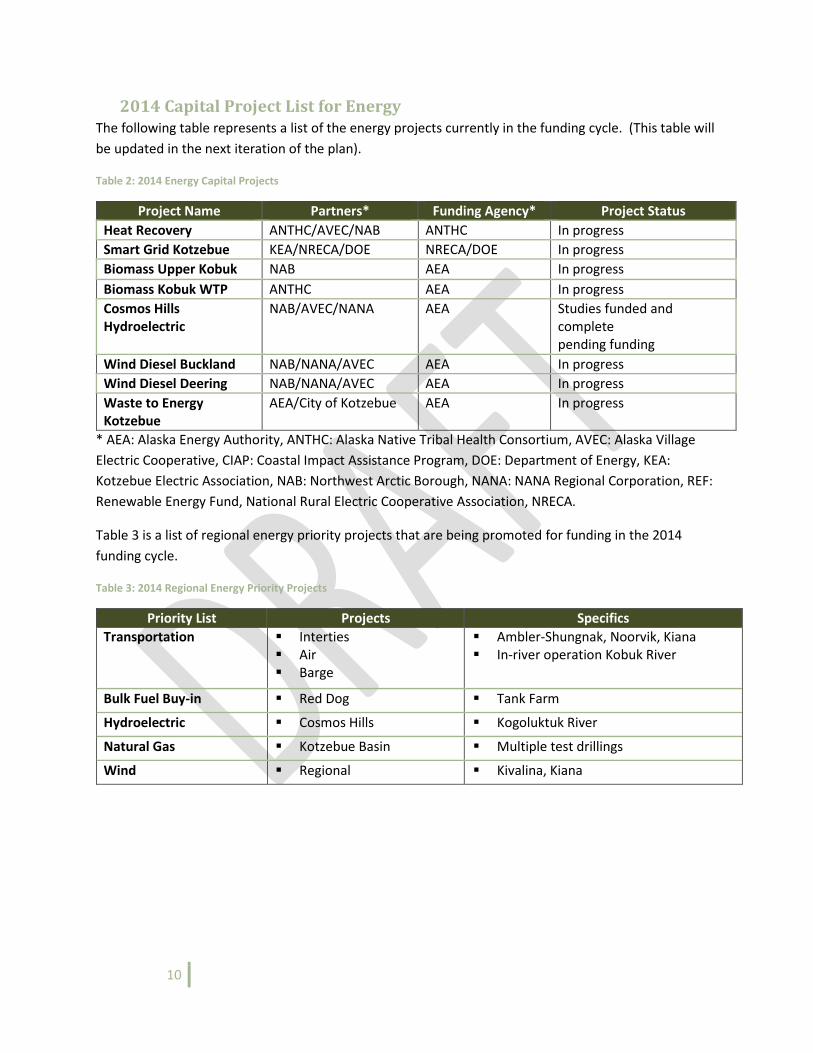
2014 Capital Project List for Energy The following table represents a list of the energy projects currently in the funding cycle. (This table will
be updated in the next iteration of the plan).
Table 2: 2014 Energy Capital Projects
Project Name Partners* Funding Agency* Project Status
Heat Recovery ANTHC/AVEC/NAB ANTHC In progress
Smart Grid Kotzebue KEA/NRECA/DOE NRECA/DOE In progress
Biomass Upper Kobuk NAB AEA In progress
Biomass Kobuk WTP ANTHC AEA In progress
Cosmos Hills Hydroelectric
NAB/AVEC/NANA AEA Studies funded and complete pending funding
Wind Diesel Buckland NAB/NANA/AVEC AEA In progress
Wind Diesel Deering NAB/NANA/AVEC AEA In progress
Waste to Energy Kotzebue
AEA/City of Kotzebue AEA In progress
* AEA: Alaska Energy Authority, ANTHC: Alaska Native Tribal Health Consortium, AVEC: Alaska Village
Electric Cooperative, CIAP: Coastal Impact Assistance Program, DOE: Department of Energy, KEA:
Kotzebue Electric Association, NAB: Northwest Arctic Borough, NANA: NANA Regional Corporation, REF:
Renewable Energy Fund, National Rural Electric Cooperative Association, NRECA.
Table 3 is a list of regional energy priority projects that are being promoted for funding in the 2014
funding cycle.
Table 3: 2014 Regional Energy Priority Projects
Priority List Projects Specifics
Transportation Interties Air Barge
Ambler-Shungnak, Noorvik, Kiana In-river operation Kobuk River
Bulk Fuel Buy-in Red Dog Tank Farm
Hydroelectric Cosmos Hills Kogoluktuk River
Natural Gas Kotzebue Basin Multiple test drillings
Wind Regional Kivalina, Kiana
11
1. Introduction
INTRODUCTION

12
This chapter introduces the plan, describes what it is and what it is not, outlines the methodology, presents the plan organization and summarizes the energy issues and goals.
INTRODUCTION
13
1. Introduction
The Northwest Arctic Borough (NAB) worked with the Northwest Arctic Energy Steering Committee and
WHPacific to develop this document to serve as the foundation of the Northwest Arctic regional energy
strategy. It builds upon previous studies and reports, notably the 2010 Northwest Arctic Strategic
Energy Plan, and is intended to facilitate improved planning, coordination and implementation of energy
strategies in the region, focusing on new energy sources and savings through efficiency. Once again, the
Northwest Arctic Energy Steering Committee and the Northwest Arctic Leadership Team were very
involved in the planning process, as they were for the 2010 Northwest Arctic Strategic Energy Plan.
These two groups and other stakeholders verified background data, prepared goals and prioritized
energy projects through a series of meetings and document reviews. The revision of the plan was
funded by the Alaska Energy Authority as part of a statewide regional planning effort.
The Northwest Arctic Regional Energy Plan is a dynamic, living document. It must be reviewed and
updated as technology evolves and stakeholders contribute to regional energy understanding. By
building on past actions, plans and research; moving forward with practical current solutions; and
continually working to maximize new and more beneficial technology, the Northwest Arctic Regional
Energy Plan will continue to be a practical and useable document.
By providing information to prioritize local and regional energy projects, this report will assist
stakeholders in choosing the best options for maximum benefit with limited available funding. An
additional benefit of the plan is that it can be used to support grant applications and to show community
and regional support for energy projects.
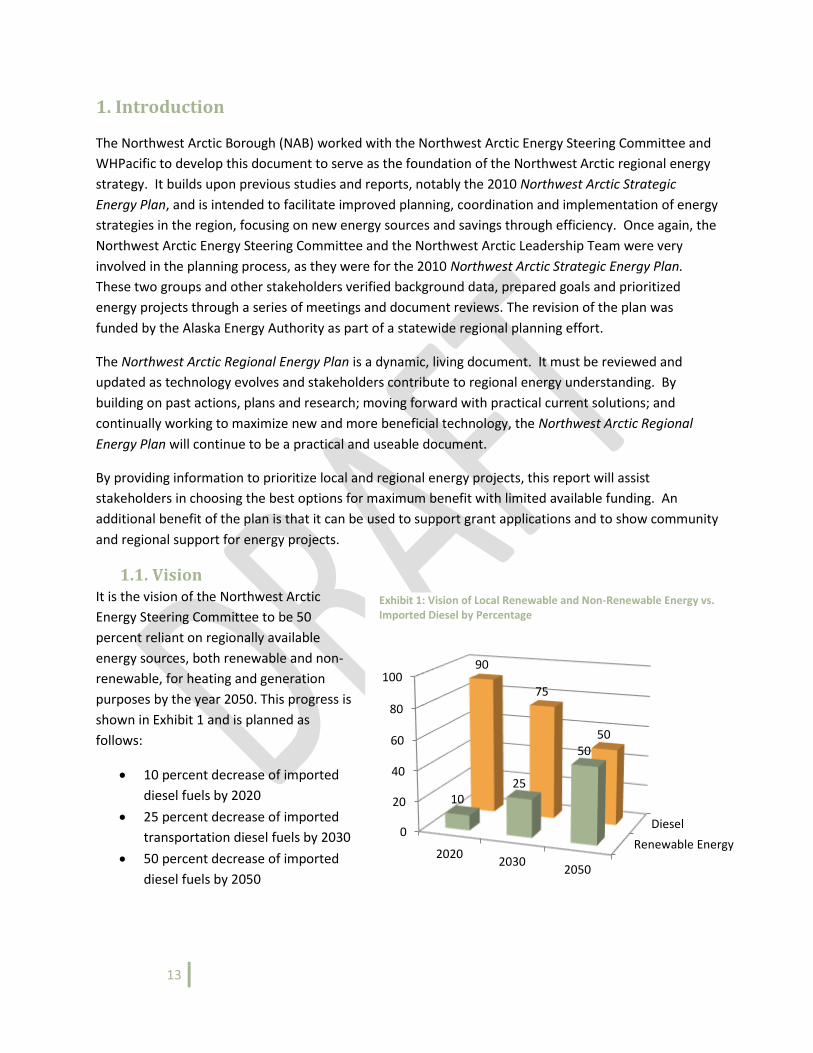
1.1. Vision It is the vision of the Northwest Arctic
Energy Steering Committee to be 50
percent reliant on regionally available
energy sources, both renewable and non-
renewable, for heating and generation
purposes by the year 2050. This progress is
shown in Exhibit 1 and is planned as
follows:
10 percent decrease of imported
diesel fuels by 2020
25 percent decrease of imported
transportation diesel fuels by 2030
50 percent decrease of imported
diesel fuels by 2050
Renewable Energy
Diesel0
20
40
60
80
100
20202030
2050
1025
50
90
75
50
Exhibit 1: Vision of Local Renewable and Non-Renewable Energy vs. Imported Diesel by Percentage
14
1.2. Regional Issues and Challenges Below is a summary of the primary issues discussed at the energy steering committee meetings and with
stakeholders.
1.2.1. Cost of Energy
As is the case throughout Alaska, the Northwest Arctic Region is heavily reliant on diesel fuels for
energy. The high cost of imported fuel creates a severe hardship in the Northwest Arctic communities,
where home heating fuel costs on average $6.26 per gallon. (DCEED, July 2014). The result is that, at
times, residents must choose between heating their homes and other necessities such as food for their
families. The high cost of energy in the Northwest Arctic is one of the leading threats to the long term
sustainability and well-being of the region (NWALT, 2010).
The skyrocketing cost of energy in the region is not expected to subside and in fact, the costs remain
unstable and continue to rise. Individual households in the region struggle directly with their ability to
pay for utilities, particularly for heating fuel. While utilities have begun to bring renewable energy
sources on line, the cost of energy per household has not seen any demonstrable reduction. Recent
energy efficiency projects such as energy education and installation of energy TED meters have proven
to provide the most immediate and effective way to reduce household energy use.
1.2.2. Maintenance and Operations
As new systems come on-line, operators need a new set of skills to properly maintain and operate the
systems. Many operators lack the proper training needed to maintain and operate new technology and
energy equipment installed in the villages. Employee turnover and lack of training in effective energy
maintenance, operation and management result in inefficient and costly energy systems. There is an
absence of current “best practices” for efficiently operating energy systems in rural Alaska.
There are no trained service personnel readily available to work on home heating/energy systems that
malfunction and in some cases, secondary heat sources have been removed, leaving residents with no
source of heat.
1.2.3. Inadequate Infrastructure
Inadequate infrastructure remains a prevailing deficit throughout the region, including bulk fuel storage,
power generation (renewable, alternative, diesel), roads, transmission lines, sewer and water systems
and inefficient building performance. Overland transportation infrastructure to deliver fuel, goods,
people, and building materials is absent, resulting in high energy costs. Aged infrastructure, deferred
maintenance, construction without concern for energy use, antiquated technologies, shrinking
subsidies, extreme construction costs and other conditions contribute to high energy use and delivery
costs in the Northwest Arctic Region.
1.2.4. Education
A more thorough understanding of energy systems, conservation measures, and available programs is
needed. Users are sometimes at a loss as to how the new technology in their homes works. They fear
inadvertently damaging the system and may indeed do so. Additionally, tinkering with high tech
products can void the manufacturer’s warranty. Energy curricula are available for classroom use, but
15
have not been utilized. The many programs and their eligibility requirements for dealing with energy
conservation and power can be confusing to residents.
1.2.5. Financing
Project financing resources are limited and requirements defined and often limiting. AEA remains a
source for many energy infrastructure projects, but with the state’s current budget issues funding is not
expected to remain stable.
Likewise, the Alaska Industrial Development and Export Authority (AIDEA) provides development
funding from the state to increase economic growth and diversity in Alaska. AIDEA supports projects
that develop Alaska’s natural resources, establish and expand manufacturing, industrial, energy, export,
small business, and business enterprises, through a variety of financing and loan programs.
Frequently, funding is allocated by agencies on the basis of a cost-benefit ratio, which causes larger
communities to receive more than smaller more rural villages. As a result of these projects, energy costs
can be reduced in larger cities, which can cause more people to move to larger communities. Although
population is denser in cities, the Northwest Arctic’s subsistence and economic resources are dispersed
throughout the region. It is, therefore, important that regional stakeholders and planners carefully
prioritize projects to best foster the sustainability of all of the villages as the Northwest Arctic Region
works toward self-sufficiency. By coordination and cooperation, the Northwest Arctic Region’s villages
may be able to tap into the economies of scale and develop projects that benefit multiple villages at a
lower cost per person.
1.2.6. Stakeholder Collaboration
The Northwest Arctic Region is large and there is much unmet need that benefits from meeting face to
face. Funding for the energy committee and for the planning effort to continue is threatened. End users
do not always feel included in the process, allowing critical information to be missed.
1.3. Goals Residents in the Northwest Arctic Region recognize that fossil fuels will eventually be depleted and the
communities must seek to be self-reliant and sustainable. To this end, the people of the Northwest
Arctic want to explore and use energy resources within the region, retaining imported diesel fuel as a
backup power source only.
Stakeholders in the region have been proactive in developing alternative energy that will, over time,
allow them to reduce their dependence on imported fuels. Only by widespread understanding of the
energy options and a strong commitment on the part of all stakeholders can the Region move forward
toward a comprehensive and implementable energy strategy. Individual residents as well as
governmental entities and agencies must all be willing to work together to promote energy efficiency
and the use of alternative fuel sources.
Energy conservation and end-use energy efficiency initiatives are needed to more effectively utilize all
forms of energy in Northwest Alaska, regardless of source. A leading approach is to promote energy
efficiency. By doing so, energy-related costs and utility solvency will be addressed.
16
To meet the needs identified in the issues listed in section 1.2, the stakeholders of the Northwest Arctic
region developed the following goals:
Maximize the use of the region's renewable energy resources and mitigate the high cost of
energy through regional strategies and energy efficiency efforts.
Develop a well-trained workforce of operators and repair technicians that keep the new energy
systems operating in communities and individual buildings continually and efficiently.
Lower energy costs through improved access.
Increase energy efficiency and lower costs through consolidated energy production and interties
within subregions where appropriate.
Improve sewer and water systems to optimize energy usage.
Increase energy efficiency for residential and commercial buildings.
Educate energy users on how their actions impact energy consumption, how their
energy/heating system operates, and what energy resources are available to them.
Develop and implement a comprehensive financial strategy for maximizing energy funding.
Continue collaboration between Northwest Arctic stakeholders.
The Northwest Arctic Regional Energy Plan is a living document. It must be reviewed and updated as
technology evolves and stakeholders contribute to regional energy understanding. By building on past
actions, plans and research, moving forward with practical current solutions, and continually working to
maximize new and more beneficial technology, the Northwest Arctic Regional Energy Plan will continue
to be a practical and useable document.
1.4. Methodology This report follows the AEA recommended regional methodology outline and is organized according to
the tasks outlined in the approved scope. Specifically, the report presents a summary of local and
regional conditions, energy use, and priority energy projects in communities within the Northwest Arctic
Region. Projects include those focused on energy efficiency and alternative energy options. The top
priority projects were ranked using the methodology developed by AEA and tailored for the region.
The data collected for this report was gathered from existing data in published reports including the
2010 Northwest Arctic Strategic Energy Plan, Alaska Energy Authority Energy Pathways and End Use
Survey, the AHFC Alaska Retrofit Information System (ARIS), Alaska Home Energy Rebate Program,
Power Cost Equalization Reports, Department of Community and Economic Development (DCCED)
Alaska Fuel Price Report, Institute of Social and Economic Research (ISER) information and data collected
by numerous stakeholders.
The plan is developed in two phases with the first phase resulting in a draft document that energy
specialists presented in meetings throughout the region in phase two. To complete the analysis, the
report consisted of three simultaneous activity tracks including planning, community and stakeholder
involvement, and preparation of deliverables. Throughout the process, stakeholder input was solicited
and the project team and AEA staff met to discuss progress. The Northwest Arctic Borough contracted
17
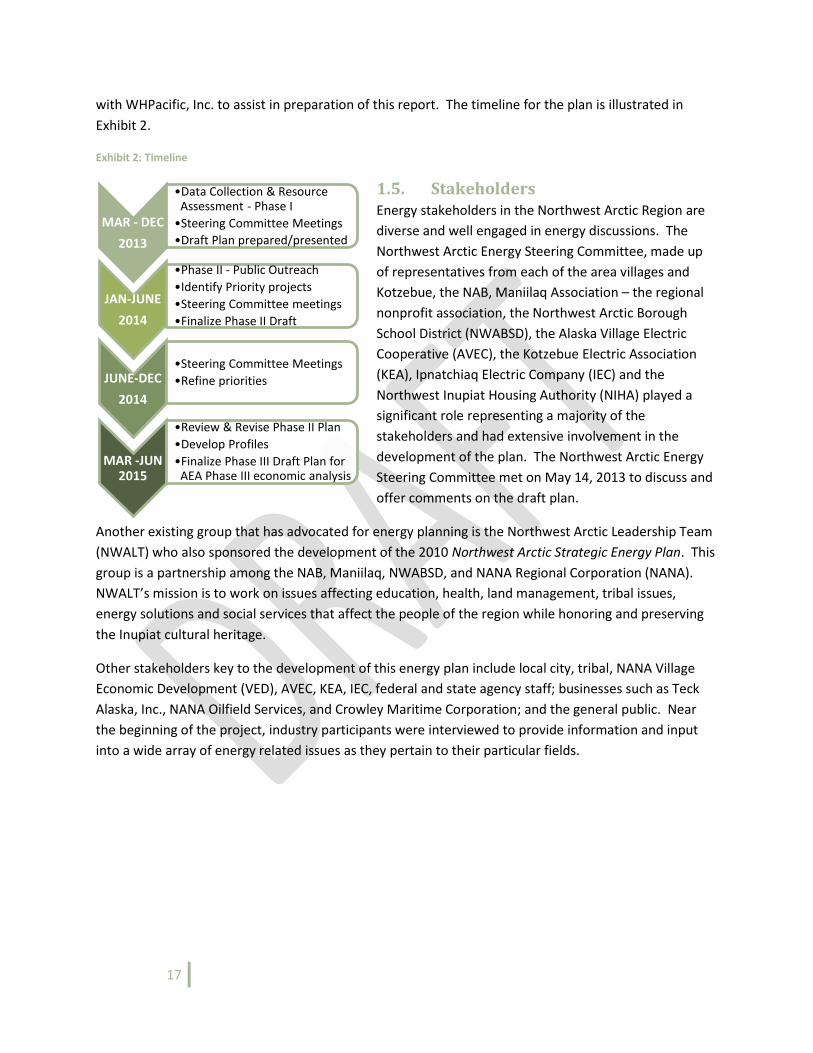
with WHPacific, Inc. to assist in preparation of this report. The timeline for the plan is illustrated in
Exhibit 2.
Exhibit 2: Timeline
1.5. Stakeholders Energy stakeholders in the Northwest Arctic Region are
diverse and well engaged in energy discussions. The
Northwest Arctic Energy Steering Committee, made up
of representatives from each of the area villages and
Kotzebue, the NAB, Maniilaq Association – the regional
nonprofit association, the Northwest Arctic Borough
School District (NWABSD), the Alaska Village Electric
Cooperative (AVEC), the Kotzebue Electric Association
(KEA), Ipnatchiaq Electric Company (IEC) and the
Northwest Inupiat Housing Authority (NIHA) played a
significant role representing a majority of the
stakeholders and had extensive involvement in the
development of the plan. The Northwest Arctic Energy
Steering Committee met on May 14, 2013 to discuss and
offer comments on the draft plan.
Another existing group that has advocated for energy planning is the Northwest Arctic Leadership Team
(NWALT) who also sponsored the development of the 2010 Northwest Arctic Strategic Energy Plan. This
group is a partnership among the NAB, Maniilaq, NWABSD, and NANA Regional Corporation (NANA).
NWALT’s mission is to work on issues affecting education, health, land management, tribal issues,
energy solutions and social services that affect the people of the region while honoring and preserving
the Inupiat cultural heritage.
Other stakeholders key to the development of this energy plan include local city, tribal, NANA Village
Economic Development (VED), AVEC, KEA, IEC, federal and state agency staff; businesses such as Teck
Alaska, Inc., NANA Oilfield Services, and Crowley Maritime Corporation; and the general public. Near
the beginning of the project, industry participants were interviewed to provide information and input
into a wide array of energy related issues as they pertain to their particular fields.
MAR - DEC
2013
•Data Collection & Resource Assessment - Phase I
•Steering Committee Meetings
•Draft Plan prepared/presented
JAN-JUNE
2014
•Phase II - Public Outreach
•Identify Priority projects
•Steering Committee meetings
•Finalize Phase II Draft
JUNE-DEC
2014
•Steering Committee Meetings
•Refine priorities
MAR -JUN 2015
•Review & Revise Phase II Plan
•Develop Profiles
•Finalize Phase III Draft Plan for AEA Phase III economic analysis

18
19
2. Regional Background
REGIONAL BACKGROUND

20
This chapter summarizes relevant physical, demographics and energy use characteristics of the Northwest Arctic region.
REGIONAL BACKGROUND
21
2. Regional Background
This section provides regional background information and describes current energy supply and demand
benchmarks and projects for the region and individual communities.
2.1. Physical Conditions
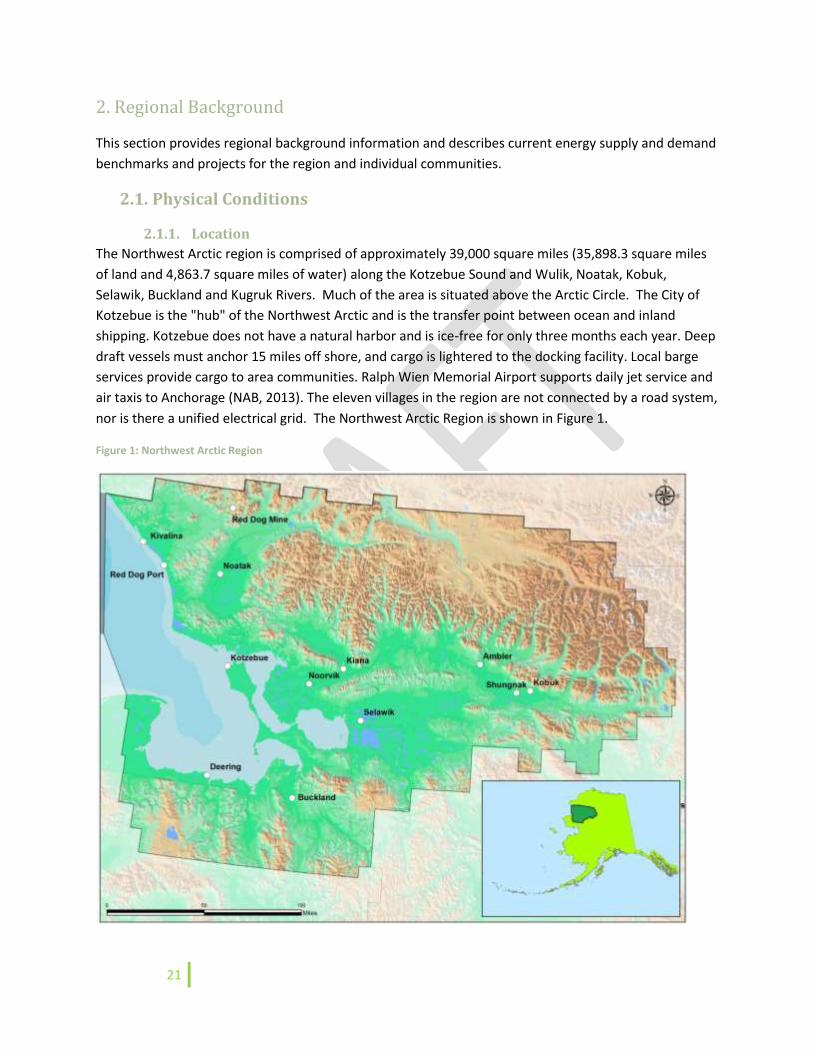
2.1.1. Location
The Northwest Arctic region is comprised of approximately 39,000 square miles (35,898.3 square miles
of land and 4,863.7 square miles of water) along the Kotzebue Sound and Wulik, Noatak, Kobuk,
Selawik, Buckland and Kugruk Rivers. Much of the area is situated above the Arctic Circle. The City of
Kotzebue is the "hub" of the Northwest Arctic and is the transfer point between ocean and inland
shipping. Kotzebue does not have a natural harbor and is ice-free for only three months each year. Deep
draft vessels must anchor 15 miles off shore, and cargo is lightered to the docking facility. Local barge
services provide cargo to area communities. Ralph Wien Memorial Airport supports daily jet service and
air taxis to Anchorage (NAB, 2013). The eleven villages in the region are not connected by a road system,
nor is there a unified electrical grid. The Northwest Arctic Region is shown in Figure 1.
Figure 1: Northwest Arctic Region
22
2.1.2. Geology
The geology of the Northwest Arctic region is dominated by the Brooks Range fold-and-thrust belt to the
north and the Yukon-Koyukuk basin to the south. The Brooks Range, like most of the North American
Cordillera, formed during a compressional tectonic event during Jurassic-Cretaceous time
(approximately 100-200 million years ago). This compressional event thrust older Paleozoic rocks over
younger rocks to the north, creating the Brooks Range and the North Slope foreland basin. These
Paleozoic rocks contain the zinc-lead-silver deposits at the Red Dog mine and the copper deposits at
Bornite in the upper Kobuk River. Crustal extension occurred in the south part of the NANA region
forming the Cretaceous Yukon-Koyukuk basin. This basin is represented by a thick package of
Cretaceous marine and non-marine sedimentary rocks and includes some coal-bearing strata. Extension
continued with the opening of the Kotzebue basin in Tertiary time (40-50 million years ago). At around
the same time, large volumes of basaltic lava poured onto the southern NANA region on the Seward
Peninsula up until at least 5 million years ago. During the Pleistocene glaciation, large glaciers flowed
out of the Brooks Range, scouring out valleys and depositing sand and gravel through the major river
valleys. Large volumes of wind-blown sand and silt covered the region adjacent to the glacial sediment
(Kobuk Sand Dunes) and the major rivers continued to rework these sediments as the ice receded,
forming more modern features like the Kobuk delta.
The Red Dog Mine, near Kivalina, is one of the largest lead and zinc mines in North America. Areas near
the Baird Mountains may contain copper, gold, lead and zinc.
2.1.3. Hydrology
Hydrology in the Northwest Arctic consists of streams and rivers that flow westward into Kotzebue
Sound. The principal rivers are the Kobuk and Noatak Rivers, each of which drains an area of about
12,000 square miles. Selawik Lake, a tidal, saline lake is the largest in the region. The Noatak National
Park and Preserve protects the largest pristine river basin in the United States; in 1976 it was designated
as an International Biosphere Reserve by the United Nations Educational, Scientific, and Cultural
Organization (UNESCO) (Brabets, 1996).
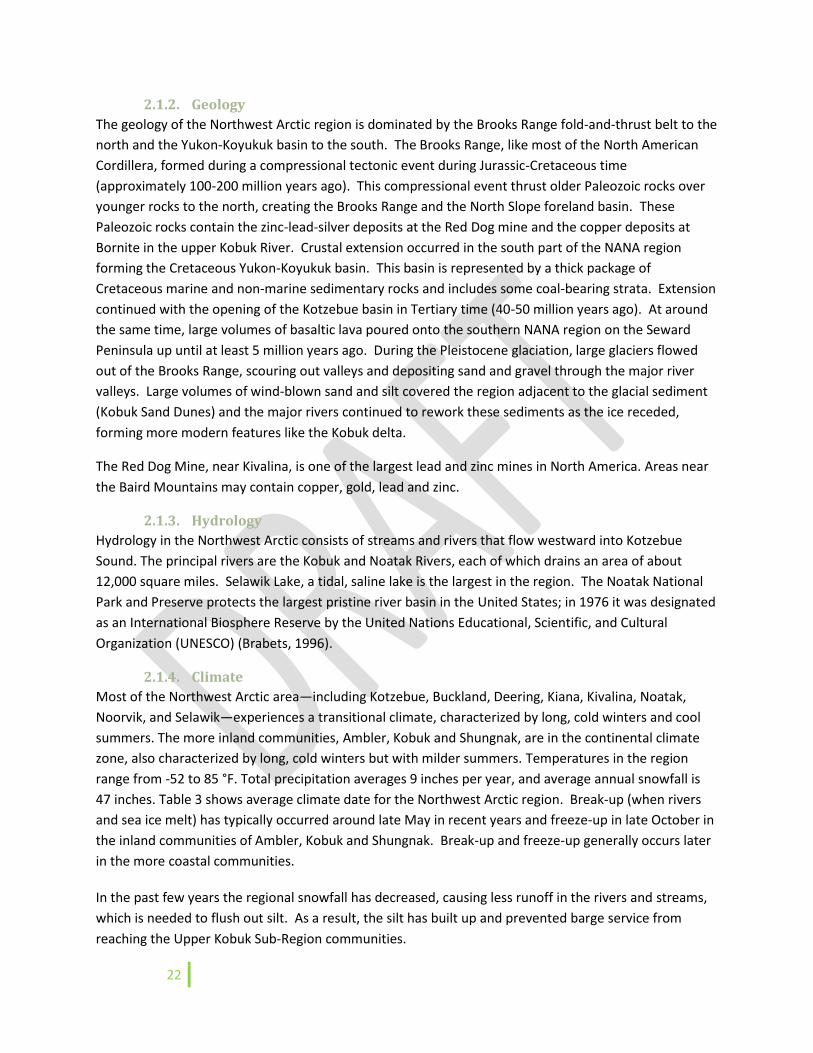
2.1.4. Climate
Most of the Northwest Arctic area—including Kotzebue, Buckland, Deering, Kiana, Kivalina, Noatak,
Noorvik, and Selawik—experiences a transitional climate, characterized by long, cold winters and cool
summers. The more inland communities, Ambler, Kobuk and Shungnak, are in the continental climate
zone, also characterized by long, cold winters but with milder summers. Temperatures in the region
range from -52 to 85 °F. Total precipitation averages 9 inches per year, and average annual snowfall is
47 inches. Table 3 shows average climate date for the Northwest Arctic region. Break-up (when rivers
and sea ice melt) has typically occurred around late May in recent years and freeze-up in late October in
the inland communities of Ambler, Kobuk and Shungnak. Break-up and freeze-up generally occurs later
in the more coastal communities.
In the past few years the regional snowfall has decreased, causing less runoff in the rivers and streams,
which is needed to flush out silt. As a result, the silt has built up and prevented barge service from
reaching the Upper Kobuk Sub-Region communities.
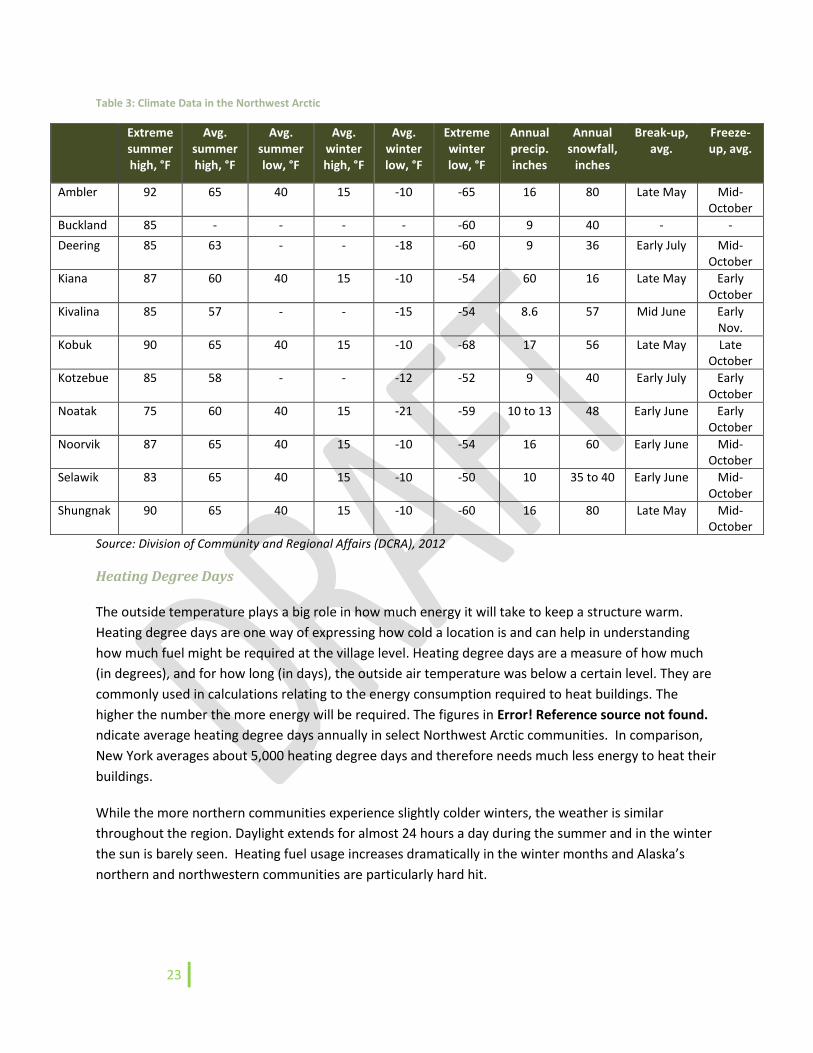
23
Table 3: Climate Data in the Northwest Arctic
Extreme summer high, °F
Avg. summer high, °F
Avg. summer low, °F
Avg. winter high, °F
Avg. winter low, °F
Extreme winter low, °F
Annual precip. inches
Annual snowfall,
inches
Break-up, avg.
Freeze-up, avg.
Ambler 92 65 40 15 -10 -65 16 80 Late May Mid-October
Buckland 85 - - - - -60 9 40 - -
Deering 85 63 - - -18 -60 9 36 Early July Mid-October
Kiana 87 60 40 15 -10 -54 60 16 Late May Early October
Kivalina 85 57 - - -15 -54 8.6 57 Mid June Early Nov.
Kobuk 90 65 40 15 -10 -68 17 56 Late May Late October
Kotzebue 85 58 - - -12 -52 9 40 Early July Early October
Noatak 75 60 40 15 -21 -59 10 to 13 48 Early June Early October
Noorvik 87 65 40 15 -10 -54 16 60 Early June Mid-October
Selawik 83 65 40 15 -10 -50 10 35 to 40 Early June Mid-October
Shungnak 90 65 40 15 -10 -60 16 80 Late May Mid-October
Source: Division of Community and Regional Affairs (DCRA), 2012
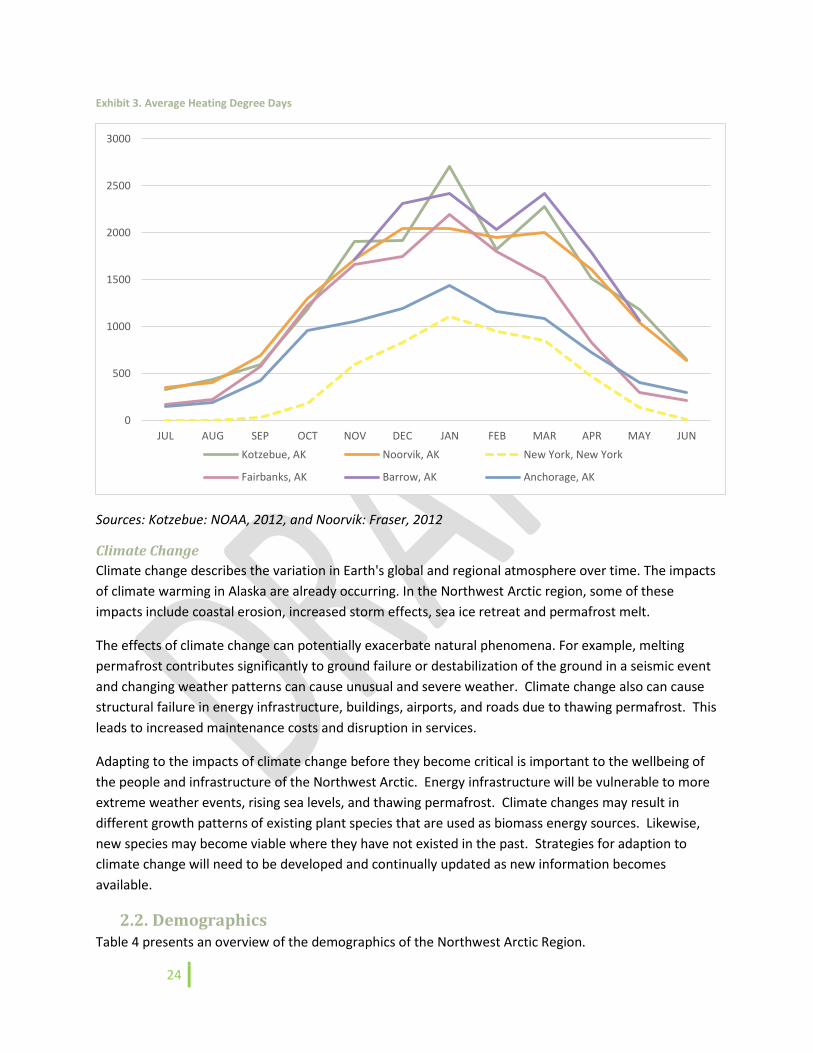
Heating Degree Days
The outside temperature plays a big role in how much energy it will take to keep a structure warm.
Heating degree days are one way of expressing how cold a location is and can help in understanding
how much fuel might be required at the village level. Heating degree days are a measure of how much
(in degrees), and for how long (in days), the outside air temperature was below a certain level. They are
commonly used in calculations relating to the energy consumption required to heat buildings. The
higher the number the more energy will be required. The figures in Error! Reference source not found.
ndicate average heating degree days annually in select Northwest Arctic communities. In comparison,
New York averages about 5,000 heating degree days and therefore needs much less energy to heat their
buildings.
While the more northern communities experience slightly colder winters, the weather is similar
throughout the region. Daylight extends for almost 24 hours a day during the summer and in the winter
the sun is barely seen. Heating fuel usage increases dramatically in the winter months and Alaska’s
northern and northwestern communities are particularly hard hit.
24
Exhibit 3. Average Heating Degree Days
Sources: Kotzebue: NOAA, 2012, and Noorvik: Fraser, 2012
Climate Change
Climate change describes the variation in Earth's global and regional atmosphere over time. The impacts
of climate warming in Alaska are already occurring. In the Northwest Arctic region, some of these
impacts include coastal erosion, increased storm effects, sea ice retreat and permafrost melt.
The effects of climate change can potentially exacerbate natural phenomena. For example, melting
permafrost contributes significantly to ground failure or destabilization of the ground in a seismic event
and changing weather patterns can cause unusual and severe weather. Climate change also can cause
structural failure in energy infrastructure, buildings, airports, and roads due to thawing permafrost. This
leads to increased maintenance costs and disruption in services.
Adapting to the impacts of climate change before they become critical is important to the wellbeing of
the people and infrastructure of the Northwest Arctic. Energy infrastructure will be vulnerable to more
extreme weather events, rising sea levels, and thawing permafrost. Climate changes may result in
different growth patterns of existing plant species that are used as biomass energy sources. Likewise,
new species may become viable where they have not existed in the past. Strategies for adaption to
climate change will need to be developed and continually updated as new information becomes
available.
2.2. Demographics Table 4 presents an overview of the demographics of the Northwest Arctic Region.
0
500
1000
1500
2000
2500
3000
JUL AUG SEP OCT NOV DEC JAN FEB MAR APR MAY JUN
Kotzebue, AK Noorvik, AK New York, New York
Fairbanks, AK Barrow, AK Anchorage, AK
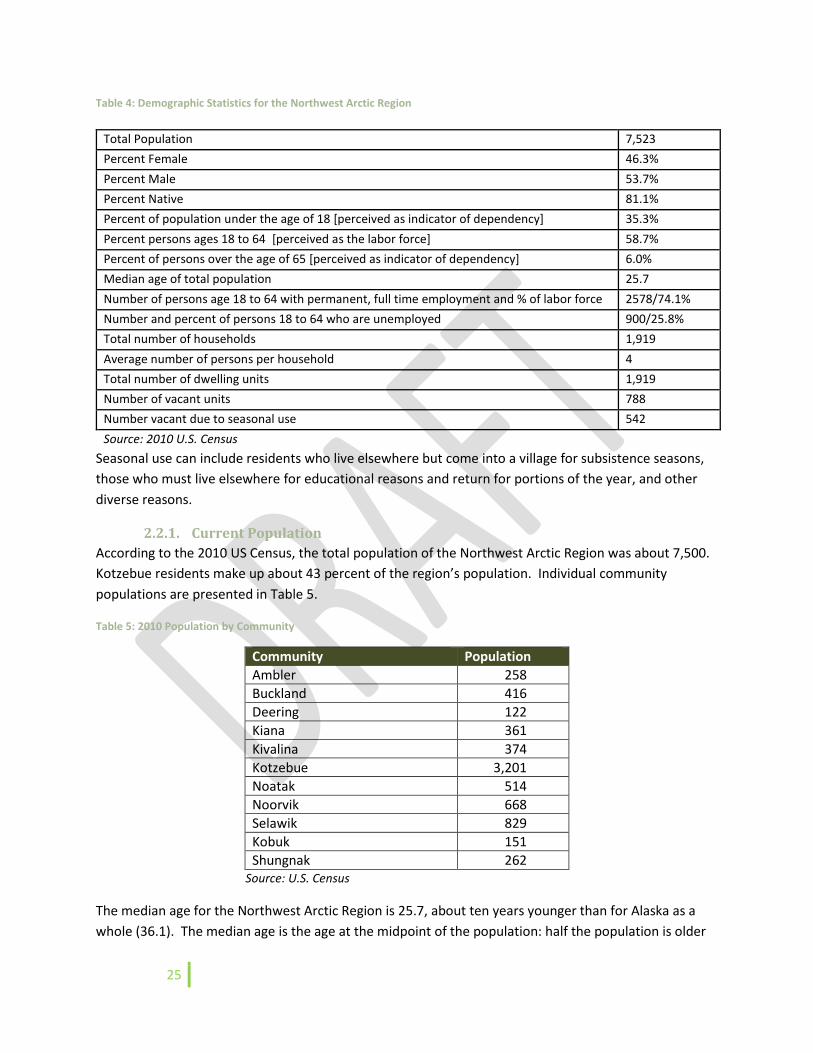
25
Table 4: Demographic Statistics for the Northwest Arctic Region
Seasonal use can include residents who live elsewhere but come into a village for subsistence seasons,
those who must live elsewhere for educational reasons and return for portions of the year, and other
diverse reasons.
2.2.1. Current Population
According to the 2010 US Census, the total population of the Northwest Arctic Region was about 7,500.
Kotzebue residents make up about 43 percent of the region’s population. Individual community
populations are presented in Table 5.
Table 5: 2010 Population by Community
Community Population
Ambler 258
Buckland 416
Deering 122
Kiana 361
Kivalina 374
Kotzebue 3,201
Noatak 514
Noorvik 668
Selawik 829
Kobuk 151
Shungnak 262 Source: U.S. Census
The median age for the Northwest Arctic Region is 25.7, about ten years younger than for Alaska as a
whole (36.1). The median age is the age at the midpoint of the population: half the population is older
Total Population 7,523
Percent Female 46.3%
Percent Male 53.7%
Percent Native 81.1%
Percent of population under the age of 18 [perceived as indicator of dependency] 35.3%
Percent persons ages 18 to 64 [perceived as the labor force] 58.7%
Percent of persons over the age of 65 [perceived as indicator of dependency] 6.0%
Median age of total population 25.7
Number of persons age 18 to 64 with permanent, full time employment and % of labor force 2578/74.1%
Number and percent of persons 18 to 64 who are unemployed 900/25.8%
Total number of households 1,919
Average number of persons per household 4
Total number of dwelling units 1,919
Number of vacant units 788
Number vacant due to seasonal use 542
Source: 2010 U.S. Census
26
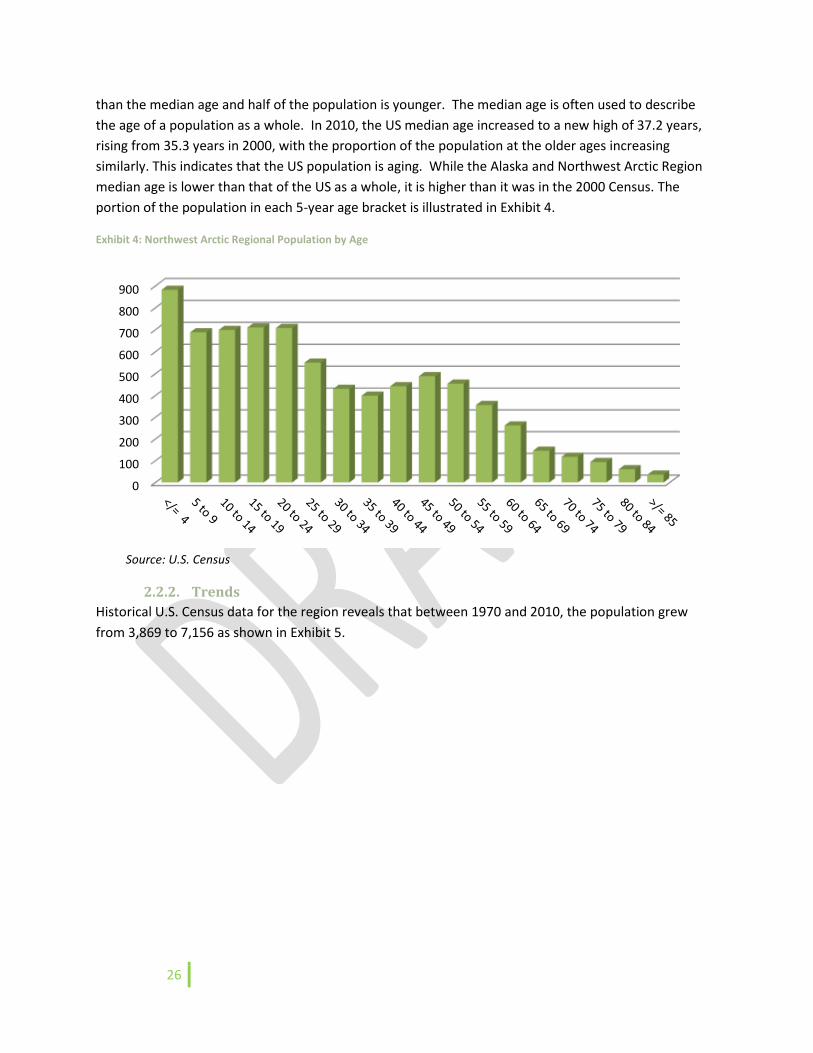
than the median age and half of the population is younger. The median age is often used to describe
the age of a population as a whole. In 2010, the US median age increased to a new high of 37.2 years,
rising from 35.3 years in 2000, with the proportion of the population at the older ages increasing
similarly. This indicates that the US population is aging. While the Alaska and Northwest Arctic Region
median age is lower than that of the US as a whole, it is higher than it was in the 2000 Census. The
portion of the population in each 5-year age bracket is illustrated in Exhibit 4.
Exhibit 4: Northwest Arctic Regional Population by Age
Source: U.S. Census
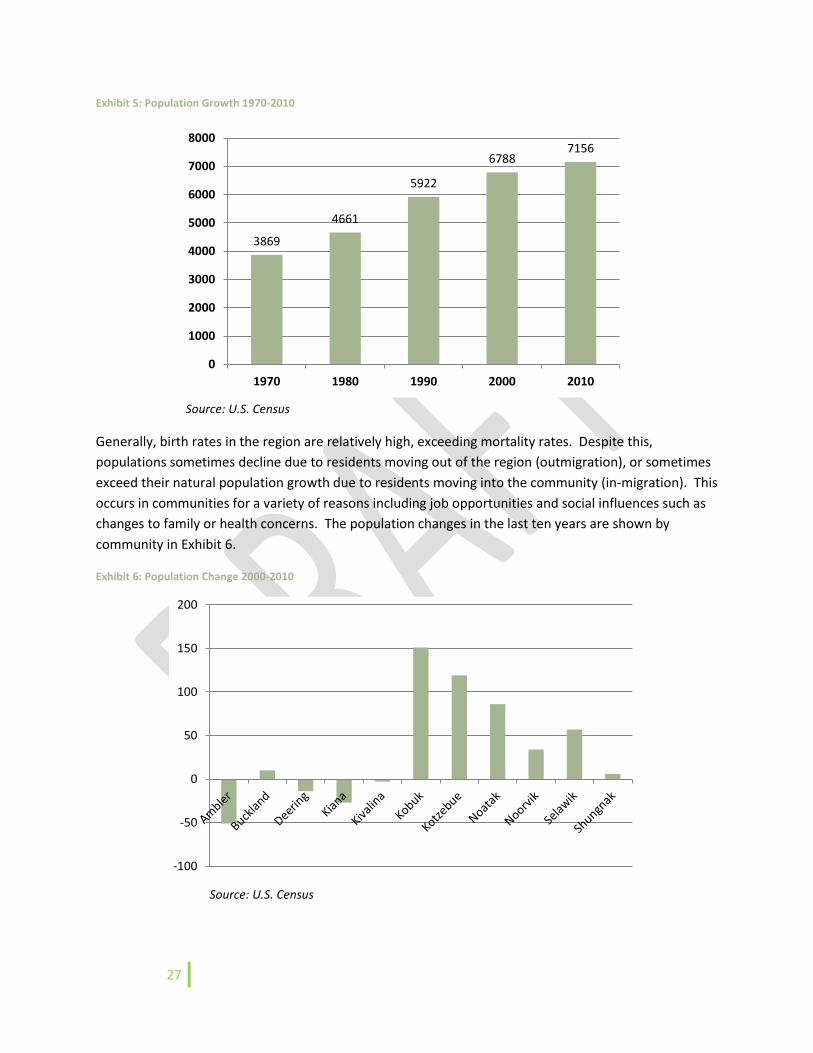
2.2.2. Trends
Historical U.S. Census data for the region reveals that between 1970 and 2010, the population grew
from 3,869 to 7,156 as shown in Exhibit 5.
0
100
200
300
400
500
600
700
800
900
27
Exhibit 5: Population Growth 1970-2010
Source: U.S. Census
Generally, birth rates in the region are relatively high, exceeding mortality rates. Despite this,
populations sometimes decline due to residents moving out of the region (outmigration), or sometimes
exceed their natural population growth due to residents moving into the community (in-migration). This
occurs in communities for a variety of reasons including job opportunities and social influences such as
changes to family or health concerns. The population changes in the last ten years are shown by
community in Exhibit 6.
Exhibit 6: Population Change 2000-2010
Source: U.S. Census
3869
4661
5922
67887156
0
1000
2000
3000
4000
5000
6000
7000
8000
1970 1980 1990 2000 2010
-100
-50
0
50
100
150
200
28
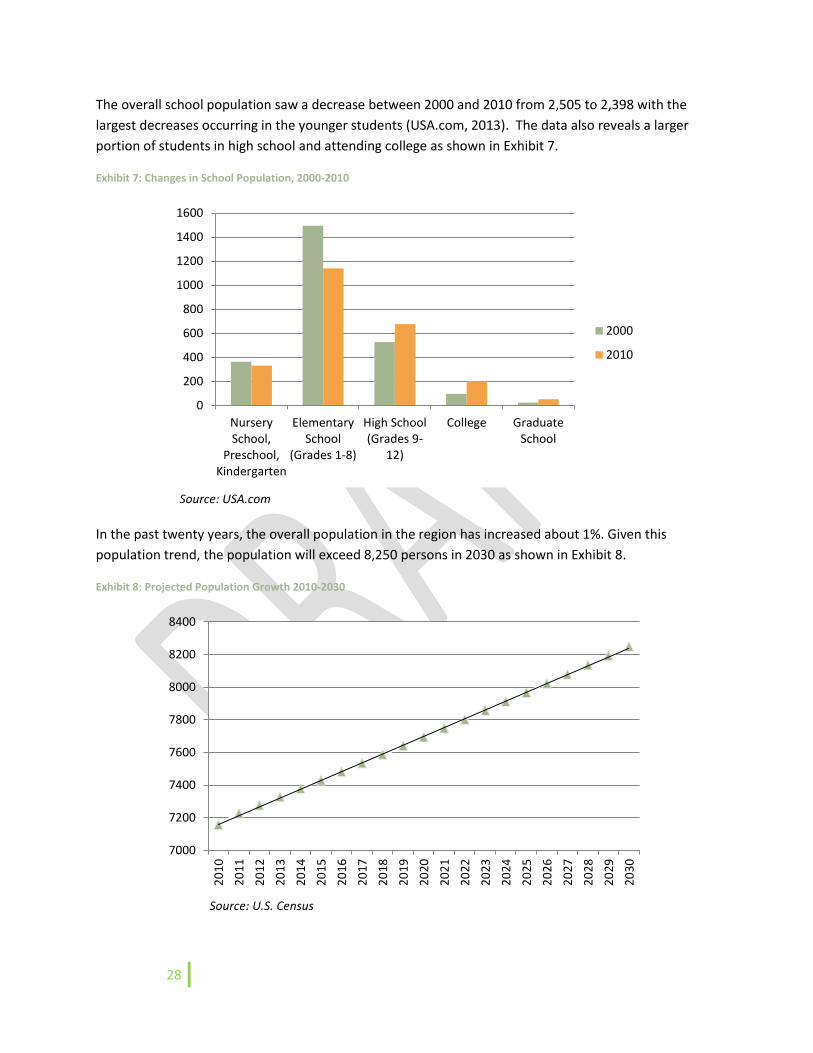
The overall school population saw a decrease between 2000 and 2010 from 2,505 to 2,398 with the
largest decreases occurring in the younger students (USA.com, 2013). The data also reveals a larger
portion of students in high school and attending college as shown in Exhibit 7.
Exhibit 7: Changes in School Population, 2000-2010
Source: USA.com
In the past twenty years, the overall population in the region has increased about 1%. Given this
population trend, the population will exceed 8,250 persons in 2030 as shown in Exhibit 8.
Exhibit 8: Projected Population Growth 2010-2030
Source: U.S. Census
0
200
400
600
800
1000
1200
1400
1600
NurserySchool,
Preschool,Kindergarten
ElementarySchool
(Grades 1-8)
High School(Grades 9-
12)
College GraduateSchool
2000
2010
7000
7200
7400
7600
7800
8000
8200
8400
20
10
20
11
20
12
20
13
20
14
20
15
20
16
20
17
20
18
20
19
20
20
20
21
20
22
20
23
20
24
20
25
20
26
20
27
20
28
20
29
20
30
29
2.2.3. Economy
The Northwest Arctic Region’s population is primarily Inupiat Eskimo, and subsistence activities are a
vital part of the lifestyle. Residents rely on caribou, moose, reindeer, beluga whale, birds, four species of
seals, berries, greens and fish.
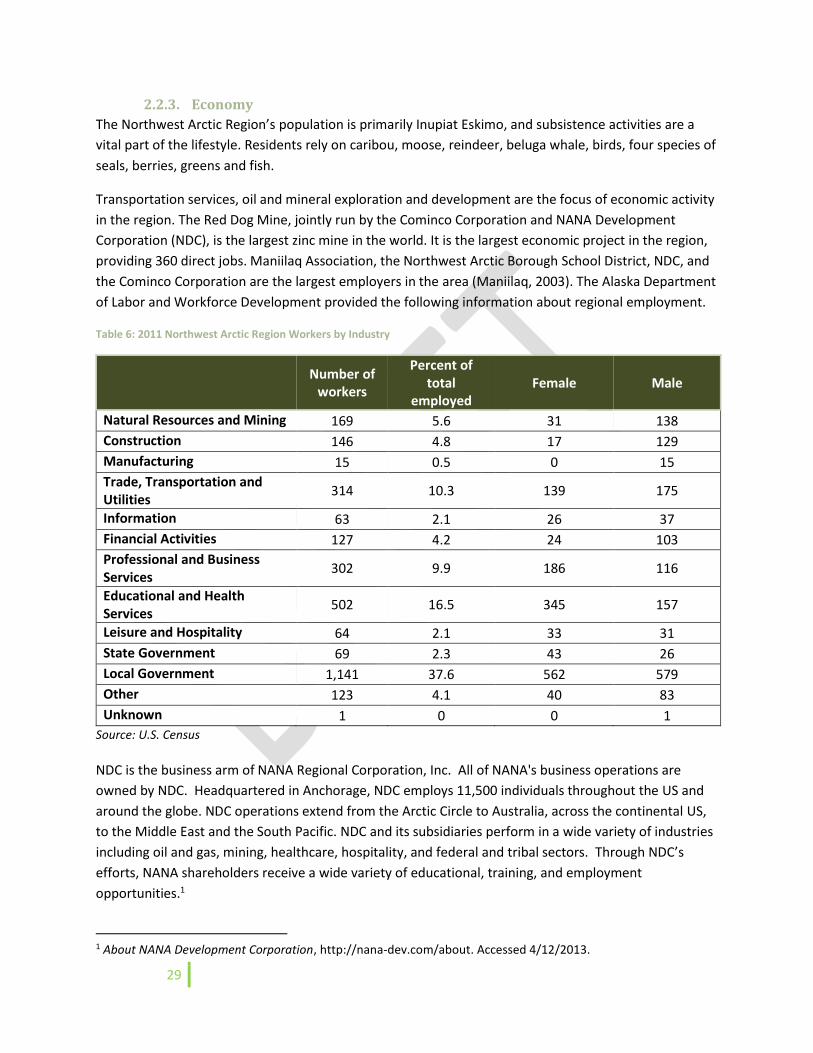
Transportation services, oil and mineral exploration and development are the focus of economic activity
in the region. The Red Dog Mine, jointly run by the Cominco Corporation and NANA Development
Corporation (NDC), is the largest zinc mine in the world. It is the largest economic project in the region,
providing 360 direct jobs. Maniilaq Association, the Northwest Arctic Borough School District, NDC, and
the Cominco Corporation are the largest employers in the area (Maniilaq, 2003). The Alaska Department
of Labor and Workforce Development provided the following information about regional employment.
Table 6: 2011 Northwest Arctic Region Workers by Industry
Number of
workers
Percent of total
employed Female Male
Natural Resources and Mining 169 5.6 31 138
Construction 146 4.8 17 129
Manufacturing 15 0.5 0 15
Trade, Transportation and Utilities
314 10.3 139 175
Information 63 2.1 26 37
Financial Activities 127 4.2 24 103
Professional and Business Services
302 9.9 186 116
Educational and Health Services
502 16.5 345 157
Leisure and Hospitality 64 2.1 33 31
State Government 69 2.3 43 26
Local Government 1,141 37.6 562 579
Other 123 4.1 40 83
Unknown 1 0 0 1
Source: U.S. Census
NDC is the business arm of NANA Regional Corporation, Inc. All of NANA's business operations are
owned by NDC. Headquartered in Anchorage, NDC employs 11,500 individuals throughout the US and
around the globe. NDC operations extend from the Arctic Circle to Australia, across the continental US,
to the Middle East and the South Pacific. NDC and its subsidiaries perform in a wide variety of industries
including oil and gas, mining, healthcare, hospitality, and federal and tribal sectors. Through NDC’s
efforts, NANA shareholders receive a wide variety of educational, training, and employment
opportunities.1
1 About NANA Development Corporation, http://nana-dev.com/about. Accessed 4/12/2013.
30
In 2012, NRC’s board of directors distributed a dividend totaling $11.8 million dollars at a rate of $7.72
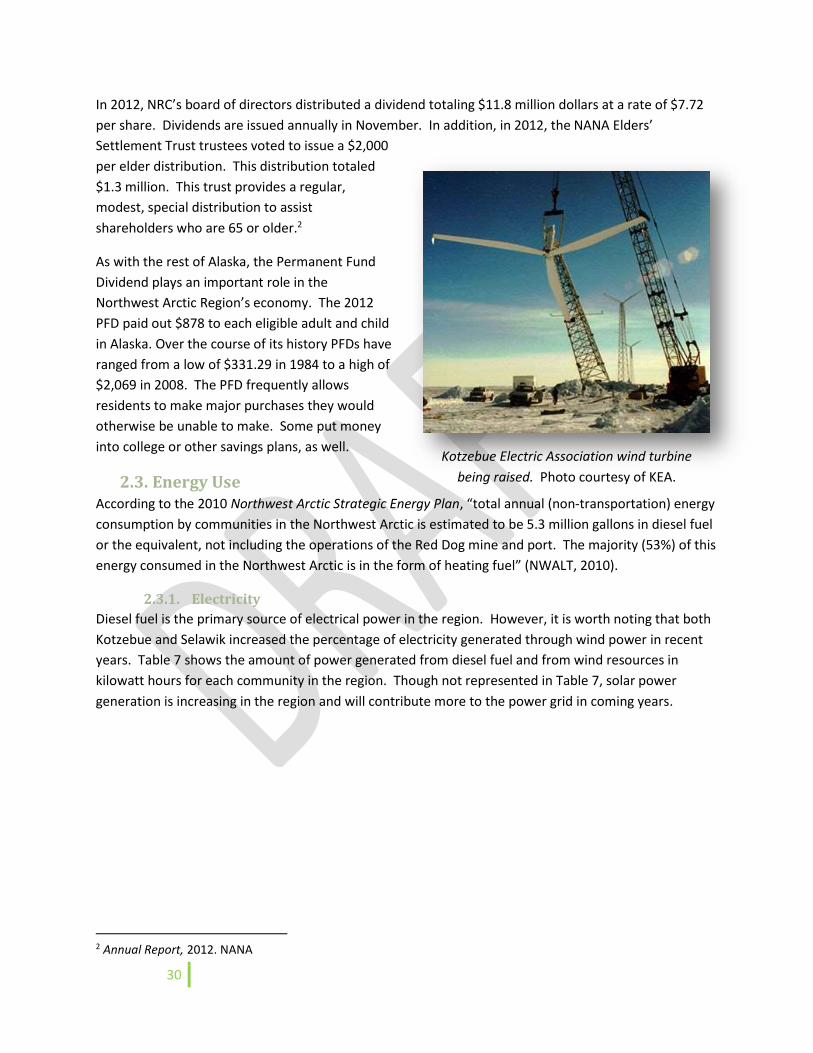
per share. Dividends are issued annually in November. In addition, in 2012, the NANA Elders’
Settlement Trust trustees voted to issue a $2,000
per elder distribution. This distribution totaled
$1.3 million. This trust provides a regular,
modest, special distribution to assist
shareholders who are 65 or older.2
As with the rest of Alaska, the Permanent Fund
Dividend plays an important role in the
Northwest Arctic Region’s economy. The 2012
PFD paid out $878 to each eligible adult and child
in Alaska. Over the course of its history PFDs have
ranged from a low of $331.29 in 1984 to a high of
$2,069 in 2008. The PFD frequently allows
residents to make major purchases they would
otherwise be unable to make. Some put money
into college or other savings plans, as well.
2.3. Energy Use According to the 2010 Northwest Arctic Strategic Energy Plan, “total annual (non-transportation) energy
consumption by communities in the Northwest Arctic is estimated to be 5.3 million gallons in diesel fuel
or the equivalent, not including the operations of the Red Dog mine and port. The majority (53%) of this
energy consumed in the Northwest Arctic is in the form of heating fuel” (NWALT, 2010).
2.3.1. Electricity
Diesel fuel is the primary source of electrical power in the region. However, it is worth noting that both
Kotzebue and Selawik increased the percentage of electricity generated through wind power in recent
years. Table 7 shows the amount of power generated from diesel fuel and from wind resources in
kilowatt hours for each community in the region. Though not represented in Table 7, solar power
generation is increasing in the region and will contribute more to the power grid in coming years.
2 Annual Report, 2012. NANA
Kotzebue Electric Association wind turbine
being raised. Photo courtesy of KEA.
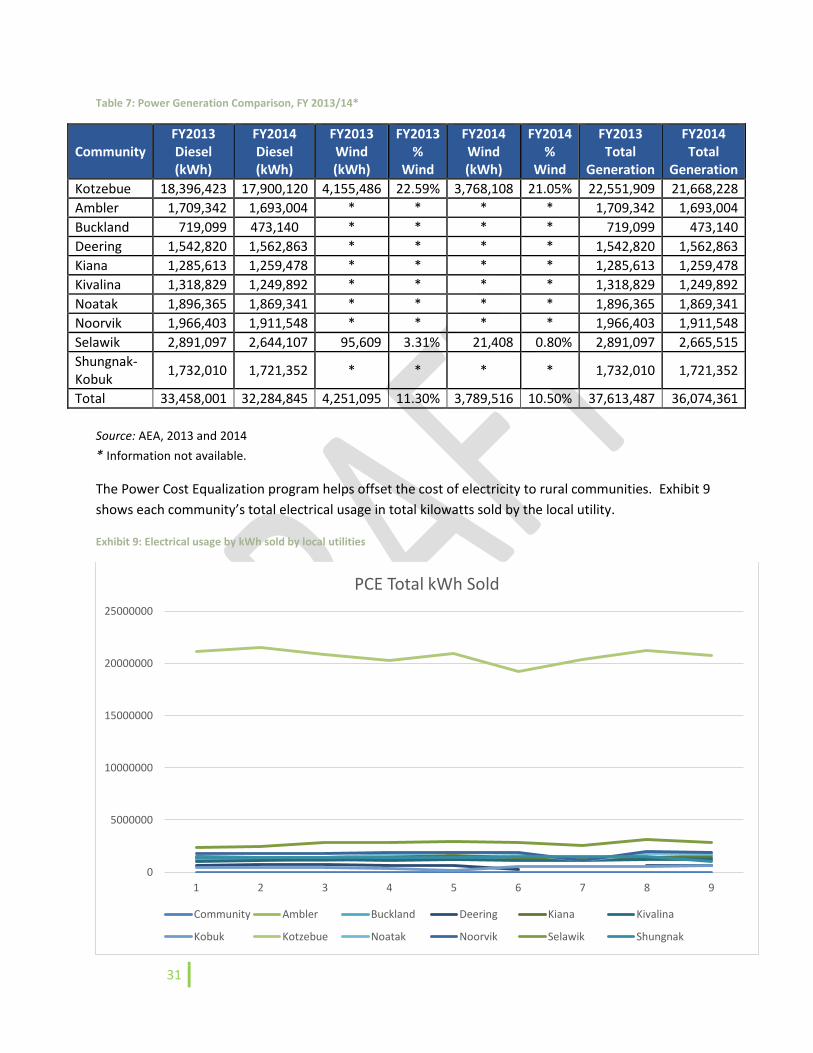
31
Table 7: Power Generation Comparison, FY 2013/14*
Community FY2013 Diesel (kWh)
FY2014 Diesel (kWh)
FY2013 Wind (kWh)
FY2013 %
Wind
FY2014 Wind (kWh)
FY2014 %
Wind
FY2013 Total
Generation
FY2014 Total
Generation
Kotzebue 18,396,423 17,900,120 4,155,486 22.59% 3,768,108 21.05% 22,551,909 21,668,228
Ambler 1,709,342 1,693,004 * * * * 1,709,342 1,693,004
Buckland 719,099 473,140 * * * * 719,099 473,140
Deering 1,542,820 1,562,863 * * * * 1,542,820 1,562,863
Kiana 1,285,613 1,259,478 * * * * 1,285,613 1,259,478
Kivalina 1,318,829 1,249,892 * * * * 1,318,829 1,249,892
Noatak 1,896,365 1,869,341 * * * * 1,896,365 1,869,341
Noorvik 1,966,403 1,911,548 * * * * 1,966,403 1,911,548
Selawik 2,891,097 2,644,107 95,609 3.31% 21,408 0.80% 2,891,097 2,665,515
Shungnak-Kobuk
1,732,010 1,721,352 * * * * 1,732,010 1,721,352
Total 33,458,001 32,284,845 4,251,095 11.30% 3,789,516 10.50% 37,613,487 36,074,361
Source: AEA, 2013 and 2014
* Information not available.
The Power Cost Equalization program helps offset the cost of electricity to rural communities. Exhibit 9
shows each community’s total electrical usage in total kilowatts sold by the local utility.
Exhibit 9: Electrical usage by kWh sold by local utilities
0
5000000
10000000
15000000
20000000
25000000
1 2 3 4 5 6 7 8 9
PCE Total kWh Sold
Community Ambler Buckland Deering Kiana Kivalina
Kobuk Kotzebue Noatak Noorvik Selawik Shungnak
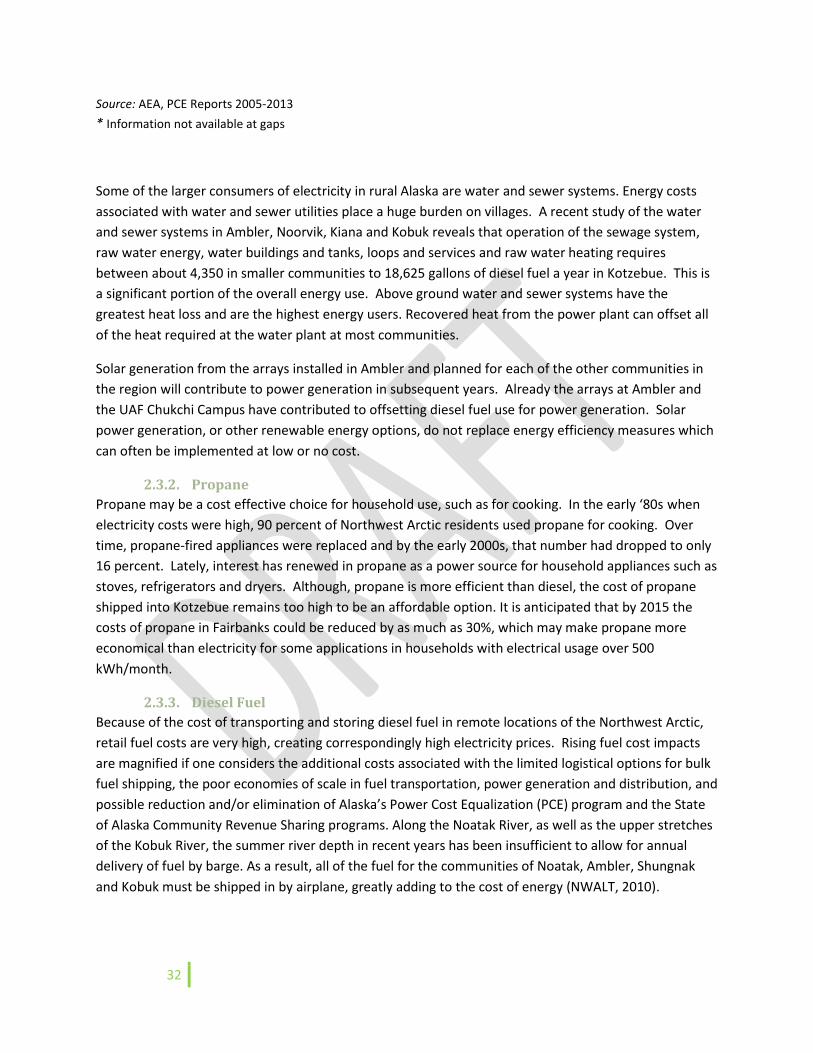
32
Source: AEA, PCE Reports 2005-2013
* Information not available at gaps
Some of the larger consumers of electricity in rural Alaska are water and sewer systems. Energy costs
associated with water and sewer utilities place a huge burden on villages. A recent study of the water
and sewer systems in Ambler, Noorvik, Kiana and Kobuk reveals that operation of the sewage system,
raw water energy, water buildings and tanks, loops and services and raw water heating requires
between about 4,350 in smaller communities to 18,625 gallons of diesel fuel a year in Kotzebue. This is
a significant portion of the overall energy use. Above ground water and sewer systems have the
greatest heat loss and are the highest energy users. Recovered heat from the power plant can offset all
of the heat required at the water plant at most communities.
Solar generation from the arrays installed in Ambler and planned for each of the other communities in
the region will contribute to power generation in subsequent years. Already the arrays at Ambler and
the UAF Chukchi Campus have contributed to offsetting diesel fuel use for power generation. Solar
power generation, or other renewable energy options, do not replace energy efficiency measures which
can often be implemented at low or no cost.
2.3.2. Propane
Propane may be a cost effective choice for household use, such as for cooking. In the early ‘80s when
electricity costs were high, 90 percent of Northwest Arctic residents used propane for cooking. Over
time, propane-fired appliances were replaced and by the early 2000s, that number had dropped to only
16 percent. Lately, interest has renewed in propane as a power source for household appliances such as
stoves, refrigerators and dryers. Although, propane is more efficient than diesel, the cost of propane
shipped into Kotzebue remains too high to be an affordable option. It is anticipated that by 2015 the
costs of propane in Fairbanks could be reduced by as much as 30%, which may make propane more
economical than electricity for some applications in households with electrical usage over 500
kWh/month.
2.3.3. Diesel Fuel
Because of the cost of transporting and storing diesel fuel in remote locations of the Northwest Arctic,
retail fuel costs are very high, creating correspondingly high electricity prices. Rising fuel cost impacts
are magnified if one considers the additional costs associated with the limited logistical options for bulk
fuel shipping, the poor economies of scale in fuel transportation, power generation and distribution, and
possible reduction and/or elimination of Alaska’s Power Cost Equalization (PCE) program and the State
of Alaska Community Revenue Sharing programs. Along the Noatak River, as well as the upper stretches
of the Kobuk River, the summer river depth in recent years has been insufficient to allow for annual
delivery of fuel by barge. As a result, all of the fuel for the communities of Noatak, Ambler, Shungnak
and Kobuk must be shipped in by airplane, greatly adding to the cost of energy (NWALT, 2010).
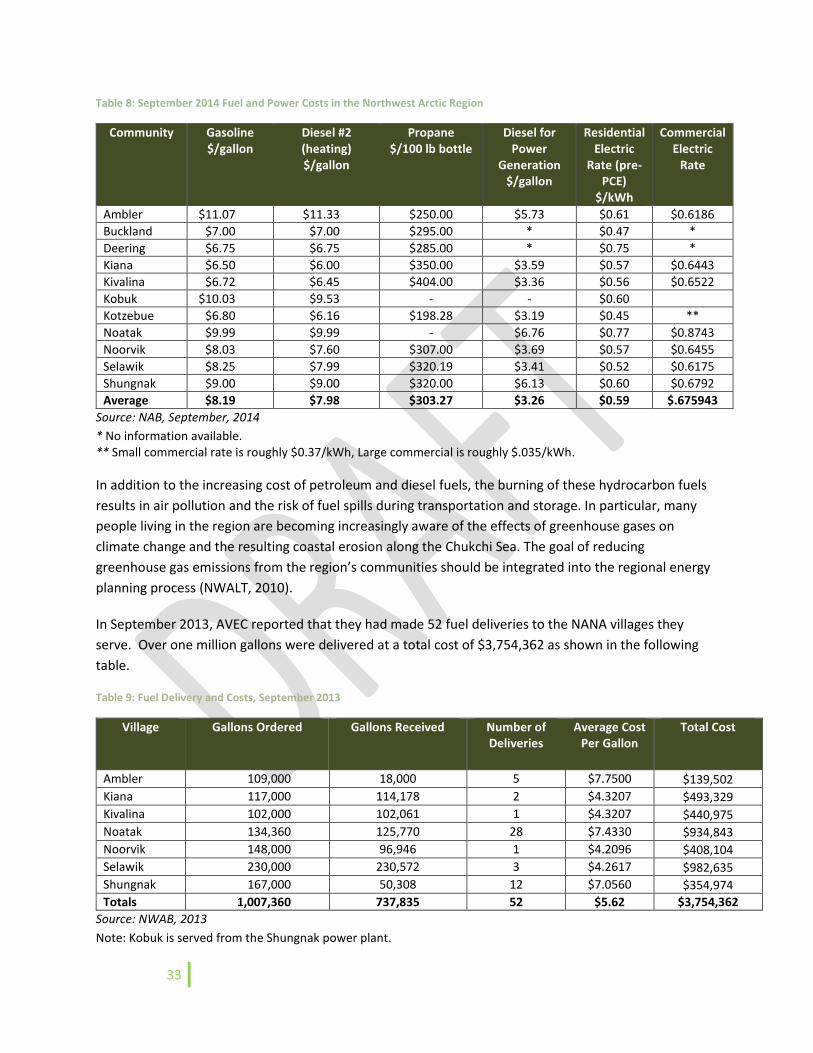
33
Table 8: September 2014 Fuel and Power Costs in the Northwest Arctic Region
Community Gasoline $/gallon
Diesel #2 (heating) $/gallon
Propane $/100 lb bottle
Diesel for Power
Generation $/gallon
Residential Electric
Rate (pre-PCE)
$/kWh
Commercial Electric
Rate
Ambler $11.07 $11.33 $250.00 $5.73 $0.61 $0.6186
Buckland $7.00 $7.00 $295.00 * $0.47 *
Deering $6.75 $6.75 $285.00 * $0.75 *
Kiana $6.50 $6.00 $350.00 $3.59 $0.57 $0.6443
Kivalina $6.72 $6.45 $404.00 $3.36 $0.56 $0.6522
Kobuk $10.03 $9.53 - - $0.60
Kotzebue $6.80 $6.16 $198.28 $3.19 $0.45 **
Noatak $9.99 $9.99 - $6.76 $0.77 $0.8743
Noorvik $8.03 $7.60 $307.00 $3.69 $0.57 $0.6455
Selawik $8.25 $7.99 $320.19 $3.41 $0.52 $0.6175
Shungnak $9.00 $9.00 $320.00 $6.13 $0.60 $0.6792
Average $8.19 $7.98 $303.27 $3.26 $0.59 $.675943
Source: NAB, September, 2014
* No information available. ** Small commercial rate is roughly $0.37/kWh, Large commercial is roughly $.035/kWh.
In addition to the increasing cost of petroleum and diesel fuels, the burning of these hydrocarbon fuels
results in air pollution and the risk of fuel spills during transportation and storage. In particular, many
people living in the region are becoming increasingly aware of the effects of greenhouse gases on
climate change and the resulting coastal erosion along the Chukchi Sea. The goal of reducing
greenhouse gas emissions from the region’s communities should be integrated into the regional energy
planning process (NWALT, 2010).
In September 2013, AVEC reported that they had made 52 fuel deliveries to the NANA villages they
serve. Over one million gallons were delivered at a total cost of $3,754,362 as shown in the following
table.
Table 9: Fuel Delivery and Costs, September 2013
Village Gallons Ordered Gallons Received Number of Deliveries
Average Cost Per Gallon
Total Cost
Ambler 109,000 18,000 5 $7.7500 $139,502
Kiana 117,000 114,178 2 $4.3207 $493,329
Kivalina 102,000 102,061 1 $4.3207 $440,975
Noatak 134,360 125,770 28 $7.4330 $934,843
Noorvik 148,000 96,946 1 $4.2096 $408,104
Selawik 230,000 230,572 3 $4.2617 $982,635
Shungnak 167,000 50,308 12 $7.0560 $354,974
Totals 1,007,360 737,835 52 $5.62 $3,754,362
Source: NWAB, 2013
Note: Kobuk is served from the Shungnak power plant.
34
2.3.4. Heat
According to the survey administered in researching the 2010 Northwest Arctic Strategic Energy Plan,
nearly half of the households in the region use a combination of energy sources to heat their homes.
Other heat sources included furnaces, wood stoves, Toyo or Monitor stoves, and boilers.
An estimated 2,273,385 gallons of diesel #2 heating oil is used annually throughout the region. In 2008,
it was estimated that about 124,000 gallons of heating oil was displaced through the burning of local
wood resources for heat. While fuel consumption remains relatively stable and in some cases has gone
down, the escalating price of imported fuels continues to dramatically increase overall energy costs for
Northwest Arctic communities.
2.3.5. Transportation Access
Residents of the Northwest Arctic Region use diesel or gas powered snowmachines, four wheelers, and
boats for subsistence hunting and fishing activities. People travel to hunting areas, fish camps and to
neighboring communities by skiffs and small boats on rivers and along the coast during the summer. In
the winter, they use snowmachines for hunting, trapping, ice fishing and intercommunity travel. Barge
delivery of fuel and deck freight, the aviation-based bypass mail system, and the delivery of freight and
fuel to Noatak, Ambler, Shungnak and Kobuk by plane are critical transport services in the region. Air
travel is the only year-round mode of transport into and out of most villages for passengers and many
goods.
Nearly all regional supplies arrive in Kotzebue by ocean shipments between June and September.
Kotzebue serves as a transportation and economic center for the Northwest Arctic. Currently, all loads
are lightered to Kotzebue from larger vessels that are restricted to waters 15 miles offshore, due to
shallow water depths. This method of delivery results in increased costs for the region for goods and
energy needs. The Alaska Department of Transportation and Public Facilities (DOT&PF) has proposed a
port site with deeper water at Cape Blossom, located ten miles to the south of Kotzebue. This would
result in a way to more economically deliver fuel and commodities to the community and in turn, the
region. DOT&PF intends to finalize documentation necessary to complete the environmental
documentation for the Cape Blossom access road in the winter of 2013. Construction contracts could be
awarded in 2014 depending on funding availability and the environmental approval schedule. It is
anticipated that the completion of the road and port at Cape Blossom will reduce goods and energy
costs in the region.
The cost of gasoline for transportation in 2013 averages $8.29/gallon.

35
36
3. Regional Resources
REGIONAL RESOURCES

37
This chapter provides
details about energy
resources and potential
opportunities in the
Northwest Arctic region.
REGIONAL RESOURCES
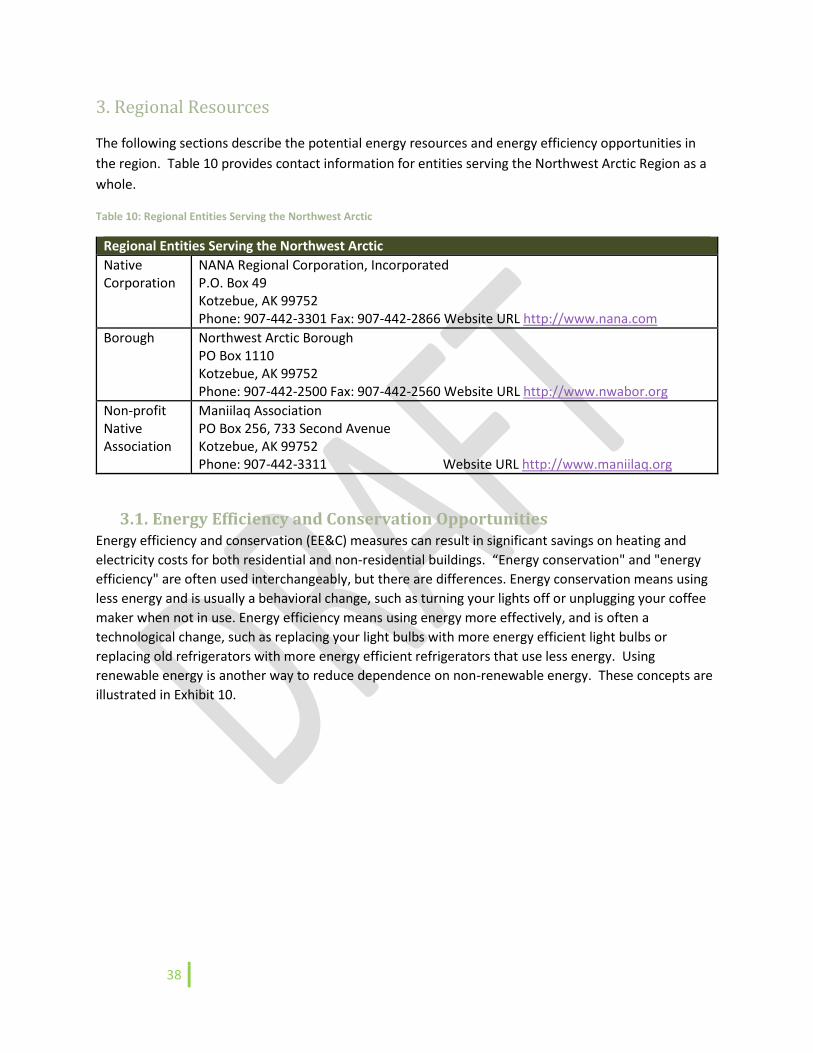
38
3. Regional Resources
The following sections describe the potential energy resources and energy efficiency opportunities in
the region. Table 10 provides contact information for entities serving the Northwest Arctic Region as a
whole.
Table 10: Regional Entities Serving the Northwest Arctic
Regional Entities Serving the Northwest Arctic
Native Corporation
NANA Regional Corporation, Incorporated P.O. Box 49 Kotzebue, AK 99752 Phone: 907-442-3301 Fax: 907-442-2866 Website URL http://www.nana.com
Borough Northwest Arctic Borough PO Box 1110 Kotzebue, AK 99752 Phone: 907-442-2500 Fax: 907-442-2560 Website URL http://www.nwabor.org
Non-profit Native Association
Maniilaq Association PO Box 256, 733 Second Avenue Kotzebue, AK 99752 Phone: 907-442-3311 Website URL http://www.maniilaq.org
3.1. Energy Efficiency and Conservation Opportunities Energy efficiency and conservation (EE&C) measures can result in significant savings on heating and
electricity costs for both residential and non-residential buildings. “Energy conservation" and "energy
efficiency" are often used interchangeably, but there are differences. Energy conservation means using
less energy and is usually a behavioral change, such as turning your lights off or unplugging your coffee
maker when not in use. Energy efficiency means using energy more effectively, and is often a
technological change, such as replacing your light bulbs with more energy efficient light bulbs or
replacing old refrigerators with more energy efficient refrigerators that use less energy. Using
renewable energy is another way to reduce dependence on non-renewable energy. These concepts are
illustrated in Exhibit 10.
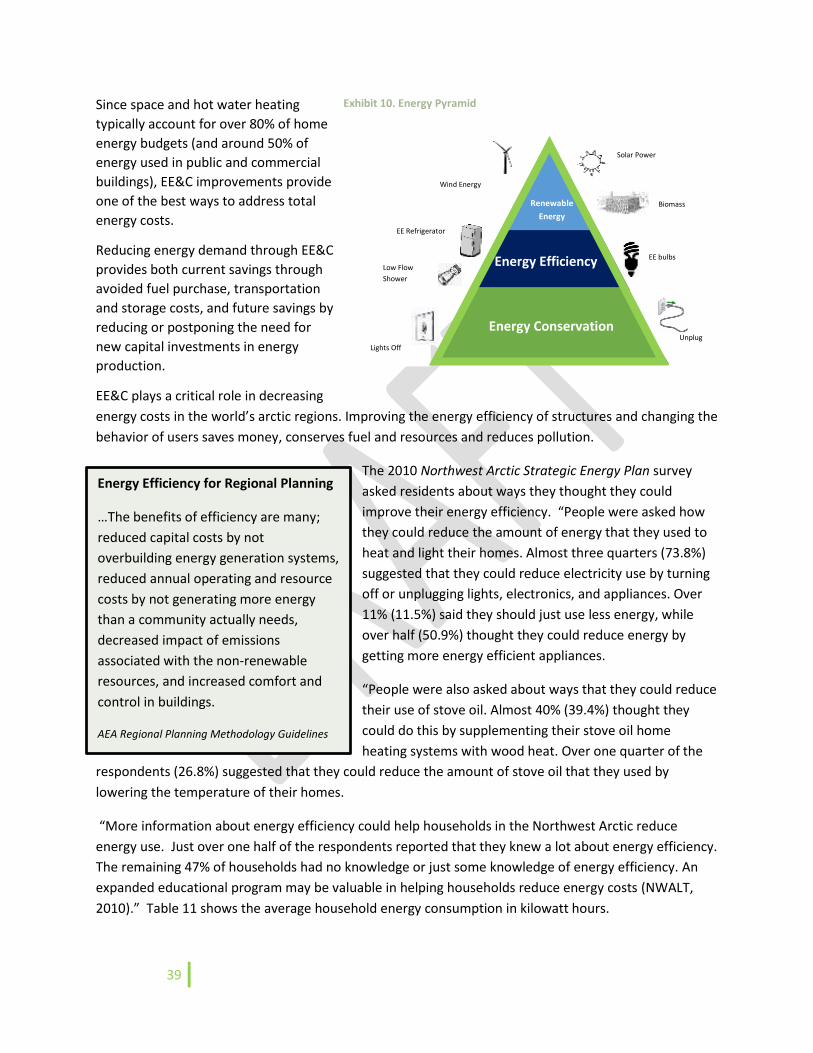
39
Since space and hot water heating
typically account for over 80% of home
energy budgets (and around 50% of
energy used in public and commercial
buildings), EE&C improvements provide
one of the best ways to address total
energy costs.
Reducing energy demand through EE&C
provides both current savings through
avoided fuel purchase, transportation
and storage costs, and future savings by
reducing or postponing the need for
new capital investments in energy
production.
EE&C plays a critical role in decreasing
energy costs in the world’s arctic regions. Improving the energy efficiency of structures and changing the
behavior of users saves money, conserves fuel and resources and reduces pollution.
The 2010 Northwest Arctic Strategic Energy Plan survey
asked residents about ways they thought they could
improve their energy efficiency. “People were asked how
they could reduce the amount of energy that they used to
heat and light their homes. Almost three quarters (73.8%)
suggested that they could reduce electricity use by turning
off or unplugging lights, electronics, and appliances. Over
11% (11.5%) said they should just use less energy, while
over half (50.9%) thought they could reduce energy by
getting more energy efficient appliances.
“People were also asked about ways that they could reduce
their use of stove oil. Almost 40% (39.4%) thought they
could do this by supplementing their stove oil home
heating systems with wood heat. Over one quarter of the
respondents (26.8%) suggested that they could reduce the amount of stove oil that they used by
lowering the temperature of their homes.
“More information about energy efficiency could help households in the Northwest Arctic reduce
energy use. Just over one half of the respondents reported that they knew a lot about energy efficiency.
The remaining 47% of households had no knowledge or just some knowledge of energy efficiency. An
expanded educational program may be valuable in helping households reduce energy costs (NWALT,
2010).” Table 11 shows the average household energy consumption in kilowatt hours.
Energy Efficiency for Regional Planning
…The benefits of efficiency are many;
reduced capital costs by not
overbuilding energy generation systems,
reduced annual operating and resource
costs by not generating more energy
than a community actually needs,
decreased impact of emissions
associated with the non-renewable
resources, and increased comfort and
control in buildings.
AEA Regional Planning Methodology Guidelines
Unplug Energy Conservation
Energy Efficiency
Renewable
Energy
EE bulbs
Lights Off
Low Flow
Shower
EE Refrigerator
Wind Energy
Solar Power
Biomass
Exhibit 10. Energy Pyramid
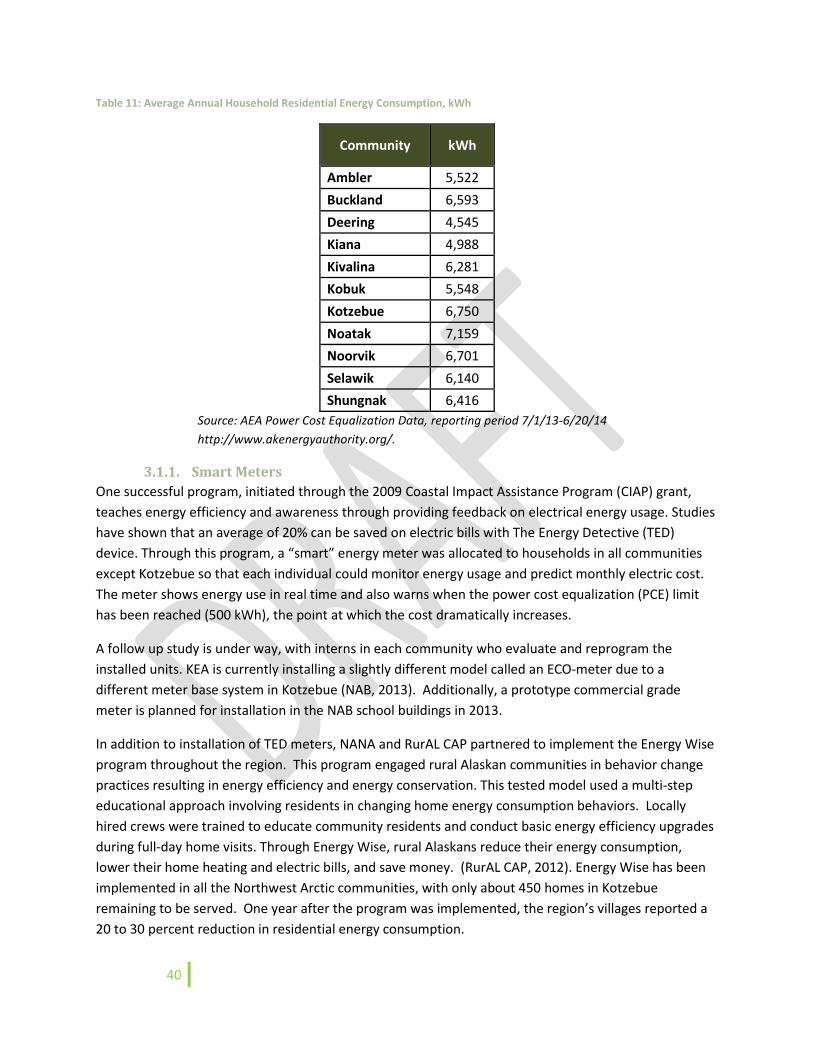
40
Table 11: Average Annual Household Residential Energy Consumption, kWh
Community kWh
Ambler 5,522
Buckland 6,593
Deering 4,545
Kiana 4,988
Kivalina 6,281
Kobuk 5,548
Kotzebue 6,750
Noatak 7,159
Noorvik 6,701
Selawik 6,140
Shungnak 6,416
Source: AEA Power Cost Equalization Data, reporting period 7/1/13-6/20/14
http://www.akenergyauthority.org/.
3.1.1. Smart Meters
One successful program, initiated through the 2009 Coastal Impact Assistance Program (CIAP) grant,
teaches energy efficiency and awareness through providing feedback on electrical energy usage. Studies
have shown that an average of 20% can be saved on electric bills with The Energy Detective (TED)
device. Through this program, a “smart” energy meter was allocated to households in all communities
except Kotzebue so that each individual could monitor energy usage and predict monthly electric cost.
The meter shows energy use in real time and also warns when the power cost equalization (PCE) limit
has been reached (500 kWh), the point at which the cost dramatically increases.
A follow up study is under way, with interns in each community who evaluate and reprogram the
installed units. KEA is currently installing a slightly different model called an ECO-meter due to a
different meter base system in Kotzebue (NAB, 2013). Additionally, a prototype commercial grade
meter is planned for installation in the NAB school buildings in 2013.
In addition to installation of TED meters, NANA and RurAL CAP partnered to implement the Energy Wise
program throughout the region. This program engaged rural Alaskan communities in behavior change
practices resulting in energy efficiency and energy conservation. This tested model used a multi-step
educational approach involving residents in changing home energy consumption behaviors. Locally
hired crews were trained to educate community residents and conduct basic energy efficiency upgrades
during full-day home visits. Through Energy Wise, rural Alaskans reduce their energy consumption,
lower their home heating and electric bills, and save money. (RurAL CAP, 2012). Energy Wise has been
implemented in all the Northwest Arctic communities, with only about 450 homes in Kotzebue
remaining to be served. One year after the program was implemented, the region’s villages reported a
20 to 30 percent reduction in residential energy consumption.
41
3.1.2. Smart Grids
A smart grid consists of components that add features to bring energy efficiency to an existing power
grid by allowing repairs to be made to sections of the power grid. KEA has obtained grant funding from
the National Rural Electric Cooperative Association (NRECA) and the Department of Energy for system
upgrades in Kotzebue. These smart grid upgrades add three features to the KEA grid:
1. Upgrade power meters with TED meters, which have two-way communication capability –
allowing KEA to retrieve data remotely, as well as disconnect or limit customers’ electrical
consumption for non-payment.
2. Install IHD (In Home Display) units (ECO meters) that allow in-home displays of current
electricity usage – kWh/day, kWh/week, kWh/month – bringing customer awareness of
electric consumption.
3. Install smart distribution switches throughout the power grid to enable KEA to shut down
small portions of the grid for repairs or upgrades instead of shutting down the entire grid.
3.1.3. Weatherization
There are several weatherization and energy efficiency programs available to rural Alaska residents
including the following:
Housing Authority Weatherization (AHFC Service Providers – i.e. Northwest Inupiat Housing
Authority) – combined state and federal dollars used to provide weatherization to residential
homes in Alaska. This is an income based program.
RurAL CAP Weatherization – Private and federal funds are used to provide weatherization to
homes not weatherized by AHFC. Like the Housing Authority Weatherization program, this is an
income-based program.
RurAL CAP Energy Wise – This program provides education on behavior change and energy-
efficiency. There are no income restrictions on this program.
AHFC Home Energy Rebate Program – State of Alaska funded program that reimburses
homeowners when energy-efficiency ratings are improved and energy conservation projects are
completed. The program has no income restrictions. Participants cannot participate in both the
Weatherization and Home Energy Rebate Programs.
AHFC New Home Efficiency Rebate Program – This is a loan reduction program for new
construction. There are no income restrictions on this program.
AKEnergySmart Curriculum is a K-12 educational tool available through a collaboration from
AHFC, Renewable Energy Alaska Project (REAP) and Alaska Center for Energy and Power (ACEP).
It can be accessed at: http://www.akenergysmart.org/.
AHFC administers weatherization programs that have been created to award grants to non-profit
organizations for the purpose of improving the energy efficiency of low-income homes statewide. These
programs also provide training and technical assistance in the area of housing energy efficiency. Funds
for these programs come from the U.S. Department of Energy as well as AHFC; however, state money
makes up the bulk of the funding (Weatherization Programs, 2013).
42
The focus of weatherization is to increase the energy efficiency, safety, comfort and life expectancy of
homes. Typical improvements include the caulking and sealing of windows and doors, adding insulation
to walls, floors and ceilings, and improving the efficiency of heating systems. By making homes more
energy-efficient, families spend less for heating, freeing up more household income for other basic
necessities and expenditures which help support local economies (RurALCap Weatherization Services).
3.1.4. Benchmarking
Using American Recovery & Reinvestment Act (ARRA) funds through the State Energy Program, the
AHFC conducted an extensive benchmarking program that included 1,200 public facilities statewide
including two in the Northwest Arctic region—the Alaska Technical Center Dormitory in Kotzebue and
the school in Buckland. By benchmarking a facility, owners and managers can identify trends in a
building’s energy use and compare use and operating costs to other buildings. Benchmarking allows
facility owners to become more aware of how their decisions on design, construction and operations
dramatically affect energy usage and costs throughout the life of the building. In 2011 and 2012, AHFC
also funded 327 audits statewide using ARRA funds through the State Energy Program.
3.1.5. Water and Sewer Improvements
The Alaska Native Tribal Health Consortium (ANTHC) Division of Health and Engineering also has an
active program to increase energy efficiency focusing on decreasing energy costs in water and sewer
systems, which have a great potential for energy efficiency improvements. Energy costs associated with
sewer and water utilities place a huge burden on villages. A recent study of water and sewer systems in
northwest Alaska revealed that the energy needed to effectively operate the sewage system, raw water
energy, water buildings and tanks, loops and services and raw water heating at -8° F can consume
between 4,350 and 18,625 gallons of diesel fuel a year. This is a significant portion of the overall village
energy use. Communities with above ground systems experience the greatest heat loss and are the
most inefficient.
In 2009, ANTHC formed the Energy Projects Group to help address energy issues in rural Alaska. The
Alaska Rural Utility Collaborative (ARUC) is an ANTHC program to manage, operate and maintain water
and sewer systems in rural Alaska. Currently, five communities in the region have joined the ARUC:
Ambler, Deering, Kiana, Kobuk, Noorvik and Selawik. ARUC works with each community to make its
water and sewer systems as sustainable as possible.
In the last five years, ARUC has implemented or expects to complete energy audits, energy efficiency
training, heat recovery systems and installation of remote monitoring equipment to help identify
problems and prevent catastrophic failure (see Table 12) in many communities in the region. ANTHC
receives funding for these energy efficiency improvements from a variety of sources including Alaska
Energy Authority, Denali Commission, U.S Department of Energy, and U.S. Rural Development program.
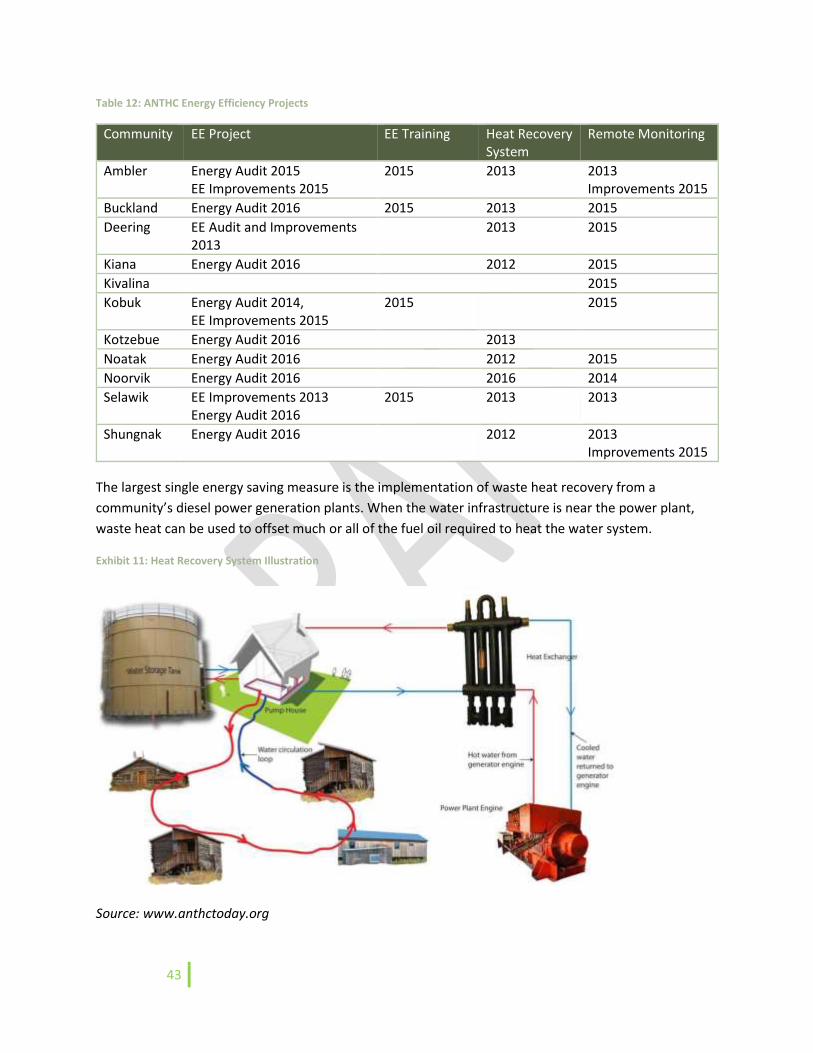
43
Table 12: ANTHC Energy Efficiency Projects
Community EE Project EE Training Heat Recovery System
Remote Monitoring
Ambler Energy Audit 2015 EE Improvements 2015
2015 2013 2013 Improvements 2015
Buckland Energy Audit 2016 2015 2013 2015
Deering EE Audit and Improvements 2013
2013 2015
Kiana Energy Audit 2016 2012 2015
Kivalina 2015
Kobuk Energy Audit 2014, EE Improvements 2015
2015 2015
Kotzebue Energy Audit 2016 2013
Noatak Energy Audit 2016 2012 2015
Noorvik Energy Audit 2016 2016 2014
Selawik EE Improvements 2013 Energy Audit 2016
2015 2013 2013
Shungnak Energy Audit 2016 2012 2013 Improvements 2015
The largest single energy saving measure is the implementation of waste heat recovery from a
community’s diesel power generation plants. When the water infrastructure is near the power plant,
waste heat can be used to offset much or all of the fuel oil required to heat the water system.
Exhibit 11: Heat Recovery System Illustration
Source: www.anthctoday.org
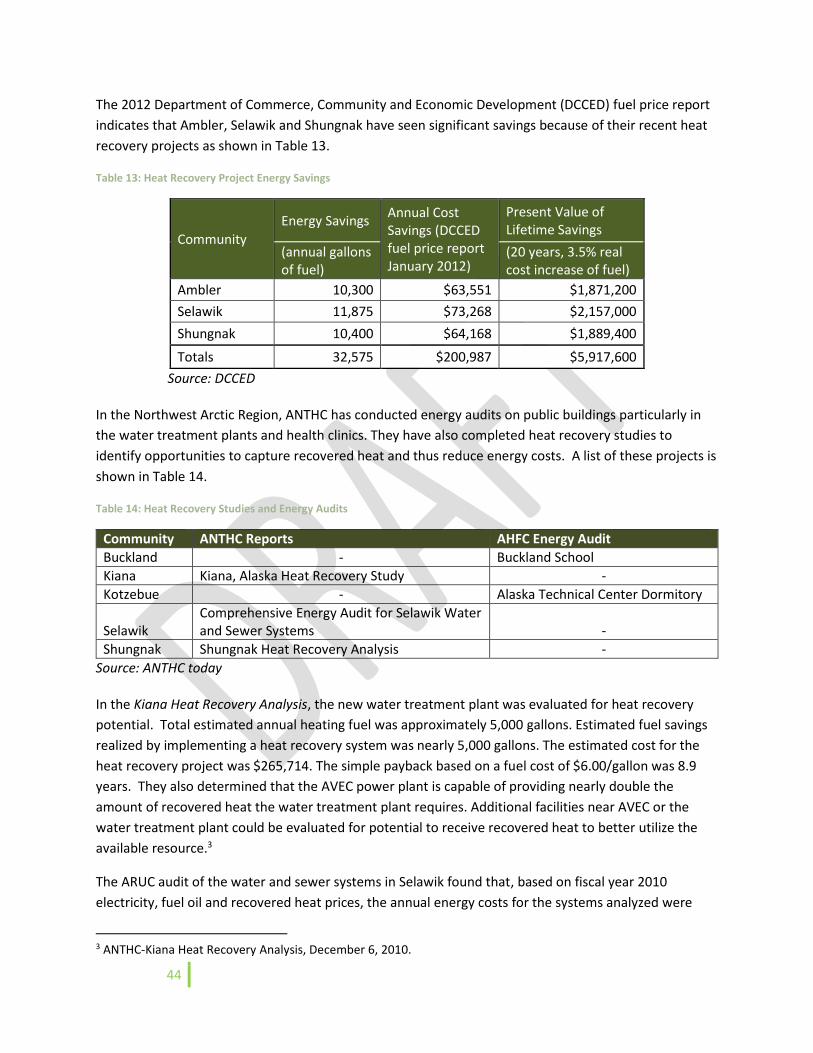
44
The 2012 Department of Commerce, Community and Economic Development (DCCED) fuel price report
indicates that Ambler, Selawik and Shungnak have seen significant savings because of their recent heat
recovery projects as shown in Table 13.
Table 13: Heat Recovery Project Energy Savings
Community
Energy Savings Annual Cost Savings (DCCED fuel price report January 2012)
Present Value of Lifetime Savings
(annual gallons of fuel)
(20 years, 3.5% real cost increase of fuel)
Ambler 10,300 $63,551 $1,871,200
Selawik 11,875 $73,268 $2,157,000
Shungnak 10,400 $64,168 $1,889,400
Totals 32,575 $200,987 $5,917,600
Source: DCCED
In the Northwest Arctic Region, ANTHC has conducted energy audits on public buildings particularly in
the water treatment plants and health clinics. They have also completed heat recovery studies to
identify opportunities to capture recovered heat and thus reduce energy costs. A list of these projects is
shown in Table 14.
Table 14: Heat Recovery Studies and Energy Audits
Community ANTHC Reports AHFC Energy Audit
Buckland - Buckland School
Kiana Kiana, Alaska Heat Recovery Study -
Kotzebue - Alaska Technical Center Dormitory
Selawik Comprehensive Energy Audit for Selawik Water and Sewer Systems -
Shungnak Shungnak Heat Recovery Analysis -
Source: ANTHC today
In the Kiana Heat Recovery Analysis, the new water treatment plant was evaluated for heat recovery
potential. Total estimated annual heating fuel was approximately 5,000 gallons. Estimated fuel savings
realized by implementing a heat recovery system was nearly 5,000 gallons. The estimated cost for the
heat recovery project was $265,714. The simple payback based on a fuel cost of $6.00/gallon was 8.9
years. They also determined that the AVEC power plant is capable of providing nearly double the
amount of recovered heat the water treatment plant requires. Additional facilities near AVEC or the
water treatment plant could be evaluated for potential to receive recovered heat to better utilize the
available resource.3
The ARUC audit of the water and sewer systems in Selawik found that, based on fiscal year 2010
electricity, fuel oil and recovered heat prices, the annual energy costs for the systems analyzed were
3 ANTHC-Kiana Heat Recovery Analysis, December 6, 2010.
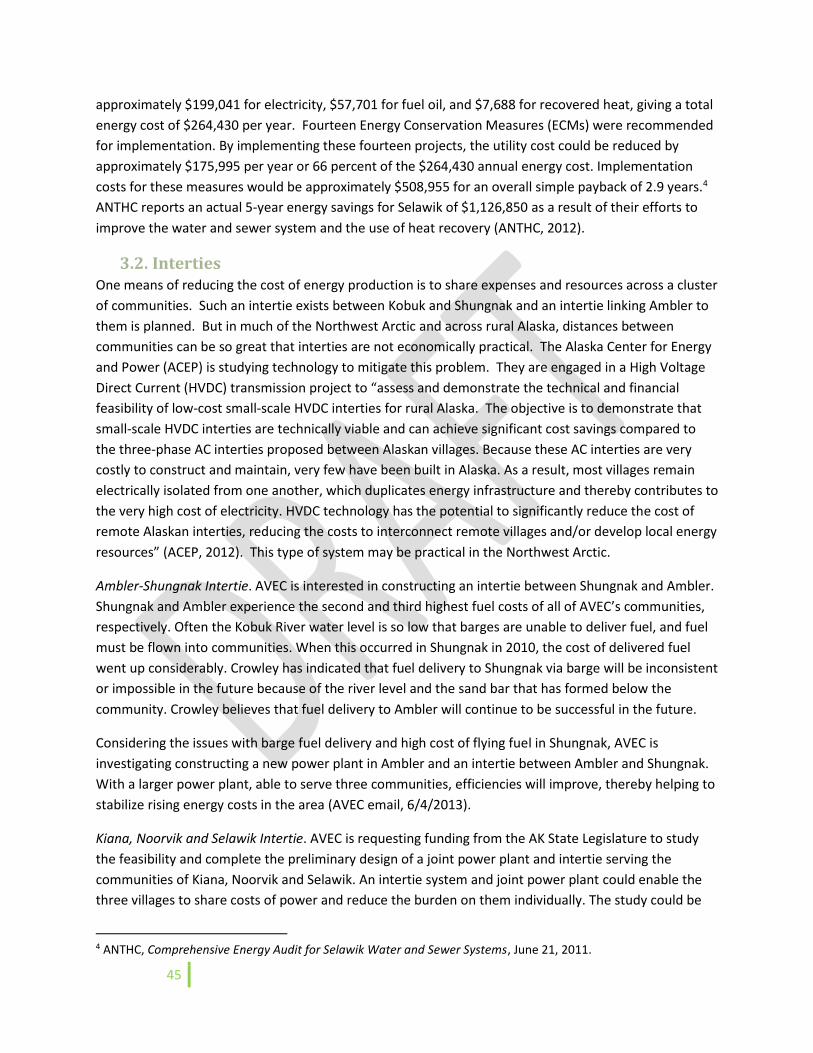
45
approximately $199,041 for electricity, $57,701 for fuel oil, and $7,688 for recovered heat, giving a total
energy cost of $264,430 per year. Fourteen Energy Conservation Measures (ECMs) were recommended
for implementation. By implementing these fourteen projects, the utility cost could be reduced by
approximately $175,995 per year or 66 percent of the $264,430 annual energy cost. Implementation
costs for these measures would be approximately $508,955 for an overall simple payback of 2.9 years.4
ANTHC reports an actual 5-year energy savings for Selawik of $1,126,850 as a result of their efforts to
improve the water and sewer system and the use of heat recovery (ANTHC, 2012).
3.2. Interties One means of reducing the cost of energy production is to share expenses and resources across a cluster
of communities. Such an intertie exists between Kobuk and Shungnak and an intertie linking Ambler to
them is planned. But in much of the Northwest Arctic and across rural Alaska, distances between
communities can be so great that interties are not economically practical. The Alaska Center for Energy
and Power (ACEP) is studying technology to mitigate this problem. They are engaged in a High Voltage
Direct Current (HVDC) transmission project to “assess and demonstrate the technical and financial
feasibility of low-cost small-scale HVDC interties for rural Alaska. The objective is to demonstrate that
small-scale HVDC interties are technically viable and can achieve significant cost savings compared to
the three-phase AC interties proposed between Alaskan villages. Because these AC interties are very
costly to construct and maintain, very few have been built in Alaska. As a result, most villages remain
electrically isolated from one another, which duplicates energy infrastructure and thereby contributes to
the very high cost of electricity. HVDC technology has the potential to significantly reduce the cost of
remote Alaskan interties, reducing the costs to interconnect remote villages and/or develop local energy
resources” (ACEP, 2012). This type of system may be practical in the Northwest Arctic.
Ambler-Shungnak Intertie. AVEC is interested in constructing an intertie between Shungnak and Ambler.
Shungnak and Ambler experience the second and third highest fuel costs of all of AVEC’s communities,
respectively. Often the Kobuk River water level is so low that barges are unable to deliver fuel, and fuel
must be flown into communities. When this occurred in Shungnak in 2010, the cost of delivered fuel
went up considerably. Crowley has indicated that fuel delivery to Shungnak via barge will be inconsistent
or impossible in the future because of the river level and the sand bar that has formed below the
community. Crowley believes that fuel delivery to Ambler will continue to be successful in the future.
Considering the issues with barge fuel delivery and high cost of flying fuel in Shungnak, AVEC is
investigating constructing a new power plant in Ambler and an intertie between Ambler and Shungnak.
With a larger power plant, able to serve three communities, efficiencies will improve, thereby helping to
stabilize rising energy costs in the area (AVEC email, 6/4/2013).
Kiana, Noorvik and Selawik Intertie. AVEC is requesting funding from the AK State Legislature to study
the feasibility and complete the preliminary design of a joint power plant and intertie serving the
communities of Kiana, Noorvik and Selawik. An intertie system and joint power plant could enable the
three villages to share costs of power and reduce the burden on them individually. The study could be
4 ANTHC, Comprehensive Energy Audit for Selawik Water and Sewer Systems, June 21, 2011.
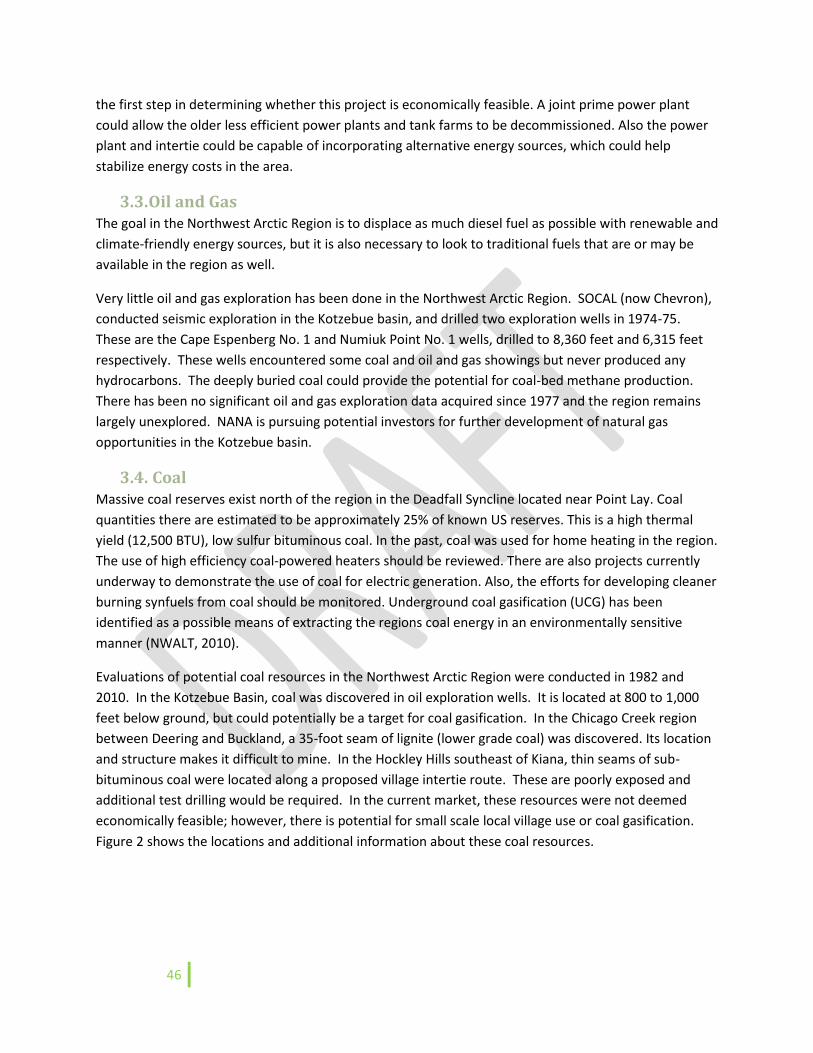
46
the first step in determining whether this project is economically feasible. A joint prime power plant
could allow the older less efficient power plants and tank farms to be decommissioned. Also the power
plant and intertie could be capable of incorporating alternative energy sources, which could help
stabilize energy costs in the area.
3.3. Oil and Gas The goal in the Northwest Arctic Region is to displace as much diesel fuel as possible with renewable and
climate-friendly energy sources, but it is also necessary to look to traditional fuels that are or may be
available in the region as well.
Very little oil and gas exploration has been done in the Northwest Arctic Region. SOCAL (now Chevron),
conducted seismic exploration in the Kotzebue basin, and drilled two exploration wells in 1974-75.
These are the Cape Espenberg No. 1 and Numiuk Point No. 1 wells, drilled to 8,360 feet and 6,315 feet
respectively. These wells encountered some coal and oil and gas showings but never produced any
hydrocarbons. The deeply buried coal could provide the potential for coal-bed methane production.
There has been no significant oil and gas exploration data acquired since 1977 and the region remains
largely unexplored. NANA is pursuing potential investors for further development of natural gas
opportunities in the Kotzebue basin.
3.4. Coal Massive coal reserves exist north of the region in the Deadfall Syncline located near Point Lay. Coal
quantities there are estimated to be approximately 25% of known US reserves. This is a high thermal
yield (12,500 BTU), low sulfur bituminous coal. In the past, coal was used for home heating in the region.
The use of high efficiency coal-powered heaters should be reviewed. There are also projects currently
underway to demonstrate the use of coal for electric generation. Also, the efforts for developing cleaner
burning synfuels from coal should be monitored. Underground coal gasification (UCG) has been
identified as a possible means of extracting the regions coal energy in an environmentally sensitive
manner (NWALT, 2010).
Evaluations of potential coal resources in the Northwest Arctic Region were conducted in 1982 and
2010. In the Kotzebue Basin, coal was discovered in oil exploration wells. It is located at 800 to 1,000
feet below ground, but could potentially be a target for coal gasification. In the Chicago Creek region
between Deering and Buckland, a 35-foot seam of lignite (lower grade coal) was discovered. Its location
and structure makes it difficult to mine. In the Hockley Hills southeast of Kiana, thin seams of sub-
bituminous coal were located along a proposed village intertie route. These are poorly exposed and
additional test drilling would be required. In the current market, these resources were not deemed
economically feasible; however, there is potential for small scale local village use or coal gasification.
Figure 2 shows the locations and additional information about these coal resources.
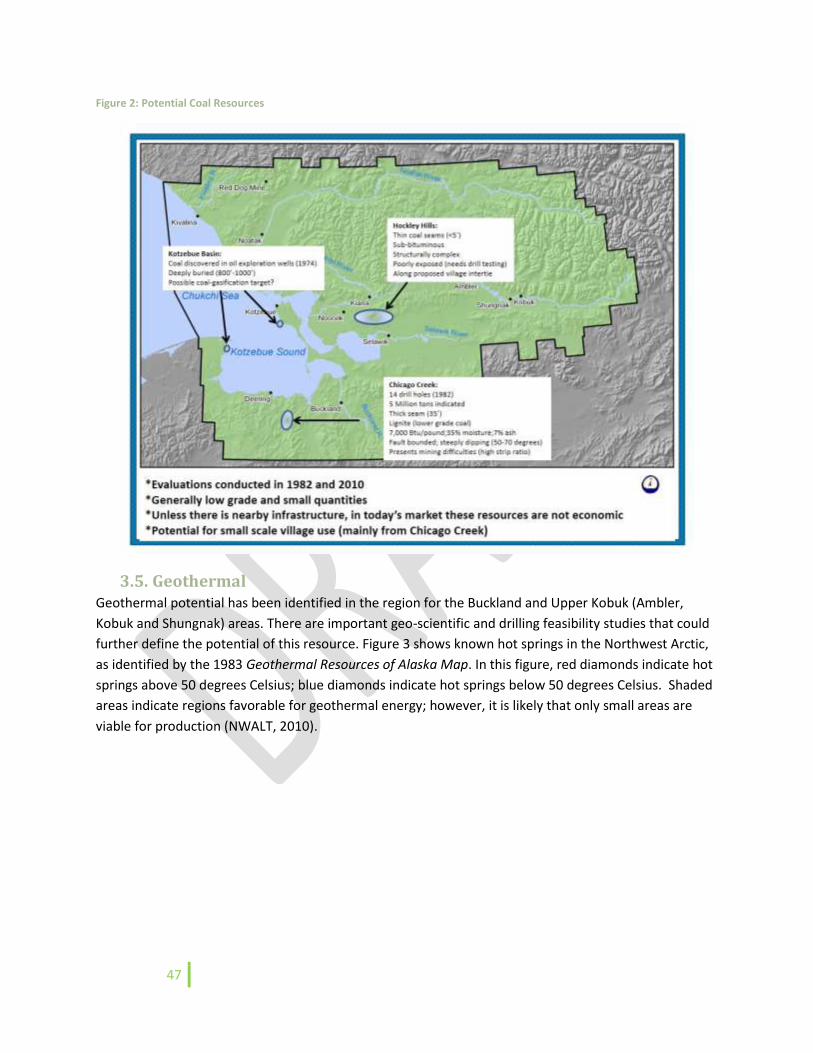
47
Figure 2: Potential Coal Resources
3.5. Geothermal Geothermal potential has been identified in the region for the Buckland and Upper Kobuk (Ambler,
Kobuk and Shungnak) areas. There are important geo-scientific and drilling feasibility studies that could
further define the potential of this resource. Figure 3 shows known hot springs in the Northwest Arctic,
as identified by the 1983 Geothermal Resources of Alaska Map. In this figure, red diamonds indicate hot
springs above 50 degrees Celsius; blue diamonds indicate hot springs below 50 degrees Celsius. Shaded
areas indicate regions favorable for geothermal energy; however, it is likely that only small areas are
viable for production (NWALT, 2010).
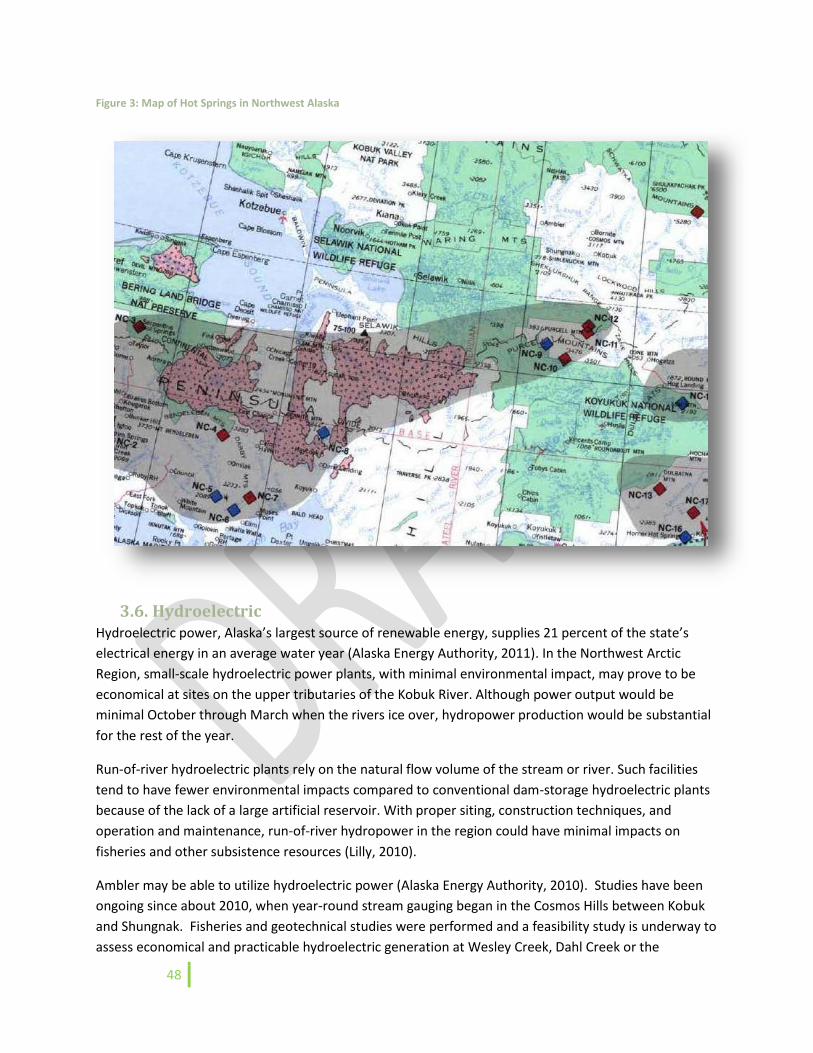
48
Figure 3: Map of Hot Springs in Northwest Alaska
3.6. Hydroelectric Hydroelectric power, Alaska’s largest source of renewable energy, supplies 21 percent of the state’s
electrical energy in an average water year (Alaska Energy Authority, 2011). In the Northwest Arctic
Region, small-scale hydroelectric power plants, with minimal environmental impact, may prove to be
economical at sites on the upper tributaries of the Kobuk River. Although power output would be
minimal October through March when the rivers ice over, hydropower production would be substantial
for the rest of the year.
Run-of-river hydroelectric plants rely on the natural flow volume of the stream or river. Such facilities
tend to have fewer environmental impacts compared to conventional dam-storage hydroelectric plants
because of the lack of a large artificial reservoir. With proper siting, construction techniques, and
operation and maintenance, run-of-river hydropower in the region could have minimal impacts on
fisheries and other subsistence resources (Lilly, 2010).
Ambler may be able to utilize hydroelectric power (Alaska Energy Authority, 2010). Studies have been
ongoing since about 2010, when year-round stream gauging began in the Cosmos Hills between Kobuk
and Shungnak. Fisheries and geotechnical studies were performed and a feasibility study is underway to
assess economical and practicable hydroelectric generation at Wesley Creek, Dahl Creek or the
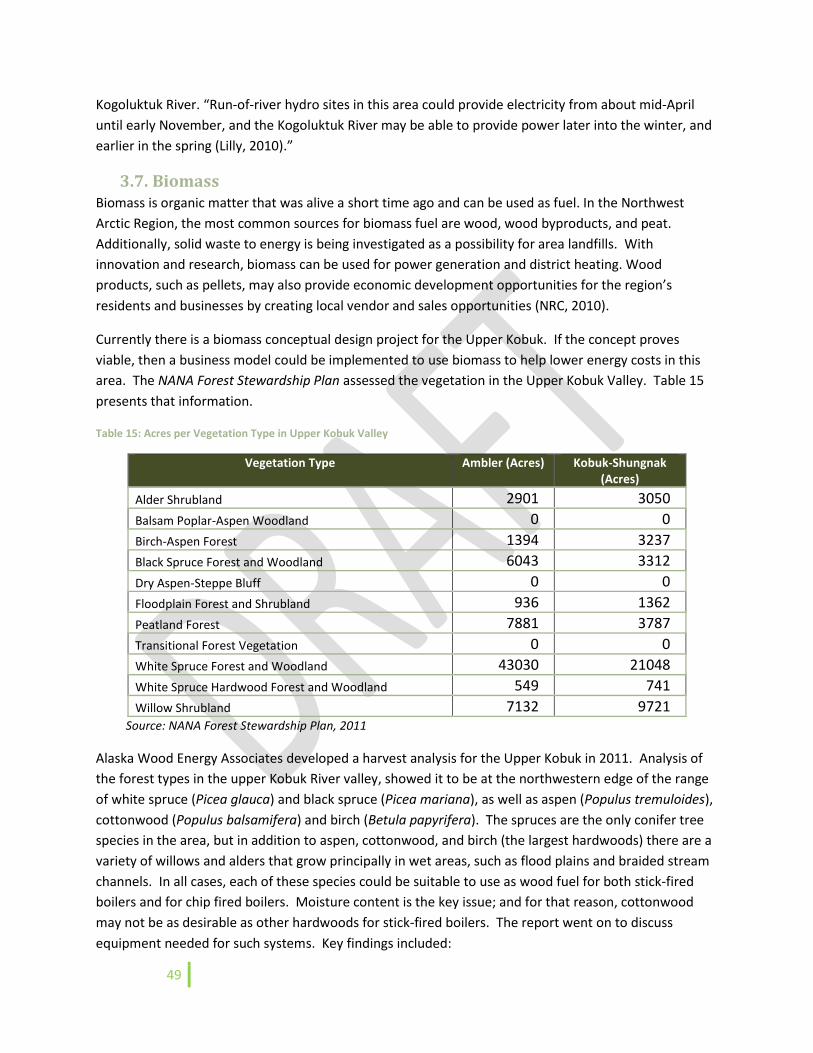
49
Kogoluktuk River. “Run-of-river hydro sites in this area could provide electricity from about mid-April
until early November, and the Kogoluktuk River may be able to provide power later into the winter, and
earlier in the spring (Lilly, 2010).”
3.7. Biomass Biomass is organic matter that was alive a short time ago and can be used as fuel. In the Northwest
Arctic Region, the most common sources for biomass fuel are wood, wood byproducts, and peat.
Additionally, solid waste to energy is being investigated as a possibility for area landfills. With
innovation and research, biomass can be used for power generation and district heating. Wood
products, such as pellets, may also provide economic development opportunities for the region’s
residents and businesses by creating local vendor and sales opportunities (NRC, 2010).
Currently there is a biomass conceptual design project for the Upper Kobuk. If the concept proves
viable, then a business model could be implemented to use biomass to help lower energy costs in this
area. The NANA Forest Stewardship Plan assessed the vegetation in the Upper Kobuk Valley. Table 15
presents that information.
Table 15: Acres per Vegetation Type in Upper Kobuk Valley
Vegetation Type Ambler (Acres) Kobuk-Shungnak (Acres)
Alder Shrubland 2901 3050
Balsam Poplar-Aspen Woodland 0 0
Birch-Aspen Forest 1394 3237
Black Spruce Forest and Woodland 6043 3312
Dry Aspen-Steppe Bluff 0 0
Floodplain Forest and Shrubland 936 1362
Peatland Forest 7881 3787
Transitional Forest Vegetation 0 0
White Spruce Forest and Woodland 43030 21048
White Spruce Hardwood Forest and Woodland 549 741
Willow Shrubland 7132 9721 Source: NANA Forest Stewardship Plan, 2011
Alaska Wood Energy Associates developed a harvest analysis for the Upper Kobuk in 2011. Analysis of
the forest types in the upper Kobuk River valley, showed it to be at the northwestern edge of the range
of white spruce (Picea glauca) and black spruce (Picea mariana), as well as aspen (Populus tremuloides),
cottonwood (Populus balsamifera) and birch (Betula papyrifera). The spruces are the only conifer tree
species in the area, but in addition to aspen, cottonwood, and birch (the largest hardwoods) there are a
variety of willows and alders that grow principally in wet areas, such as flood plains and braided stream
channels. In all cases, each of these species could be suitable to use as wood fuel for both stick-fired
boilers and for chip fired boilers. Moisture content is the key issue; and for that reason, cottonwood
may not be as desirable as other hardwoods for stick-fired boilers. The report went on to discuss
equipment needed for such systems. Key findings included:
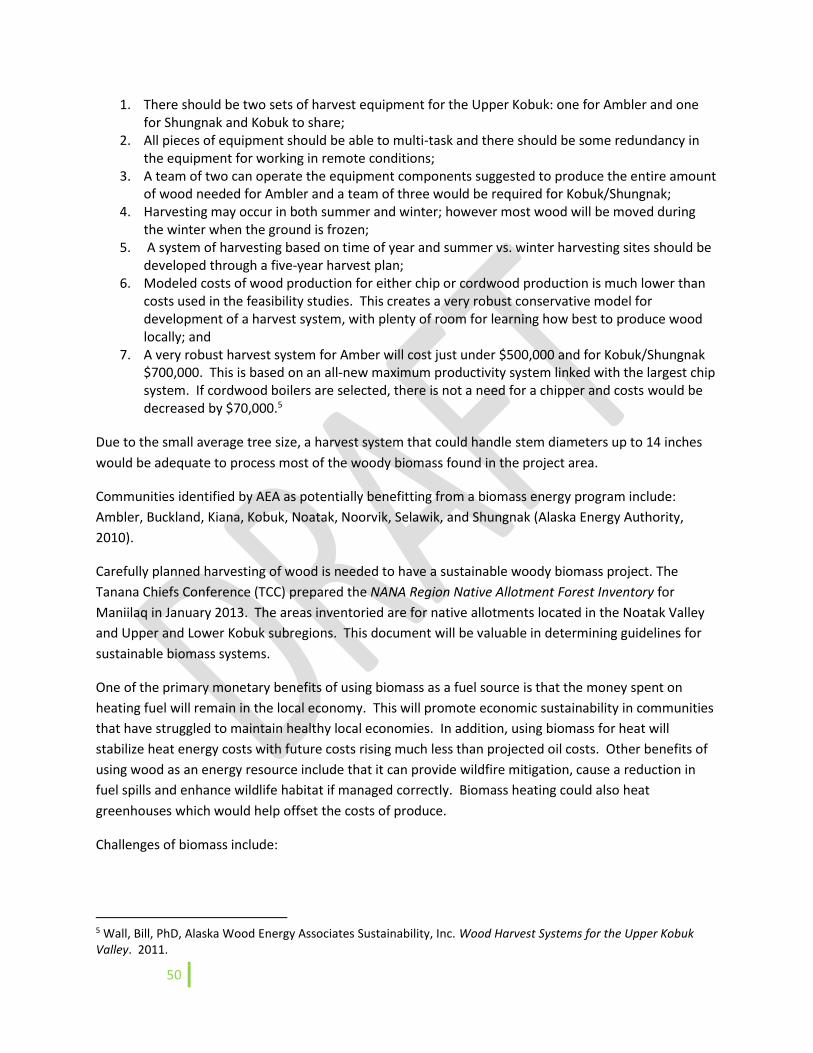
50
1. There should be two sets of harvest equipment for the Upper Kobuk: one for Ambler and one for Shungnak and Kobuk to share;
2. All pieces of equipment should be able to multi-task and there should be some redundancy in the equipment for working in remote conditions;
3. A team of two can operate the equipment components suggested to produce the entire amount of wood needed for Ambler and a team of three would be required for Kobuk/Shungnak;
4. Harvesting may occur in both summer and winter; however most wood will be moved during the winter when the ground is frozen;
5. A system of harvesting based on time of year and summer vs. winter harvesting sites should be developed through a five-year harvest plan;
6. Modeled costs of wood production for either chip or cordwood production is much lower than costs used in the feasibility studies. This creates a very robust conservative model for development of a harvest system, with plenty of room for learning how best to produce wood locally; and
7. A very robust harvest system for Amber will cost just under $500,000 and for Kobuk/Shungnak $700,000. This is based on an all-new maximum productivity system linked with the largest chip system. If cordwood boilers are selected, there is not a need for a chipper and costs would be decreased by $70,000.5
Due to the small average tree size, a harvest system that could handle stem diameters up to 14 inches
would be adequate to process most of the woody biomass found in the project area.
Communities identified by AEA as potentially benefitting from a biomass energy program include:
Ambler, Buckland, Kiana, Kobuk, Noatak, Noorvik, Selawik, and Shungnak (Alaska Energy Authority,
2010).
Carefully planned harvesting of wood is needed to have a sustainable woody biomass project. The
Tanana Chiefs Conference (TCC) prepared the NANA Region Native Allotment Forest Inventory for
Maniilaq in January 2013. The areas inventoried are for native allotments located in the Noatak Valley
and Upper and Lower Kobuk subregions. This document will be valuable in determining guidelines for
sustainable biomass systems.
One of the primary monetary benefits of using biomass as a fuel source is that the money spent on
heating fuel will remain in the local economy. This will promote economic sustainability in communities
that have struggled to maintain healthy local economies. In addition, using biomass for heat will
stabilize heat energy costs with future costs rising much less than projected oil costs. Other benefits of
using wood as an energy resource include that it can provide wildfire mitigation, cause a reduction in
fuel spills and enhance wildlife habitat if managed correctly. Biomass heating could also heat
greenhouses which would help offset the costs of produce.
Challenges of biomass include:
5 Wall, Bill, PhD, Alaska Wood Energy Associates Sustainability, Inc. Wood Harvest Systems for the Upper Kobuk Valley. 2011.
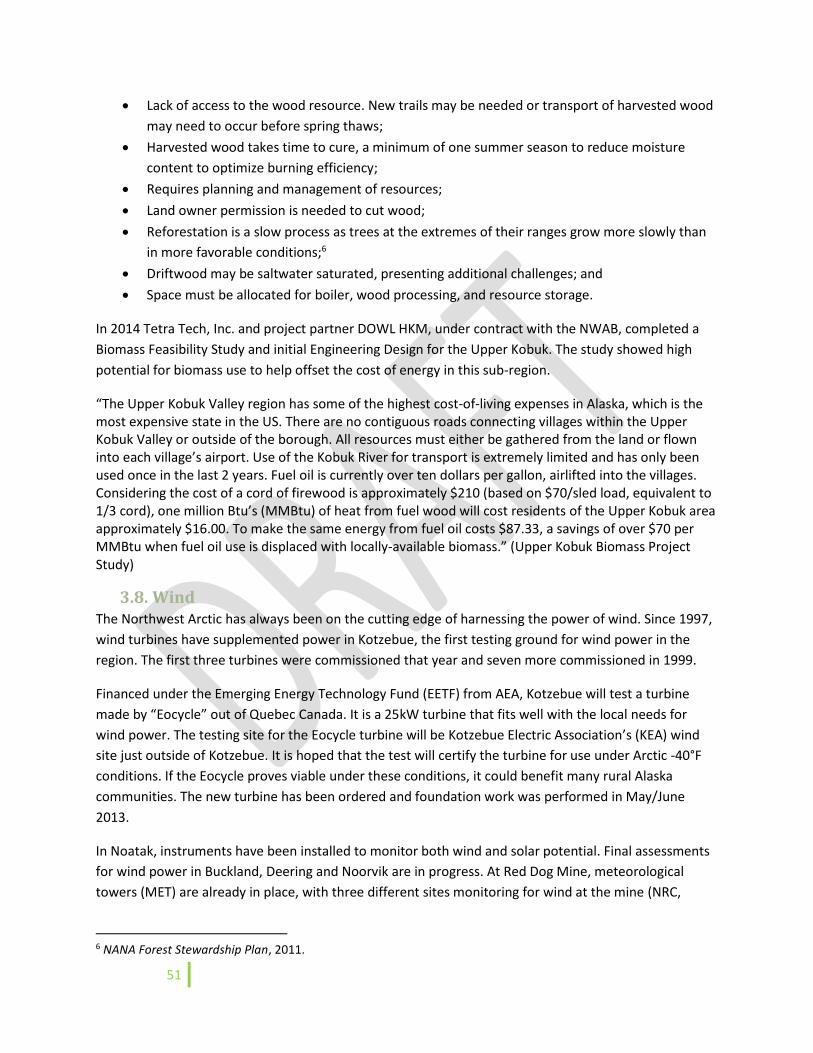
51
Lack of access to the wood resource. New trails may be needed or transport of harvested wood
may need to occur before spring thaws;
Harvested wood takes time to cure, a minimum of one summer season to reduce moisture
content to optimize burning efficiency;
Requires planning and management of resources;
Land owner permission is needed to cut wood;
Reforestation is a slow process as trees at the extremes of their ranges grow more slowly than
in more favorable conditions;6
Driftwood may be saltwater saturated, presenting additional challenges; and
Space must be allocated for boiler, wood processing, and resource storage.
In 2014 Tetra Tech, Inc. and project partner DOWL HKM, under contract with the NWAB, completed a
Biomass Feasibility Study and initial Engineering Design for the Upper Kobuk. The study showed high
potential for biomass use to help offset the cost of energy in this sub-region.
“The Upper Kobuk Valley region has some of the highest cost-of-living expenses in Alaska, which is the most expensive state in the US. There are no contiguous roads connecting villages within the Upper Kobuk Valley or outside of the borough. All resources must either be gathered from the land or flown into each village’s airport. Use of the Kobuk River for transport is extremely limited and has only been used once in the last 2 years. Fuel oil is currently over ten dollars per gallon, airlifted into the villages. Considering the cost of a cord of firewood is approximately $210 (based on $70/sled load, equivalent to 1/3 cord), one million Btu’s (MMBtu) of heat from fuel wood will cost residents of the Upper Kobuk area approximately $16.00. To make the same energy from fuel oil costs $87.33, a savings of over $70 per MMBtu when fuel oil use is displaced with locally-available biomass.” (Upper Kobuk Biomass Project Study)
3.8. Wind The Northwest Arctic has always been on the cutting edge of harnessing the power of wind. Since 1997,
wind turbines have supplemented power in Kotzebue, the first testing ground for wind power in the
region. The first three turbines were commissioned that year and seven more commissioned in 1999.
Financed under the Emerging Energy Technology Fund (EETF) from AEA, Kotzebue will test a turbine
made by “Eocycle” out of Quebec Canada. It is a 25kW turbine that fits well with the local needs for
wind power. The testing site for the Eocycle turbine will be Kotzebue Electric Association’s (KEA) wind
site just outside of Kotzebue. It is hoped that the test will certify the turbine for use under Arctic -40°F
conditions. If the Eocycle proves viable under these conditions, it could benefit many rural Alaska
communities. The new turbine has been ordered and foundation work was performed in May/June
2013.
In Noatak, instruments have been installed to monitor both wind and solar potential. Final assessments
for wind power in Buckland, Deering and Noorvik are in progress. At Red Dog Mine, meteorological
towers (MET) are already in place, with three different sites monitoring for wind at the mine (NRC,
6 NANA Forest Stewardship Plan, 2011.
52
2010). Wind classification at the village sites is listed in Table 16. Wind speeds at Red Dog have been
monitored as high as 99 miles per hour. These winds have been from one direction, making the
resource more reliable.7
The quality of a wind resource is critical to determining the feasibility of a wind project. But other
important factors to consider include the size of a community’s electrical load, the price of displaced
fuel such as diesel, turbine foundation costs, the length of transmission lines, and other site-specific
variables. Potential wind power is rated on a scale of one to seven with seven being strongest (Alaska
Energy Authority, 2011).
Six of the communities in the Northwest Arctic Region have a Wind Power Class of 3-5 and therefore
have the potential to benefit from wind projects. Table 16 lists the communities and their power class
ratings along with the best potential wind areas identified.
Table 16: Northwest Arctic Region Community Wind Power Class Ratings
Community Estimated Wind Power Class (Location)
Project and Status (if any) Feasibility Study
Kotzebue 5 (Airport) 10 turbines 2 900 kW turbines
Yes Yes Eocycle Testing 2013/2014
Buckland 1 (Airport), 4 (7 miles west) Construction 2014 Yes
Deering 3 (Airport) Construction 2014 Yes
Kiana N/A None No
Noorvik 3 None Yes
Selawik 3 (Airport), map forecasts class 2 in region
4 turbines are installed in Selawik – AVEC to restart 2014
Yes
Kivalina 5 (Airport) Met Tower Yes
Noatak 4 Met Tower Yes
Kobuk N/A Met Tower going up near Shungnak May 2013 for feasibility study
May 2013-May 2014 Report June 2014 Shungnak N/A
Ambler 1-2 Wind Study complete 2011-12 Yes
Source: Alaska Energy Authority, 2011
Cost estimates for wind power systems in Deering, Buckland and Noorvik place costs including turbines,
transition lines, parts and engineering at almost $11 million dollars for all three communities.
7 Red Dog Mine, the next 20 years. Teck, 2009.
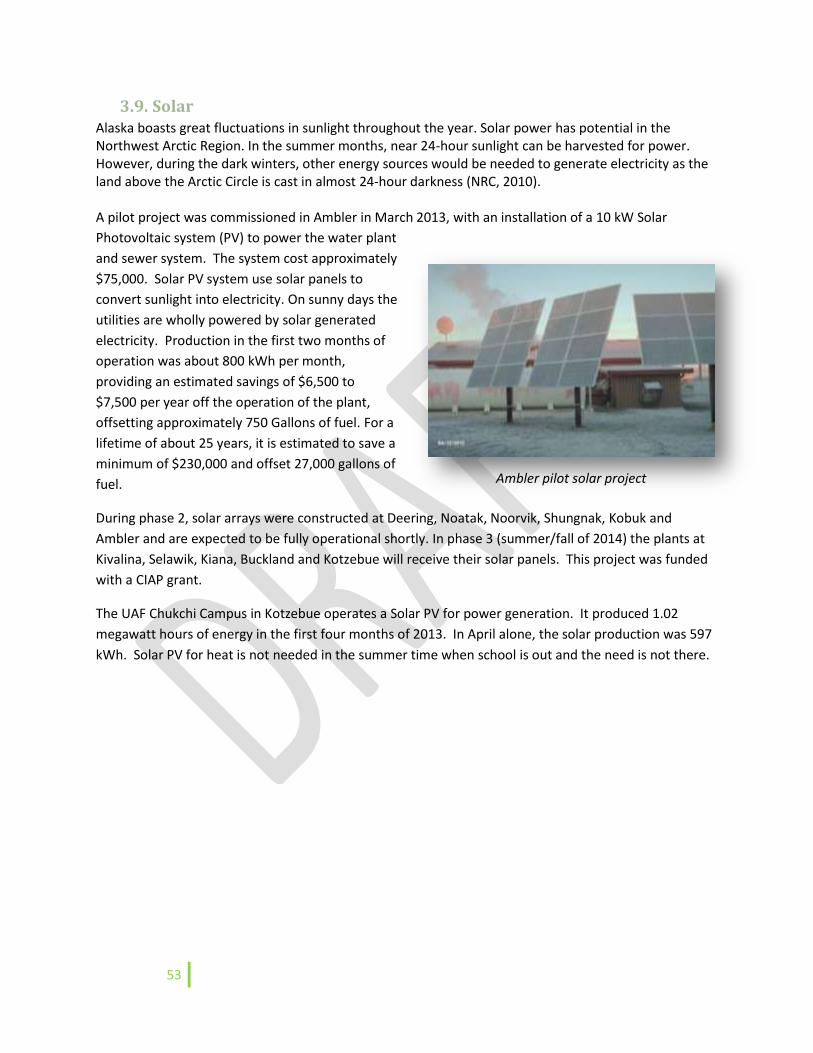
53
3.9. Solar Alaska boasts great fluctuations in sunlight throughout the year. Solar power has potential in the Northwest Arctic Region. In the summer months, near 24-hour sunlight can be harvested for power. However, during the dark winters, other energy sources would be needed to generate electricity as the land above the Arctic Circle is cast in almost 24-hour darkness (NRC, 2010). A pilot project was commissioned in Ambler in March 2013, with an installation of a 10 kW Solar
Photovoltaic system (PV) to power the water plant
and sewer system. The system cost approximately
$75,000. Solar PV system use solar panels to
convert sunlight into electricity. On sunny days the
utilities are wholly powered by solar generated
electricity. Production in the first two months of
operation was about 800 kWh per month,
providing an estimated savings of $6,500 to
$7,500 per year off the operation of the plant,
offsetting approximately 750 Gallons of fuel. For a
lifetime of about 25 years, it is estimated to save a
minimum of $230,000 and offset 27,000 gallons of
fuel.
During phase 2, solar arrays were constructed at Deering, Noatak, Noorvik, Shungnak, Kobuk and
Ambler and are expected to be fully operational shortly. In phase 3 (summer/fall of 2014) the plants at
Kivalina, Selawik, Kiana, Buckland and Kotzebue will receive their solar panels. This project was funded
with a CIAP grant.
The UAF Chukchi Campus in Kotzebue operates a Solar PV for power generation. It produced 1.02
megawatt hours of energy in the first four months of 2013. In April alone, the solar production was 597
kWh. Solar PV for heat is not needed in the summer time when school is out and the need is not there.
Ambler pilot solar project
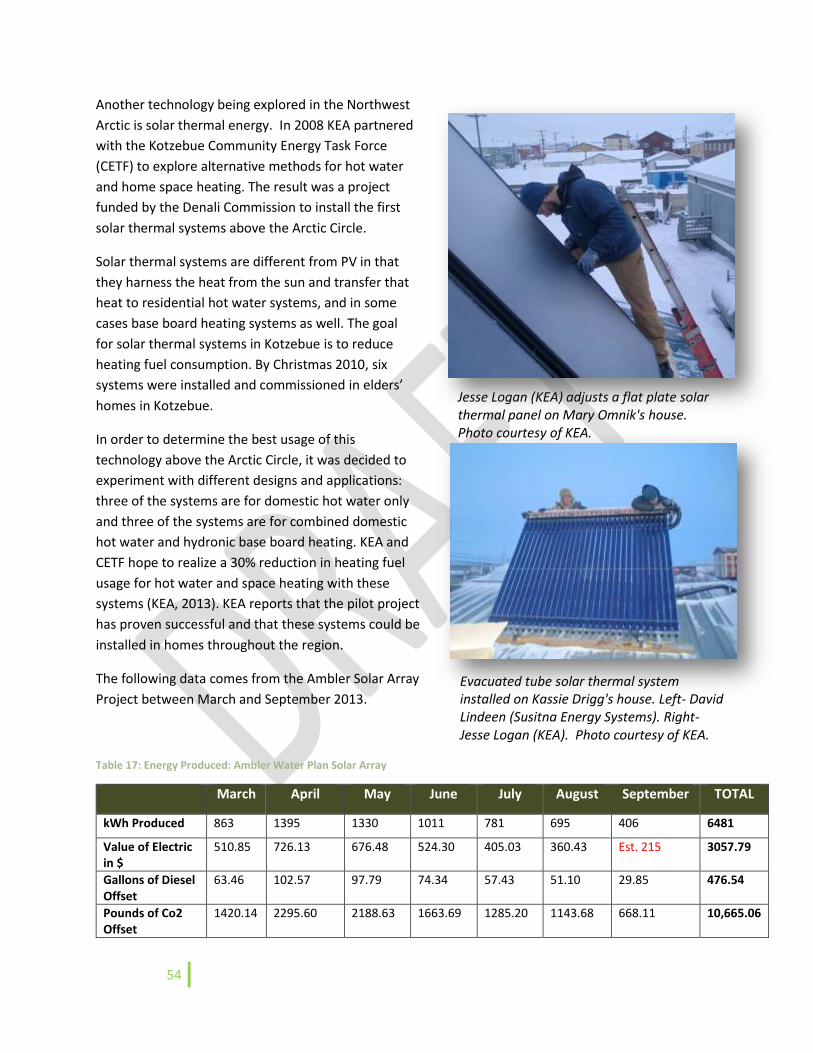
54
Another technology being explored in the Northwest
Arctic is solar thermal energy. In 2008 KEA partnered
with the Kotzebue Community Energy Task Force
(CETF) to explore alternative methods for hot water
and home space heating. The result was a project
funded by the Denali Commission to install the first
solar thermal systems above the Arctic Circle.
Solar thermal systems are different from PV in that
they harness the heat from the sun and transfer that
heat to residential hot water systems, and in some
cases base board heating systems as well. The goal
for solar thermal systems in Kotzebue is to reduce
heating fuel consumption. By Christmas 2010, six
systems were installed and commissioned in elders’
homes in Kotzebue.
In order to determine the best usage of this
technology above the Arctic Circle, it was decided to
experiment with different designs and applications:
three of the systems are for domestic hot water only
and three of the systems are for combined domestic
hot water and hydronic base board heating. KEA and
CETF hope to realize a 30% reduction in heating fuel
usage for hot water and space heating with these
systems (KEA, 2013). KEA reports that the pilot project
has proven successful and that these systems could be
installed in homes throughout the region.
The following data comes from the Ambler Solar Array
Project between March and September 2013.
Table 17: Energy Produced: Ambler Water Plan Solar Array
March April May June July August September TOTAL
kWh Produced 863 1395 1330 1011 781 695 406 6481
Value of Electric in $
510.85 726.13 676.48 524.30 405.03 360.43 Est. 215 3057.79
Gallons of Diesel Offset
63.46 102.57 97.79 74.34 57.43 51.10 29.85 476.54
Pounds of Co2 Offset
1420.14 2295.60 2188.63 1663.69 1285.20 1143.68 668.11 10,665.06
Evacuated tube solar thermal system installed on Kassie Drigg's house. Left- David Lindeen (Susitna Energy Systems). Right- Jesse Logan (KEA). Photo courtesy of KEA.
Jesse Logan (KEA) adjusts a flat plate solar thermal panel on Mary Omnik's house. Photo courtesy of KEA.
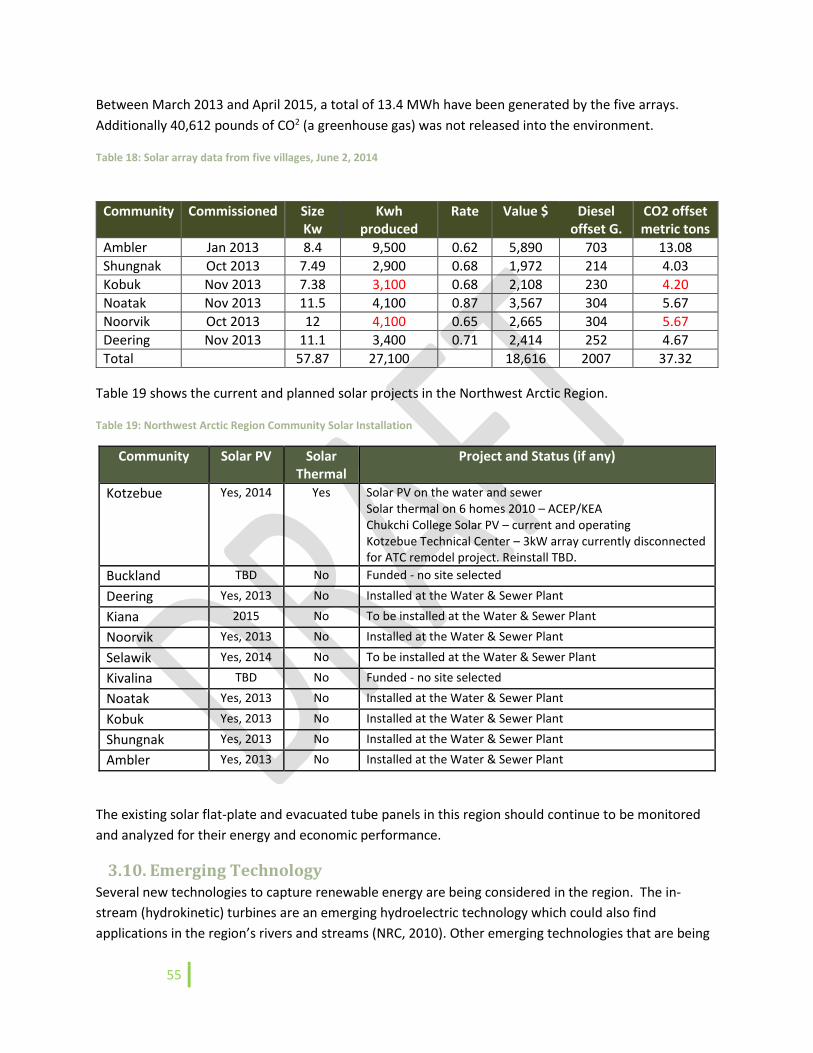
55
Between March 2013 and April 2015, a total of 13.4 MWh have been generated by the five arrays.
Additionally 40,612 pounds of CO2 (a greenhouse gas) was not released into the environment.
Table 18: Solar array data from five villages, June 2, 2014
Table 19 shows the current and planned solar projects in the Northwest Arctic Region.
Table 19: Northwest Arctic Region Community Solar Installation
Community Solar PV Solar Thermal
Project and Status (if any)
Kotzebue Yes, 2014 Yes Solar PV on the water and sewer Solar thermal on 6 homes 2010 – ACEP/KEA Chukchi College Solar PV – current and operating Kotzebue Technical Center – 3kW array currently disconnected for ATC remodel project. Reinstall TBD.
Buckland TBD No Funded - no site selected
Deering Yes, 2013 No Installed at the Water & Sewer Plant
Kiana 2015 No To be installed at the Water & Sewer Plant
Noorvik Yes, 2013 No Installed at the Water & Sewer Plant
Selawik Yes, 2014 No To be installed at the Water & Sewer Plant
Kivalina TBD No Funded - no site selected
Noatak Yes, 2013 No Installed at the Water & Sewer Plant
Kobuk Yes, 2013 No Installed at the Water & Sewer Plant
Shungnak Yes, 2013 No Installed at the Water & Sewer Plant
Ambler Yes, 2013 No Installed at the Water & Sewer Plant
The existing solar flat-plate and evacuated tube panels in this region should continue to be monitored
and analyzed for their energy and economic performance.
3.10. Emerging Technology Several new technologies to capture renewable energy are being considered in the region. The in-
stream (hydrokinetic) turbines are an emerging hydroelectric technology which could also find
applications in the region’s rivers and streams (NRC, 2010). Other emerging technologies that are being
Community Commissioned Size Kw
Kwh produced
Rate Value $ Diesel offset G.
CO2 offset metric tons
Ambler Jan 2013 8.4 9,500 0.62 5,890 703 13.08
Shungnak Oct 2013 7.49 2,900 0.68 1,972 214 4.03
Kobuk Nov 2013 7.38 3,100 0.68 2,108 230 4.20
Noatak Nov 2013 11.5 4,100 0.87 3,567 304 5.67
Noorvik Oct 2013 12 4,100 0.65 2,665 304 5.67
Deering Nov 2013 11.1 3,400 0.71 2,414 252 4.67
Total 57.87 27,100 18,616 2007 37.32
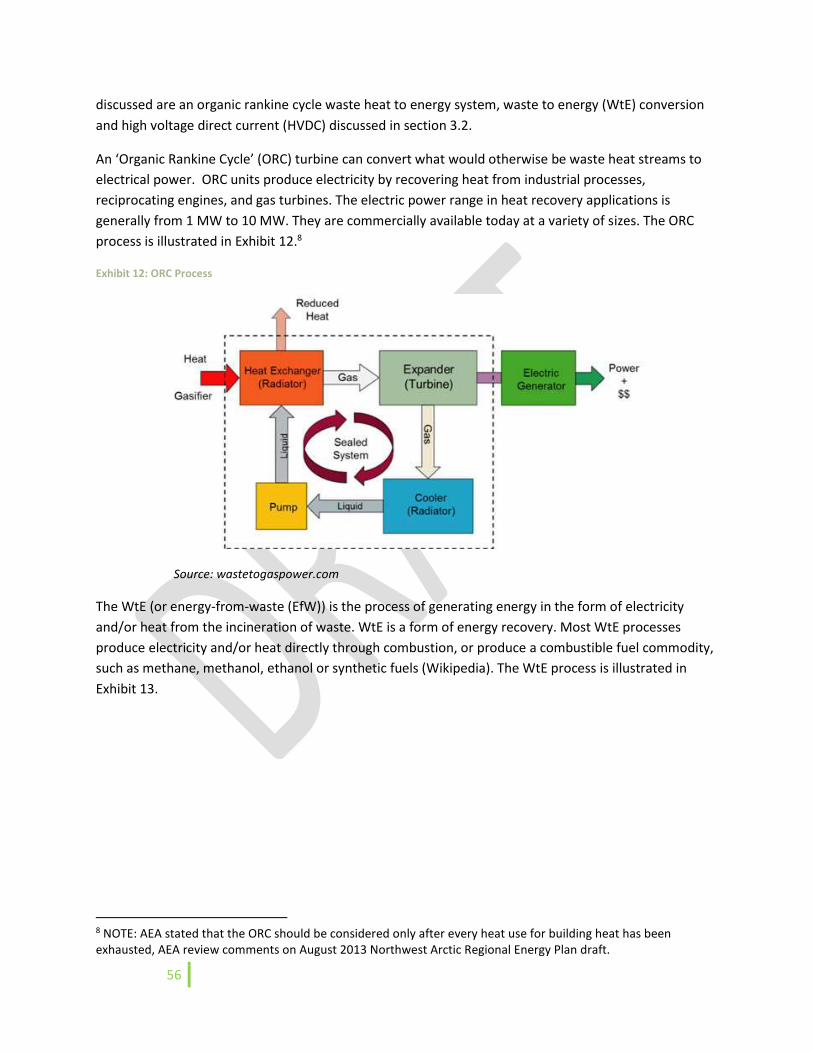
56
discussed are an organic rankine cycle waste heat to energy system, waste to energy (WtE) conversion
and high voltage direct current (HVDC) discussed in section 3.2.
An ‘Organic Rankine Cycle’ (ORC) turbine can convert what would otherwise be waste heat streams to
electrical power. ORC units produce electricity by recovering heat from industrial processes,
reciprocating engines, and gas turbines. The electric power range in heat recovery applications is
generally from 1 MW to 10 MW. They are commercially available today at a variety of sizes. The ORC
process is illustrated in Exhibit 12.8
Exhibit 12: ORC Process
Source: wastetogaspower.com
The WtE (or energy-from-waste (EfW)) is the process of generating energy in the form of electricity
and/or heat from the incineration of waste. WtE is a form of energy recovery. Most WtE processes
produce electricity and/or heat directly through combustion, or produce a combustible fuel commodity,
such as methane, methanol, ethanol or synthetic fuels (Wikipedia). The WtE process is illustrated in
Exhibit 13.
8 NOTE: AEA stated that the ORC should be considered only after every heat use for building heat has been exhausted, AEA review comments on August 2013 Northwest Arctic Regional Energy Plan draft.
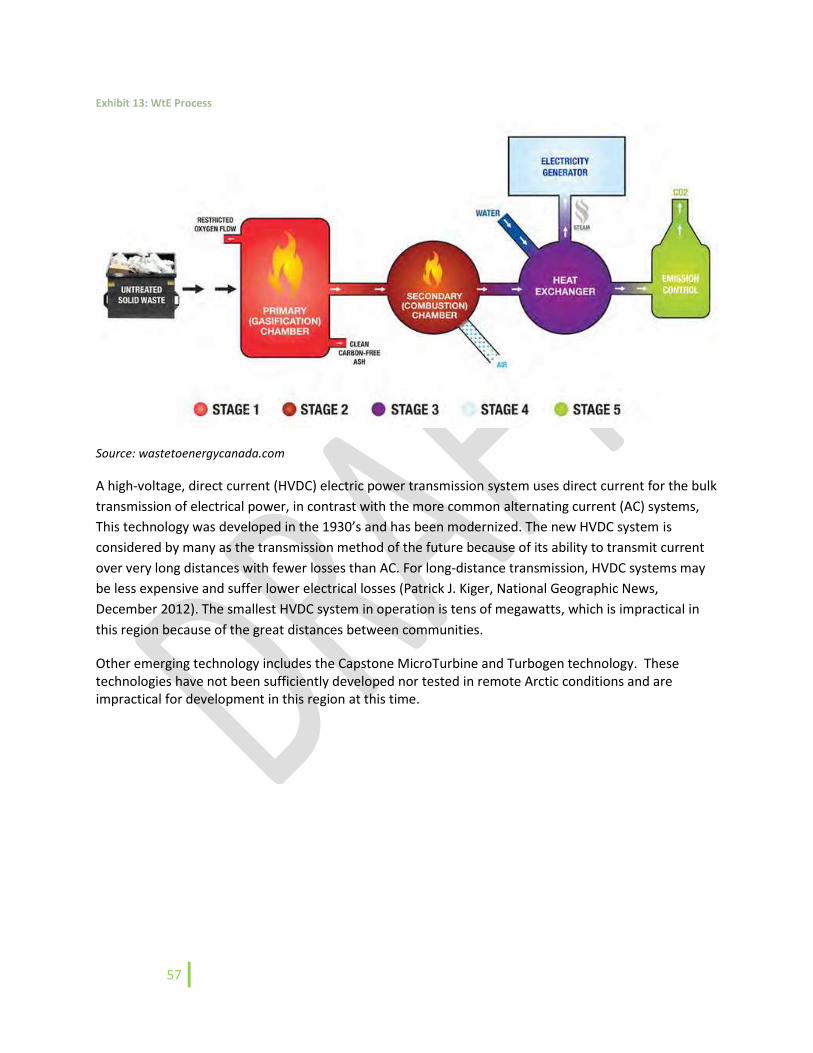
57
Exhibit 13: WtE Process
Source: wastetoenergycanada.com
A high-voltage, direct current (HVDC) electric power transmission system uses direct current for the bulk
transmission of electrical power, in contrast with the more common alternating current (AC) systems,
This technology was developed in the 1930’s and has been modernized. The new HVDC system is
considered by many as the transmission method of the future because of its ability to transmit current
over very long distances with fewer losses than AC. For long-distance transmission, HVDC systems may
be less expensive and suffer lower electrical losses (Patrick J. Kiger, National Geographic News,
December 2012). The smallest HVDC system in operation is tens of megawatts, which is impractical in
this region because of the great distances between communities.
Other emerging technology includes the Capstone MicroTurbine and Turbogen technology. These technologies have not been sufficiently developed nor tested in remote Arctic conditions and are impractical for development in this region at this time.
58
4. Subregional Summaries, Community and Energy Profiles
SUBREGIONAL SUMMARIES,
COMMUNITY & ENERGY PROFILES
59
This chapter provides a closer
look at the five subregions,
their communities, resources
and potential energy-related
projects
SUBREGIONAL SUMMARIES, COMMUNITY & ENERGY PROFILES
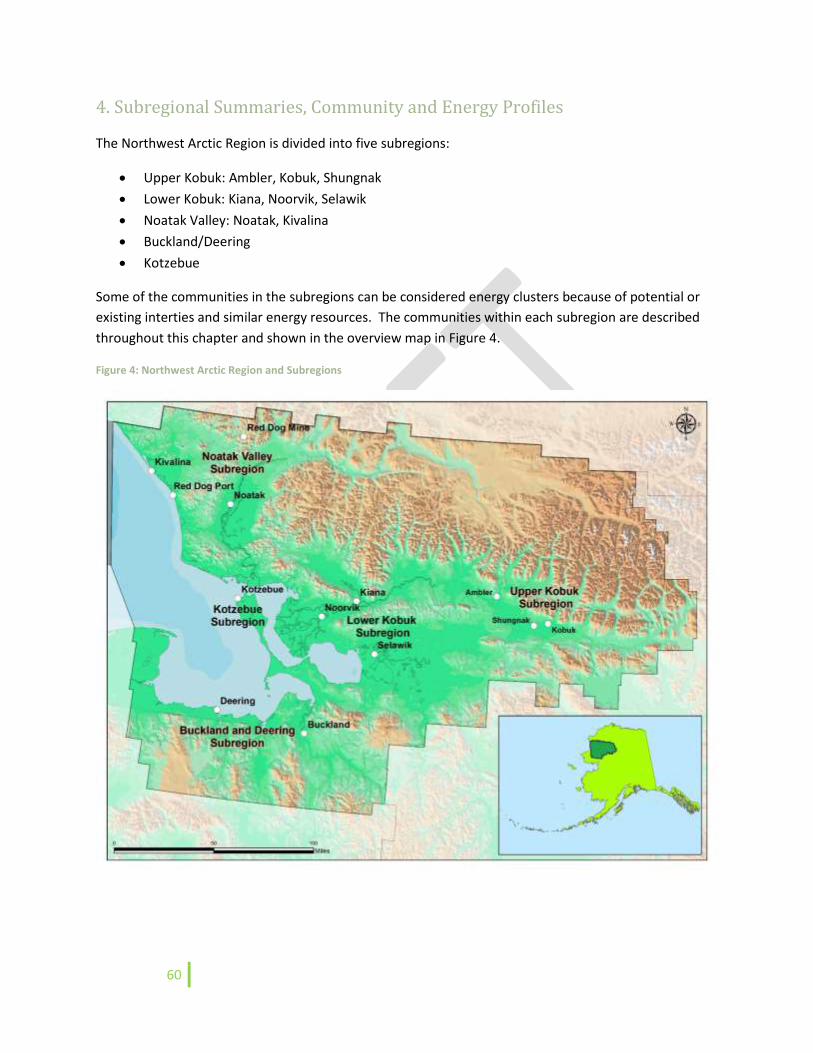
60
4. Subregional Summaries, Community and Energy Profiles
The Northwest Arctic Region is divided into five subregions:
Upper Kobuk: Ambler, Kobuk, Shungnak
Lower Kobuk: Kiana, Noorvik, Selawik
Noatak Valley: Noatak, Kivalina
Buckland/Deering
Kotzebue
Some of the communities in the subregions can be considered energy clusters because of potential or
existing interties and similar energy resources. The communities within each subregion are described
throughout this chapter and shown in the overview map in Figure 4.
Figure 4: Northwest Arctic Region and Subregions
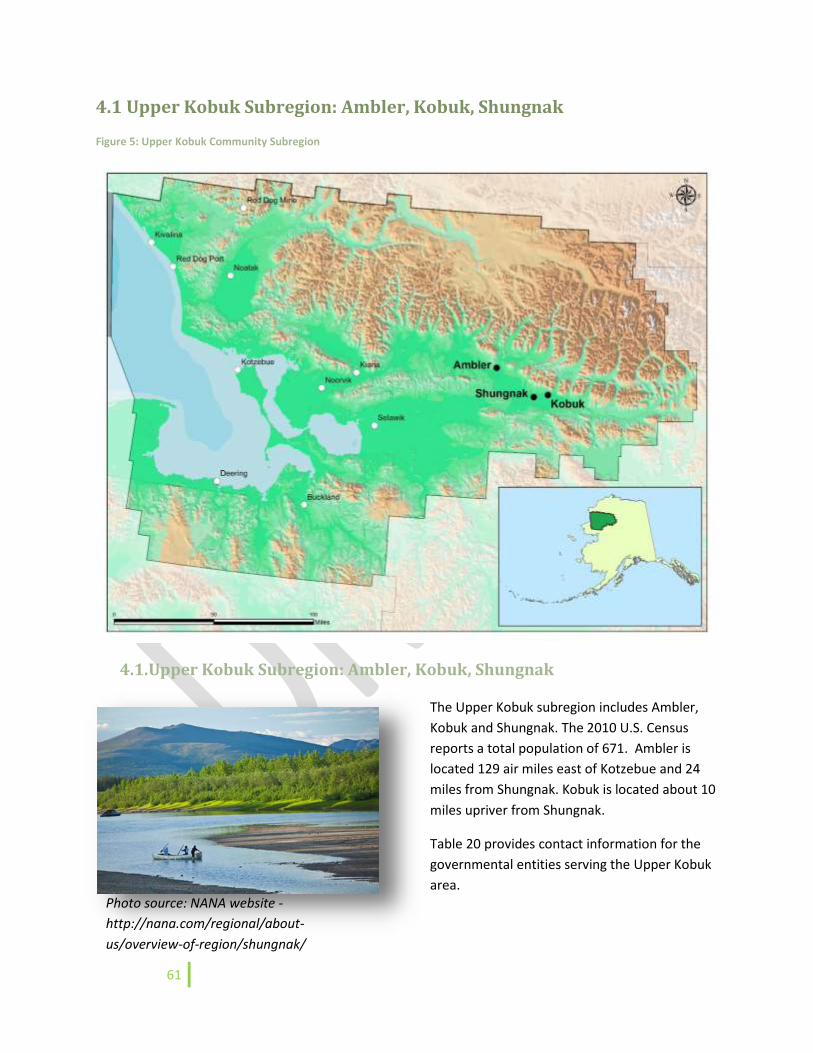
61
4.1 Upper Kobuk Subregion: Ambler, Kobuk, Shungnak
Figure 5: Upper Kobuk Community Subregion
4.1. Upper Kobuk Subregion: Ambler, Kobuk, Shungnak
The Upper Kobuk subregion includes Ambler,
Kobuk and Shungnak. The 2010 U.S. Census
reports a total population of 671. Ambler is
located 129 air miles east of Kotzebue and 24
miles from Shungnak. Kobuk is located about 10
miles upriver from Shungnak.
Table 20 provides contact information for the
governmental entities serving the Upper Kobuk
area.
Photo source: NANA website -
http://nana.com/regional/about-
us/overview-of-region/shungnak/
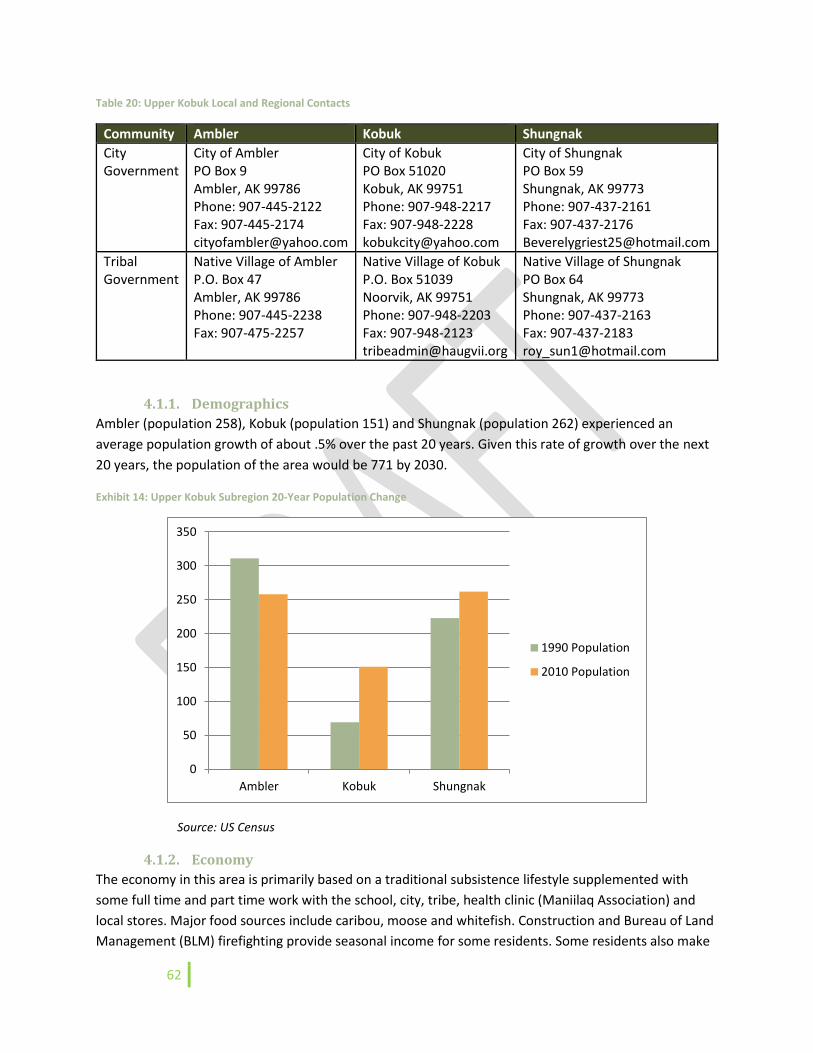
62
Table 20: Upper Kobuk Local and Regional Contacts
Community Ambler Kobuk Shungnak
City Government
City of Ambler PO Box 9 Ambler, AK 99786 Phone: 907-445-2122 Fax: 907-445-2174 [email protected]
City of Kobuk PO Box 51020 Kobuk, AK 99751 Phone: 907-948-2217 Fax: 907-948-2228 [email protected]
City of Shungnak PO Box 59 Shungnak, AK 99773 Phone: 907-437-2161 Fax: 907-437-2176 [email protected]
Tribal Government
Native Village of Ambler P.O. Box 47 Ambler, AK 99786 Phone: 907-445-2238 Fax: 907-475-2257
Native Village of Kobuk P.O. Box 51039 Noorvik, AK 99751 Phone: 907-948-2203 Fax: 907-948-2123 [email protected]
Native Village of Shungnak PO Box 64 Shungnak, AK 99773 Phone: 907-437-2163 Fax: 907-437-2183 [email protected]
4.1.1. Demographics
Ambler (population 258), Kobuk (population 151) and Shungnak (population 262) experienced an
average population growth of about .5% over the past 20 years. Given this rate of growth over the next
20 years, the population of the area would be 771 by 2030.
Exhibit 14: Upper Kobuk Subregion 20-Year Population Change
Source: US Census
4.1.2. Economy
The economy in this area is primarily based on a traditional subsistence lifestyle supplemented with
some full time and part time work with the school, city, tribe, health clinic (Maniilaq Association) and
local stores. Major food sources include caribou, moose and whitefish. Construction and Bureau of Land
Management (BLM) firefighting provide seasonal income for some residents. Some residents also make
0
50
100
150
200
250
300
350
Ambler Kobuk Shungnak
1990 Population
2010 Population
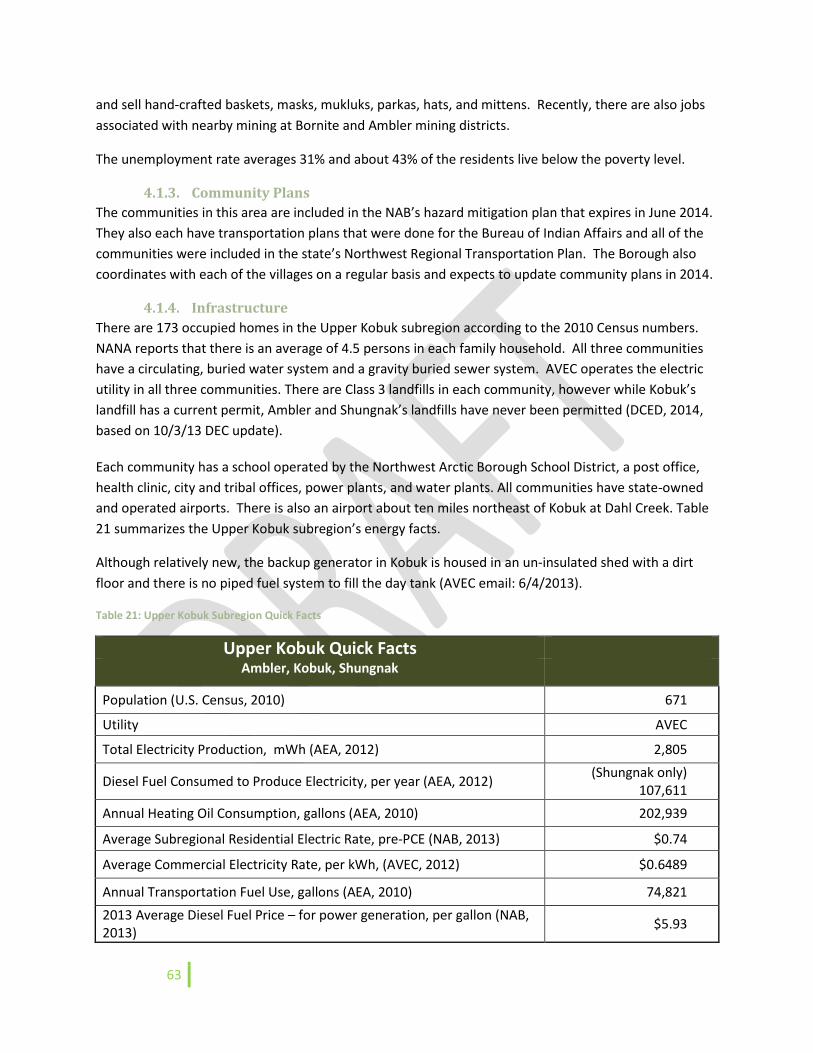
63
and sell hand-crafted baskets, masks, mukluks, parkas, hats, and mittens. Recently, there are also jobs
associated with nearby mining at Bornite and Ambler mining districts.
The unemployment rate averages 31% and about 43% of the residents live below the poverty level.
4.1.3. Community Plans
The communities in this area are included in the NAB’s hazard mitigation plan that expires in June 2014.
They also each have transportation plans that were done for the Bureau of Indian Affairs and all of the
communities were included in the state’s Northwest Regional Transportation Plan. The Borough also
coordinates with each of the villages on a regular basis and expects to update community plans in 2014.
4.1.4. Infrastructure
There are 173 occupied homes in the Upper Kobuk subregion according to the 2010 Census numbers.
NANA reports that there is an average of 4.5 persons in each family household. All three communities
have a circulating, buried water system and a gravity buried sewer system. AVEC operates the electric
utility in all three communities. There are Class 3 landfills in each community, however while Kobuk’s
landfill has a current permit, Ambler and Shungnak’s landfills have never been permitted (DCED, 2014,
based on 10/3/13 DEC update).
Each community has a school operated by the Northwest Arctic Borough School District, a post office,
health clinic, city and tribal offices, power plants, and water plants. All communities have state-owned
and operated airports. There is also an airport about ten miles northeast of Kobuk at Dahl Creek. Table
21 summarizes the Upper Kobuk subregion’s energy facts.
Although relatively new, the backup generator in Kobuk is housed in an un-insulated shed with a dirt
floor and there is no piped fuel system to fill the day tank (AVEC email: 6/4/2013).
Table 21: Upper Kobuk Subregion Quick Facts
Upper Kobuk Quick Facts Ambler, Kobuk, Shungnak
Population (U.S. Census, 2010) 671
Utility AVEC
Total Electricity Production, mWh (AEA, 2012) 2,805
Diesel Fuel Consumed to Produce Electricity, per year (AEA, 2012) (Shungnak only)
107,611
Annual Heating Oil Consumption, gallons (AEA, 2010) 202,939
Average Subregional Residential Electric Rate, pre-PCE (NAB, 2013) $0.74
Average Commercial Electricity Rate, per kWh, (AVEC, 2012) $0.6489
Annual Transportation Fuel Use, gallons (AEA, 2010) 74,821
2013 Average Diesel Fuel Price – for power generation, per gallon (NAB, 2013)
$5.93
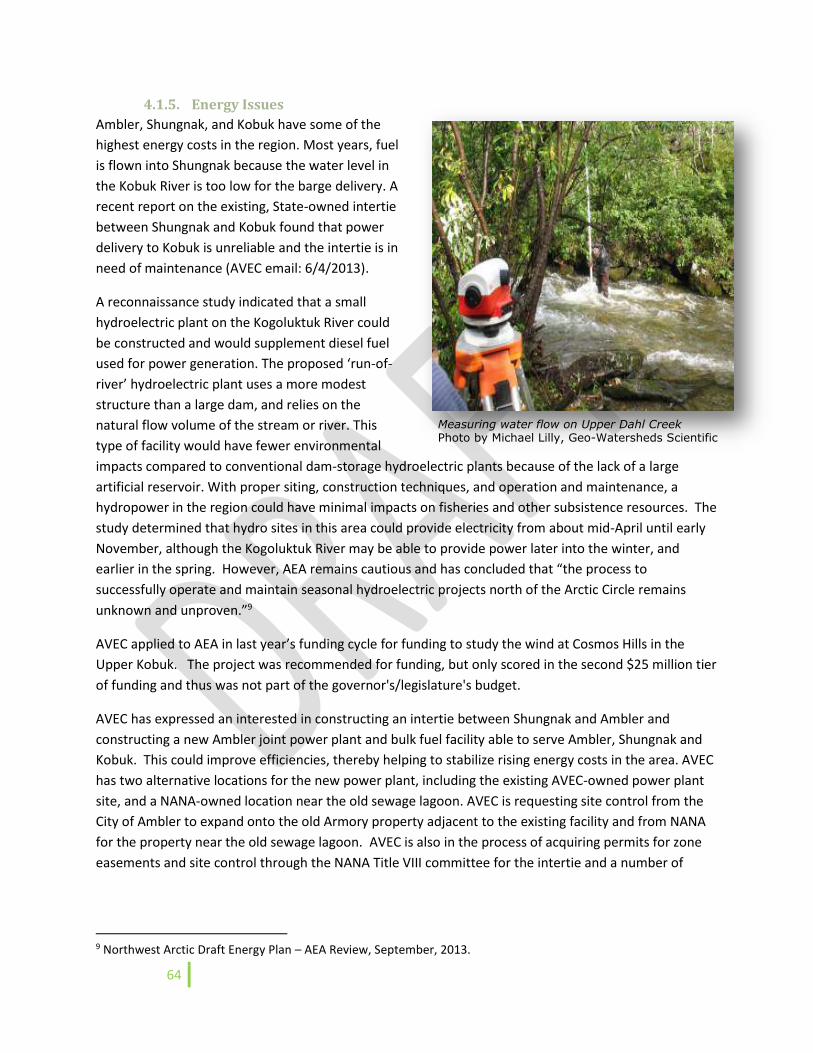
64
4.1.5. Energy Issues
Ambler, Shungnak, and Kobuk have some of the
highest energy costs in the region. Most years, fuel
is flown into Shungnak because the water level in
the Kobuk River is too low for the barge delivery. A
recent report on the existing, State-owned intertie
between Shungnak and Kobuk found that power
delivery to Kobuk is unreliable and the intertie is in
need of maintenance (AVEC email: 6/4/2013).
A reconnaissance study indicated that a small
hydroelectric plant on the Kogoluktuk River could
be constructed and would supplement diesel fuel
used for power generation. The proposed ‘run-of-
river’ hydroelectric plant uses a more modest
structure than a large dam, and relies on the
natural flow volume of the stream or river. This
type of facility would have fewer environmental
impacts compared to conventional dam-storage hydroelectric plants because of the lack of a large
artificial reservoir. With proper siting, construction techniques, and operation and maintenance, a
hydropower in the region could have minimal impacts on fisheries and other subsistence resources. The
study determined that hydro sites in this area could provide electricity from about mid-April until early
November, although the Kogoluktuk River may be able to provide power later into the winter, and
earlier in the spring. However, AEA remains cautious and has concluded that “the process to
successfully operate and maintain seasonal hydroelectric projects north of the Arctic Circle remains
unknown and unproven.”9
AVEC applied to AEA in last year’s funding cycle for funding to study the wind at Cosmos Hills in the
Upper Kobuk. The project was recommended for funding, but only scored in the second $25 million tier
of funding and thus was not part of the governor's/legislature's budget.
AVEC has expressed an interested in constructing an intertie between Shungnak and Ambler and
constructing a new Ambler joint power plant and bulk fuel facility able to serve Ambler, Shungnak and
Kobuk. This could improve efficiencies, thereby helping to stabilize rising energy costs in the area. AVEC
has two alternative locations for the new power plant, including the existing AVEC-owned power plant
site, and a NANA-owned location near the old sewage lagoon. AVEC is requesting site control from the
City of Ambler to expand onto the old Armory property adjacent to the existing facility and from NANA
for the property near the old sewage lagoon. AVEC is also in the process of acquiring permits for zone
easements and site control through the NANA Title VIII committee for the intertie and a number of
9 Northwest Arctic Draft Energy Plan – AEA Review, September, 2013.
Measuring water flow on Upper Dahl Creek Photo by Michael Lilly, Geo-Watersheds Scientific
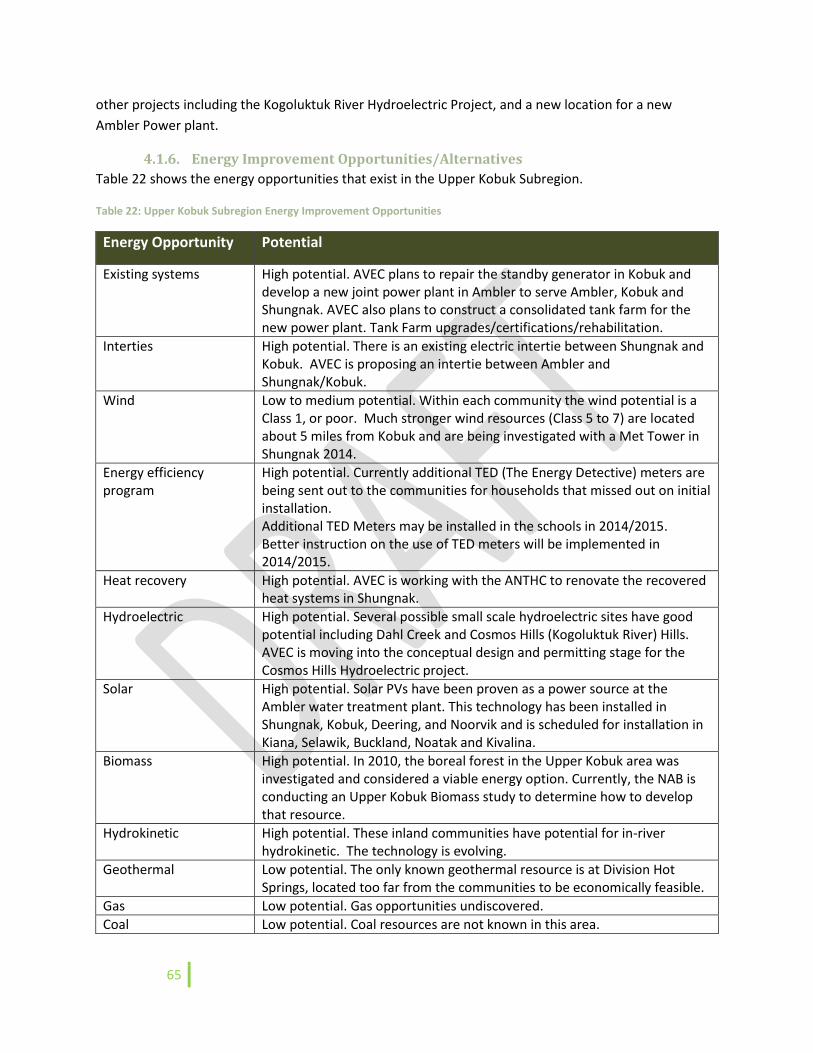
65
other projects including the Kogoluktuk River Hydroelectric Project, and a new location for a new
Ambler Power plant.
4.1.6. Energy Improvement Opportunities/Alternatives
Table 22 shows the energy opportunities that exist in the Upper Kobuk Subregion.
Table 22: Upper Kobuk Subregion Energy Improvement Opportunities
Energy Opportunity Potential
Existing systems High potential. AVEC plans to repair the standby generator in Kobuk and develop a new joint power plant in Ambler to serve Ambler, Kobuk and Shungnak. AVEC also plans to construct a consolidated tank farm for the new power plant. Tank Farm upgrades/certifications/rehabilitation.
Interties High potential. There is an existing electric intertie between Shungnak and Kobuk. AVEC is proposing an intertie between Ambler and Shungnak/Kobuk.
Wind Low to medium potential. Within each community the wind potential is a Class 1, or poor. Much stronger wind resources (Class 5 to 7) are located about 5 miles from Kobuk and are being investigated with a Met Tower in Shungnak 2014.
Energy efficiency program
High potential. Currently additional TED (The Energy Detective) meters are being sent out to the communities for households that missed out on initial installation. Additional TED Meters may be installed in the schools in 2014/2015. Better instruction on the use of TED meters will be implemented in 2014/2015.
Heat recovery High potential. AVEC is working with the ANTHC to renovate the recovered heat systems in Shungnak.
Hydroelectric High potential. Several possible small scale hydroelectric sites have good potential including Dahl Creek and Cosmos Hills (Kogoluktuk River) Hills. AVEC is moving into the conceptual design and permitting stage for the Cosmos Hills Hydroelectric project.
Solar High potential. Solar PVs have been proven as a power source at the Ambler water treatment plant. This technology has been installed in Shungnak, Kobuk, Deering, and Noorvik and is scheduled for installation in Kiana, Selawik, Buckland, Noatak and Kivalina.
Biomass High potential. In 2010, the boreal forest in the Upper Kobuk area was investigated and considered a viable energy option. Currently, the NAB is conducting an Upper Kobuk Biomass study to determine how to develop that resource.
Hydrokinetic High potential. These inland communities have potential for in-river hydrokinetic. The technology is evolving.
Geothermal Low potential. The only known geothermal resource is at Division Hot Springs, located too far from the communities to be economically feasible.
Gas Low potential. Gas opportunities undiscovered.
Coal Low potential. Coal resources are not known in this area.
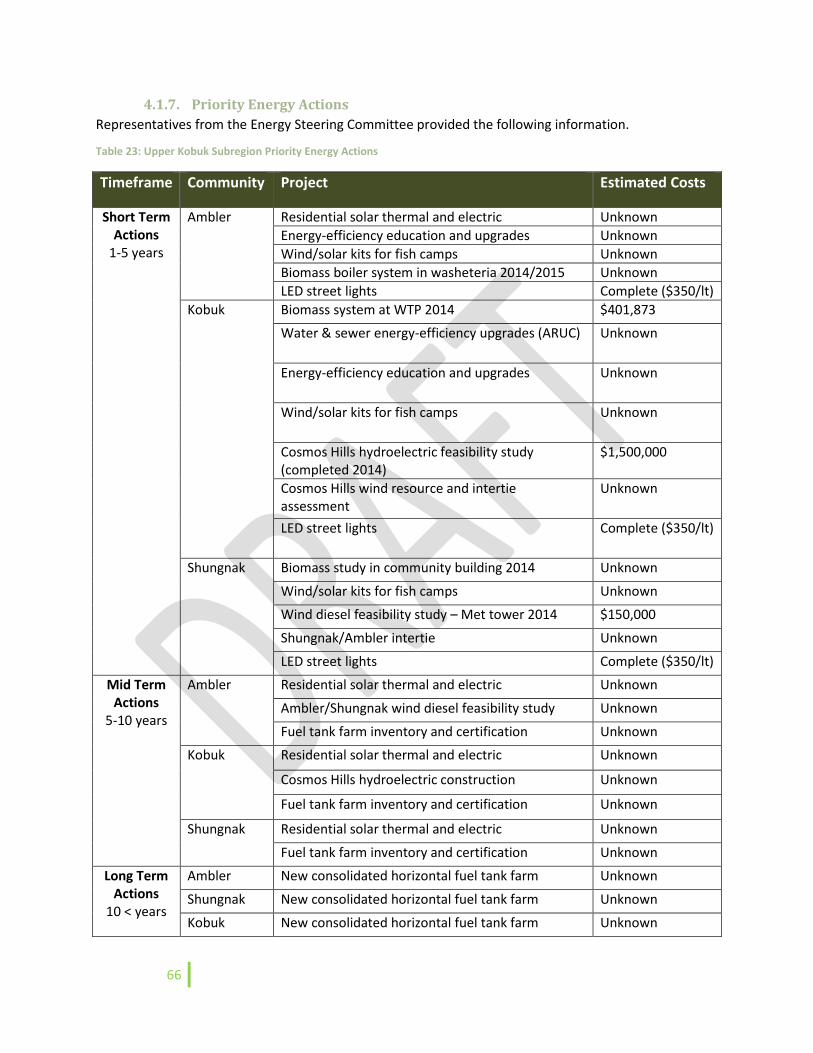
66
4.1.7. Priority Energy Actions
Representatives from the Energy Steering Committee provided the following information.
Table 23: Upper Kobuk Subregion Priority Energy Actions
Timeframe Community Project Estimated Costs
Short Term Actions
1-5 years
Ambler Residential solar thermal and electric Unknown
Energy-efficiency education and upgrades Unknown
Wind/solar kits for fish camps Unknown
Biomass boiler system in washeteria 2014/2015 Unknown
LED street lights Complete ($350/lt)
Kobuk Biomass system at WTP 2014 $401,873
Water & sewer energy-efficiency upgrades (ARUC) Unknown
Energy-efficiency education and upgrades Unknown
Wind/solar kits for fish camps Unknown
Cosmos Hills hydroelectric feasibility study (completed 2014)
$1,500,000
Cosmos Hills wind resource and intertie assessment
Unknown
LED street lights Complete ($350/lt)
Shungnak Biomass study in community building 2014 Unknown
Wind/solar kits for fish camps Unknown
Wind diesel feasibility study – Met tower 2014 $150,000
Shungnak/Ambler intertie Unknown
LED street lights Complete ($350/lt)
Mid Term Actions
5-10 years
Ambler Residential solar thermal and electric Unknown
Ambler/Shungnak wind diesel feasibility study Unknown
Fuel tank farm inventory and certification Unknown
Kobuk Residential solar thermal and electric Unknown
Cosmos Hills hydroelectric construction Unknown
Fuel tank farm inventory and certification Unknown
Shungnak Residential solar thermal and electric Unknown
Fuel tank farm inventory and certification Unknown
Long Term Actions
10 < years
Ambler New consolidated horizontal fuel tank farm Unknown
Shungnak New consolidated horizontal fuel tank farm Unknown
Kobuk New consolidated horizontal fuel tank farm Unknown

67
68
Ambler Community and Energy Profile

69
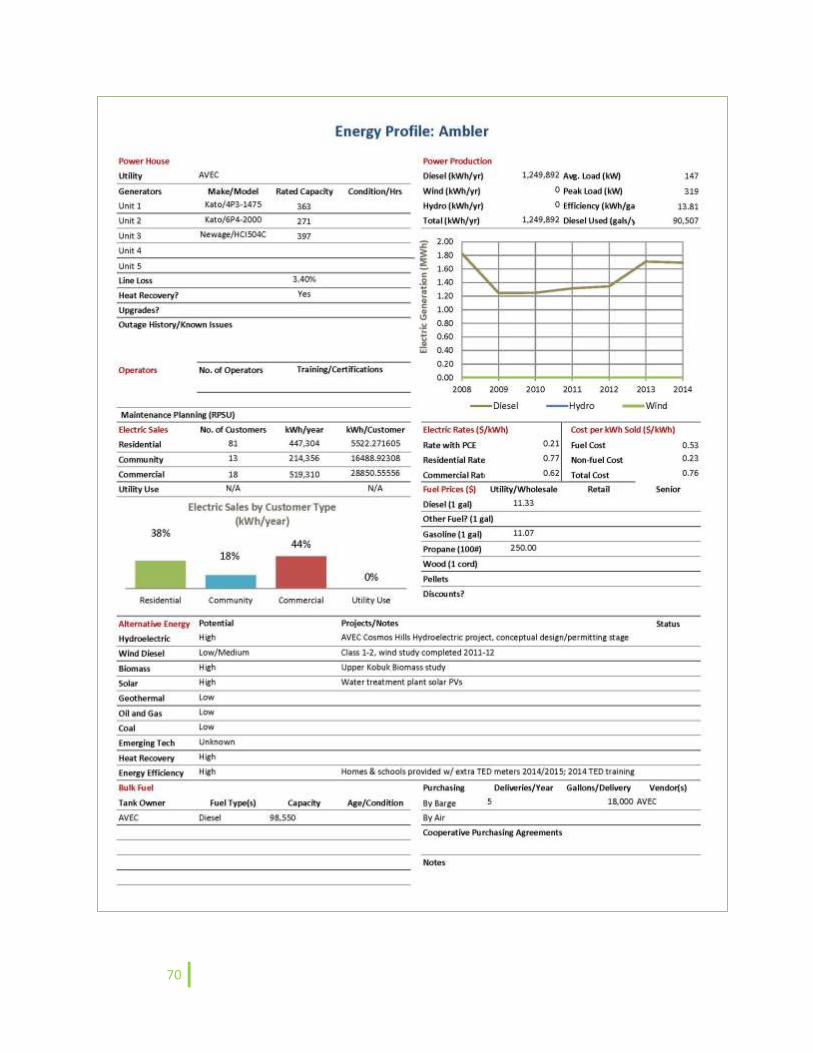
70
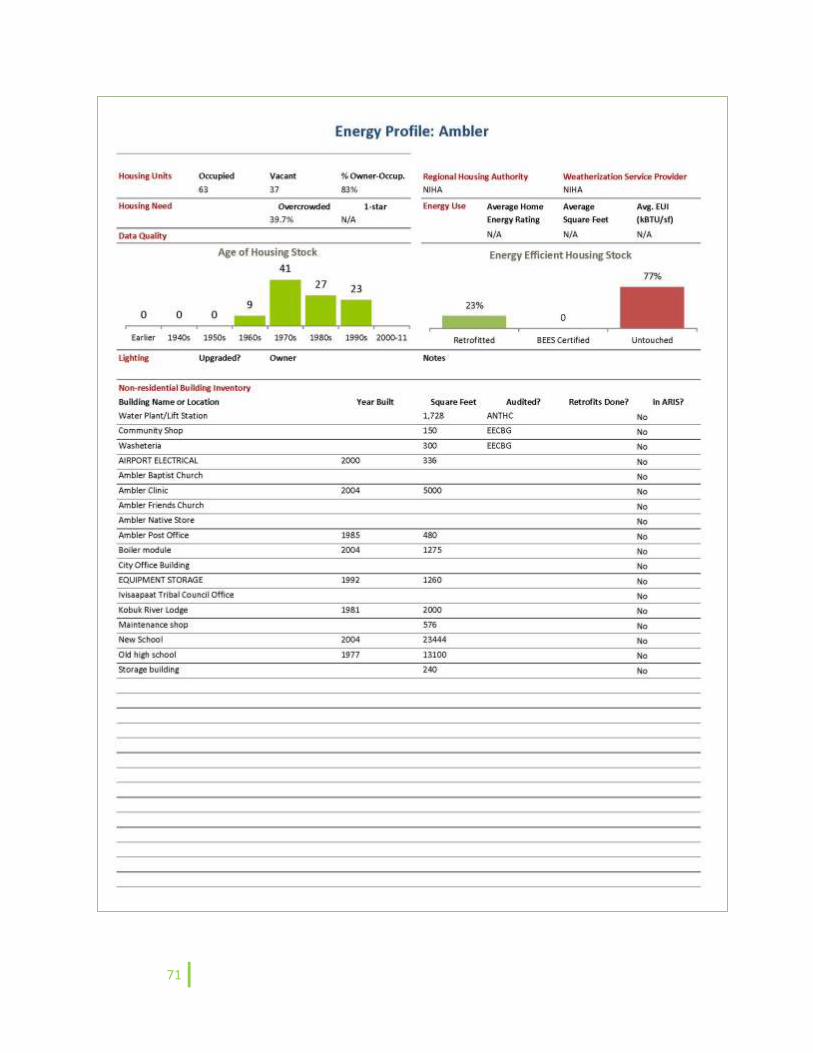
71
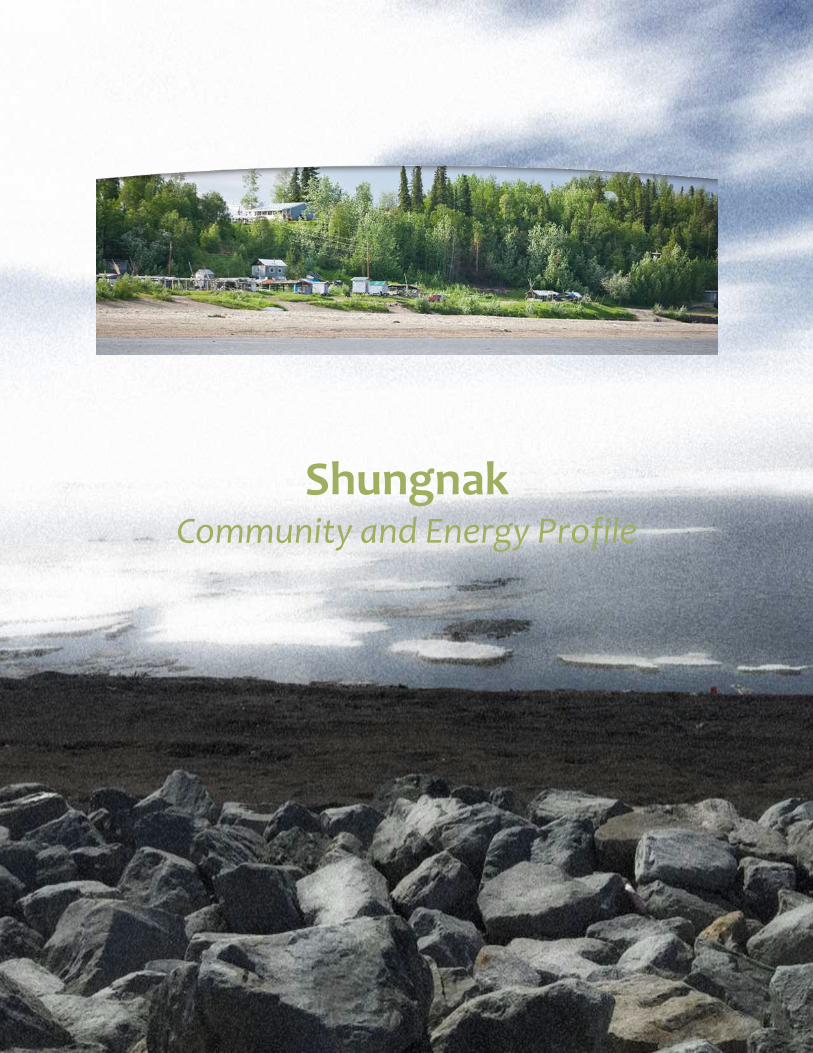
72
Shungnak Community and Energy Profile
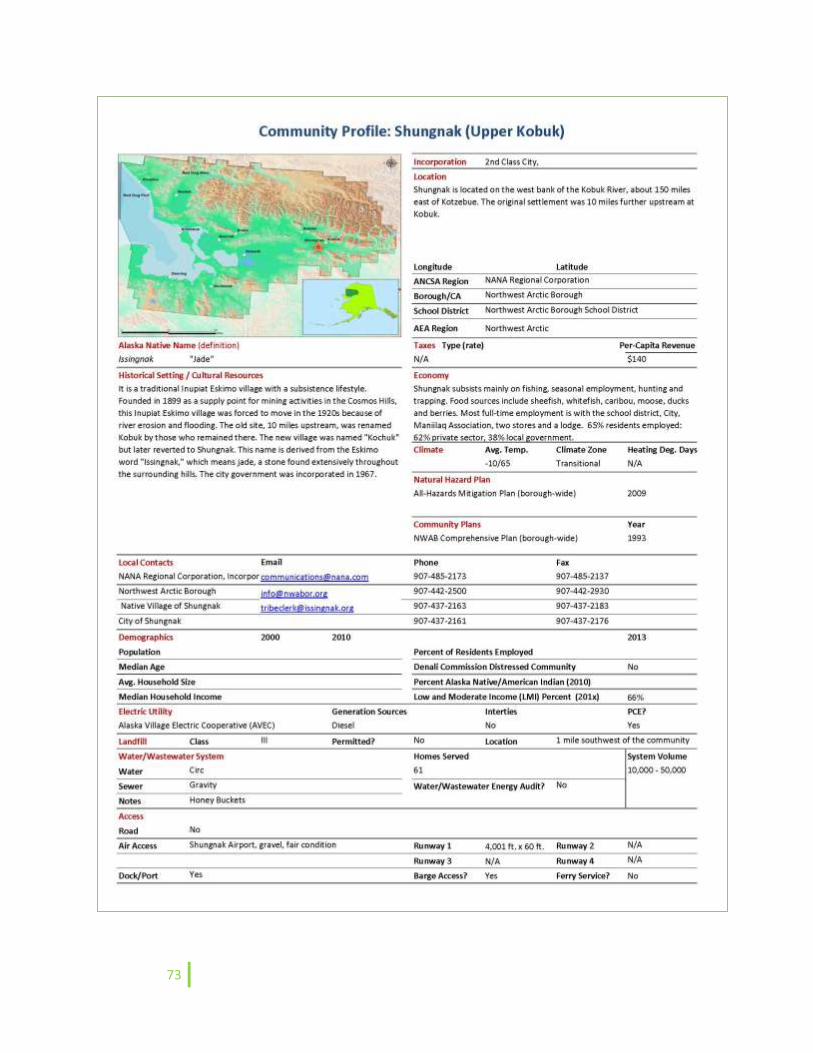
73
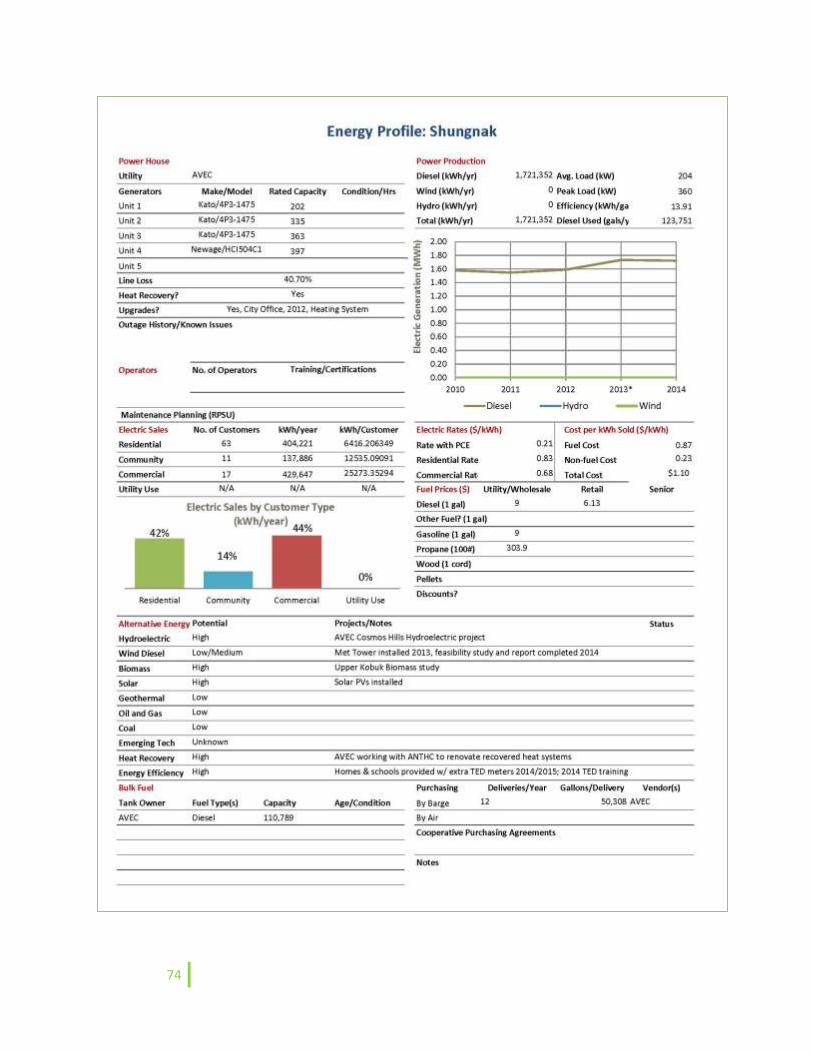
74
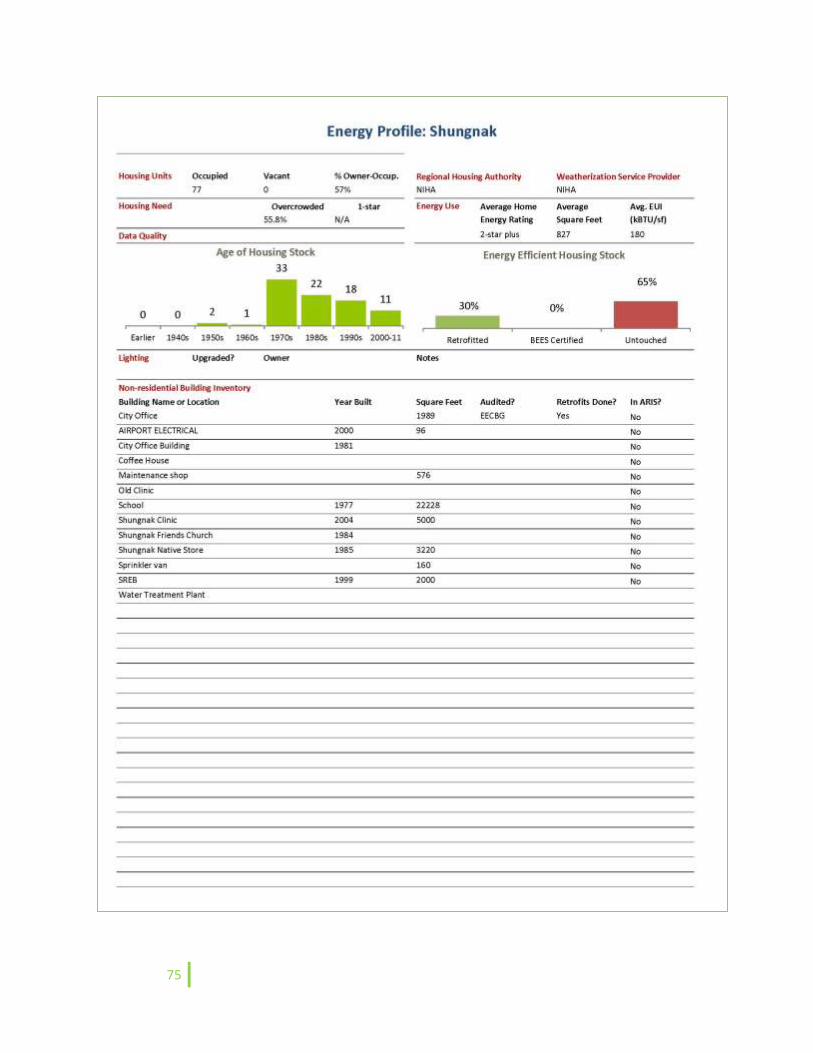
75
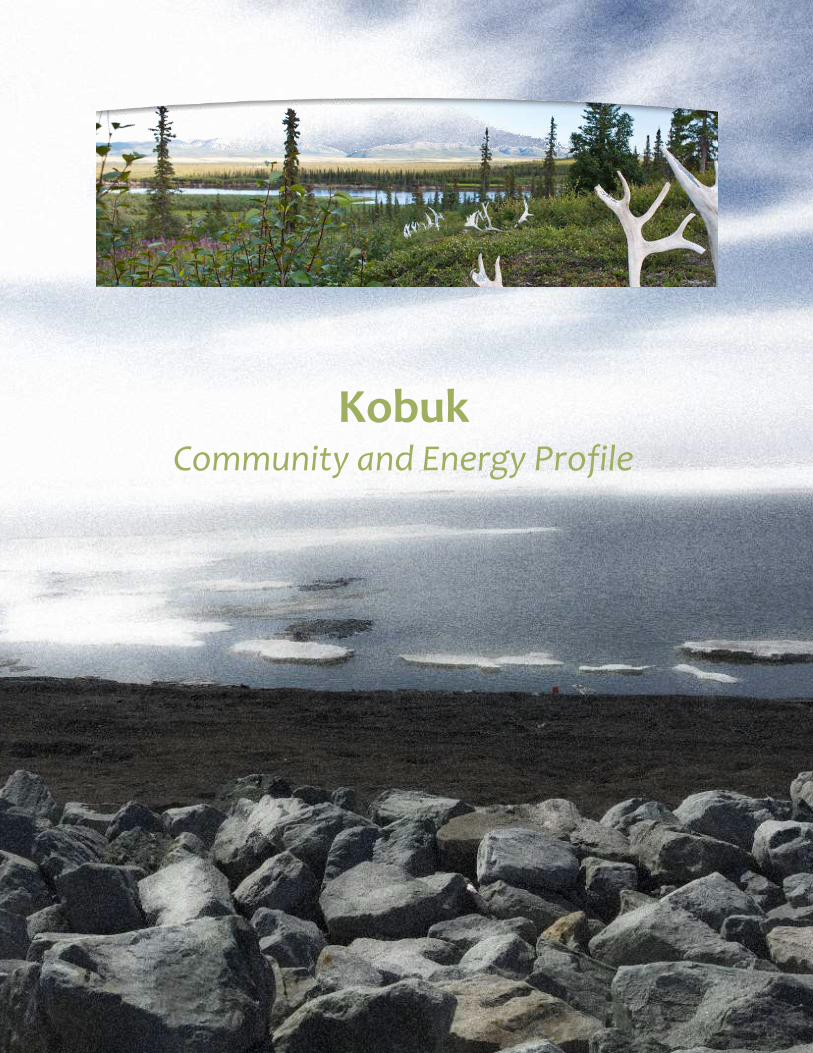
76
Kobuk Community and Energy Profile
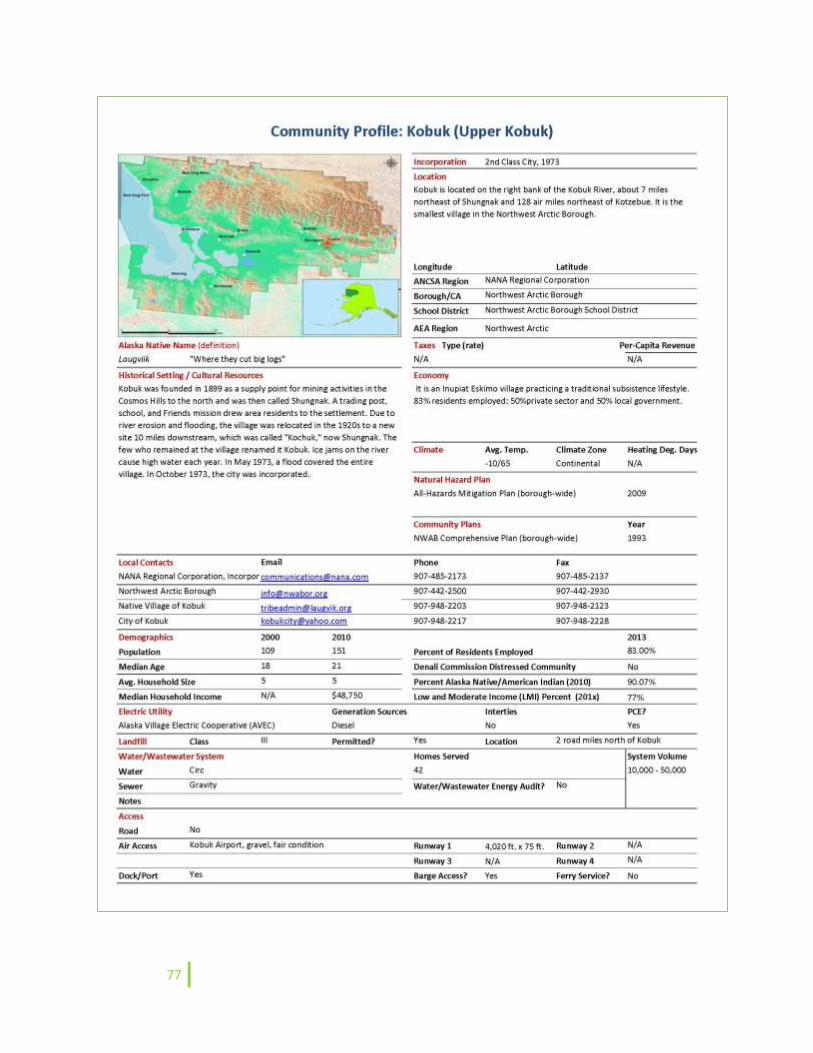
77
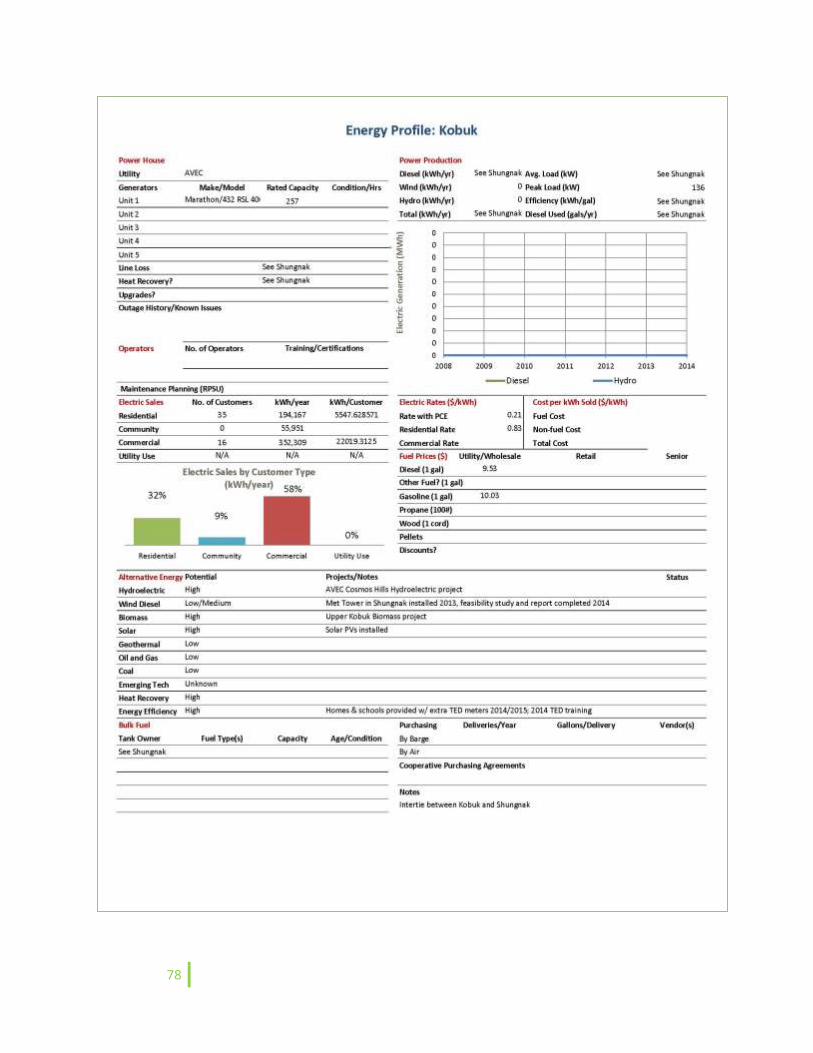
78
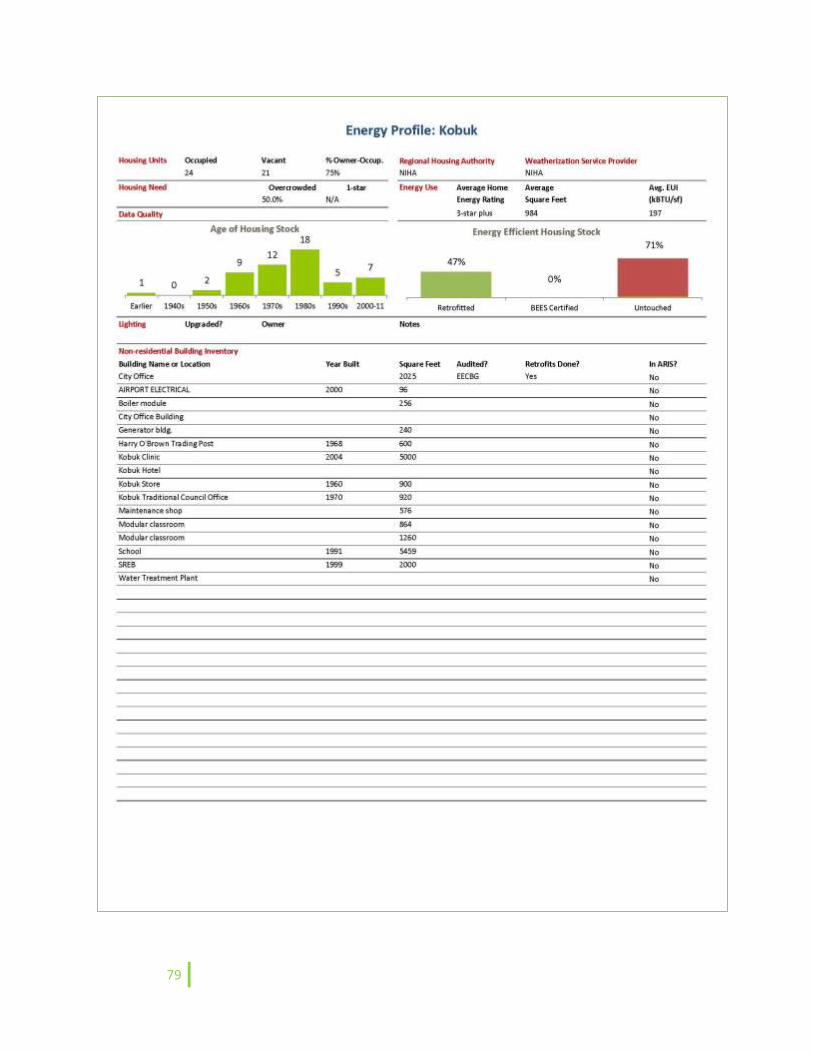
79
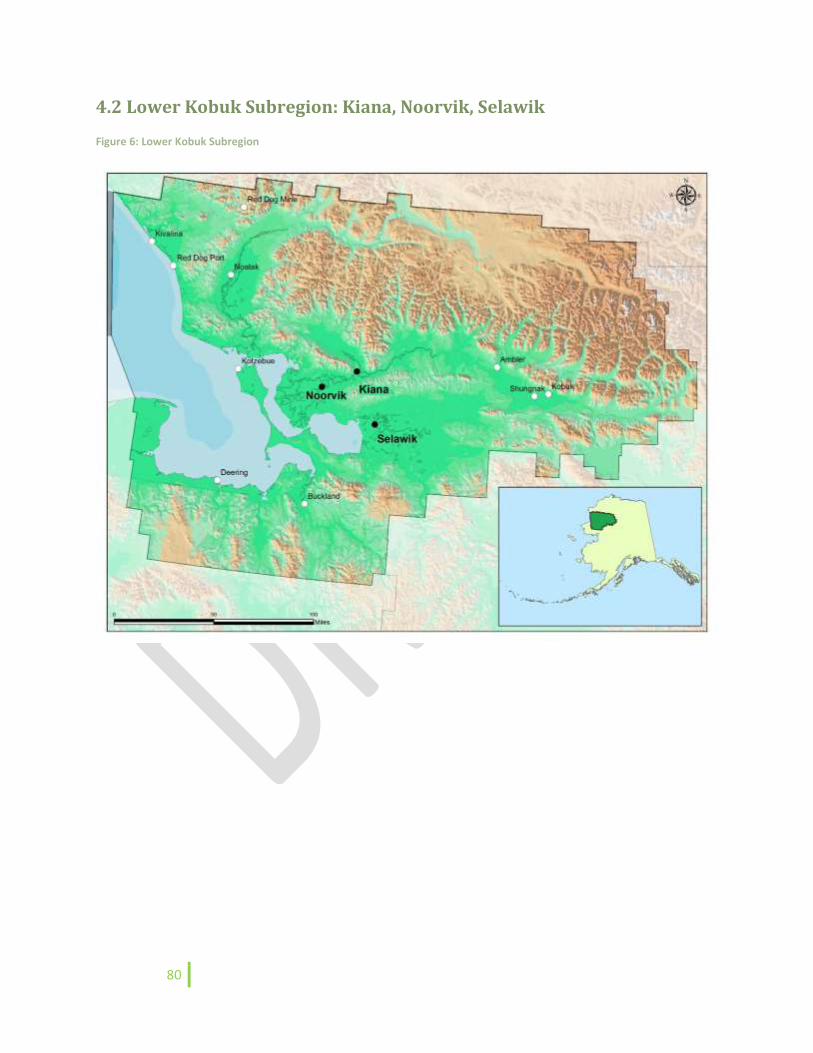
80
4.2 Lower Kobuk Subregion: Kiana, Noorvik, Selawik
Figure 6: Lower Kobuk Subregion
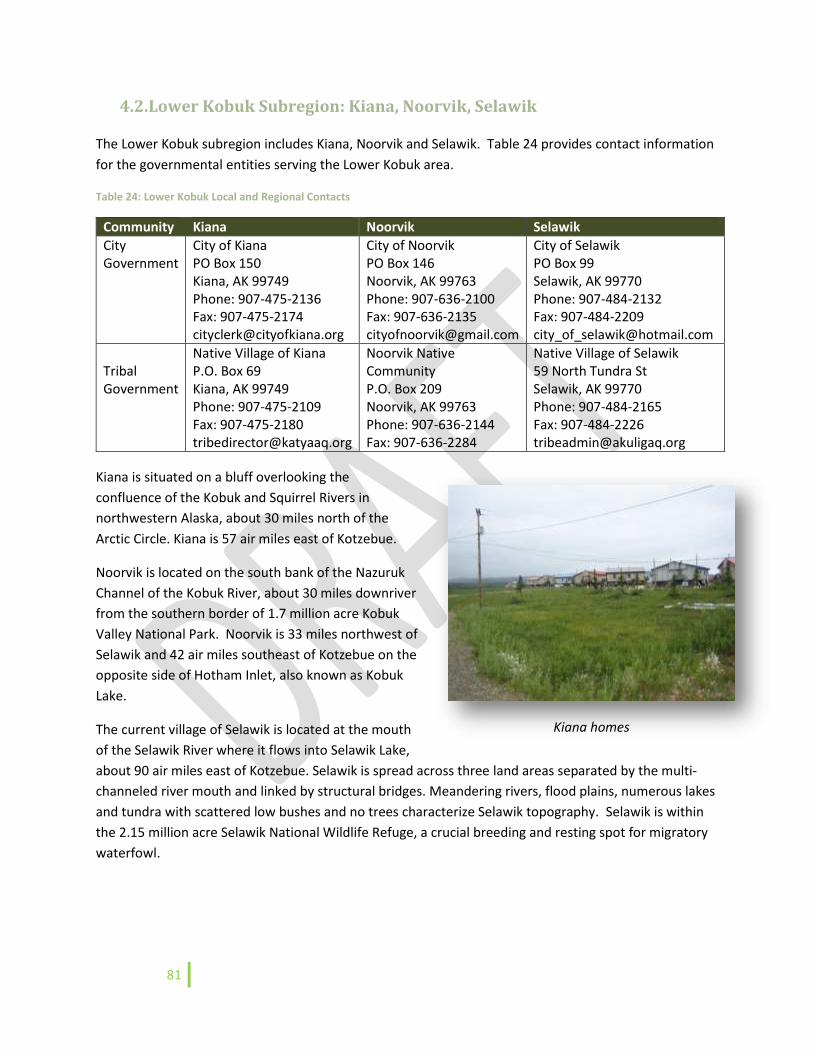
81
4.2. Lower Kobuk Subregion: Kiana, Noorvik, Selawik
The Lower Kobuk subregion includes Kiana, Noorvik and Selawik. Table 24 provides contact information
for the governmental entities serving the Lower Kobuk area.
Table 24: Lower Kobuk Local and Regional Contacts
Community Kiana Noorvik Selawik
City Government
City of Kiana PO Box 150 Kiana, AK 99749 Phone: 907-475-2136 Fax: 907-475-2174 [email protected]
City of Noorvik PO Box 146 Noorvik, AK 99763 Phone: 907-636-2100 Fax: 907-636-2135 [email protected]
City of Selawik PO Box 99 Selawik, AK 99770 Phone: 907-484-2132 Fax: 907-484-2209 [email protected]
Tribal Government
Native Village of Kiana P.O. Box 69 Kiana, AK 99749 Phone: 907-475-2109 Fax: 907-475-2180 [email protected]
Noorvik Native Community P.O. Box 209 Noorvik, AK 99763 Phone: 907-636-2144 Fax: 907-636-2284
Native Village of Selawik 59 North Tundra St Selawik, AK 99770 Phone: 907-484-2165 Fax: 907-484-2226 [email protected]
Kiana is situated on a bluff overlooking the
confluence of the Kobuk and Squirrel Rivers in
northwestern Alaska, about 30 miles north of the
Arctic Circle. Kiana is 57 air miles east of Kotzebue.
Noorvik is located on the south bank of the Nazuruk
Channel of the Kobuk River, about 30 miles downriver
from the southern border of 1.7 million acre Kobuk
Valley National Park. Noorvik is 33 miles northwest of
Selawik and 42 air miles southeast of Kotzebue on the
opposite side of Hotham Inlet, also known as Kobuk
Lake.
The current village of Selawik is located at the mouth
of the Selawik River where it flows into Selawik Lake,
about 90 air miles east of Kotzebue. Selawik is spread across three land areas separated by the multi-
channeled river mouth and linked by structural bridges. Meandering rivers, flood plains, numerous lakes
and tundra with scattered low bushes and no trees characterize Selawik topography. Selawik is within
the 2.15 million acre Selawik National Wildlife Refuge, a crucial breeding and resting spot for migratory
waterfowl.
Kiana homes
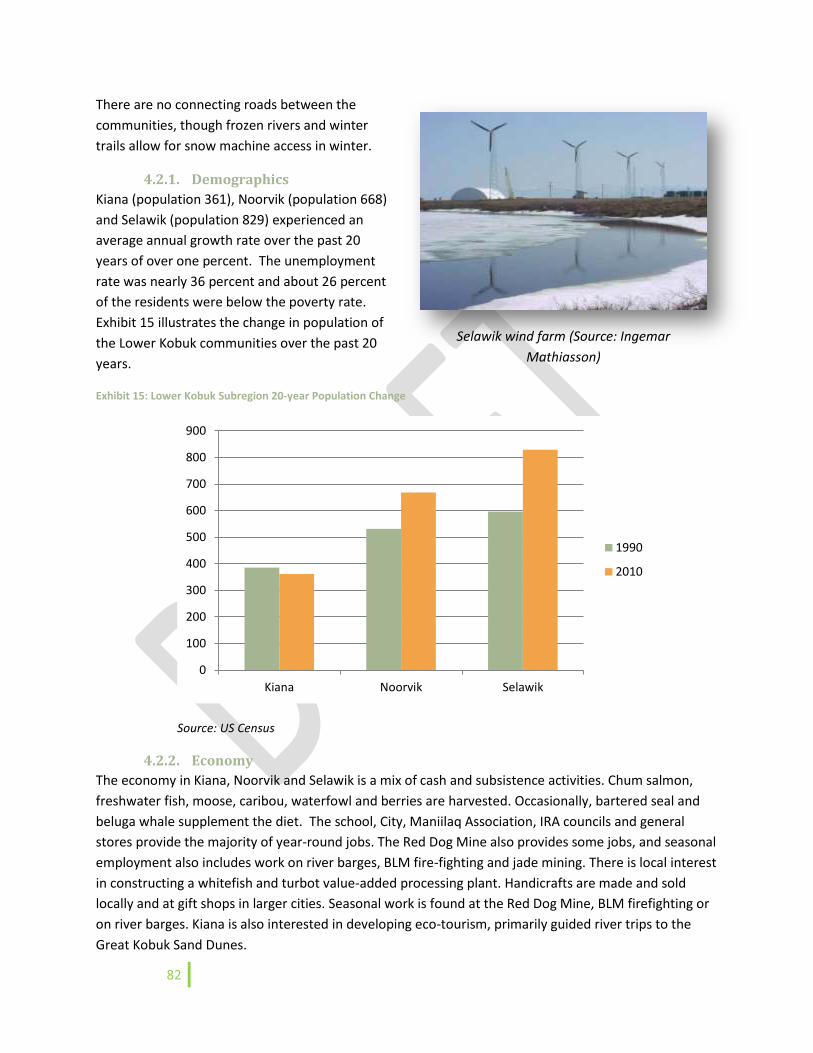
82
There are no connecting roads between the
communities, though frozen rivers and winter
trails allow for snow machine access in winter.
4.2.1. Demographics
Kiana (population 361), Noorvik (population 668)
and Selawik (population 829) experienced an
average annual growth rate over the past 20
years of over one percent. The unemployment
rate was nearly 36 percent and about 26 percent
of the residents were below the poverty rate.
Exhibit 15 illustrates the change in population of
the Lower Kobuk communities over the past 20
years.
Exhibit 15: Lower Kobuk Subregion 20-year Population Change
Source: US Census
4.2.2. Economy
The economy in Kiana, Noorvik and Selawik is a mix of cash and subsistence activities. Chum salmon,
freshwater fish, moose, caribou, waterfowl and berries are harvested. Occasionally, bartered seal and
beluga whale supplement the diet. The school, City, Maniilaq Association, IRA councils and general
stores provide the majority of year-round jobs. The Red Dog Mine also provides some jobs, and seasonal
employment also includes work on river barges, BLM fire-fighting and jade mining. There is local interest
in constructing a whitefish and turbot value-added processing plant. Handicrafts are made and sold
locally and at gift shops in larger cities. Seasonal work is found at the Red Dog Mine, BLM firefighting or
on river barges. Kiana is also interested in developing eco-tourism, primarily guided river trips to the
Great Kobuk Sand Dunes.
0
100
200
300
400
500
600
700
800
900
Kiana Noorvik Selawik
1990
2010
Selawik wind farm (Source: Ingemar
Mathiasson)
83
4.2.3. Community Plans
The communities in this area are included in
the NAB’s hazard mitigation plan that expires
in June 2014. They also each have
transportation plans that were done for the
Bureau of Indian Affairs and all of the
communities were included in the state’s
Northwest Alaska Regional Transportation
Plan. The Borough coordinates with each of
the villages on a regular basis and is
currently updating their community plans.
4.2.4. Infrastructure
There are 440 occupied homes in the Lower Kobuk subregion according to the 2010 Census numbers
reported by the DCRA, with an average of about 4.5 persons in each family household.
All three communities have a circulating water system to which most residences are connected; Noorvik
and Selawik’s are above ground, while Kiana’s is buried. The sewer systems also vary, with above-
ground vacuum systems in Noorvik and Selawik and a gravity buried system in Kiana. Some residents
still haul water and rely on honeybuckets. AVEC operates the electric utility in all three communities.
The landfills in Noorvik and Selawik are Class 3 permitted by the Alaska Department of Environmental
Conservation. Kiana has a Class 3 landfill; however, no permit has been obtained (DCED, 2014, based on
10/3/13 DEC update).
Each community has a school operated by the Northwest Arctic Borough School District, a post office, a
health clinic, city and tribal offices, power plants, and water plants. Noorvik has a public safety building.
All communities have state-owned and operated airports. In addition, Selawik operates a city-owned,
3,000-foot-long by 70-foot-wide gravel airstrip located at the Siilivitchaq or “Spud Farm,” about 15 miles
from town.
Table 25 provides an overview of energy facts for the Lower Kobuk subregion.
Noorvik winter landscape
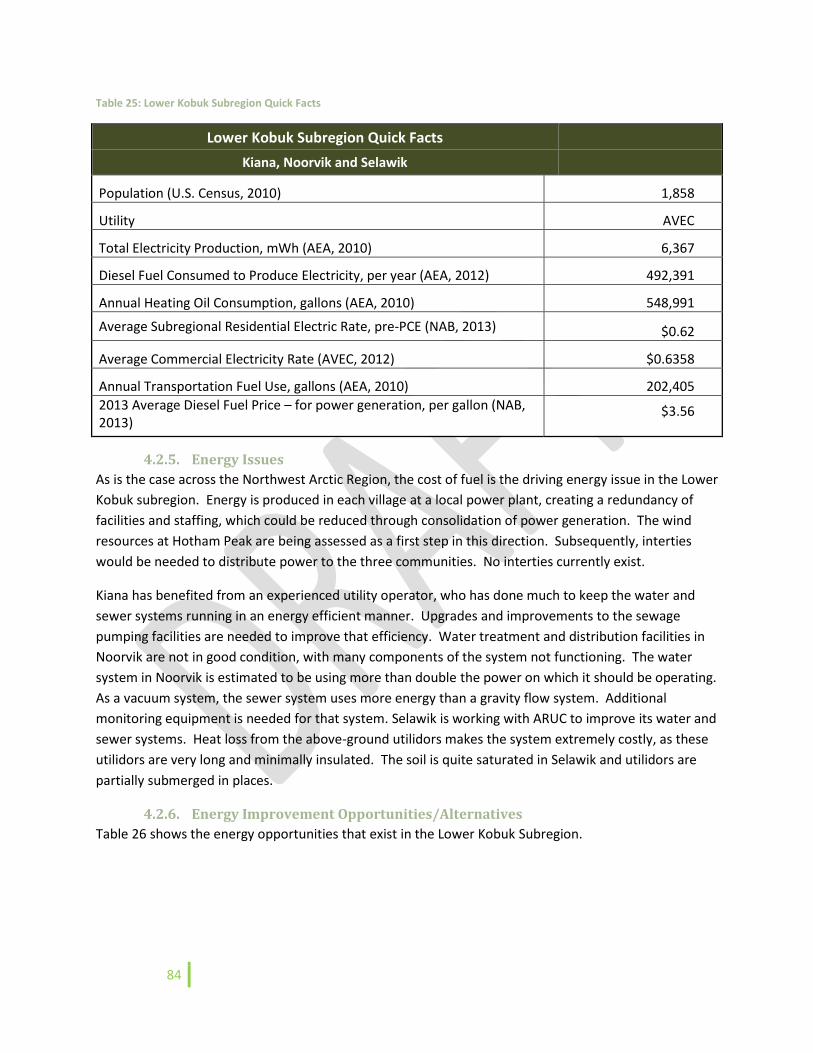
84
Table 25: Lower Kobuk Subregion Quick Facts
Lower Kobuk Subregion Quick Facts
Kiana, Noorvik and Selawik
Population (U.S. Census, 2010) 1,858
Utility AVEC
Total Electricity Production, mWh (AEA, 2010) 6,367
Diesel Fuel Consumed to Produce Electricity, per year (AEA, 2012) 492,391
Annual Heating Oil Consumption, gallons (AEA, 2010) 548,991
Average Subregional Residential Electric Rate, pre-PCE (NAB, 2013) $0.62
Average Commercial Electricity Rate (AVEC, 2012) $0.6358
Annual Transportation Fuel Use, gallons (AEA, 2010) 202,405
2013 Average Diesel Fuel Price – for power generation, per gallon (NAB, 2013)
$3.56
4.2.5. Energy Issues
As is the case across the Northwest Arctic Region, the cost of fuel is the driving energy issue in the Lower
Kobuk subregion. Energy is produced in each village at a local power plant, creating a redundancy of
facilities and staffing, which could be reduced through consolidation of power generation. The wind
resources at Hotham Peak are being assessed as a first step in this direction. Subsequently, interties
would be needed to distribute power to the three communities. No interties currently exist.
Kiana has benefited from an experienced utility operator, who has done much to keep the water and
sewer systems running in an energy efficient manner. Upgrades and improvements to the sewage
pumping facilities are needed to improve that efficiency. Water treatment and distribution facilities in
Noorvik are not in good condition, with many components of the system not functioning. The water
system in Noorvik is estimated to be using more than double the power on which it should be operating.
As a vacuum system, the sewer system uses more energy than a gravity flow system. Additional
monitoring equipment is needed for that system. Selawik is working with ARUC to improve its water and
sewer systems. Heat loss from the above-ground utilidors makes the system extremely costly, as these
utilidors are very long and minimally insulated. The soil is quite saturated in Selawik and utilidors are
partially submerged in places.
4.2.6. Energy Improvement Opportunities/Alternatives
Table 26 shows the energy opportunities that exist in the Lower Kobuk Subregion.
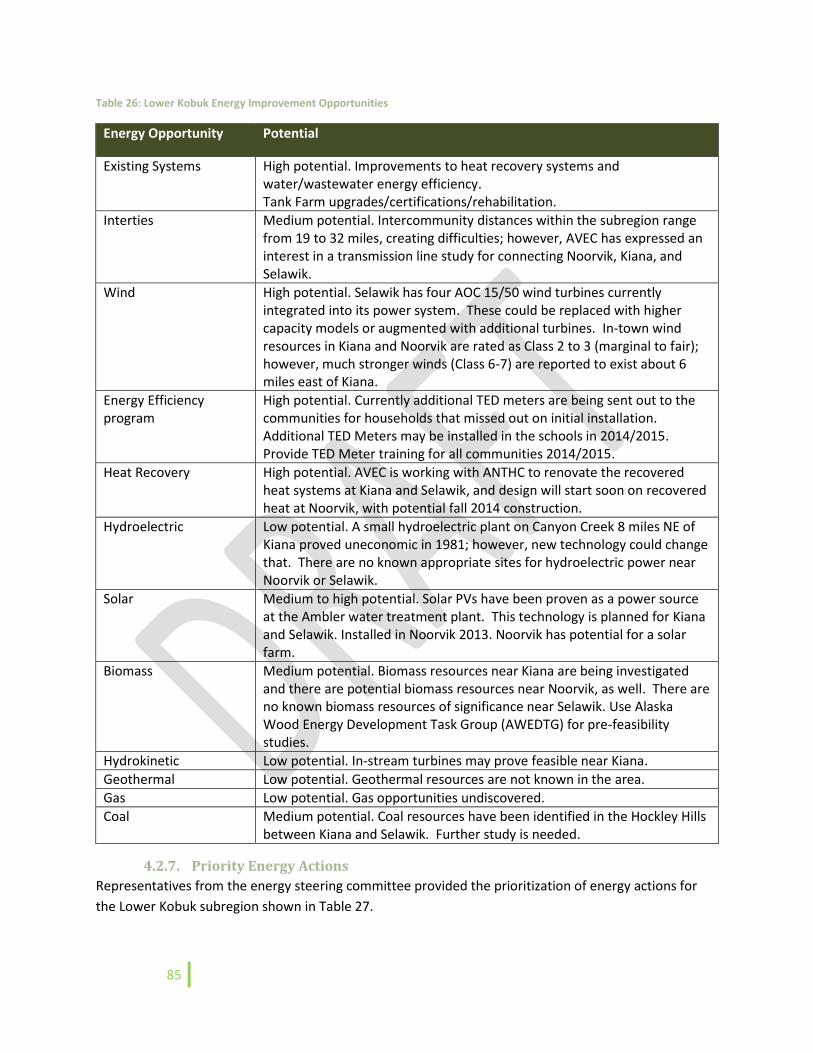
85
Table 26: Lower Kobuk Energy Improvement Opportunities
Energy Opportunity Potential
Existing Systems High potential. Improvements to heat recovery systems and water/wastewater energy efficiency. Tank Farm upgrades/certifications/rehabilitation.
Interties Medium potential. Intercommunity distances within the subregion range from 19 to 32 miles, creating difficulties; however, AVEC has expressed an interest in a transmission line study for connecting Noorvik, Kiana, and Selawik.
Wind High potential. Selawik has four AOC 15/50 wind turbines currently integrated into its power system. These could be replaced with higher capacity models or augmented with additional turbines. In-town wind resources in Kiana and Noorvik are rated as Class 2 to 3 (marginal to fair); however, much stronger winds (Class 6-7) are reported to exist about 6 miles east of Kiana.
Energy Efficiency program
High potential. Currently additional TED meters are being sent out to the communities for households that missed out on initial installation. Additional TED Meters may be installed in the schools in 2014/2015. Provide TED Meter training for all communities 2014/2015.
Heat Recovery High potential. AVEC is working with ANTHC to renovate the recovered heat systems at Kiana and Selawik, and design will start soon on recovered heat at Noorvik, with potential fall 2014 construction.
Hydroelectric Low potential. A small hydroelectric plant on Canyon Creek 8 miles NE of Kiana proved uneconomic in 1981; however, new technology could change that. There are no known appropriate sites for hydroelectric power near Noorvik or Selawik.
Solar Medium to high potential. Solar PVs have been proven as a power source at the Ambler water treatment plant. This technology is planned for Kiana and Selawik. Installed in Noorvik 2013. Noorvik has potential for a solar farm.
Biomass Medium potential. Biomass resources near Kiana are being investigated and there are potential biomass resources near Noorvik, as well. There are no known biomass resources of significance near Selawik. Use Alaska Wood Energy Development Task Group (AWEDTG) for pre-feasibility studies.
Hydrokinetic Low potential. In-stream turbines may prove feasible near Kiana.
Geothermal Low potential. Geothermal resources are not known in the area.
Gas Low potential. Gas opportunities undiscovered.
Coal Medium potential. Coal resources have been identified in the Hockley Hills between Kiana and Selawik. Further study is needed.
4.2.7. Priority Energy Actions
Representatives from the energy steering committee provided the prioritization of energy actions for
the Lower Kobuk subregion shown in Table 27.
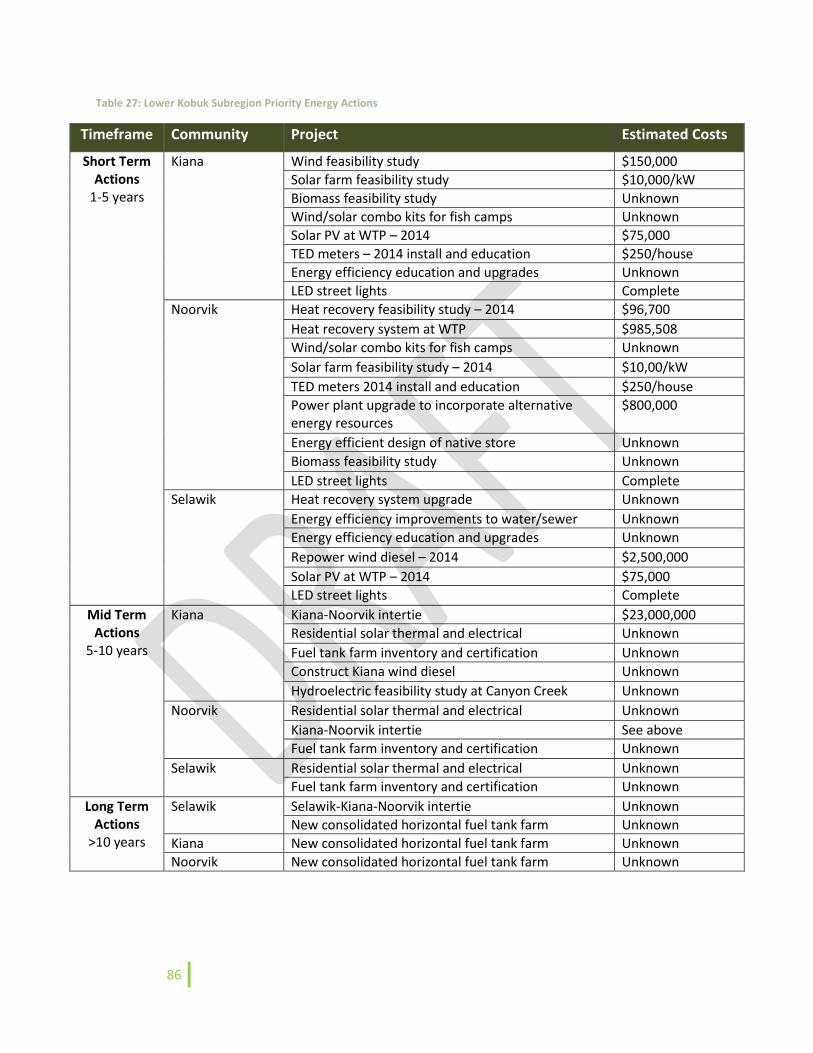
86
Table 27: Lower Kobuk Subregion Priority Energy Actions
Timeframe Community Project Estimated Costs
Short Term Actions
1-5 years
Kiana Wind feasibility study $150,000
Solar farm feasibility study $10,000/kW
Biomass feasibility study Unknown
Wind/solar combo kits for fish camps Unknown
Solar PV at WTP – 2014 $75,000
TED meters – 2014 install and education $250/house
Energy efficiency education and upgrades Unknown
LED street lights Complete
Noorvik Heat recovery feasibility study – 2014 $96,700
Heat recovery system at WTP $985,508
Wind/solar combo kits for fish camps Unknown
Solar farm feasibility study – 2014 $10,00/kW
TED meters 2014 install and education $250/house
Power plant upgrade to incorporate alternative energy resources
$800,000
Energy efficient design of native store Unknown
Biomass feasibility study Unknown
LED street lights Complete
Selawik Heat recovery system upgrade Unknown
Energy efficiency improvements to water/sewer Unknown
Energy efficiency education and upgrades Unknown
Repower wind diesel – 2014 $2,500,000
Solar PV at WTP – 2014 $75,000
LED street lights Complete
Mid Term Actions
5-10 years
Kiana Kiana-Noorvik intertie $23,000,000
Residential solar thermal and electrical Unknown
Fuel tank farm inventory and certification Unknown
Construct Kiana wind diesel Unknown
Hydroelectric feasibility study at Canyon Creek Unknown
Noorvik Residential solar thermal and electrical Unknown
Kiana-Noorvik intertie See above
Fuel tank farm inventory and certification Unknown
Selawik Residential solar thermal and electrical Unknown
Fuel tank farm inventory and certification Unknown
Long Term Actions
>10 years
Selawik Selawik-Kiana-Noorvik intertie Unknown
New consolidated horizontal fuel tank farm Unknown
Kiana New consolidated horizontal fuel tank farm Unknown
Noorvik New consolidated horizontal fuel tank farm Unknown

87
88
Kiana Community and Energy Profile
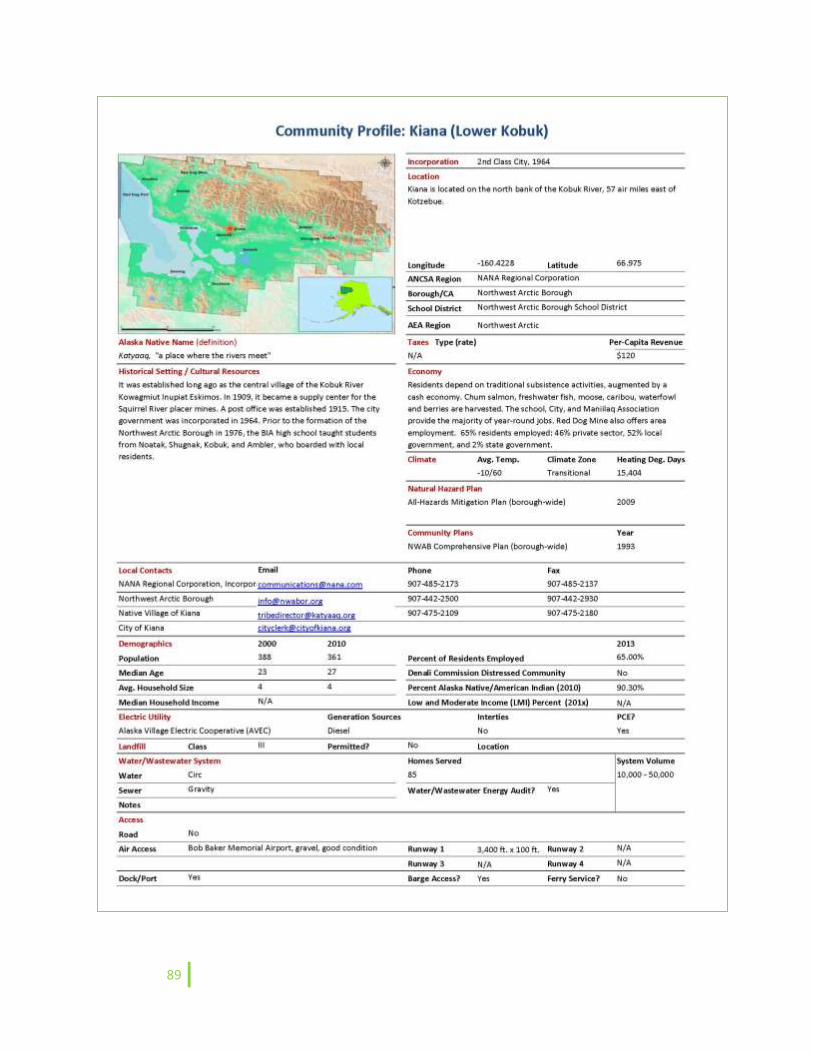
89
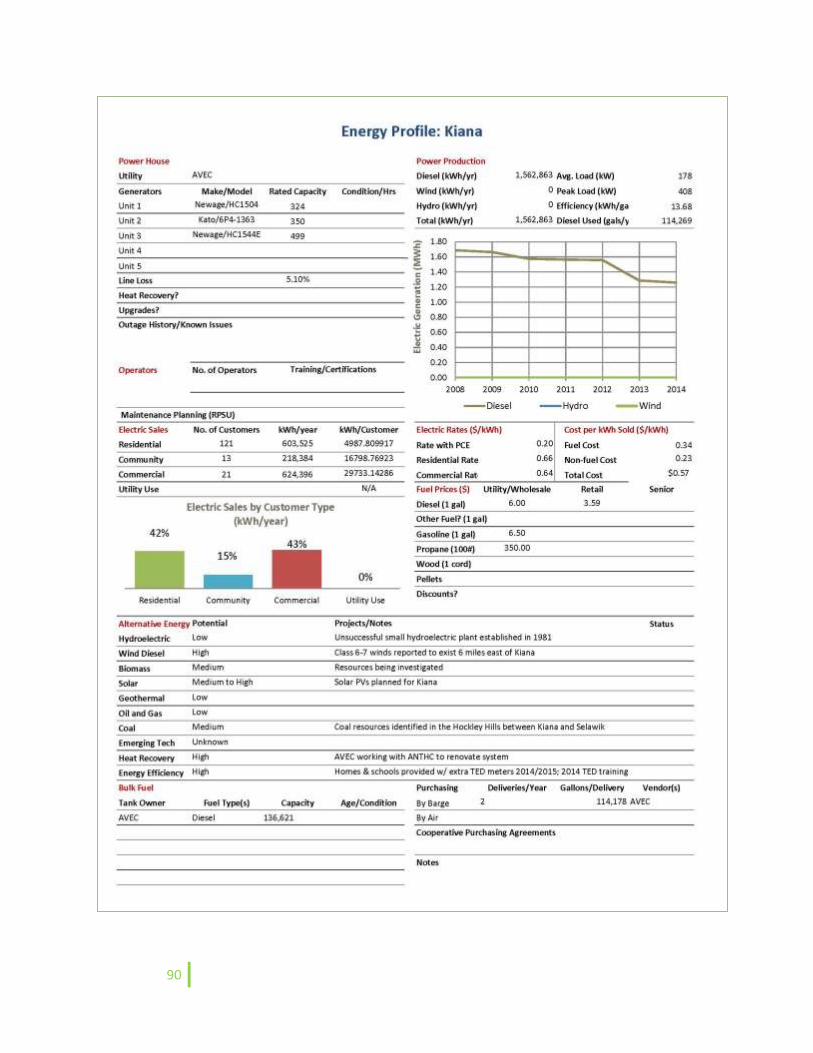
90
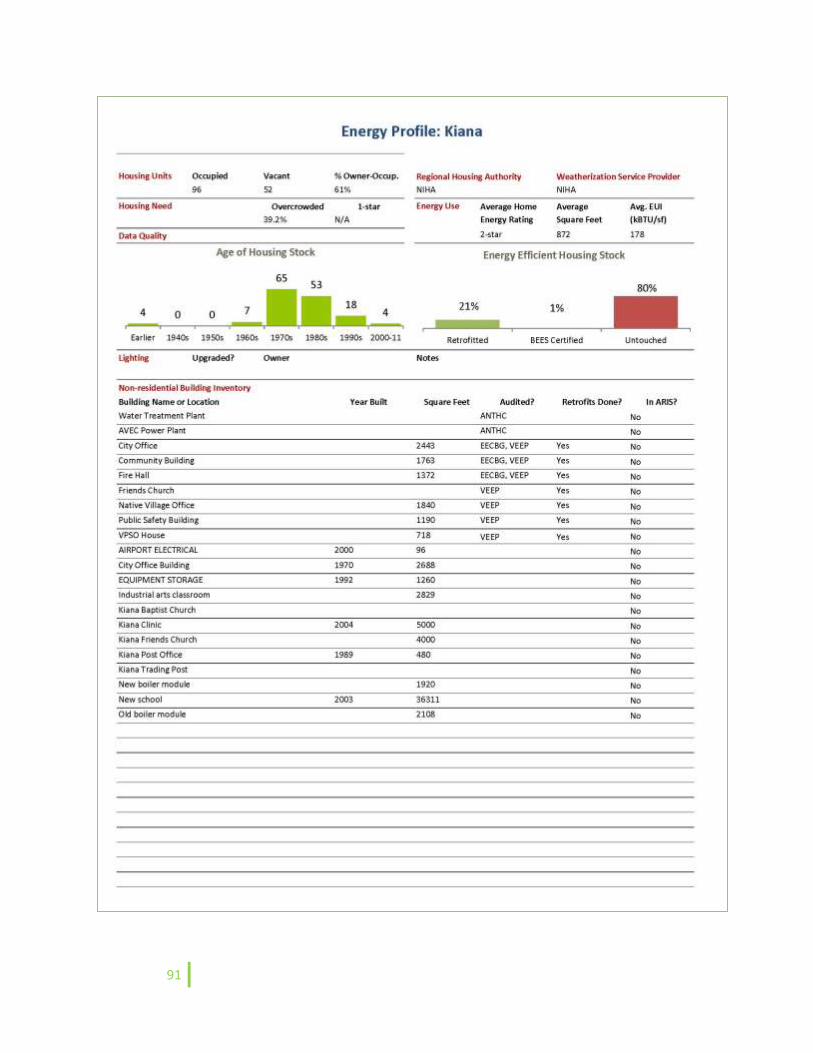
91
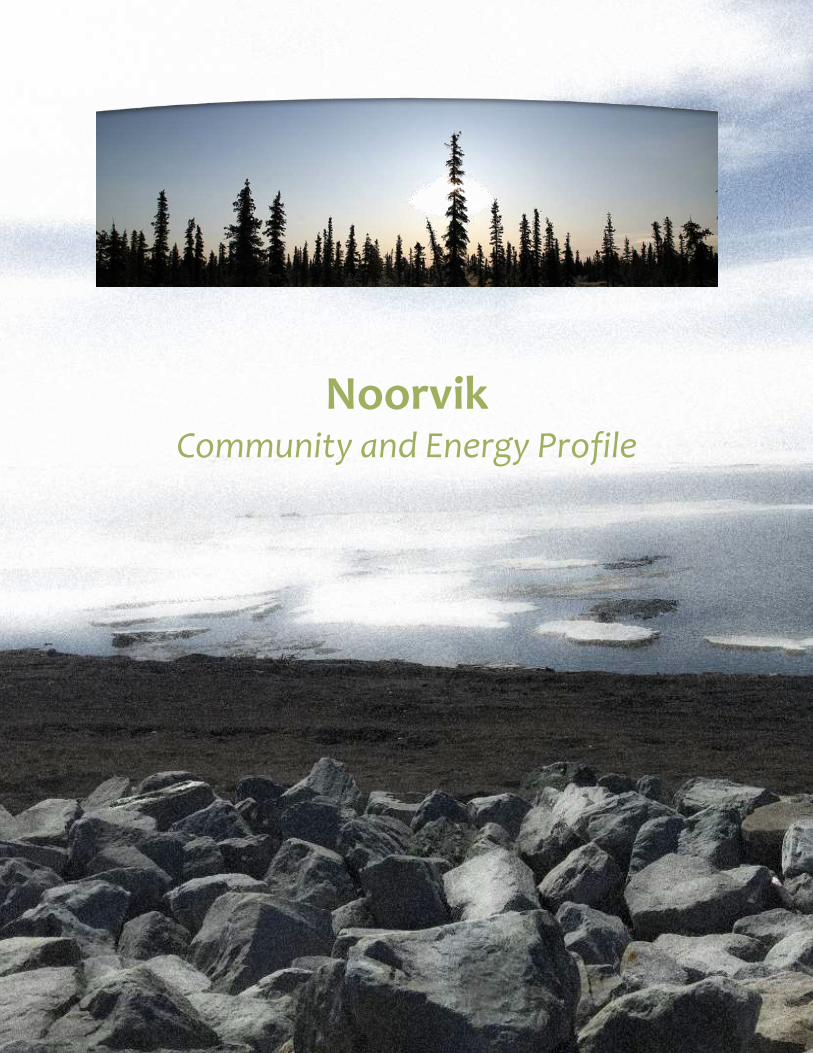
92
Noorvik Community and Energy Profile

93
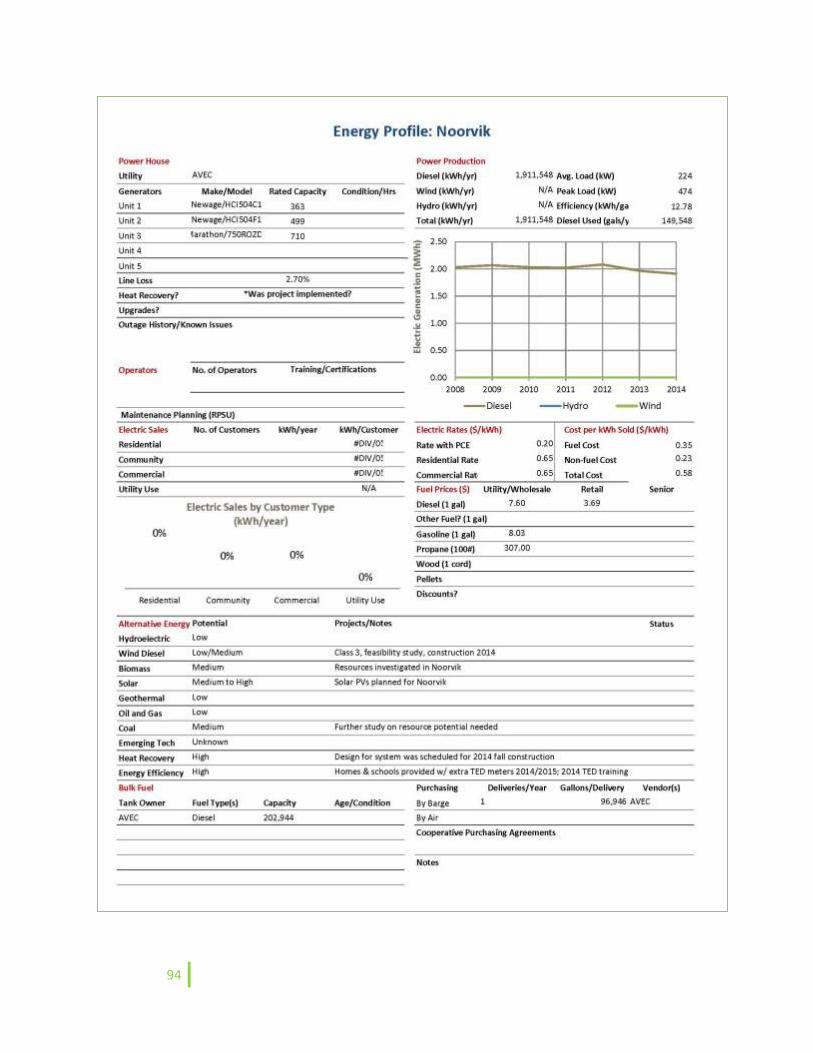
94
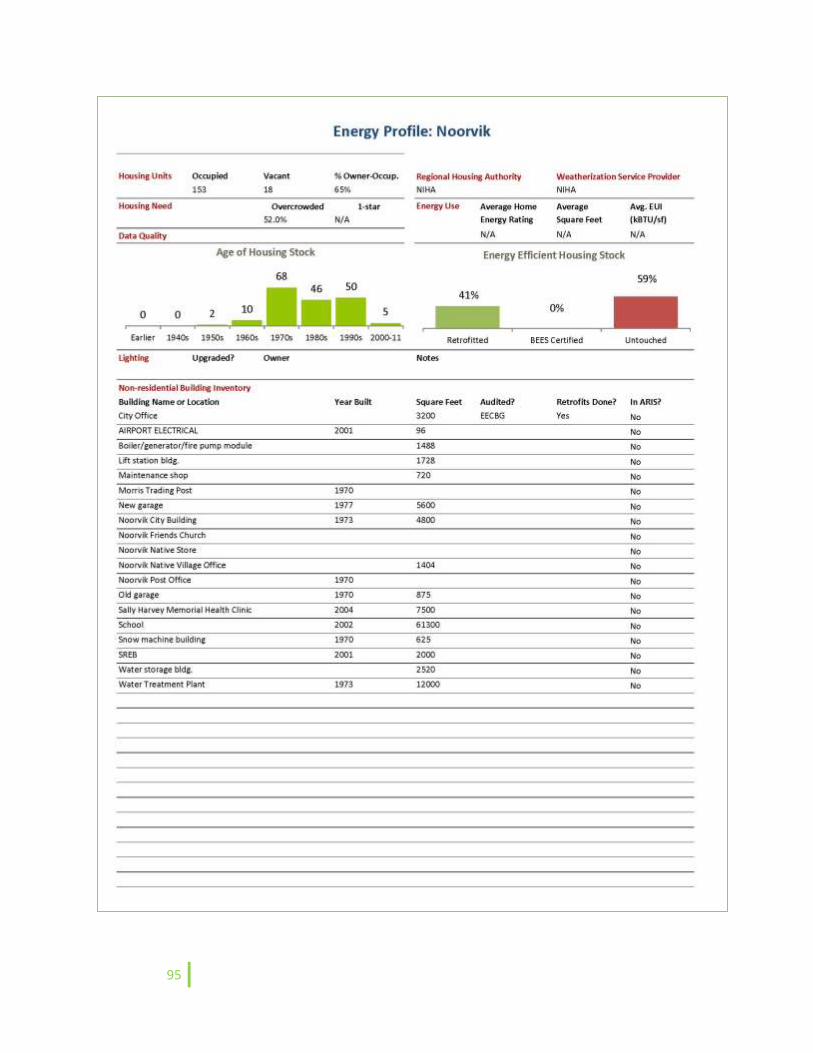
95

96
Selawik Community and Energy Profile
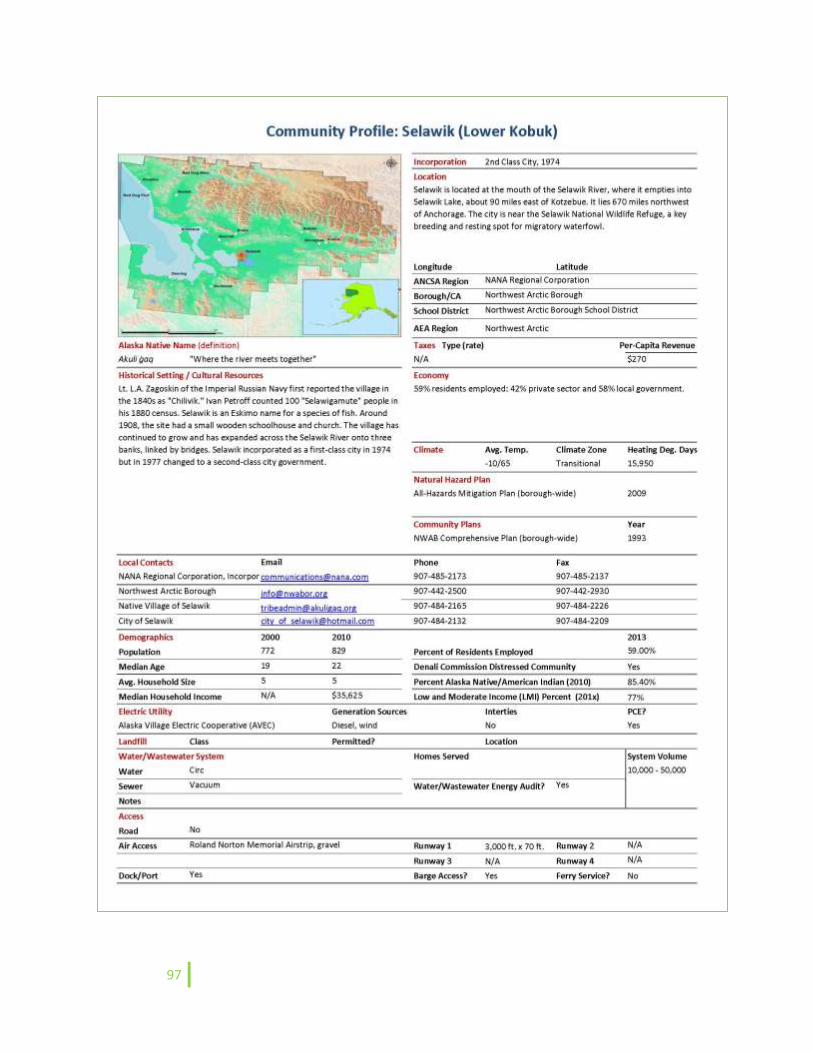
97

98
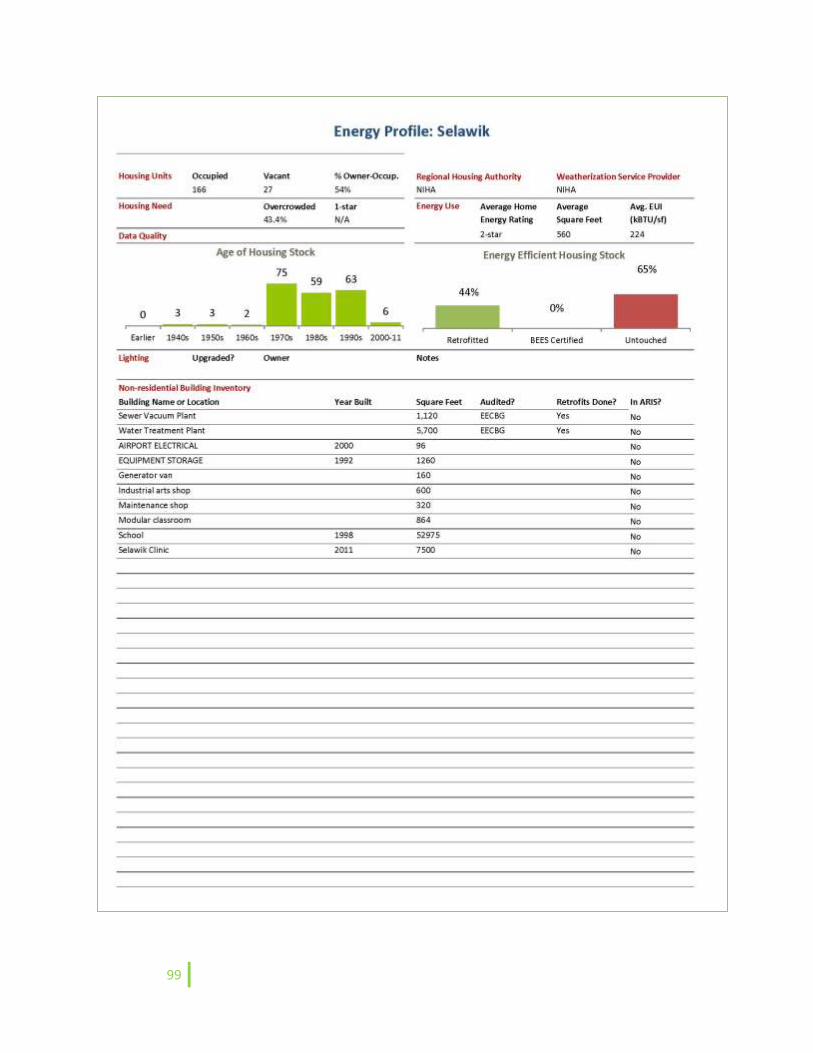
99
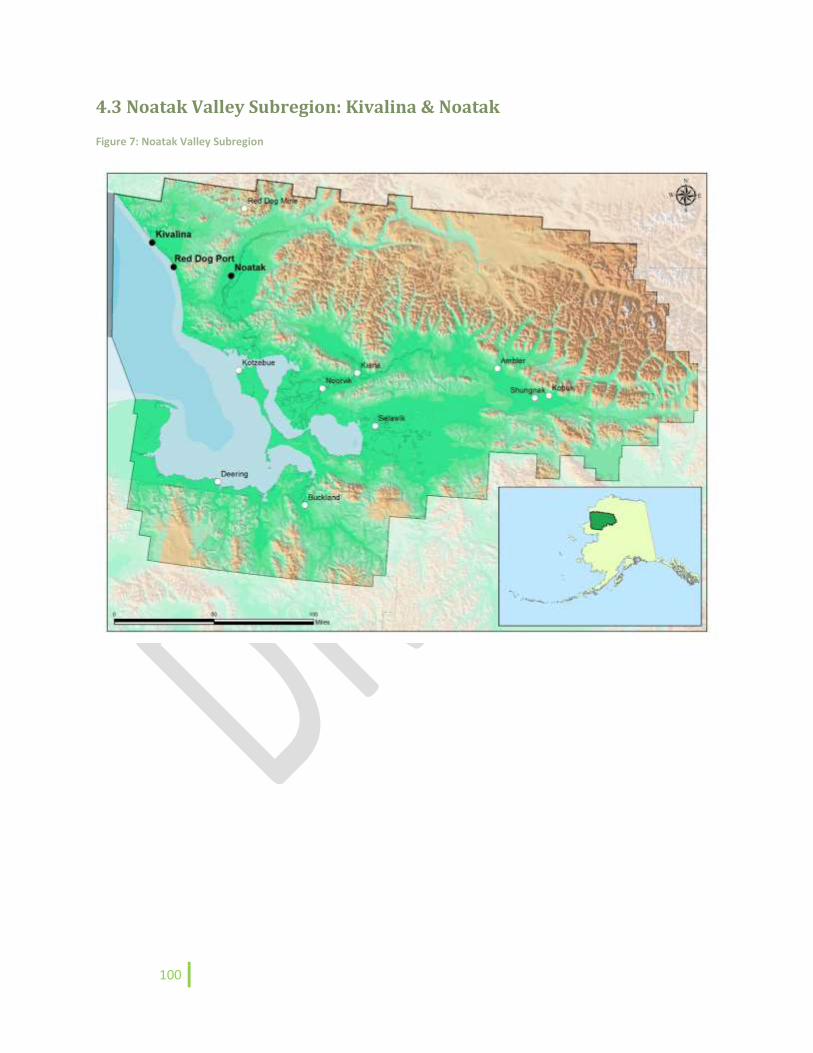
100
4.3 Noatak Valley Subregion: Kivalina & Noatak
Figure 7: Noatak Valley Subregion
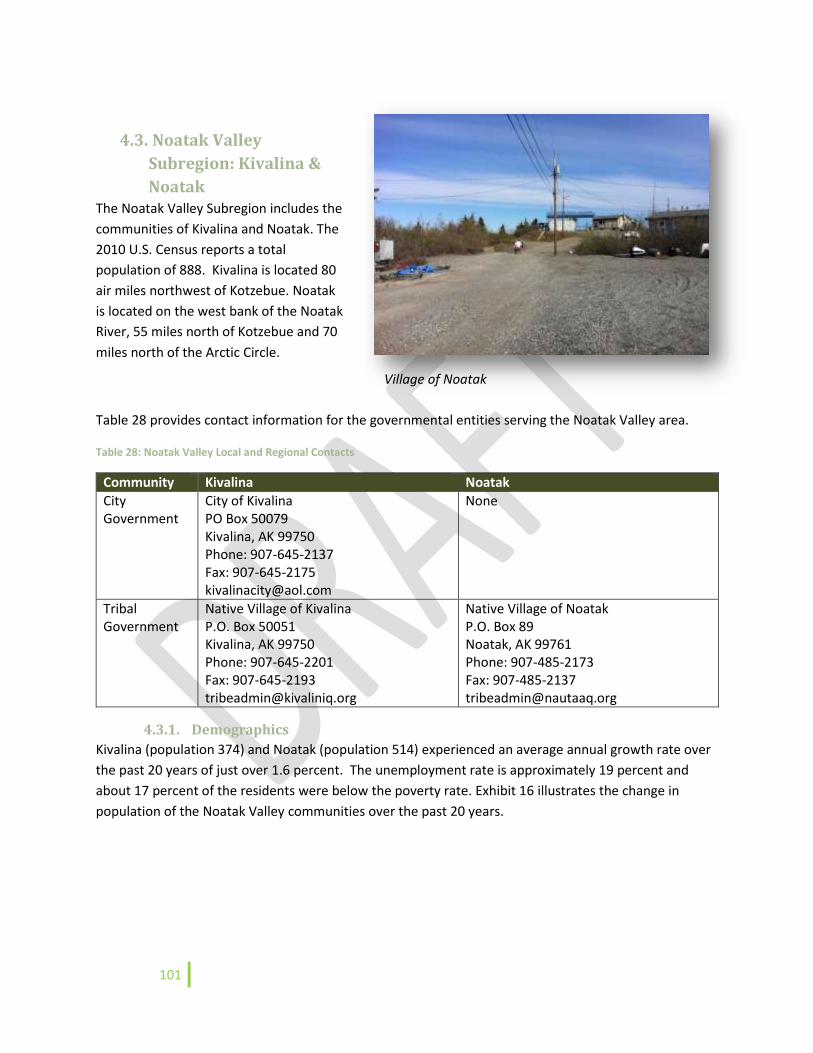
101
4.3. Noatak Valley
Subregion: Kivalina &
Noatak The Noatak Valley Subregion includes the
communities of Kivalina and Noatak. The
2010 U.S. Census reports a total
population of 888. Kivalina is located 80
air miles northwest of Kotzebue. Noatak
is located on the west bank of the Noatak
River, 55 miles north of Kotzebue and 70
miles north of the Arctic Circle.
Table 28 provides contact information for the governmental entities serving the Noatak Valley area.
Table 28: Noatak Valley Local and Regional Contacts
Community Kivalina Noatak
City Government
City of Kivalina PO Box 50079 Kivalina, AK 99750 Phone: 907-645-2137 Fax: 907-645-2175 [email protected]
None
Tribal Government
Native Village of Kivalina P.O. Box 50051 Kivalina, AK 99750 Phone: 907-645-2201 Fax: 907-645-2193 [email protected]
Native Village of Noatak P.O. Box 89 Noatak, AK 99761 Phone: 907-485-2173 Fax: 907-485-2137 [email protected]
4.3.1. Demographics
Kivalina (population 374) and Noatak (population 514) experienced an average annual growth rate over
the past 20 years of just over 1.6 percent. The unemployment rate is approximately 19 percent and
about 17 percent of the residents were below the poverty rate. Exhibit 16 illustrates the change in
population of the Noatak Valley communities over the past 20 years.
Village of Noatak
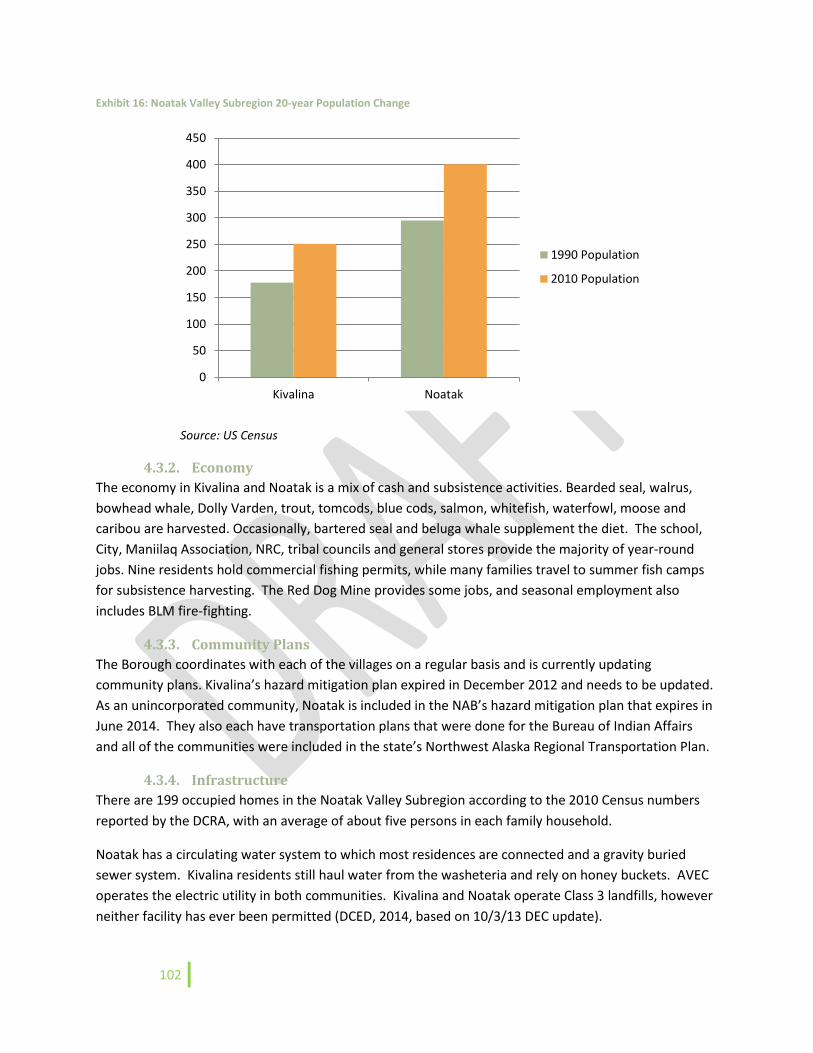
102
Exhibit 16: Noatak Valley Subregion 20-year Population Change
Source: US Census
4.3.2. Economy
The economy in Kivalina and Noatak is a mix of cash and subsistence activities. Bearded seal, walrus,
bowhead whale, Dolly Varden, trout, tomcods, blue cods, salmon, whitefish, waterfowl, moose and
caribou are harvested. Occasionally, bartered seal and beluga whale supplement the diet. The school,
City, Maniilaq Association, NRC, tribal councils and general stores provide the majority of year-round
jobs. Nine residents hold commercial fishing permits, while many families travel to summer fish camps
for subsistence harvesting. The Red Dog Mine provides some jobs, and seasonal employment also
includes BLM fire-fighting.
4.3.3. Community Plans
The Borough coordinates with each of the villages on a regular basis and is currently updating
community plans. Kivalina’s hazard mitigation plan expired in December 2012 and needs to be updated.
As an unincorporated community, Noatak is included in the NAB’s hazard mitigation plan that expires in
June 2014. They also each have transportation plans that were done for the Bureau of Indian Affairs
and all of the communities were included in the state’s Northwest Alaska Regional Transportation Plan.
4.3.4. Infrastructure
There are 199 occupied homes in the Noatak Valley Subregion according to the 2010 Census numbers
reported by the DCRA, with an average of about five persons in each family household.
Noatak has a circulating water system to which most residences are connected and a gravity buried
sewer system. Kivalina residents still haul water from the washeteria and rely on honey buckets. AVEC
operates the electric utility in both communities. Kivalina and Noatak operate Class 3 landfills, however
neither facility has ever been permitted (DCED, 2014, based on 10/3/13 DEC update).
0
50
100
150
200
250
300
350
400
450
Kivalina Noatak
1990 Population
2010 Population
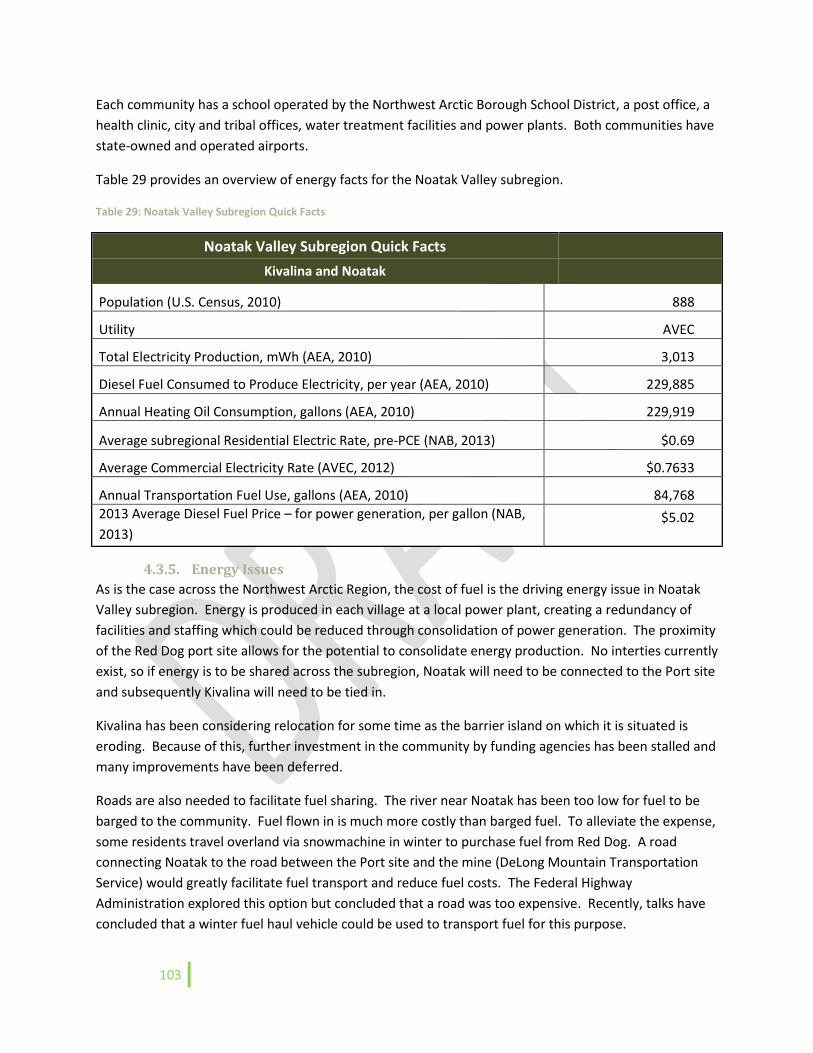
103
Each community has a school operated by the Northwest Arctic Borough School District, a post office, a
health clinic, city and tribal offices, water treatment facilities and power plants. Both communities have
state-owned and operated airports.
Table 29 provides an overview of energy facts for the Noatak Valley subregion.
Table 29: Noatak Valley Subregion Quick Facts
Noatak Valley Subregion Quick Facts Kivalina and Noatak
Population (U.S. Census, 2010) 888
Utility AVEC
Total Electricity Production, mWh (AEA, 2010) 3,013
Diesel Fuel Consumed to Produce Electricity, per year (AEA, 2010) 229,885
Annual Heating Oil Consumption, gallons (AEA, 2010) 229,919
Average subregional Residential Electric Rate, pre-PCE (NAB, 2013) $0.69
Average Commercial Electricity Rate (AVEC, 2012) $0.7633
Annual Transportation Fuel Use, gallons (AEA, 2010) 84,768
2013 Average Diesel Fuel Price – for power generation, per gallon (NAB,
2013) $5.02
4.3.5. Energy Issues
As is the case across the Northwest Arctic Region, the cost of fuel is the driving energy issue in Noatak
Valley subregion. Energy is produced in each village at a local power plant, creating a redundancy of
facilities and staffing which could be reduced through consolidation of power generation. The proximity
of the Red Dog port site allows for the potential to consolidate energy production. No interties currently
exist, so if energy is to be shared across the subregion, Noatak will need to be connected to the Port site
and subsequently Kivalina will need to be tied in.
Kivalina has been considering relocation for some time as the barrier island on which it is situated is
eroding. Because of this, further investment in the community by funding agencies has been stalled and
many improvements have been deferred.
Roads are also needed to facilitate fuel sharing. The river near Noatak has been too low for fuel to be
barged to the community. Fuel flown in is much more costly than barged fuel. To alleviate the expense,
some residents travel overland via snowmachine in winter to purchase fuel from Red Dog. A road
connecting Noatak to the road between the Port site and the mine (DeLong Mountain Transportation
Service) would greatly facilitate fuel transport and reduce fuel costs. The Federal Highway
Administration explored this option but concluded that a road was too expensive. Recently, talks have
concluded that a winter fuel haul vehicle could be used to transport fuel for this purpose.
104
Noatak’s water and sewer facilities – particularly the wastewater facilities – need extensive work, and
improvements would be expected to reduce the energy needed to keep them operational.
AVEC has actively pursued funding for a new power plant and tank farm in Noatak. In early 2009, with
the help of community leaders, a feasible power plant and consolidated tank farm site near the new
school was identified. The new power plant would be more efficient than the current plant. The
consolidated tank farm would serve AVEC and Native Village of Noatak. AVEC has previously looked at
the feasibility of installing solar panels in Noatak to help reduce power plant service station fees. The
proposed power plant and tank farm site is currently leased from NANA to the Borough for a length of
55 years. NAB determined that they do not want to sublease the site to AVEC and instead would like
AVEC to obtain the land directly from NANA. AVEC has initiated this process, but it has proven to be
difficult and expensive, so they are looking at alternatives.
AVEC approached the Alaska State Legislature in January 2012 requesting an appropriation of
$11,500,000 for a new power plant and consolidated bulk fuel facility that would be constructed away
from the currently eroding site on the Noatak River. The project was not awarded. To move forward,
AVEC needs NANA’s assistance in gaining site control for an area near the new school.
According to findings in a 2001 Concept Design Report,10 Noatak’s fuel storage capacity included the
following:
AVEC: 99,800 gallons
IRA: 91,800 gallons
School: 89,500 gallons
From AVEC’s operations numbers, the maximum fill capacity is 95,000 gallons and the usable capacity is
92,000 gallons.
The Noatak IRA operates three separate tank farms: at the store, the pump house and the airport. Total
capacity is 91,800 gallons. The store has 46,000 gallons. The pump house tank farm is in two separate
locations, with a combined capacity of 26,500 gallons. The remaining tanks are located at the airport
with a combined capacity of about 19,300.
AEA granted funding to AVEC to produce a conceptual design report and feasibility study for a
transmission line and wind development at both Kivalina and the Red Dog Mine, however, economic
feasibility remains the primary obstacle to ascertaining feasibility. The Kivalina power plant site is
vulnerable as it is located near the beach which is subject to erosion; the tank farm is located far from
power plant. Future funding might be hard to secure at the ‘old’ site and the new site is undefined.
10 Cited by AVEC in email May 23, 2013.
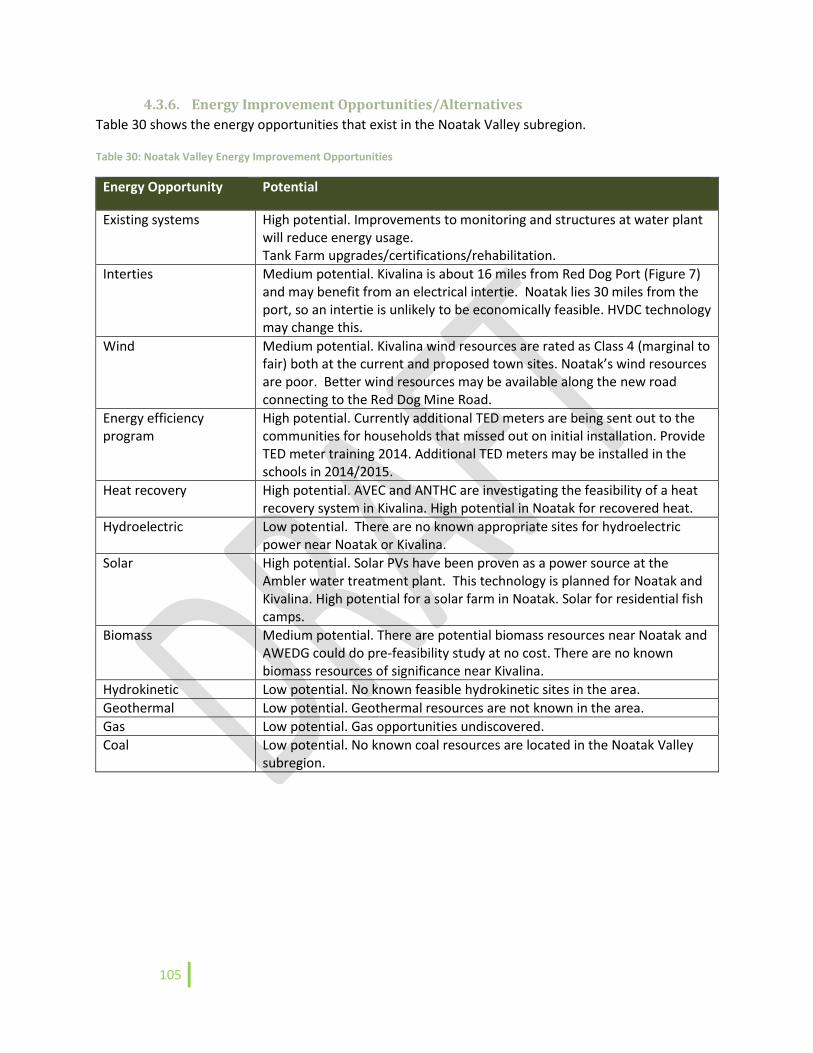
105
4.3.6. Energy Improvement Opportunities/Alternatives
Table 30 shows the energy opportunities that exist in the Noatak Valley subregion.
Table 30: Noatak Valley Energy Improvement Opportunities
Energy Opportunity Potential
Existing systems High potential. Improvements to monitoring and structures at water plant will reduce energy usage. Tank Farm upgrades/certifications/rehabilitation.
Interties Medium potential. Kivalina is about 16 miles from Red Dog Port (Figure 7) and may benefit from an electrical intertie. Noatak lies 30 miles from the port, so an intertie is unlikely to be economically feasible. HVDC technology may change this.
Wind Medium potential. Kivalina wind resources are rated as Class 4 (marginal to fair) both at the current and proposed town sites. Noatak’s wind resources are poor. Better wind resources may be available along the new road connecting to the Red Dog Mine Road.
Energy efficiency program
High potential. Currently additional TED meters are being sent out to the communities for households that missed out on initial installation. Provide TED meter training 2014. Additional TED meters may be installed in the schools in 2014/2015.
Heat recovery High potential. AVEC and ANTHC are investigating the feasibility of a heat recovery system in Kivalina. High potential in Noatak for recovered heat.
Hydroelectric Low potential. There are no known appropriate sites for hydroelectric power near Noatak or Kivalina.
Solar High potential. Solar PVs have been proven as a power source at the Ambler water treatment plant. This technology is planned for Noatak and Kivalina. High potential for a solar farm in Noatak. Solar for residential fish camps.
Biomass Medium potential. There are potential biomass resources near Noatak and AWEDG could do pre-feasibility study at no cost. There are no known biomass resources of significance near Kivalina.
Hydrokinetic Low potential. No known feasible hydrokinetic sites in the area.
Geothermal Low potential. Geothermal resources are not known in the area.
Gas Low potential. Gas opportunities undiscovered.
Coal Low potential. No known coal resources are located in the Noatak Valley subregion.
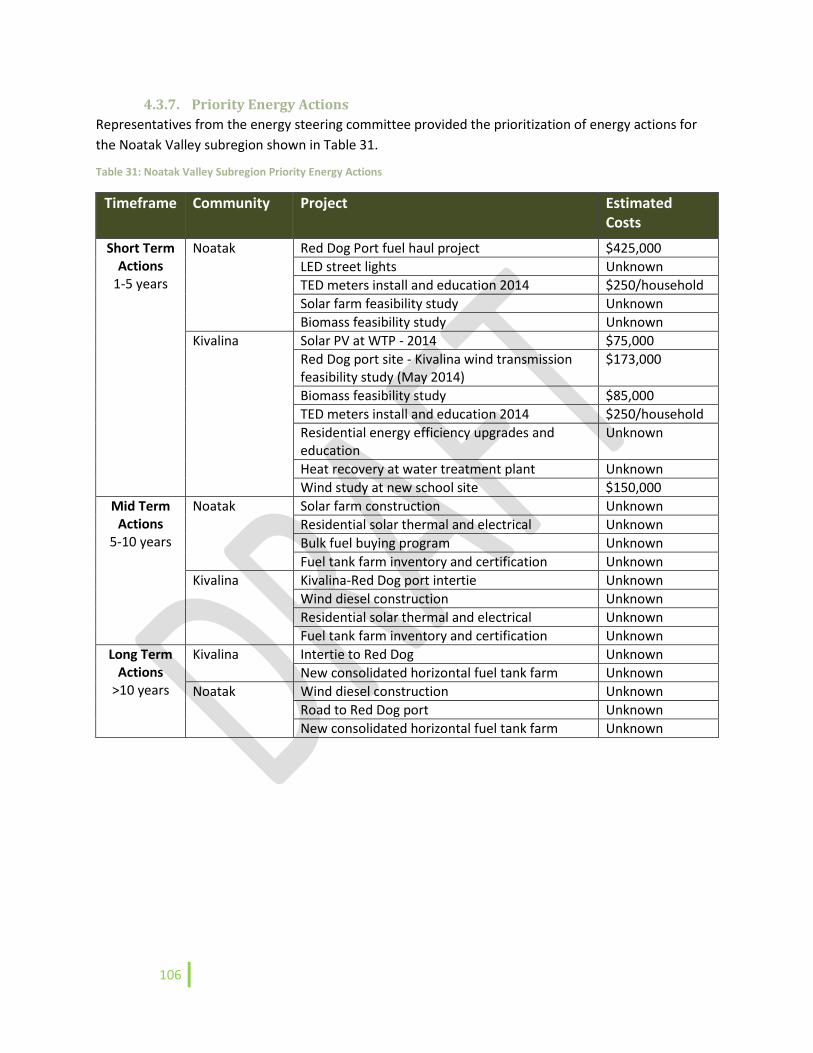
106
4.3.7. Priority Energy Actions
Representatives from the energy steering committee provided the prioritization of energy actions for
the Noatak Valley subregion shown in Table 31.
Table 31: Noatak Valley Subregion Priority Energy Actions
Timeframe Community Project Estimated Costs
Short Term Actions
1-5 years
Noatak Red Dog Port fuel haul project $425,000
LED street lights Unknown
TED meters install and education 2014 $250/household
Solar farm feasibility study Unknown
Biomass feasibility study Unknown
Kivalina Solar PV at WTP - 2014 $75,000
Red Dog port site - Kivalina wind transmission feasibility study (May 2014)
$173,000
Biomass feasibility study $85,000
TED meters install and education 2014 $250/household
Residential energy efficiency upgrades and education
Unknown
Heat recovery at water treatment plant Unknown
Wind study at new school site $150,000
Mid Term Actions
5-10 years
Noatak Solar farm construction Unknown
Residential solar thermal and electrical Unknown
Bulk fuel buying program Unknown
Fuel tank farm inventory and certification Unknown
Kivalina Kivalina-Red Dog port intertie Unknown
Wind diesel construction Unknown
Residential solar thermal and electrical Unknown
Fuel tank farm inventory and certification Unknown
Long Term Actions
>10 years
Kivalina Intertie to Red Dog Unknown
New consolidated horizontal fuel tank farm Unknown
Noatak Wind diesel construction Unknown
Road to Red Dog port Unknown
New consolidated horizontal fuel tank farm Unknown

107
108
Kivalina
Community and Energy Profile
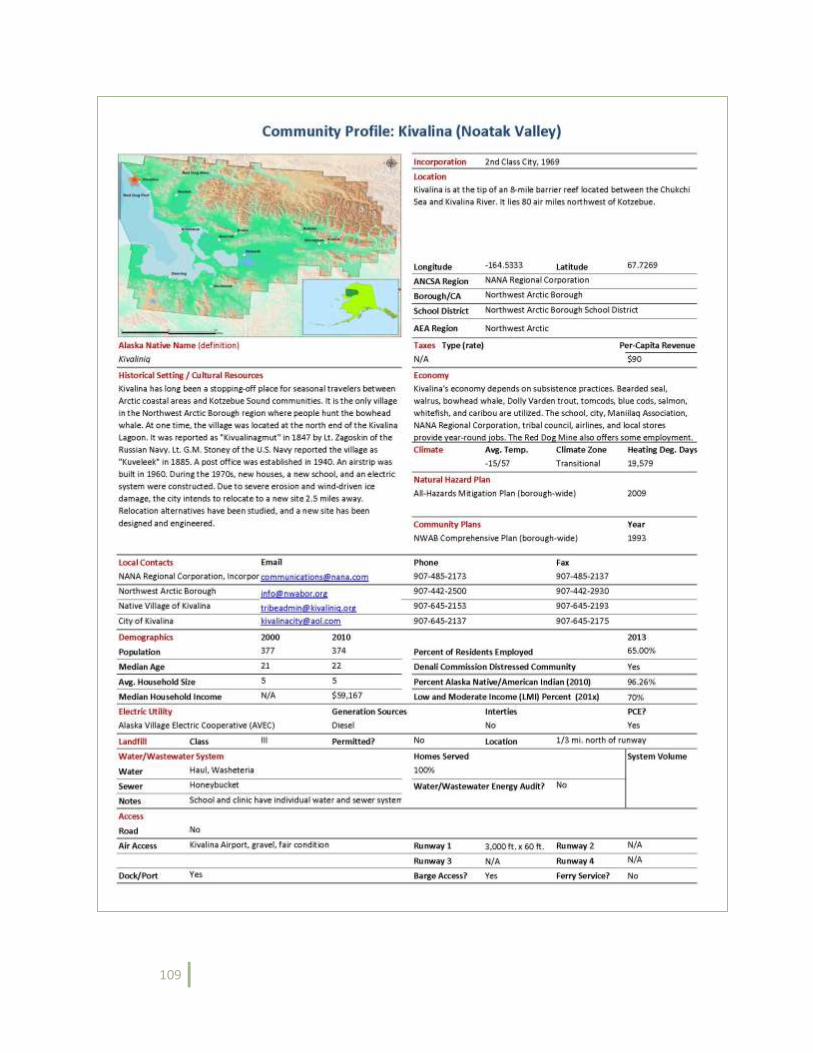
109
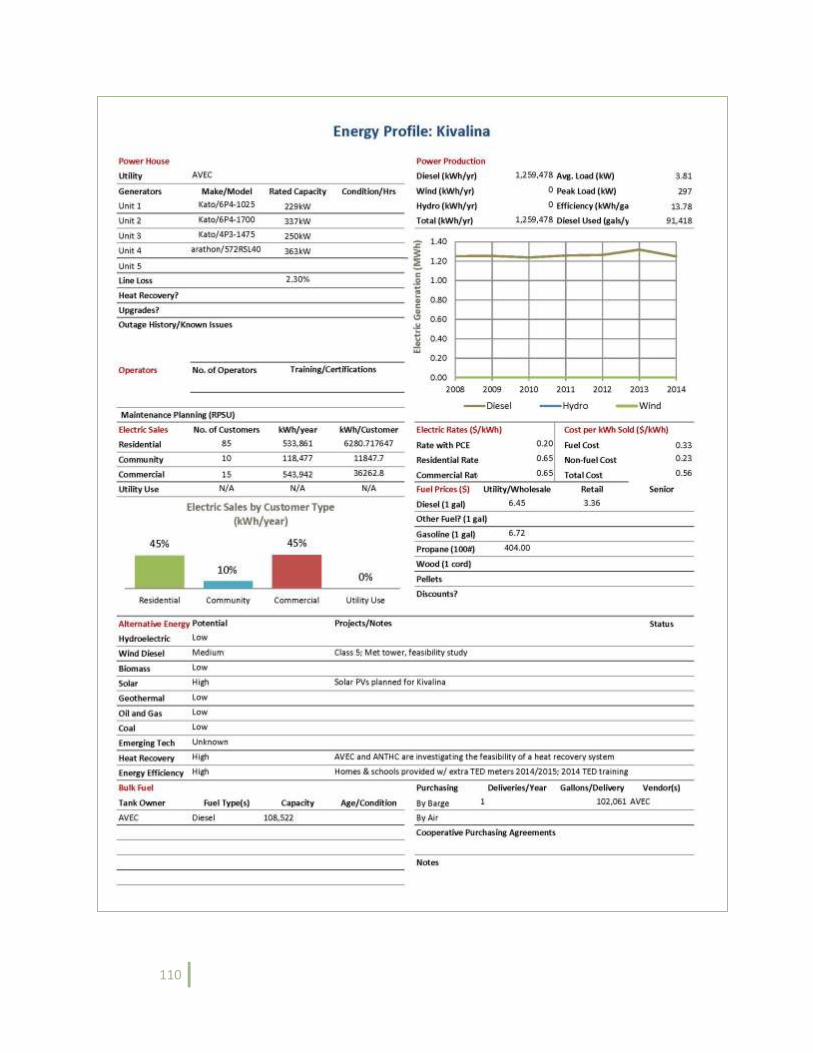
110
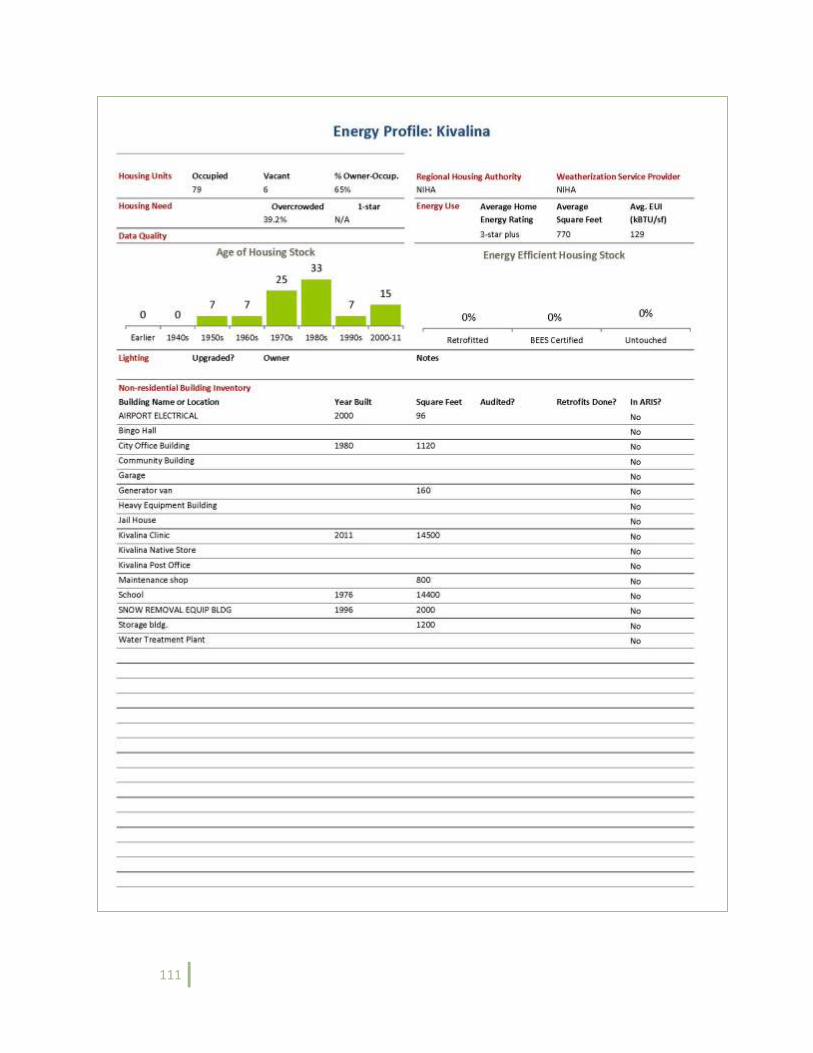
111
112
Noatak
Community and Energy Profile
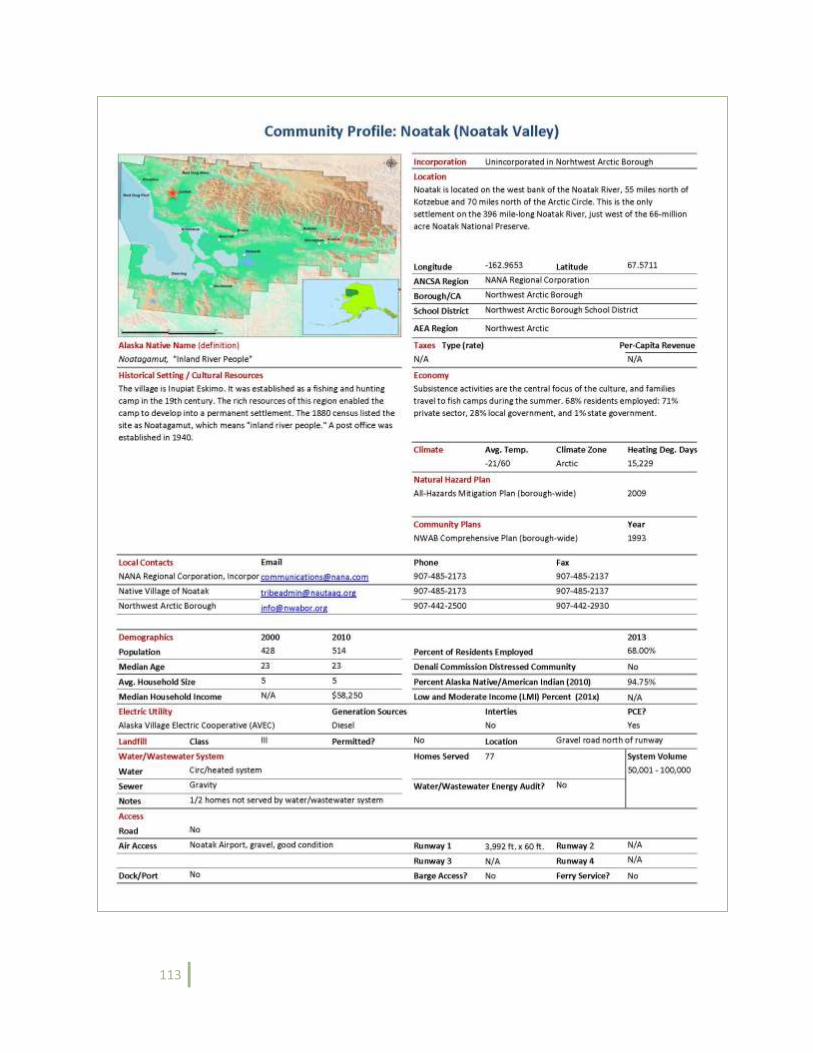
113
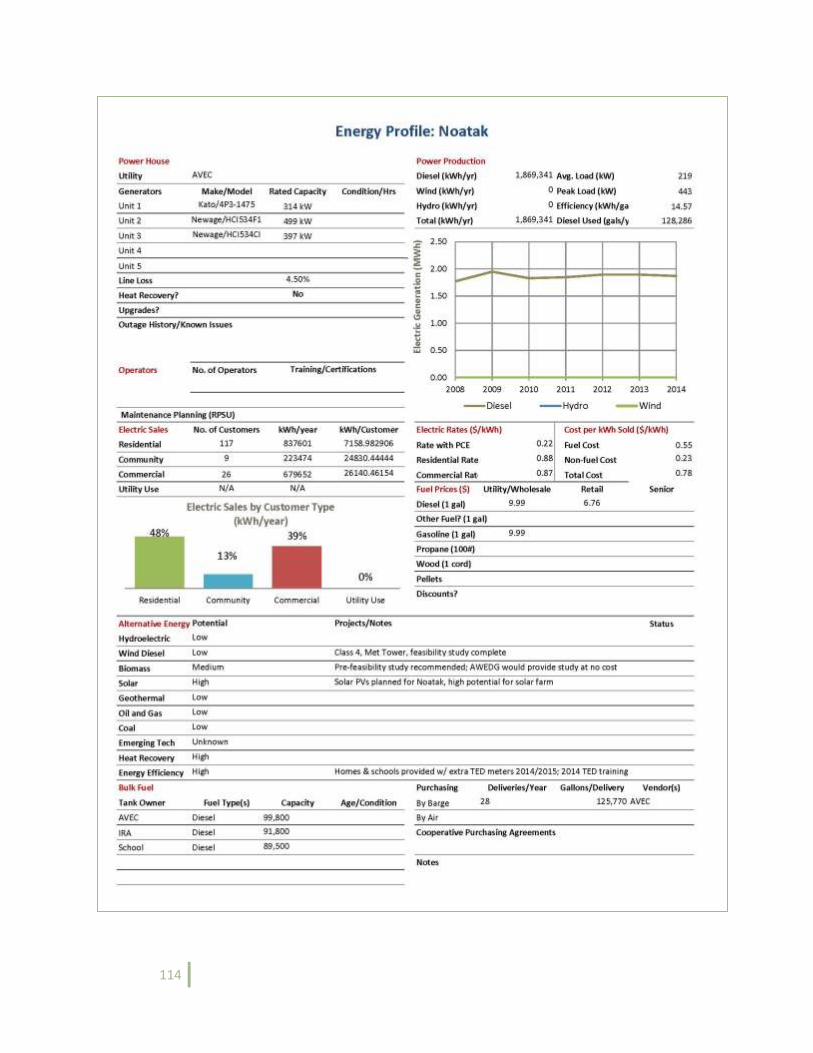
114
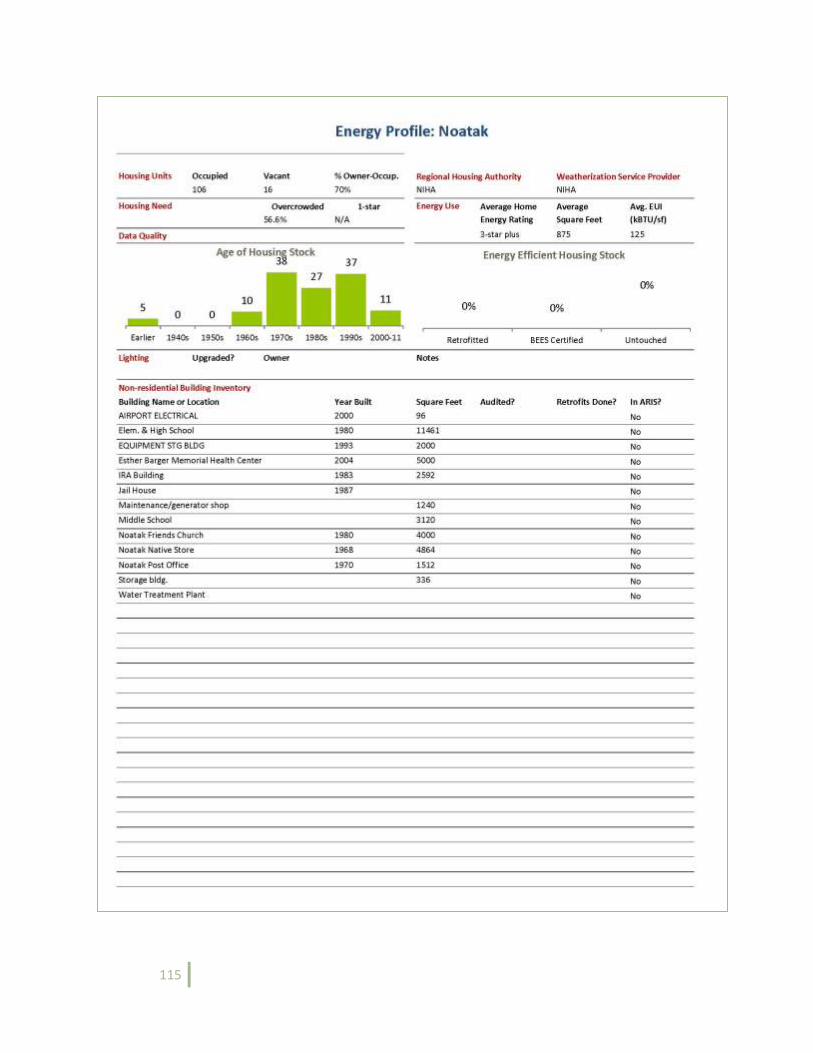
115
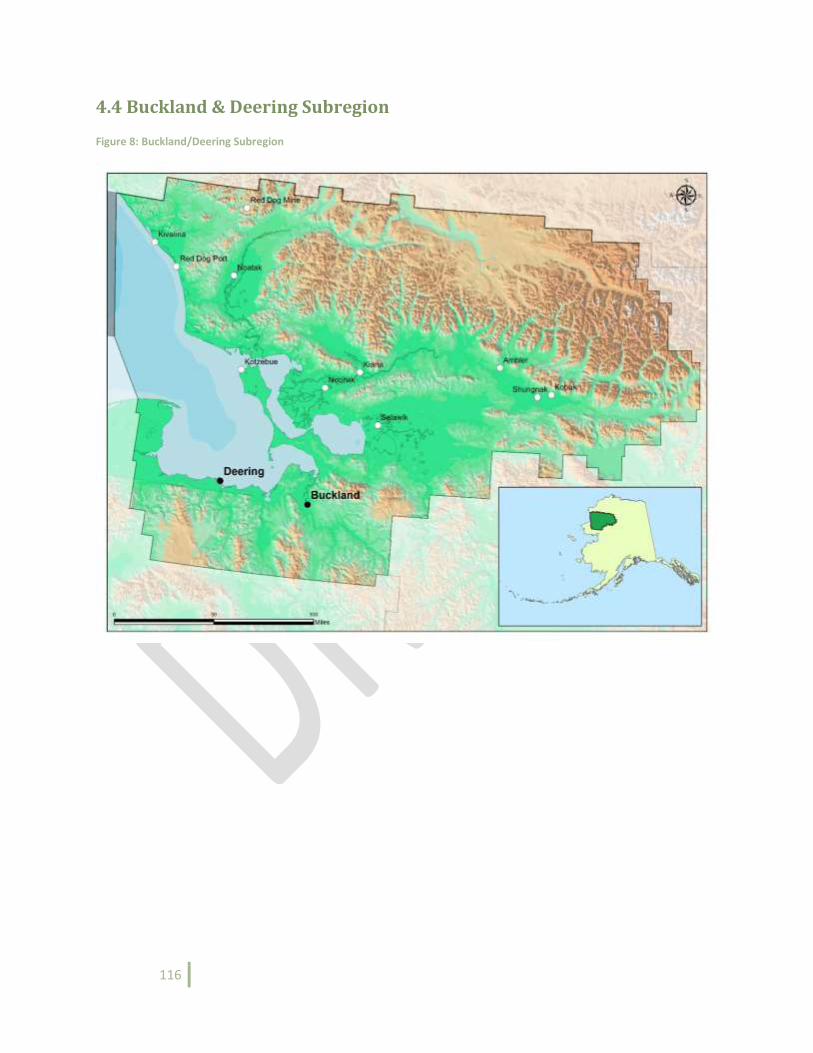
116
4.4 Buckland & Deering Subregion
Figure 8: Buckland/Deering Subregion
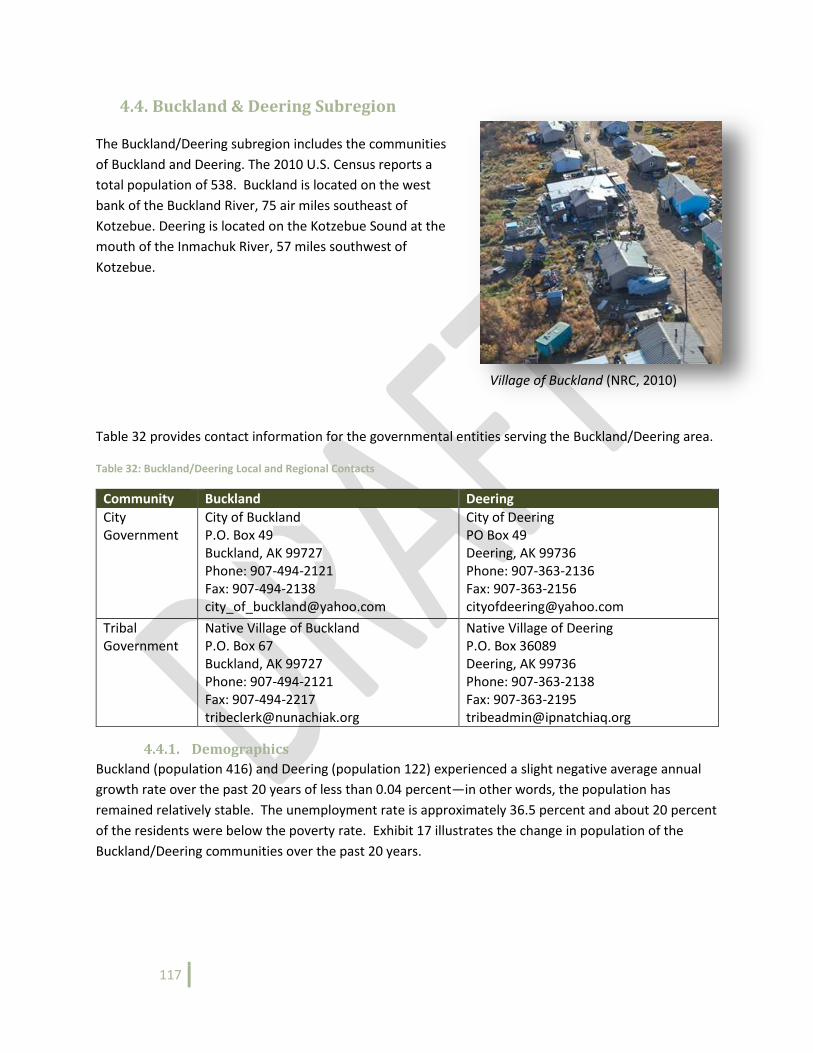
117
4.4. Buckland & Deering Subregion
The Buckland/Deering subregion includes the communities
of Buckland and Deering. The 2010 U.S. Census reports a
total population of 538. Buckland is located on the west
bank of the Buckland River, 75 air miles southeast of
Kotzebue. Deering is located on the Kotzebue Sound at the
mouth of the Inmachuk River, 57 miles southwest of
Kotzebue.
Table 32 provides contact information for the governmental entities serving the Buckland/Deering area.
Table 32: Buckland/Deering Local and Regional Contacts
Community Buckland Deering
City Government
City of Buckland P.O. Box 49 Buckland, AK 99727 Phone: 907-494-2121 Fax: 907-494-2138 [email protected]
City of Deering PO Box 49 Deering, AK 99736 Phone: 907-363-2136 Fax: 907-363-2156 [email protected]
Tribal Government
Native Village of Buckland P.O. Box 67 Buckland, AK 99727 Phone: 907-494-2121 Fax: 907-494-2217 [email protected]
Native Village of Deering P.O. Box 36089 Deering, AK 99736 Phone: 907-363-2138 Fax: 907-363-2195 [email protected]
4.4.1. Demographics
Buckland (population 416) and Deering (population 122) experienced a slight negative average annual
growth rate over the past 20 years of less than 0.04 percent—in other words, the population has
remained relatively stable. The unemployment rate is approximately 36.5 percent and about 20 percent
of the residents were below the poverty rate. Exhibit 17 illustrates the change in population of the
Buckland/Deering communities over the past 20 years.
Village of Buckland (NRC, 2010)
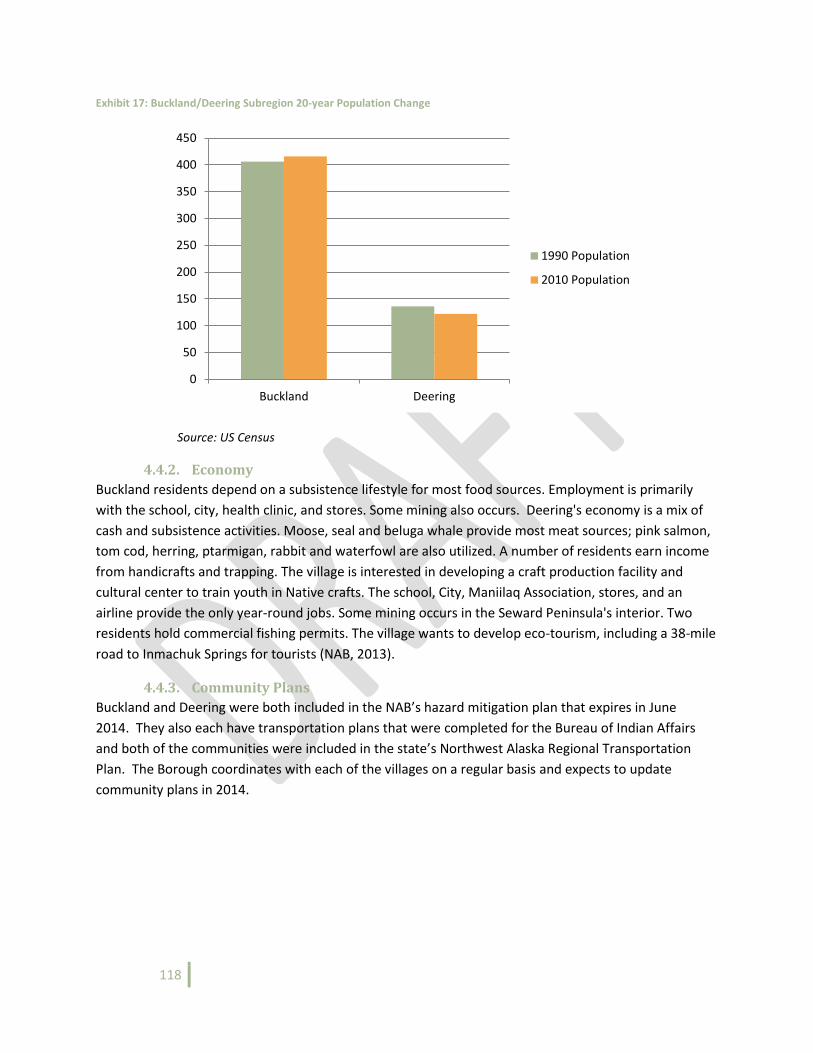
118
Exhibit 17: Buckland/Deering Subregion 20-year Population Change
Source: US Census
4.4.2. Economy
Buckland residents depend on a subsistence lifestyle for most food sources. Employment is primarily
with the school, city, health clinic, and stores. Some mining also occurs. Deering's economy is a mix of
cash and subsistence activities. Moose, seal and beluga whale provide most meat sources; pink salmon,
tom cod, herring, ptarmigan, rabbit and waterfowl are also utilized. A number of residents earn income
from handicrafts and trapping. The village is interested in developing a craft production facility and
cultural center to train youth in Native crafts. The school, City, Maniilaq Association, stores, and an
airline provide the only year-round jobs. Some mining occurs in the Seward Peninsula's interior. Two
residents hold commercial fishing permits. The village wants to develop eco-tourism, including a 38-mile
road to Inmachuk Springs for tourists (NAB, 2013).
4.4.3. Community Plans
Buckland and Deering were both included in the NAB’s hazard mitigation plan that expires in June
2014. They also each have transportation plans that were completed for the Bureau of Indian Affairs
and both of the communities were included in the state’s Northwest Alaska Regional Transportation
Plan. The Borough coordinates with each of the villages on a regular basis and expects to update
community plans in 2014.
0
50
100
150
200
250
300
350
400
450
Buckland Deering
1990 Population
2010 Population
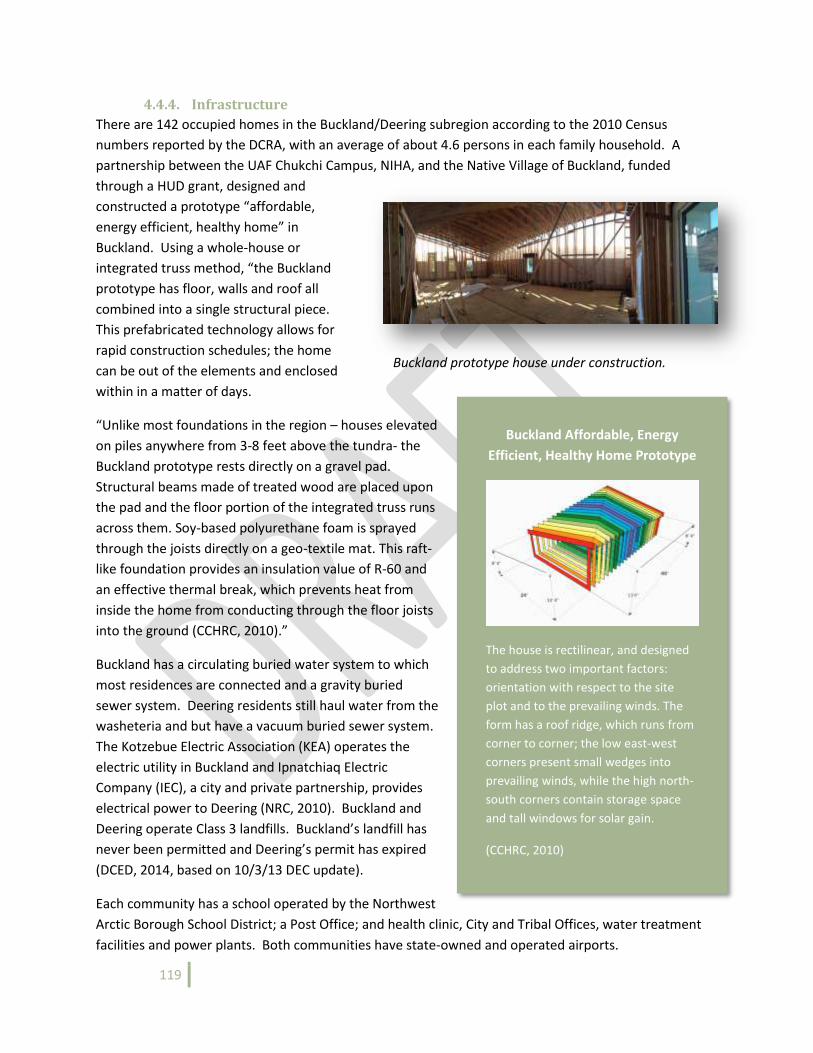
119
4.4.4. Infrastructure
There are 142 occupied homes in the Buckland/Deering subregion according to the 2010 Census
numbers reported by the DCRA, with an average of about 4.6 persons in each family household. A
partnership between the UAF Chukchi Campus, NIHA, and the Native Village of Buckland, funded
through a HUD grant, designed and
constructed a prototype “affordable,
energy efficient, healthy home” in
Buckland. Using a whole-house or
integrated truss method, “the Buckland
prototype has floor, walls and roof all
combined into a single structural piece.
This prefabricated technology allows for
rapid construction schedules; the home
can be out of the elements and enclosed
within in a matter of days.
“Unlike most foundations in the region – houses elevated
on piles anywhere from 3-8 feet above the tundra- the
Buckland prototype rests directly on a gravel pad.
Structural beams made of treated wood are placed upon
the pad and the floor portion of the integrated truss runs
across them. Soy-based polyurethane foam is sprayed
through the joists directly on a geo-textile mat. This raft-
like foundation provides an insulation value of R-60 and
an effective thermal break, which prevents heat from
inside the home from conducting through the floor joists
into the ground (CCHRC, 2010).”
Buckland has a circulating buried water system to which
most residences are connected and a gravity buried
sewer system. Deering residents still haul water from the
washeteria and but have a vacuum buried sewer system.
The Kotzebue Electric Association (KEA) operates the
electric utility in Buckland and Ipnatchiaq Electric
Company (IEC), a city and private partnership, provides
electrical power to Deering (NRC, 2010). Buckland and
Deering operate Class 3 landfills. Buckland’s landfill has
never been permitted and Deering’s permit has expired
(DCED, 2014, based on 10/3/13 DEC update).
Each community has a school operated by the Northwest
Arctic Borough School District; a Post Office; and health clinic, City and Tribal Offices, water treatment
facilities and power plants. Both communities have state-owned and operated airports.
Buckland Affordable, Energy
Efficient, Healthy Home Prototype
The house is rectilinear, and designed
to address two important factors:
orientation with respect to the site
plot and to the prevailing winds. The
form has a roof ridge, which runs from
corner to corner; the low east-west
corners present small wedges into
prevailing winds, while the high north-
south corners contain storage space
and tall windows for solar gain.
(CCHRC, 2010)
Buckland prototype house under construction.
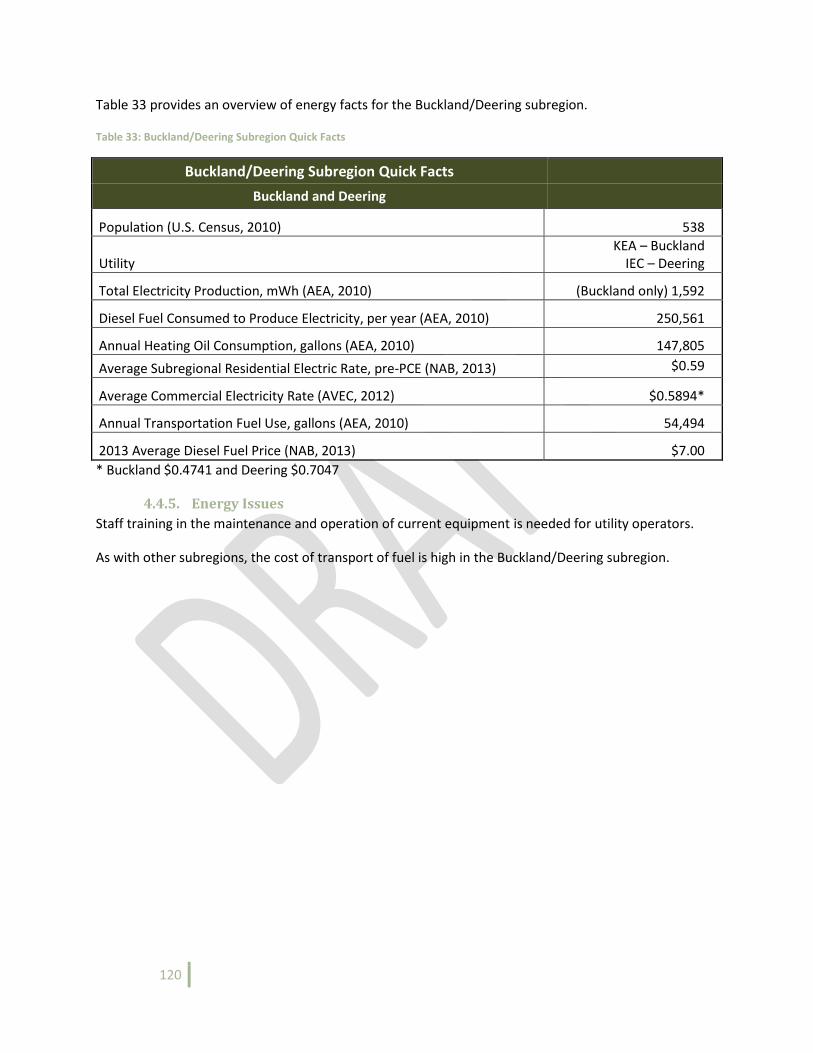
120
Table 33 provides an overview of energy facts for the Buckland/Deering subregion.
Table 33: Buckland/Deering Subregion Quick Facts
Buckland/Deering Subregion Quick Facts
Buckland and Deering
Population (U.S. Census, 2010) 538
Utility KEA – Buckland
IEC – Deering
Total Electricity Production, mWh (AEA, 2010) (Buckland only) 1,592
Diesel Fuel Consumed to Produce Electricity, per year (AEA, 2010) 250,561
Annual Heating Oil Consumption, gallons (AEA, 2010) 147,805
Average Subregional Residential Electric Rate, pre-PCE (NAB, 2013) $0.59
Average Commercial Electricity Rate (AVEC, 2012) $0.5894*
Annual Transportation Fuel Use, gallons (AEA, 2010) 54,494
2013 Average Diesel Fuel Price (NAB, 2013) $7.00
* Buckland $0.4741 and Deering $0.7047
4.4.5. Energy Issues
Staff training in the maintenance and operation of current equipment is needed for utility operators.
As with other subregions, the cost of transport of fuel is high in the Buckland/Deering subregion.
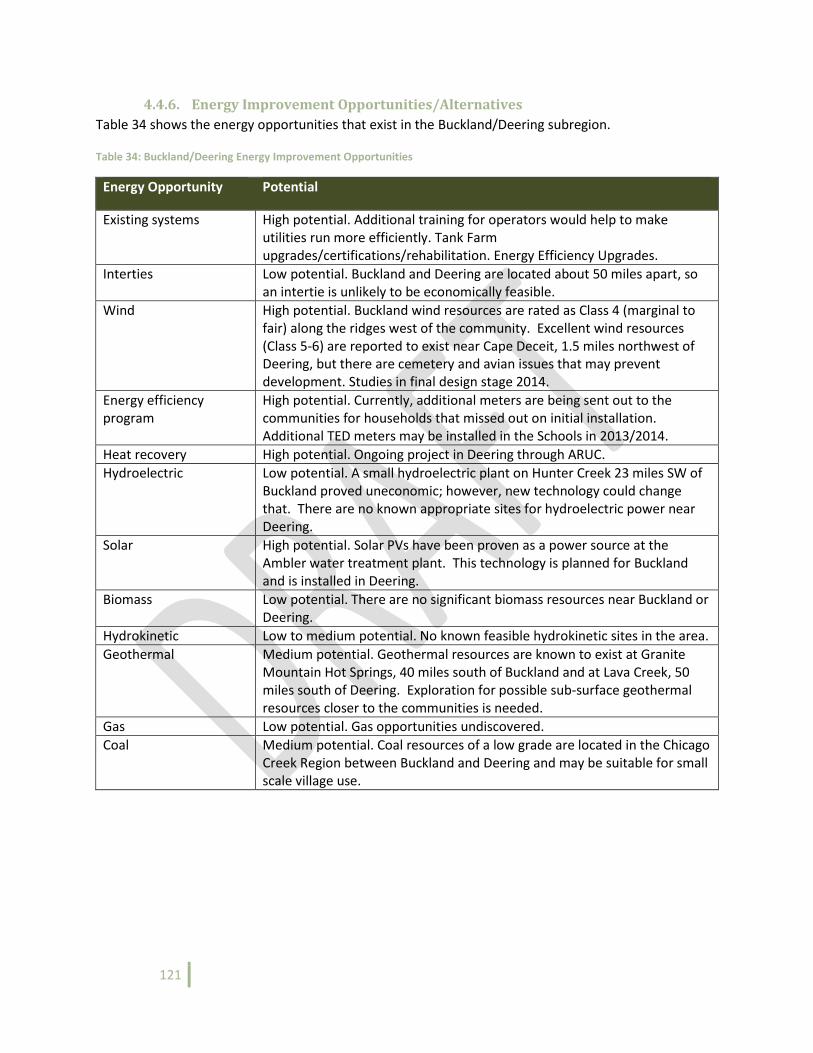
121
4.4.6. Energy Improvement Opportunities/Alternatives
Table 34 shows the energy opportunities that exist in the Buckland/Deering subregion.
Table 34: Buckland/Deering Energy Improvement Opportunities
Energy Opportunity Potential
Existing systems High potential. Additional training for operators would help to make utilities run more efficiently. Tank Farm upgrades/certifications/rehabilitation. Energy Efficiency Upgrades.
Interties Low potential. Buckland and Deering are located about 50 miles apart, so an intertie is unlikely to be economically feasible.
Wind High potential. Buckland wind resources are rated as Class 4 (marginal to fair) along the ridges west of the community. Excellent wind resources (Class 5-6) are reported to exist near Cape Deceit, 1.5 miles northwest of Deering, but there are cemetery and avian issues that may prevent development. Studies in final design stage 2014.
Energy efficiency program
High potential. Currently, additional meters are being sent out to the communities for households that missed out on initial installation. Additional TED meters may be installed in the Schools in 2013/2014.
Heat recovery High potential. Ongoing project in Deering through ARUC.
Hydroelectric Low potential. A small hydroelectric plant on Hunter Creek 23 miles SW of Buckland proved uneconomic; however, new technology could change that. There are no known appropriate sites for hydroelectric power near Deering.
Solar High potential. Solar PVs have been proven as a power source at the Ambler water treatment plant. This technology is planned for Buckland and is installed in Deering.
Biomass Low potential. There are no significant biomass resources near Buckland or Deering.
Hydrokinetic Low to medium potential. No known feasible hydrokinetic sites in the area.
Geothermal Medium potential. Geothermal resources are known to exist at Granite Mountain Hot Springs, 40 miles south of Buckland and at Lava Creek, 50 miles south of Deering. Exploration for possible sub-surface geothermal resources closer to the communities is needed.
Gas Low potential. Gas opportunities undiscovered.
Coal Medium potential. Coal resources of a low grade are located in the Chicago Creek Region between Buckland and Deering and may be suitable for small scale village use.
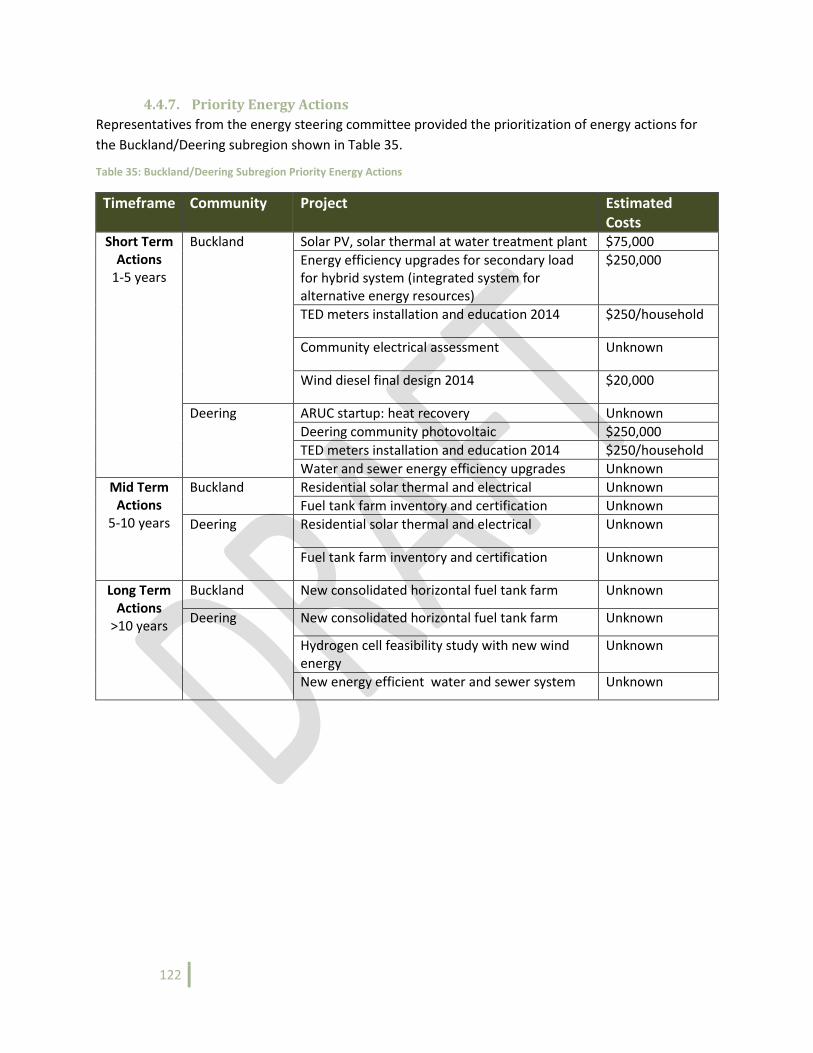
122
4.4.7. Priority Energy Actions
Representatives from the energy steering committee provided the prioritization of energy actions for
the Buckland/Deering subregion shown in Table 35.
Table 35: Buckland/Deering Subregion Priority Energy Actions
Timeframe Community Project Estimated Costs
Short Term Actions
1-5 years
Buckland Solar PV, solar thermal at water treatment plant $75,000
Energy efficiency upgrades for secondary load for hybrid system (integrated system for alternative energy resources)
$250,000
TED meters installation and education 2014 $250/household
Community electrical assessment Unknown
Wind diesel final design 2014 $20,000
Deering ARUC startup: heat recovery Unknown
Deering community photovoltaic $250,000
TED meters installation and education 2014 $250/household
Water and sewer energy efficiency upgrades Unknown
Mid Term Actions
5-10 years
Buckland Residential solar thermal and electrical Unknown
Fuel tank farm inventory and certification Unknown
Deering Residential solar thermal and electrical Unknown
Fuel tank farm inventory and certification Unknown
Long Term Actions
>10 years
Buckland New consolidated horizontal fuel tank farm Unknown
Deering New consolidated horizontal fuel tank farm Unknown
Hydrogen cell feasibility study with new wind energy
Unknown
New energy efficient water and sewer system Unknown

123
124
Buckland
Community and Energy Profile
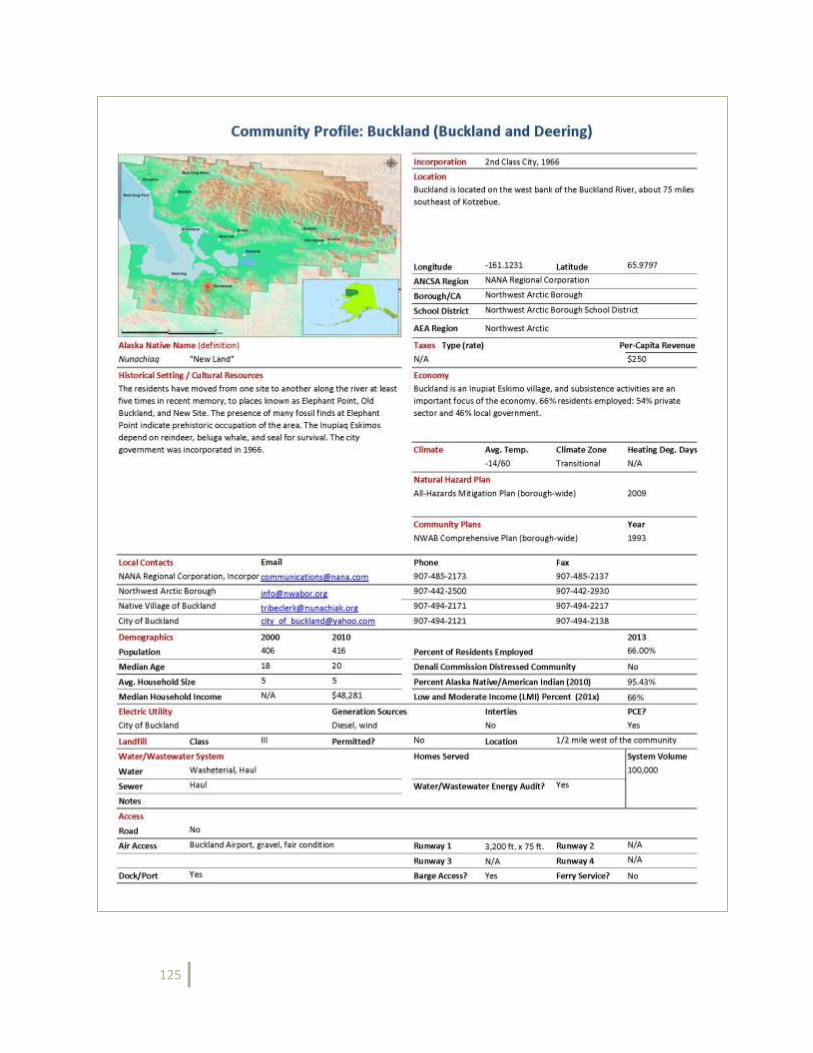
125
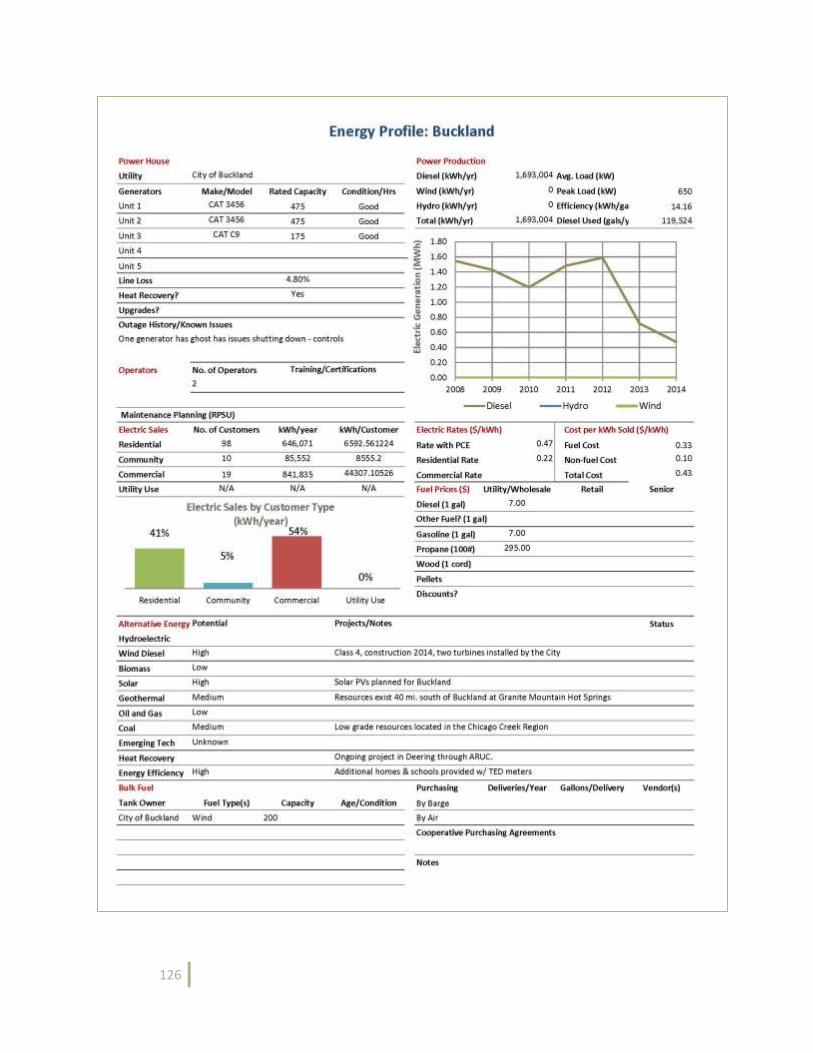
126
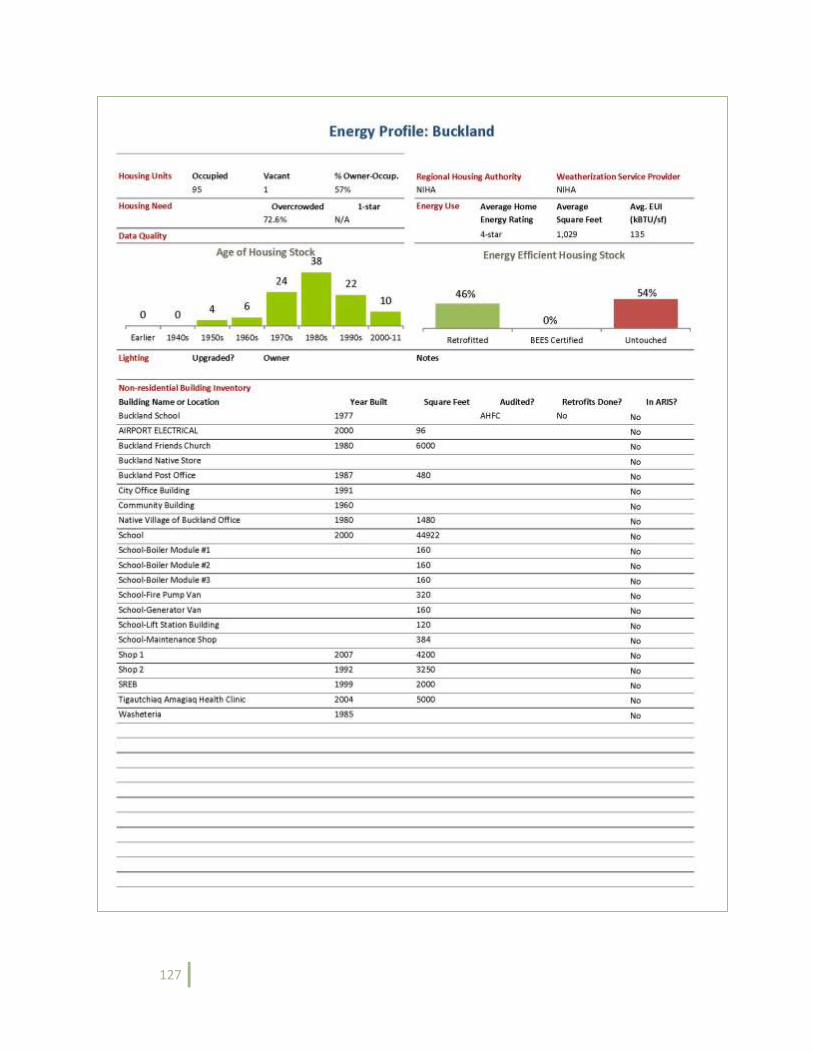
127
128
Deering Community and Energy Profile

129
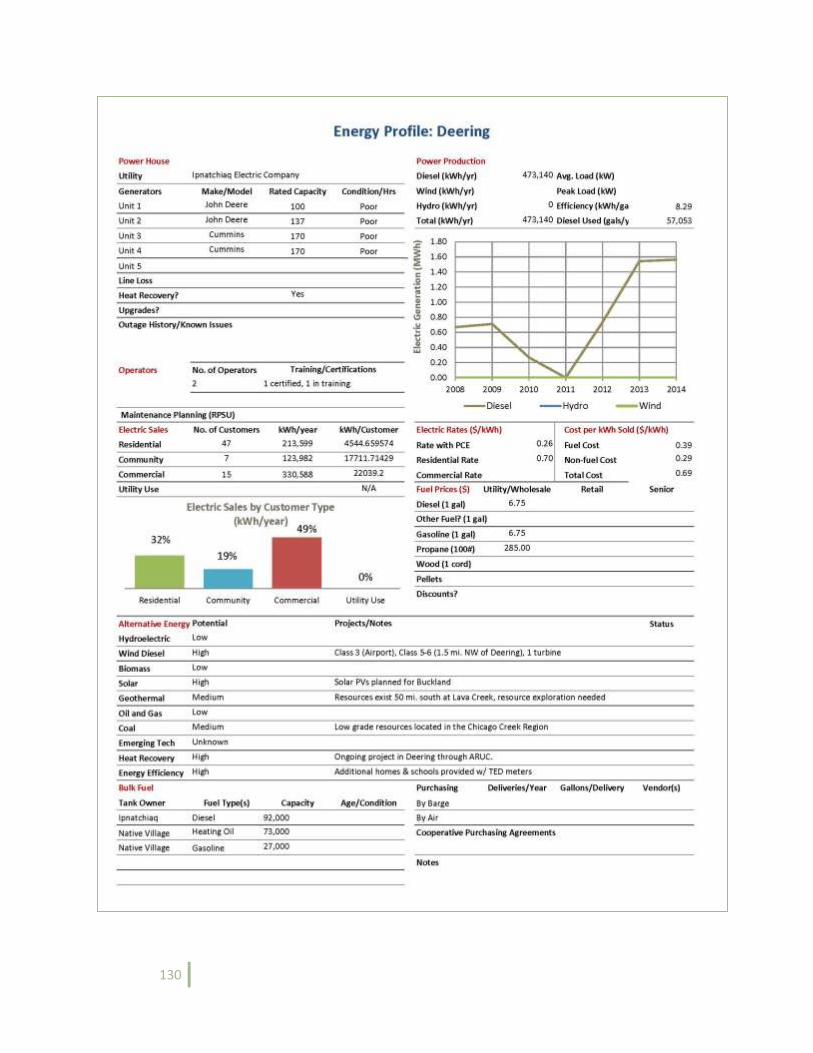
130
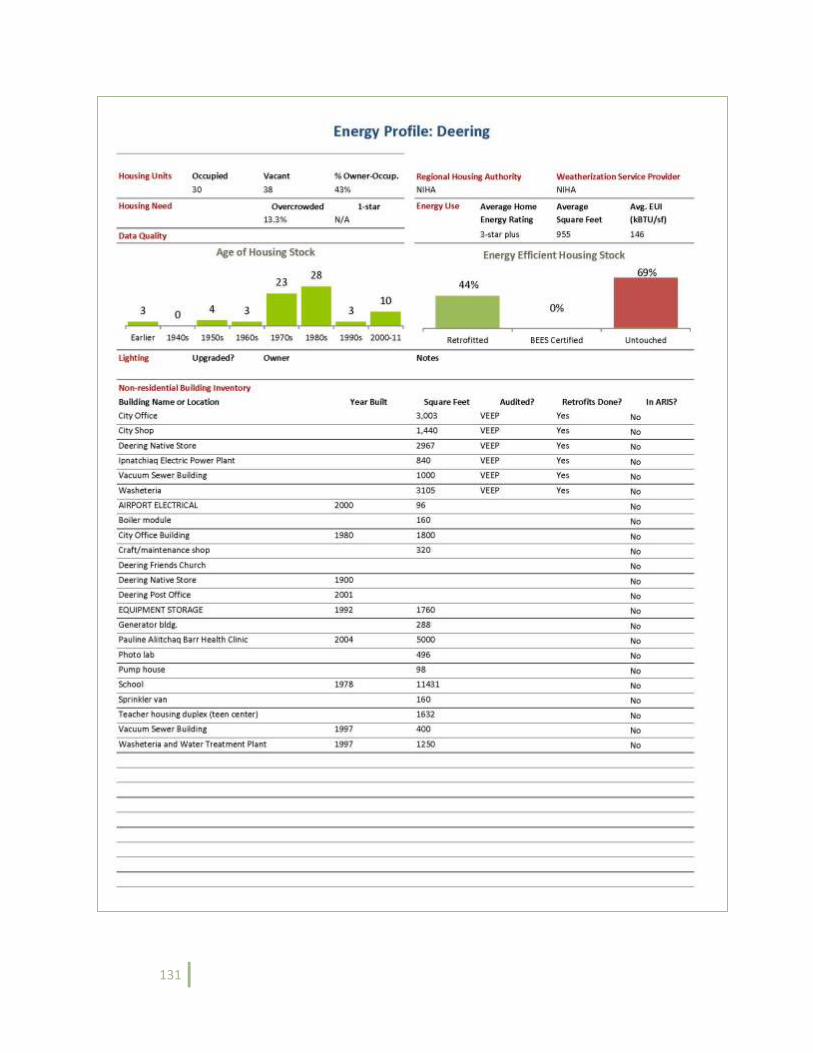
131
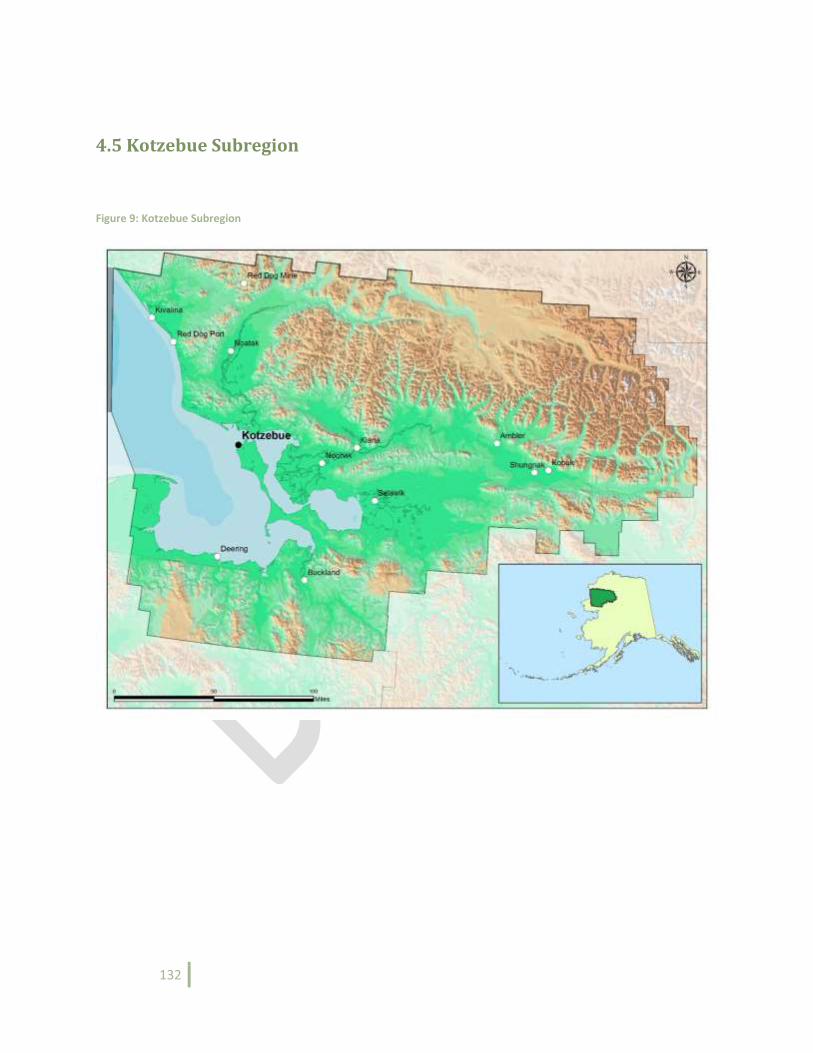
132
4.5 Kotzebue Subregion
Figure 9: Kotzebue Subregion
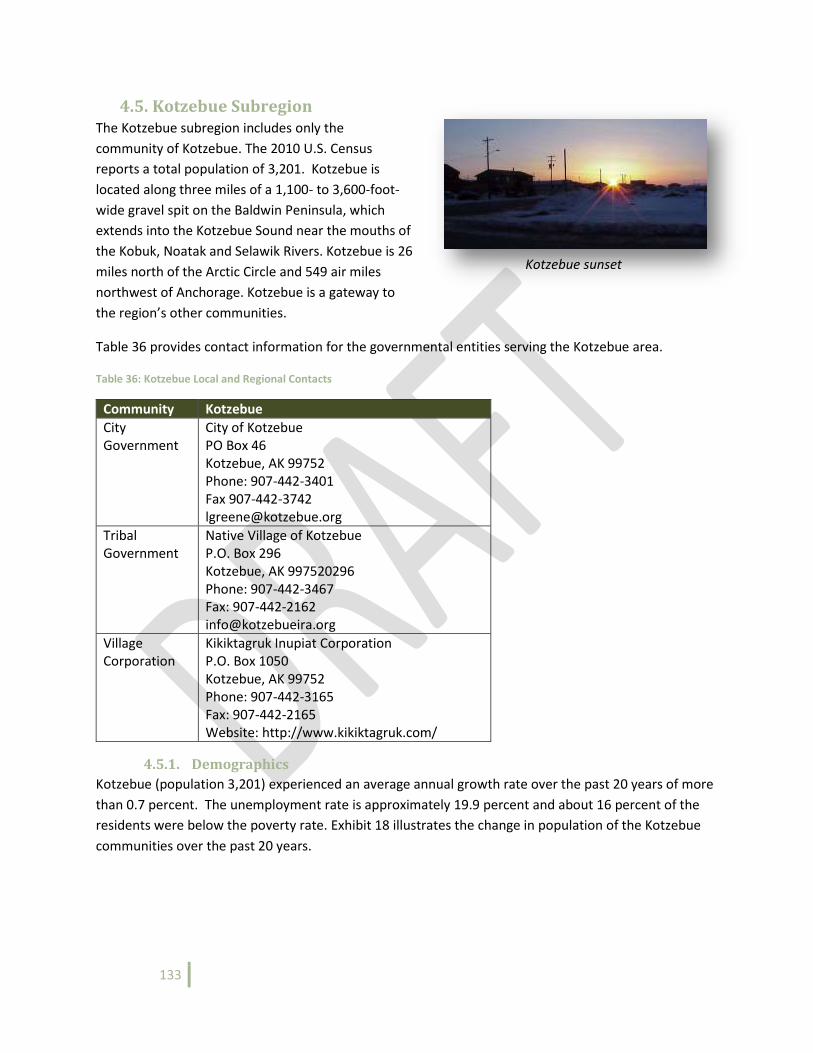
133
4.5. Kotzebue Subregion The Kotzebue subregion includes only the
community of Kotzebue. The 2010 U.S. Census
reports a total population of 3,201. Kotzebue is
located along three miles of a 1,100- to 3,600-foot-
wide gravel spit on the Baldwin Peninsula, which
extends into the Kotzebue Sound near the mouths of
the Kobuk, Noatak and Selawik Rivers. Kotzebue is 26
miles north of the Arctic Circle and 549 air miles
northwest of Anchorage. Kotzebue is a gateway to
the region’s other communities.
Table 36 provides contact information for the governmental entities serving the Kotzebue area.
Table 36: Kotzebue Local and Regional Contacts
Community Kotzebue
City Government
City of Kotzebue PO Box 46 Kotzebue, AK 99752 Phone: 907-442-3401 Fax 907-442-3742 [email protected]
Tribal Government
Native Village of Kotzebue P.O. Box 296 Kotzebue, AK 997520296 Phone: 907-442-3467 Fax: 907-442-2162 [email protected]
Village Corporation
Kikiktagruk Inupiat Corporation P.O. Box 1050 Kotzebue, AK 99752 Phone: 907-442-3165 Fax: 907-442-2165 Website: http://www.kikiktagruk.com/
4.5.1. Demographics
Kotzebue (population 3,201) experienced an average annual growth rate over the past 20 years of more
than 0.7 percent. The unemployment rate is approximately 19.9 percent and about 16 percent of the
residents were below the poverty rate. Exhibit 18 illustrates the change in population of the Kotzebue
communities over the past 20 years.
Kotzebue sunset
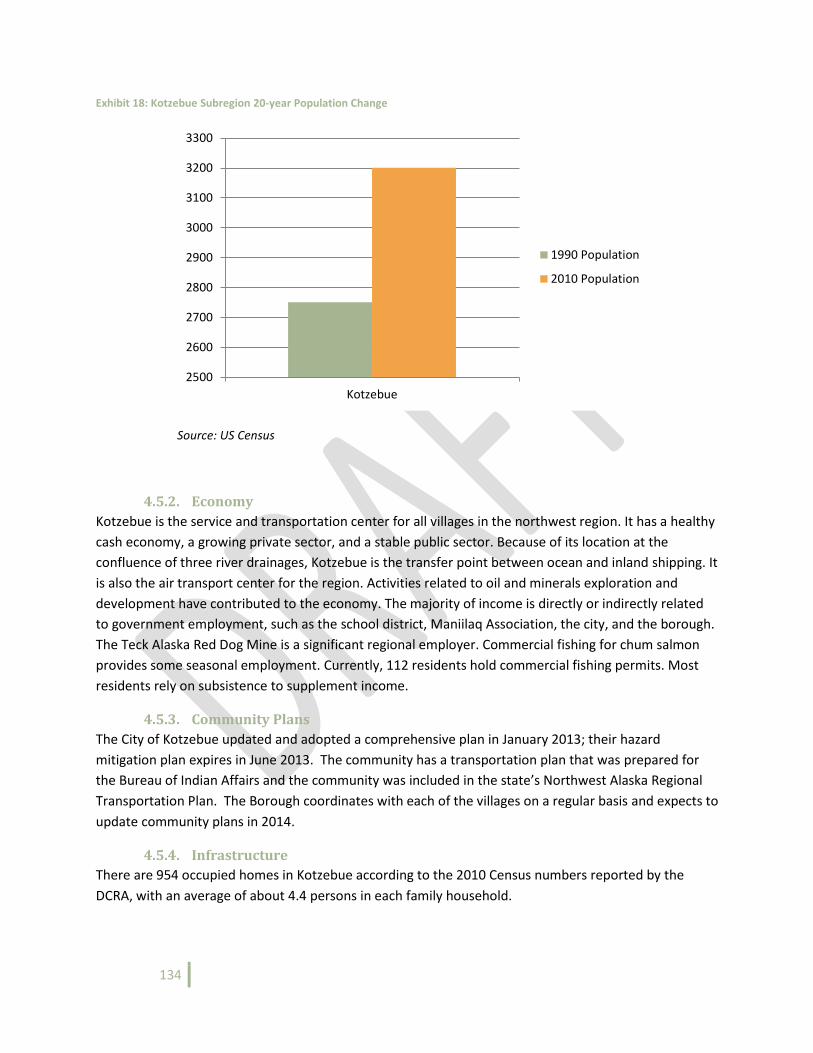
134
Exhibit 18: Kotzebue Subregion 20-year Population Change
Source: US Census
4.5.2. Economy
Kotzebue is the service and transportation center for all villages in the northwest region. It has a healthy
cash economy, a growing private sector, and a stable public sector. Because of its location at the
confluence of three river drainages, Kotzebue is the transfer point between ocean and inland shipping. It
is also the air transport center for the region. Activities related to oil and minerals exploration and
development have contributed to the economy. The majority of income is directly or indirectly related
to government employment, such as the school district, Maniilaq Association, the city, and the borough.
The Teck Alaska Red Dog Mine is a significant regional employer. Commercial fishing for chum salmon
provides some seasonal employment. Currently, 112 residents hold commercial fishing permits. Most
residents rely on subsistence to supplement income.
4.5.3. Community Plans
The City of Kotzebue updated and adopted a comprehensive plan in January 2013; their hazard
mitigation plan expires in June 2013. The community has a transportation plan that was prepared for
the Bureau of Indian Affairs and the community was included in the state’s Northwest Alaska Regional
Transportation Plan. The Borough coordinates with each of the villages on a regular basis and expects to
update community plans in 2014.
4.5.4. Infrastructure
There are 954 occupied homes in Kotzebue according to the 2010 Census numbers reported by the
DCRA, with an average of about 4.4 persons in each family household.
2500
2600
2700
2800
2900
3000
3100
3200
3300
Kotzebue
1990 Population
2010 Population
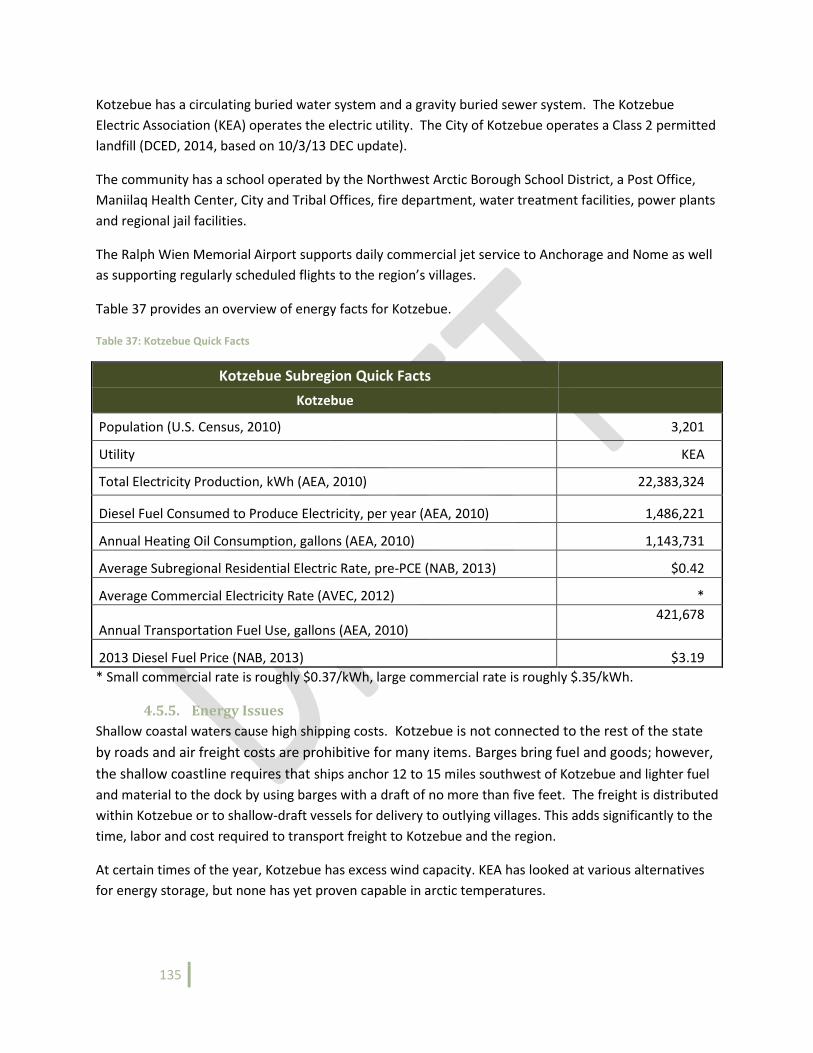
135
Kotzebue has a circulating buried water system and a gravity buried sewer system. The Kotzebue
Electric Association (KEA) operates the electric utility. The City of Kotzebue operates a Class 2 permitted
landfill (DCED, 2014, based on 10/3/13 DEC update).
The community has a school operated by the Northwest Arctic Borough School District, a Post Office,
Maniilaq Health Center, City and Tribal Offices, fire department, water treatment facilities, power plants
and regional jail facilities.
The Ralph Wien Memorial Airport supports daily commercial jet service to Anchorage and Nome as well
as supporting regularly scheduled flights to the region’s villages.
Table 37 provides an overview of energy facts for Kotzebue.
Table 37: Kotzebue Quick Facts
Kotzebue Subregion Quick Facts Kotzebue
Population (U.S. Census, 2010) 3,201
Utility KEA
Total Electricity Production, kWh (AEA, 2010) 22,383,324
Diesel Fuel Consumed to Produce Electricity, per year (AEA, 2010) 1,486,221
Annual Heating Oil Consumption, gallons (AEA, 2010) 1,143,731
Average Subregional Residential Electric Rate, pre-PCE (NAB, 2013) $0.42
Average Commercial Electricity Rate (AVEC, 2012) *
Annual Transportation Fuel Use, gallons (AEA, 2010) 421,678
2013 Diesel Fuel Price (NAB, 2013) $3.19
* Small commercial rate is roughly $0.37/kWh, large commercial rate is roughly $.35/kWh.
4.5.5. Energy Issues
Shallow coastal waters cause high shipping costs. Kotzebue is not connected to the rest of the state
by roads and air freight costs are prohibitive for many items. Barges bring fuel and goods; however,
the shallow coastline requires that ships anchor 12 to 15 miles southwest of Kotzebue and lighter fuel
and material to the dock by using barges with a draft of no more than five feet. The freight is distributed
within Kotzebue or to shallow-draft vessels for delivery to outlying villages. This adds significantly to the
time, labor and cost required to transport freight to Kotzebue and the region.
At certain times of the year, Kotzebue has excess wind capacity. KEA has looked at various alternatives
for energy storage, but none has yet proven capable in arctic temperatures.
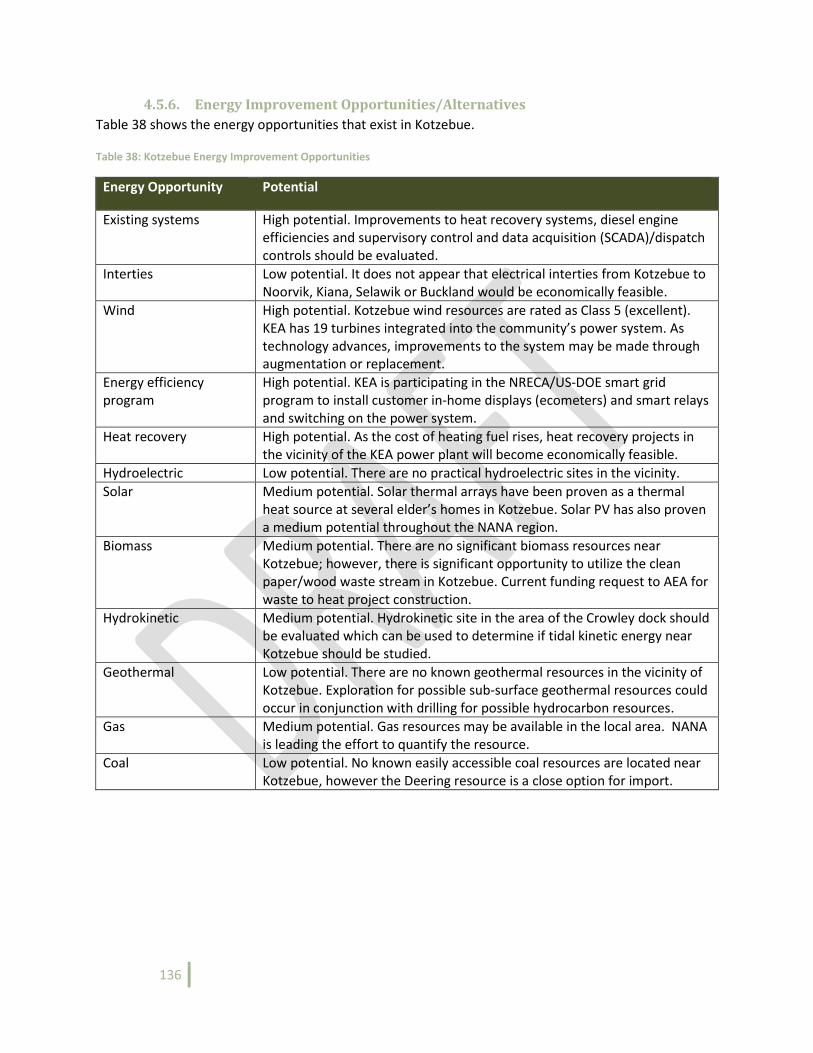
136
4.5.6. Energy Improvement Opportunities/Alternatives
Table 38 shows the energy opportunities that exist in Kotzebue.
Table 38: Kotzebue Energy Improvement Opportunities
Energy Opportunity Potential
Existing systems High potential. Improvements to heat recovery systems, diesel engine efficiencies and supervisory control and data acquisition (SCADA)/dispatch controls should be evaluated.
Interties Low potential. It does not appear that electrical interties from Kotzebue to Noorvik, Kiana, Selawik or Buckland would be economically feasible.
Wind High potential. Kotzebue wind resources are rated as Class 5 (excellent). KEA has 19 turbines integrated into the community’s power system. As technology advances, improvements to the system may be made through augmentation or replacement.
Energy efficiency program
High potential. KEA is participating in the NRECA/US-DOE smart grid program to install customer in-home displays (ecometers) and smart relays and switching on the power system.
Heat recovery High potential. As the cost of heating fuel rises, heat recovery projects in the vicinity of the KEA power plant will become economically feasible.
Hydroelectric Low potential. There are no practical hydroelectric sites in the vicinity.
Solar Medium potential. Solar thermal arrays have been proven as a thermal heat source at several elder’s homes in Kotzebue. Solar PV has also proven a medium potential throughout the NANA region.
Biomass Medium potential. There are no significant biomass resources near Kotzebue; however, there is significant opportunity to utilize the clean paper/wood waste stream in Kotzebue. Current funding request to AEA for waste to heat project construction.
Hydrokinetic Medium potential. Hydrokinetic site in the area of the Crowley dock should be evaluated which can be used to determine if tidal kinetic energy near Kotzebue should be studied.
Geothermal Low potential. There are no known geothermal resources in the vicinity of Kotzebue. Exploration for possible sub-surface geothermal resources could occur in conjunction with drilling for possible hydrocarbon resources.
Gas Medium potential. Gas resources may be available in the local area. NANA is leading the effort to quantify the resource.
Coal Low potential. No known easily accessible coal resources are located near Kotzebue, however the Deering resource is a close option for import.
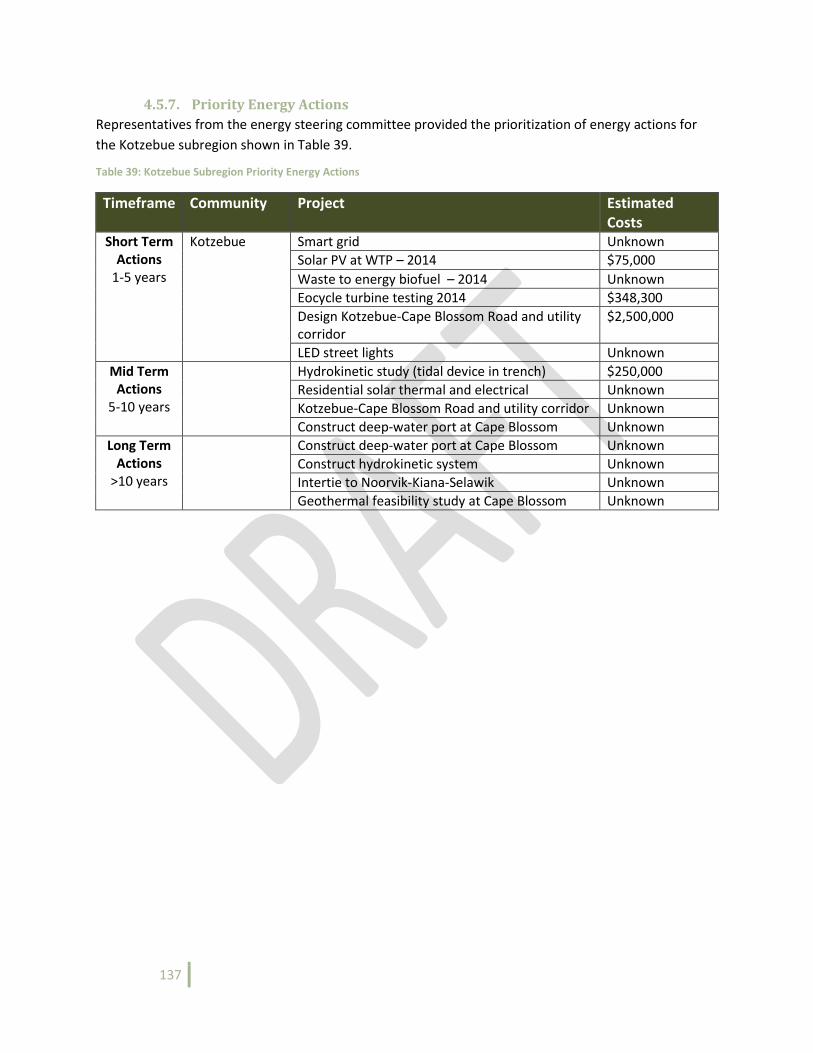
137
4.5.7. Priority Energy Actions
Representatives from the energy steering committee provided the prioritization of energy actions for
the Kotzebue subregion shown in Table 39.
Table 39: Kotzebue Subregion Priority Energy Actions
Timeframe Community Project Estimated Costs
Short Term Actions
1-5 years
Kotzebue Smart grid Unknown
Solar PV at WTP – 2014 $75,000
Waste to energy biofuel – 2014 Unknown
Eocycle turbine testing 2014 $348,300
Design Kotzebue-Cape Blossom Road and utility corridor
$2,500,000
LED street lights Unknown
Mid Term Actions
5-10 years
Hydrokinetic study (tidal device in trench) $250,000
Residential solar thermal and electrical Unknown
Kotzebue-Cape Blossom Road and utility corridor Unknown
Construct deep-water port at Cape Blossom Unknown
Long Term Actions
>10 years
Construct deep-water port at Cape Blossom Unknown
Construct hydrokinetic system Unknown
Intertie to Noorvik-Kiana-Selawik Unknown
Geothermal feasibility study at Cape Blossom Unknown
138
Kotzebue Community and Energy Profile
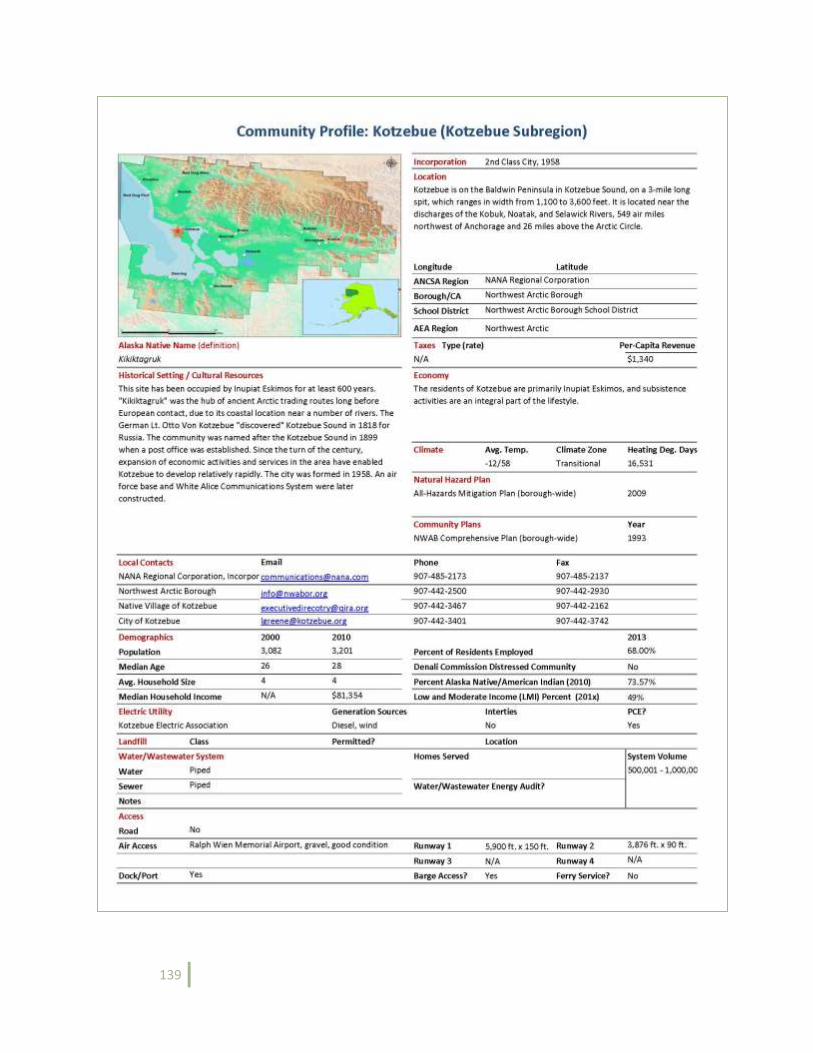
139
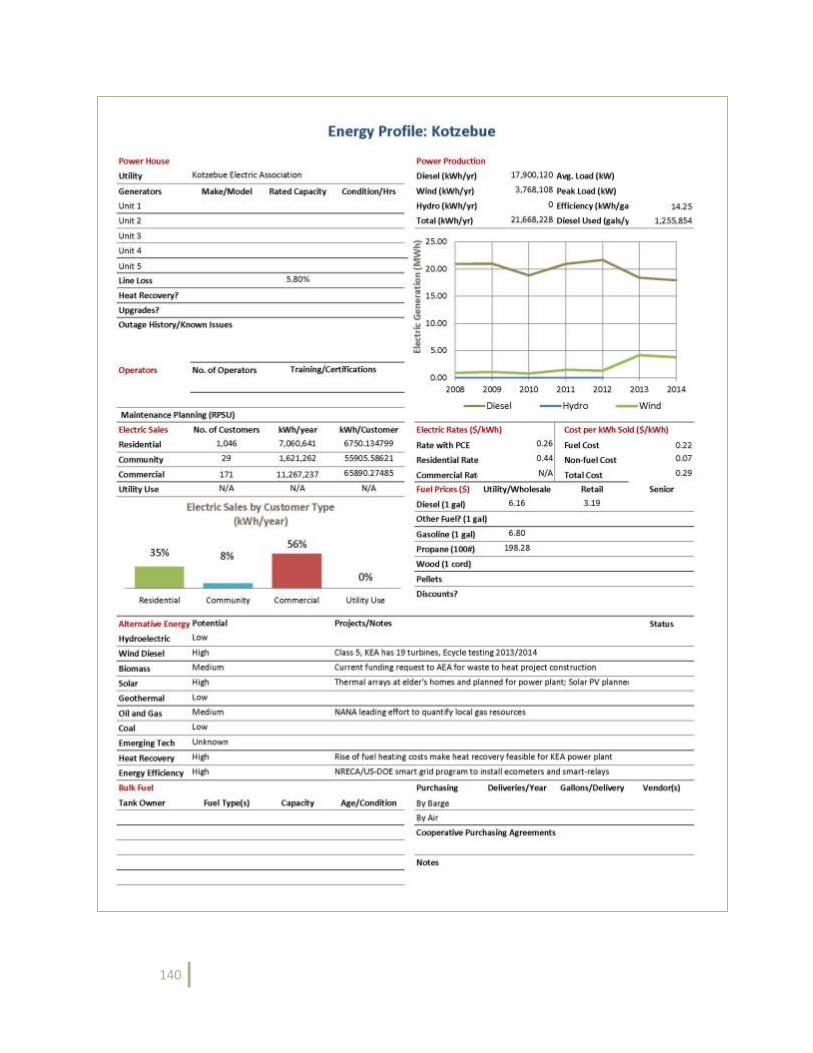
140
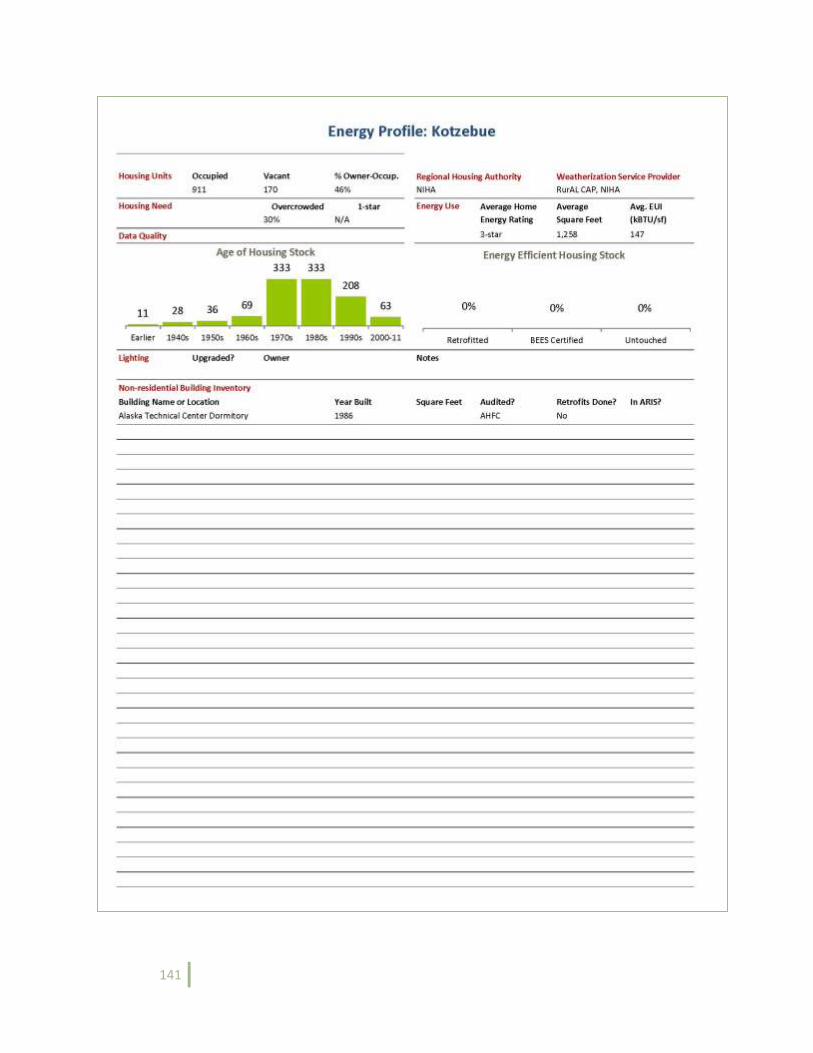
141
142
5. Implementation Plan
IMPLEMENTATION PLAN

143
This chapter provides funding information and a strategy for completing the energy priorities.
Implementation Plan
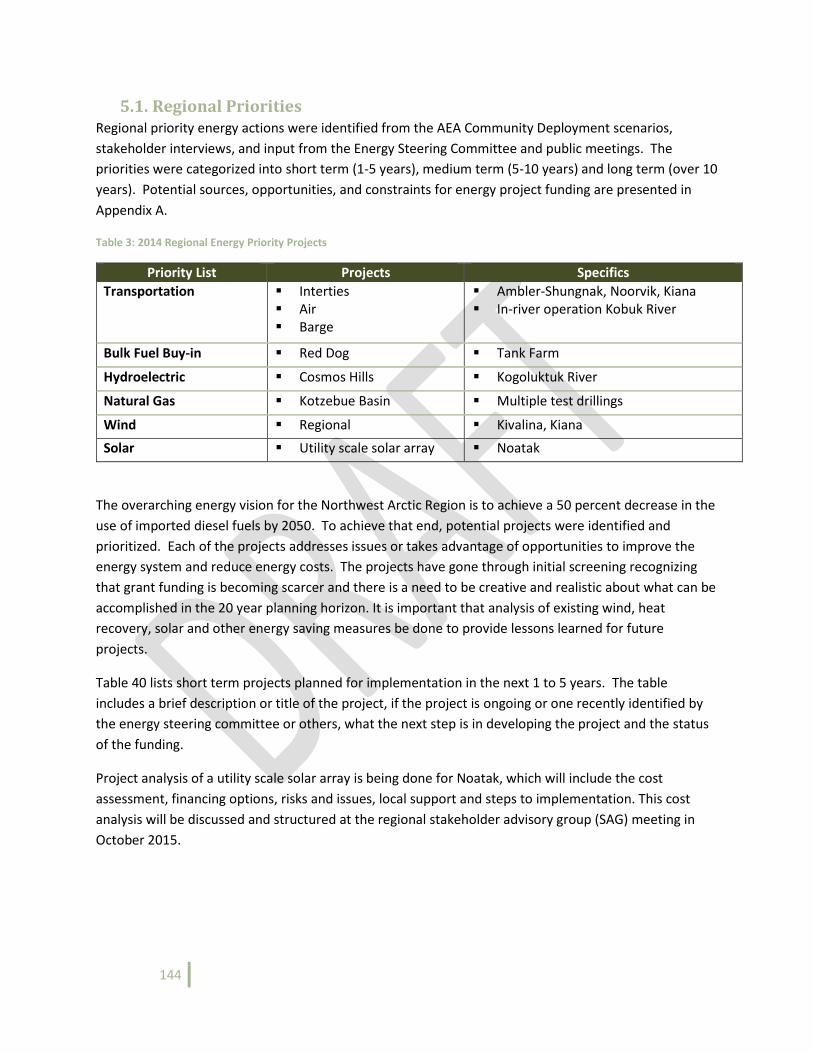
144
5.1. Regional Priorities Regional priority energy actions were identified from the AEA Community Deployment scenarios,
stakeholder interviews, and input from the Energy Steering Committee and public meetings. The
priorities were categorized into short term (1-5 years), medium term (5-10 years) and long term (over 10
years). Potential sources, opportunities, and constraints for energy project funding are presented in
Appendix A.
Table 3: 2014 Regional Energy Priority Projects
Priority List Projects Specifics
Transportation Interties Air Barge
Ambler-Shungnak, Noorvik, Kiana In-river operation Kobuk River
Bulk Fuel Buy-in Red Dog Tank Farm
Hydroelectric Cosmos Hills Kogoluktuk River
Natural Gas Kotzebue Basin Multiple test drillings
Wind Regional Kivalina, Kiana
Solar Utility scale solar array Noatak
The overarching energy vision for the Northwest Arctic Region is to achieve a 50 percent decrease in the
use of imported diesel fuels by 2050. To achieve that end, potential projects were identified and
prioritized. Each of the projects addresses issues or takes advantage of opportunities to improve the
energy system and reduce energy costs. The projects have gone through initial screening recognizing
that grant funding is becoming scarcer and there is a need to be creative and realistic about what can be
accomplished in the 20 year planning horizon. It is important that analysis of existing wind, heat
recovery, solar and other energy saving measures be done to provide lessons learned for future
projects.
Table 40 lists short term projects planned for implementation in the next 1 to 5 years. The table
includes a brief description or title of the project, if the project is ongoing or one recently identified by
the energy steering committee or others, what the next step is in developing the project and the status
of the funding.
Project analysis of a utility scale solar array is being done for Noatak, which will include the cost
assessment, financing options, risks and issues, local support and steps to implementation. This cost
analysis will be discussed and structured at the regional stakeholder advisory group (SAG) meeting in
October 2015.
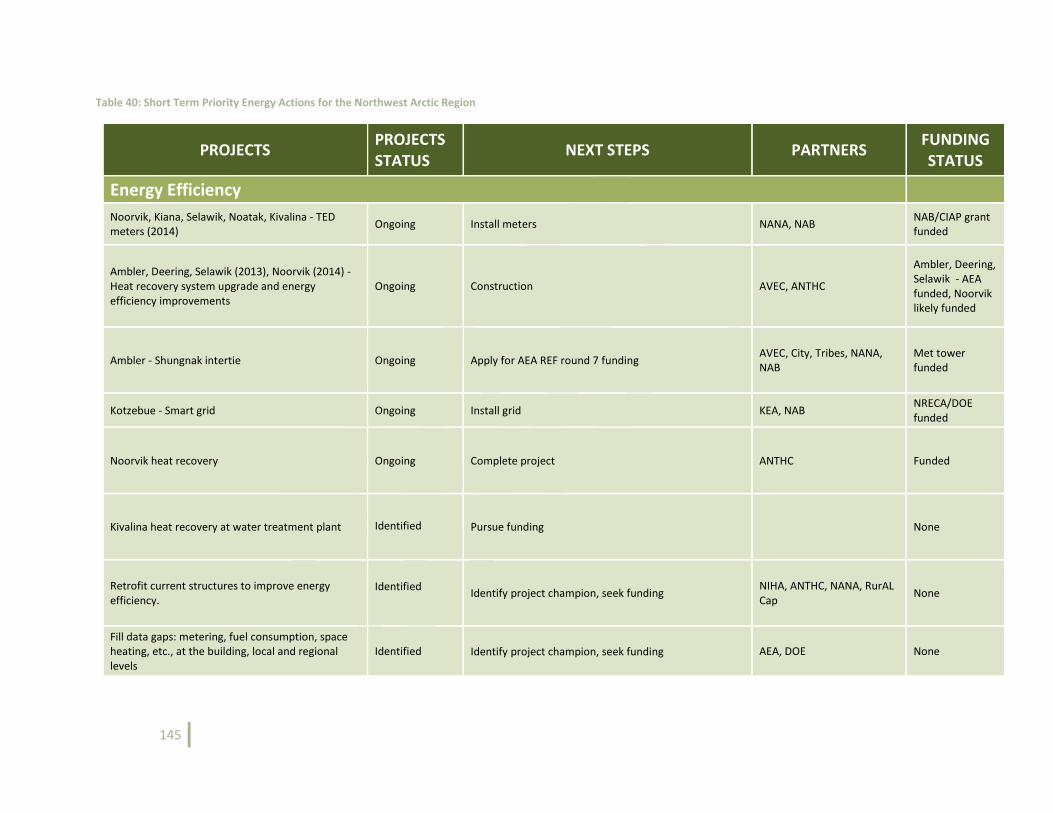
145
Table 40: Short Term Priority Energy Actions for the Northwest Arctic Region
PROJECTS PROJECTS STATUS
NEXT STEPS PARTNERS FUNDING STATUS
Energy Efficiency
Noorvik, Kiana, Selawik, Noatak, Kivalina - TED meters (2014)
Ongoing Install meters NANA, NAB NAB/CIAP grant funded
Ambler, Deering, Selawik (2013), Noorvik (2014) - Heat recovery system upgrade and energy efficiency improvements
Ongoing Construction AVEC, ANTHC
Ambler, Deering, Selawik - AEA funded, Noorvik likely funded
Ambler - Shungnak intertie Ongoing Apply for AEA REF round 7 funding AVEC, City, Tribes, NANA, NAB
Met tower funded
Kotzebue - Smart grid Ongoing Install grid KEA, NAB NRECA/DOE funded
Noorvik heat recovery Ongoing Complete project ANTHC Funded
Kivalina heat recovery at water treatment plant Identified Pursue funding None
Retrofit current structures to improve energy efficiency.
Identified Identify project champion, seek funding
NIHA, ANTHC, NANA, RurAL Cap
None
Fill data gaps: metering, fuel consumption, space heating, etc., at the building, local and regional levels
Identified Identify project champion, seek funding AEA, DOE None
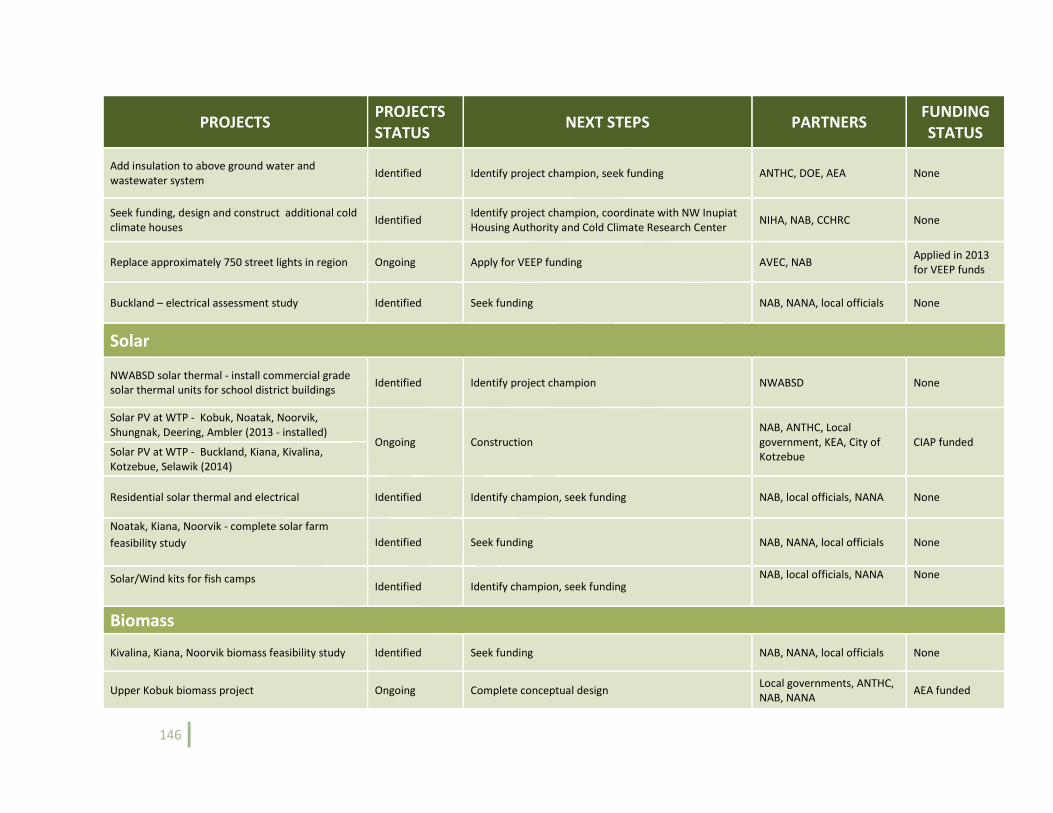
146
PROJECTS PROJECTS STATUS
NEXT STEPS PARTNERS FUNDING STATUS
Add insulation to above ground water and wastewater system
Identified Identify project champion, seek funding ANTHC, DOE, AEA None
Seek funding, design and construct additional cold climate houses
Identified Identify project champion, coordinate with NW Inupiat Housing Authority and Cold Climate Research Center
NIHA, NAB, CCHRC None
Replace approximately 750 street lights in region Ongoing Apply for VEEP funding AVEC, NAB Applied in 2013 for VEEP funds
Buckland – electrical assessment study Identified Seek funding NAB, NANA, local officials None
Solar
NWABSD solar thermal - install commercial grade solar thermal units for school district buildings
Identified Identify project champion NWABSD None
Solar PV at WTP - Kobuk, Noatak, Noorvik, Shungnak, Deering, Ambler (2013 - installed)
Ongoing Construction NAB, ANTHC, Local government, KEA, City of Kotzebue
CIAP funded Solar PV at WTP - Buckland, Kiana, Kivalina, Kotzebue, Selawik (2014)
Residential solar thermal and electrical Identified Identify champion, seek funding NAB, local officials, NANA None
Noatak, Kiana, Noorvik - complete solar farm
feasibility study Identified Seek funding NAB, NANA, local officials None
Solar/Wind kits for fish camps Identified Identify champion, seek funding
NAB, local officials, NANA None
Biomass
Kivalina, Kiana, Noorvik biomass feasibility study Identified Seek funding NAB, NANA, local officials None
Upper Kobuk biomass project Ongoing Complete conceptual design Local governments, ANTHC, NAB, NANA
AEA funded
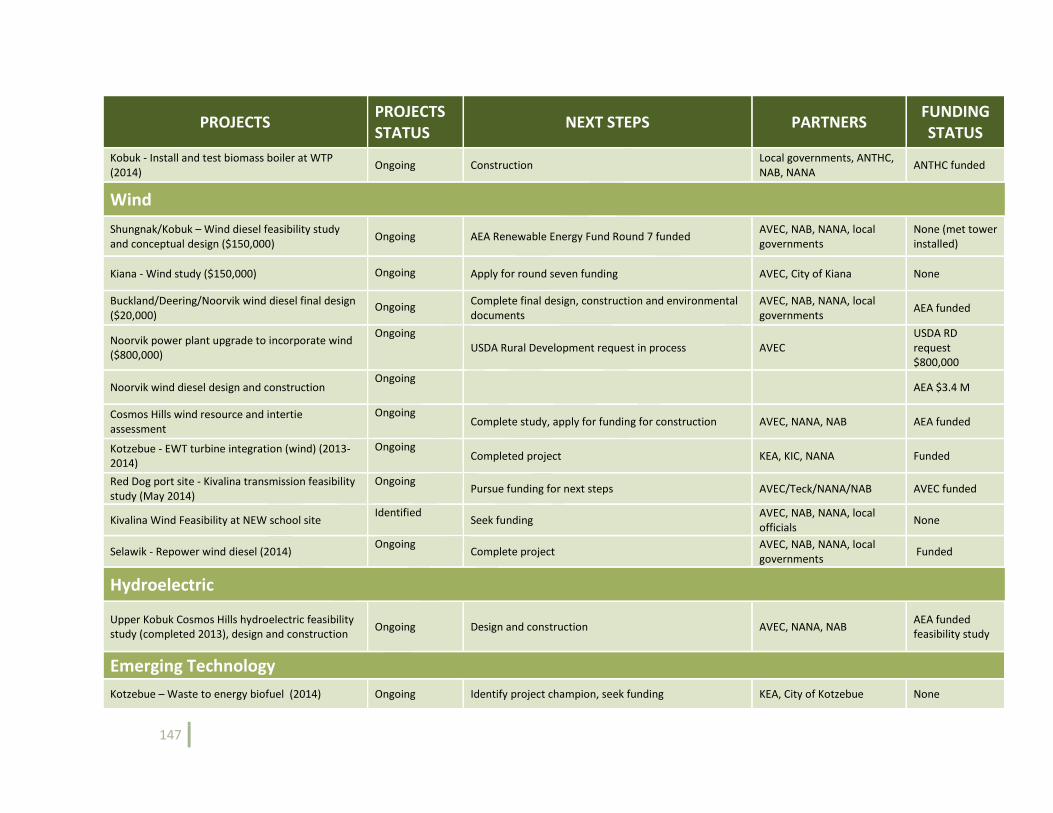
147
PROJECTS PROJECTS STATUS
NEXT STEPS PARTNERS FUNDING STATUS
Kobuk - Install and test biomass boiler at WTP (2014)
Ongoing Construction Local governments, ANTHC, NAB, NANA
ANTHC funded
Wind
Shungnak/Kobuk – Wind diesel feasibility study and conceptual design ($150,000)
Ongoing AEA Renewable Energy Fund Round 7 funded AVEC, NAB, NANA, local governments
None (met tower installed)
Kiana - Wind study ($150,000) Ongoing Apply for round seven funding AVEC, City of Kiana None
Buckland/Deering/Noorvik wind diesel final design ($20,000)
Ongoing Complete final design, construction and environmental documents
AVEC, NAB, NANA, local governments
AEA funded
Noorvik power plant upgrade to incorporate wind ($800,000)
Ongoing USDA Rural Development request in process AVEC
USDA RD request $800,000
Noorvik wind diesel design and construction Ongoing
AEA $3.4 M
Cosmos Hills wind resource and intertie assessment
Ongoing Complete study, apply for funding for construction AVEC, NANA, NAB AEA funded
Kotzebue - EWT turbine integration (wind) (2013-2014)
Ongoing Completed project KEA, KIC, NANA Funded
Red Dog port site - Kivalina transmission feasibility study (May 2014)
Ongoing Pursue funding for next steps AVEC/Teck/NANA/NAB AVEC funded
Kivalina Wind Feasibility at NEW school site Identified
Seek funding AVEC, NAB, NANA, local officials
None
Selawik - Repower wind diesel (2014) Ongoing
Complete project AVEC, NAB, NANA, local governments
Funded
Hydroelectric
Upper Kobuk Cosmos Hills hydroelectric feasibility study (completed 2013), design and construction
Ongoing Design and construction AVEC, NANA, NAB AEA funded feasibility study
Emerging Technology
Kotzebue – Waste to energy biofuel (2014) Ongoing Identify project champion, seek funding KEA, City of Kotzebue None
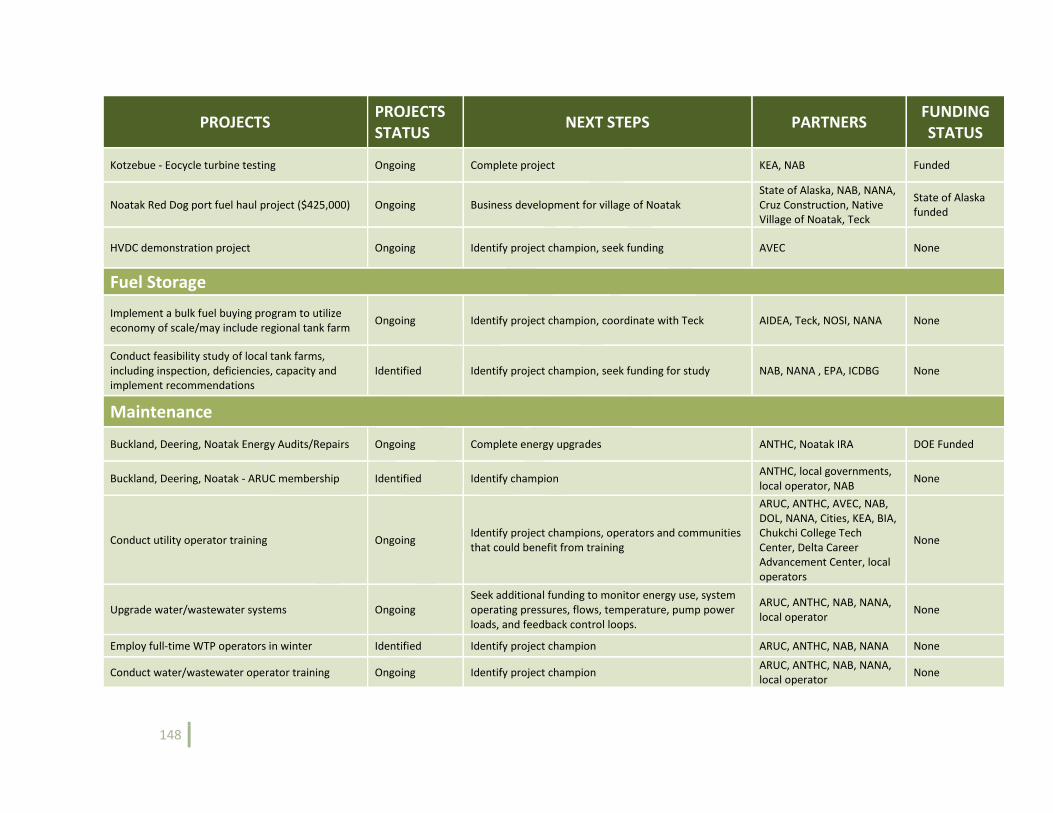
148
PROJECTS PROJECTS STATUS
NEXT STEPS PARTNERS FUNDING STATUS
Kotzebue - Eocycle turbine testing Ongoing Complete project KEA, NAB Funded
Noatak Red Dog port fuel haul project ($425,000) Ongoing Business development for village of Noatak State of Alaska, NAB, NANA, Cruz Construction, Native Village of Noatak, Teck
State of Alaska funded
HVDC demonstration project Ongoing Identify project champion, seek funding AVEC None
Fuel Storage
Implement a bulk fuel buying program to utilize economy of scale/may include regional tank farm
Ongoing Identify project champion, coordinate with Teck AIDEA, Teck, NOSI, NANA None
Conduct feasibility study of local tank farms, including inspection, deficiencies, capacity and implement recommendations
Identified Identify project champion, seek funding for study NAB, NANA , EPA, ICDBG None
Maintenance
Buckland, Deering, Noatak Energy Audits/Repairs Ongoing Complete energy upgrades ANTHC, Noatak IRA DOE Funded
Buckland, Deering, Noatak - ARUC membership Identified Identify champion ANTHC, local governments, local operator, NAB
None
Conduct utility operator training Ongoing Identify project champions, operators and communities that could benefit from training
ARUC, ANTHC, AVEC, NAB, DOL, NANA, Cities, KEA, BIA, Chukchi College Tech Center, Delta Career Advancement Center, local operators
None
Upgrade water/wastewater systems Ongoing Seek additional funding to monitor energy use, system operating pressures, flows, temperature, pump power loads, and feedback control loops.
ARUC, ANTHC, NAB, NANA, local operator
None
Employ full-time WTP operators in winter Identified Identify project champion ARUC, ANTHC, NAB, NANA None
Conduct water/wastewater operator training Ongoing Identify project champion ARUC, ANTHC, NAB, NANA, local operator
None
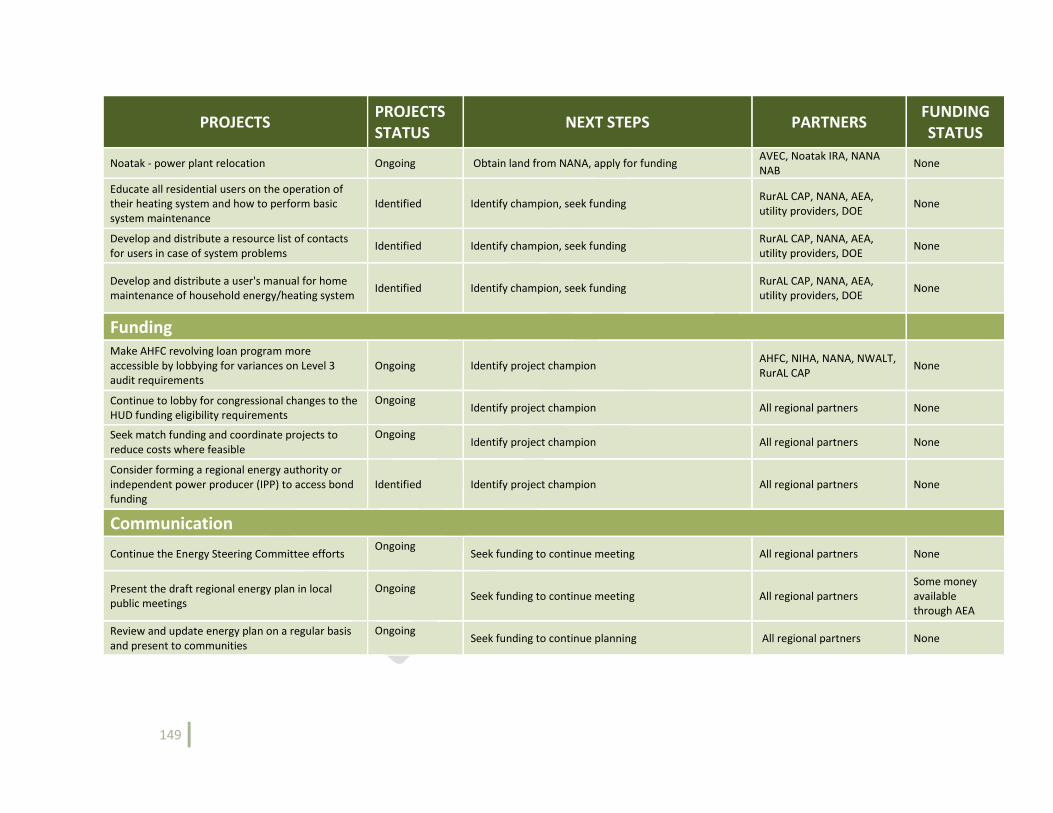
149
PROJECTS PROJECTS STATUS
NEXT STEPS PARTNERS FUNDING STATUS
Noatak - power plant relocation Ongoing Obtain land from NANA, apply for funding AVEC, Noatak IRA, NANA NAB
None
Educate all residential users on the operation of their heating system and how to perform basic system maintenance
Identified Identify champion, seek funding RurAL CAP, NANA, AEA, utility providers, DOE
None
Develop and distribute a resource list of contacts for users in case of system problems
Identified Identify champion, seek funding RurAL CAP, NANA, AEA, utility providers, DOE
None
Develop and distribute a user's manual for home maintenance of household energy/heating system
Identified Identify champion, seek funding RurAL CAP, NANA, AEA, utility providers, DOE
None
Funding Make AHFC revolving loan program more accessible by lobbying for variances on Level 3 audit requirements
Ongoing Identify project champion AHFC, NIHA, NANA, NWALT, RurAL CAP
None
Continue to lobby for congressional changes to the HUD funding eligibility requirements
Ongoing Identify project champion All regional partners None
Seek match funding and coordinate projects to reduce costs where feasible
Ongoing Identify project champion All regional partners None
Consider forming a regional energy authority or independent power producer (IPP) to access bond funding
Identified Identify project champion All regional partners None
Communication
Continue the Energy Steering Committee efforts Ongoing
Seek funding to continue meeting All regional partners None
Present the draft regional energy plan in local public meetings
Ongoing Seek funding to continue meeting All regional partners
Some money available through AEA
Review and update energy plan on a regular basis and present to communities
Ongoing Seek funding to continue planning All regional partners None
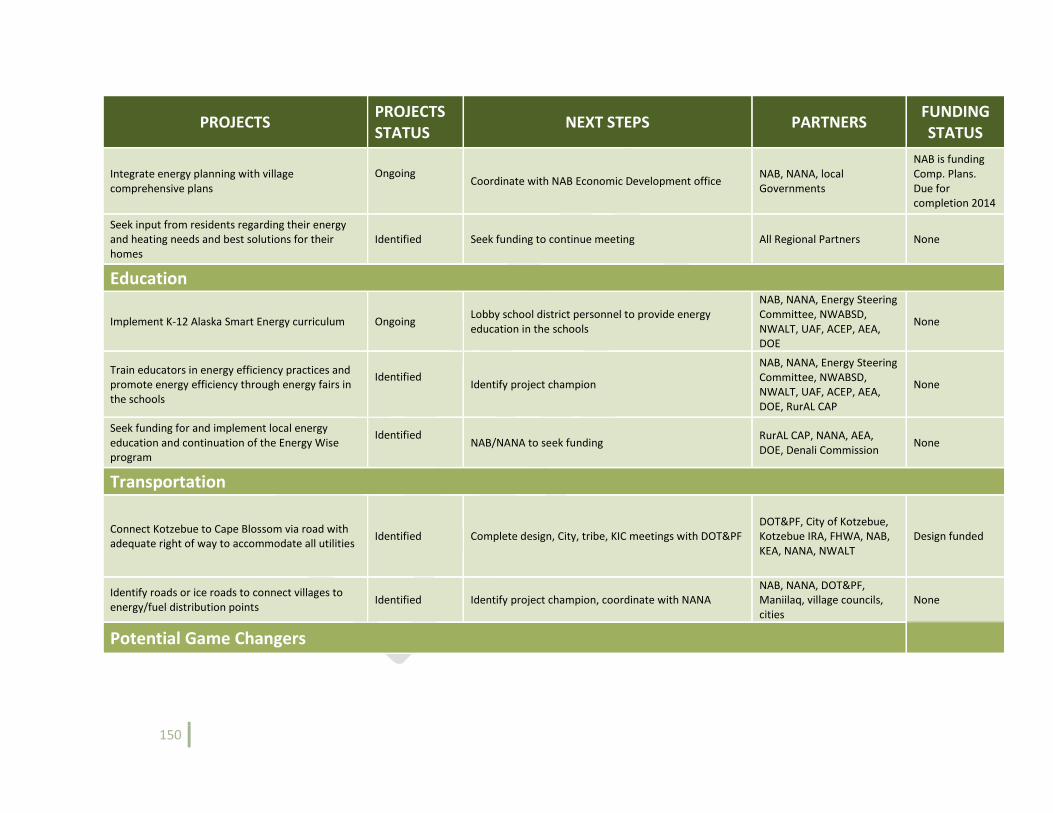
150
PROJECTS PROJECTS STATUS
NEXT STEPS PARTNERS FUNDING STATUS
Integrate energy planning with village comprehensive plans
Ongoing Coordinate with NAB Economic Development office
NAB, NANA, local Governments
NAB is funding Comp. Plans. Due for completion 2014
Seek input from residents regarding their energy and heating needs and best solutions for their homes
Identified Seek funding to continue meeting All Regional Partners None
Education
Implement K-12 Alaska Smart Energy curriculum Ongoing Lobby school district personnel to provide energy education in the schools
NAB, NANA, Energy Steering Committee, NWABSD, NWALT, UAF, ACEP, AEA, DOE
None
Train educators in energy efficiency practices and promote energy efficiency through energy fairs in the schools
Identified Identify project champion
NAB, NANA, Energy Steering Committee, NWABSD, NWALT, UAF, ACEP, AEA, DOE, RurAL CAP
None
Seek funding for and implement local energy education and continuation of the Energy Wise program
Identified NAB/NANA to seek funding
RurAL CAP, NANA, AEA, DOE, Denali Commission
None
Transportation
Connect Kotzebue to Cape Blossom via road with adequate right of way to accommodate all utilities
Identified Complete design, City, tribe, KIC meetings with DOT&PF DOT&PF, City of Kotzebue, Kotzebue IRA, FHWA, NAB, KEA, NANA, NWALT
Design funded
Identify roads or ice roads to connect villages to energy/fuel distribution points
Identified Identify project champion, coordinate with NANA NAB, NANA, DOT&PF, Maniilaq, village councils, cities
None
Potential Game Changers
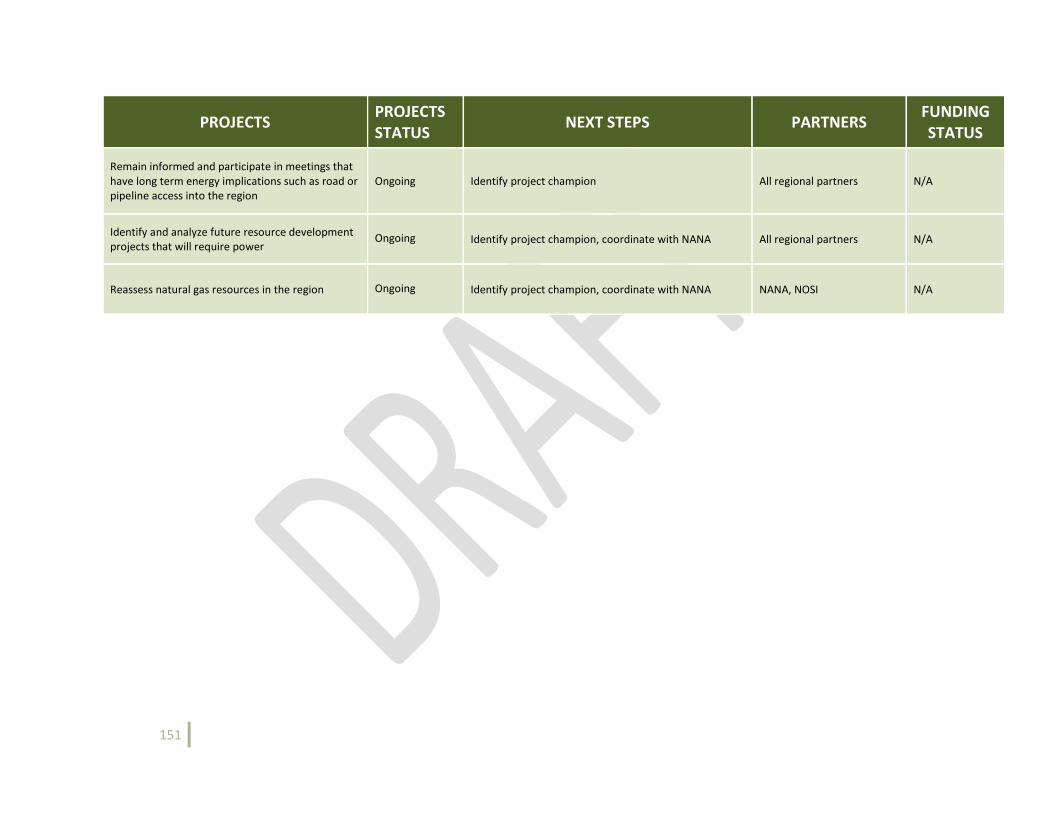
151
PROJECTS PROJECTS STATUS
NEXT STEPS PARTNERS FUNDING STATUS
Remain informed and participate in meetings that have long term energy implications such as road or pipeline access into the region
Ongoing Identify project champion All regional partners N/A
Identify and analyze future resource development projects that will require power
Ongoing Identify project champion, coordinate with NANA All regional partners N/A
Reassess natural gas resources in the region Ongoing Identify project champion, coordinate with NANA NANA, NOSI N/A
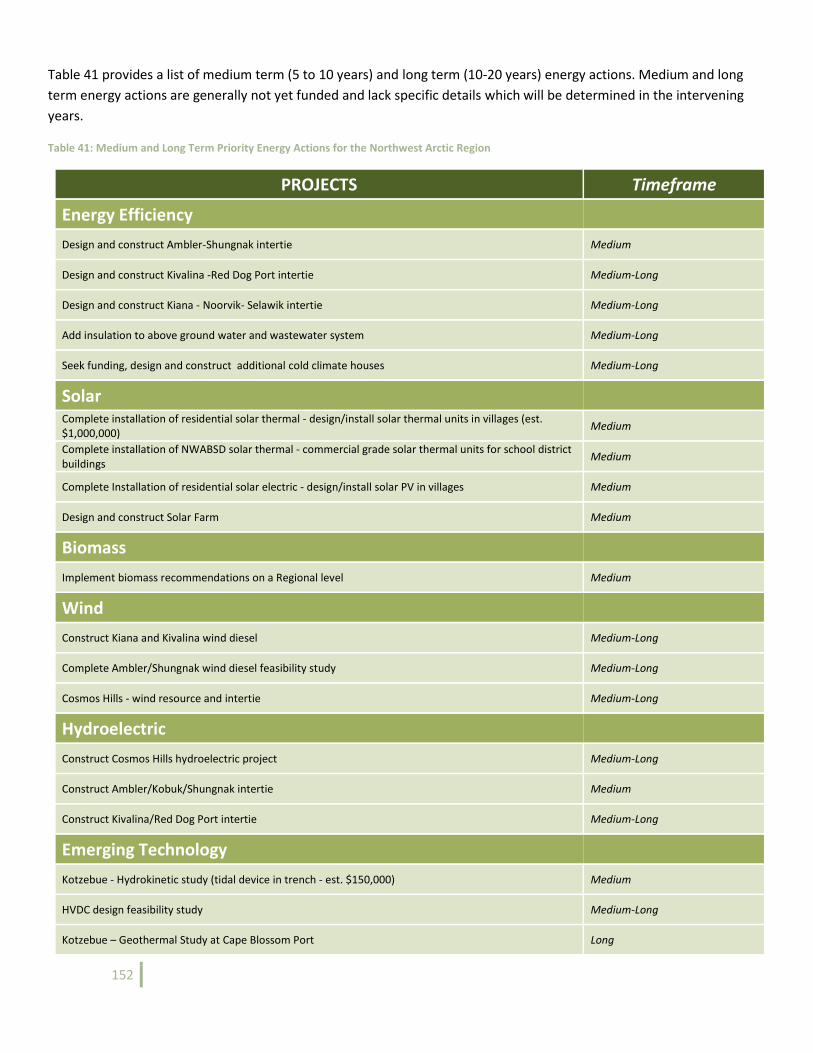
152
Table 41 provides a list of medium term (5 to 10 years) and long term (10-20 years) energy actions. Medium and long
term energy actions are generally not yet funded and lack specific details which will be determined in the intervening
years.
Table 41: Medium and Long Term Priority Energy Actions for the Northwest Arctic Region
PROJECTS Timeframe
Energy Efficiency
Design and construct Ambler-Shungnak intertie Medium
Design and construct Kivalina -Red Dog Port intertie Medium-Long
Design and construct Kiana - Noorvik- Selawik intertie Medium-Long
Add insulation to above ground water and wastewater system Medium-Long
Seek funding, design and construct additional cold climate houses Medium-Long
Solar Complete installation of residential solar thermal - design/install solar thermal units in villages (est. $1,000,000)
Medium
Complete installation of NWABSD solar thermal - commercial grade solar thermal units for school district buildings
Medium
Complete Installation of residential solar electric - design/install solar PV in villages Medium
Design and construct Solar Farm Medium
Biomass
Implement biomass recommendations on a Regional level Medium
Wind
Construct Kiana and Kivalina wind diesel Medium-Long
Complete Ambler/Shungnak wind diesel feasibility study Medium-Long
Cosmos Hills - wind resource and intertie Medium-Long
Hydroelectric
Construct Cosmos Hills hydroelectric project Medium-Long
Construct Ambler/Kobuk/Shungnak intertie Medium
Construct Kivalina/Red Dog Port intertie Medium-Long
Emerging Technology
Kotzebue - Hydrokinetic study (tidal device in trench - est. $150,000) Medium
HVDC design feasibility study Medium-Long
Kotzebue – Geothermal Study at Cape Blossom Port Long
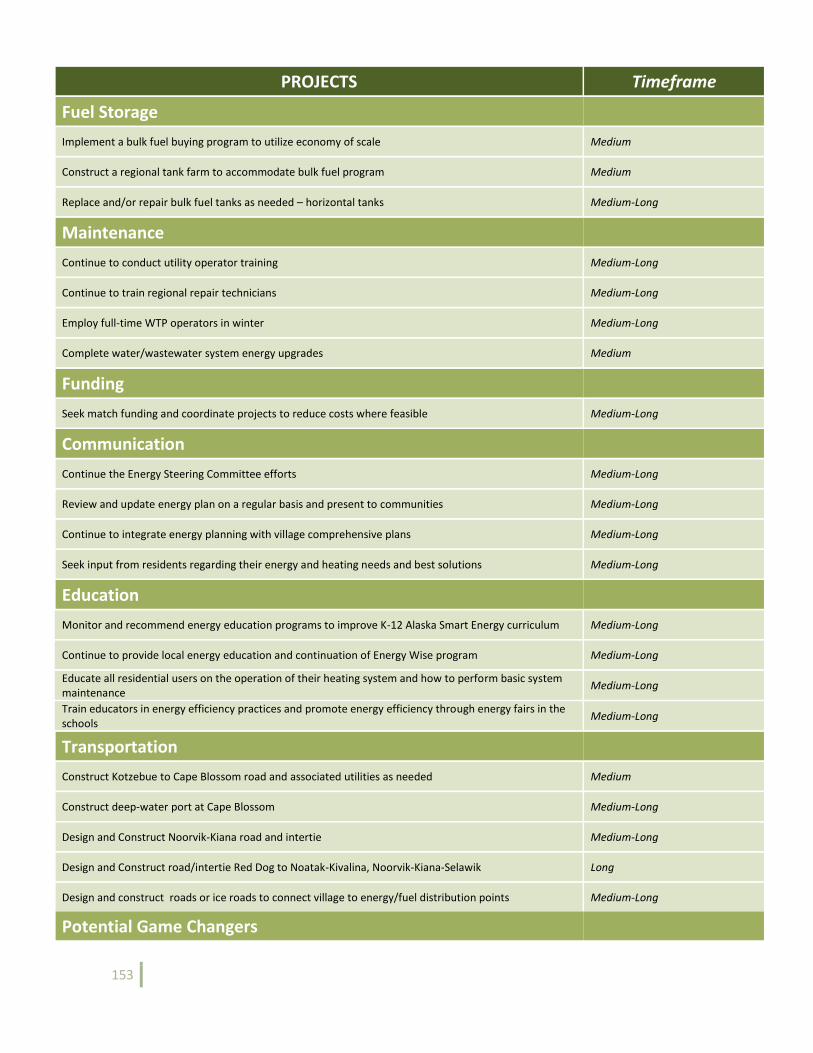
153
PROJECTS Timeframe
Fuel Storage
Implement a bulk fuel buying program to utilize economy of scale Medium
Construct a regional tank farm to accommodate bulk fuel program Medium
Replace and/or repair bulk fuel tanks as needed – horizontal tanks Medium-Long
Maintenance
Continue to conduct utility operator training Medium-Long
Continue to train regional repair technicians Medium-Long
Employ full-time WTP operators in winter Medium-Long
Complete water/wastewater system energy upgrades Medium
Funding
Seek match funding and coordinate projects to reduce costs where feasible Medium-Long
Communication
Continue the Energy Steering Committee efforts Medium-Long
Review and update energy plan on a regular basis and present to communities Medium-Long
Continue to integrate energy planning with village comprehensive plans Medium-Long
Seek input from residents regarding their energy and heating needs and best solutions Medium-Long
Education
Monitor and recommend energy education programs to improve K-12 Alaska Smart Energy curriculum Medium-Long
Continue to provide local energy education and continuation of Energy Wise program Medium-Long
Educate all residential users on the operation of their heating system and how to perform basic system maintenance
Medium-Long
Train educators in energy efficiency practices and promote energy efficiency through energy fairs in the schools
Medium-Long
Transportation
Construct Kotzebue to Cape Blossom road and associated utilities as needed Medium
Construct deep-water port at Cape Blossom Medium-Long
Design and Construct Noorvik-Kiana road and intertie Medium-Long
Design and Construct road/intertie Red Dog to Noatak-Kivalina, Noorvik-Kiana-Selawik Long
Design and construct roads or ice roads to connect village to energy/fuel distribution points Medium-Long
Potential Game Changers
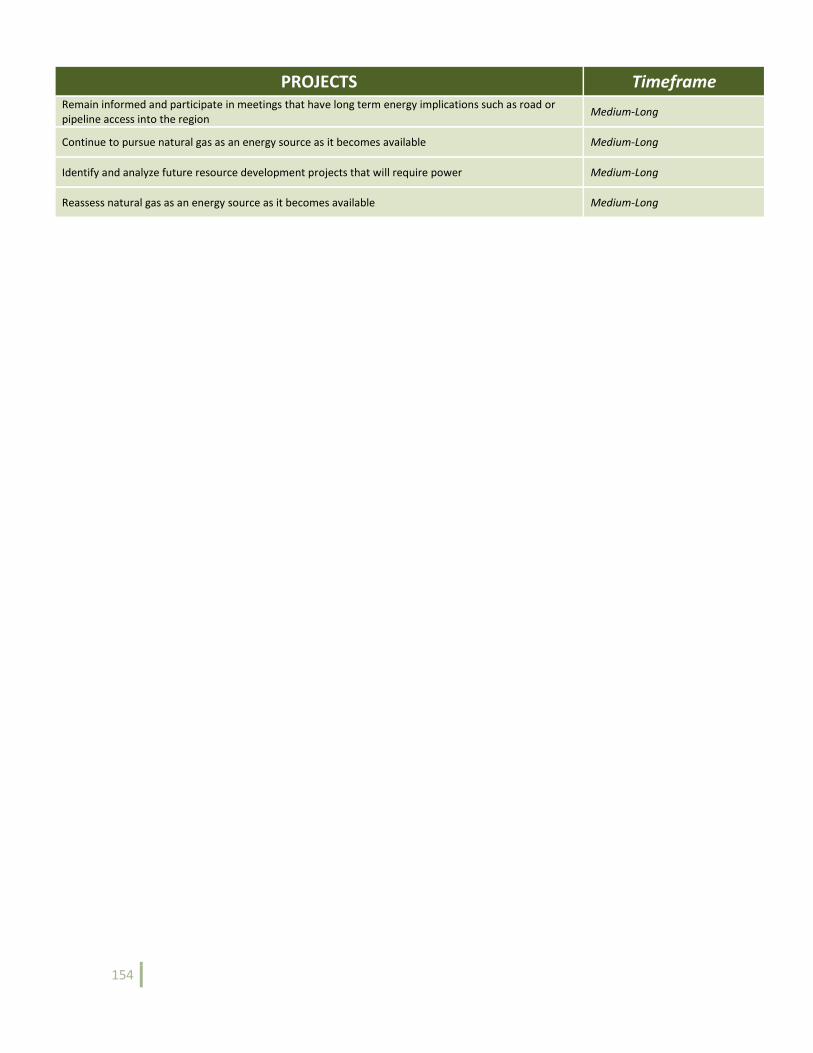
154
PROJECTS Timeframe Remain informed and participate in meetings that have long term energy implications such as road or pipeline access into the region
Medium-Long
Continue to pursue natural gas as an energy source as it becomes available Medium-Long
Identify and analyze future resource development projects that will require power Medium-Long
Reassess natural gas as an energy source as it becomes available Medium-Long

155
156
Works Cited
ACEP. (2012, 12 12). Alaska Energy Wiki. Retrieved 05 09, 2013, from EETG: High Voltage Direct Current Transmission:
http://energy-alaska.wikidot.com/high-voltage-direct-current-transmission
ADEC. (2012). Solid Waste Information Management System. Retrieved 04 18, 2013, from Alaska Department of
Environmental Conservation: http://dec.alaska.gov/Applications/EH/SWIMS/Search.aspx
AEA. (2011). Statistical Report of the Power Cost Equalization Program FY2010. Anchorage: Alaska Energy Authority.
AEA. (2012). Statistical Report of the Power Cost Equalization Program FY2011. Anchorage: Alaska Energy Authority.
Alaska Energy Authority. (2007). A Guide to Alaska's Clean, Local, and Inexhaustible Energy Resources. Anchorage: State
of Alaska.
Alaska Energy Authority. (2010). Energy Pathway. Anchorage: State of Alaska.
Alaska Energy Authority. (2011, August). Renewable Energy Atlas of Alaska. Retrieved March 11, 2013, from
ftp://ftp.aidea.org/AEAPublications/2011_RenewableEnergyAtlasofAlaska.pdf
Alaska Native Tribal Health Consortium. (2010). ANTHC-Kiana Heat Recovery Analysis. Anchorage, AK: Alaska Energy and
Engineering.
Alaska Native Tribal Health Consortium. (2011). Comprehensive Energy Audit for Selawik Water and Sewer Systems.
Anchorage: ANTHC.
ANTHC. (2012). Energy Audits. Retrieved 05 10, 2013, from ANTHC :: Energy Innovations:
http://www.anthctoday.org/dehe/cbee/watersystemaudits.html
Brabets, T. P. (1996). Evaluation of the Streamflow-Gaging Network of Alaska in Providing Streamflow Information.
Anchorage: US Geological Survey.
CCHRC. (2010). Cold Climate Housing Research Center. Retrieved 05 09, 2013, from Buckland Prototype Home:
http://www.cchrc.org/buckland-prototype-home
Collins, W. B. (1998). Logging in Alaska's Boreal Forest: Creation of Grasslands or Enhancement of Moose Habitat.
Retrieved 02 2013, from http://bolt.lakeheadu.ca/~alceswww/Bol34b/Alces34(2)_355.pdf
DCEED. (July 2014). Alaska Fuel Price Report. Anchorage: State of Alaska.
DCRA. (2012). Community Information Summaries. Retrieved 04 08, 2013, from Alaska Department of Commerce,
Community and Economic Development, Division of Community and Regional Affairs:
http://www.commerce.state.ak.us/cra/DCRAExternal/Community
Department of Commerce, Community, and Economic Development; Division of Community and Regional Affairs.
(2014). Alaska Fuel Price REport: Current Community Conditions, July 2014. Anchorage: DCEED.
Division of Forestry. (2009). 2009 Alaska Wildfires by Area and Protection Level. Retrieved 02 2013, from
http://forestry.alaska.gov/pdfs/2009_fire_statistics.pdf
157
Fraser, W. (2012). Noorvik Heat Recovery Project. Anchorage: Alaska Native Tribal Healt Consortium.
Hinzman, L. e. (n.d.). Permafrost, Hydrology & Climate Change on the Seward Peninsula. Fairbanks, AK: International
Arctic Research Center and the University of Alaska Fairbanks.
Katherine L. Jacobs, e. a. (2012). Adapting to the Impacts of Climate Change. Washington DC: The National Academies.
KEA. (2013). Solar Thermal Above the Arctic Circle. Retrieved 04 10, 2013, from Kotzebue Electric Association:
http://www.kea.coop/articles/solar-thermal-above-the-arctic-circle/
Lilly, M. (2010, October 12). Project Information. Retrieved May 09, 2013, from Cosmos Hills Hydrologic Network:
http://www.cosmoshydro.org/
Maniilaq. (2003). About Northwest Alaska. Retrieved 04 12, 2013, from Maniilaq Association.
NAB. (2013). About the Northwest Arctic Borough. Retrieved 04 05, 2013, from Northwest Arctic Borough:
http://www.nwabor.org/about.html
NAB. (2013). Energy Issues. Retrieved 04 18, 2013, from Northwest Arctic Borough:
http://www.nwabor.org/energy.html
NANA Regional Corporation. (2012). Annual Report. Kotzebue, AK: NRC.
NDC. (2013). About NANA Development Corporation. Retrieved 04 12, 2013, from NANA Development: http://nana-
dev.com/about
NOAA. (2012). Preliminary Local Climatological Data, WSO Kotzebue, Alaska. Kotzebue, AK: US Department of
Commerce, National Oceanic and Atmospheric Administration, National Weather Service.
NRC. (2010). Our Region. Retrieved 04 30, 2013, from NANA Regional Corportation: http://nana.com/regional/about-
us/overview-of-region/
NRC. (2010). Renewable Energy. Retrieved 4 4, 2013, from NANA Regional Corporation:
http://nana.com/regional/resources/alternative-energy/
NWALT. (2010). Northwest Arctic Strategic Energy Plan. Retrieved 08 14, 2013, from Northwest Arctic Borough:
www.nwabor.org/forms/EnergyPlan.pdf
RurAL CAP. (2012). Energy Wise Program. Retrieved 04 18, 2013, from RurAL CAP: Healthy People, Sustainable
Communities, Vibrant Cultures: http://ruralcap.com/?option=com_content&view=article&id=530&Itemid=348
Tom Wilbanks, e. a. (2012). Climate Change and Energy Supply and Use, Technical Report for the US Department of
Energy in Support of the National Climate Assessment. Washington, DC: US Department of Energy, Office of
Science.
US EPA. (2013, 06 21). Energy Imacts and Adaptation. Retrieved 08 09, 2013, from EPA/Climate Change:
http://www.epa.gov/climatechange/impacts-adaptation/energy.html
158
USA.com. (2013). Northwest Arctic County Historical School Enrollment Data. Retrieved 14 17, 2013, from USA.com:
http://www.usa.com/northwest-arctic-county-ak-population-and-races--historical-school-enrollment-data.htm
Wall, B. (2011). Wood Harvest Systems for the Upper Kobuk Valley. Anchorage, AK: Alaska Wood Energy Associates
Sustainabiltiy, Inc.
Weatherization Programs. (2013). Retrieved January 9, 2013, from Alaska Housing Finance Corportation:
http://www.ahfc.us/pros/grants/service-assistance-grants/weatherization-programs/
Weatherization Services. (n.d.). Retrieved January 10, 2013, from RurAL CAP:
http://www.ruralcap.com/index.php?option=com_content&view=article&id=170&Itemid=85
WHPacific, Inc. (2011). NANA Forest Stewardship Plan. Anchorage: WHPacific.

159

160
Appendix A: Funding Opportunities for Energy Projects

161
162
Funding Opportunities for Energy Projects
The majority of energy funding resources accessed for Alaska projects come from either the State of Alaska or from U.S.
Department of Energy. AHFC funds energy efficiency projects for residences, businesses, and buildings owned by
municipalities and educational entities, such as the University of Alaska Anchorage. AEA provides energy audit services
to commercial and governmental agencies, renewable energy funds, rural power systems upgrades, bulk fuel
construction funds and alternative energy and energy efficiency development programs. AEA also provides economic
assistance to rural customers where kilowatt hour charges for electricity are three to five times higher than more urban
areas of the state.
Private foundations and corporations also provide funds for smaller projects, some of which can be energy
improvements, but most of which are capital funds for construction or reconstruction projects.
In the table that follows, funding sources are listed by type of project and then funding agency. The description of the
type of project eligible is included as well as if the funding eligibility is dependent on economic status of the applicant.
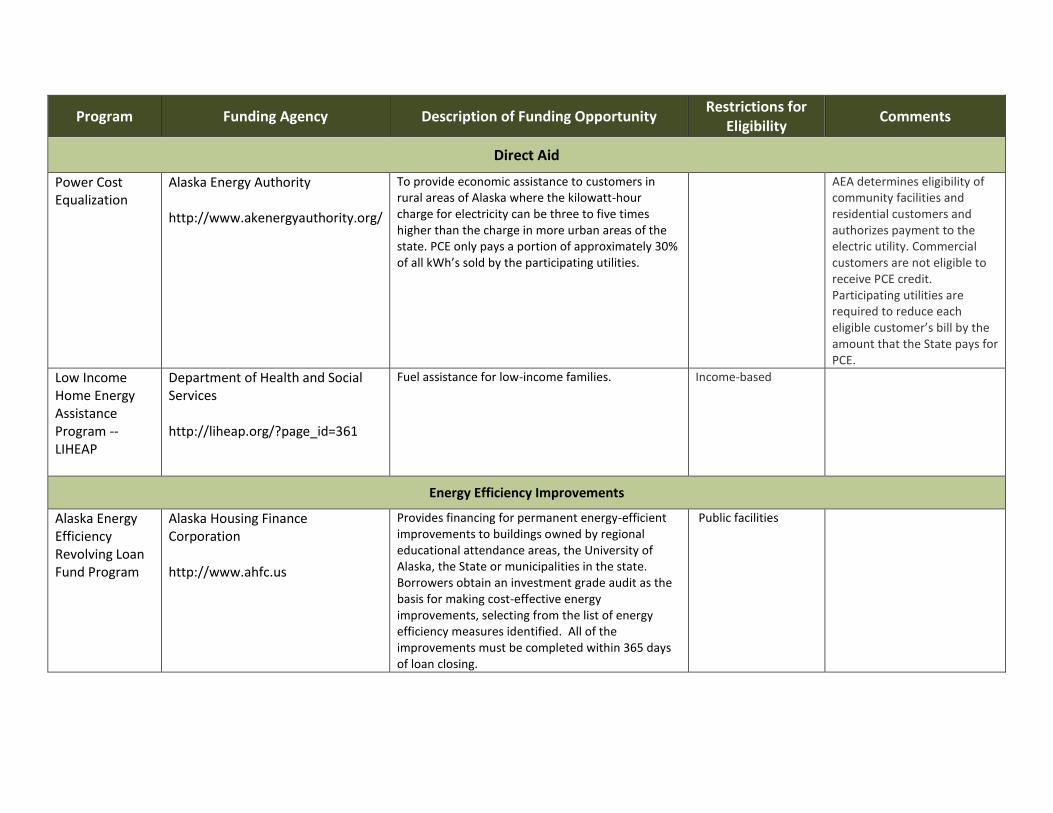
163
Program Funding Agency Description of Funding Opportunity Restrictions for
Eligibility Comments
Direct Aid
Power Cost Equalization
Alaska Energy Authority http://www.akenergyauthority.org/
To provide economic assistance to customers in rural areas of Alaska where the kilowatt-hour charge for electricity can be three to five times higher than the charge in more urban areas of the state. PCE only pays a portion of approximately 30% of all kWh’s sold by the participating utilities.
AEA determines eligibility of community facilities and residential customers and authorizes payment to the electric utility. Commercial customers are not eligible to receive PCE credit. Participating utilities are required to reduce each eligible customer’s bill by the amount that the State pays for PCE.
Low Income Home Energy Assistance Program -- LIHEAP
Department of Health and Social Services http://liheap.org/?page_id=361
Fuel assistance for low-income families. Income-based
Energy Efficiency Improvements
Alaska Energy Efficiency Revolving Loan Fund Program
Alaska Housing Finance Corporation http://www.ahfc.us
Provides financing for permanent energy-efficient improvements to buildings owned by regional educational attendance areas, the University of Alaska, the State or municipalities in the state. Borrowers obtain an investment grade audit as the basis for making cost-effective energy improvements, selecting from the list of energy efficiency measures identified. All of the improvements must be completed within 365 days of loan closing.
Public facilities
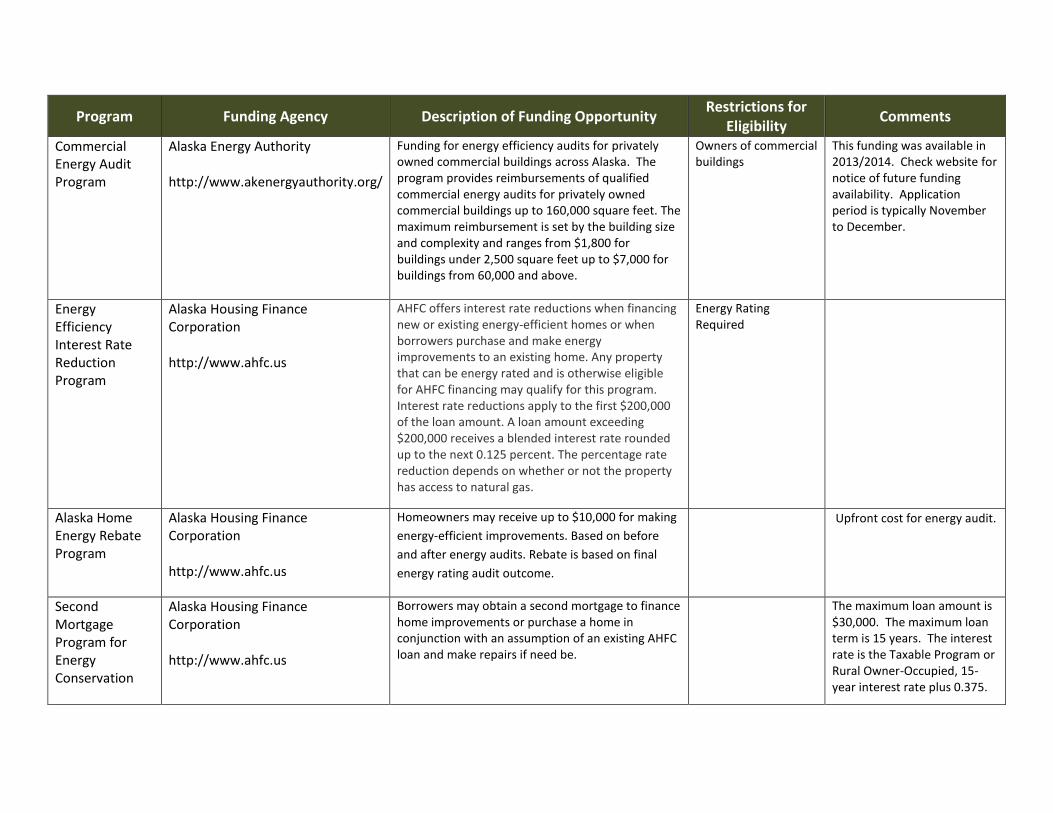
164
Program Funding Agency Description of Funding Opportunity Restrictions for
Eligibility Comments
Commercial Energy Audit Program
Alaska Energy Authority http://www.akenergyauthority.org/
Funding for energy efficiency audits for privately owned commercial buildings across Alaska. The program provides reimbursements of qualified commercial energy audits for privately owned commercial buildings up to 160,000 square feet. The maximum reimbursement is set by the building size and complexity and ranges from $1,800 for buildings under 2,500 square feet up to $7,000 for buildings from 60,000 and above.
Owners of commercial buildings
This funding was available in 2013/2014. Check website for notice of future funding availability. Application period is typically November to December.
Energy Efficiency Interest Rate Reduction Program
Alaska Housing Finance Corporation http://www.ahfc.us
AHFC offers interest rate reductions when financing new or existing energy-efficient homes or when borrowers purchase and make energy improvements to an existing home. Any property that can be energy rated and is otherwise eligible for AHFC financing may qualify for this program. Interest rate reductions apply to the first $200,000 of the loan amount. A loan amount exceeding $200,000 receives a blended interest rate rounded up to the next 0.125 percent. The percentage rate reduction depends on whether or not the property has access to natural gas.
Energy Rating Required
Alaska Home Energy Rebate Program
Alaska Housing Finance Corporation http://www.ahfc.us
Homeowners may receive up to $10,000 for making
energy-efficient improvements. Based on before
and after energy audits. Rebate is based on final
energy rating audit outcome.
Upfront cost for energy audit.
Second Mortgage Program for Energy Conservation
Alaska Housing Finance Corporation http://www.ahfc.us
Borrowers may obtain a second mortgage to finance home improvements or purchase a home in conjunction with an assumption of an existing AHFC loan and make repairs if need be.
The maximum loan amount is $30,000. The maximum loan term is 15 years. The interest rate is the Taxable Program or Rural Owner-Occupied, 15-year interest rate plus 0.375.
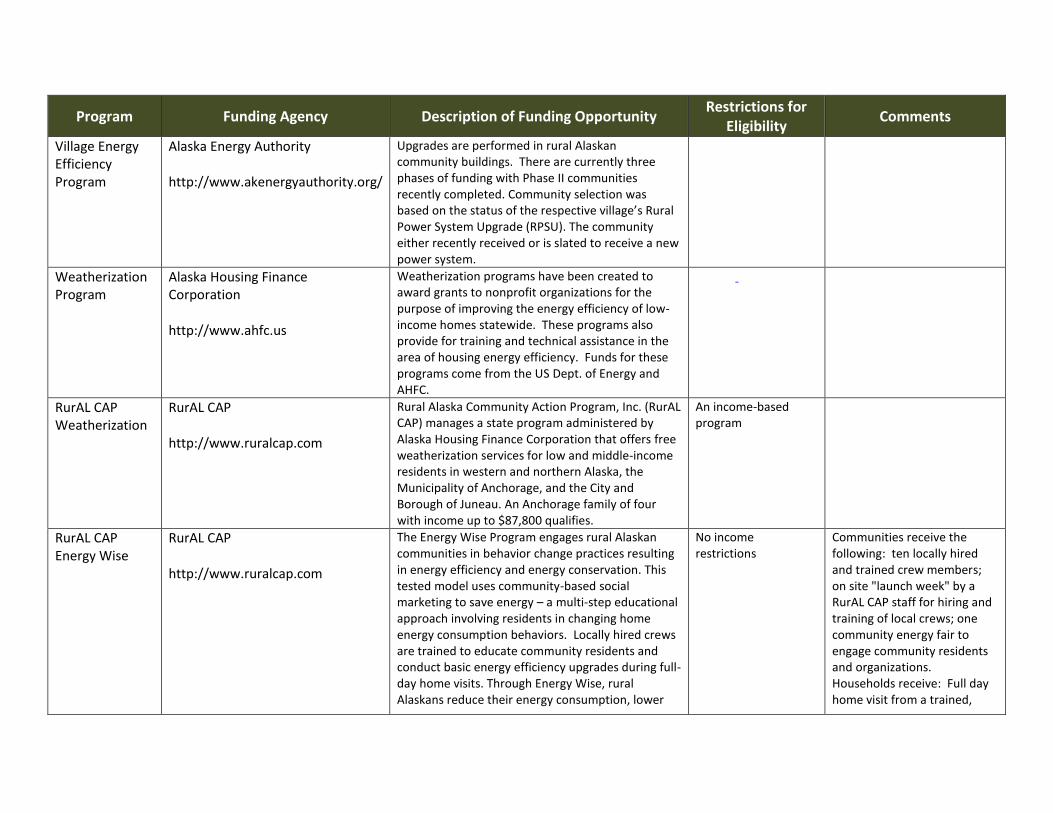
165
Program Funding Agency Description of Funding Opportunity Restrictions for
Eligibility Comments
Village Energy Efficiency Program
Alaska Energy Authority http://www.akenergyauthority.org/
Upgrades are performed in rural Alaskan community buildings. There are currently three phases of funding with Phase II communities recently completed. Community selection was based on the status of the respective village’s Rural Power System Upgrade (RPSU). The community either recently received or is slated to receive a new power system.
Weatherization Program
Alaska Housing Finance Corporation http://www.ahfc.us
Weatherization programs have been created to award grants to nonprofit organizations for the purpose of improving the energy efficiency of low-income homes statewide. These programs also provide for training and technical assistance in the area of housing energy efficiency. Funds for these programs come from the US Dept. of Energy and AHFC.
RurAL CAP Weatherization
RurAL CAP http://www.ruralcap.com
Rural Alaska Community Action Program, Inc. (RurAL CAP) manages a state program administered by Alaska Housing Finance Corporation that offers free weatherization services for low and middle-income residents in western and northern Alaska, the Municipality of Anchorage, and the City and Borough of Juneau. An Anchorage family of four with income up to $87,800 qualifies.
An income-based program
RurAL CAP Energy Wise
RurAL CAP http://www.ruralcap.com
The Energy Wise Program engages rural Alaskan communities in behavior change practices resulting in energy efficiency and energy conservation. This tested model uses community-based social marketing to save energy – a multi-step educational approach involving residents in changing home energy consumption behaviors. Locally hired crews are trained to educate community residents and conduct basic energy efficiency upgrades during full-day home visits. Through Energy Wise, rural Alaskans reduce their energy consumption, lower
No income restrictions
Communities receive the following: ten locally hired and trained crew members; on site "launch week" by a RurAL CAP staff for hiring and training of local crews; one community energy fair to engage community residents and organizations. Households receive: Full day home visit from a trained,
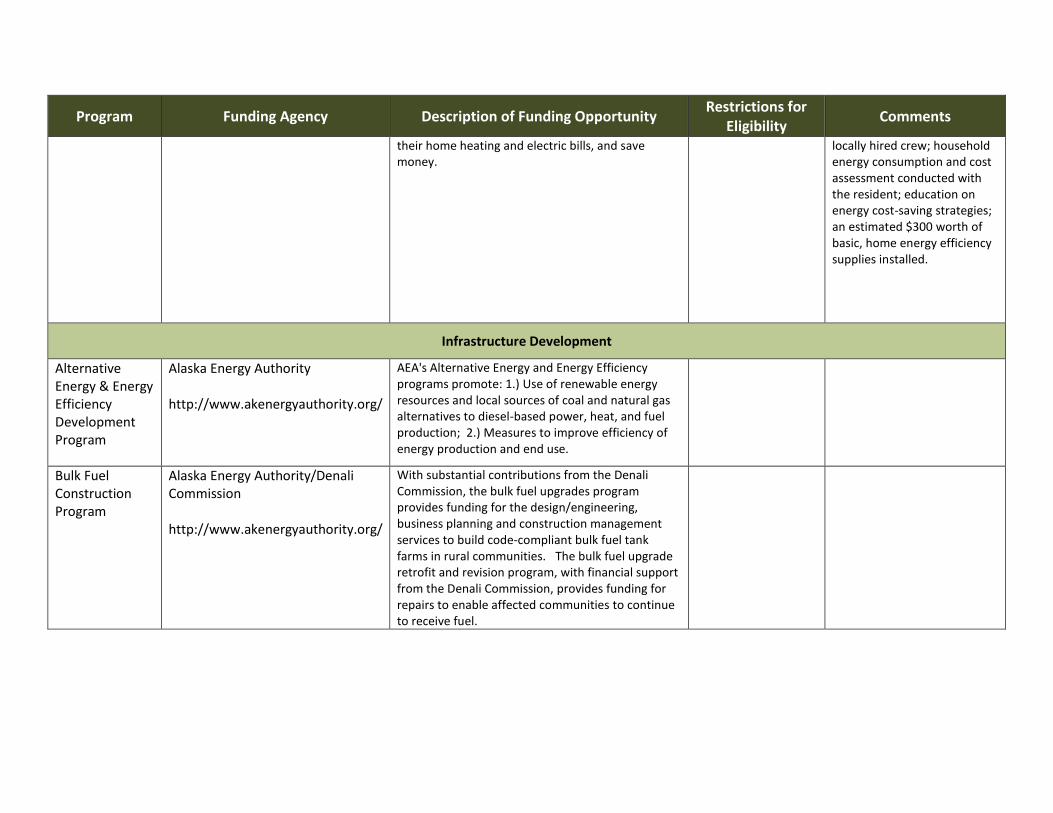
166
Program Funding Agency Description of Funding Opportunity Restrictions for
Eligibility Comments
their home heating and electric bills, and save money.
locally hired crew; household energy consumption and cost assessment conducted with the resident; education on energy cost-saving strategies; an estimated $300 worth of basic, home energy efficiency supplies installed.
Infrastructure Development
Alternative Energy & Energy Efficiency Development Program
Alaska Energy Authority http://www.akenergyauthority.org/
AEA's Alternative Energy and Energy Efficiency programs promote: 1.) Use of renewable energy resources and local sources of coal and natural gas alternatives to diesel-based power, heat, and fuel production; 2.) Measures to improve efficiency of energy production and end use.
Bulk Fuel Construction Program
Alaska Energy Authority/Denali Commission http://www.akenergyauthority.org/
With substantial contributions from the Denali Commission, the bulk fuel upgrades program provides funding for the design/engineering, business planning and construction management services to build code-compliant bulk fuel tank farms in rural communities. The bulk fuel upgrade retrofit and revision program, with financial support from the Denali Commission, provides funding for repairs to enable affected communities to continue to receive fuel.
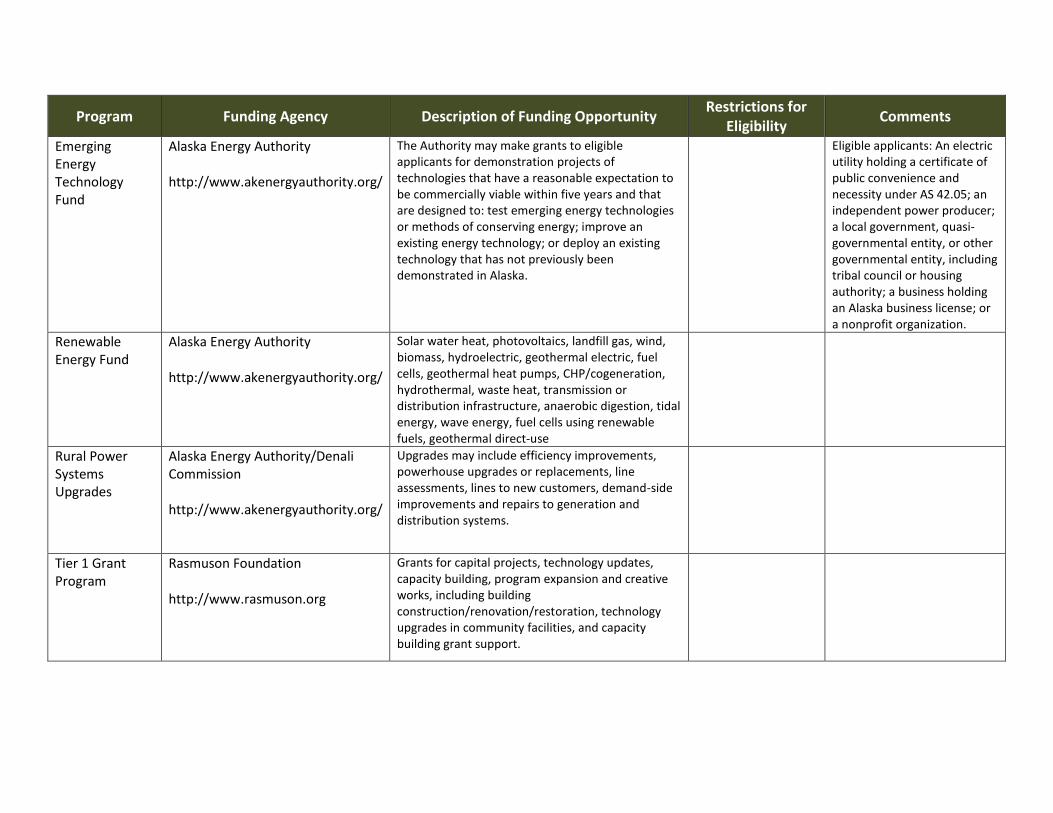
167
Program Funding Agency Description of Funding Opportunity Restrictions for
Eligibility Comments
Emerging Energy Technology Fund
Alaska Energy Authority http://www.akenergyauthority.org/
The Authority may make grants to eligible applicants for demonstration projects of technologies that have a reasonable expectation to be commercially viable within five years and that are designed to: test emerging energy technologies or methods of conserving energy; improve an existing energy technology; or deploy an existing technology that has not previously been demonstrated in Alaska.
Eligible applicants: An electric utility holding a certificate of public convenience and necessity under AS 42.05; an independent power producer; a local government, quasi-governmental entity, or other governmental entity, including tribal council or housing authority; a business holding an Alaska business license; or a nonprofit organization.
Renewable Energy Fund
Alaska Energy Authority http://www.akenergyauthority.org/
Solar water heat, photovoltaics, landfill gas, wind, biomass, hydroelectric, geothermal electric, fuel cells, geothermal heat pumps, CHP/cogeneration, hydrothermal, waste heat, transmission or distribution infrastructure, anaerobic digestion, tidal energy, wave energy, fuel cells using renewable fuels, geothermal direct-use
Rural Power Systems Upgrades
Alaska Energy Authority/Denali Commission http://www.akenergyauthority.org/
Upgrades may include efficiency improvements, powerhouse upgrades or replacements, line assessments, lines to new customers, demand-side improvements and repairs to generation and distribution systems.
Tier 1 Grant Program
Rasmuson Foundation http://www.rasmuson.org
Grants for capital projects, technology updates, capacity building, program expansion and creative works, including building construction/renovation/restoration, technology upgrades in community facilities, and capacity building grant support.
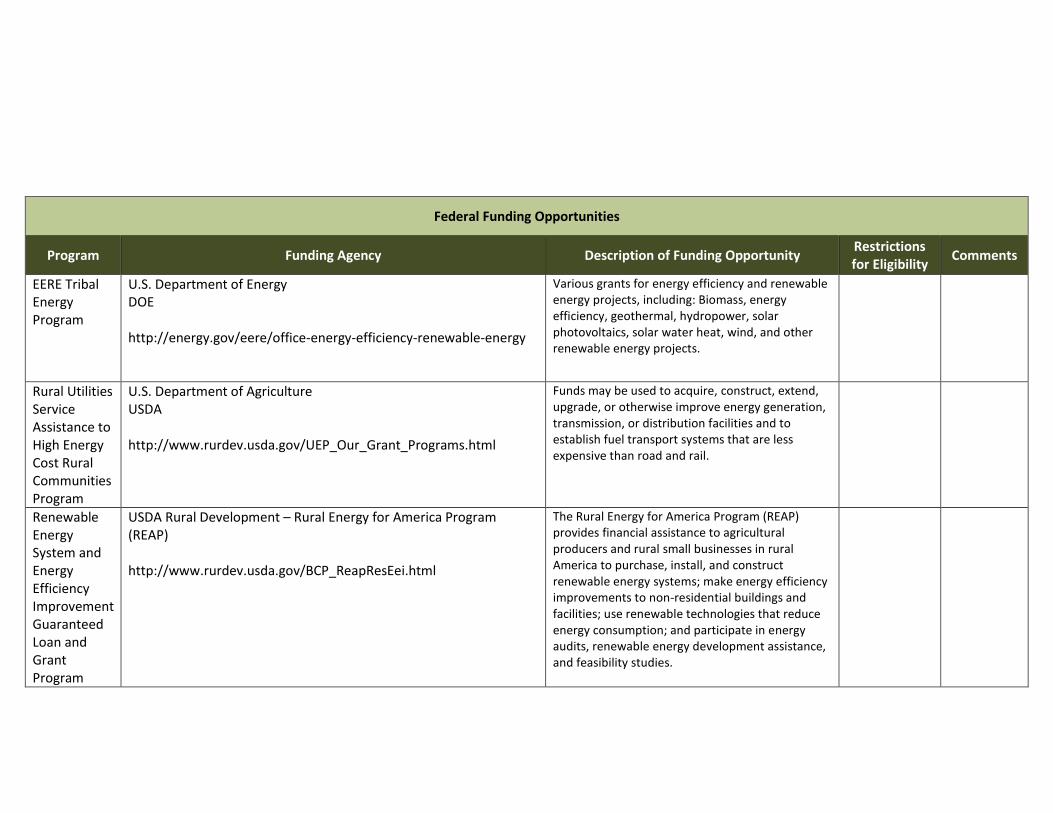
168
Federal Funding Opportunities
Program Funding Agency Description of Funding Opportunity Restrictions for Eligibility
Comments
EERE Tribal Energy Program
U.S. Department of Energy DOE http://energy.gov/eere/office-energy-efficiency-renewable-energy
Various grants for energy efficiency and renewable energy projects, including: Biomass, energy efficiency, geothermal, hydropower, solar photovoltaics, solar water heat, wind, and other renewable energy projects.
Rural Utilities Service Assistance to High Energy Cost Rural Communities Program
U.S. Department of Agriculture USDA http://www.rurdev.usda.gov/UEP_Our_Grant_Programs.html
Funds may be used to acquire, construct, extend, upgrade, or otherwise improve energy generation, transmission, or distribution facilities and to establish fuel transport systems that are less expensive than road and rail.
Renewable Energy System and Energy Efficiency Improvement Guaranteed Loan and Grant Program
USDA Rural Development – Rural Energy for America Program (REAP) http://www.rurdev.usda.gov/BCP_ReapResEei.html
The Rural Energy for America Program (REAP) provides financial assistance to agricultural producers and rural small businesses in rural America to purchase, install, and construct renewable energy systems; make energy efficiency improvements to non-residential buildings and facilities; use renewable technologies that reduce energy consumption; and participate in energy audits, renewable energy development assistance, and feasibility studies.