Embed Size (px)
Citation preview
Hyperglycemia and a Common Variant of GCKR AreAssociated With the Levels of Eight Amino Acids in9,369 Finnish MenAlena Stan�cáková,1 Mete Civelek,
2Niyas K. Saleem,
1Pasi Soininen,
3,4Antti J. Kangas,
3
Henna Cederberg,1Jussi Paananen,
1Jussi Pihlajamäki,
5Lori L. Bonnycastle,
6Mario A. Morken,
6
Michael Boehnke,7Päivi Pajukanta,
8Aldons J. Lusis,
2Francis S. Collins,
6Johanna Kuusisto,
1
Mika Ala-Korpela,3,4,9
and Markku Laakso1
We investigated the association of glycemia and 43 genetic riskvariants for hyperglycemia/type 2 diabetes with amino acid levelsin the population-based Metabolic Syndrome in Men (METSIM)Study, including 9,369 nondiabetic or newly diagnosed type 2diabetic Finnish men. Plasma levels of eight amino acids weremeasured with proton nuclear magnetic resonance spectroscopy.Increasing fasting and 2-h plasma glucose levels were associatedwith increasing levels of several amino acids and decreasing levelsof histidine and glutamine. Alanine, leucine, isoleucine, tyrosine,and glutamine predicted incident type 2 diabetes in a 4.7-yearfollow-up of the METSIM Study, and their effects were largelymediated by insulin resistance (except for glutamine). We alsofound significant correlations between insulin sensitivity (Matsudainsulin sensitivity index) and mRNA expression of genes regulatingamino acid degradation in 200 subcutaneous adipose tissuesamples. Only 1 of 43 risk single nucleotide polymorphisms fortype 2 diabetes or hyperglycemia, the glucose-increasing major Callele of rs780094 of GCKR, was significantly associated with de-creased levels of alanine and isoleucine and elevated levels ofglutamine. In conclusion, the levels of branched-chain, aromaticamino acids and alanine increased and the levels of glutamine andhistidine decreased with increasing glycemia, reflecting, at least inpart, insulin resistance. Only one single nucleotide polymorphismregulating hyperglycemia was significantly associated with aminoacid levels.
Insulin regulates carbohydrate, lipid, protein, and aminoacid metabolism (1). Insulin inhibits proteolysis andassociated release of amino acids and stimulatesamino acid uptake and protein synthesis in skeletal
muscle (2,3). Selected amino acids, however, enhance in-sulin secretion (4,5) or modulate insulin sensitivity (6–10),the two main mechanisms in the regulation of glucosehomeostasis.
A recent study reported that three branched-chain aminoacids (BCAAs), valine, leucine and isoleucine, and two ar-omatic amino acids, phenylalanine and tyrosine, predictedtype 2 diabetes (11). The risk of diabetes was fivefold higherin individuals in the top quartile of a combination of threeamino acids (isoleucine, phenylalanine, and tyrosine) com-pared with individuals in the lowest quartile. Although somesmall studies have reported that the levels of amino acidsdiffer between individuals with normal and abnormal glu-cose tolerance (12,13), previous studies have not inves-tigated the levels of amino acids across the entire range ofglucose tolerance.
Amino acids modulate insulin action on glucose trans-port (9,14–16) and gluconeogenesis (17). High levels ofBCAAs, especially leucine, have been shown to associatewith insulin resistance (16,18,19) or insulin-resistant states,including diabetes (6,12,13). BCAAs have been shown todownregulate insulin action on glucose uptake by inhibit-ing critical steps in the postreceptor insulin signalingcascade (10), although other studies have concluded thatleucine and isoleucine stimulate glucose uptake (7,8,20).Gluconeogenic amino acids (mainly alanine and gluta-mine) can enhance hepatic glucose production and thuslead to hyperglycemia (21,22). Finally, amino acids such asarginine, glutamine, leucine, and phenylalanine directlystimulate insulin secretion (4).
Type 2 diabetes is a complex metabolic disease with asignificant genetic component, and .40 gene loci associ-ated with the risk of type 2 diabetes or hyperglycemia havebeen identified (23–26). The mechanisms by which theseloci contribute to the risk of diabetes are only partiallyknown. There are no previous studies on the association ofthese gene variants with the levels of amino acids.
The aims of our study were 1) to investigate the re-lationship between the levels of amino acids and fastingand 2-h glucose across the entire range of glucose toler-ance, 2) to investigate the role of insulin sensitivity andinsulin secretion in this relationship, 3) to investigate therelationship between insulin sensitivity and adipose tissue
From the 1Department of Medicine, University of Eastern Finland and KuopioUniversity Hospital, Kuopio, Finland; the 2Department of Human Genetics,the Department of Microbiology, Immunology and Molecular Genetics, andthe Department of Medicine, University of California, Los Angeles, Los An-geles, California; the 3Computational Medicine Research Group, Institute ofClinical Medicine, University of Oulu and Biocenter Oulu, Oulu, Finland; the4Nuclear Magnetic Resonance Metabonomics Laboratory, Laboratory ofChemistry, Department of Biosciences, University of Eastern Finland, Kuo-pio, Finland; the 5Departments of Medicine and Clinical Nutrition, Univer-sity of Eastern Finland and Kuopio University Hospital, Kuopio, Finland; the6National Human Genome Research Institute, National Institutes of Health,Bethesda, Maryland; the 7Center for Statistical Genetics, Department of Bio-statistics, University of Michigan School of Public Health, Ann Arbor, Michi-gan; the 8Department of Human Genetics, David Geffen School of Medicine,University of California, Los Angeles, Los Angeles, California; and the 9Depart-ment of Internal Medicine and Biocenter Oulu, Clinical Research Center,University of Oulu, Oulu, Finland.
Corresponding author: Markku Laakso, [email protected] 5 October 2011 and accepted 2 March 2012.DOI: 10.2337/db11-1378This article contains Supplementary Data online at http://diabetes
.diabetesjournals.org/lookup/suppl/doi:10.2337/db11-1378/-/DC1.� 2012 by the American Diabetes Association. Readers may use this article as
long as the work is properly cited, the use is educational and not for profit,and the work is not altered. See http://creativecommons.org/licenses/by-nc-nd/3.0/ for details.
diabetes.diabetesjournals.org DIABETES 1
ORIGINAL ARTICLE
Diabetes Publish Ahead of Print, published online May 2, 2012
mRNA expression of genes implicated in the catabolism ofamino acids, and 4) to investigate whether any of 43 risksingle nucleotide polymorphisms (SNPs) for type 2 di-abetes or hyperglycemia affect serum amino acid levels.
RESEARCH DESIGN AND METHODS
Subjects and clinical measurements. The study included 9,369 nondiabeticor newly diagnosed type 2 diabetic men from the population-based MetabolicSyndrome in Men (METSIM) Study (mean6 SD age, 576 7 years; BMI, 27.064.0 kg/m2). The study design has been described in detail elsewhere (27).
Glucose tolerance was evaluated according to the American Diabetes As-sociation criteria (28). A total of 3,026 subjects (32.3%) had normal glucosetolerance (NGT), 4,327 (46.2%) had isolated impaired fasting glucose (IFG), 312(3.3%) had isolated impaired glucose tolerance (IGT), 1,058 (11.3%) had IFG andIGT, and 646 (6.9%) had newly diagnosed type 2 diabetes. Additional analyseswere performed in 1,775 nondiabetic subjects re-examined during an ongoingfollow-up METSIM study, of which 375 maintained NGT, 1,249 remained non-diabetic, and 151 developed new type 2 diabetes during the mean follow-up of4.7 6 1.0 years. None of 9,369 subjects was receiving antidiabetic treatment.BMI was calculated as weight (kg) divided by height (m) squared. The studywas approved by the ethics committee of the University of Kuopio and KuopioUniversity Hospital and conducted in accordance with the Helsinki Declaration.Amino acid measurements. A high-throughput serum nuclear magnetic res-onance (NMR) platform operating at 500 MHz was used for amino acid quan-tification (29). Fasting serum samples collected at the baseline study werestored at 280°C and thawed overnight in a refrigerator before sample prep-aration. Aliquots of each sample (300 mL) were mixed with sodium phosphatebuffer (300 mL). A proton NMR spectrum was acquired where most spectralsignals from the macromolecules and lipoprotein lipids were suppressed toenhance detection of the amino acid signals. The eight amino acids (alanine,phenylalanine, valine, leucine, isoleucine, tyrosine, histidine, glutamine) werequantified in standardized concentration units. Details of the NMR experimen-tation and amino acid quantification have been described previously (29,30).Insulin sensitivity and insulin secretion indices. Results of oral glucosetolerance testing (OGTT) were used to calculate the Matsuda index of insulinsensitivity (ISI) as 10,000/= (fasting insulin 3 fasting glucose 3 mean insulinduring OGTT 3 mean glucose during OGTT) (31). An index of early-phaseinsulin secretion during an OGTT, insulin area under the curve (InsAUC)0–30/glucose (Glu)AUC0–30, was calculated as (fasting insulin + 30-min insulin)/(fasting glucose + 30-min glucose) (pmol/mmol) (27).Genotyping. Genotyping of 43 SNPs (29 SNPs associated with risk for type 2diabetes and 14 associated with increased fasting or 2-h glucose in an OGTT)(23–26) was performed using the Applied Biosystems TaqMan Allelic Dis-crimination Assay at the University of Eastern Finland or the Sequenom iPlexGold SBE assay at the National Human Genome Research Institute at theNational Institutes of Health. The TaqMan genotyping call rate was 100%, andthe discordance rate was 0% among 4.5% DNA samples genotyped in duplicate.The Sequenom iPlex call rate was 90.2–96.9%, and the discordance rate was 0%among 4.2% DNA samples genotyped in duplicate. All SNPs were in Hardy-Weinberg equilibrium at the significance level corrected for multiple testing byBonferroni method (P , 0.0012). Descriptive data for individual SNPs areshown in Supplementary Table 1.Gene expression analysis. Total RNAwas isolated from 200 subcutaneous fatbiopsy samples of METSIM participants using Qiagen miRNeasy kit accordingto manufacturer’s instructions. RNA integrity number values were assessedwith the Agilent Bioanalyzer 2100. High-quality samples (RNA integrity number.7.0) were used for transcriptional profiling with the Illumina Human HT-12 v3Expression BeadChip. Genome Studio software (2010.v3) was used for obtain-ing fluorescent intensities. The HT-12 BeadChip contains 48,804 expression and786 control probes. Expression data from 19,306 probes were removed becauseof 1) failure of the probe to align to a genomic or transcriptomic location;2) alignment of the probe to multiple genomic or transcriptomic locations; or3) presence of SNPs in the probe sequence that may affect hybridization effi-ciency using the methodology developed by Barbosa-Morais et al. (32). Theremaining 29,497 probes were processed using nonparametric background cor-rection, followed by quantile normalization with control and expression probesusing the neqc function in the limma package (R v2.13.0) (33). The 16,223 probeswith detection P values ,0.01 in any of the 200 samples were used for fur-ther analysis. Gene expression data have been deposited to Gene ExpressionOmnibus (GEO) with the accession number GSE32512.Statistical analysis. Statistical analyses were conducted using SPSS 17software (SPSS, Chicago, IL). All amino acids, BMI, Matsuda ISI, and early-phase insulin secretion index (InsAUC0–30/GluAUC0–30) were log-transformedto correct for their skewed distribution. Amino acids were compared acrossthe fasting and 2-h glucose categories using the general linear model adjusted
for age and BMI, or additionally for Matsuda ISI or InsAUC0–30/GluAUC0–30
indices. P, 0.003 (corrected for 16 tests by Bonferroni method) was consideredstatistically significant. Associations between amino acid levels and indices ofinsulin sensitivity and insulin secretion were evaluated with Pearson correlationcoefficients. The association of amino acid levels with newly developed type 2diabetes was tested with logistic regression adjusted for confounding factors.Correlations between gene expression levels and phenotypes were calculatedusing the Pearson correlation coefficient. We used the Benjamini–Hochbergfalse discovery rate (FDR) method (34) to correct for multiple comparisons, andconsidered an FDR-adjusted PFDR , 0.05 statistically significant.
For genetic association analysis, unstandardized effect sizes (B [SE]) per copyof the minor allele were estimated by linear regression analysis adjusted for ageand BMI, using untransformed dependent variables, and percentages of B from themean were calculated. P values were calculated using logarithmically trans-formed variables when appropriate. A P , 1.45 3 1024 adjusted for multiplecomparisons by Bonferroni method was considered to be statistically significantgiven a total of 344 tests performed (8 traits 3 43 SNPs). We had $80% power todetect changes in the mean trait value from 1.4 to 5.9% per copy of the minorallele at the significance level of 0.05, depending on the minor allele frequency(Supplementary Fig. 1). Hardy-Weinberg equilibrium was evaluated by x2 test.
RESULTS
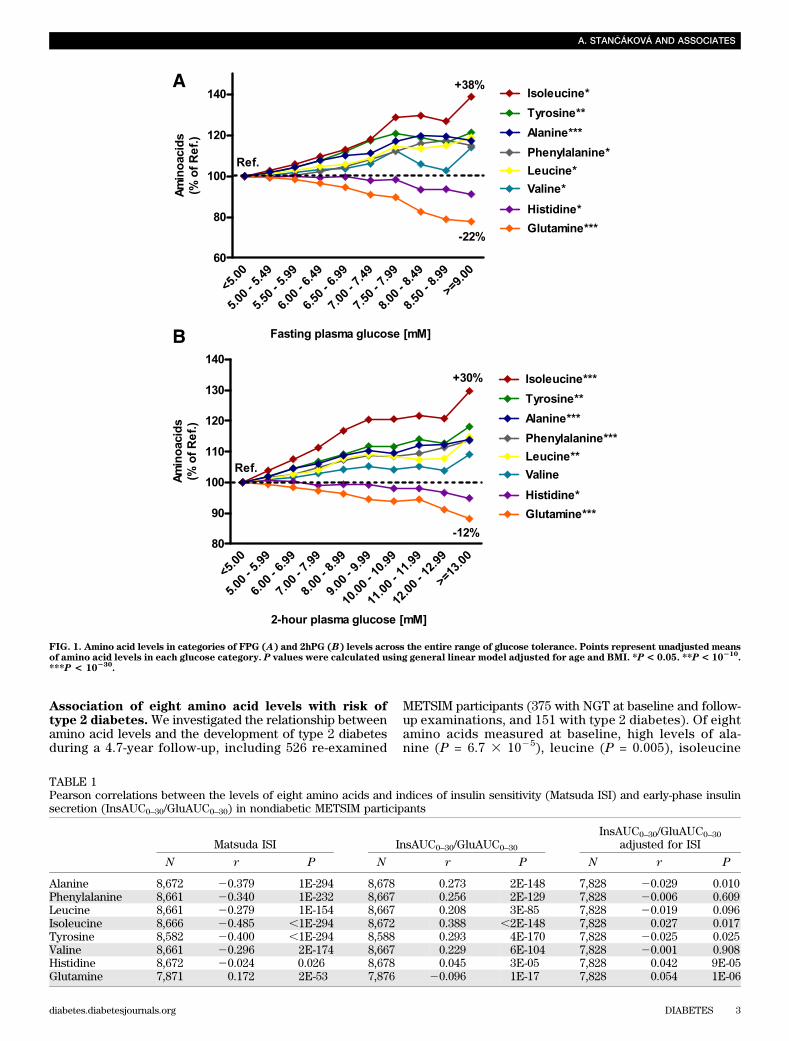
Hyperglycemia and the levels of eight amino acids.Wegenerated categories of fasting (FPG) and 2-h (2hPG)plasma glucose (by 0.5 and 1.0 mmol/L steps, respectively)to investigate the relationship between amino acid levelsand glycemia in participants with normoglycemia, IFG, IGT,and type 2 diabetes. Categories with FPG ,5.0 mmol/L and2hPG ,5.0 mmol/L were set as the reference categories.Across the FPG categories, we observed a significant (P ,0.003) increase in isoleucine level of 38% in the highestglucose category versus the reference category (P = 6.7 310210 adjusted for age and BMI), tyrosine (+21%, P = 1.8 310215), alanine (+17%, P = 4.3 3 10242), phenylalanine(+15%, P = 1.1 3 1029), and leucine (+19%, P = 4.2 3 1024)levels, and a significant decrease in histidine (29%, P =3.33 1024) and glutamine (222%, P = 1.93 10248; Fig. 1A).Similar trends were seen across the 2hPG categories, witha significant increase in isoleucine (+38%, P = 2.7 3 10258),tyrosine (+30%, P = 1.1 3 10210), alanine (+14%, P = 2.3 310246), phenylalanine (+14%, P = 1.1 3 10213), and leucine(+15%, P = 1.0 3 10218) levels, and a significant decrease inhistidine (25%, P = 9.1 3 1026) and glutamine (212%, P =1.4 3 10231) levels with higher 2hPG (Fig. 1B). Theseeffects were more significant in obese (BMI $27 kg/m2)than in nonobese (BMI,27 kg/m2) participants, althoughthe trends were similar in both groups (Supplementary Fig. 2).Overall, most amino acids increased, whereas glutamine andhistidine decreased with higher FPG and 2hPG.
Table 1 shows that all amino acids that were increasedin hyperglycemia negatively correlated with Matsuda ISI(r#20.3, P# 13 102154) and positively (r$ 0.2, P# 3310285) with the InsAUC0–30/GluAUC0–30 index of early-phaseinsulin secretion. For glutamine, which was decreased inhyperglycemia, the correlations were weaker and in theopposite direction (r = 0.17 for Matsuda ISI and 20.12 forInsAUC0–30/GluAUC0–30). Correlations of amino acid levels(except for histidine) with InsAUC0–30/GluAUC0–30 wereweaker than correlations with Matsuda ISI and werelargely attenuated after the adjustment of InsAUC0–30/GluAUC0–30 for Matsuda ISI. Furthermore, additional ad-justment for Matsuda ISI attenuated or abolished most ofthe associations between glucose categories and amino acidlevels (with the exception of valine and histidine), whereasadjustment for InsAUC0–30/GluAUC0–30 attenuated only theassociations for histidine (Supplementary Table 2). Thus,insulin sensitivity seemed to at least partly explain the re-lationship between glucose and amino acid levels.
HYPERGLYCEMIA, SNPS, AND AMINO ACIDS
2 DIABETES diabetes.diabetesjournals.org
Association of eight amino acid levels with risk oftype 2 diabetes.We investigated the relationship betweenamino acid levels and the development of type 2 diabetesduring a 4.7-year follow-up, including 526 re-examined
METSIM participants (375 with NGT at baseline and follow-up examinations, and 151 with type 2 diabetes). Of eightamino acids measured at baseline, high levels of ala-nine (P = 6.7 3 1025), leucine (P = 0.005), isoleucine
FIG. 1. Amino acid levels in categories of FPG (A) and 2hPG (B) levels across the entire range of glucose tolerance. Points represent unadjusted meansof amino acid levels in each glucose category. P values were calculated using general linear model adjusted for age and BMI. *P< 0.05. **P< 10
210.
***P < 10230
.
TABLE 1Pearson correlations between the levels of eight amino acids and indices of insulin sensitivity (Matsuda ISI) and early-phase insulinsecretion (InsAUC0–30/GluAUC0–30) in nondiabetic METSIM participants
Matsuda ISI InsAUC0–30/GluAUC0–30
InsAUC0–30/GluAUC0–30
adjusted for ISI
N r P N r P N r P
Alanine 8,672 20.379 1E-294 8,678 0.273 2E-148 7,828 20.029 0.010Phenylalanine 8,661 20.340 1E-232 8,667 0.256 2E-129 7,828 20.006 0.609Leucine 8,661 20.279 1E-154 8,667 0.208 3E-85 7,828 20.019 0.096Isoleucine 8,666 20.485 ,1E-294 8,672 0.388 ,2E-148 7,828 0.027 0.017Tyrosine 8,582 20.400 ,1E-294 8,588 0.293 4E-170 7,828 20.025 0.025Valine 8,661 20.296 2E-174 8,667 0.229 6E-104 7,828 20.001 0.908Histidine 8,672 20.024 0.026 8,678 0.045 3E-05 7,828 0.042 9E-05Glutamine 7,871 0.172 2E-53 7,876 20.096 1E-17 7,828 0.054 1E-06
A. STAN�CÁKOVÁ AND ASSOCIATES
diabetes.diabetesjournals.org DIABETES 3
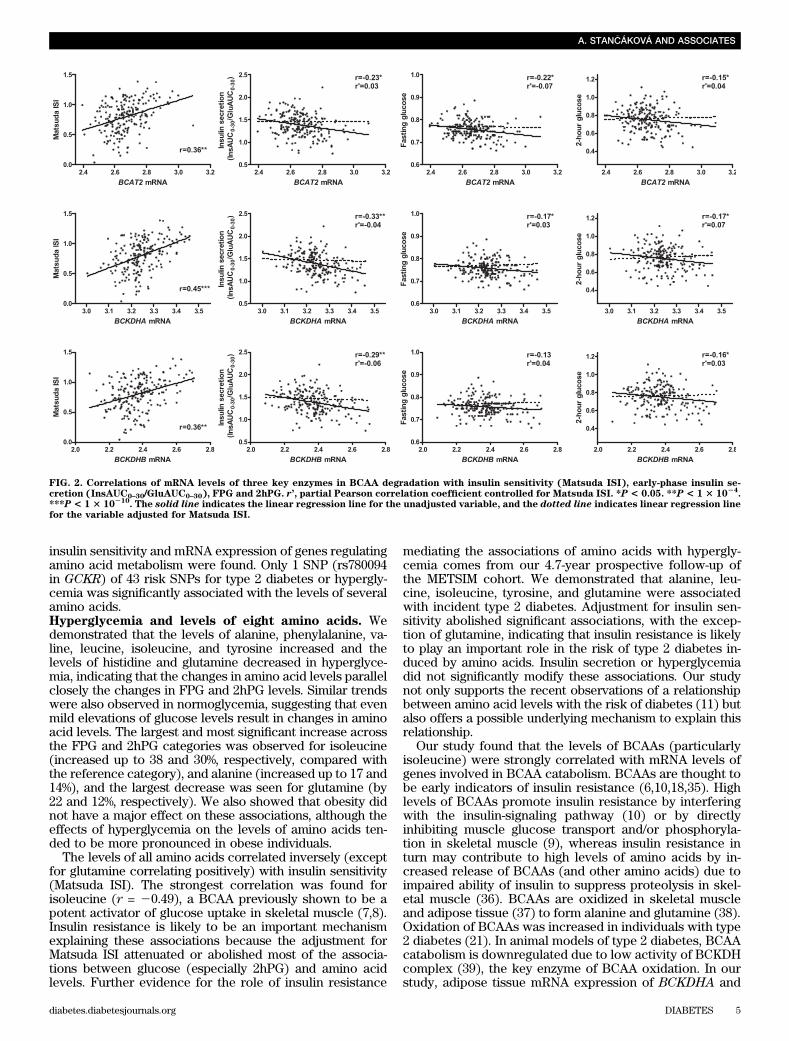
(P = 3.3 3 1025), tyrosine (P = 0.001), and phenylalanine(P = 0.048) were significantly associated with incident di-abetes (adjusted for age and BMI; Table 2). Additionaladjustment for Matsuda ISI alone, or Matsuda ISI andInsAUC0–30/GluAUC0–30, but not for InsAUC0–30/GluAUC0–30alone, abolished statistical significances, suggesting thatthe association of these amino acids with incident diabeteswas mostly explained by insulin resistance. Furtheradjustment for fasting hyperglycemia did not essentiallychange the association, but adjustment for 2-h glucosemade the association for alanine statistically significant (P =0.027). The elevated baseline glutamine level was signifi-cantly associated with a decreased risk of newly developedtype 2 diabetes (P = 4.1 3 1026), and this association per-sisted after the adjustment for Matsuda ISI (P = 1.5 3 1024)or InsAUC0–30/GluAUC0–30 (P = 6.7 3 1026) or both (P =0.048). Additional adjustment for fasting glucose abolishedthis association (P = 0.051). The levels of glutamine weresignificantly lower at baseline in 440 participants who de-veloped abnormal glucose tolerance (IGT and/or IFG, di-abetes) at follow-up, compared with 375 participants whoremained normoglycemic (155.6 vs. 159.6; P = 0.019, ad-justed for age and BMI; Supplementary Table 3). We alsoperformed statistical analyses in a larger sample, includingall 1,624 re-examined participants who did not developdiabetes during the follow-up and 151 participants whodeveloped type 2 diabetes. The results remained essentiallysimilar, although P values were less significant.Gene expression of genes involved in amino acidmetabolism in relation to insulin sensitivity. Analysisof microarray data from subcutaneous adipose tissuesamples of 200 METSIM participants showed that MatsudaISI correlated significantly with mRNA levels of severalgenes involved in the metabolism of alanine, including a keyenzyme, alanine aminotransferase (r = 0.46, PFDR = 9.7 31029); glutamine, including a key enzyme, glutamine syn-thetase (r = 0.44, PFDR = 4.0 3 1028); BCAA, including keyenzymes of BCAA degradation, branched chain amino-acidtransaminase 2 (r = 0.36, PFDR = 2.53 1025) and branched-chain a-keto acid dehydrogenase (BCKDH) A and B (r = 0.45and 0.35, PFDR = 1.3 3 1028 and 3.0 3 1025); and phenylal-anine, tyrosine, and histidine (Supplementary Table 4). Themost consistent results were observed for the BCAA deg-radation, as enzyme-mRNAs correlated positively withMatsuda ISI at almost all steps of the metabolic pathway(Supplementary Fig. 3). Figure 2 shows that the mRNAlevels of three key enzymes in BCAA degradation also
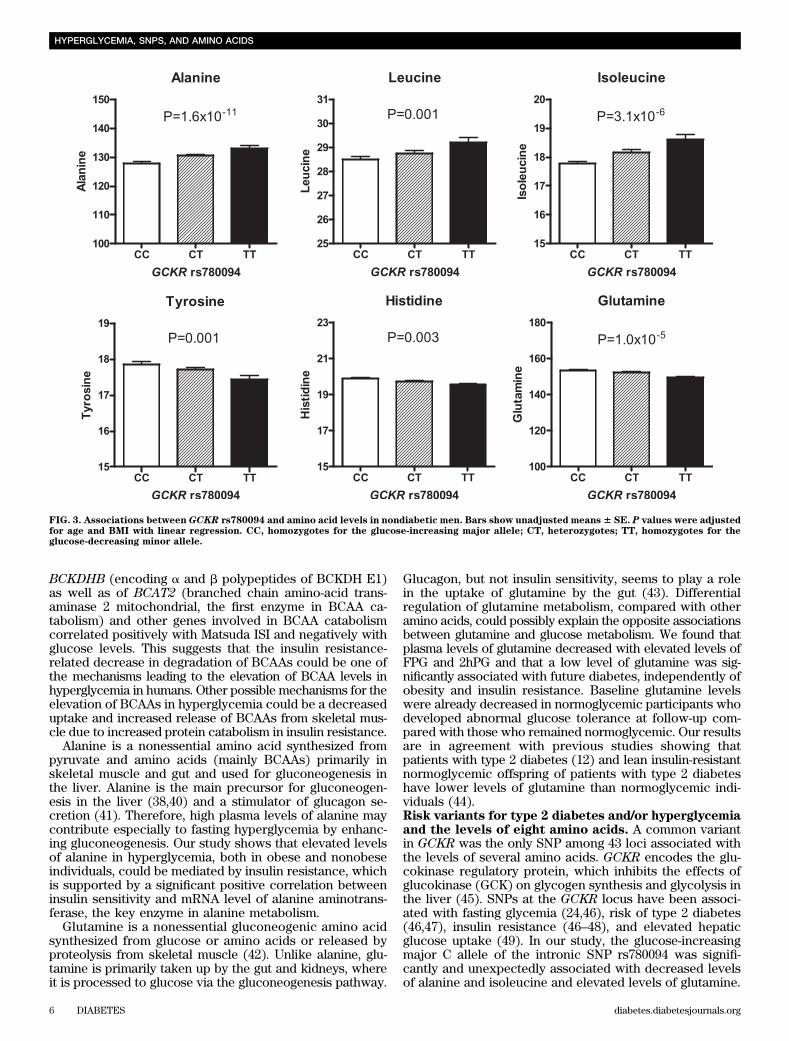
correlated negatively with ISI, FPG, and 2hFP levels.However, these associations disappeared when controlledfor Matsuda ISI. These results indicate that the associationbetween insulin sensitivity and amino acid catabolism (es-pecially BCAA catabolism) also exists at the mRNA leveland add further evidence that insulin sensitivity is likelycontributing to higher BCAA levels in hyperglycemia.Risk variants for type 2 diabetes and/or hyperglycemiaand the levels of eight amino acids. Of the 43 SNPs in-vestigated, only GCKR rs780094 was significantly associ-ated with the levels of several amino acids after Bonferronicorrection for multiple testing (P , 1.45 3 1024) (Fig. 3and Supplementary Table 1). The glucose-increasing C(major) allele was associated with lower levels of alanine(effect size 21.9% per C allele, P = 1.6 3 10211) and iso-leucine (22.3%, P = 3.1 3 1026), and higher levels ofglutamine (+1.2%, P = 1.0 3 1026 adjusted for age andBMI). The C allele also had nominally significant effectson leucine (21.2%, P = 0.001), tyrosine (+1.1%, P = 0.001),and histidine (+0.8%, P = 0.003). These associations didnot change significantly after additional adjustment forFPG, 2hPG, or Matsuda ISI (data not shown), traits knownto be modulated by SNPs of GCKR. Furthermore, theassociation of amino acids with newly developed type 2diabetes was not affected by further adjustment forrs780094.
A number of nominally significant associations of otherSNPs with amino acids were found; the top ranking wasrs8042680 (PRC1). The type 2 diabetes risk allele (A) wasnominally associated with higher levels of leucine (+1.2%,P = 0.002), isoleucine (+1.7%, P = 0.001), and valine (+1.2%,P = 0.001; Supplementary Table 1). The most consistentnominally significant associations were seen for rs75789326(IRS1). The nonrisk allele (G) was associated with lowerleucine (20.8%, P = 0.019), isoleucine (21.5%, P = 0.003),tyrosine (20.7%, P = 0.037), valine (20.7%, P = 0.047), andhistidine (20.5%, P = 0.039) levels.
DISCUSSION
This is the first large, population-based study aiming toinvestigate the relationship between hyperglycemia and 43risk SNPs for type 2 diabetes/hyperglycemia and amino acidlevels. We observed that with increasing FPG and/or 2hPG,the levels of alanine, valine, leucine, isoleucine, phenylala-nine, and tyrosine increased, whereas the levels of histidineand glutamine decreased. Significant correlations between
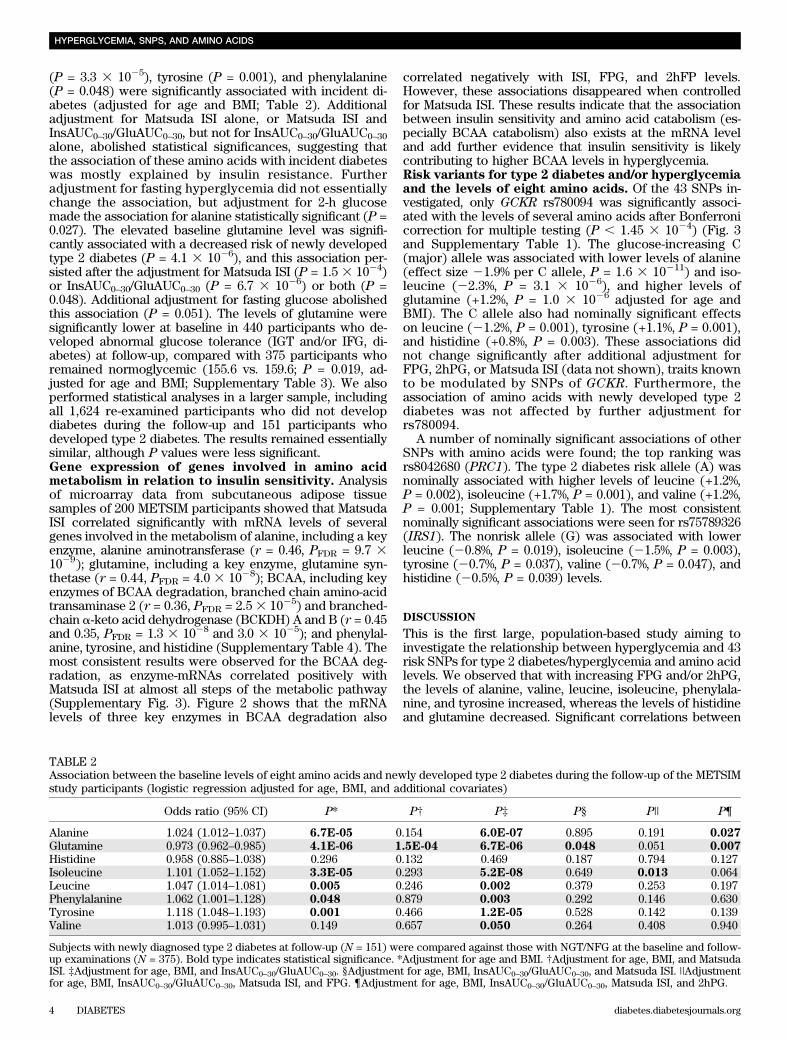
TABLE 2Association between the baseline levels of eight amino acids and newly developed type 2 diabetes during the follow-up of the METSIMstudy participants (logistic regression adjusted for age, BMI, and additional covariates)
Odds ratio (95% CI) P* P† P‡ P§ P|| P¶
Alanine 1.024 (1.012–1.037) 6.7E-05 0.154 6.0E-07 0.895 0.191 0.027
Glutamine 0.973 (0.962–0.985) 4.1E-06 1.5E-04 6.7E-06 0.048 0.051 0.007
Histidine 0.958 (0.885–1.038) 0.296 0.132 0.469 0.187 0.794 0.127Isoleucine 1.101 (1.052–1.152) 3.3E-05 0.293 5.2E-08 0.649 0.013 0.064Leucine 1.047 (1.014–1.081) 0.005 0.246 0.002 0.379 0.253 0.197Phenylalanine 1.062 (1.001–1.128) 0.048 0.879 0.003 0.292 0.146 0.630Tyrosine 1.118 (1.048–1.193) 0.001 0.466 1.2E-05 0.528 0.142 0.139Valine 1.013 (0.995–1.031) 0.149 0.657 0.050 0.264 0.408 0.940
Subjects with newly diagnosed type 2 diabetes at follow-up (N = 151) were compared against those with NGT/NFG at the baseline and follow-up examinations (N = 375). Bold type indicates statistical significance. *Adjustment for age and BMI. †Adjustment for age, BMI, and MatsudaISI. ‡Adjustment for age, BMI, and InsAUC0–30/GluAUC0–30. §Adjustment for age, BMI, InsAUC0–30/GluAUC0–30, and Matsuda ISI. ||Adjustmentfor age, BMI, InsAUC0–30/GluAUC0–30, Matsuda ISI, and FPG. ¶Adjustment for age, BMI, InsAUC0–30/GluAUC0–30, Matsuda ISI, and 2hPG.
HYPERGLYCEMIA, SNPS, AND AMINO ACIDS
4 DIABETES diabetes.diabetesjournals.org
insulin sensitivity and mRNA expression of genes regulatingamino acid metabolism were found. Only 1 SNP (rs780094in GCKR) of 43 risk SNPs for type 2 diabetes or hypergly-cemia was significantly associated with the levels of severalamino acids.Hyperglycemia and levels of eight amino acids. Wedemonstrated that the levels of alanine, phenylalanine, va-line, leucine, isoleucine, and tyrosine increased and thelevels of histidine and glutamine decreased in hyperglyce-mia, indicating that the changes in amino acid levels parallelclosely the changes in FPG and 2hPG levels. Similar trendswere also observed in normoglycemia, suggesting that evenmild elevations of glucose levels result in changes in aminoacid levels. The largest and most significant increase acrossthe FPG and 2hPG categories was observed for isoleucine(increased up to 38 and 30%, respectively, compared withthe reference category), and alanine (increased up to 17 and14%), and the largest decrease was seen for glutamine (by22 and 12%, respectively). We also showed that obesity didnot have a major effect on these associations, although theeffects of hyperglycemia on the levels of amino acids ten-ded to be more pronounced in obese individuals.
The levels of all amino acids correlated inversely (exceptfor glutamine correlating positively) with insulin sensitivity(Matsuda ISI). The strongest correlation was found forisoleucine (r = 20.49), a BCAA previously shown to be apotent activator of glucose uptake in skeletal muscle (7,8).Insulin resistance is likely to be an important mechanismexplaining these associations because the adjustment forMatsuda ISI attenuated or abolished most of the associa-tions between glucose (especially 2hPG) and amino acidlevels. Further evidence for the role of insulin resistance
mediating the associations of amino acids with hypergly-cemia comes from our 4.7-year prospective follow-up ofthe METSIM cohort. We demonstrated that alanine, leu-cine, isoleucine, tyrosine, and glutamine were associatedwith incident type 2 diabetes. Adjustment for insulin sen-sitivity abolished significant associations, with the excep-tion of glutamine, indicating that insulin resistance is likelyto play an important role in the risk of type 2 diabetes in-duced by amino acids. Insulin secretion or hyperglycemiadid not significantly modify these associations. Our studynot only supports the recent observations of a relationshipbetween amino acid levels with the risk of diabetes (11) butalso offers a possible underlying mechanism to explain thisrelationship.
Our study found that the levels of BCAAs (particularlyisoleucine) were strongly correlated with mRNA levels ofgenes involved in BCAA catabolism. BCAAs are thought tobe early indicators of insulin resistance (6,10,18,35). Highlevels of BCAAs promote insulin resistance by interferingwith the insulin-signaling pathway (10) or by directlyinhibiting muscle glucose transport and/or phosphoryla-tion in skeletal muscle (9), whereas insulin resistance inturn may contribute to high levels of amino acids by in-creased release of BCAAs (and other amino acids) due toimpaired ability of insulin to suppress proteolysis in skel-etal muscle (36). BCAAs are oxidized in skeletal muscleand adipose tissue (37) to form alanine and glutamine (38).Oxidation of BCAAs was increased in individuals with type2 diabetes (21). In animal models of type 2 diabetes, BCAAcatabolism is downregulated due to low activity of BCKDHcomplex (39), the key enzyme of BCAA oxidation. In ourstudy, adipose tissue mRNA expression of BCKDHA and
FIG. 2. Correlations of mRNA levels of three key enzymes in BCAA degradation with insulin sensitivity (Matsuda ISI), early-phase insulin se-cretion (InsAUC0–30/GluAUC0–30), FPG and 2hPG. r’, partial Pearson correlation coefficient controlled for Matsuda ISI. *P < 0.05. **P < 1 3 10
24.
***P < 1 3 10210
. The solid line indicates the linear regression line for the unadjusted variable, and the dotted line indicates linear regression linefor the variable adjusted for Matsuda ISI.
A. STAN�CÁKOVÁ AND ASSOCIATES
diabetes.diabetesjournals.org DIABETES 5
BCKDHB (encoding a and b polypeptides of BCKDH E1)as well as of BCAT2 (branched chain amino-acid trans-aminase 2 mitochondrial, the first enzyme in BCAA ca-tabolism) and other genes involved in BCAA catabolismcorrelated positively with Matsuda ISI and negatively withglucose levels. This suggests that the insulin resistance-related decrease in degradation of BCAAs could be one ofthe mechanisms leading to the elevation of BCAA levels inhyperglycemia in humans. Other possible mechanisms for theelevation of BCAAs in hyperglycemia could be a decreaseduptake and increased release of BCAAs from skeletal mus-cle due to increased protein catabolism in insulin resistance.
Alanine is a nonessential amino acid synthesized frompyruvate and amino acids (mainly BCAAs) primarily inskeletal muscle and gut and used for gluconeogenesis inthe liver. Alanine is the main precursor for gluconeogen-esis in the liver (38,40) and a stimulator of glucagon se-cretion (41). Therefore, high plasma levels of alanine maycontribute especially to fasting hyperglycemia by enhanc-ing gluconeogenesis. Our study shows that elevated levelsof alanine in hyperglycemia, both in obese and nonobeseindividuals, could be mediated by insulin resistance, whichis supported by a significant positive correlation betweeninsulin sensitivity and mRNA level of alanine aminotrans-ferase, the key enzyme in alanine metabolism.
Glutamine is a nonessential gluconeogenic amino acidsynthesized from glucose or amino acids or released byproteolysis from skeletal muscle (42). Unlike alanine, glu-tamine is primarily taken up by the gut and kidneys, whereit is processed to glucose via the gluconeogenesis pathway.
Glucagon, but not insulin sensitivity, seems to play a rolein the uptake of glutamine by the gut (43). Differentialregulation of glutamine metabolism, compared with otheramino acids, could possibly explain the opposite associationsbetween glutamine and glucose metabolism. We found thatplasma levels of glutamine decreased with elevated levels ofFPG and 2hPG and that a low level of glutamine was sig-nificantly associated with future diabetes, independently ofobesity and insulin resistance. Baseline glutamine levelswere already decreased in normoglycemic participants whodeveloped abnormal glucose tolerance at follow-up com-pared with those who remained normoglycemic. Our resultsare in agreement with previous studies showing thatpatients with type 2 diabetes (12) and lean insulin-resistantnormoglycemic offspring of patients with type 2 diabeteshave lower levels of glutamine than normoglycemic indi-viduals (44).Risk variants for type 2 diabetes and/or hyperglycemiaand the levels of eight amino acids. A common variantin GCKR was the only SNP among 43 loci associated withthe levels of several amino acids. GCKR encodes the glu-cokinase regulatory protein, which inhibits the effects ofglucokinase (GCK) on glycogen synthesis and glycolysis inthe liver (45). SNPs at the GCKR locus have been associ-ated with fasting glycemia (24,46), risk of type 2 diabetes(46,47), insulin resistance (46–48), and elevated hepaticglucose uptake (49). In our study, the glucose-increasingmajor C allele of the intronic SNP rs780094 was signifi-cantly and unexpectedly associated with decreased levelsof alanine and isoleucine and elevated levels of glutamine.
FIG. 3. Associations between GCKR rs780094 and amino acid levels in nondiabetic men. Bars show unadjusted means6 SE. P values were adjustedfor age and BMI with linear regression. CC, homozygotes for the glucose-increasing major allele; CT, heterozygotes; TT, homozygotes for theglucose-decreasing minor allele.
HYPERGLYCEMIA, SNPS, AND AMINO ACIDS
6 DIABETES diabetes.diabetesjournals.org
Mechanisms explaining the relationship of rs780094 ofGCKR with amino acids are unknown, but the associationwith low levels of alanine could be a consequence of re-duced glycolysis induced by GCKR resulting in decreasedproduction of pyruvate and its conversion to alanine. Onthe basis of our study, it remains unclear whether theeffects of rs780094 of GCKR on amino acid metabolism areprimary or secondary. Although in our study the C allele ofrs780094 was associated with both FPG and 2hPG, as wellas with Matsuda ISI, the association of GCKR with thelevels of amino acids was independent of these variables(data not shown). The GCKR variant did not affect theassociation of amino acids with newly developed type 2diabetes, which agrees with its modest effect on aminoacid levels.
Although several type 2 diabetes/hyperglycemia riskSNPs showed nominally significant associations with thelevels of selected amino acids, the most consistent resultswere found for rs7578326 near IRS1. The major A majorallele previously linked to type 2 diabetes risk in a genome-wide association study (26) was nominally associated withelevated levels of several amino acids (valine, leucine,isoleucine, tyrosine, histidine). IRS1 encodes the insulinreceptor substrate 1, an important component of the insulin-signaling pathway, and its gene variant affects insulinresistance and adiposity (50). The association of IRS1 withamino acid levels, if confirmed, could contribute to evi-dence for a causal relationship between insulin resistanceand amino acid metabolism. The type 2 diabetes risk alleleof the rs8042680 in PRC1, encoding protein regulator ofcytokinesis 1, was associated specifically but nominallywith higher levels of all three BCAAs. PRC1 is not knownto have a function in amino acid metabolism. These resultssuggest that the relationship between the levels of glucoseand amino acids could be determined, at least in part, bygenes regulating hyperglycemia or the risk of diabetes.
This study has limitations. Only Finnish men were in-cluded, and therefore, we do not know whether our resultsare applicable to women and to different ethnic or racialgroups. We had only a modest statistical power to dem-onstrate statistically significant associations of gene var-iants with amino acids.
In conclusion, our large, population-based study showsthat levels of branched-chain, aromatic amino acids andalanine increase whereas glutamine and histidine decreasewith increasing FPG and/or 2hPG levels. These associa-tions seemed to be mediated by insulin resistance, at leastin part, supported by correlations of expression of genesinvolved in amino acid metabolism with the Matsuda ISI.Among the 43 loci associated with risk for hyperglycemiaor type 2 diabetes, only GCKR rs780094 was significantlyassociated with several amino acids, especially with thelevels of alanine.
ACKNOWLEDGMENTS
This work was supported by the Academy of Finland (A.S.,M.L., SALVE program to M.A.-K.), the Finnish DiabetesResearch Foundation (M.L.), the Finnish CardiovascularResearch Foundation (M.L., M.A.-K.), the Jenny and AnttiWihuri Foundation (A.J.K.), an EVO grant from the KuopioUniversity Hospital (5263), DK062370 to M.B., 1Z01 HG000024to F.S.C., and National Institutes of Health Grant HL-095056 toP.P. and Grant HL-28481 to P.P. and A.J.L.
No potential conflicts of interest relevant to this articlewere reported.
A.S. wrote the manuscript and researched the data. M.C.,N.K.S., P.P., and A.J.L. performed the mRNA experiments,analyzed the data, and reviewed and edited the manu-script. P.S. conceived, designed, and performed the NMRexperiments, analyzed the data, and reviewed and editedthe manuscript. A.J.K. analyzed the NMR data, contributedanalysis tools, and reviewed and edited the manuscript. H.C.,J.Pa., and J.Pi. researched the data and reviewed andedited the manuscript. L.L.B., M.A.M., and F.S.C. designedand performed genotyping and reviewed and edited themanuscript. M.B. contributed analysis tools and reviewedand edited the manuscript. J.K. designed the study andreviewed the manuscript. M.A.-K. conceived and designedthe NMR experiments, analyzed the data, and reviewed andedited the manuscript. M.L. designed the study, contributedto discussion, and reviewed and edited the manuscript. M.L.is the guarantor of this work and, as such, had full access toall of the data in the study and takes responsibility for theintegrity of the data and the accuracy of the data analysis.
REFERENCES
1. Felig P. Amino acid metabolism in man. Annu Rev Biochem 1975;44:933–955
2. Jefferson LS, Li JB, Rannels SR. Regulation by insulin of amino acid re-lease and protein turnover in the perfused rat hemicorpus. J Biol Chem1977;252:1476–1483
3. Biolo G, Williams BD, Fleming RY, Wolfe RR. Insulin action on muscleprotein kinetics and amino acid transport during recovery after resistanceexercise. Diabetes 1999;48:949–957
4. van Loon LJ, Kruijshoop M, Menheere PP, Wagenmakers AJ, Saris WH,Keizer HA. Amino acid ingestion strongly enhances insulin secretion inpatients with long-term type 2 diabetes. Diabetes Care 2003;26:625–630
5. Floyd JC Jr, Fajans SS, Conn JW, Knopf RF, Rull J. Stimulation of insulinsecretion by amino acids. J Clin Invest 1966;45:1487–1502
6. Newgard CB, An J, Bain JR, et al. A branched-chain amino acid-relatedmetabolic signature that differentiates obese and lean humans and con-tributes to insulin resistance. Cell Metab 2009;9:311–326
7. Doi M, Yamaoka I, Nakayama M, Mochizuki S, Sugahara K, Yoshizawa F.Isoleucine, a blood glucose-lowering amino acid, increases glucose uptakein rat skeletal muscle in the absence of increases in AMP-activated proteinkinase activity. J Nutr 2005;135:2103–2108
8. Doi M, Yamaoka I, Nakayama M, Sugahara K, Yoshizawa F. Hypoglycemiceffect of isoleucine involves increased muscle glucose uptake and wholebody glucose oxidation and decreased hepatic gluconeogenesis. AmJ Physiol Endocrinol Metab 2007;292:E1683–E1693
9. Krebs M, Krssak M, Bernroider E, et al. Mechanism of amino acid-inducedskeletal muscle insulin resistance in humans. Diabetes 2002;51:599–605
10. Patti ME, Brambilla E, Luzi L, Landaker EJ, Kahn CR. Bidirectional mod-ulation of insulin action by amino acids. J Clin Invest 1998;101:1519–1529
11. Wang TJ, Larson MG, Vasan RS, et al. Metabolite profiles and the risk ofdeveloping diabetes. Nat Med 2011;17:448–453
12. Menge BA, Schrader H, Ritter PR, et al. Selective amino acid deficiency inpatients with impaired glucose tolerance and type 2 diabetes. Regul Pept2010;160:75–80
13. Fiehn O, Garvey WT, Newman JW, Lok KH, Hoppel CL, Adams SH.Plasma metabolomic profiles reflective of glucose homeostasis in non-diabetic and type 2 diabetic obese African-American women. PLoS ONE2010;5:e15234
14. Flakoll PJ, Wentzel LS, Rice DE, Hill JO, Abumrad NN. Short-term regu-lation of insulin-mediated glucose utilization in four-day fasted humanvolunteers: role of amino acid availability. Diabetologia 1992;35:357–366
15. Schwenk WF, Haymond MW. Decreased uptake of glucose by humanforearm during infusion of leucine, isoleucine, or threonine. Diabetes 1987;36:199–204
16. Pisters PW, Restifo NP, Cersosimo E, Brennan MF. The effects of euglycemichyperinsulinemia and amino acid infusion on regional and whole body glu-cose disposal in man. Metabolism 1991;40:59–65
17. Tappy L, Acheson K, Normand S, et al. Effects of infused amino acids onglucose production and utilization in healthy human subjects. Am J Physiol1992;262:E826–E833
18. Huffman KM, Shah SH, Stevens RD, et al. Relationships between circu-lating metabolic intermediates and insulin action in overweight to obese,inactive men and women. Diabetes Care 2009;32:1678–1683
A. STAN�CÁKOVÁ AND ASSOCIATES
diabetes.diabetesjournals.org DIABETES 7
19. Macotela Y, Emanuelli B, Bång AM, et al. Dietary leucine—an environ-mental modifier of insulin resistance acting on multiple levels of metabo-lism. PLoS ONE 2011;6:e21187
20. Layman DK, Walker DA. Potential importance of leucine in treatment ofobesity and the metabolic syndrome. J Nutr 2006;136(Suppl.):319S–323S
21. Henry RR. Protein content of the diabetic diet. Diabetes Care 1994;17:1502–1513
22. Krebs M, Brehm A, Krssak M, et al. Direct and indirect effects of aminoacids on hepatic glucose metabolism in humans. Diabetologia 2003;46:917–925
23. McCarthy MI, Zeggini E. Genome-wide association studies in type 2 di-abetes. Curr Diab Rep 2009;9:164–171
24. Dupuis J, Langenberg C, Prokopenko I, et al.; DIAGRAM Consortium;GIANT Consortium; Global BPgen Consortium; Anders Hamsten on behalfof Procardis Consortium; MAGIC investigators. New genetic loci impli-cated in fasting glucose homeostasis and their impact on type 2 diabetesrisk. Nat Genet 2010;42:105–116
25. Saxena R, Hivert MF, Langenberg C, et al.; GIANT consortium; MAGICinvestigators. Genetic variation in GIPR influences the glucose and insulinresponses to an oral glucose challenge. Nat Genet 2010;42:142–148
26. Voight BF, Scott LJ, Steinthorsdottir V, et al.; MAGIC investigators; GIANTConsortium. Twelve type 2 diabetes susceptibility loci identified throughlarge-scale association analysis. Nat Genet 2010;42:579–589
27. Stancáková A, Javorský M, Kuulasmaa T, Haffner SM, Kuusisto J, Laakso M.Changes in insulin sensitivity and insulin release in relation to glycemia andglucose tolerance in 6,414 Finnish men. Diabetes 2009;58:1212–1221
28. Genuth S, Alberti KG, Bennett P, et al.; Expert Committee on the Diagnosisand Classification of Diabetes Mellitus. Follow-up report on the diagnosisof diabetes mellitus. Diabetes Care 2003;26:3160–3167
29. Soininen P, Kangas AJ, Würtz P, et al. High-throughput serum NMR me-tabonomics for cost-effective holistic studies on systemic metabolism.Analyst (Lond) 2009;134:1781–1785
30. Inouye M, Kettunen J, Soininen P, et al. Metabonomic, transcriptomic, andgenomic variation of a population cohort. Mol Syst Biol 2010;6:441
31. Matsuda M, DeFronzo RA. Insulin sensitivity indices obtained from oralglucose tolerance testing: comparison with the euglycemic insulin clamp.Diabetes Care 1999;22:1462–1470
32. Barbosa-Morais NL, Dunning MJ, Samarajiwa SA, et al. A re-annotationpipeline for Illumina BeadArrays: improving the interpretation of geneexpression data. Nucleic Acids Res 2010;38:e17
33. Shi W, Oshlack A, Smyth GK. Optimizing the noise versus bias trade-off forIllumina whole genome expression BeadChips. Nucleic Acids Res 2010;38:e204
34. Benjamini Y, Hochberg Y. Controlling the false discovery rate: a practicaland powerful approach to multiple testing. J R Stat Soc Ser B 1995;57:289–300
35. Shaham O, Wei R, Wang TJ, et al. Metabolic profiling of the human re-sponse to a glucose challenge reveals distinct axes of insulin sensitivity.Mol Syst Biol 2008;4:214
36. Luzi L, Castellino P, DeFronzo RA. Insulin and hyperaminoacidemia reg-ulate by a different mechanism leucine turnover and oxidation in obesity.Am J Physiol 1996;270:E273–E281
37. Rosenthal J, Angel A, Farkas J. Metabolic fate of leucine: a significant sterolprecursor in adipose tissue and muscle. Am J Physiol 1974;226:411–418
38. Felig P, Wahren J, Sherwin R, Palaiologos G. Amino acid and proteinmetabolism in diabetes mellitus. Arch Intern Med 1977;137:507–513
39. Kuzuya T, Katano Y, Nakano I, et al. Regulation of branched-chain aminoacid catabolism in rat models for spontaneous type 2 diabetes mellitus.Biochem Biophys Res Commun 2008;373:94–98
40. Felig P, Pozefsky T, Marliss E, Cahill GF Jr. Alanine: key role in gluco-neogenesis. Science 1970;167:1003–1004
41. Müller WA, Faloona GR, Unger RH. The effect of alanine on glucagonsecretion. J Clin Invest 1971;50:2215–2218
42. Stumvoll M, Perriello G, Meyer C, Gerich J. Role of glutamine in humancarbohydrate metabolism in kidney and other tissues. Kidney Int 1999;55:778–792
43. Abumrad NN, Kim S, Molina PE. Regulation of gut glutamine metabolism:role of hormones and cytokines. Proc Nutr Soc 1995l;54:525–533
44. Perseghin G, Ghosh S, Gerow K, Shulman GI. Metabolic defects in leannondiabetic offspring of NIDDM parents: a cross-sectional study. Diabetes1997;46:1001–1009
45. de la Iglesia N, Mukhtar M, Seoane J, Guinovart JJ, Agius L. The role of theregulatory protein of glucokinase in the glucose sensory mechanism of thehepatocyte. J Biol Chem 2000;275:10597–10603
46. Vaxillaire M, Cavalcanti-Proença C, Dechaume A, et al.; DESIR StudyGroup. The common P446L polymorphism in GCKR inversely modulatesfasting glucose and triglyceride levels and reduces type 2 diabetes risk in theDESIR prospective general French population. Diabetes 2008;57:2253–2257
47. Sparsø T, Andersen G, Nielsen T, et al. The GCKR rs780094 polymorphismis associated with elevated fasting serum triacylglycerol, reduced fastingand OGTT-related insulinaemia, and reduced risk of type 2 diabetes. Dia-betologia 2008;51:70–75
48. Ingelsson E, Langenberg C, Hivert MF, et al.; MAGIC investigators. De-tailed physiologic characterization reveals diverse mechanisms for novelgenetic Loci regulating glucose and insulin metabolism in humans. Di-abetes 2010;59:1266–1275
49. Rees MG, Wincovitch S, Schultz J, et al. Cellular characterization of theGCKR P446L variant associated with type 2 diabetes risk. Diabetologia2011;55:114–22
50. Kilpeläinen TO, Zillikens MC, Stan�cákova A, et al. Genetic variation nearIRS1 associates with reduced adiposity and an impaired metabolic profile.Nat Genet 2011;43:753–760
HYPERGLYCEMIA, SNPS, AND AMINO ACIDS
8 DIABETES diabetes.diabetesjournals.org