Embed Size (px)
Citation preview

_ 156 _
Glycative Stress ResearchOnline edition : ISSN 2188-3610
Print edition : ISSN 2188-3602Received : June 24, 2016
Accepted : August 20, 2016Published online : September 30, 2016
Glycative Stress Research 2016; 3 (3): 156-171(c) Society for Glycative Stress Research
Corresponding author: Yuri IshiiClinical Research Group, Health Science Research Center, FANCL Research Institute, FANCL Corporation12-13 Kamishinano, Totsuka-ku, Yokohama-shi, Kanagawa 244-0806, JapanTEL: +81-45-820-3419, E-mail: [email protected] for Co-author: Okada Y, [email protected]; Matsuoka S, [email protected]; Shen M, [email protected]; Yui K, [email protected]; Yagi M, [email protected]; Yonei Y, [email protected]
Original Article
Yuri Ishii 1), Yumika Okada 1), Sayuri Matsuoka 1), Manzhen Shen 1), Kei Yui 1), Masayuki Yagi 2), Yoshikazu Yonei 2)
1) FANCL Research Institute, FANCL Corporation, Yokohama, Kanagawa2) Anti-Aging Medical Research Center/Glycative Stress Research Center, Graduate School of Life and Medical Sciences, Doshisha University, Kyotanabe, Kyoto
SummaryObjective and Methods: Healthy Japanese women aged from 41 to 69 years old with saggy skin and winkles were thesubjects of a randomized, placebo-controlled, double-blind clinical study on improvements in skin condition after ingestinga test food for 12 weeks. The active food contained 462 mg Silybum marianum extract (138 mg silybin), 70 mg soy extract (10 mg saponin B and 25 mg isoflavone), 900 mg collagen peptide, 32 mg bifidobacteria (2 billion or more bifidobacteria BB536), and 83 mg apple extract (65 mg apple polyphenol) in 6 tablets taken daily. The control food was a placebo formulation.Fifty-six subjects (51.5 ± 8.0 years) were randomly divided into an active food group (n = 28) and a placebo food group (n = 28). Before and after ingesting the test food, we measured skin parameters (skin viscoelasticity, wrinkle replica analysis,color difference, stratum corneum moisture content and transepidermal water loss), oxidative stress markers (in blood and stratum corneum), glycative stress markers (skin and serum), and inflammatory markers (blood). As a subjective assessment measure, we implemented an anti-aging quality of life (AAQoL) questionnaire and a feelings questionnaire (only after the use of supplements). Results: In the active food group, an improvement in wrinkles and suppression of the decline in skin viscoelasticity wereconfirmed. Regarding oxidative stress markers, the decrease in the level of the deglycation protein DJ-1 in the stratum corneumwas alleviated, but the results were not superior in the active food group for glycative stress markers or an inflammatory marker. During the test period, there were no serious adverse events. Conclusions: The study showed that the active food could support the maintenance of skin elasticity and improve winkles in the skin of middle-aged women.
Effect of supplement containing Silybum marianum extract, soy extract, collagen peptide, bifidobacteria and apple extract on skin: A randomized placebo-con-trolled, double-blind, parallel group comparative clinical study.
Introduction Physiological changes in the body occur with age in
everyone. Unlike the internal organs, photo-aging by UV rays is known to have an impact on aging of the skin in addition to physiological aging 1, 2). With chronic exposure to sunlight and UV rays, reactive oxygen species are generated in the skin and damage the DNA. At the same time, inhibitionof tyrosine-phosphatase oxidation 3) ultimately promotes theinduction of the transcription factor AP-1 and the transfer of matrix metalloproteinase (MMP) 4). Collagen production in fibroblasts decreases, and the collagen and elastin that are thestructural components of the dermis become decomposed 5, 6).
As a result, collagen becomes denatured and loses its elasticitythrough cross linking, and elastin forms an irregular elastin fiber network; therefore, wrinkles form with the loss of function and structure of the dermis that is gradually caused by chronic irradiation with UV rays. In order to protect the body from damage by UV rays, the generation of melanin in pigment cells is promoted in skin that has been exposed to UV light through the actions of melanocyte stimulating hormone (α-MSH) and adrenocorticotropic hormone (ACTH).These are secreted by epidermal keratinocytes 7), and melaninthat has not been metabolized remains as a discoloration. In recent years, the usefulness of stratum corneum DJ-1 protein
KEY WORDS: supplements, wrinkles, elasticity, silybin, apple polyphenol

_ 157 _
Glycative Stress Research
as an index of anti-oxidative defenses from UV rays has beenreported in a study on stratum corneum markers. There havebeen many studies on photo-aging in various fields 8). Under these circumstances, a type of advanced glycation end product(AGE) named Nε- carboxymethyl-lysine (CML) is generated in a non-enzymatic oxidation reaction between carbonyl compounds and sugars such as glucose, which modifies proteins. This has been demonstrated in elastic fibers in solarelastosis degeneration, and attention has been focused on glycative stress as a factor associated with aging of the skin 9).As such, aging of the skin can be said to occur because of both oxidation and glycation 10-12).
For women, aging of the skin not only changes their appearance, but impacts on their mental state and lowers thequality of life (QOL). From this perspective, the developmentof an anti-aging technology for the skin has been an importantissue both medically and cosmetically. Presently, the techniquesthat are provided as medical treatments include dermatologicaltreatments (external preparations, peeling, laser, hyaluronic acid injection), cosmetic surgery, medicines taken internally (such as hormone treatments), and regenerative medicines (injections of autologous cultured fibroblasts, isolagen). These techniques have been developed and used in practical settings. On the other hand, foods that have anti-oxidant or anti-glycation effects and lead to improvements in skin condition may be used as common measures, in addition tothe prevention and improvements achieved through sunscreensand cosmetics. From the various food materials for whichsuch effects are expected, we focused on five: Silybum marianum extract, soy extract, collagen peptide, bifidobacteria,and apple extract. Silybum marianum is widely found in southern Europe, northern Africa, and Asia, and its seeds contain flavonolignans such as silybin. Anti-oxidant effects 13),anti-glycation effects 14), production of collagen in the dermis 15),and retinoic acid-like activity 16, 17) have been indicated with its use. Furthermore, a 16-week long placebo-controlled double-blind parallel group comparative study showed that the intake of 462 mg Silybum marianum extract (138 mg silybin) had a wrinkle-improvement effect 15). Soy extracts containing components such as saponin and isoflavone have also been reported to have anti-oxidant effects 18), inhibitory effects on increases in blood glucose 19), a lowering effect on protein carbonyl formation through proteasome activation, and wrinkle-improvement effects in middle-aged women after a 10-week course of 55 mg saponin B 20-22). Soy isoflavone not only has anti-glycation effects 23) and anti-oxidant effects 24, 25), but has also been reported to improve the amount of collagen in the dermis and increase the amountof elastin in a test that targeted 30 perimenopausal women (a six-month course of 100 mg isoflavone daily) 26), and improved wrinkles and skin elasticity in a test that targeted women in their late 30s to early 40s (a 12 week course of 40 mg isoflavone daily) 27). Collagen peptides are derived from hydrolyzed gelatin and include tripeptides with a molecularweight of about 300 Da. These have been reported to promotecollagen synthesis more effectively than non-degradablecollagen 20). Bifidobacteria refers to the genus Bifidobacteriumthat is found in the intestine and decomposes lactose and oligosaccharides to produce lactic and acetic acid, lowering the pH in the intestine significantly and adjusting the environment of the intestine 28), improving bowel movements 29),and relieving allergy symptoms such as hay fever 30). As for the skin, the ingestion of drinks that contain two billion bifidobacteria (BB536) has been reported to improve
subjective symptoms such as firmness and pore size 31). Appleextract contains a large amount of polyphenols such as procyanidin, chlorogenic acid, and phlorizin, and has been shown to have anti-oxidant effects 32, 33), anti-glycation effects 34 -36), and inhibitory actions on melanin production 37).In addition, the suppression of wrinkle generation by UV irradiation has been reported in an experiment that used hairless mice. The mechanism was by the suppression ofsinglet oxygen generation by UV irradiation, and the suppression of a series of phenomena promoted by oxidativestress (oxidative carbonyl formation, a decrease in proteasomeactivity, transcription factor AP-1 activation, increased production of MMP-1, and decreased production of TIMP-1) 38). In a human experiment that used both 2.6 g collagen peptide containing a large amount of tripeptide and 83 mgapple extract, improvements in the skin condition were expected, such as improved elasticity 38). As we have discussedso far, there have been many reports on the usefulness of these raw food materials for improving the skin condition andtheir anti-oxidant and anti-glycation effects through in vitro studies, animal experiments, or clinical studies; however, there has not yet been a report on the effectiveness of their use in combination. Thus, we developed a supplement in which these raw materials were combined, and evaluated changes in the skin condition along with changes in oxidativeand glycative stress markers by using middle-aged women as subjects. In this manner, we examined the usefulness of the supplement contained present foodstuffs in a randomized placebo-controlled double-blind parallel group comparative clinical study.
Methods1. Subjects
Subjects were healthy Japanese women between 41 and69 years old who were concerned by sagging skin and wrinkles. However, we excluded those who met the followingexclusion criteria: 1) those who were allergic to soy, collagen,dairy products, and apples, 2) those who were taking supplement(s) that contain Silybum marianum, soy saponin,soy isoflavone, collagen, lactic acid bacteria, and/or appleextract, 3) those who were being treated or seen by a physicianfor liver disease or kidney disease, 4) those who were being treated or seen by a physician for type II diabetes, 5) those with atopic dermatitis, 6) those with a serious medical history, 7) those who were being treated for a disease, 8) those who were participating in other clinical studies when this study began, 9) those who had difficulties maintaining their life style (diet, exercise, sleep, skin care), 10) those who had difficulty making entries in a journal and completing a diet questionnaire, 11) those who worked at a company that develops, manufactures, or sells health food or whose family members work at such a company, and 12) those who were deemed unfit as subjects by the investigating physician.
During the test period (from screening to the completion of the final test), subjects were required to adhere to the following: 1) avoid excessive eating, extreme exercise, and lack of sleep, 2) fast from 10 pm the night before until the end of the test process (water was allowed), 3) abstain from alcohol starting from the day before until the end of the test process, 4) sleep at least six hours during the night before the test day, 5) avoid smoking on the test day from the time the

Table 1. Composition of test food
content(active ingredient)
quantity (mg/day)Active Placebo
Silybum marianum extract(silibin)
Soy extract(sapnin B, isoflavon)
Bifidobacteria(Bifidobacterium longum BB536)
Apple extract(apple polyphenol)
excipient (cellulose, trehalose, erythritol,
scallop shell powder, calcium stearate)
Collagen peptide
total
462(138)
70(10, 25)
32( > 2 billion cell )
83(65)
853
900
2,400
0
0
0
0
2,400
0
2,400
_ 158 _
Skin Improvement Effects of Anti-aging Supplement
subject wakes up until the test process is completed, 6) avoid changes in life style (such as quitting or beginning exercise, starting or quitting drinking), 7) avoid excessive exposure to the sun or traveling to places with strong UV rays, 8) do not start taking new health foods (including vitamins and nutritional drinks), 9) do not change skin care products and methods, 10) avoid the use of new bath products and body care products, 11) if moisturizing cream is needed for extremely dry skin, avoid its use on the measured area (face and arms), and make sure to enter such use in the journal, 12) avoid activities that impact the quality of the skin such as peeling, visiting beauty salons, scrubbing, and 13) avoid shaving the face or treating excess hair for two days before the test day.
2. Test food The test food containing 462 mg/day Silybum marianum
extract (138 mg/day silybin), 70 mg/day soy extract (10 mg/daysaponin B and 25 mg/day isoflavone), 900 mg/day collagenpeptide, 32 mg/day bifidobacteria ( > 2 billion BifidobacteriumBB536), and 83 mg/day apple extract (65 mg/day polyphenol)was used as active food. The control food that appeared thesame but did not include any of the active ingredients (placebo). Each dose was six tablets once daily, taken with water following dinner. Table 1 shows the formulation of the test food.
3. Procedure 3.1 Screening
To screen those who provided informed consent, we examined the background information (age, smoking, drinking,exercise, diet, use of health food products, bowel movements, sleep, medications, allergies, hay fever, menstruation, nightshift work, medical history, skin problems, and exposure to UV rays), and measured AGE deposition in the skin (hereafter, the AF value). The principal investigator examined the content of the background survey, and selected those who met the selection criteria and not the exclusion criteria. From the selected group, the 56 subjects with the highest AF values were selected as the subjects of this study.
3.2 The testThe test design was a randomized placebo-controlled
double-blind parallel group comparative clinical study. The person responsible for group assignment randomly divided the 56 subjects into two groups: a group that ingested the active food (active food group) and a group that ingested the placebo (placebo group). The assignment table was sealed and stored until unlocked. The period of ingesting the test food was 12 weeks, and skin measurements, examination of oxidative stress, glycative stress, and inflammatory markers, blood tests (safety), basic measurements (body composition and blood pressure measurements), an interview with a

_ 159 _
Glycative Stress Research
physician, and anti-aging QOL questionnaire were performedbefore taking the supplement (0w) and at the end of the study (12w). In addition, subjects kept a journal every day during the test period, and completed a feelings questionnaire onthe skin and physical condition at the end of the period duringwhich they took the supplement.
Parameter
(1) Skin conditions Skin measurements included skin viscoelasticity, wrinklereplica analysis, stratum corneum moisture content, transepidermal water loss and color difference. Measurementsof the face were made after washing the face and habituation for 20 minutes in a room with constant temperature andhumidity (21 ± 1 °C and 50% ± 5%, respectively). Skin viscoelasticity, stratum corneum moisture content, transepidermal water loss, and color difference were measuredfive times around the right cheek bone in a supine position, and the mean of three measurements was used after excludingthe highest and lowest values.
Skin viscoelasticity was measured with a cutometer (Courage+khazaka CT580) using a single-suction method. The evaluated parameters were R2 and R7. R2 indicates the recovery rate of the skin length after elongation and constriction (Ua1/Uf1) while R7 indicates the ratio of elastic part during constriction (Ur1/Uf1). Both R2 and R7 indicate higher elasticity as the value approaches 1.00.
The stratum corneum moisture content was measured with a corneometer (Courage+khazaka CM825), while transepidermal water loss was measured with a Tewameter (Courage+khazaka TM300).
Color differences were measured with a spectrocolorimeter (Konica Minolta CM-600d), and the evaluation parameters were the Melanin Index, Hb Index, HbSO2 Index, and L*, a*, b* values.
For the wrinkle replica analysis, a replica silicon casting solution was applied in a mold with a silicon coagulating liquid while keeping the eyes lightly closed in the supine position, and a replica was prepared of a 10 mm × 10 mm or wider area approximately 5 mm away from the corner of the right eye. The replica was analyzed using three-dimensional image analysis (GFMesstechnik GmbH PRIMOS lite 18 × 13 mm), and the wrinkle area rate, average wrinkle depth (total wrinkle), average wrinkle depth (maximum wrinkle), maximum wrinkle depth, and total wrinkle volume were calculated.
(2) Marker The concentrations of the oxidative stress markers, lipidhydroperoxide (LPO) in blood and DJ-1 in the stratum corneumwere measured. The stratum corneum was sampled by stripping cells from the right cheekbone with tape. The DJ-1concentration was measured using an enzyme-linked immunosorbent assay (ELISA) according to a previous report 8.The glycative stress markers, AF values, 3-deoxyglucosone (3-DG), CML, and glyceraldehyde-derived AGEs (Toxic AGEs : TAGE) were measured in the blood.
For AF values, we used an AGE Reader (DiagnOptics B.V. AGE Reader SU) to measure the inside of the right upper arm three times (10 cm above the olecranon toward the shoulder while seated), and their mean value was used.
In addition, we measured Tumor Necrosis Factor α (TNF-α) as an inflammatory marker. Blood sampling was performed by a qualified person based on standard blood sampling guidelines, and 24 mL was sampled each time. The 3-DG, CML, and TNF-α levels were measured by LSI Medience Corporation, TAGE was measured by Trans Genic Inc., LPO was measured by Japan Institute for the Control of Aging, NIKKEN SEIL Co., Ltd, and DJ-1 was measured by FANCL Corporation.
(3) Anti-aging QOL questionnaire (subjective symptoms) The survey of subjective symptoms evaluated physical
symptoms (30 items) and mental symptoms (21 items) using a five-point scale (score 1: none, score 2: few, score 3: a little, score 4: some, score 5: quite a few) with an Anti-Aging QOL Common Questionnaire (AAQoL). Subjects were asked to note sleeping habits, eating habits, exercise habits, and time spent at visual display terminals.
(4) Feelings questionnaire Changes in skin and physical condition after taking thetest food were self-evaluated on a four-point scale (2 points:improved, 1 point: somewhat improved, 0 points: no change,-1 point: deteriorated). Evaluation parameters were as follows:dry skin (moisture), sag of circumoral skin (nasolabial fold), sag under the eyes, texture, pores, wrinkles and fine lines, dullness of skin (brightness of the skin), spots, make-up condition, shine and strength of the hair, tendency to tire (frequency of fatigue), heaviness in the head, feelings of fatigue (intensity of fatigue), awakening (how fresh one feels when waking up), sleep quality, and defecation (constipation or loose stools).
(5) Blood tests (safety) As safety parameter, glucose, glycated hemoglobin
(HbA1c), glycoalbumin, triglycerides, total cholesterol, high-density lipoprotein cholesterol (HDL-C), low-density lipoprotein cholesterol (LDL-C), gamma-glutamyl transferase(γ-GTP), aspartate transaminase (AST), alanine transaminase(ALT), total bilirubin, total protein, albumin (ALB), albumin/globulin (A/G) ratio, alkaline phosphatase, lactate dehydrogenase (LDH), creatine phosphokinase (CPK), creatinine, uric acid, and blood urea nitrogen were measured.Measurements were outsourced to LSI Medience Corporation.
(6) Body composition and blood pressure For body composition, we measured height, weight,
BMI, body fat percentage, and basal metabolic rate. Items other than height were measured using a body composition analyzer (WELL-SCAN500, Canon Lifecare Solutions, Inc.). Blood pressure was measured with an automated sphygmomanometer (UDEX-I, Canon System & Support Inc.) while resting (three or more minutes in a sitting position, after taking three deep breaths). Measurements were taken twice on the right arm, and the mean value was used.
(7) Adverse event During the test period, subjects were asked to record
their intake of the test food, the amount of daily activity, the length of sleep, stress conditions, bowel movements, use of medications or supplements other than the test food and the reason for its use, and as a survey of the diet, the time and amount of three meals on a four point scale (a lot, as usual,

_ 160 _
Skin Improvement Effects of Anti-aging Supplement
less, no meal), the details of the main dish and side dish, and alcohol consumption every day. The contents of this journal were assessed every four weeks, and it was confirmed that there were no major fluctuations in the lifestyle habits of the subjects.
4. Evaluations We used skin viscoelasticity and wrinkle replica
analysis results as the main endpoints. Other skin evaluation items (AF values, stratum corneum moisture content, transepidermal water loss, and color difference), oxidative stress markers, glycative stress markers, the inflammatory marker, the anti-aging QOL common questionnaire, and the feelings questionnaire were used as the secondary endpoints. Safety was evaluated through general biochemical analyses, body composition, fluctuations in blood pressure, and the presence/absence of adverse events was determined by the principal investigator.
5. Statistical analysis Data for the background characteristics of the subjects
are presented as mean ± standard deviation, and evaluation items are presented as mean ± standard error. We considered subjects who were included in the test and began the use ofthe test food as the Full Analysis Set (FAS), and the group ofsubjects remaining after excluding those who dropped outfrom the FAS due to serious protocol breaches was consideredto be the group that was suited to the test implementation plan(Per-Protocol Set; PPS). To evaluate the safety of the subjects,we used FAS analysis, and the analysis of effectiveness was made using PPS analysis. The test method was a paired t test(AF values, color difference, skin viscoelasticity, body composition, and blood pressure) or Wilcoxon signed-rank test (for items other than those listed above) to compare itemsbefore and after the intake of the test food, and comparisons between groups were made using Student’s t test (AF values, color difference, skin viscoelasticity, body composition, and blood pressure) or Mann-Whitney U test (for items other than those listed above). Statistical analysis was conducted using JMP11.1.1 (SAS), and the significance level was less than 5% in a two-tailed test.
6. Ethics This study was reviewed by the ethics board of Tokyo
Synergy Clinic from the perspective of ethics, science, andmedical validity, and was implemented according to the approved test protocol (October 28, 2014). The study wasimplemented according to the ethical doctrine of the Declaration of Helsinki, and respect was paid to the ordinanceon the criteria for the implementation of clinical trials of drugs (Good Clinical Practice, GCP; Ministry of Health and Welfare Ordinance No. 28, March 27, 1997). The principal investigator of this study provided sufficient explanation to the subjects prior to the commencement of the study using informed consent documents with the support of the CRC. Once subjects fully understood the content, we obtained informed written consent based on their free will prior to commencement of the study. This study was implemented during the period from November 2014 to April 2015 at A-kit Corporation Skin Lab.
Results Of the 131 people who voluntarily agreed to participate
and provided written informed consent, 12 were excluded based on the background survey. Of the remaining 119 people,one person was excluded as his/her AF value was an outlier. Among the remaining 118 people, we registered the 56 people with the highest AF values. Background characteristics of the selected subjects are shown in Table 2.
All 56 subjects in this test completed the project, but two subjects in the active food group met the dropout criteria (subjects did not take the test food for three or more consecutive days), and thus the PPS analysis was performed on 26 subjects in the active food group and 28 subjects in the placebo group, totaling 54 subjects. The flow diagram of this test is shown in Fig. 1.
[Effectiveness]
Skin conditions Results of skin measurements and stress indicators are
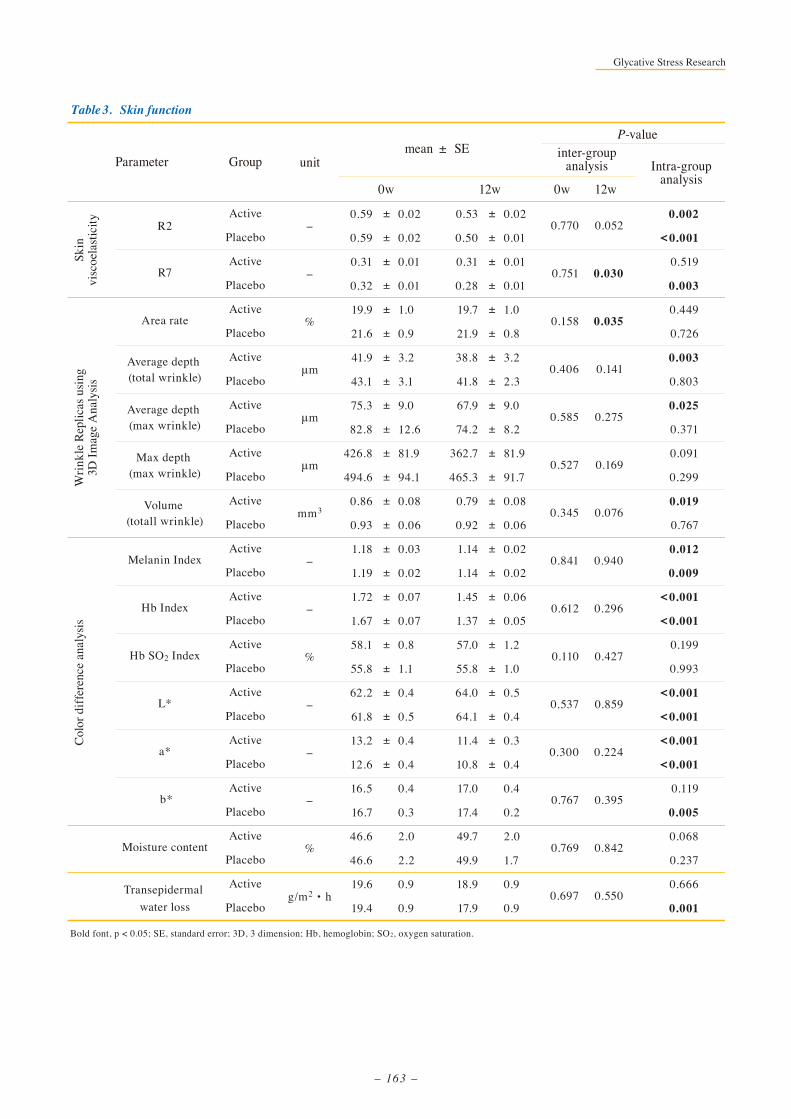
shown in Table 3. Compared with the R7 of the placebo group, which dropped significantly from 0.32 ± 0.01 to 0.28 ± 0.01, R7 in the active food group remained at 0.31 ± 0.01 and did not show any decrease with the intake of the active food. Therefore, the placebo group showed a significant decrease after the 12 weeks of the test period. On the other hand, R2 dropped significantly in both groups after taking the test, with no difference between the two groups. In the wrinkle replica analysis, the wrinkle area rate decreased significantly in the active food group vs placebo group at 12 weeks. The average wrinkle depth (total wrinkle), average wrinkle depth (maximum wrinkle), and total wrinkle volumedecreased significantly only in the active food group after the test. None of the parameters for color difference showed any difference between the two groups, but on comparing the before and after test results, the melanin index, Hb index, and a* value decreased significantly in both groups, while the L* value increased significantly. In addition, the b* valueincreased significantly in the placebo group. Stratum corneum moisture content did not show any difference between or within groups, and the transepidermal water content showed a significant decrease only in the placebo group.
Marker Table 4 shows stratum corneum and skin markers in
the blood. Among the oxidative stress markers, blood LPO decreased significantly in both groups, while the stratum corneum DJ-1 levels decreased significantly only in the placebo group but there was no difference between the groupsafter 12 weeks. Among the glycative stress markers, the AF value and blood CML increased significantly in both groups, while blood TAGE significantly decreased in both groups. On the other hand, the glycation reaction intermediate 3-DG decreased significantly only in the placebo group, but there was no difference between the groups at 12 weeks. The bloodinflammatory marker, TNF-α decreased significantly in both groups, but there was no difference between the groups.

base
Skin
func
tion
mar
ker
51.5
0.59
0.32
20.9
43.1
80.3
487.3
0.91
1.19
1.69
57.0
62.1
12.9
16.7
46.6
19.5
3.1
4.3
2.14
15.1
1.12
10.8
1.09
8.0
0.08
0.06
4.9
16.9
57.5
508.1
0.40
0.13
0.37
5.3
2.2
2.1
1.9
11.0
4.5
0.5
2.1
0.24
3.9
1.39
4.1
0.56
-
68
0.77
0.48
31.5
113
368
2199
2.16
1.56
2.68
76.0
68.8
17.7
20.2
72.8
30.3
4.1
12.8
2.72
27.6
11.3
28.6
3.04
-
year
-
-
%
μm
μm
μm
mm3
-
-
%
-
-
-
%
g/m2・h
nmol/mL
pg/ug protein
-
ng/mL
μg/mL
U/mL
pg/mL
-
41
0.35
0.19
8.2
24
26
51
0.21
0.98
0.76
44.2
57.5
7.4
12.0
20.0
12.1
2.2
1.4
1.72
7.7
0.70
3.3
0.55
-
49.5
0.60
0.32
21.4
37.5
59.0
275.0
0.85
1.18
1.70
56.7
62.2
12.9
16.7
44.7
19.2
3.0
3.8
2.12
14.6
0.91
10.1
0.99
56
±
±
±
±
±
±
±
±
±
±
±
±
±
±
±
±
±
±
±
±
±
±
±
Table 2. Background
MaxMinMedianmean SD±unitParameter
R2
R7
Area rate
Average depth (total wrinkle)
Average depth (max wrinkle)
Max depth (max wrinkle)
Volume (total wrinkle)
Melanin Index
Hb Index
Hb SO2 Index (%)
L*
a*
b*
LPO (serum)
DJ-1 (straum corneum)
Skin AGE fluorescence
3-DG (serum)
CML (serum)
TAGE (serum)
TNF-α (serum)
Skin viscoelasticity
Wrinkle Replicas using
3D Image Analysis
Color difference
analysis
Oxidative stress marker
Glycative stress marker
Inflammatory marker
SD, standard deviation; 3D, 3 dimension; Hb, hemoglobin; SO2, oxygen saturation; LPO, lipid peroxide; AGE, advanced glycation endproduct; 3-DG, 3-deoxyglucosone; CML, carboxymethyl-lysine; TAGE, toxic AGE; TNF, tumor necrosis factor.
Moisture content
Transepidermal water loss
n
Age
_ 161 _
Glycative Stress Research

HO
HO
HO
HO
HO
H H
HH3C
H3C
CH3
CH3
H
O
O O
O
O
O
O
O O
O O
OGlu Glu
O Glu
OH
A
C
B
Assessed for eligibility(n=131)
Randomized(n=56)
Test food(n=28)
FAS Analyzed(n=28)
PPS Analyzed(n=26)
Excluded (n=2)・withdrawal (n=0)・dropout⦆(n=2)
Excluded (n=75)・Did not meet inclusion criteria (n=12)・Other reasons (n=63)
PPS Analyzed(n=28)
FAS Analyzed(n=28)
Placebo(n=28)
Enrollment
Allocation
Intervention
Analysis
_ 162 _
Skin Improvement Effects of Anti-aging Supplement
Fig. 1. Flow diagram.FAS, full analysis set; PPS, per protocol set.
Skin
visc
oela
stic
ityW
rinkl
e Re
plic
as u
sing
3D Im
age
Ana
lysis
Col
or d
iffer
ence
ana
lysis
0.59
0.59
0.31
0.32
19.9
21.6
41.9
43.1
75.3
82.8
426.8
494.6
0.86
0.93
1.18
1.19
1.72
1.67
58.1
55.8
62.2
61.8
13.2
12.6
16.5
16.7
46.6
46.6
19.6
19.4
0.02
0.02
0.01
0.01
1.0
0.9
3.2
3.1
9.0
12.6
81.9
94.1
0.08
0.06
0.03
0.02
0.07
0.07
0.8
1.1
0.4
0.5
0.4
0.4
0.4
0.3
2.0
2.2
0.9
0.9
0.002
< 0.001
0.519
0.003
0.449
0.726
0.003
0.803
0.025
0.371
0.091
0.299
0.019
0.767
0.012
0.009
< 0.001
< 0.001
0.199
0.993
< 0.001
< 0.001
< 0.001
< 0.001
0.119
0.005
0.068
0.237
0.666
0.001
0.052
0.030
0.035
0.141
0.275
0.169
0.076
0.940
0.296
0.427
0.859
0.224
0.395
0.842
0.550
0.770
0.751
0.158
0.406
0.585
0.527
0.345
0.841
0.612
0.110
0.537
0.300
0.767
0.769
0.697
-
-
%
μm
μm
μm
mm3
-
-
%
-
-
-
%
g/m2・h
±
±
±
±
±
±
±
±
±
±
±
±
±
±
±
±
±
±
±
±
±
±
±
±
Active
Placebo
Active
Placebo
Active
Placebo
Active
Placebo
Active
Placebo
Active
Placebo
Active
Placebo
Active
Placebo
Active
Placebo
Active
Placebo
Active
Placebo
Active
Placebo
Active
Placebo
Active
Placebo
Active
Placebo
R2
R7
Area rate
Average depth (total wrinkle)
Average depth (max wrinkle)
Max depth (max wrinkle)
Volume (totall wrinkle)
Melanin Index
Hb Index
Hb SO2 Index
L*
a*
b*
Moisture content
Transepidermal water loss
0.53
0.50
0.31
0.28
19.7
21.9
38.8
41.8
67.9
74.2
362.7
465.3
0.79
0.92
1.14
1.14
1.45
1.37
57.0
55.8
64.0
64.1
11.4
10.8
17.0
17.4
49.7
49.9
18.9
17.9
0.02
0.01
0.01
0.01
1.0
0.8
3.2
2.3
9.0
8.2
81.9
91.7
0.08
0.06
0.02
0.02
0.06
0.05
1.2
1.0
0.5
0.4
0.3
0.4
0.4
0.2
2.0
1.7
0.9
0.9
±
±
±
±
±
±
±
±
±
±
±
±
±
±
±
±
±
±
±
±
±
±
±
±
Table 3. Skin function
P-valuemean SE
Intra-groupanalysis
inter-groupanalysis
12w0w12w0w
±unitGroupParameter
Bold font, p < 0.05; SE, standard error; 3D, 3 dimension; Hb, hemoglobin; SO2, oxygen saturation.
_ 163 _
Glycative Stress Research

Table 4.
2.7
2.6
3.54
4.32
2.26
2.31
14.9
12.9
1.5
1.1
7.6
6.9
0.9
0.9
0.1
0.1
0.25
0.35
0.05
0.04
0.8
0.6
0.4
0.0
0.8
0.6
0.1
0.1
0.001
<0.001
0.561
0.039
<0.001
<0.001
0.796
0.002
0.001
<0.001
<0.001
<0.001
0.002
0.047
±
±
±
±
±
±
±
±
±
±
±
±
±
±
3.2
3.0
3.51
5.10
2.13
2.15
14.9
15.2
1.4
0.9
11.0
10.6
1.2
1.0
0.1
0.1
0.25
0.47
0.05
0.05
0.8
0.7
0.4
0.0
0.8
0.8
0.1
0.1
±
±
±
±
±
±
±
±
±
±
±
±
±
±
Active
Placebo
Active
Placebo
Active
Placebo
Active
Placebo
Active
Placebo
Active
Placebo
Active
Placebo
LPO(serum)
DJ-1(straum corneum)
Skin AGEfluorescence
3-DG(serum)
CML(serum)
TAGE(serum)
TNF-α(serum)
nmol/mL
pg/ug protein
-
ng/mL
μg/mL
U/mL
pg/mL
0.715
0.106
0.488
0.091
0.332
0.243
0.662
0.443
0.005
0.727
0.622
0.008
0.431
0.488
Oxy
dativ
est
ress
mar
ker
Infla
mm
ator
y m
arke
rG
lyca
tive
stre
ss m
arke
r
unitGroupParameter
P-valuemean SE
Intra-groupanalysis
inter-groupanalysis
12w0w12w0w
±
Bold font, p < 0.05; SE, standard error; LPO, lipid peroxide; AGE, advanced glycation endproduct;3-DG, 3-deoxyglucosone; CML, carboxymethyl- lysine; TAGE, toxic AGE; TNF, tumor necrosis factor.
_ 16 4 _
Skin Improvement Effects of Anti-aging Supplement
Anti-aging QOL questionnaire (subjective symptoms) Results of the anti-aging QOL common questionnaire are
shown in Table 5. “Difficulty falling asleep” did not show asignificant fluctuation before and after the test in both groups,but at week 12, the active food group had a significantly highervalue. In addition, “easily breaking into a sweat” increased significantly in both groups, “dry mouth” and “swelling” increased significantly only in the active food group, “tendencyto gain weight” only decreased significantly in the placebo group, and “difficulty falling asleep” increased significantly in the placebo group. However, there was no difference between the groups.
Feelings questionnaire Results of the feelings questionnaire are shown in Fig. 2.
On all items, there was no difference between the groups, but “dullness (brightness of skin)” was 0.58 ± 0.11 for the active food group and 0.35 ± 0.09 for the placebo group, showing a greater tendency towards an improvement in the active food group (p < 0.1).
[Safety]
Body composition, blood pressure measurement, and general biochemistry
Results for body composition, sphygmomanometry measurements, and general biochemistry analyses are shown in Table 6. On all items, there was no difference between the groups at weeks 0 and 12. There was a significant difference before and after the test period for the following five: diastolicblood pressure (the active food group), HDL-C, ALB, ALP (the placebo group), and total protein (both groups). Fluctuations were all within the normal range. In addition, it was confirmed that individual fluctuations in subjects were not abnormal and would not be a clinical problem.
Adverse events and others During the test period, there were multiple adverse
events in both groups, but all cases were examined and were determined to be within normal limits for symptoms and severity and have no causal relationship with the test food. In addition, on all observed items, there was no problem with safety.

Phys
ical
sym
ptom
s
2.58 2.36 2.15 1.96 1.62 1.54 2.96 2.86 2.35 2.39 1.54 1.61 1.58 1.75 2.62 2.96 1.35 1.36 1.81 1.93 1.92 1.82 1.77 1.68 2.23 2.07 1.46 1.39 1.54 1.54 1.46 1.36 1.85 1.68 1.62 1.71 1.38 1.64 2.27 2.00 2.15 2.11 3.23 3.18 1.96 2.11 1.50 1.57 1.31 1.54 1.88 2.04 1.58 1.54
0.20 0.18 0.16 0.15 0.16 0.13 0.23 0.24 0.21 0.19 0.14 0.12 0.15 0.16 0.24 0.21 0.11 0.09 0.16 0.18 0.15 0.19 0.14 0.17 0.17 0.16 0.13 0.09 0.13 0.14 0.13 0.11 0.14 0.13 0.16 0.17 0.10 0.12 0.23 0.15 0.17 0.17 0.17 0.19 0.15 0.23 0.13 0.15 0.09 0.16 0.17 0.17 0.13 0.16
0.265
0.541
0.239
0.165
0.302
0.537
0.232
0.915
0.518
0.964
0.363
0.475
0.948
0.378
0.287
0.091
0.575
0.661
0.906
0.280
0.678
0.948
0.840
0.375
0.314
0.683
0.679
0.540
0.373
0.800
0.803
0.878
0.575
0.446
0.408
0.792
0.775
0.338
0.410
0.463
0.879
0.837
0.584
0.406
0.666
0.127
0.489
0.698
0.978
0.941
0.890
0.323
0.576
0.492
Tired eyes
Blurry eyes
Eye pain
Stiff shoulders
Muscular pains/stiffness
Palpitations
Shortness of breath
Tendency to gain weight
Weight loss, thin
Lethargy
Lack of sense of wellness
Thirst
Skin problems
Anorexia
Early satiety
Epigastralgia
Liability to catch colds
Coughing and sputum
Diarrhea
Constipation
Hair loss
Gray hair
Headache
Dizziness
Tinnitus
Lumbago
Arthralgia
±±±±±±±±±±±±±±±±±±±±±±±±±±±±±±±±±±±±±±±±±±±±±±±±±±±±±±
ActivePlaceboActive
PlaceboActive
PlaceboActive
PlaceboActive
PlaceboActive
PlaceboActive
PlaceboActive
PlaceboActive
PlaceboActive
PlaceboActive
PlaceboActive
PlaceboActive
PlaceboActive
PlaceboActive
PlaceboActive
PlaceboActive
PlaceboActive
PlaceboActive
PlaceboActive
PlaceboActive
PlaceboActive
PlaceboActive
PlaceboActive
PlaceboActive
PlaceboActive
PlaceboActive
Placebo
2.65 2.39 2.23 2.07 1.85 1.61 3.15 2.71 2.46 2.21 1.65 1.54 1.58 1.79 2.65 2.64 1.38 1.46 2.12 2.11 2.12 1.93 2.04 1.89 2.12 2.18 1.38 1.46 1.73 1.50 1.69 1.36 1.81 1.71 1.92 1.71 1.50 1.54 2.27 1.89 2.23 2.11 3.19 3.14 2.19 2.25 1.62 1.82 1.38 1.64 2.12 2.21 1.77 1.89
0.19 0.16 0.18 0.16 0.15 0.14 0.21 0.22 0.19 0.19 0.14 0.12 0.15 0.14 0.23 0.23 0.15 0.13 0.18 0.17 0.15 0.16 0.14 0.15 0.14 0.18 0.12 0.10 0.15 0.12 0.15 0.11 0.12 0.12 0.21 0.13 0.11 0.12 0.23 0.17 0.18 0.18 0.18 0.14 0.16 0.23 0.14 0.15 0.11 0.17 0.19 0.17 0.15 0.17
0.8381.0000.8000.6130.2850.8070.3920.4630.5100.2830.5810.7541.0001.0000.9600.0451.0000.5310.1160.2730.1800.6410.0390.2910.4940.8160.7810.6880.1801.0000.1831.0001.0001.0000.0630.9140.5490.3751.0000.4530.7271.0001.0001.0000.0700.3670.5900.1450.6880.3750.1480.3070.0630.051
±±±±±±±±±±±±±±±±±±±±±±±±±±±±±±±±±±±±±±±±±±±±±±±±±±±±±±
Table 5-1. AAQoL.
P-valuemean SE
Intra-groupanalysis
inter-groupanalysis
12w0w12w0w
±GroupParameter
Bold font, p < 0.05; AAQoL, Anti-Aging QOL Common Questionnaire; QOL, quality of life; SE, standard error.
_ 165 _
Glycative Stress Research

Men
tal s
ympt
oms
Phys
ical
sym
ptom
s
1.77 1.86 1.96 2.07 1.96 1.86 1.85 1.54 2.50 2.11 2.15 2.07 1.92 1.89 1.85 1.75 1.54 1.57 1.50 1.57 1.50 1.57 1.65 1.46 1.54 1.43 1.50 1.32 1.58 1.57 1.77 1.68 1.85 1.54 1.92 1.68 2.62 2.21 1.88 1.71 1.62 1.54 1.58 1.57 1.54 1.43 1.92 1.79 1.54 1.43 1.31 1.29
0.17 0.16 0.17 0.21 0.16 0.19 0.15 0.17 0.23 0.20 0.16 0.14 0.17 0.14 0.16 0.12 0.11 0.11 0.11 0.11 0.10 0.12 0.12 0.10 0.16 0.11 0.13 0.09 0.11 0.10 0.17 0.15 0.15 0.12 0.17 0.13 0.18 0.17 0.19 0.12 0.12 0.11 0.13 0.12 0.11 0.10 0.17 0.15 0.11 0.10 0.09 0.09
0.870
0.431
0.391
0.501
0.136
0.591
0.865
0.955
0.938
0.913
0.474
0.740
0.696
0.379
0.345
0.301
0.026
0.889
0.494
0.711
0.327
0.478
0.545
0.826
0.868
0.301
0.683
0.905
0.467
0.701
0.217
0.752
1.000
0.813
0.814
0.623
0.798
0.289
0.856
0.346
0.945
0.763
0.143
0.361
0.149
0.671
0.690
0.992
0.531
0.561
0.531
0.870
Edematous
Easily breakinginto a sweat
Frequent urination
Hot flashes
Cold skin
Irritability
Easily angered
Loss of motivation
Unhappy
Nothing to look forwardto in my life
Daily life is not enjoyable
No confidence
Reluctance to talkwith others
Depressed
Feeling useless
Shallow sleep
Difficulty falling asleep
Memory lapse
Pessimism
Inability to concentrate
Inability to solve problems
Inability to readily makejudgments
Inability to sleep due to
worries
Feeling tense
Feeling anxious for noparticular reason
Vague feeling of fear
±±±±±±±±±±±±±±±±±±±±±±±±±±±±±±±±±±±±±±±±±±±±±±±±±±±±
ActivePlaceboActive
PlaceboActive
PlaceboActive
PlaceboActive
PlaceboActive
PlaceboActive
PlaceboActive
PlaceboActive
PlaceboActive
PlaceboActive
PlaceboActive
PlaceboActive
PlaceboActive
PlaceboActive
PlaceboActive
PlaceboActive
PlaceboActive
PlaceboActive
PlaceboActive
PlaceboActive
PlaceboActive
PlaceboActive
PlaceboActive
PlaceboActive
PlaceboActive
Placebo
2.08 2.07 2.31 2.54 2.27 2.00 1.88 1.68 2.42 1.96 2.04 2.14 1.96 1.93 1.92 1.86 1.65 1.64 1.54 1.54 1.77 1.64 1.81 1.68 1.65 1.50 1.62 1.46 1.81 1.57 2.00 1.75 1.88 1.43 1.85 1.79 2.54 2.36 2.04 1.89 1.81 1.57 1.81 1.64 1.58 1.71 1.96 1.93 1.62 1.57 1.46 1.32
0.21 0.16 0.19 0.22 0.21 0.15 0.18 0.12 0.22 0.18 0.14 0.13 0.14 0.14 0.18 0.14 0.14 0.12 0.11 0.10 0.13 0.12 0.17 0.12 0.17 0.11 0.12 0.11 0.16 0.10 0.18 0.17 0.16 0.12 0.16 0.14 0.19 0.16 0.19 0.14 0.16 0.11 0.15 0.11 0.11 0.13 0.16 0.16 0.12 0.11 0.10 0.09
0.0220.1460.0310.0010.3750.3881.0000.4320.7960.3440.4530.7541.0001.0000.6880.5900.3750.7271.0001.0000.0650.7540.2190.0700.5080.7270.3750.2890.1091.0000.1090.7811.0000.3750.6880.5490.7270.3250.2890.1880.1881.0000.2170.6251.0000.0081.0000.4390.6880.3590.2191.000
±±±±±±±±±±±±±±±±±±±±±±±±±±±±±±±±±±±±±±±±±±±±±±±±±±±±
Table 5-2. AAQoL.
P-valuemean SE
Intra-groupanalysis
inter-groupanalysis
12w0w12w0w
±GroupParameter
Bold font, p < 0.05; AAQoL, Anti-Aging QOL Common Questionnaire; QOL, quality of life; SE, standard error.
_ 166 _
Skin Improvement Effects of Anti-aging Supplement

0.0 0.1 0.2 0.3 0.4 0.5 0.6 0.7
dry skin (moisture)
circumoral sagging(nasolabial fold)
sagging under eyes
texture
pores
wrinkles
dullness
spots
make-up condition
hair condition
nail condition
tiring easily
heaviness in the head
feeling fatigued
feelings on waking up
sleep quality
p=0.096 (vs placebo)
ActivePlacebo
constipation or loose stools
_ 167 _
Glycative Stress Research
Fig. 2. Feelings questionnaire on skin or healthmean ± SE (standard error)

bloo
d ch
emic
al a
naly
sisbo
dy c
ompo
sitio
nsp
hygm
oman
ometr
y
52.8 55.2 25.9 26.1 21.5 21.6
1074.5 1098.3
112.0 112.0 72.6 73.0 72.9 72.1 85.6 84.8
5.5 5.5
14.8 14.7 81.6 82.0
222.4 208.3
73.5 72.1
131.0 118.6 26.5 18.9 21.4 18.8 17.6 14.1 0.8 0.7 7.1 7.2 4.4 4.4 1.6 1.6
206.4 185.1 179.9 174.7 87.7 88.0
0.6 0.6 4.2 4.5
12.3 13.4
1.5 1.7 1.1 1.0 0.6 0.6 11.6 13.3 2.9 2.7 2.0 1.8 1.9 2.0 3.0 2.0 0.1 0.1 0.3 0.2 8.7 7.8 9.9 8.5 3.9 3.1 8.2 7.7 7.3 1.9 2.1 1.0 3.9 1.2 0.1 0.0 0.1 0.1 0.0 0.0 0.0 0.0 14.3 10.3 6.7 6.6 7.2 8.5 0.0 0.0 0.2 0.2 0.6 0.7
0.402
0.780
0.929
0.194
0.516
0.449
0.406
0.663
0.746
0.792
0.874
0.196
0.288
0.246
0.260
0.226
0.256
0.303
0.356
0.574
0.955
0.104
0.483
0.806
0.911
0.259
0.504
0.298
0.932
0.909
0.183
0.996
0.885
0.779
0.828
0.734
0.812
0.971
0.285
0.779
0.273
0.323
0.258
0.399
0.469
0.286
0.433
0.676
0.234
0.579
0.977
0.781
0.194
0.238
Weight
Body Fat percentage
BMI
basal metabolic rate
systolic blood pressure
diastolic blood pressure
pulse
glucose (FPG)
HbA1c (NGSP)
glycoalbumin
Triglyceride
Total cholesterol
HDL-C
LDL-C
γ -GT
AST
ALT
Total bilirubin
Total protein
ALB(improved BCP method)
A/G (0w)
ALP (0w)
LD (LDH)
CK
Creatinine
UA
UN
±±±±±±±±±±±±±±±±±±±±±±±±±±±±±±±±±±±±±±±±±±±±±±±±±±±±±±
ActiveplaceboActive
placeboActive
placeboActive
placeboActive
placeboActive
placeboActive
placeboActive
placeboActive
placeboActive
placeboActive
placeboActive
placeboActive
placeboActive
placeboActive
placeboActive
placeboActive
placeboActive
placeboActive
placeboActive
placeboActive
placeboActive
placeboActive
placeboActive
placeboActive
placeboActive
placeboActive
placebo
70 - 109
4.6 - 6.2
12.3 - 16.5
30 - 149
120 - 219
40 - 95
65 - 139
< 30
10 - 40
5 - 45
0.2 - 1.2
6.7 - 8.3
3.8 - 5.2
1.1 - 2.0
100 - 325
120 - 240
40 - 150
0.47 - 0.79
2.5 - 7.0
8.0 - 20.0
kg
%
kg/m2
kcal/day
mmHg
mmHg
bpm
ng/dL
%
%
mg/dL
mg/dL
mg/dL
mg/dL
U/L
U/L
U/L
mg/dL
g/dL
g/dL
-
U/L
U/L
U/L
mg/dL
mg/dL
mg/dL
53.2 55.1 26.3 25.9 21.6 21.5
1073.6 1097.0
114.3 111.6 76.2 73.9 73.2 70.8 87.4 86.0
5.5 5.5
14.9 14.8 76.6 78.1
218.7 201.9 72.0 67.3
130.0 116.9 27.5 18.5 21.8 18.2 19.9 14.1 0.8 0.7 7.0 7.1 4.3 4.3 1.6 1.6
207.3 175.1 181.7 174.8 88.2 90.9
0.6 0.6 4.2 4.4
13.0 13.6
1.5 1.7 1.0 0.9 0.6 0.6 11.8 13.4 2.8 3.1 2.3 2.0 2.0 1.9 3.0 1.5 0.1 0.1 0.4 0.3 5.9 7.3 8.8 9.3 3.1 3.1 7.9 7.8 7.5 2.2 2.7 1.1 4.7 1.8 0.1 0.0 0.1 0.1 0.0 0.0 0.0 0.0 16.6 10.2 7.3 6.6 6.4 8.8 0.0 0.0 0.1 0.1 0.5 0.7
0.1350.5130.0940.4460.2070.5450.5560.4760.1930.8480.0040.4060.8190.3280.0900.1990.7080.6110.0910.0800.4010.3530.4360.0630.451
< 0.001 0.7910.5450.2160.6810.6920.2810.0730.9660.6960.7460.0280.0070.0960.0260.8110.3720.8400.0230.6050.9720.9440.4470.5110.5310.8370.2960.1590.721
±±±±±±±±±±±±±±±±±±±±±±±±±±±±±±±±±±±±±±±±±±±±±±±±±±±±±±
Table 6. Safety
P-valuemean SE
Intra-groupanalysis
inter-groupanalysis
12w0w12w0w
±Groupreference
valueunitParameter
Bold font, p < 0.05; SE, standard error; BMI, body mass index; FPG, fasting plasma glucose; NGSP, National Glycohemoglobin Standardization Program; HDL-C, high-density lipoprotein cholesterol; LDL-C, low-density lipoprotein cholesterol; γ-GT, γ-glutamyl aminotransferase; AST, aspartate transaminase;ALT, alanine aminotransferase; ALB, albumin; BCP, bromcresol purple; A/G, albumin globulin ratio; ALP, alkaline phosphatase; LDH, lactate dehydrogenase; CK, Creatine kinase; UA uric acid; UN, urea nitrogen.
_ 168 _
Skin Improvement Effects of Anti-aging Supplement
_ 169 _
Glycative Stress Research
Discussion In this study of with women aged between 41 and 69 who
were concerned by sagging skin and wrinkles, we examined the effectiveness of the test food on the skin condition, changesin oxidative and glycative stress markers, and subjective symptoms by having the subjects take the active food orplacebo for 12 weeks. The results showed that the R7 indicatorof skin elasticity decreased significantly (deteriorated) in the placebo group between the periods before and after the intake. In the active food group, the R7 value before the intakewas maintained throughout the test, and showed a significant difference between the groups at 12 weeks. It confirmed thesuppressive effect of the active food on the decrease in skinelasticity. In addition, in the replica analysis of the area around the eyes, the wrinkle area rate after the test showedsignificantly low values in the active food group. Furthermore,the average wrinkle depth (total wrinkle), average wrinkle depth (maximum wrinkle), and total wrinkle volume showed significant improvements only in the active food group between the periods before and after the intake; and thus, on all items, wrinkles were considered to have improved in the active food group. In addition, in the feelings questionnaire implemented after the intake, the level of improvement was higher in the active food group on items that asked about improvements in “dullness (brightness of skin)” ( p < 0.1), although it was not significant. Five of the raw materials usedin the active food were expected to maintain or improve the skin condition, and each of them has been tested on its own or as a combination of two; however, their effectiveness in a combination more than two had not yet been examined. Inthis study, we used an active food that combined these five raw materials. The results of the randomized controlled trial(RCT) with a placebo as the control confirmed a suppression of the decrease in elasticity and an improvement in wrinkles,and an improvement in the skin condition could be attributed to the active food.
The present test was implemented using women living in Kyoto, Osaka, and Hyogo during November to April as subjects. The UV index (estimated value) from January to April in Kyoto in 2015 gradually increased: 1.5 (January), 2.1 (February), 3.1 (March), and 4.2 (April) 39). On the other hand, there was a significant decrease in the melanin index and a significant increase in the L* value when comparing the measurements taken before and after the intake in both groups. These facts indicate that the subjects’ protection against UV rays during the test period was sufficient, and that exposure to UV rays was equivalent in both groups. In other words, subjects were protected from the oxidative stress of UV rays during the intake period, and this was the reason for the significant decrease in the oxidative stress marker LPO in both groups. There was a positive correlation between the protective effect on skin cells from oxidative stress by UV-B irradiation, and the stratum corneum Total Anti-oxidative Capacity (TAC). Stratum corneum DJ-1 8) is a useful marker for anti-oxidation in the skin, and is known to increase with UV irradiation and oxidative stress. As mentioned earlier, oxidative stress from stimulation by UV rays during the test period was similar in both groups, and the stress level was estimated to be low; therefore, it was predicted that stratum corneum DJ-1 would either decrease or be maintained in both groups. In fact, it only decreasedsignificantly in the placebo group between the periods beforeand after the intake. This indicates the possibility that DJ-1
production was promoted or its metabolism and decompositionwere suppressed in the active food group. The impact of food intake on DJ-1 production and metabolism has not been studied, but if DJ-1 production could be promoted without stimulation from UV rays and oxidative stress, it would be useful for protecting the skin from oxidative stress.
There are various approaches to reducing glycative stressboth upstream and downstream of AGE production. Loweringhigh blood sugar levels, and delaying and inhibiting sugar absorption are upstream of AGE formation and lead to areduction in AGE generation downstream. Silybum marianumextract in the active food has a reducing effect on blood sugarand HbA1c 40, 41), and its mechanism involves peroxisome proliferator -activated receptor -γ (PPARγ ) 42, 43). There are also reports of apple extract suppressing sugar absorption in the small intestine 44, 45), improving α-glucosidase inhibition and insulin resistance 46), and suppressing postprandial hyperglycemia 47). The saponin B in soy extract has an inhibitory effect on increases in blood glucose 48), while aglycone-type isoflavone has been reported to improve insulin resistance 49). In addition, in an experiment showing inhibition of 3-DG generation in reactions between human serum albumin and glucose, the IC50 of the active food and placebo food were 1.5 mg/mL and >10 mg/mL, respectively (unpublished data), and the active food was expected to decrease 3-DG generation and reduce 3-DG levels in the blood. However, in this study, the levels of the glycation reaction intermediate 3-DG were significantly decreased inthe placebo group, but there was no change in the active foodgroup. Unlike the prediction, a reduction in glycative stress markers was not confirmed through the use of the active food.If the changes observed in the placebo group were seasonal changes, a decrease should be observed in the active foodgroup as well. This was not observed in this study, perhapsbecause the active food has a promoting effect on 3-DG generation or suppresses its metabolism. The former is unlikely based on the results of an experiment investigating the inhibition of 3-DG generation. If anything, 3-DG metabolism was suppressed, or in other words, the conversionfrom the intermediate product to the final metabolite. To verify this possibility, 3-DG derived AGEs such as pyrraline and imidazoline need to be measured. After including these investigations, the effect of the active food on glycation should be re-examined.
In the AAQoL common questionnaire, “difficulty fallingasleep” was different between groups after the test period, butsince there was no change within the group, the deterioration was not considered to be due to the test food, and there is no issue with safety. All the materials included in the active food have been commonly used as foodstuffs or functional food materials in the past, and are considered highly safe. In the present test, there were no serious adverse events arising from the components, and it was determined that there was no problem with the safety of the active food.
Conclusions The active food was formulated as a complex of food
materials that were expected to improve the skin condition, reduce oxidative and glycative stress, suppress the decrease in elasticity observed in the skin of middle-aged women, and improve winkles in a randomized placebo-controlled
_ 170 _
Skin Improvement Effects of Anti-aging Supplement
References1) Kligman LH, Akin FJ, Kligman AM. Prevention of UV
damage to the dermis of hairless mice by sunscreens. J Invest Dermatol. 1982; 78: 181-189.
2) Kamide R. Photoaging. Jpn J Dermatol. 2012; 122: 3717-3723. (in Japanese)
3) Gross S, Knebel A, Tenev T, et al. Inactivation of protein-tyrosine phosphatases as mechanism of UV-induced signaltransduction. J Biol Chem. 1999; 274: 26378-26386.
4) Fisher GJ, Datta SC, Talwar HS, et al. Molecular basis ofsun-induced premature skin ageing and retinoid antagonism.Nature. 1996; 379: 335-339.
5) Fisher GJ, Kang S, Varani J, et al. Mechanisms of photoagingand chronological skin aging. Arch Dermatol. 2002; 138: 1462-1470.
6) Quan T, Qin Z, Xia W, et al. Matrix-degrading metalloproteinases in photoaging. J Investig Dermatol Symp Proc. 2009; 14: 20-24.
7) Chakraborty AK, Funasaka Y, Slominski A, et al. Productionand release of proopiomelanocortin (POMC) derived peptides by human melanocytes and keratinocytes in culture: Regulation by UV B. Biochem Biophys Acta. 1996; 1313: 130-138.
8) Ishiwatari S, Takahashi M, Yasuda C, et al. The protectiverole of DJ-1 in UV-induced damage of human skin: DJ-1levels in the stratum corneum as an indicator of antioxidativedefense. Arch Dermatol Res. 2015; 307: 925-935.
9) Mizutari K, Ono T, Ikeda K, et al. Photo-enhanced modification of human skin elastin in actinic elastosis by N(epsilon)-(carboxymethyl)lysine, one of the glycoxidation products of the Maillard reaction. J Invest Dermatol. 1997; 108: 797-802.
10) Rittié L, Fisher GJ. UV-light-induced signal cascades and skin aging. Ageing Res Rev. 2002; 1: 705-720.
11) Funasaka Y. Photoaging and response. J Dermatol 2008; 118: 17-21. (in Japanese)
12) Ichihashi M, Yagi M, Nomoto K, et al. Glycation stress and photo-aging in skin. Anti-Aging Med. 2011; 8: 23-29.
13) Ebrahimpour Koujan S, Gargari BP, Mobasseri M, et al. Effects of Silybum marianum (L.) Gaertn. (silymarin) extract supplementation on antioxidant status and hs-CRPin patients with type 2 diabetes mellitus: A randomized, triple-blind, placebo-controlled clinical trial. Phytomedicine.2015; 22: 290-296.
14) Shin S, Lee JA, Kim M, et al. Anti-glycation activities ofphenolic constituents from Silybum marianum (Milk Thistle) flower in vitro and on human explants. Molecules.2015; 20: 3549-3564.
15) Miyata S. Inhibitory effects of silybin, a flavonolignan isolated from Silybum marianum, on skin aging. Medical Science Digest. 2006; 32: 27-31. (in Japanese)
16) Kitajima S. Identification of functional components ofsilymarin for preventation of skin aging and gene expressionprofiling in skin-equivalent models treated with silybin. Fragr J. 2007; 35: 27-29. (in Japanese)
17) Kitajima S, Yamaguchi K. Silybin from Silybum marianumseeds inhibits confluent-induced keratinocytes differentiationas effectively as retinoic acid without inducing inflammatorycytokine. J Clin Biochem Nutr. 2009; 45: 178-184.
18) Katayama S. Soyasaponins mediate antioxidative stress activity via the Nrf2-ARE pathway. Fragr J. 2013; 41: 57-63.
19) Tanaka M, Watanabe T, Uchida T. et al. The hypoglycemiceffects of soyasaponin B. Japan Mibyou System Association.2006; 12: 1-8. (in Japanese)
20) Tsuji T. Trend in development of the dietary supplement for skin care. Fragr J. 2003; 12: 46-54. (in Japanese)
21) Ono E, Shin M, Yasuda C, et al. Effect of group B soyasaponins for skin ageing. J Traditional Med. 2008; 25: 125 (in Japanese)
22) Ono E, Kajiwara N, Function of group B soyasaponins for antiageing. Food Style 21. 2010; 14: 37-39. (in Japanese)
23) Sakata Y. Research on anti glycative component of fermented food. Thesis for Master Degree. Doshisha University Graduate School, Kyoto, Japan, 2015. (in Japanese)
24) Esaki H, Shirasaki T, Yamashita K, et al. Absorption andexcretion of the 8-hydroxydaidzein in rats after oral administration and its antioxidant effect. J Nutr Sci Vitaminol. 2005; 51: 80-86.
25) Mukai R. Terao J. Antioxidant effects of isoflavone. Funct Food 2011; 5: 126-129. (in Japanese)
26) Accorsi-Neto A, Haidar M, Simões R, et al. Effects of isoflavones on the skin of postmenopausal women: A pilotstudy. Clinics. 2009; 64: 505-510.
27) Izumi T, Saito M, Obata A, et al. Oral intake of soy isoflavone aglycone improves the aged skin of adult women.J Nutr Sci Vitaminol. 2007; 53: 57-62.
double-blind clinical study. In terms of subjective symptoms, the results showed the possibility that dullness of the skin may be improved. On the other hand, in terms of oxidative stress markers, a decrease in stratum corneum DJ-1 protein was not observed. There were no clear results for glycative stress markers, and this it is an issue for future research, in addition to elucidating the mechanism for improving for the condition of skin. There were no safety issues with consumption of the active food, and thus it is expected that the present active food could maintain skin elasticity in middle-aged women and improve wrinkles.
Conflicts of interest Research funding for this study was provided by the
FANCL Corporation.
_ 171 _
Glycative Stress Research
28) Morishita Y. Probiotics and prebiotics activate the intestinalbacteria for one’s health. Luminacoids Research. 2000; 4: 47-58.
29) Xiao JZ, Kondo S, Odamaki T, et al. Effect of yogurt containing Bifidobacterium lingum BB 536 on the defecation frequency and fecal characteristics of healthy adults: A double-blind cross over study. Jpn J Lactic Acid Bact. 2007: 18: 31-36.
30) Xiao JZ, Kondo S, Yanagisawa N, et al. Probiotics in the treatment of Japanese cedar pollinosis: A double-blind placebo-controlled trial. Clin Exp Allergy. 2006; 36: 1425-1435.
31) Yonezawa S, Xiao JZ, Yamamoto Y, et al. Effect of milk supplemented with Bifidobacteria on skin condition in healthy adult women. Clinical Allergy. 2014; 34: 872-875. (in Japanese)
32) Hamauzu Y, Iijima E, Polyphenolic composition and antioxidative activity of apple flesh extracts. Nippon Shokuhin Kagaku Kogaku Kaishi. 1999; 46: 645-651. (in Japanese)
33) Sawada Y, Sugimoto A, Sami M, et al. Dietary supplementwith Apple Polyphenols and antioxidants decrease the oxidative stress in human. The Journal of Japan Mibyou System Association. 2015; 21: 21-35. (in Japanese)
34) Shao X, Bai N, He K, et al. Apple polyphenols, phloretin and phloridzin: New trapping agents of reactive dicarbonylspecies. Chem Res Toxicol. 2008; 21: 2042-2050.
35) Ma J, Peng X, Zhang X, et al. Dual effects of phloretin and phloridzin on the glycation induced by methylglyoxal in model systems. Chem Res Toxicol. 2011; 24: 1304-1311.
36) Parengkuan L, Yagi M, Matsushima M, et al. Anti-glycationactivity of various fruits. Anti-Aging Med. 2013; 10: 70-76.
37) Shoji T, Masumoto S, Moriichi N, et al. Procyanidin trimers to pentamers fractionated from apple inhibit melanogenesis in B16 mouse melanoma cells. J Agric Food Chem. 2005; 53: 6105-6111.
38) Kon T. Photoaging-care factor “Apple Polyphenol” based on beauty from the Inside Out. Fragrance Journal. 2013; 41: 27-33. (in Japanese)
39) Japan Meteorological Agency HP (Ministry of Land, Infrastructure, Transport and Tourism). Monthly mean maximum UV index data (estimated). http://www.data.jma.go.jp/gmd/env/uvhp/link_uvindex_month54.html
40) Di Pierro F, Putignano P, Villanova N, et al. Preliminary study about the possible glycemic clinical advantage in using a fixed combination of Berberis aristata and Silybum marianum standardized extracts versus only Berberis aristata in patients with type 2 diabetes. Clin Pharmacol. 2013; 5: 167-174.
41) Moona MM, Smits R, Kertesz J, et al. Clinical inquiry: Do complementary agents lower HbA1c when used with standard type 2 diabetes therapy? J Fam Pract. 2014; 63: 336-338.
42) Pferschy-Wenzig EM, Atanasov AG, Malainer C, et al. Identification of isosilybin a from milk thistle seeds as an agonist of peroxisome proliferator-activated receptor gamma. J Nat Prod. 2014; 77: 842-847.
43) Kazazis CE, Evangelopoulos AA, Kollas A, et al. The therapeutic potential of milk thistle in diabetes. Rev DiabetStud. 2014; 11: 167-174.
44) Yokota K, Nishi Y, Takesue Y. Effect of phloretin on Na[+]-dependent D-glucose uptake by intestinal brush border membrane vesicles. Biochem Pharmacol. 1983; 32: 3453-3457.
45) Kasagi T, Yoshioka S, Imoto Y. Inhibition of the intestinal glucose absorption by the phlorizin-like substance extractedfrom the jujuba leaf (Zizphus jujuba). Tottori University College of Medical Care Technology Research Report. 1985; 9: 13-17. (in Japanese)
46) Antu KA, Riya MP, Mishra A, et al. Antidiabetic property of Symplocos cochinchinensis is mediated by inhibition of alpha glucosidase and enhanced insulin sensitivity. PLoS One. 2014; 9: e105829.
47) Shirosaki M, Koyama T, Yazawa K. Apple leaf extract asa potential candidate for suppressing postprandial elevationof the blood glucose level. J Nutr Sci Vitaminol. 2012; 58: 63-67.
48) Tanaka M, Watanabe T, Uchida T, et al. Blood glucose suppressive effects of soyasaponin B. The Journal of JapanMibyou System Association. 2006; 12: 1-8. (in Japanese)
49) Pan W. Daidzein-rich aglycone isoflavones improve the insulin sensitivity for prevention of type 2 diabetes. The Journal of Japan Mibyou System Association. 2014; 20: 62-66. (in Japanese)