Embed Size (px)
Citation preview
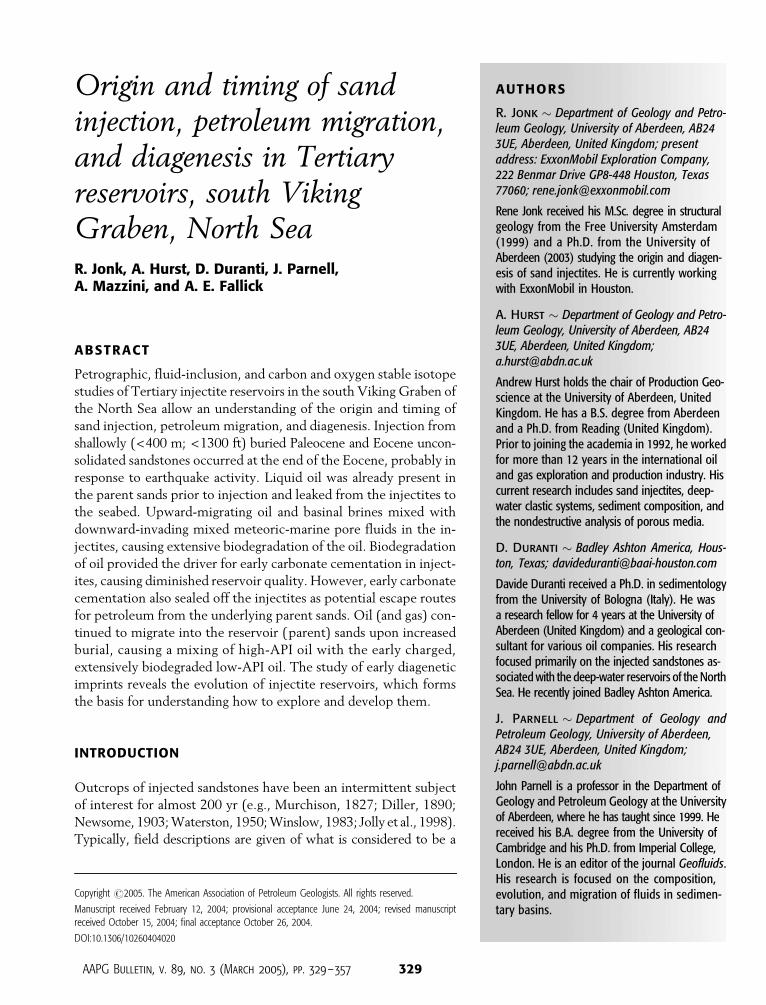
AUTHORS
R. Jonk � Department of Geology and Petro-leum Geology, University of Aberdeen, AB243UE, Aberdeen, United Kingdom; presentaddress: ExxonMobil Exploration Company,222 Benmar Drive GP8-448 Houston, Texas77060; [email protected]
Rene Jonk received his M.Sc. degree in structuralgeology from the Free University Amsterdam(1999) and a Ph.D. from the University ofAberdeen (2003) studying the origin and diagen-esis of sand injectites. He is currently workingwith ExxonMobil in Houston.
A. Hurst � Department of Geology and Petro-leum Geology, University of Aberdeen, AB243UE, Aberdeen, United Kingdom;[email protected]
Andrew Hurst holds the chair of Production Geo-science at the University of Aberdeen, UnitedKingdom. He has a B.S. degree from Aberdeenand a Ph.D. from Reading (United Kingdom).Prior to joining the academia in 1992, he workedfor more than 12 years in the international oiland gas exploration and production industry. Hiscurrent research includes sand injectites, deep-water clastic systems, sediment composition, andthe nondestructive analysis of porous media.
D. Duranti � Badley Ashton America, Hous-ton, Texas; [email protected]
Davide Duranti received a Ph.D. in sedimentologyfrom the University of Bologna (Italy). He wasa research fellow for 4 years at the University ofAberdeen (United Kingdom) and a geological con-sultant for various oil companies. His researchfocused primarily on the injected sandstones as-sociated with the deep-water reservoirs of the NorthSea. He recently joined Badley Ashton America.
J. Parnell � Department of Geology andPetroleum Geology, University of Aberdeen,AB24 3UE, Aberdeen, United Kingdom;[email protected]
John Parnell is a professor in the Department ofGeology and Petroleum Geology at the Universityof Aberdeen, where he has taught since 1999. Hereceived his B.A. degree from the University ofCambridge and his Ph.D. from Imperial College,London. He is an editor of the journal Geofluids.His research is focused on the composition,evolution, and migration of fluids in sedimen-tary basins.
Origin and timing of sandinjection, petroleum migration,and diagenesis in Tertiaryreservoirs, south VikingGraben, North SeaR. Jonk, A. Hurst, D. Duranti, J. Parnell,A. Mazzini, and A. E. Fallick
ABSTRACT
Petrographic, fluid-inclusion, and carbon and oxygen stable isotope
studies of Tertiary injectite reservoirs in the south Viking Graben of
the North Sea allow an understanding of the origin and timing of
sand injection, petroleum migration, and diagenesis. Injection from
shallowly (<400 m; <1300 ft) buried Paleocene and Eocene uncon-
solidated sandstones occurred at the end of the Eocene, probably in
response to earthquake activity. Liquid oil was already present in
the parent sands prior to injection and leaked from the injectites to
the seabed. Upward-migrating oil and basinal brines mixed with
downward-invading mixed meteoric-marine pore fluids in the in-
jectites, causing extensive biodegradation of the oil. Biodegradation
of oil provided the driver for early carbonate cementation in inject-
ites, causing diminished reservoir quality. However, early carbonate
cementation also sealed off the injectites as potential escape routes
for petroleum from the underlying parent sands. Oil (and gas) con-
tinued to migrate into the reservoir (parent) sands upon increased
burial, causing a mixing of high-API oil with the early charged,
extensively biodegraded low-API oil. The study of early diagenetic
imprints reveals the evolution of injectite reservoirs, which forms
the basis for understanding how to explore and develop them.
INTRODUCTION
Outcrops of injected sandstones have been an intermittent subject
of interest for almost 200 yr (e.g., Murchison, 1827; Diller, 1890;
Newsome, 1903; Waterston, 1950; Winslow, 1983; Jolly et al., 1998).
Typically, field descriptions are given of what is considered to be a
AAPG Bulletin, v. 89, no. 3 (March 2005), pp. 329–357 329
Copyright #2005. The American Association of Petroleum Geologists. All rights reserved.
Manuscript received February 12, 2004; provisional acceptance June 24, 2004; revised manuscriptreceived October 15, 2004; final acceptance October 26, 2004.
DOI:10.1306/10260404020
geological curiosity, sometimes offering explanations for their origin
(Murchison, 1827; Diller, 1890; Newsome, 1903; Waterston 1950)
and, more recently, adding paleostress studies of the geometries
of sandstone dikes, which aids in understanding the stress regime
at the time of dike formation (Huang, 1988; Boehm and Moore,
2002; Jonk et al., 2003). During the past decade, numerous de-
scriptions have emerged of large-scale (hundreds of meters verti-
cally and several square kilometers areally) sand injectite complexes
(all sandy facies associated with sand injection [see Duranti et al.,
2002] are hereafter referred to as sand injectites [after Hurst et al.,
2003]) associated with Tertiary petroleum reservoirs in the north-
ern North Sea (Jenssen et al., 1993; Dixon et al., 1995; Lonergan
and Cartwright, 1999; Lonergan et al., 2000; Bergslien, 2002;
Duranti et al., 2002; Purvis et al., 2002; Hurst et al., 2003; Duranti
and Hurst, 2004; Huuse et al., 2004). These studies have largely
used seismic, core, and wire-line-log data, and although they assist
in the recognition of sand injectites, they shed little light on the
timing and genesis of sand injection.
Fluid overpressuring in a sand body is believed to be required
for sand injection to occur (Jolly and Lonergan, 2002; Duranti
and Hurst, 2004), and three mechanisms of fluid overpressuring
and subsequent sand injection are proposed:
� disequilibrium compaction when pore-fluid expulsion from sedi-
ments upon burial is reduced because of rapid loading and/or
good seal integrity (Osborne and Swarbrick, 1997)� seismically induced liquefaction (Obermeier, 1996)� addition of overpressured (petroleum) fluids (Lonergan et al.,
2000)
Each of these mechanisms is invoked to varying extents to ex-
plain the sand injectites in the Tertiary petroleum reservoirs of the
northern North Sea (Lonergan et al., 2000; Jolly and Lonergan, 2002;
Duranti and Hurst, 2004; Huuse et al., 2004).
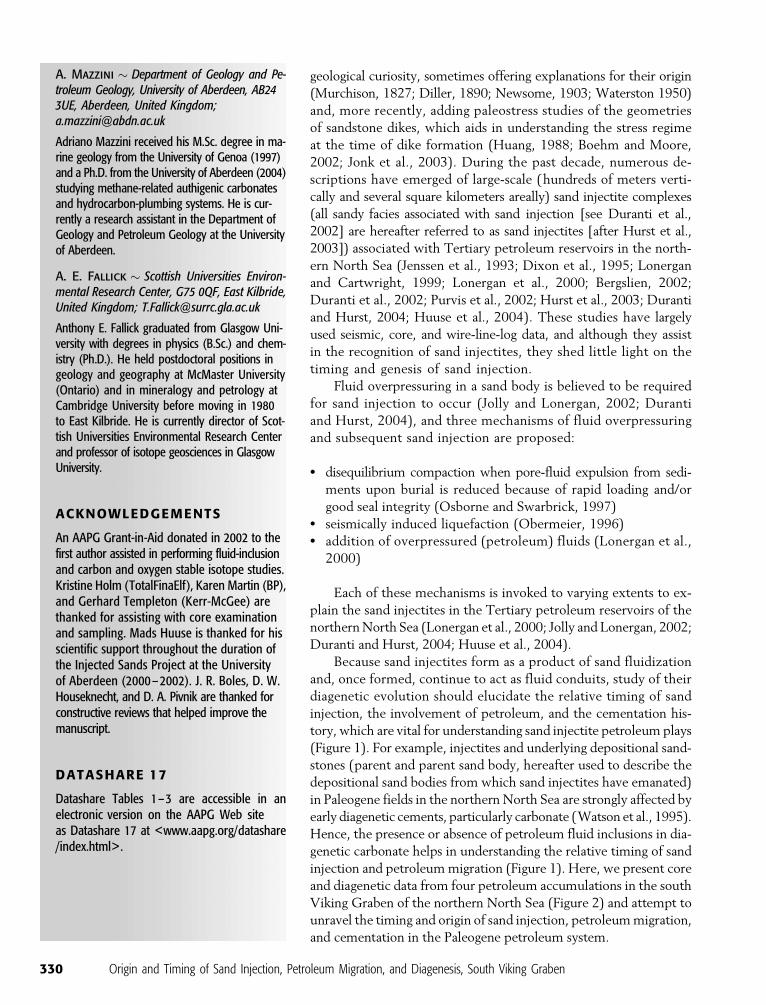
Because sand injectites form as a product of sand fluidization
and, once formed, continue to act as fluid conduits, study of their
diagenetic evolution should elucidate the relative timing of sand
injection, the involvement of petroleum, and the cementation his-
tory, which are vital for understanding sand injectite petroleum plays
(Figure 1). For example, injectites and underlying depositional sand-
stones (parent and parent sand body, hereafter used to describe the
depositional sand bodies from which sand injectites have emanated)
in Paleogene fields in the northern North Sea are strongly affected by
early diagenetic cements, particularly carbonate (Watson et al., 1995).
Hence, the presence or absence of petroleum fluid inclusions in dia-
genetic carbonate helps in understanding the relative timing of sand
injection and petroleum migration (Figure 1). Here, we present core
and diagenetic data from four petroleum accumulations in the south
Viking Graben of the northern North Sea (Figure 2) and attempt to
unravel the timing and origin of sand injection, petroleum migration,
and cementation in the Paleogene petroleum system.
A. Mazzini � Department of Geology and Pe-troleum Geology, University of Aberdeen, AB243UE, Aberdeen, United Kingdom;[email protected]
Adriano Mazzini received his M.Sc. degree in ma-rine geology from the University of Genoa (1997)and a Ph.D. from the University of Aberdeen (2004)studying methane-related authigenic carbonatesand hydrocarbon-plumbing systems. He is cur-rently a research assistant in the Department ofGeology and Petroleum Geology at the Universityof Aberdeen.
A. E. Fallick � Scottish Universities Environ-mental Research Center, G75 0QF, East Kilbride,United Kingdom; [email protected]
Anthony E. Fallick graduated from Glasgow Uni-versity with degrees in physics (B.Sc.) and chem-istry (Ph.D.). He held postdoctoral positions ingeology and geography at McMaster University(Ontario) and in mineralogy and petrology atCambridge University before moving in 1980to East Kilbride. He is currently director of Scot-tish Universities Environmental Research Centerand professor of isotope geosciences in GlasgowUniversity.
ACKNOWLEDGEMENTS
An AAPG Grant-in-Aid donated in 2002 to thefirst author assisted in performing fluid-inclusionand carbon and oxygen stable isotope studies.Kristine Holm (TotalFinaElf), Karen Martin (BP),and Gerhard Templeton (Kerr-McGee) arethanked for assisting with core examinationand sampling. Mads Huuse is thanked for hisscientific support throughout the duration ofthe Injected Sands Project at the Universityof Aberdeen (2000 –2002). J. R. Boles, D. W.Houseknecht, and D. A. Pivnik are thanked forconstructive reviews that helped improve themanuscript.
DATASHARE 17
Datashare Tables 1–3 are accessible in anelectronic version on the AAPG Web siteas Datashare 17 at <www.aapg.org/datashare/index.html> .
330 Origin and Timing of Sand Injection, Petroleum Migration, and Diagenesis, South Viking Graben
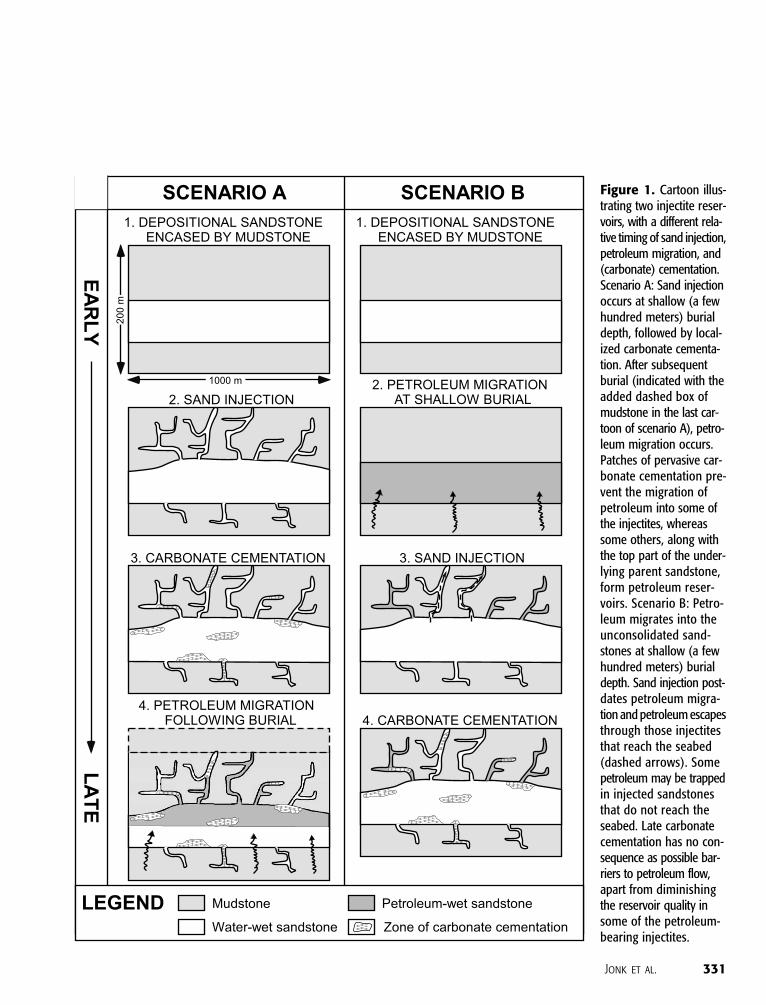
Figure 1. Cartoon illus-trating two injectite reser-voirs, with a different rela-tive timing of sand injection,petroleum migration, and(carbonate) cementation.Scenario A: Sand injectionoccurs at shallow (a fewhundred meters) burialdepth, followed by local-ized carbonate cementa-tion. After subsequentburial (indicated with theadded dashed box ofmudstone in the last car-toon of scenario A), petro-leum migration occurs.Patches of pervasive car-bonate cementation pre-vent the migration ofpetroleum into some ofthe injectites, whereassome others, along withthe top part of the under-lying parent sandstone,form petroleum reser-voirs. Scenario B: Petro-leum migrates into theunconsolidated sand-stones at shallow (a fewhundred meters) burialdepth. Sand injection post-dates petroleum migra-tion and petroleum escapesthrough those injectitesthat reach the seabed(dashed arrows). Somepetroleum may be trappedin injected sandstonesthat do not reach theseabed. Late carbonatecementation has no con-sequence as possible bar-riers to petroleum flow,apart from diminishingthe reservoir quality insome of the petroleum-bearing injectites.
Jonk et al. 331
THE TERTIARY PETROLEUM SYSTEM OF THESOUTH VIKING GRABEN
During the Cenozoic, the North Sea was an intracra-
tonic sag basin developed over a series of failed Meso-
zoic rift structures (Ziegler, 1990).The studied petroleum
accumulations have reservoirs of Paleogene age located
in the south Viking Graben (Figure 2), which, at that
time, was situated in a marine basinal setting with wa-
ter depths of 400–600 m (1300–2000 ft) (Joy, 1992).
Although the Tertiary section in the northern North
Sea is relatively unaffected by tectonic deformation, tec-
tonic activity did have a major influence on sedimen-
tation (Bowman, 1998). Rifting of the Greenland–
European plate in the early Paleocene caused the thermal
uplift of Scotland and the East Shetland platform (Bow-
man, 1998; Haaland et al., 2000; Ahmadi et al., 2003).
Clastic sediments derived from these uplifted areas
were deposited as deltaic and deep-water systems in
the south Viking Graben (Dixon et al., 1995); hence,
the majority of the Paleogene reservoirs are turbidite
systems sourced from the west.
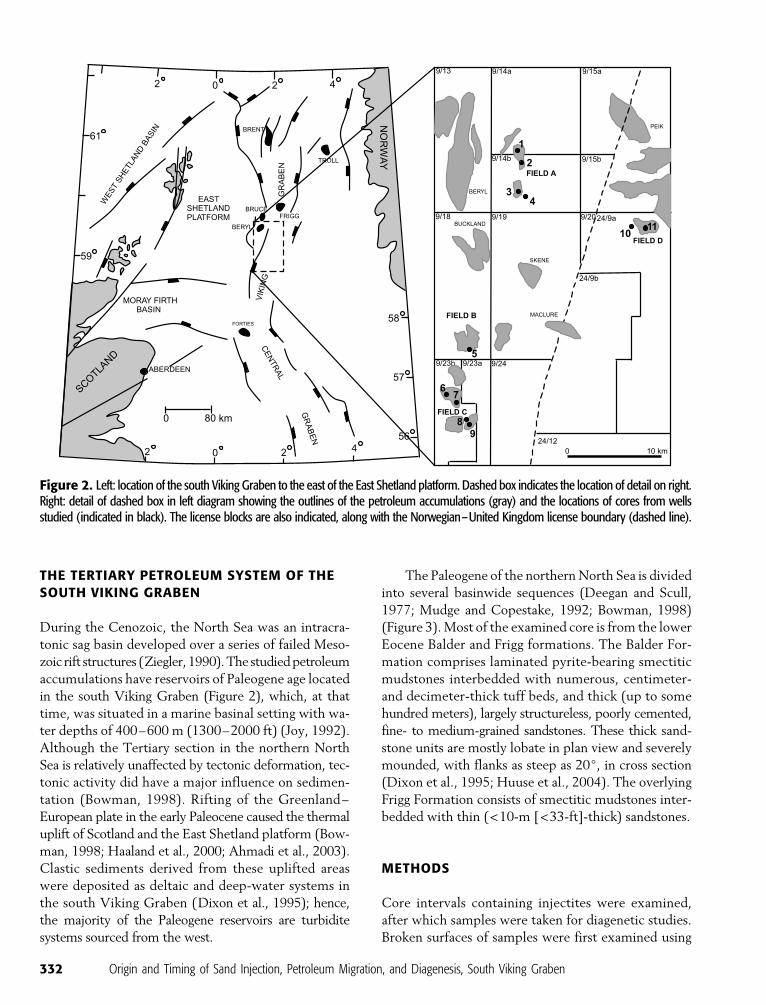
The Paleogene of the northern North Sea is divided
into several basinwide sequences (Deegan and Scull,
1977; Mudge and Copestake, 1992; Bowman, 1998)
(Figure 3). Most of the examined core is from the lower
Eocene Balder and Frigg formations. The Balder For-
mation comprises laminated pyrite-bearing smectitic
mudstones interbedded with numerous, centimeter-
and decimeter-thick tuff beds, and thick (up to some
hundred meters), largely structureless, poorly cemented,
fine- to medium-grained sandstones. These thick sand-
stone units are mostly lobate in plan view and severely
mounded, with flanks as steep as 20j, in cross section
(Dixon et al., 1995; Huuse et al., 2004). The overlying
Frigg Formation consists of smectitic mudstones inter-
bedded with thin (<10-m [<33-ft]-thick) sandstones.
METHODS
Core intervals containing injectites were examined,
after which samples were taken for diagenetic studies.
Broken surfaces of samples were first examined using
Figure 2. Left: location of the south Viking Graben to the east of the East Shetland platform. Dashed box indicates the location of detail on right.Right: detail of dashed box in left diagram showing the outlines of the petroleum accumulations (gray) and the locations of cores from wellsstudied (indicated in black). The license blocks are also indicated, along with the Norwegian–United Kingdom license boundary (dashed line).
332 Origin and Timing of Sand Injection, Petroleum Migration, and Diagenesis, South Viking Graben
an ISI ABT-55 scanning electron microscope with a
Link analytical AN10155S electron-dispersive system
with a beam current of 30–70 mA and an acceleration
voltage between 15 and 25 kV. Following this first ex-
amination, samples were selected for thin sectioning.
Samples were mounted on 75 � 23-mm (3 � 1-in.)
glass slides and ground to a thickness of 30 mm. Samples
were prepared as uncovered polished sections and first
examined using a polarization microscope. Following
this, uncovered polished sections were examined for
different types of carbonates using a Cambridge CITL
Cold Cathodoluminescence 8200 mk3 with operating
beam current conditions of 200–300 mA and an ac-
celeration voltage of 15 kV. Carbon-coated polished
sections were investigated for authigenic quartz and
feldspar using an Oxford Instruments Hot Cathodolu-
minescence detector on a Link analytical AN10155S
electron-dispersive system. Operating beam current
conditions were 30–70 mA with an acceleration voltage
of 25 kV. On the same system, at beam current con-
ditions between 3 and 5 nA, the chemical composition
of diagenetic minerals was determined using a back-
scattered electron detector. Following petrographic stud-
ies, samples were selected for fluid-inclusion studies.
Samples for microthermometric analysis were prepared
as doubly polished wafers and examined using a Linkam
THM600 heating-freezing stage attached to a Nikon
Optiphot2-POL microscope. Finally, carbon and ox-
ygen stable isotope analysis of authigenic carbonates
were carried out at the Scottish Universities Environ-
mental Research Center. Samples of about 1 mg were
drilled from polished slabs with a spatial resolution
of about 1 mm. Sample powders were placed in a
temperature-controlled block at 70jC. Ultrapure he-
lium was used to purge all atmospheric gases. Samples
were digested in 103% H3PO4 (Wachter and Hayes,
1985) and were left for 8 hr to react. Gas was extracted
on a AP2003 Gas Prep Interface by overpressurizing
Figure 3. Lithostratigra-phy and nomenclature ofthe northern North Sea(modified after Mudgeand Copestake, 1992).
Jonk et al. 333
with helium to 5 mbar. The resulting gas was analyzed
using an AP2003 triple-collector mass spectrometer with
a 1s reproducibility of ±0.1xfor both d13C and d18O
values. All data are reported as per-mil deviation from
the Vienna Peedee belemnite (V-PDB) standard unless
stated otherwise.
CORE DESCRIPTION
A total of 904 m (2965 ft) of core from 11 wells from
the 4 studied fields were examined (Figure 2; also
see Datashare Table 1 at AAPG’s Datashare Web site
[Datashare 17], www.aapg.org/datashare/index.html).
The A, B, and C fields are characterized by 10–100-m
(33–330-ft)-thick, largely structureless, unconsolidated
(parent) sands in the Balder Formation, overlain by up
to 100-m (330-ft)-thick sections of interbedded sand-
stone and mudstone, mainly in the upper part of the
Balder Formation and the overlying Frigg Formation.
Only the uppermost 10 m (33 ft) of a 50-m (160-ft)-
thick sandstone body enclosed in the lower part of the
Balder Formation were recovered from the D field.
This thick unit is overlain by generally centimeter-thick
sandstones encased in mudstones and abundant tuffs
and is underlain by a sand-rich (Hermod Member) Sele
Formation.
Four sandy facies, described in the subsequent sec-
tion, are distinguished in the core: depositional sand-
stones, depositional sandstones affected by sand remo-
bilization, injected sandstones, and injection breccias.
Depositional Sandstones
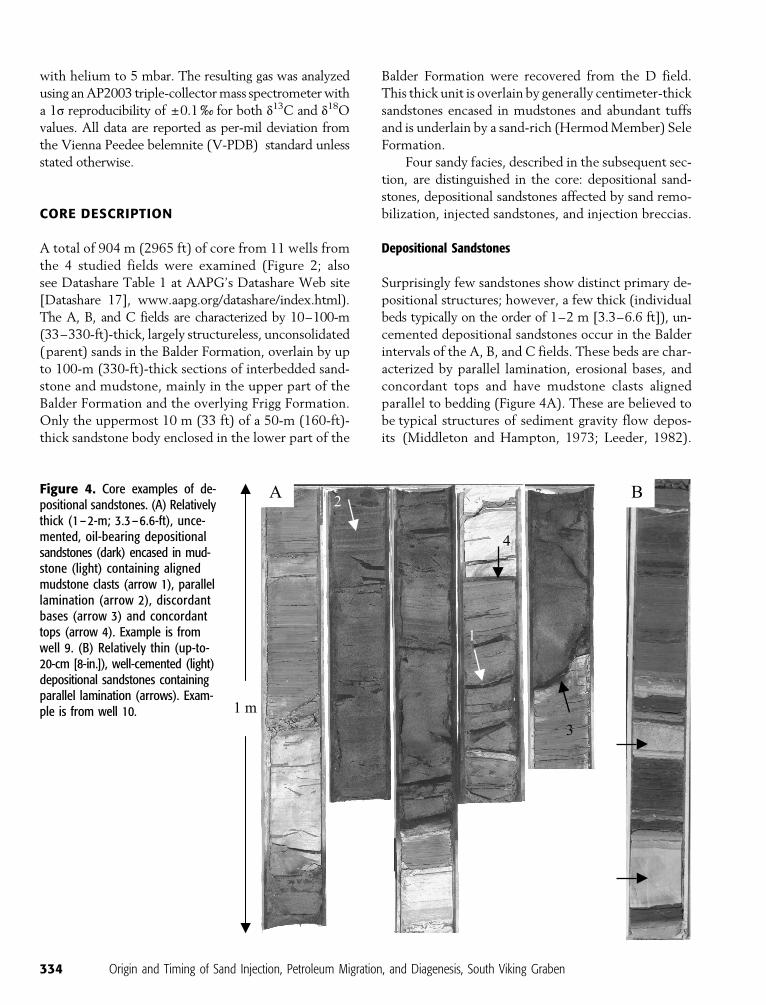
Surprisingly few sandstones show distinct primary de-
positional structures; however, a few thick (individual
beds typically on the order of 1–2 m [3.3–6.6 ft]), un-
cemented depositional sandstones occur in the Balder
intervals of the A, B, and C fields. These beds are char-
acterized by parallel lamination, erosional bases, and
concordant tops and have mudstone clasts aligned
parallel to bedding (Figure 4A). These are believed to
be typical structures of sediment gravity flow depos-
its (Middleton and Hampton, 1973; Leeder, 1982).
Figure 4. Core examples of de-positional sandstones. (A) Relativelythick (1 – 2-m; 3.3 –6.6-ft), unce-mented, oil-bearing depositionalsandstones (dark) encased in mud-stone (light) containing alignedmudstone clasts (arrow 1), parallellamination (arrow 2), discordantbases (arrow 3) and concordanttops (arrow 4). Example is fromwell 9. (B) Relatively thin (up-to-20-cm [8-in.]), well-cemented (light)depositional sandstones containingparallel lamination (arrows). Exam-ple is from well 10.
334 Origin and Timing of Sand Injection, Petroleum Migration, and Diagenesis, South Viking Graben
Thin (up to 20 cm [8 in.] thick) carbonate-cemented,
horizontally laminated sandstone units, which are
interpreted as depositional sandstones, are found in
the Balder section of the D field (Figure 4B).
Depositional Sandstones Affected by Sand Remobilization
The A, B, and C fields comprise 10–100-m (33–330-ft)-
thick sections of uncemented, structureless sandstones
that preserve no depositional structures. Their contacts
with the overlying mudstones, where preserved, are
commonly sharp and discordant. Thick sections of struc-
tureless sandstones in the lower Tertiary section of the
North Sea have been controversially attributed to the
deposition of sandy debris flows (Shanmugam et al.,
1995; Hiscott et al., 1997). The paucity of depositional
structures, the characteristics of the upper contacts, and
the association with injected sandstones in the overlying
mudstones support formation by severe postdeposi-
tional sand fluidization and remobilization, as inferred
for similar sandstones in the nearby Eocene Alba field
(Duranti and Hurst, 2004). The large-scale fluidization
and remobilization required for the upward injection
of significant amounts of sand is likely to have oblit-
erated any depositional structures originally present
(Duranti and Hurst, 2004). Moreover, the steep-sided
mounded geometry of these sand bodies is likely to have
been, at least partially, produced by large-scale sand
remobilization (Dixon et al., 1995; Purvis et al., 2002;
Duranti and Hurst, 2004).
Injected Sandstones
Injected sandstones comprise sandstone dikes (discor-
dant to bedding) and sills (concordant to bedding), with
thicknesses ranging from subcentimeter to meter scale.
Numerous sandstone dikes occur in the up-to-100-m
(330-ft)-thick Balder and Frigg intervals of interbedded
sandstone and mudstone that overlie thick, structureless
sandstones (the parent) in the A, B, and C fields, where-
as the Balder interval of the D field contains only a few
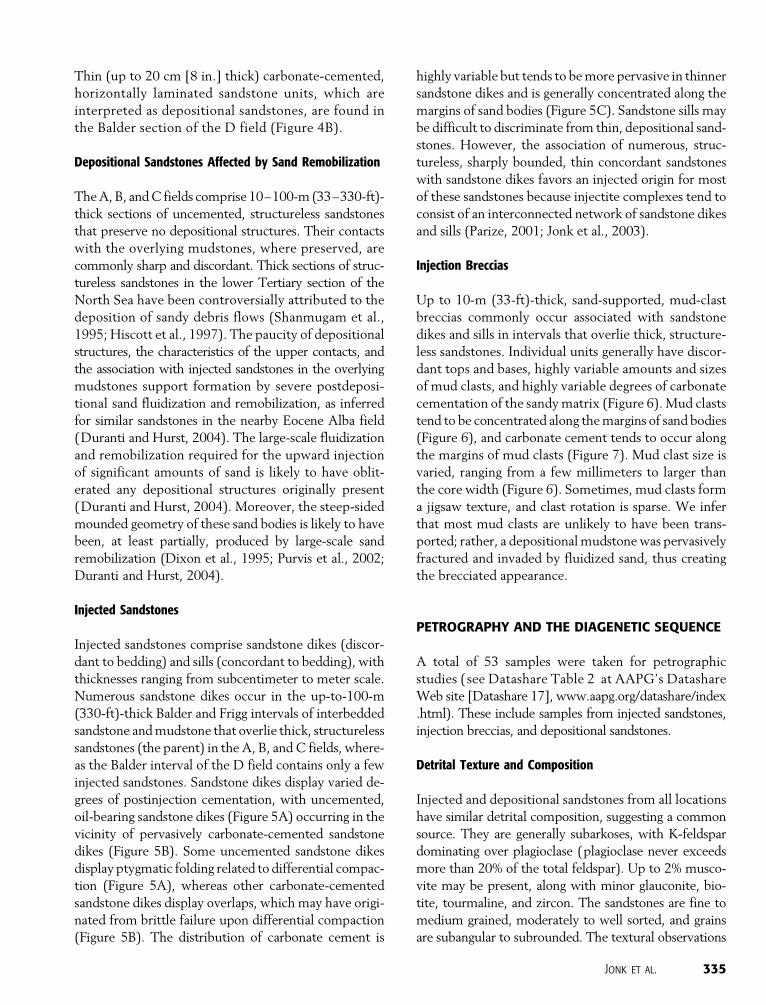
injected sandstones. Sandstone dikes display varied de-
grees of postinjection cementation, with uncemented,
oil-bearing sandstone dikes (Figure 5A) occurring in the
vicinity of pervasively carbonate-cemented sandstone
dikes (Figure 5B). Some uncemented sandstone dikes
display ptygmatic folding related to differential compac-
tion (Figure 5A), whereas other carbonate-cemented
sandstone dikes display overlaps, which may have origi-
nated from brittle failure upon differential compaction
(Figure 5B). The distribution of carbonate cement is
highly variable but tends to be more pervasive in thinner
sandstone dikes and is generally concentrated along the
margins of sand bodies (Figure 5C). Sandstone sills may
be difficult to discriminate from thin, depositional sand-
stones. However, the association of numerous, struc-
tureless, sharply bounded, thin concordant sandstones
with sandstone dikes favors an injected origin for most
of these sandstones because injectite complexes tend to
consist of an interconnected network of sandstone dikes
and sills (Parize, 2001; Jonk et al., 2003).
Injection Breccias
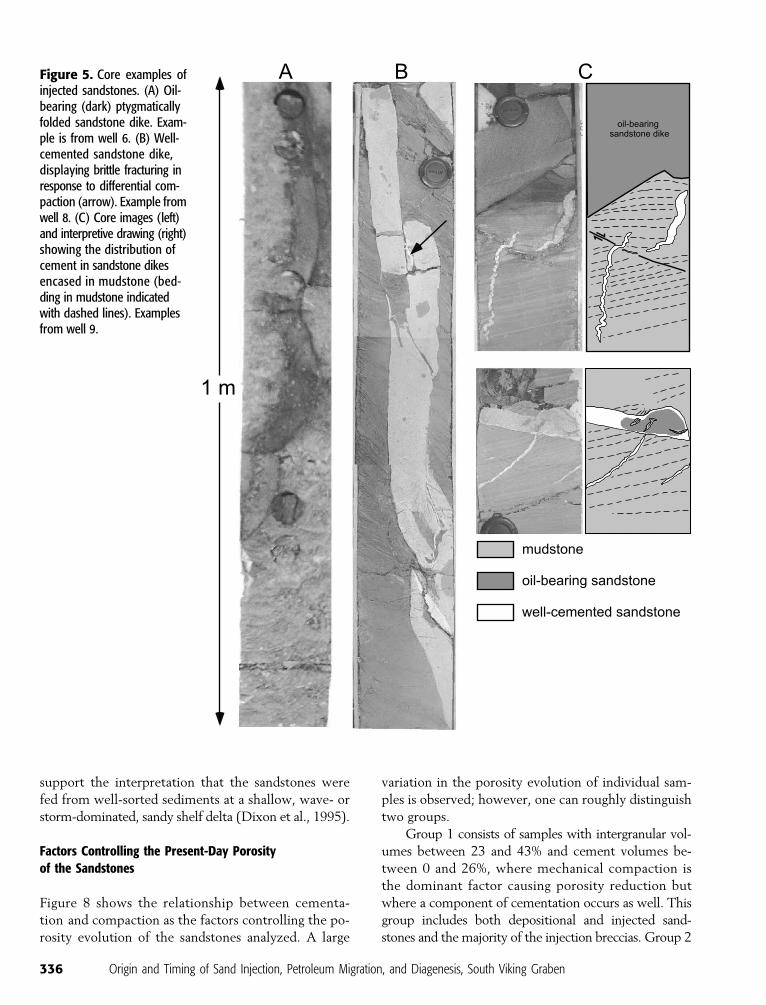
Up to 10-m (33-ft)-thick, sand-supported, mud-clast
breccias commonly occur associated with sandstone
dikes and sills in intervals that overlie thick, structure-
less sandstones. Individual units generally have discor-
dant tops and bases, highly variable amounts and sizes
of mud clasts, and highly variable degrees of carbonate
cementation of the sandy matrix (Figure 6). Mud clasts
tend to be concentrated along the margins of sand bodies
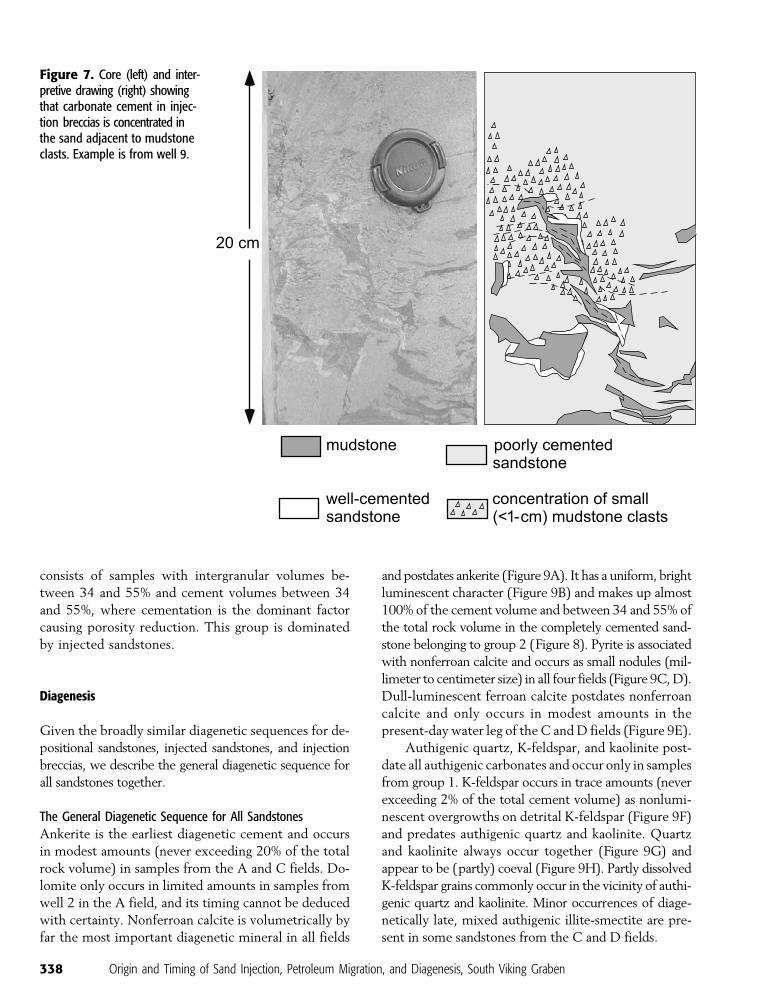
(Figure 6), and carbonate cement tends to occur along
the margins of mud clasts (Figure 7). Mud clast size is
varied, ranging from a few millimeters to larger than
the core width (Figure 6). Sometimes, mud clasts form
a jigsaw texture, and clast rotation is sparse. We infer
that most mud clasts are unlikely to have been trans-
ported; rather, a depositional mudstone was pervasively
fractured and invaded by fluidized sand, thus creating
the brecciated appearance.
PETROGRAPHY AND THE DIAGENETIC SEQUENCE
A total of 53 samples were taken for petrographic
studies ( see Datashare Table 2 at AAPG’s Datashare
Web site [Datashare 17], www.aapg.org/datashare/index
.html). These include samples from injected sandstones,
injection breccias, and depositional sandstones.
Detrital Texture and Composition
Injected and depositional sandstones from all locations
have similar detrital composition, suggesting a common
source. They are generally subarkoses, with K-feldspar
dominating over plagioclase (plagioclase never exceeds
more than 20% of the total feldspar). Up to 2% musco-
vite may be present, along with minor glauconite, bio-
tite, tourmaline, and zircon. The sandstones are fine to
medium grained, moderately to well sorted, and grains
are subangular to subrounded. The textural observations
Jonk et al. 335
support the interpretation that the sandstones were
fed from well-sorted sediments at a shallow, wave- or
storm-dominated, sandy shelf delta (Dixon et al., 1995).
Factors Controlling the Present-Day Porosityof the Sandstones
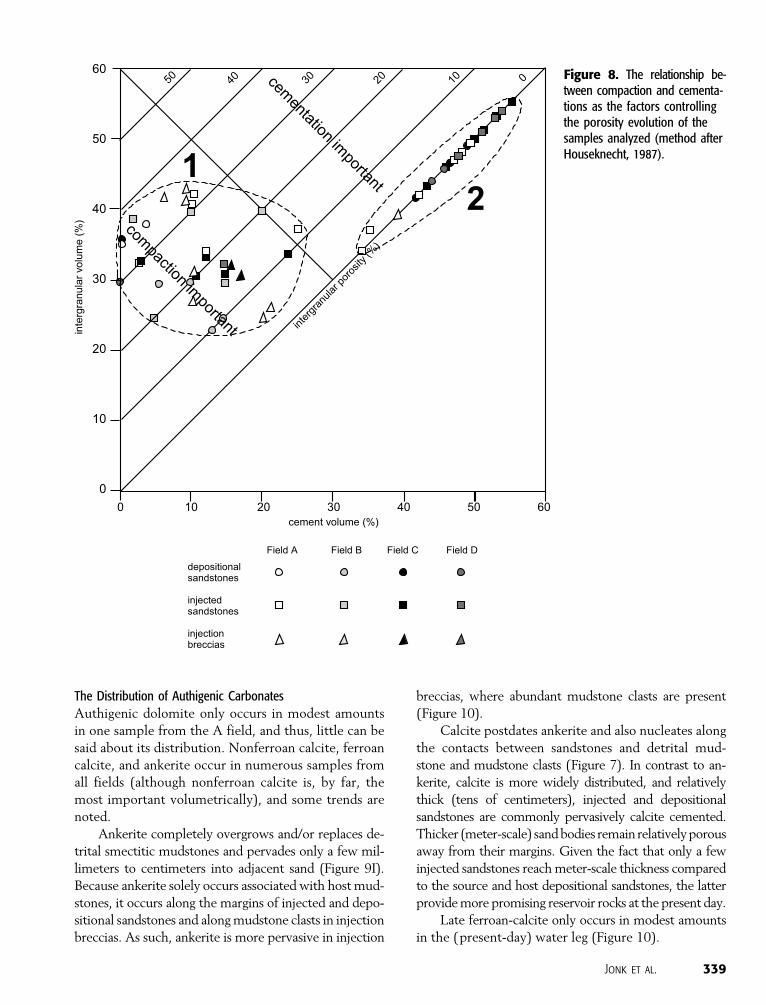
Figure 8 shows the relationship between cementa-
tion and compaction as the factors controlling the po-
rosity evolution of the sandstones analyzed. A large
variation in the porosity evolution of individual sam-
ples is observed; however, one can roughly distinguish
two groups.
Group 1 consists of samples with intergranular vol-
umes between 23 and 43% and cement volumes be-
tween 0 and 26%, where mechanical compaction is
the dominant factor causing porosity reduction but
where a component of cementation occurs as well. This
group includes both depositional and injected sand-
stones and the majority of the injection breccias. Group 2
Figure 5. Core examples ofinjected sandstones. (A) Oil-bearing (dark) ptygmaticallyfolded sandstone dike. Exam-ple is from well 6. (B) Well-cemented sandstone dike,displaying brittle fracturing inresponse to differential com-paction (arrow). Example fromwell 8. (C) Core images (left)and interpretive drawing (right)showing the distribution ofcement in sandstone dikesencased in mudstone (bed-ding in mudstone indicatedwith dashed lines). Examplesfrom well 9.
336 Origin and Timing of Sand Injection, Petroleum Migration, and Diagenesis, South Viking Graben
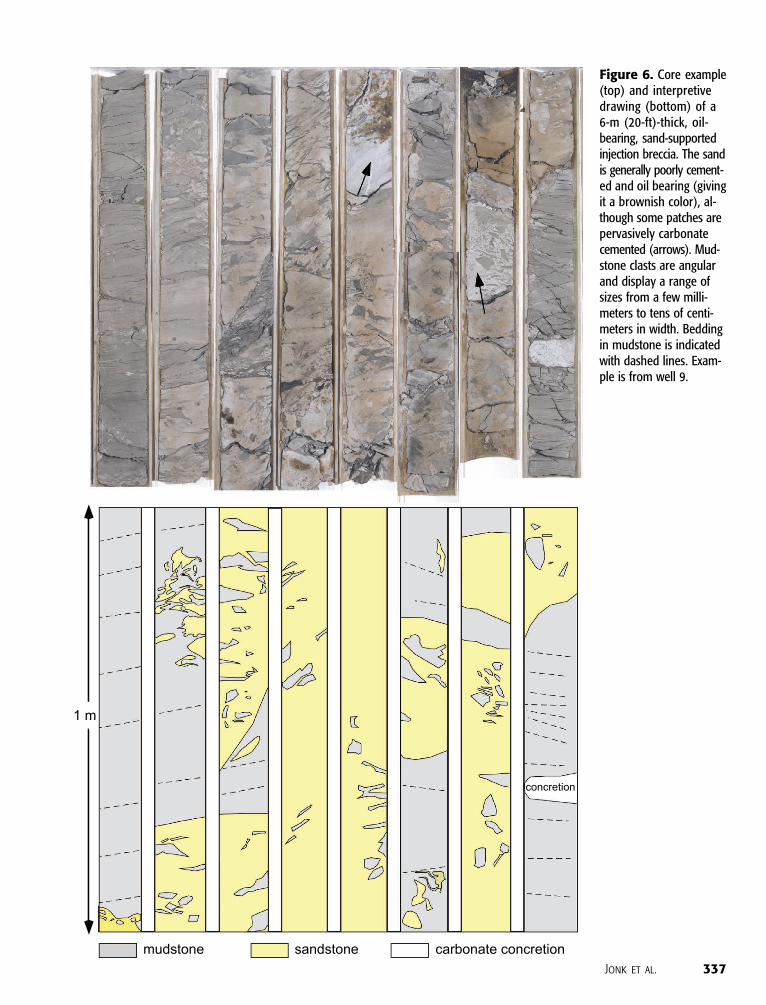
Figure 6. Core example(top) and interpretivedrawing (bottom) of a6-m (20-ft)-thick, oil-bearing, sand-supportedinjection breccia. The sandis generally poorly cement-ed and oil bearing (givingit a brownish color), al-though some patches arepervasively carbonatecemented (arrows). Mud-stone clasts are angularand display a range ofsizes from a few milli-meters to tens of centi-meters in width. Beddingin mudstone is indicatedwith dashed lines. Exam-ple is from well 9.
Jonk et al. 337
consists of samples with intergranular volumes be-
tween 34 and 55% and cement volumes between 34
and 55%, where cementation is the dominant factor
causing porosity reduction. This group is dominated
by injected sandstones.
Diagenesis
Given the broadly similar diagenetic sequences for de-
positional sandstones, injected sandstones, and injection
breccias, we describe the general diagenetic sequence for
all sandstones together.
The General Diagenetic Sequence for All Sandstones
Ankerite is the earliest diagenetic cement and occurs
in modest amounts (never exceeding 20% of the total
rock volume) in samples from the A and C fields. Do-
lomite only occurs in limited amounts in samples from
well 2 in the A field, and its timing cannot be deduced
with certainty. Nonferroan calcite is volumetrically by
far the most important diagenetic mineral in all fields
and postdates ankerite (Figure 9A). It has a uniform, bright
luminescent character (Figure 9B) and makes up almost
100% of the cement volume and between 34 and 55% of
the total rock volume in the completely cemented sand-
stone belonging to group 2 (Figure 8). Pyrite is associated
with nonferroan calcite and occurs as small nodules (mil-
limeter to centimeter size) in all four fields (Figure 9C, D).
Dull-luminescent ferroan calcite postdates nonferroan
calcite and only occurs in modest amounts in the
present-day water leg of the C and D fields (Figure 9E).
Authigenic quartz, K-feldspar, and kaolinite post-
date all authigenic carbonates and occur only in samples
from group 1. K-feldspar occurs in trace amounts (never
exceeding 2% of the total cement volume) as nonlumi-
nescent overgrowths on detrital K-feldspar (Figure 9F)
and predates authigenic quartz and kaolinite. Quartz
and kaolinite always occur together (Figure 9G) and
appear to be (partly) coeval (Figure 9H). Partly dissolved
K-feldspar grains commonly occur in the vicinity of authi-
genic quartz and kaolinite. Minor occurrences of diage-
netically late, mixed authigenic illite-smectite are pre-
sent in some sandstones from the C and D fields.
Figure 7. Core (left) and inter-pretive drawing (right) showingthat carbonate cement in injec-tion breccias is concentrated inthe sand adjacent to mudstoneclasts. Example is from well 9.
338 Origin and Timing of Sand Injection, Petroleum Migration, and Diagenesis, South Viking Graben
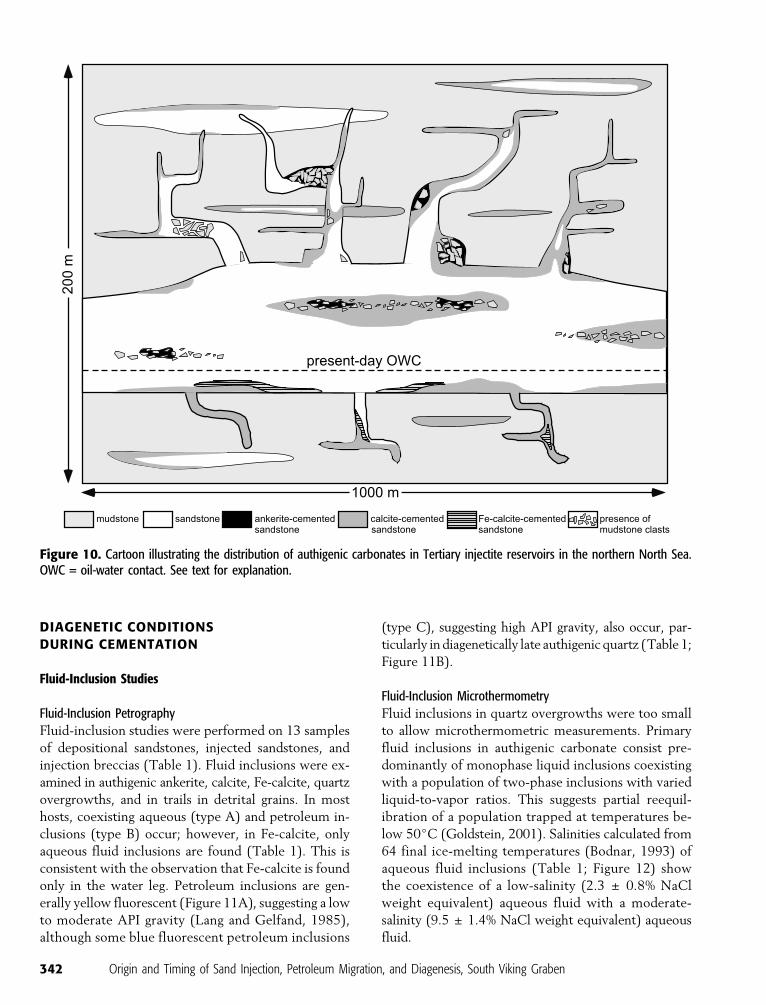
The Distribution of Authigenic Carbonates
Authigenic dolomite only occurs in modest amounts
in one sample from the A field, and thus, little can be
said about its distribution. Nonferroan calcite, ferroan
calcite, and ankerite occur in numerous samples from
all fields (although nonferroan calcite is, by far, the
most important volumetrically), and some trends are
noted.
Ankerite completely overgrows and/or replaces de-
trital smectitic mudstones and pervades only a few mil-
limeters to centimeters into adjacent sand (Figure 9I).
Because ankerite solely occurs associated with host mud-
stones, it occurs along the margins of injected and depo-
sitional sandstones and along mudstone clasts in injection
breccias. As such, ankerite is more pervasive in injection
breccias, where abundant mudstone clasts are present
(Figure 10).
Calcite postdates ankerite and also nucleates along
the contacts between sandstones and detrital mud-
stone and mudstone clasts (Figure 7). In contrast to an-
kerite, calcite is more widely distributed, and relatively
thick (tens of centimeters), injected and depositional
sandstones are commonly pervasively calcite cemented.
Thicker (meter-scale) sand bodies remain relativelyporous
away from their margins. Given the fact that only a few
injected sandstones reach meter-scale thickness compared
to the source and host depositional sandstones, the latter
provide more promising reservoir rocks at the present day.
Late ferroan-calcite only occurs in modest amounts
in the (present-day) water leg (Figure 10).
Figure 8. The relationship be-tween compaction and cementa-tions as the factors controllingthe porosity evolution of thesamples analyzed (method afterHouseknecht, 1987).
Jonk et al. 339
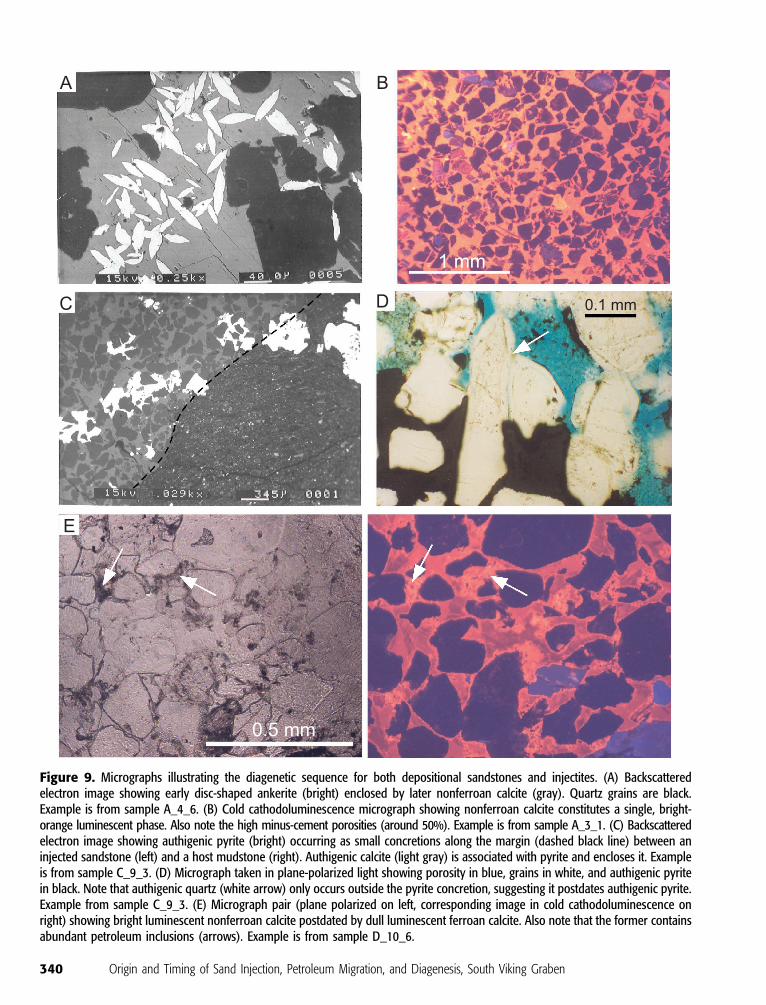
Figure 9. Micrographs illustrating the diagenetic sequence for both depositional sandstones and injectites. (A) Backscatteredelectron image showing early disc-shaped ankerite (bright) enclosed by later nonferroan calcite (gray). Quartz grains are black.Example is from sample A_4_6. (B) Cold cathodoluminescence micrograph showing nonferroan calcite constitutes a single, bright-orange luminescent phase. Also note the high minus-cement porosities (around 50%). Example is from sample A_3_1. (C) Backscatteredelectron image showing authigenic pyrite (bright) occurring as small concretions along the margin (dashed black line) between aninjected sandstone (left) and a host mudstone (right). Authigenic calcite (light gray) is associated with pyrite and encloses it. Exampleis from sample C_9_3. (D) Micrograph taken in plane-polarized light showing porosity in blue, grains in white, and authigenic pyritein black. Note that authigenic quartz (white arrow) only occurs outside the pyrite concretion, suggesting it postdates authigenic pyrite.Example from sample C_9_3. (E) Micrograph pair (plane polarized on left, corresponding image in cold cathodoluminescence onright) showing bright luminescent nonferroan calcite postdated by dull luminescent ferroan calcite. Also note that the former containsabundant petroleum inclusions (arrows). Example is from sample D_10_6.
340 Origin and Timing of Sand Injection, Petroleum Migration, and Diagenesis, South Viking Graben
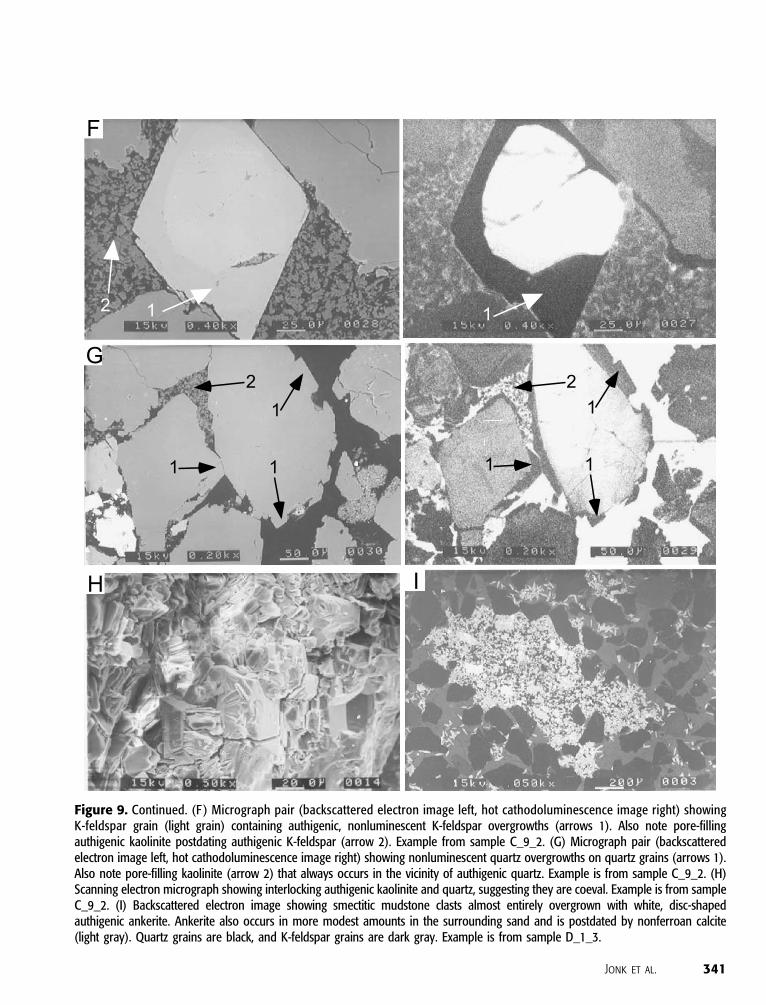
Figure 9. Continued. (F ) Micrograph pair (backscattered electron image left, hot cathodoluminescence image right) showingK-feldspar grain (light grain) containing authigenic, nonluminescent K-feldspar overgrowths (arrows 1). Also note pore-fillingauthigenic kaolinite postdating authigenic K-feldspar (arrow 2). Example from sample C_9_2. (G) Micrograph pair (backscatteredelectron image left, hot cathodoluminescence image right) showing nonluminescent quartz overgrowths on quartz grains (arrows 1).Also note pore-filling kaolinite (arrow 2) that always occurs in the vicinity of authigenic quartz. Example is from sample C_9_2. (H)Scanning electron micrograph showing interlocking authigenic kaolinite and quartz, suggesting they are coeval. Example is from sampleC_9_2. (I) Backscattered electron image showing smectitic mudstone clasts almost entirely overgrown with white, disc-shapedauthigenic ankerite. Ankerite also occurs in more modest amounts in the surrounding sand and is postdated by nonferroan calcite(light gray). Quartz grains are black, and K-feldspar grains are dark gray. Example is from sample D_1_3.
Jonk et al. 341
DIAGENETIC CONDITIONSDURING CEMENTATION
Fluid-Inclusion Studies
Fluid-Inclusion Petrography
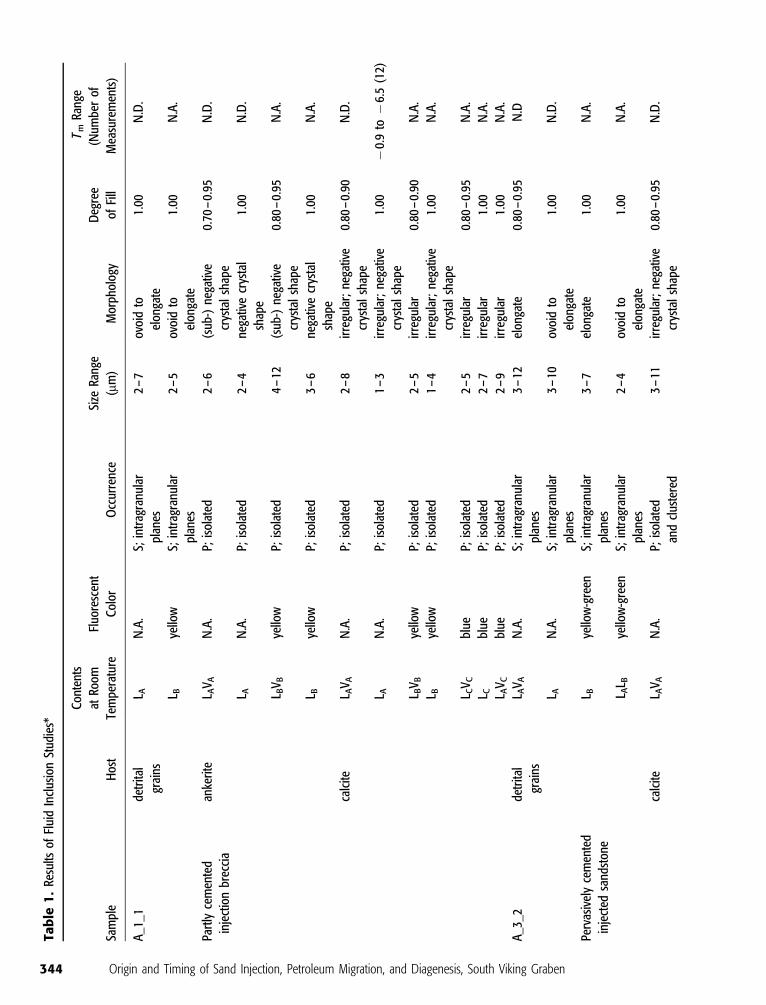
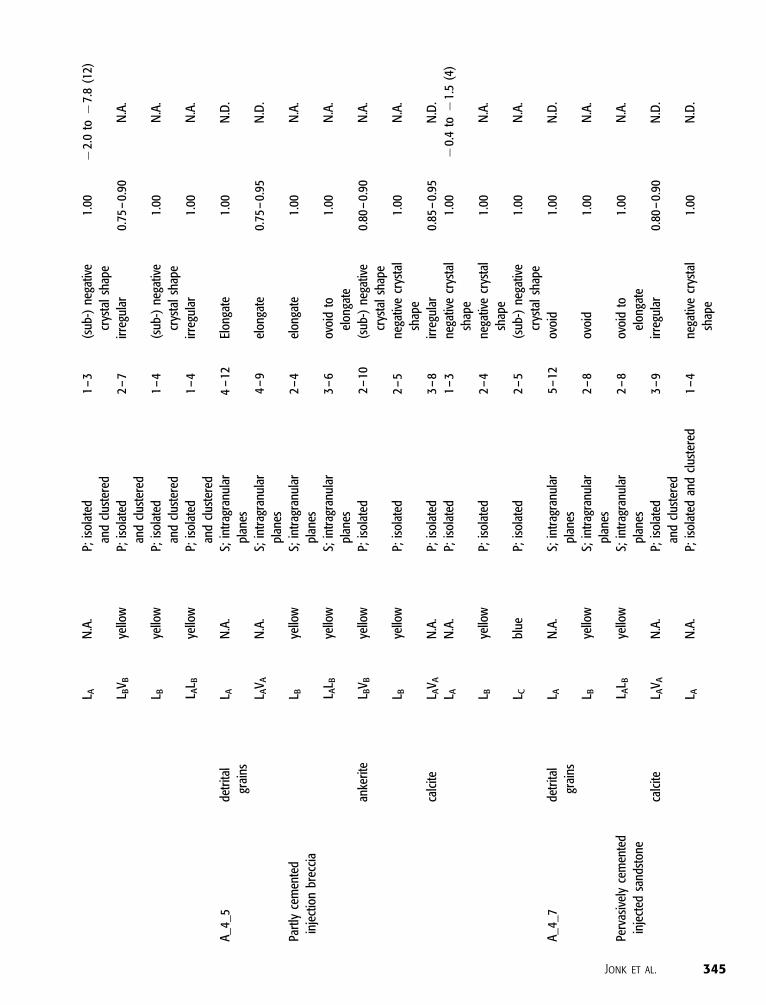
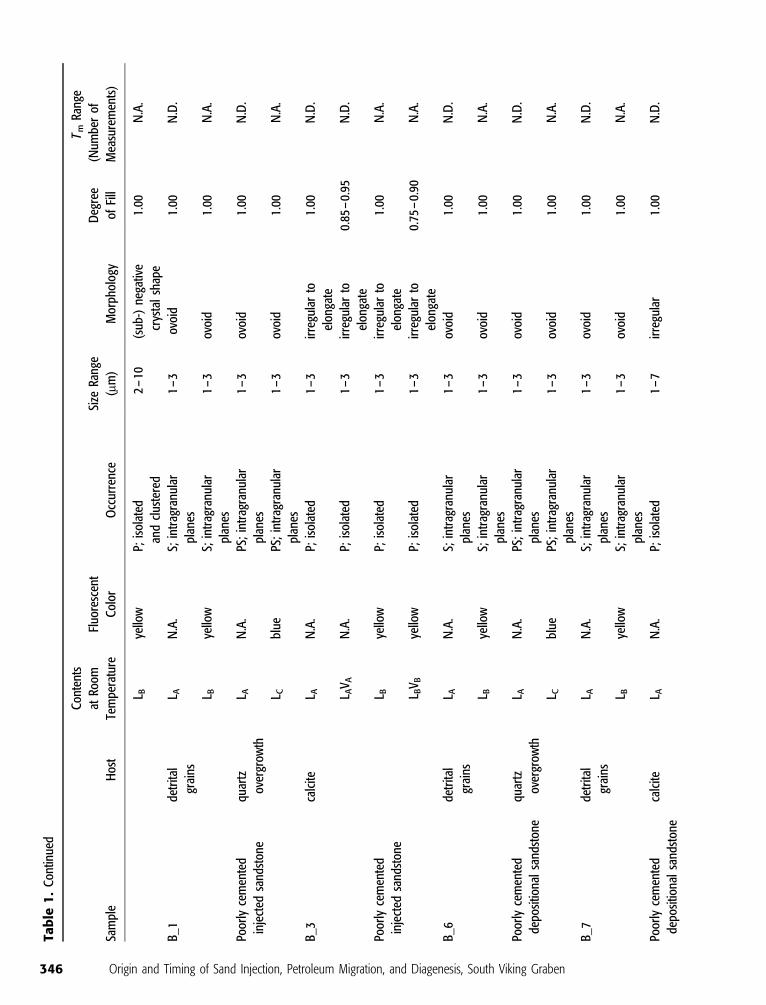
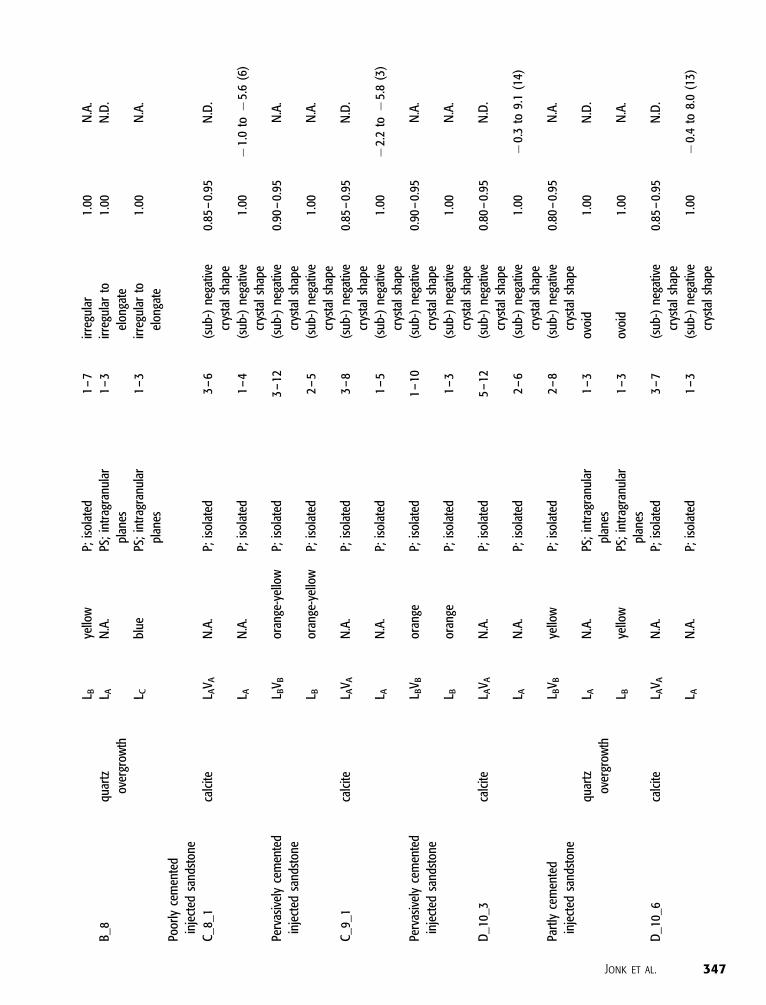
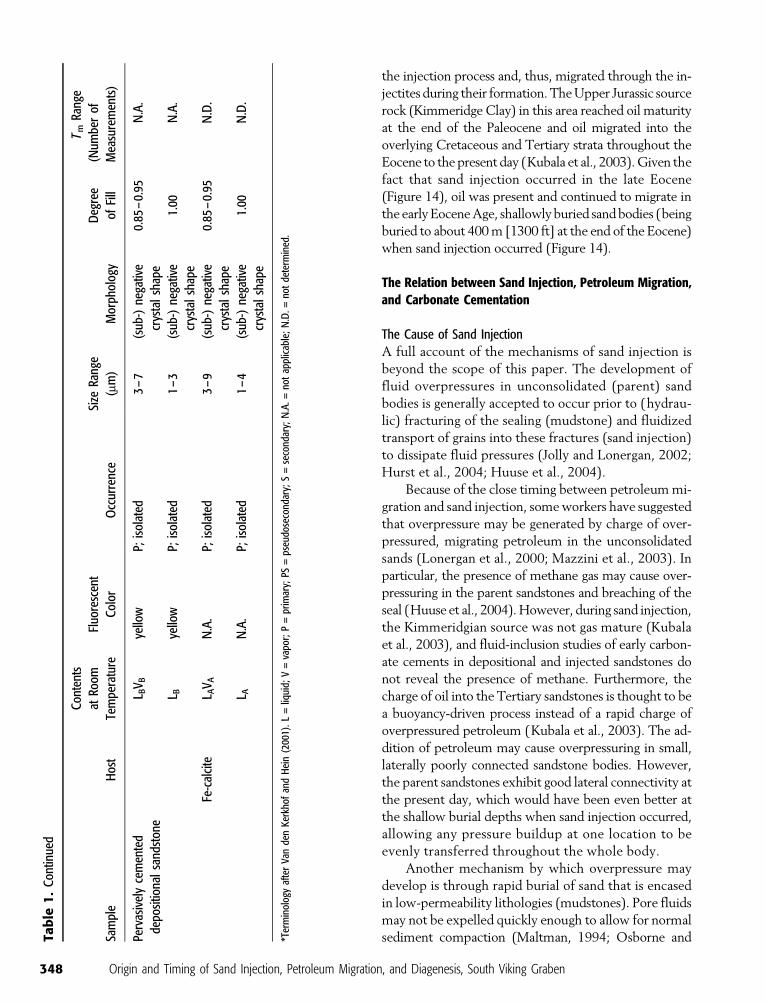
Fluid-inclusion studies were performed on 13 samples
of depositional sandstones, injected sandstones, and
injection breccias (Table 1). Fluid inclusions were ex-
amined in authigenic ankerite, calcite, Fe-calcite, quartz
overgrowths, and in trails in detrital grains. In most
hosts, coexisting aqueous (type A) and petroleum in-
clusions (type B) occur; however, in Fe-calcite, only
aqueous fluid inclusions are found (Table 1). This is
consistent with the observation that Fe-calcite is found
only in the water leg. Petroleum inclusions are gen-
erally yellow fluorescent (Figure 11A), suggesting a low
to moderate API gravity (Lang and Gelfand, 1985),
although some blue fluorescent petroleum inclusions
(type C), suggesting high API gravity, also occur, par-
ticularly in diagenetically late authigenic quartz (Table 1;
Figure 11B).
Fluid-Inclusion Microthermometry
Fluid inclusions in quartz overgrowths were too small
to allow microthermometric measurements. Primary
fluid inclusions in authigenic carbonate consist pre-
dominantly of monophase liquid inclusions coexisting
with a population of two-phase inclusions with varied
liquid-to-vapor ratios. This suggests partial reequil-
ibration of a population trapped at temperatures be-
low 50jC (Goldstein, 2001). Salinities calculated from
64 final ice-melting temperatures (Bodnar, 1993) of
aqueous fluid inclusions (Table 1; Figure 12) show
the coexistence of a low-salinity (2.3 ± 0.8% NaCl
weight equivalent) aqueous fluid with a moderate-
salinity (9.5 ± 1.4% NaCl weight equivalent) aqueous
fluid.
Figure 10. Cartoon illustrating the distribution of authigenic carbonates in Tertiary injectite reservoirs in the northern North Sea.OWC = oil-water contact. See text for explanation.
342 Origin and Timing of Sand Injection, Petroleum Migration, and Diagenesis, South Viking Graben
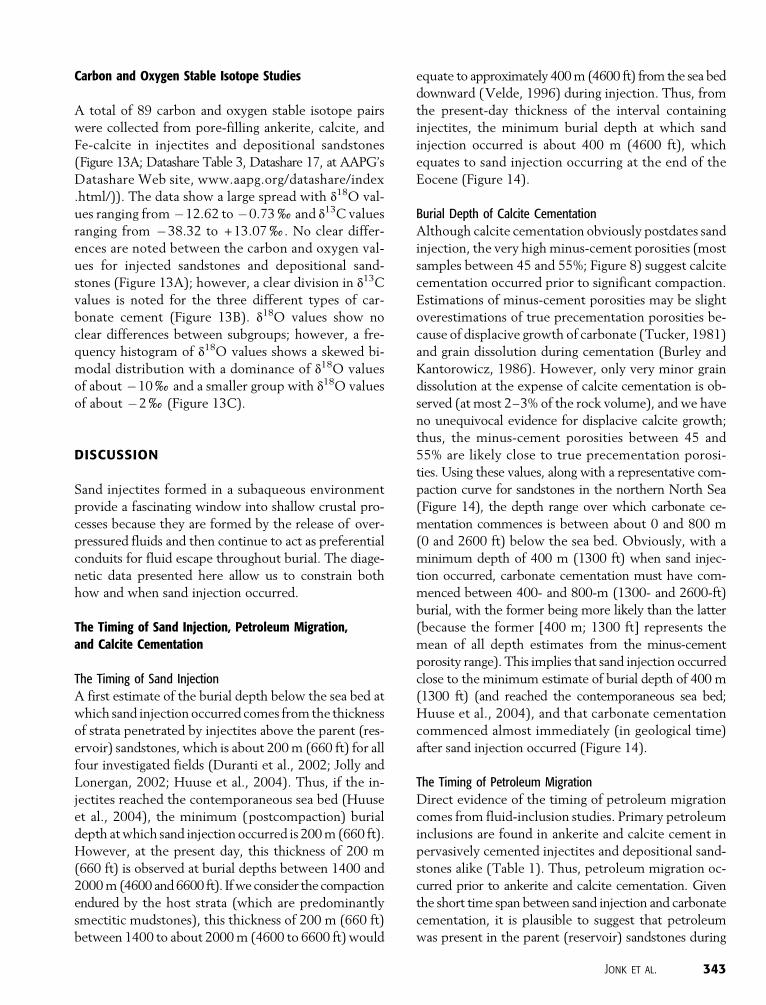
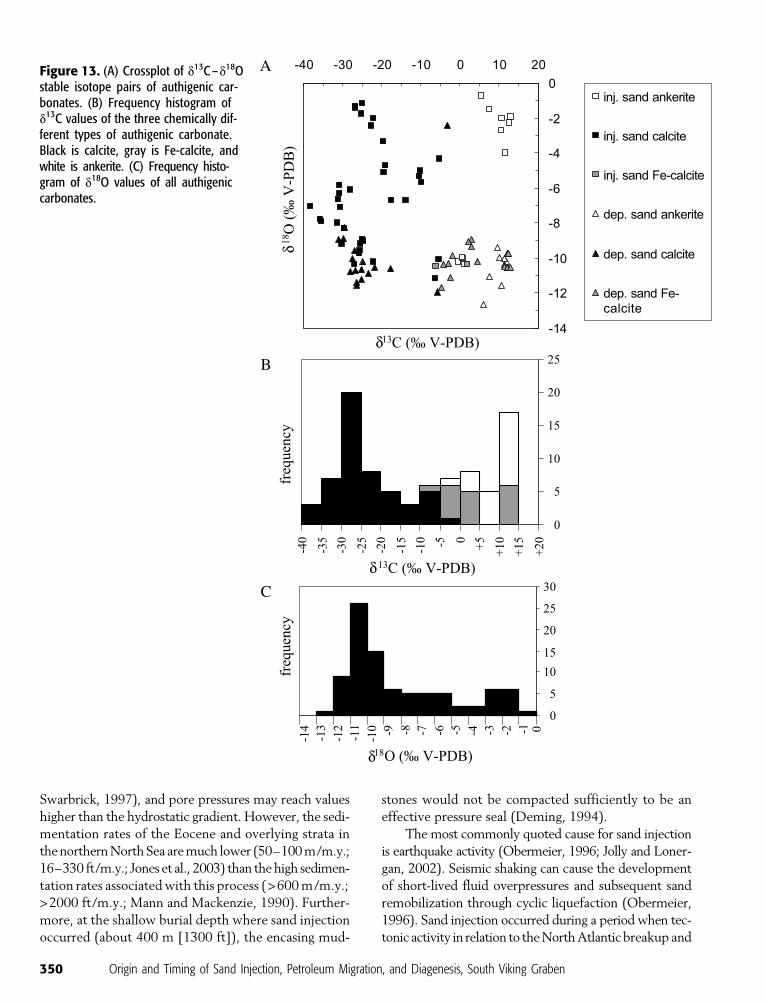
Carbon and Oxygen Stable Isotope Studies
A total of 89 carbon and oxygen stable isotope pairs
were collected from pore-filling ankerite, calcite, and
Fe-calcite in injectites and depositional sandstones
(Figure 13A; Datashare Table 3, Datashare 17, at AAPG’s
Datashare Web site, www.aapg.org/datashare/index
.html/)). The data show a large spread with d18O val-
ues ranging from �12.62 to �0.73xand d13C values
ranging from �38.32 to +13.07x. No clear differ-
ences are noted between the carbon and oxygen val-
ues for injected sandstones and depositional sand-
stones (Figure 13A); however, a clear division in d13C
values is noted for the three different types of car-
bonate cement (Figure 13B). d18O values show no
clear differences between subgroups; however, a fre-
quency histogram of d18O values shows a skewed bi-
modal distribution with a dominance of d18O values
of about �10xand a smaller group with d18O values
of about �2x(Figure 13C).
DISCUSSION
Sand injectites formed in a subaqueous environment
provide a fascinating window into shallow crustal pro-
cesses because they are formed by the release of over-
pressured fluids and then continue to act as preferential
conduits for fluid escape throughout burial. The diage-
netic data presented here allow us to constrain both
how and when sand injection occurred.
The Timing of Sand Injection, Petroleum Migration,and Calcite Cementation
The Timing of Sand Injection
A first estimate of the burial depth below the sea bed at
which sand injection occurred comes from the thickness
of strata penetrated by injectites above the parent (res-
ervoir) sandstones, which is about 200 m (660 ft) for all
four investigated fields (Duranti et al., 2002; Jolly and
Lonergan, 2002; Huuse et al., 2004). Thus, if the in-
jectites reached the contemporaneous sea bed (Huuse
et al., 2004), the minimum (postcompaction) burial
depth at which sand injection occurred is 200 m (660 ft).
However, at the present day, this thickness of 200 m
(660 ft) is observed at burial depths between 1400 and
2000 m (4600 and 6600 ft). If we consider the compaction
endured by the host strata (which are predominantly
smectitic mudstones), this thickness of 200 m (660 ft)
between 1400 to about 2000 m (4600 to 6600 ft) would
equate to approximately 400 m (4600 ft) from the sea bed
downward (Velde, 1996) during injection. Thus, from
the present-day thickness of the interval containing
injectites, the minimum burial depth at which sand
injection occurred is about 400 m (4600 ft), which
equates to sand injection occurring at the end of the
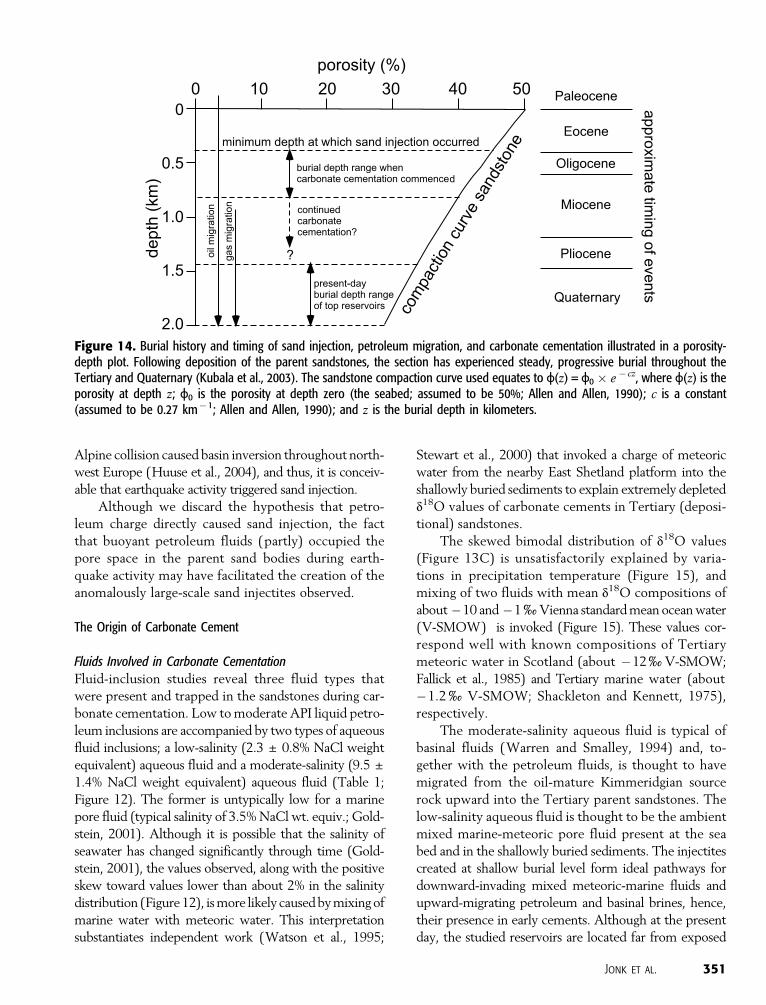
Eocene (Figure 14).
Burial Depth of Calcite Cementation
Although calcite cementation obviously postdates sand
injection, the very high minus-cement porosities (most
samples between 45 and 55%; Figure 8) suggest calcite
cementation occurred prior to significant compaction.
Estimations of minus-cement porosities may be slight
overestimations of true precementation porosities be-
cause of displacive growth of carbonate (Tucker, 1981)
and grain dissolution during cementation (Burley and
Kantorowicz, 1986). However, only very minor grain
dissolution at the expense of calcite cementation is ob-
served (at most 2–3% of the rock volume), and we have
no unequivocal evidence for displacive calcite growth;
thus, the minus-cement porosities between 45 and
55% are likely close to true precementation porosi-
ties. Using these values, along with a representative com-
paction curve for sandstones in the northern North Sea
(Figure 14), the depth range over which carbonate ce-
mentation commences is between about 0 and 800 m
(0 and 2600 ft) below the sea bed. Obviously, with a
minimum depth of 400 m (1300 ft) when sand injec-
tion occurred, carbonate cementation must have com-
menced between 400- and 800-m (1300- and 2600-ft)
burial, with the former being more likely than the latter
(because the former [400 m; 1300 ft] represents the
mean of all depth estimates from the minus-cement
porosity range). This implies that sand injection occurred
close to the minimum estimate of burial depth of 400 m
(1300 ft) (and reached the contemporaneous sea bed;
Huuse et al., 2004), and that carbonate cementation
commenced almost immediately (in geological time)
after sand injection occurred (Figure 14).
The Timing of Petroleum Migration
Direct evidence of the timing of petroleum migration
comes from fluid-inclusion studies. Primary petroleum
inclusions are found in ankerite and calcite cement in
pervasively cemented injectites and depositional sand-
stones alike (Table 1). Thus, petroleum migration oc-
curred prior to ankerite and calcite cementation. Given
the short time span between sand injection and carbonate
cementation, it is plausible to suggest that petroleum
was present in the parent (reservoir) sandstones during
Jonk et al. 343
Tab
le1
.Re
sults
ofFl
uid
Incl
usio
nSt
udie
s*
Sam
ple
Hos
t
Con
tent
s
atRo
om
Tem
pera
ture
Fluo
resc
ent
Col
orO
ccur
renc
e
Size
Rang
e
(mm
)M
orph
olog
y
Deg
ree
ofFi
ll
Tm
Rang
e
(Num
ber
of
Mea
sure
men
ts)
A_1
_1de
trita
l
grai
ns
L AN
.A.
S;in
trag
ranu
lar
plan
es
2–
7ov
oid
to
elon
gate
1.00
N.D
.
L Bye
llow
S;in
trag
ranu
lar
plan
es
2–
5ov
oid
to
elon
gate
1.00
N.A
.
Part
lyce
men
ted
inje
ctio
nbr
ecci
a
anke
rite
L AV A
N.A
.P;
isol
ated
2–
6(s
ub-)
nega
tive
crys
tal
shap
e
0.70
–0.
95N
.D.
L AN
.A.
P;is
olat
ed2
–4
nega
tive
crys
tal
shap
e
1.00
N.D
.
L BV B
yello
wP;
isol
ated
4–
12(s
ub-)
nega
tive
crys
tal
shap
e
0.80
–0.
95N
.A.
L Bye
llow
P;is
olat
ed3
–6
nega
tive
crys
tal
shap
e
1.00
N.A
.
calc
iteL A
V AN
.A.
P;is
olat
ed2
–8
irre
gula
r;ne
gativ
e
crys
tal
shap
e
0.80
–0.
90N
.D.
L AN
.A.
P;is
olat
ed1
–3
irre
gula
r;ne
gativ
e
crys
tal
shap
e
1.00
�0.
9to
�6.
5(1
2)
L BV B
yello
wP;
isol
ated
2–
5ir
regu
lar
0.80
–0.
90N
.A.
L Bye
llow
P;is
olat
ed1
–4
irre
gula
r;ne
gativ
e
crys
tal
shap
e
1.00
N.A
.
L CV C
blue
P;is
olat
ed2
–5
irre
gula
r0.
80–
0.95
N.A
.
L Cbl
ueP;
isol
ated
2–
7ir
regu
lar
1.00
N.A
.
L AV C
blue
P;is
olat
ed2
–9
irre
gula
r1.
00N
.A.
A_3
_2de
trita
l
grai
ns
L AV A
N.A
.S;
intr
agra
nula
r
plan
es
3–
12el
onga
te0.
80–
0.95
N.D
L AN
.A.
S;in
trag
ranu
lar
plan
es
3–
10ov
oid
to
elon
gate
1.00
N.D
.
Perv
asiv
ely
cem
ente
d
inje
cted
sand
ston
e
L Bye
llow
-gre
enS;
intr
agra
nula
r
plan
es
3–
7el
onga
te1.
00N
.A.
L AL B
yello
w-g
reen
S;in
trag
ranu
lar
plan
es
2–
4ov
oid
to
elon
gate
1.00
N.A
.
calc
iteL A
V AN
.A.
P;is
olat
ed
and
clus
tere
d
3–
11ir
regu
lar;
nega
tive
crys
tal
shap
e
0.80
–0.
95N
.D.
344 Origin and Timing of Sand Injection, Petroleum Migration, and Diagenesis, South Viking Graben
L AN
.A.
P;is
olat
ed
and
clus
tere
d
1–
3(s
ub-)
nega
tive
crys
tal
shap
e
1.00
�2.
0to
�7.
8(1
2)
L BV B
yello
wP;
isol
ated
and
clus
tere
d
2–
7ir
regu
lar
0.75
–0.
90N
.A.
L Bye
llow
P;is
olat
ed
and
clus
tere
d
1–
4(s
ub-)
nega
tive
crys
tal
shap
e
1.00
N.A
.
L AL B
yello
wP;
isol
ated
and
clus
tere
d
1–
4ir
regu
lar
1.00
N.A
.
A_4
_5de
trita
l
grai
ns
L AN
.A.
S;in
trag
ranu
lar
plan
es
4–
12El
onga
te1.
00N
.D.
L AV A
N.A
.S;
intr
agra
nula
r
plan
es
4–
9el
onga
te0.
75–
0.95
N.D
.
Part
lyce
men
ted
inje
ctio
nbr
ecci
a
L Bye
llow
S;in
trag
ranu
lar
plan
es
2–
4el
onga
te1.
00N
.A.
L AL B
yello
wS;
intr
agra
nula
r
plan
es
3–
6ov
oid
to
elon
gate
1.00
N.A
.
anke
rite
L BV B
yello
wP;
isol
ated
2–
10(s
ub-)
nega
tive
crys
tal
shap
e
0.80
–0.
90N
.A.
L Bye
llow
P;is
olat
ed2
–5
nega
tive
crys
tal
shap
e
1.00
N.A
.
calc
iteL A
V AN
.A.
P;is
olat
ed3
–8
irre
gula
r0.
85–
0.95
N.D
.
L AN
.A.
P;is
olat
ed1
–3
nega
tive
crys
tal
shap
e
1.00
�0.
4to
�1.
5(4
)
L Bye
llow
P;is
olat
ed2
–4
nega
tive
crys
tal
shap
e
1.00
N.A
.
L Cbl
ueP;
isol
ated
2–
5(s
ub-)
nega
tive
crys
tal
shap
e
1.00
N.A
.
A_4
_7de
trita
l
grai
ns
L AN
.A.
S;in
trag
ranu
lar
plan
es
5–
12ov
oid
1.00
N.D
.
L Bye
llow
S;in
trag
ranu
lar
plan
es
2–
8ov
oid
1.00
N.A
.
Perv
asiv
ely
cem
ente
d
inje
cted
sand
ston
e
L AL B
yello
wS;
intr
agra
nula
r
plan
es
2–
8ov
oid
to
elon
gate
1.00
N.A
.
calc
iteL A
V AN
.A.
P;is
olat
ed
and
clus
tere
d
3–
9ir
regu
lar
0.80
–0.
90N
.D.
L AN
.A.
P;is
olat
edan
dcl
uste
red
1–
4ne
gativ
ecr
ysta
l
shap
e
1.00
N.D
.
Jonk et al. 345
Tab
le1
.C
ontin
ued
Sam
ple
Hos
t
Con
tent
s
atRo
om
Tem
pera
ture
Fluo
resc
ent
Col
orO
ccur
renc
e
Size
Rang
e
(mm
)M
orph
olog
y
Deg
ree
ofFi
ll
Tm
Rang
e
(Num
ber
of
Mea
sure
men
ts)
L Bye
llow
P;is
olat
ed
and
clus
tere
d
2–
10(s
ub-)
nega
tive
crys
tal
shap
e
1.00
N.A
.
B_1
detr
ital
grai
ns
L AN
.A.
S;in
trag
ranu
lar
plan
es
1–
3ov
oid
1.00
N.D
.
L Bye
llow
S;in
trag
ranu
lar
plan
es
1–
3ov
oid
1.00
N.A
.
Poor
lyce
men
ted
inje
cted
sand
ston
e
quar
tz
over
grow
th
L AN
.A.
PS;
intr
agra
nula
r
plan
es
1–
3ov
oid
1.00
N.D
.
L Cbl
uePS
;in
trag
ranu
lar
plan
es
1–
3ov
oid
1.00
N.A
.
B_3
calc
iteL A
N.A
.P;
isol
ated
1–
3ir
regu
lar
to
elon
gate
1.00
N.D
.
L AV A
N.A
.P;
isol
ated
1–
3ir
regu
lar
to
elon
gate
0.85
–0.
95N
.D.
Poor
lyce
men
ted
inje
cted
sand
ston
e
L Bye
llow
P;is
olat
ed1
–3
irre
gula
rto
elon
gate
1.00
N.A
.
L BV B
yello
wP;
isol
ated
1–
3ir
regu
lar
to
elon
gate
0.75
–0.
90N
.A.
B_6
detr
ital
grai
ns
L AN
.A.
S;in
trag
ranu
lar
plan
es
1–
3ov
oid
1.00
N.D
.
L Bye
llow
S;in
trag
ranu
lar
plan
es
1–
3ov
oid
1.00
N.A
.
Poor
lyce
men
ted
depo
sitio
nal
sand
ston
e
quar
tz
over
grow
th
L AN
.A.
PS;
intr
agra
nula
r
plan
es
1–
3ov
oid
1.00
N.D
.
L Cbl
uePS
;in
trag
ranu
lar
plan
es
1–
3ov
oid
1.00
N.A
.
B_7
detr
ital
grai
ns
L AN
.A.
S;in
trag
ranu
lar
plan
es
1–
3ov
oid
1.00
N.D
.
L Bye
llow
S;in
trag
ranu
lar
plan
es
1–
3ov
oid
1.00
N.A
.
Poor
lyce
men
ted
depo
sitio
nal
sand
ston
e
calc
iteL A
N.A
.P;
isol
ated
1–
7ir
regu
lar
1.00
N.D
.
346 Origin and Timing of Sand Injection, Petroleum Migration, and Diagenesis, South Viking Graben
L Bye
llow
P;is
olat
ed1
–7
irre
gula
r1.
00N
.A.
B_8
quar
tz
over
grow
th
L AN
.A.
PS;
intr
agra
nula
r
plan
es
1–
3ir
regu
lar
to
elon
gate
1.00
N.D
.
L Cbl
uePS
;in
trag
ranu
lar
plan
es
1–
3ir
regu
lar
to
elon
gate
1.00
N.A
.
Poor
lyce
men
ted
inje
cted
sand
ston
e
C_8
_1ca
lcite
L AV A
N.A
.P;
isol
ated
3–
6(s
ub-)
nega
tive
crys
tal
shap
e
0.85
–0.
95N
.D.
L AN
.A.
P;is
olat
ed1
–4
(sub
-)ne
gativ
e
crys
tal
shap
e
1.00
�1.
0to
�5.
6(6
)
Perv
asiv
ely
cem
ente
d
inje
cted
sand
ston
e
L BV B
oran
ge-y
ello
wP;
isol
ated
3–
12(s
ub-)
nega
tive
crys
tal
shap
e
0.90
–0.
95N
.A.
L Bor
ange
-yel
low
P;is
olat
ed2
–5
(sub
-)ne
gativ
e
crys
tal
shap
e
1.00
N.A
.
C_9
_1ca
lcite
L AV A
N.A
.P;
isol
ated
3–
8(s
ub-)
nega
tive
crys
tal
shap
e
0.85
–0.
95N
.D.
L AN
.A.
P;is
olat
ed1
–5
(sub
-)ne
gativ
e
crys
tal
shap
e
1.00
�2.
2to
�5.
8(3
)
Perv
asiv
ely
cem
ente
d
inje
cted
sand
ston
e
L BV B
oran
geP;
isol
ated
1–
10(s
ub-)
nega
tive
crys
tal
shap
e
0.90
–0.
95N
.A.
L Bor
ange
P;is
olat
ed1
–3
(sub
-)ne
gativ
e
crys
tal
shap
e
1.00
N.A
.
D_1
0_3
calc
iteL A
V AN
.A.
P;is
olat
ed5
–12
(sub
-)ne
gativ
e
crys
tal
shap
e
0.80
–0.
95N
.D.
L AN
.A.
P;is
olat
ed2
–6
(sub
-)ne
gativ
e
crys
tal
shap
e
1.00
�0.
3to
9.1
(14)
Part
lyce
men
ted
inje
cted
sand
ston
e
L BV B
yello
wP;
isol
ated
2–
8(s
ub-)
nega
tive
crys
tal
shap
e
0.80
–0.
95N
.A.
quar
tz
over
grow
th
L AN
.A.
PS;
intr
agra
nula
r
plan
es
1–
3ov
oid
1.00
N.D
.
L Bye
llow
PS;
intr
agra
nula
r
plan
es
1–
3ov
oid
1.00
N.A
.
D_1
0_6
calc
iteL A
V AN
.A.
P;is
olat
ed3
–7
(sub
-)ne
gativ
e
crys
tal
shap
e
0.85
–0.
95N
.D.
L AN
.A.
P;is
olat
ed1
–3
(sub
-)ne
gativ
e
crys
tal
shap
e
1.00
�0.
4to
8.0
(13)
Jonk et al. 347
the injection process and, thus, migrated through the in-
jectites during their formation. The Upper Jurassic source
rock (Kimmeridge Clay) in this area reached oil maturity
at the end of the Paleocene and oil migrated into the
overlying Cretaceous and Tertiary strata throughout the
Eocene to the present day (Kubala et al., 2003). Given the
fact that sand injection occurred in the late Eocene
(Figure 14), oil was present and continued to migrate in
the early Eocene Age, shallowly buried sand bodies (being
buried to about 400 m [1300 ft] at the end of the Eocene)
when sand injection occurred (Figure 14).
The Relation between Sand Injection, Petroleum Migration,and Carbonate Cementation
The Cause of Sand Injection
A full account of the mechanisms of sand injection is
beyond the scope of this paper. The development of
fluid overpressures in unconsolidated (parent) sand
bodies is generally accepted to occur prior to (hydrau-
lic) fracturing of the sealing (mudstone) and fluidized
transport of grains into these fractures (sand injection)
to dissipate fluid pressures (Jolly and Lonergan, 2002;
Hurst et al., 2004; Huuse et al., 2004).
Because of the close timing between petroleum mi-
gration and sand injection, some workers have suggested
that overpressure may be generated by charge of over-
pressured, migrating petroleum in the unconsolidated
sands (Lonergan et al., 2000; Mazzini et al., 2003). In
particular, the presence of methane gas may cause over-
pressuring in the parent sandstones and breaching of the
seal (Huuse et al., 2004). However, during sand injection,
the Kimmeridgian source was not gas mature (Kubala
et al., 2003), and fluid-inclusion studies of early carbon-
ate cements in depositional and injected sandstones do
not reveal the presence of methane. Furthermore, the
charge of oil into the Tertiary sandstones is thought to be
a buoyancy-driven process instead of a rapid charge of
overpressured petroleum (Kubala et al., 2003). The ad-
dition of petroleum may cause overpressuring in small,
laterally poorly connected sandstone bodies. However,
the parent sandstones exhibit good lateral connectivity at
the present day, which would have been even better at
the shallow burial depths when sand injection occurred,
allowing any pressure buildup at one location to be
evenly transferred throughout the whole body.
Another mechanism by which overpressure may
develop is through rapid burial of sand that is encased
in low-permeability lithologies (mudstones). Pore fluids
may not be expelled quickly enough to allow for normal
sediment compaction (Maltman, 1994; Osborne andTab
le1
.C
ontin
ued
Sam
ple
Hos
t
Con
tent
s
atRo
om
Tem
pera
ture
Fluo
resc
ent
Col
orO
ccur
renc
e
Size
Rang
e
(mm
)M
orph
olog
y
Deg
ree
ofFi
ll
Tm
Rang
e
(Num
ber
of
Mea
sure
men
ts)
Perv
asiv
ely
cem
ente
d
depo
sitio
nal
sand
ston
e
L BV B
yello
wP;
isol
ated
3–
7(s
ub-)
nega
tive
crys
tal
shap
e
0.85
–0.
95N
.A.
L Bye
llow
P;is
olat
ed1
–3
(sub
-)ne
gativ
e
crys
tal
shap
e
1.00
N.A
.
Fe-c
alci
teL A
V AN
.A.
P;is
olat
ed3
–9
(sub
-)ne
gativ
e
crys
tal
shap
e
0.85
–0.
95N
.D.
L AN
.A.
P;is
olat
ed1
–4
(sub
-)ne
gativ
e
crys
tal
shap
e
1.00
N.D
.
*Ter
min
olog
yaf
ter
Van
den
Ker
khof
and
Hei
n(2
001)
.L
=liq
uid;
V=
vapo
r;P
=pr
imar
y;PS
=ps
eudo
seco
ndar
y;S
=se
cond
ary;
N.A
.=
not
appl
icab
le;
N.D
.=
not
dete
rmin
ed.
348 Origin and Timing of Sand Injection, Petroleum Migration, and Diagenesis, South Viking Graben
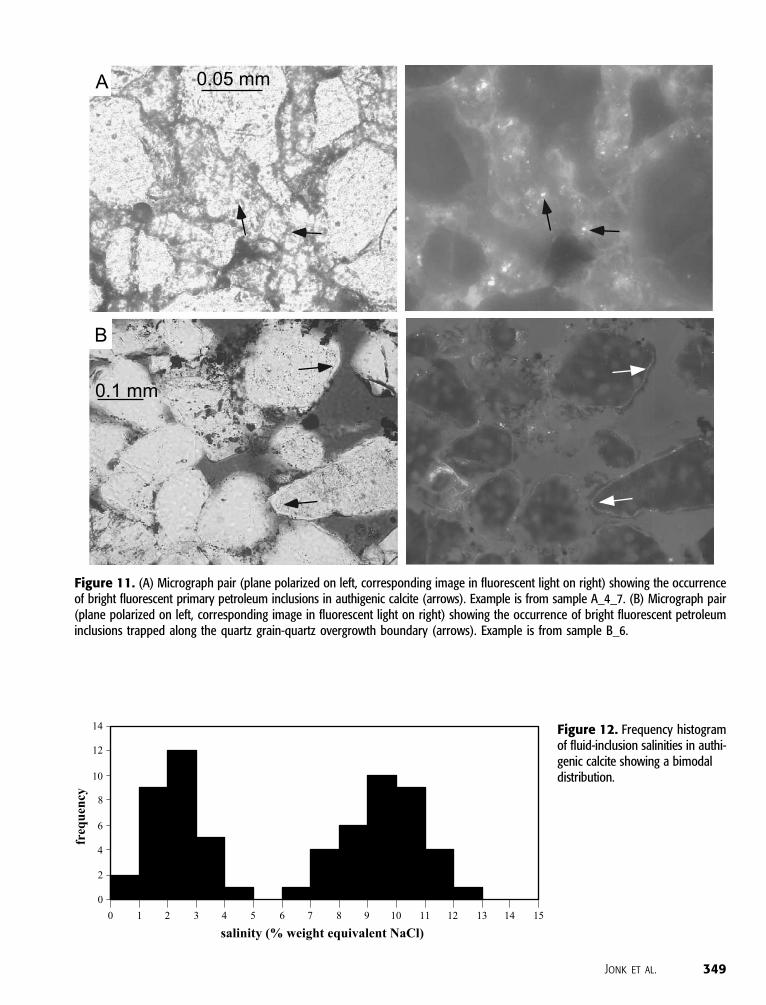
Figure 11. (A) Micrograph pair (plane polarized on left, corresponding image in fluorescent light on right) showing the occurrenceof bright fluorescent primary petroleum inclusions in authigenic calcite (arrows). Example is from sample A_4_7. (B) Micrograph pair(plane polarized on left, corresponding image in fluorescent light on right) showing the occurrence of bright fluorescent petroleuminclusions trapped along the quartz grain-quartz overgrowth boundary (arrows). Example is from sample B_6.
Figure 12. Frequency histogramof fluid-inclusion salinities in authi-genic calcite showing a bimodaldistribution.
Jonk et al. 349
Swarbrick, 1997), and pore pressures may reach values
higher than the hydrostatic gradient. However, the sedi-
mentation rates of the Eocene and overlying strata in
the northern North Sea are much lower (50–100 m/m.y.;
16–330 ft/m.y.; Jones et al., 2003) than the high sedimen-
tation rates associated with this process (>600 m/m.y.;
>2000 ft/m.y.; Mann and Mackenzie, 1990). Further-
more, at the shallow burial depth where sand injection
occurred (about 400 m [1300 ft]), the encasing mud-
stones would not be compacted sufficiently to be an
effective pressure seal (Deming, 1994).
The most commonly quoted cause for sand injection
is earthquake activity (Obermeier, 1996; Jolly and Loner-
gan, 2002). Seismic shaking can cause the development
of short-lived fluid overpressures and subsequent sand
remobilization through cyclic liquefaction (Obermeier,
1996). Sand injection occurred during a period when tec-
tonic activity in relation to the North Atlantic breakup and
Figure 13. (A) Crossplot of d13C –d18Ostable isotope pairs of authigenic car-bonates. (B) Frequency histogram ofd13C values of the three chemically dif-ferent types of authigenic carbonate.Black is calcite, gray is Fe-calcite, andwhite is ankerite. (C) Frequency histo-gram of d18O values of all authigeniccarbonates.
350 Origin and Timing of Sand Injection, Petroleum Migration, and Diagenesis, South Viking Graben
Alpine collision caused basin inversion throughout north-
west Europe (Huuse et al., 2004), and thus, it is conceiv-
able that earthquake activity triggered sand injection.
Although we discard the hypothesis that petro-
leum charge directly caused sand injection, the fact
that buoyant petroleum fluids (partly) occupied the
pore space in the parent sand bodies during earth-
quake activity may have facilitated the creation of the
anomalously large-scale sand injectites observed.
The Origin of Carbonate Cement
Fluids Involved in Carbonate Cementation
Fluid-inclusion studies reveal three fluid types that
were present and trapped in the sandstones during car-
bonate cementation. Low to moderate API liquid petro-
leum inclusions are accompanied by two types of aqueous
fluid inclusions; a low-salinity (2.3 ± 0.8% NaCl weight
equivalent) aqueous fluid and a moderate-salinity (9.5 ±
1.4% NaCl weight equivalent) aqueous fluid (Table 1;
Figure 12). The former is untypically low for a marine
pore fluid (typical salinity of 3.5% NaCl wt. equiv.; Gold-
stein, 2001). Although it is possible that the salinity of
seawater has changed significantly through time (Gold-
stein, 2001), the values observed, along with the positive
skew toward values lower than about 2% in the salinity
distribution (Figure 12), is more likely caused by mixing of
marine water with meteoric water. This interpretation
substantiates independent work (Watson et al., 1995;
Stewart et al., 2000) that invoked a charge of meteoric
water from the nearby East Shetland platform into the
shallowly buried sediments to explain extremely depleted
d18O values of carbonate cements in Tertiary (deposi-
tional) sandstones.
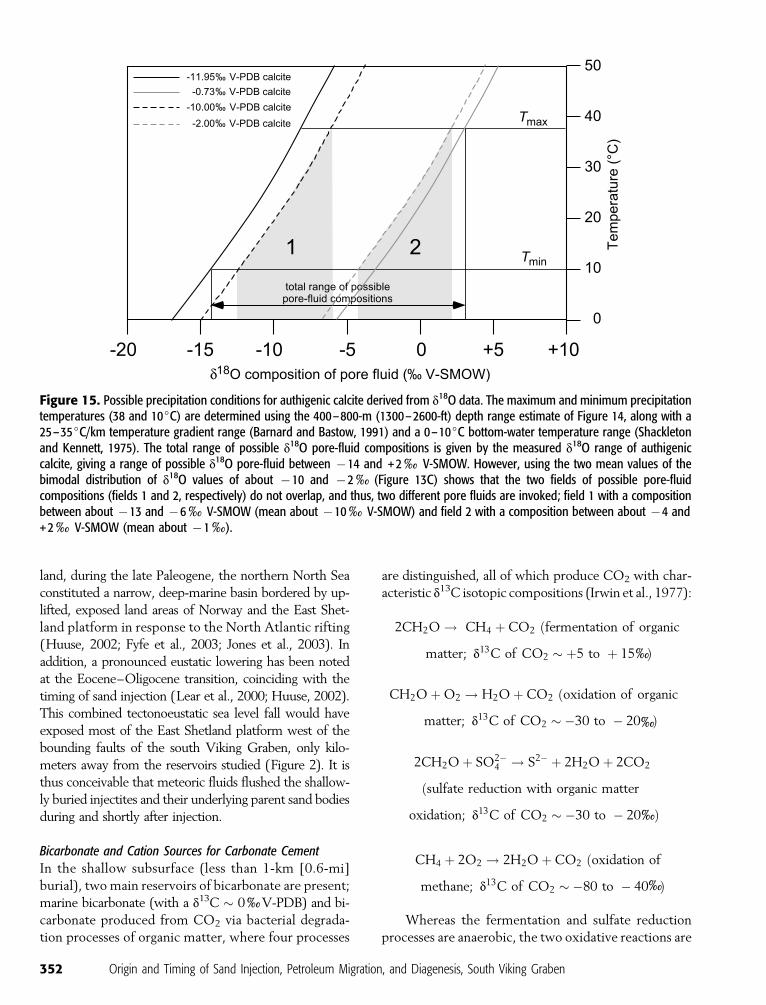
The skewed bimodal distribution of d18O values
(Figure 13C) is unsatisfactorily explained by varia-
tions in precipitation temperature (Figure 15), and
mixing of two fluids with mean d18O compositions of
about �10 and �1xVienna standard mean ocean water
(V-SMOW) is invoked (Figure 15). These values cor-
respond well with known compositions of Tertiary
meteoric water in Scotland (about �12xV-SMOW;
Fallick et al., 1985) and Tertiary marine water (about
�1.2xV-SMOW; Shackleton and Kennett, 1975),
respectively.
The moderate-salinity aqueous fluid is typical of
basinal fluids (Warren and Smalley, 1994) and, to-
gether with the petroleum fluids, is thought to have
migrated from the oil-mature Kimmeridgian source
rock upward into the Tertiary parent sandstones. The
low-salinity aqueous fluid is thought to be the ambient
mixed marine-meteoric pore fluid present at the sea
bed and in the shallowly buried sediments. The injectites
created at shallow burial level form ideal pathways for
downward-invading mixed meteoric-marine fluids and
upward-migrating petroleum and basinal brines, hence,
their presence in early cements. Although at the present
day, the studied reservoirs are located far from exposed
Figure 14. Burial history and timing of sand injection, petroleum migration, and carbonate cementation illustrated in a porosity-depth plot. Following deposition of the parent sandstones, the section has experienced steady, progressive burial throughout theTertiary and Quaternary (Kubala et al., 2003). The sandstone compaction curve used equates to $(z) = $0 � e � cz, where $(z) is theporosity at depth z; $0 is the porosity at depth zero (the seabed; assumed to be 50%; Allen and Allen, 1990); c is a constant(assumed to be 0.27 km�1; Allen and Allen, 1990); and z is the burial depth in kilometers.
Jonk et al. 351
land, during the late Paleogene, the northern North Sea
constituted a narrow, deep-marine basin bordered by up-
lifted, exposed land areas of Norway and the East Shet-
land platform in response to the North Atlantic rifting
(Huuse, 2002; Fyfe et al., 2003; Jones et al., 2003). In
addition, a pronounced eustatic lowering has been noted
at the Eocene–Oligocene transition, coinciding with the
timing of sand injection (Lear et al., 2000; Huuse, 2002).
This combined tectonoeustatic sea level fall would have
exposed most of the East Shetland platform west of the
bounding faults of the south Viking Graben, only kilo-
meters away from the reservoirs studied (Figure 2). It is
thus conceivable that meteoric fluids flushed the shallow-
ly buried injectites and their underlying parent sand bodies
during and shortly after injection.
Bicarbonate and Cation Sources for Carbonate Cement
In the shallow subsurface (less than 1-km [0.6-mi]
burial), two main reservoirs of bicarbonate are present;
marine bicarbonate (with a d13C � 0xV-PDB) and bi-
carbonate produced from CO2 via bacterial degrada-
tion processes of organic matter, where four processes
are distinguished, all of which produce CO2 with char-
acteristic d13C isotopic compositions (Irwin et al., 1977):
2CH2O ! CH4 þ CO2 ðfermentation of organic
matter; d13C of CO2 � þ5 to þ 15 Þx
CH2O þ O2 ! H2O þ CO2 ðoxidation of organic
matter; d13C of CO2 � �30 to � 20 Þx
2CH2O þ SO2�4 ! S2� þ 2H2O þ 2CO2
ðsulfate reduction with organic matter
oxidation; d13C of CO2 � �30 to � 20 Þx
CH4 þ 2O2 ! 2H2O þ CO2 ðoxidation of
methane; d13C of CO2 � �80 to � 40 Þx
Whereas the fermentation and sulfate reduction
processes are anaerobic, the two oxidative reactions are
Figure 15. Possible precipitation conditions for authigenic calcite derived from d18O data. The maximum and minimum precipitationtemperatures (38 and 10jC) are determined using the 400–800-m (1300–2600-ft) depth range estimate of Figure 14, along with a25–35jC/km temperature gradient range (Barnard and Bastow, 1991) and a 0–10jC bottom-water temperature range (Shackletonand Kennett, 1975). The total range of possible d18O pore-fluid compositions is given by the measured d18O range of authigeniccalcite, giving a range of possible d18O pore-fluid between �14 and +2xV-SMOW. However, using the two mean values of thebimodal distribution of d18O values of about �10 and �2x(Figure 13C) shows that the two fields of possible pore-fluidcompositions (fields 1 and 2, respectively) do not overlap, and thus, two different pore fluids are invoked; field 1 with a compositionbetween about �13 and �6xV-SMOW (mean about �10xV-SMOW) and field 2 with a composition between about �4 and+2xV-SMOW (mean about �1x).
352 Origin and Timing of Sand Injection, Petroleum Migration, and Diagenesis, South Viking Graben
clearly enhanced by the presence of oxygen-rich me-
teoric waters, which, in this study, are interpreted to
have charged the injected and underlying depositional
sandstones during shallow (<800-m; <2600-ft) burial.
Distinct differences in the d13C isotopic signatures are
noted between the three types of carbonate (Figure 13).
Early ankerite is characterized by d13C values between
�0.42 and +12.36 with a mean of +8.41 ± 4.52x.
These values suggest a predominant source of carbon
derived from the bacterial fermentation of organic mat-
ter with a contribution of marine bicarbonate (Irwin
et al., 1977; Macaulay et al., 2000). Liquid petroleum
fluid inclusions in ankerite cement show that liquid
petroleum was present during the precipitation of an-
kerite and, as such, provides the most obvious source of
organic matter (given that the host Paleogene mud-
stones are not enriched in unoxidized organic matter).
Early fermentation of organic matter and the introduc-
tion of meteoric waters in the shallowly buried injected
sandstones and underlying (parent) depositional sand-
stones from the nearby East Shetland platform have been
invoked by others (Watson et al., 1995; Macaulay et al.,
2000; Stewart et al., 2000).
The observation of ankerite overgrowing and oc-
curring in the vicinity of host smectitic mudstone clasts
(Figure 9I) suggests that cations may be partly derived
from these mudstones. Smectite occurs abundantly in
the host mudstones and tuffs and formed through the
alteration of volcanic glass (Watson, 1993), a reaction
that releases cations and, as such, is commonly accom-
panied by carbonate cementation (Andreozzi et al.,
1997; Buck and Bates, 1999). We do note, however,
that sand injectites act as foci for fluid flow during
burial and may transmit considerable pore volumes of
fluid per unit volume of sandstone, and thus, external
sourcing of cations may also be a factor in sand inject-
ites, although unrealistic fluid fluxes are required to
account for the full volume of observed carbonates
(Walderhaug and Bjørkum, 1998).
Exhaustion of suitable hydrocarbons for fermen-
tation leads to a (rapid) change in the way CO2 is
generated (Irwin et al., 1977), and bacterial oxidation
and sulfate reduction take over. Instead of ankerite,
calcite precipitates with d13C values of about �25x,
typical of carbon derived through oxidation and/or
sulfate reduction of the petroleum. Some of the more
depleted d13C values (between about �40 and �30x;
Datashare Table 3, Datashare 17, at AAPG’s Datashare
Web site, www.aapg.org/datashare/index.html) are like-
ly caused by minor carbon derived from the oxidation of
methane produced during the fermentation process. The
skew toward d13C values around 0x(Figure 13B) is
caused by additional sourcing from marine-derived
bicarbonate. The precipitated carbonate is low in Fe2+,
because this component is taken up in associated pyrite
precipitating during sulfate reduction.
Fe-calcite is the last diagenetic carbonate to pre-
cipitate. It occurs in minor amounts in the present-day
water leg only, and d13C values of about 0xsuggest an
ultimately marine bicarbonate source, probably de-
rived directly from the mixed meteoric-marine-basinal
pore fluid.
The Evolution of the Tertiary Reservoirs inthe Northern North Sea
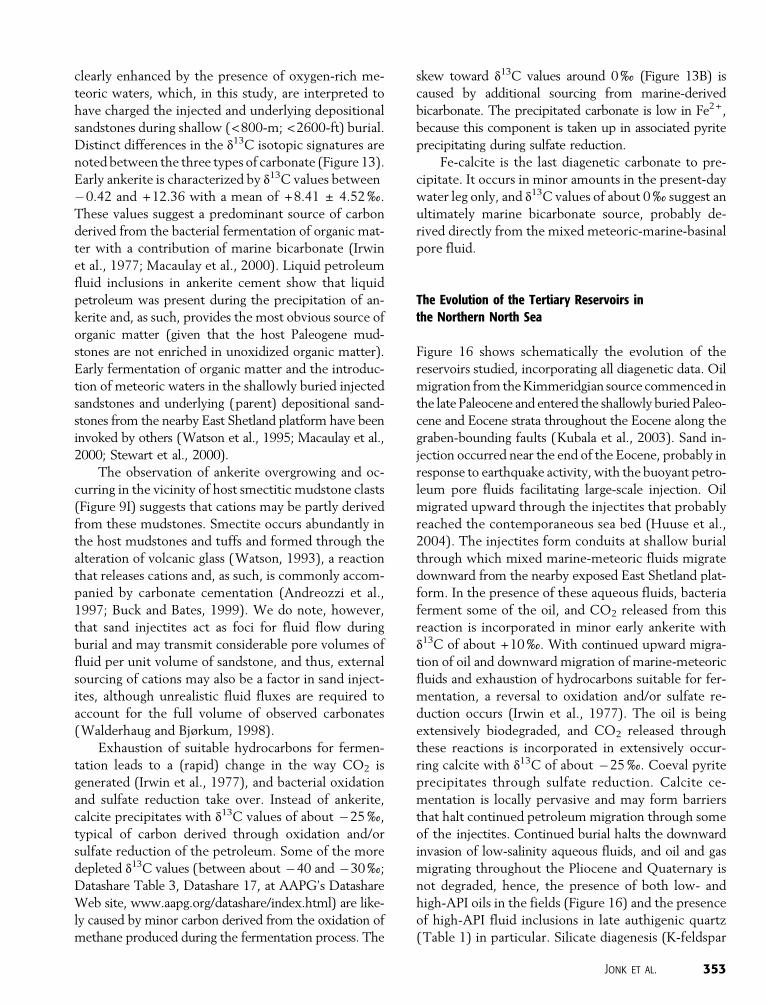
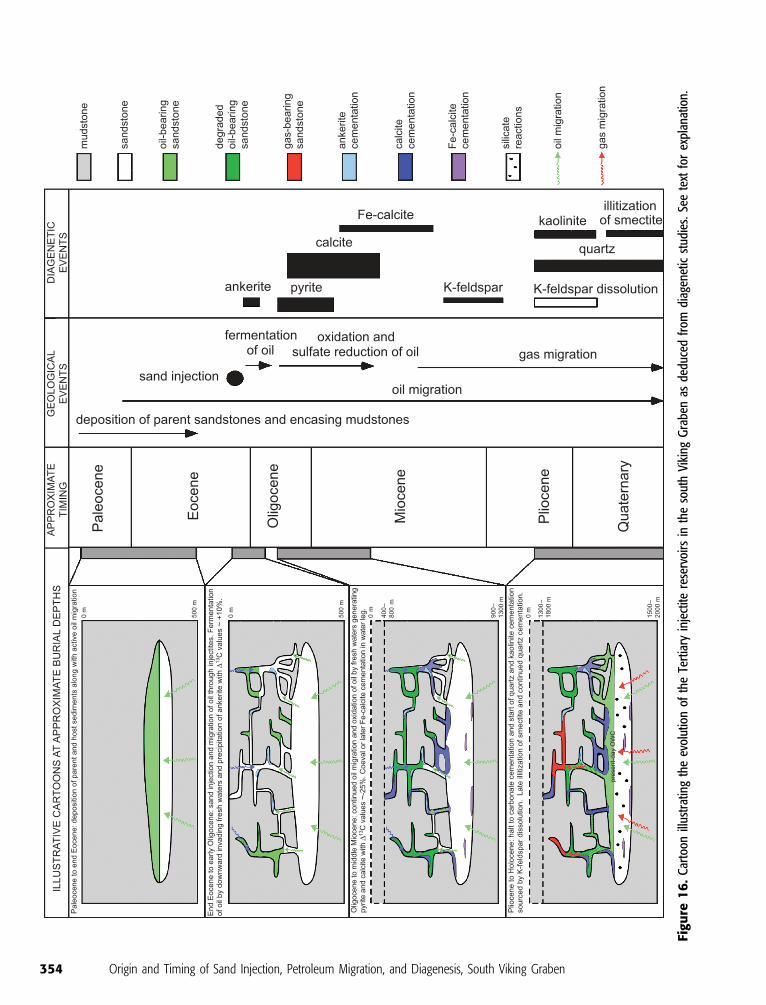
Figure 16 shows schematically the evolution of the
reservoirs studied, incorporating all diagenetic data. Oil
migration from the Kimmeridgian source commenced in
the late Paleocene and entered the shallowly buried Paleo-
cene and Eocene strata throughout the Eocene along the
graben-bounding faults (Kubala et al., 2003). Sand in-
jection occurred near the end of the Eocene, probably in
response to earthquake activity, with the buoyant petro-
leum pore fluids facilitating large-scale injection. Oil
migrated upward through the injectites that probably
reached the contemporaneous sea bed (Huuse et al.,
2004). The injectites form conduits at shallow burial
through which mixed marine-meteoric fluids migrate
downward from the nearby exposed East Shetland plat-
form. In the presence of these aqueous fluids, bacteria
ferment some of the oil, and CO2 released from this
reaction is incorporated in minor early ankerite with
d13C of about +10x. With continued upward migra-
tion of oil and downward migration of marine-meteoric
fluids and exhaustion of hydrocarbons suitable for fer-
mentation, a reversal to oxidation and/or sulfate re-
duction occurs (Irwin et al., 1977). The oil is being
extensively biodegraded, and CO2 released through
these reactions is incorporated in extensively occur-
ring calcite with d13C of about �25x. Coeval pyrite
precipitates through sulfate reduction. Calcite ce-
mentation is locally pervasive and may form barriers
that halt continued petroleum migration through some
of the injectites. Continued burial halts the downward
invasion of low-salinity aqueous fluids, and oil and gas
migrating throughout the Pliocene and Quaternary is
not degraded, hence, the presence of both low- and
high-API oils in the fields (Figure 16) and the presence
of high-API fluid inclusions in late authigenic quartz
(Table 1) in particular. Silicate diagenesis (K-feldspar
Jonk et al. 353
Figu
re1
6.
Car
toon
illus
trat
ing
the
evol
utio
nof
the
Tert
iary
inje
ctite
rese
rvoi
rsin
the
sout
hVi
king
Gra
ben
asde
duce
dfr
omdi
agen
etic
stud
ies.
See
text
for
expl
anat
ion.
354 Origin and Timing of Sand Injection, Petroleum Migration, and Diagenesis, South Viking Graben
dissolution, quartz cementation, and clay mineral ce-
mentation) takes over at increased burial, with kaolinite
and quartz cementation related to K-feldspar dissolution
(Worden and Morad, 2000) and late onset of illitization
of smectite also being accompanied by further quartz
cementation (Worden and Morad, 2003).
CONCLUSIONS
Being able to constrain the timing of sand injection,
petroleum migration, and pervasive (carbonate) cemen-
tation is a major aspect of understanding injectite petro-
leum plays in the northern North Sea and probably
elsewhere in the world. In this case, we have shown that
petroleum migration occurred prior to sand injection
and continued to migrate following the injection pro-
cess. As such, petroleum has been lost to the contem-
poraneous sea bed, and petroleum trapped at very
shallow (0- to about 500-m; 0- to about 1600-ft)
burial depths was extensively biodegraded by invad-
ing low-salinity (mixed meteoric-marine) fluids. Apart
from diminishing the quality of oil, this process had
another important consequence from a petroleum ex-
ploration point of view: it provided an excellent bicar-
bonate source for pervasive, early carbonate cementation.
In fact, it was previously suggested that in those injectite
reservoirs where oil migration occurred more or less co-
eval with sand injection, about 30% of the pore space in
sandstones was filled with carbonate cement, whereas
those where oil emplacement was later only about 4% of
the pore space was occupied by carbonate cements
(Macaulay et al., 2000). In the fields studied here, this
order of cementation is confirmed in depositional (par-
ent) sandstones, with the percentage of pore space
occupied by carbonate cement in injectites even higher,
as much as 50–60% in some of the fields studied
(Figure 8). From this point of view, it is important to
understand the distribution and magnitude of carbon-
ate cementation in injectite reservoirs where biodegra-
dation of shallowly migrated oil may contribute sub-
stantial amounts of bicarbonate to the aqueous pore fluid
and thus may be the driver of carbonate cementation.
REFERENCES CITED
Ahmadi, Z. M., M. Sawyers, S. Kenyon-Roberts, C. W. Stanworth,K. A. Kugler, J. Kristensen, and E. M. G. Fugelli, 2003, Paleocene,in D. Evans, C. Graham, A. Armour, and P. Bathurst, eds., Themillennium atlas: Petroleum geology of the central and northernNorth Sea: The Geological Society (London), p. 235–259.
Allen, P. A., and J. R. Allen, 1990, Basin analysis— Principles andapplications: Oxford, Blackwell Scientific Publications, 451 p.
Andreozzi, M., E. Dinelli, and F. Tateo, 1997, Geochemical andmineralogical criteria for the identification of ash layers in thestratigraphic framework of a foredeep: The early Miocene Mt.Cervarola sandstones, northern Italy: Chemical Geology,v. 137, p. 23–39.
Barnard, P. C., and M. A. Bastow, 1991, Hydrocarbon generation,migration, alteration, entrapment and mixing in the central andnorthern North Sea, in W. A. England and A. J. Fleet, eds.,Petroleum migration: Geological Society (London) SpecialPublication 59, p. 167–190.
Bergslien, D., 2002, Balder and Jotun— Two sides of the samecoin? A comparison of two Tertiary oil fields in the NorwegianNorth Sea: Petroleum Geoscience, v. 8, p. 349–363.
Bodnar, R. J., 1993, Revised equation and table for determining thefreezing point depression of H2O–NaCl solutions: Geochi-mica et Cosmochimica Acta, v. 57, p. 683–684.
Boehm, A., and J. C. Moore, 2002, Fluidized sandstone intrusions asan indicator of paleostress orientation, Santa Cruz, California:Geofluids, v. 2, p. 147–161.
Bowman, M. B. J., 1998, Cenozoic, in K. W. Glennie, ed., Petroleumgeology of the North Sea: Basic concepts and recent advances,4th ed.: Oxford, Blackwell Science, 278 p.
Buck, E. C., and J. K. Bates, 1999, Microanalysis of colloids andsuspended particles from nuclear waste glass alteration: Ap-plied Geochemistry, v. 14, p. 635–653.
Burley, S. D., and J. D. Kantorowicz, 1986, Thin section and SEMtextural criteria for the recognition of cement-dissolution po-rosity in sandstones: Sedimentology, v. 33, p. 587–604.
Deegan, C. E., and B. J. Scull, 1977, A standard lithostratigraphicnomenclature for the Mesozoic of the central and northernNorth Sea, in K. G. Finstad and R. C. Selley, coordinators,Mesozoic; Northern North Sea Symposium 1997 Proceedings:Norwegian Petroleum Society, 24 p.
Deming, D., 1994, Factors necessary to define a pressure seal:AAPG Bulletin, v. 78, p. 1005 – 1009.
Diller, J. S., 1890, Sandstone dikes: Geological Society of AmericaBulletin, v. 1, p. 411–442.
Dixon, R. J., K. Schofield, R. Anderton, A. D. Reynolds, R. W. S.Alexander, M. C. Williams, and K. G. Davies, 1995, Sandstonediapirism and clastic intrusion in the Tertiary submarine fansof the Bruce-Beryl embayment, Quadrant 9, UKCS, in A. J.Hartley and D. J. Prosser, eds., Characterization of deep ma-rine clastic systems: Geological Society (London) Special Pub-lication 94, p. 77–94.
Duranti, D., and A. Hurst, 2004, Fluidisation and injection in thedeep-water sandstones of the Eocene Alba Formation (UKNorth Sea): Sedimentology, v. 51, p. 503–529.
Duranti, D., A. Hurst, C. Bell, S. Groves, and R. Hansen, 2002,Injected and remobilised sands from the Alba field (Eocene,UKCS): Core and wire-line log characteristics: Petroleum Geo-science, v. 8, p. 99–107.
Fallick, A. E., J. Jocelyn, T. Donnelly, M. Guy, and C. Behan, 1985,Origin of agates in volcanic rocks from Scotland: Nature,v. 313, p. 672–674.
Fyfe, J. A., U. Gregersen, H. Jordt, Y. Rundberg, T. Eidvin, D.Evans, D. Stewart, M. Hovland, and P. Andresen, 2003, Oli-gocene to Holocene, in D. Evans, C. Graham, A. Armour, andP. Bathurst, eds., The millennium atlas: Petroleum geology ofthe central and northern North Sea: The Geological Society(London), p. 279–287.
Goldstein, R. H., 2001, Fluid inclusions in sedimentary anddiagenetic systems: Lithos, v. 55, p. 159–193.
Haaland, H. J., H. Furnes, and O. J. Martinsen, 2000, Palaeogenetuffaceous intervals, Grane field (Block 25/11), Norwegian
Jonk et al. 355
North Sea: Their depositional petrographical, geochemicalcharacter and regional implications: Marine and PetroleumGeology, v. 17, p. 101–118.
Hiscott, R. N., K. T. Pickering, A. H. Bouma, B. M. Hand, B. C.Kneller, G. Postma, and W. Soh, 1997, Basin-floor fans in theNorth Sea: Sequence stratigraphic models vs. sedimentaryfacies: Discussion: AAPG Bulletin, v. 81, p. 662–665.
Houseknecht, D. W., 1987, Assessing the relative importance ofcompaction processes and cementation to reduction ofporosity in sandstones: AAPG Bulletin, v. 71, p. 633–642.
Huang, Q., 1988, Geometry and tectonic significance of Albiansedimentary dykes in the Sisteron area, SE France: Journal ofStructural Geology, v. 10, p. 453–462.
Hurst, A., J. A. Cartwright, M. Huuse, R. Jonk, A. Schwab, D.Duranti, and B. Cronin, 2003, Significance of large-scale sandinjectites as long-term fluid conduits: Evidence from seismicdata: Geofluids, v. 3, p. 263–274.
Huuse, M., 2002, Cenozoic uplift and denudation of southernNorway: Insights from the North Sea Basin, in A. G. Dore, J. A.Cartwright, M. S. Stoker, J. P. Turner, and N. White, eds.,Exhumation of the North Atlantic margin: Timing, mecha-nisms and implications for petroleum exploration: GeologicalSociety (London) Special Publication 196, p. 209–233.
Huuse, M., D. Duranti, N. Steinsland, C. G. Guargena, P. Prat, K.Holm, J. A. Cartwright, and A. Hurst, 2004, Seismic char-acteristics of large-scale sandstone intrusions in the Paleogeneof the south Viking Graben, UK and Norwegian North Sea,in R. J. Davies, J. Cartwright, S. A. Stewart, J. R. Underhill,and M. Lappin, eds., 3D seismic data: Application to the ex-ploration of sedimentary basins: Geological Society (London)Memoir 29, p. 257–271.
Irwin, H., C. Curtis, and M. Coleman, 1977, Isotopic evidence forsource of diagenetic carbonates formed during burial of organicrich sediments: Nature, v. 269, p. 209–213.
Jenssen, A. I., D. Bergslien, M. Rye-Larsen, and R. M. Lindholm,1993, Origin of complex mound geometry of Palaeocenesubmarine-fan sandstone reservoirs, Balder field, Norway, inJ. R. Parker, ed., Petroleum geology of northwest Europe: Pro-ceedings of the 4th Conference, Geological Society (London),p. 135–143.
Jolly, R. J. H., and L. Lonergan, 2002, Mechanisms and controls onthe formation of sand intrusions: Journal of the GeologicalSociety (London), v. 159, p. 605–617.
Jolly, R. J. H., J. W. Cosgrove, and D. N. Dewhurst, 1998, Thick-ness and spatial distributions of clastic dykes, northwest Sacra-mento Valley, California: Journal of Structural Geology, v. 20,p. 1663–1672.
Jones, E., R. Jones, C. Ebdon, D. Ewen, P. Milner, J. Plunkett, G.Hudson, and P. Slater, 2003, Eocene, in D. Evans, C. Graham,A. Armour, and P. Bathurst, eds., The millenium atlas: Pe-troleum geology of the central and northern North Sea: TheGeological Society (London), p. 261–277.
Jonk, R., 2003, The origin and diagenesis of intruded sandstones:Ph.D. thesis, University of Aberdeen, Aberdeen, 2 volumes,628 p.
Jonk, R., D. Duranti, J. Parnell, A. Hurst, and A. E. Fallick, 2003,The structural and diagenetic evolution of injected sandstones:Examples from the Kimmeridgian of NE Scotland: Journal ofthe Geological Society (London), v. 160, p. 881–894.
Joy, A. M., 1992, Right place, wrong time: Anomalous post-riftsubsidence in sedimentary basins around the North AtlanticOcean, in B. C. Storey, T. Alabaster, and R. J. Pankhurst, eds.,Magmatism and the causes of continental break-up: Geolog-ical Society (London) Special Publication, v. 68, p. 387–393.
Kubala, M., M. Bastow, S. Thompson, I. Scotchman, and K. Oygard,2003, Geothermal regime, petroleum generation and migra-
tion, in D. Evans, C. Graham, A. Armour, and P. Bathurst, eds.,The millennium atlas: Petroleum geology of the central andnorthern North Sea: The Geological Society (London), p. 289–315.
Lang, W. H., and J. C. Gelfand, 1985, The evaluation of shallowpotential in a deep field wildcat: Log Analyst, v. 26, p. 13–22.
Lear, C. H., H. Elderfield, and P. A. Wilson, 2000, Cenozoic deep-sea temperatures and global ice volumes from Mg/Ca in benthicforaminiferal calcite: Science, v. 287, p. 269–272.
Leeder, M. R., 1982, Sedimentology: Process and products: London,Unwin Hyman, 344 p.
Lonergan, L., and J. A. Cartwright, 1999, Polygonal faults and theirinfluence on deep-water sandstone reservoir geometries, Albafield, United Kingdom central North Sea: AAPG Bulletin,v. 83, p. 410–432.
Lonergan, L., N. Lee, H. D. Johnson, J. A. Cartwright, and R. J. H.Jolly, 2000, Remobilization and injection in deepwaterdepositional systems: Implications for reservoir architectureand prediction, in P. Weimer, R. M. Slatt, J. Coleman, N. C.Rosen, H. Nelson, A. H., Bouma, M. J. Styzen, and D. T.Lawrence, eds., Deep-water reservoirs of the world: GulfCoast Section SEPM Foundation, 20th annual conference,Houston, p. 515–532.
Macaulay, C. I., A. E. Fallick, R. S. Haszeldine, and G. E. Mcaulay,2000, Oil migration makes the difference: Regional distribu-tion of carbonate cement d13C in northern North Sea Tertiarysandstones: Clay Minerals, v. 35, p. 69–76.
Maltman, A. J., 1994, Chapter 1: Introduction, in A. J. Maltman,ed., The geological deformation of sediments: London,Chapman and Hall, p. 1–35.
Mann, D. M., and A. S. Mackenzie, 1990, Prediction of pore fluidpressures in sedimentary basins: Marine and Petroleum Geol-ogy, v. 7, p. 55–65.
Mazzini, A., D. Duranti, R. Jonk, J. Parnell, B. Cronin, A. Hurst,and M. Quine, 2003, Palaeo-carbonate seep structures abovean oil reservoir, Gryphon field, Tertiary, North Sea: Geoma-rine Letters, v. 23, p. 323–339.
Middleton, G. V., and M. A. Hampton, 1973, Sediment gravityflows: Mechanics of flow and deposition, in G. V. Middleton andA. H. Bouma, eds., Turbidites and deep water sedimentation—Short course notes: Pacific Section SEPM, p. 1–38.
Mudge, D. C., and P. Copestake, 1992, Lower Palaeogene litho-stratigraphy of the northern North Sea: Marine and PetroleumGeology, v. 9, p. 287–301.
Murchison, R. I., 1827, Supplementary remarks on the oolitic seriesin the counties of Sutherland and Ross, and in the Hebrides:Transactions of the Geological Society, v. 2, no. ii, p. 353.
Newsome, J. F., 1903, Clastic dikes: Geological Society of AmericaBulletin, v. 14, p. 227–268.
Obermeier, S., 1996, Use of liquefaction-induced features for pa-leoseismic analysis— An overview of how seismic liquefac-tion features can be distinguished from other features and howtheir regional response distribution and properties of source sed-iment can be used to infer the location and strength of Holo-cene paleo-earthquakes: Engineering Geology, v. 44, p. 1–76.
Osborne, M. J., and R. E. Swarbrick, 1997, Mechanisms for gen-erating overpressure in sedimentary basins: A re-evaluation:AAPG Bulletin, v. 81, p. 1023–1041.
Parize, O., 2001, Sand injections in deep marine shale formations inSE France: Association des Sedimentologistes Francais Publi-cation, v. 35, 120 p.
Purvis, K., J. Kao, K. Flanagan, J. Henderson, and D. Duranti, 2002,Complex reservoir geometries in a deep water clasticsequence, Gryphon field, UKCS: Injection structures, geolog-ical modelling and reservoir simulation: Marine and PetroleumGeology, v. 19, p. 161–179.
356 Origin and Timing of Sand Injection, Petroleum Migration, and Diagenesis, South Viking Graben
Shackleton, N. H., and J. P. Kennett, 1975, Palaeotemperaturehistory of the Cenozoic and the initiation of Antarctic glaciation:Oxygen and carbon isotope analysis in DSDP sites 277, 279 and281: Initial Reports of the Deep Sea Drilling Project, v. 24,p. 743–755.
Shanmugam, G., R. B. Bloch, S. M. Mitchell, G. W. J. Beamish, R. J.Hodgkinson, J. E. Damuth, T. Straume, S. E. Syvertsen, and K. E.Shields, 1995, Basin-floor fans in the North Sea: Sequence strat-igraphic models vs. sedimentary facies: AAPG Bulletin, v. 79,p. 477–512.
Stewart, I. J., 1987, A revised stratigraphic interpretation of the earlyPalaeogene of the central North Sea, in J. Brooks and K. W.Glennie, eds., Petroleum geology of NW Europe: London,Graham and Trotman, p. 557–576.
Stewart, R. N. T., R. S. Haszeldine, A. E. Fallick, M. Wikinson, andC. Macaulay, 2000, Regional distribution of diagenetic carbon-ate cement in Palaeocene deepwater sandstones: North Sea:Clay Minerals, v. 35, p. 119–123.
Tucker, M. E., 1981, Sedimentary petrology; an introduction: NewYork, John Wiley, 252 p.
Van den Kerkhof, A. M., and U. F. Hein, 2001, Fluid inclusion pe-trography: Lithos, v. 55, p. 27–47.
Velde, B., 1996, Compaction trends of clay-rich deep sea sediments:Marine Geology, v. 133, p. 193–201.
Wachter, E. A., and J. M. Hayes, 1985, Exchange of oxygen isotopesin carbon dioxide-phosphoric acid systems: Chemical Geology,v. 52, p. 365–374.
Walderhaug, O., and P. A. Bjørkum, 1998, Calcite cement in shallowmarine sandstones: Growth mechanisms and geometry, in S.Morad, ed., Carbonate cementation in sandstones: InternationalAssociation of Sedimentologists Special Publication 26, p. 179–192.
Warren, E. A., and P. C. E. Smalley, eds., 1994, North Sea for-mation waters atlas: Geological Society (London) Memoir 15,208 p.
Waterston, C. D., 1950, Note on the sandstone injections of EathieHaven, Cromarty: Geological Magazine, v. 87, p. 133–139.
Watson, R. S., 1993, The diagenesis of Tertiary sands from theForth and Balmoral fields, northern North Sea: Ph.D. Thesis,University of Aberdeen, Aberdeen, 315 p.
Watson, R. S., N. H. Trewin, and A. E. Fallick, 1995,The formationof carbonate cements in the Forth and Balmoral fields,northern North Sea: A case for biodegradation, carbonatecementation and oil leakage during early burial, in A. J. Hartleyand D. J. Prosser, eds., Characterization of deep marine clasticsystems: Geological Society (London) Special Publication 94,p. 177–200.
Winslow, M. A., 1983, Clastic dike swarms and the structural evo-lution of the foreland fold and thrust belt of the southernAndes: Geological Society of America Bulletin, v. 94, p. 1073–1080.
Worden, R. H., and S. Morad, 2000, Quartz cementation in oil fieldsandstones: A review of the key controversies, in R. H. Wordenand S. Morad, eds., Quartz cementation in sandstones: Inter-national Association of Sedimentologists Special Publication 29,p. 1–20.
Worden, R. H., and S. Morad, 2003, Clay minerals in sandstones:Controls on formation, distribution and evolution, in R. H.Worden and S. Morad, eds., Clay mineral cements in sand-stones: International Association of Sedimentologists SpecialPublication 34, p. 3–41.
Ziegler, P. A., 1990, Geological atlas of Western and Central Europe:Den Haag, Shell Internationale Petroleum Maatschappij BV,(CD-ROM).
Jonk et al. 357