Embed Size (px)
Citation preview

Origin and Recharge Rates of Alluvial Ground Waters, Eastern Desert, Egypt
Mohamed Sultan
Environmental Research Division Argonne National Laboratory, Argonne, IL 60439-4843, USA
e-mail: [email protected]
Hazem Gheith EMH&T, Inc., Gahanna, OH 43230, USA
e-mail: [email protected]
Neil C. Sturchio Department of Earth and Environmental Sciences
University of Illinois at Chicago, Chicago, IL 60607-7059, USA e-mail: [email protected]
Zeinhom El Alfy
Egyptian Geological Survey and Mining Authority, Cairo, Egypt e-mail: [email protected]
Shuhab Danishwar
Environmental Science, School of Science and Math, Roosevelt University, Chicago, IL 60605, USA
e-mail: [email protected]
Abstract
Stable isotope and tritium analyses of shallow ground waters in the Eastern Desert of Egypt showed that the waters were derived largely by evaporation of regional precipitation and at least partly from precipitation in the past 45 y. To estimate the ground water recharge rate, we developed an integrated hydrologic model based on satellite data, geologic maps, infiltration parameters, and spatial rainfall distribution. Modeling indicated that during a severe 1994 storm, recharge through transmission loss in Wadi El-Tarfa was 21% of the precipitation volume. From archival precipitation data, we estimate that the annual recharge rate for the El-Tarfa alluvial aquifer is 4.7 x 10⁶ m3. Implications for the use of renewable ground waters in arid areas of Egypt and in neighboring countries are clear.

Introduction
Water shortages could adversely affect human welfare, economic activity, and stability in the Middle East. Efforts are needed to avert water shortages in the region and conflicts that might result. Perhaps the most important need is exploration for alternative renewable water sources. Faced with overpopulation problems and demand for development of new agricultural lands to support its increasing population, Egypt has adopted aggressive policies to develop new agricultural communities outside the overpopulated Nile Delta and Nile Valley and to relocate major portions of its population. Two national projects are under way: the El-Salam Canal, which will channel Nile River water to the Sinai Peninsula, and the Tushka Canal, which will divert Nile River water from Lake Nasser to the Baris Depression in the Western Desert (Fig. 1). These projects rely on Nile River waters as the sole source for irrigation of the newly reclaimed lands. Egypt is currently using almost its entire share (55.5 × 10⁹ m3 a-1) of Nile River waters; thus, alternative renewable water resources must be found if Egypt is to continue efforts to expand agricultural lands (Said, 1993).
This study aims at demonstrating the viability of alternative water resources, such as alluvial aquifers recharged by flash flooding, which could complement surface waters. Ground water in the shallow alluvial aquifers of the Eastern Desert and in the karstified Eocene limestone aquifers underlying the alluvial aquifers could provide an alternative renewable water resource. In the Eastern Desert, rainfall is collected as surface runoff through networks of alluvial channels in the main valleys and as ground water in the shallow alluvial and limestone aquifers flooring the main valleys. We show, through the use of isotopic techniques, that the source of much of the ground water in question is rainwater falling over the Red Sea hills area in the Eastern Desert. We develop a hydrologic model that simulates high-intensity rainfall, initial losses, and transmission losses into dry channel alluvium, the major processes that influence flooding events in arid areas. We then use the limited available temporal and spatial rain gauge data to provide conservative estimates of the renewable ground water resources of the Eastern Desert that are of meteoric origin. The results are applicable to topographically similar arid areas in Egypt (e.g., Sinai; Gheith and Sultan, 2001) and in neighboring countries (e.g., watersheds to the west of the Red Sea Hills in Sudan) where precipitation over mountainous areas recharges downstream alluvial aquifers.
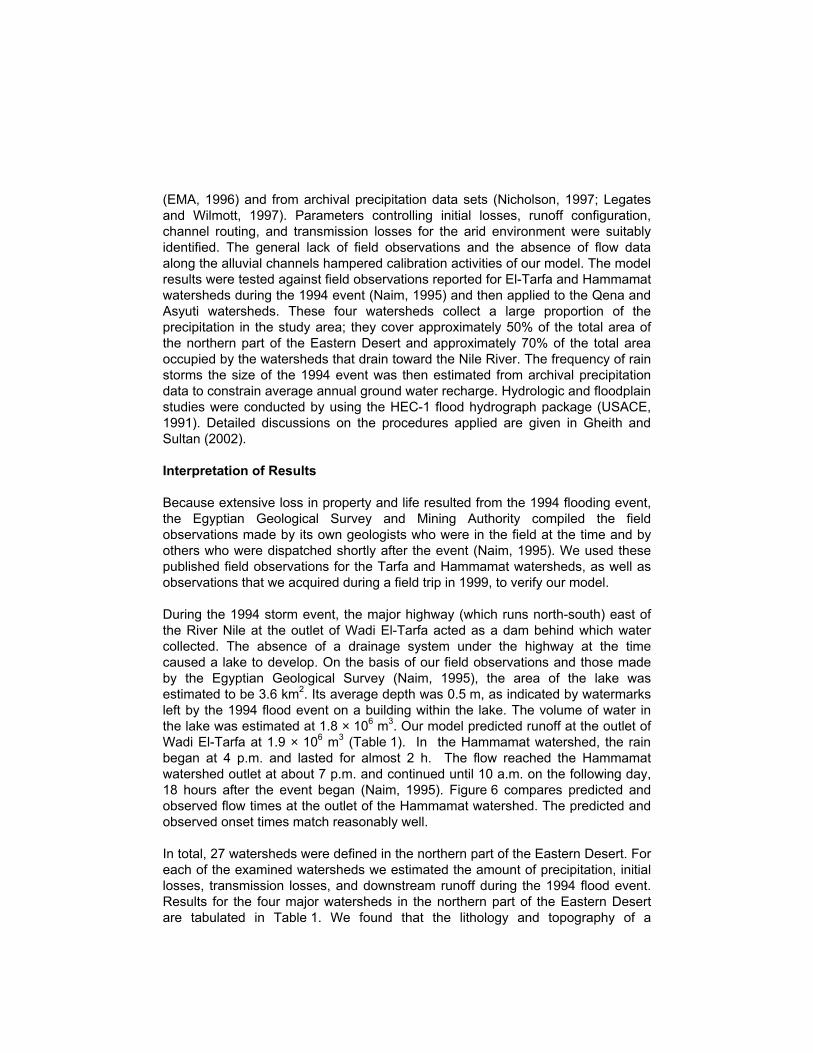
The Study Area
The subject of this study is the ground waters in the shallow (< 150 m) alluvial and limestone aquifers of Wadi El-Tarfa (Fig. 1) and the surrounding valleys, namely Asyuti, Wadi Qena, and Wadi Hammamat. Here, Quaternary deposits comprise wadi and floodplain deposits. The alluvial deposits were eroded from the dissected plateau, and the Red Sea hills and were deposited within the valleys. The floodplain deposits of the Nile Valley are made up of relatively thin (7 m) Holocene units of fine mud and silt deposited by repeated seasonal floods during the past
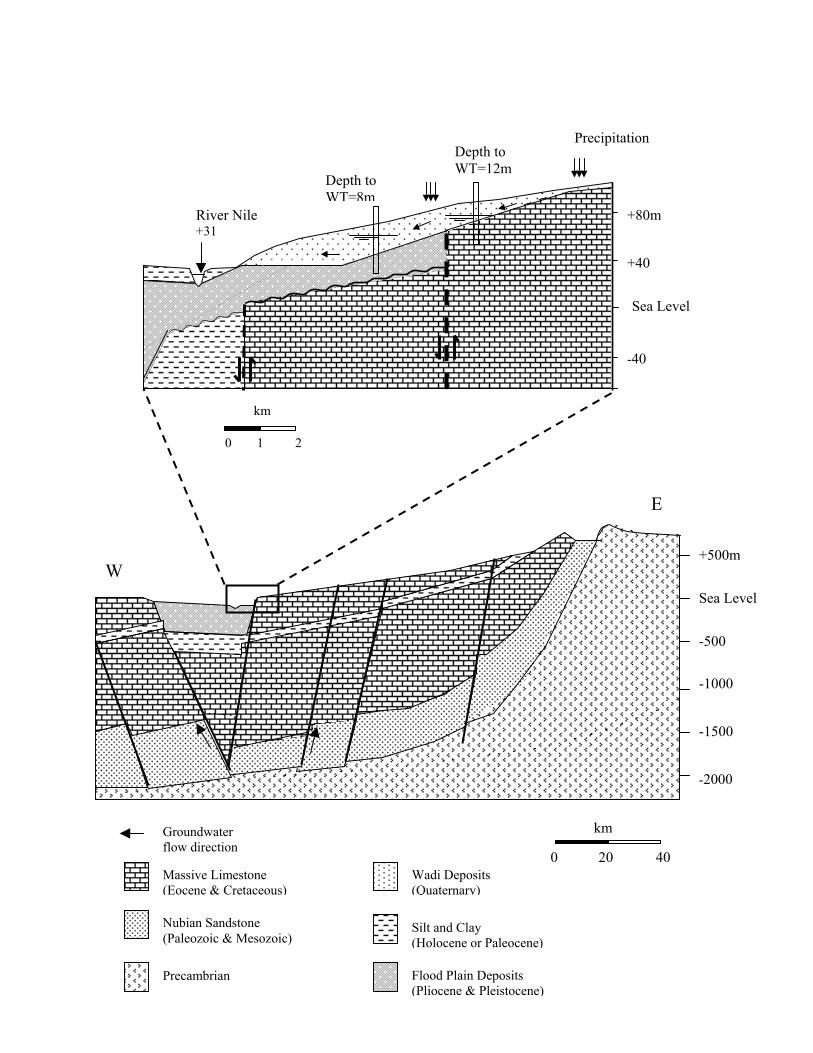
8,000 y. The sediments are underlain by thicker deposits of middle Pleistocene sand and gravel under the Nile Valley proper. The Quaternary deposits rest on karstified carbonates of Eocene and Upper Cretaceous ages. The carbonates are underlain by Paleozoic-Mesozoic Nubian sandstones that host nonrenewable fossil waters under high pressure (Fig. 2).
Isotopic Data from Wadi El-Tarfa
Hydrogen and oxygen isotope ratios were determined by the methods of Coleman et al. (1982) and Socki et al. (1992), respectively. Hydrogen and oxygen isotope ratios are expressed as
δ = [(Rsample/Rstandard) - 1] × 1000 , [1]
where R represents the ratio of D/H or 18O/16O, respectively, in the sample and the standard. The resulting sample values of δD and δ18O are reported in units of ‰ (per mil) or parts per thousand deviation relative to the corresponding ratios in Standard Mean Ocean Water.
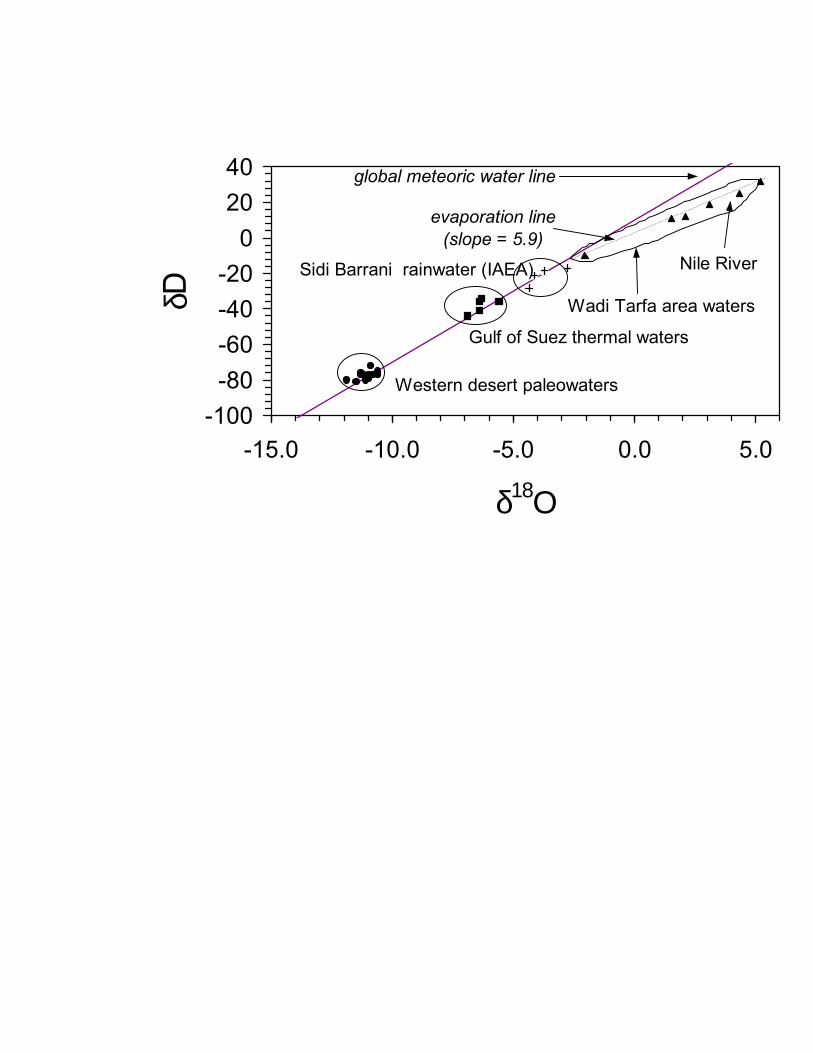
Results of the hydrogen and oxygen isotope analyses (Sultan et al., 2000) of Wadi El-Tarfa ground waters collected near the intersection of the wadi and the Nile River are shown in Fig. 3. Values of δD and δ18O range from -10 to +34‰ and from -3.6 to -0.1‰, respectively, defining a line with a slope of 5.9 that intersects the meteoric water line at about δD = -15‰ on the plot of δD vs. δ18O. Also shown in Fig. 3 are isotope data for Nubian aquifer paleowaters from the Western Desert of Egypt and the Gulf of Suez area (Sturchio et al., 1996; Sultan et al., 1997); modern precipitation from Sidi Barrani, Egypt (IAEA/WMO, 1998) which might represent modern precipitation in the Nile Valley area; and Nile River water from the El Minya area, collected before and after the erection of the High Dam (El Bakri et al., 1992).
The Wadi El-Tarfa ground waters have isotopic compositions that are quite distinct from those of the Nubian aquifer paleowaters. In addition, Wadi El-Tarfa ground waters are generally less enriched in D and 18O than modern Nile River water. The ground water samples plot mostly in a position intermediate between the Sidi Barrani on one hand and our Nile River water sample and some of the post-High Dam Nile River samples (El Bakri et al., 1992). This result indicates that the samples could be composed mostly of evaporated rainwater, such as flash flood waters that must occasionally infiltrate the shallow alluvial aquifers and the underlying limestone aquifers in the study area. Because the water table in all investigated wells is above the Nile River level (RIGW, 1988) the modern Nile River is unlikely to be the sole source of the ground water under investigation.
Tritium (3H), the radioactive isotope of hydrogen, has a half-life of 12.43 y. Tritium was produced during the atmospheric testing of fusion bombs between 1953 and 1964 and is an excellent tracer for recharge, flow, and mixing processes of young

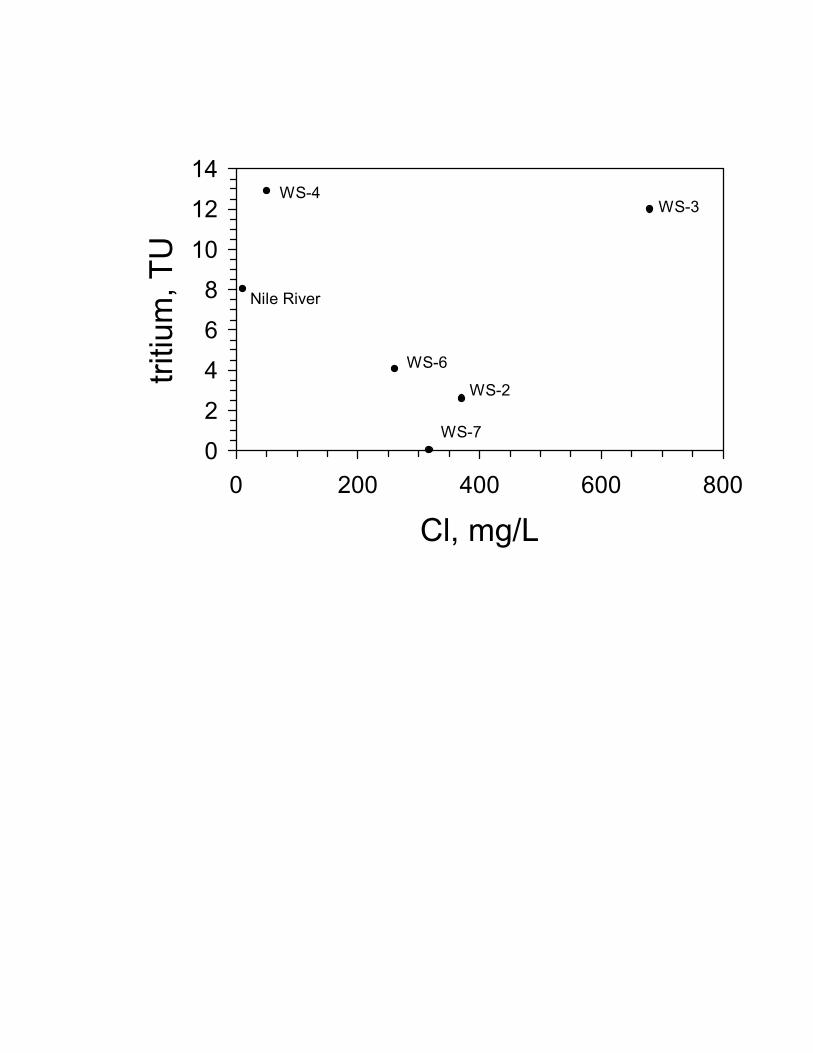
ground waters (Plummer et al., 1993). Because natural background tritium activity in the atmosphere was low (about 5 TU) prior to bomb testing, ground waters having tritium activities less than about 0.5 TU must have been derived from precipitation that fell before 1953. All of the waters except WS-7 have tritium activities (Fig. 4; WS-2: 2.61 ± 0.09; WS-3: 12.04 ± 0.4; WS-4: 12.9 ± 0.4; WS-6: 4.1 ± 0.1) indicative of postbomb precipitation (younger than 45 y). The low tritium activity for WS-7 ground water (0.04 ± 0.09 TU) indicates that it is older than 45 y, but no upper limit on its age can be estimated from these data. Some of the ground waters could represent mixtures of younger waters with older waters.
Surface Runoff Modeling
The model construction involved extraction of geomorphologic and lithologic information from Landsat thematic mapper (TM) scenes and digital terrain elevation data (DTED) to enable estimates to be made for initial loss, recharge rate through transmission loss, and runoff at the watershed’s outlets. We adopted the U.S. Department of Agriculture-Soil Conservation Service method (SCS, 1985) to calculate initial losses in the sub-basins. The SCS method is commonly used in the United States in areas lacking good coverage by rain gauges and in areas having poor runoff records, a situation like that encountered in our study area. Transmission losses were computed by using expressions (Walters, 1990) developed for areas with similar climatic conditions and landforms in the southwest hills of Saudi Arabia. We integrated precipitation patterns extracted from global average annual precipitation data sets over the study area and the limited precipitation records from the available rain gauges to generate spatial precipitation distribution patterns. We then tested the model by using field observations collected at the outlets of the investigated watersheds during the 1994 storm event. Finally, we developed criteria to provide first-order estimates for the frequency of extreme flood events and the average annual recharge rates.
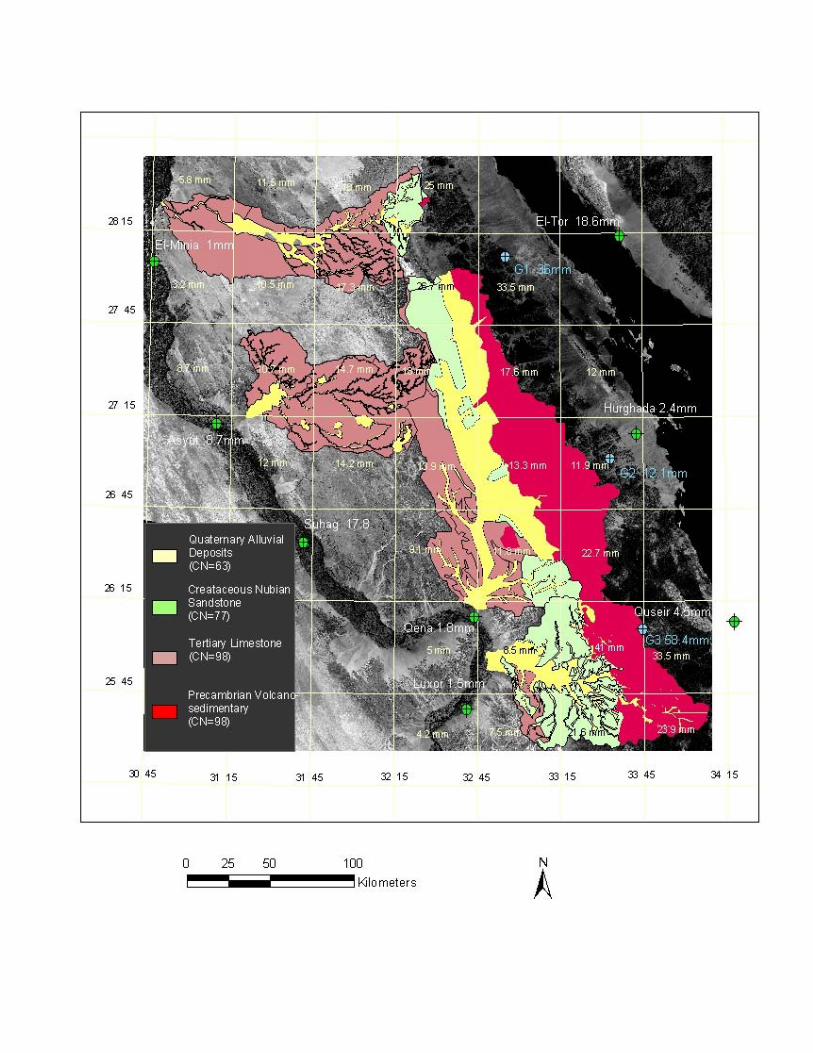
The first step in the development of our hydrologic model was the generation of a database incorporating digital mosaics from DTED, Landsat TM data, geologic maps, and topographic sheets. All digital data sets were co-registered and used for watershed delineation. A set of 3-arc-second (approximately 85-m) DTED prepared by the National Imagery Mapping Agency (NIMA, 1991) was used to define the distribution of watersheds and stream networks (Fig. 5), as well as geometric properties (areas, slope, lengths, etc.) for the main basins and valleys. Landsat TM band-4 scenes with 30-m resolution, acquired in 1996, were used to calibrate and verify the DTED-based distribution of watersheds and stream networks and to define the distribution of stream networks floored by alluvial deposits. Geologic maps (scale 1:500,000; Klitzsch et al., 1987a-e) were used for mapping valleys and soil types and as base maps onto which the Landsat TM scenes were co-registered.
Precipitation patterns over each of the watersheds were then determined for the 1994 event. Precipitation data were obtained from the Climatic Atlas of Egypt
(EMA, 1996) and from archival precipitation data sets (Nicholson, 1997; Legates and Wilmott, 1997). Parameters controlling initial losses, runoff configuration, channel routing, and transmission losses for the arid environment were suitably identified. The general lack of field observations and the absence of flow data along the alluvial channels hampered calibration activities of our model. The model results were tested against field observations reported for El-Tarfa and Hammamat watersheds during the 1994 event (Naim, 1995) and then applied to the Qena and Asyuti watersheds. These four watersheds collect a large proportion of the precipitation in the study area; they cover approximately 50% of the total area of the northern part of the Eastern Desert and approximately 70% of the total area occupied by the watersheds that drain toward the Nile River. The frequency of rain storms the size of the 1994 event was then estimated from archival precipitation data to constrain average annual ground water recharge. Hydrologic and floodplain studies were conducted by using the HEC-1 flood hydrograph package (USACE, 1991). Detailed discussions on the procedures applied are given in Gheith and Sultan (2002).
Interpretation of Results
Because extensive loss in property and life resulted from the 1994 flooding event, the Egyptian Geological Survey and Mining Authority compiled the field observations made by its own geologists who were in the field at the time and by others who were dispatched shortly after the event (Naim, 1995). We used these published field observations for the Tarfa and Hammamat watersheds, as well as observations that we acquired during a field trip in 1999, to verify our model.
During the 1994 storm event, the major highway (which runs north-south) east of the River Nile at the outlet of Wadi El-Tarfa acted as a dam behind which water collected. The absence of a drainage system under the highway at the time caused a lake to develop. On the basis of our field observations and those made by the Egyptian Geological Survey (Naim, 1995), the area of the lake was estimated to be 3.6 km2. Its average depth was 0.5 m, as indicated by watermarks left by the 1994 flood event on a building within the lake. The volume of water in the lake was estimated at 1.8 × 10⁶ m3. Our model predicted runoff at the outlet of Wadi El-Tarfa at 1.9 × 10⁶ m3 (Table 1). In the Hammamat watershed, the rain began at 4 p.m. and lasted for almost 2 h. The flow reached the Hammamat watershed outlet at about 7 p.m. and continued until 10 a.m. on the following day, 18 hours after the event began (Naim, 1995). Figure 6 compares predicted and observed flow times at the outlet of the Hammamat watershed. The predicted and observed onset times match reasonably well.
In total, 27 watersheds were defined in the northern part of the Eastern Desert. For each of the examined watersheds we estimated the amount of precipitation, initial losses, transmission losses, and downstream runoff during the 1994 flood event. Results for the four major watersheds in the northern part of the Eastern Desert are tabulated in Table 1. We found that the lithology and topography of a
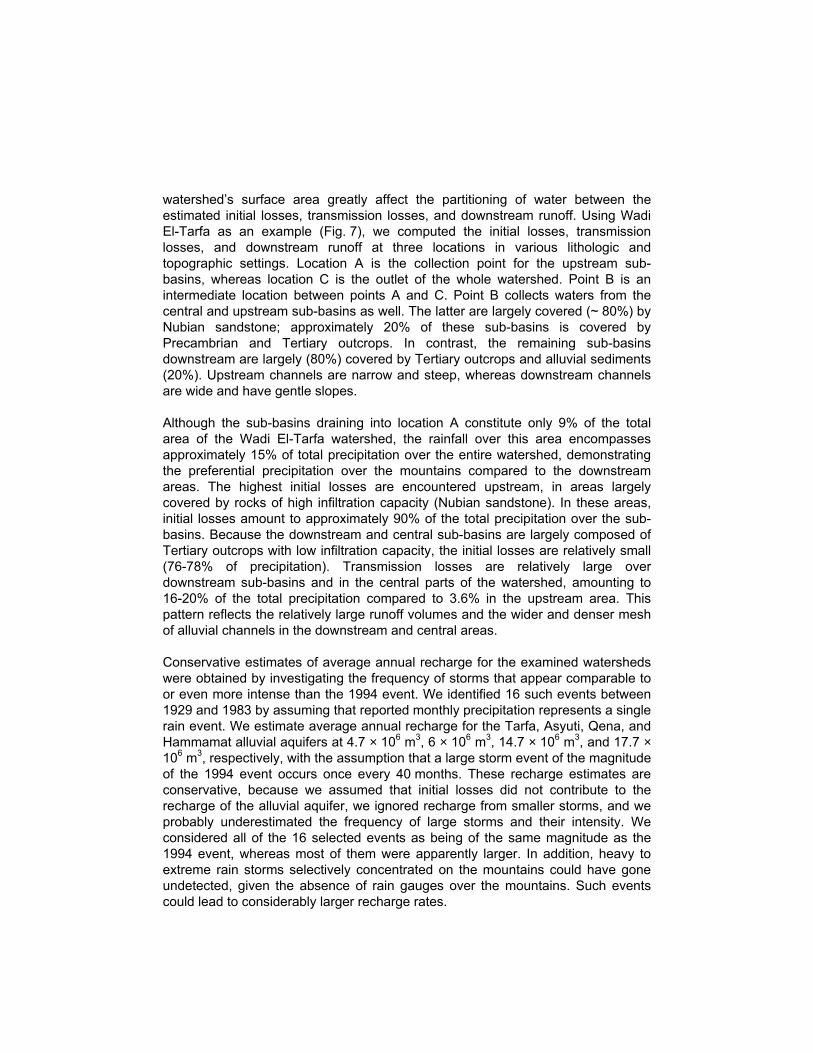
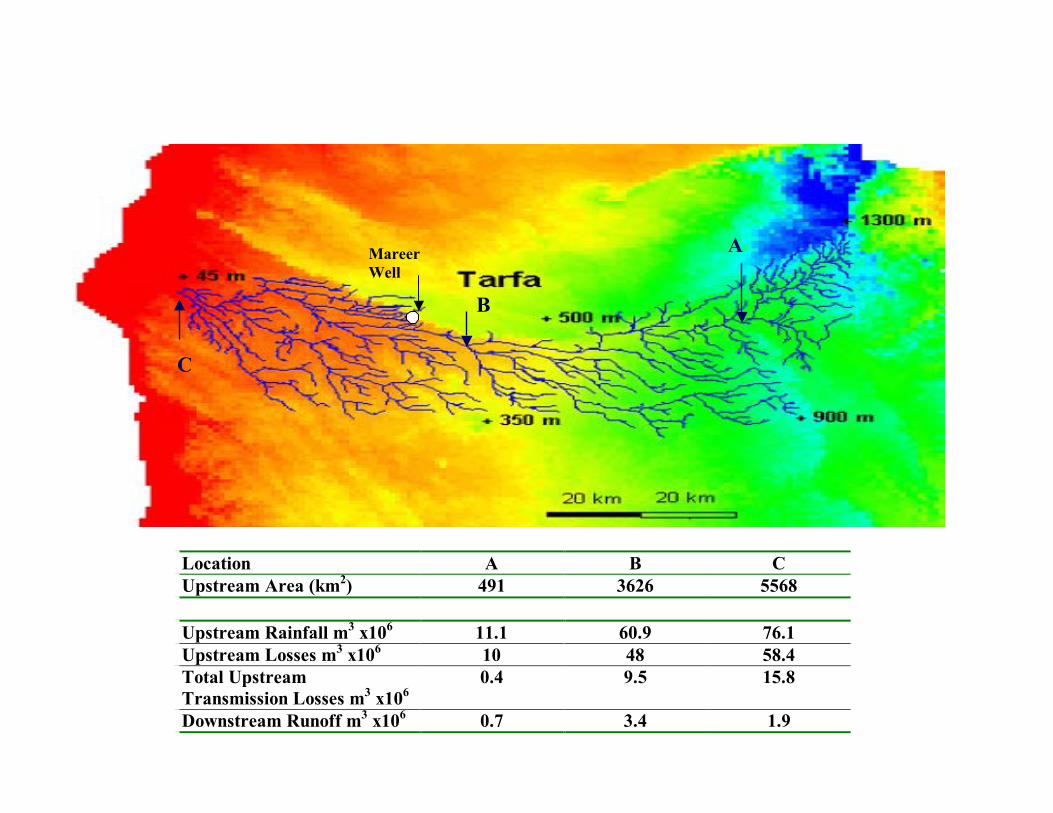
watershed’s surface area greatly affect the partitioning of water between the estimated initial losses, transmission losses, and downstream runoff. Using Wadi El-Tarfa as an example (Fig. 7), we computed the initial losses, transmission losses, and downstream runoff at three locations in various lithologic and topographic settings. Location A is the collection point for the upstream sub-basins, whereas location C is the outlet of the whole watershed. Point B is an intermediate location between points A and C. Point B collects waters from the central and upstream sub-basins as well. The latter are largely covered (~ 80%) by Nubian sandstone; approximately 20% of these sub-basins is covered by Precambrian and Tertiary outcrops. In contrast, the remaining sub-basins downstream are largely (80%) covered by Tertiary outcrops and alluvial sediments (20%). Upstream channels are narrow and steep, whereas downstream channels are wide and have gentle slopes.
Although the sub-basins draining into location A constitute only 9% of the total area of the Wadi El-Tarfa watershed, the rainfall over this area encompasses approximately 15% of total precipitation over the entire watershed, demonstrating the preferential precipitation over the mountains compared to the downstream areas. The highest initial losses are encountered upstream, in areas largely covered by rocks of high infiltration capacity (Nubian sandstone). In these areas, initial losses amount to approximately 90% of the total precipitation over the sub-basins. Because the downstream and central sub-basins are largely composed of Tertiary outcrops with low infiltration capacity, the initial losses are relatively small (76-78% of precipitation). Transmission losses are relatively large over downstream sub-basins and in the central parts of the watershed, amounting to 16-20% of the total precipitation compared to 3.6% in the upstream area. This pattern reflects the relatively large runoff volumes and the wider and denser mesh of alluvial channels in the downstream and central areas.
Conservative estimates of average annual recharge for the examined watersheds were obtained by investigating the frequency of storms that appear comparable to or even more intense than the 1994 event. We identified 16 such events between 1929 and 1983 by assuming that reported monthly precipitation represents a single rain event. We estimate average annual recharge for the Tarfa, Asyuti, Qena, and Hammamat alluvial aquifers at 4.7 × 10⁶ m3, 6 × 10⁶ m3, 14.7 × 10⁶ m3, and 17.7 × 10⁶ m3, respectively, with the assumption that a large storm event of the magnitude of the 1994 event occurs once every 40 months. These recharge estimates are conservative, because we assumed that initial losses did not contribute to the recharge of the alluvial aquifer, we ignored recharge from smaller storms, and we probably underestimated the frequency of large storms and their intensity. We considered all of the 16 selected events as being of the same magnitude as the 1994 event, whereas most of them were apparently larger. In addition, heavy to extreme rain storms selectively concentrated on the mountains could have gone undetected, given the absence of rain gauges over the mountains. Such events could lead to considerably larger recharge rates.

Summary
We constructed a hydrologic model to estimate the ground water recharge rate for alluvial aquifers in Wadi El-Tarfa and the major watersheds of the north Eastern Desert from sporadic precipitation. The integrated model combines spatial rainfall distribution and appropriate infiltration parameters to estimate initial losses over sub-basins and transmission losses through channel routing. We made conservative estimates of ground water recharge by assuming that transmission loss through channel routing is the sole source for the recharge. By using DTED with Landsat TM scenes and geologic maps, we delineated the watershed boundaries and the stream networks within the watersheds. Records of a November 1994 storm event acquired from rain gauges along the Nile River and the Red Sea shore were used to generate a spatial precipitation distribution for the study area. We tested the model against records from the November 1994 flood event at the outlets of the El-Tarfa and Hammamat watersheds.
We estimated that during the 1994 flood event, the ground water recharge through transmission loss in Wadi El-Tarfa reached 21% of the precipitation volume. The initial loss was 76%, and only 3% of the precipitation reached the watershed outlet. Given the archival precipitation data for the Eastern Desert area, we estimate that the annual recharge rate for the El-Tarfa alluvial aquifer is 4.7 x 10⁶ m3. Implications for the use of these renewable ground waters and similar water resources in other arid areas of Egypt and in neighboring countries are clear.
Acknowledgments. We thank Professors Naguib El Helaly, Farouk Ismail, Mohamed Shuhaieb, Fathy Saad, and Hamdy Ibrahim for facilitating collaborative scientific research between Cairo University and Argonne National Laboratory. Efforts at Argonne National Laboratory were supported by Cairo University through U.S. Department of Energy contract W-31-109-Eng-38.

Figure Captions
Figure 1. Map showing the location of the study area, including Wadi El-Tarfa, Asyuti, Hammamat, and Qena. Also shown are the locations of other main valleys of the Eastern Desert that drain into the Nile River and could have hydrologic settings similar to those investigated in this study.
Figure 2. Schematic west-to-east cross section (top) along Wadi El-Tarfa, showing the major stratigraphic units and water table elevations in relation to the Nile River surface elevation. Also shown (bottom) is a schematic west-to-east cross section from the Nile River (west) across the study area to the Red Sea hills (east). The cross sections are based on our field data and on published data (RIGW, 1988).
Figure 3. Plot of δD vs. δ18O in the Wadi El-Tarfa and surrounding ground waters (solid triangles; this study), Nubian aquifer paleowaters from the Western Desert of Egypt (solid circles; Sultan et al., 1997), thermal waters from the Gulf of Suez area (solid squares; Sturchio et al., 1996), modern rainwater from Sidi Barrani, Egypt (plus signs; IAEA/WMO, 1998), and our Nile surface water analysis (open triangle). Also shown are two fields for ground water from El Minya that was interpreted as recharge from Nile River before and after the erection of the High Dam (El Bakri et al., 1992) and the global meteoric water line, δD = 8δ18O + 10 (Craig, 1961).
Figure 4. Plot of tritium vs. chloride concentrations in Wadi El-Tarfa and surrounding ground waters.
Figure 5. Mosaic of nine Landsat TM band-4 images covering the study area, with an overlay of DTED-derived elevations (meters above sea level) and the wadi network. Digital contours were derived from a mosaic of 12 cells of 3-arc-second DTED prepared by NIMA (1991). The highest terrain (blue) is in the Red Sea hills; the lowest terrain (red) is at the Nile River and on the Red Sea and Gulf of Suez coastlines. The Tertiary plateau shows intermediate (green) to high elevations.
Figure 6. Runoff hydrograph that shows the relationship, with time, of discharge for the 1994 flood at the outlet of Wadi Hammamat. Also shown are the observed onset and termination times for the flood.
Figure 7. Color-coded DTED-derived elevations (meters above sea level) over the Wadi El-Tarfa watershed, showing estimates of precipitation, initial losses, transmission losses, and downstream runoff at various locations (A, B, C) in the watershed.
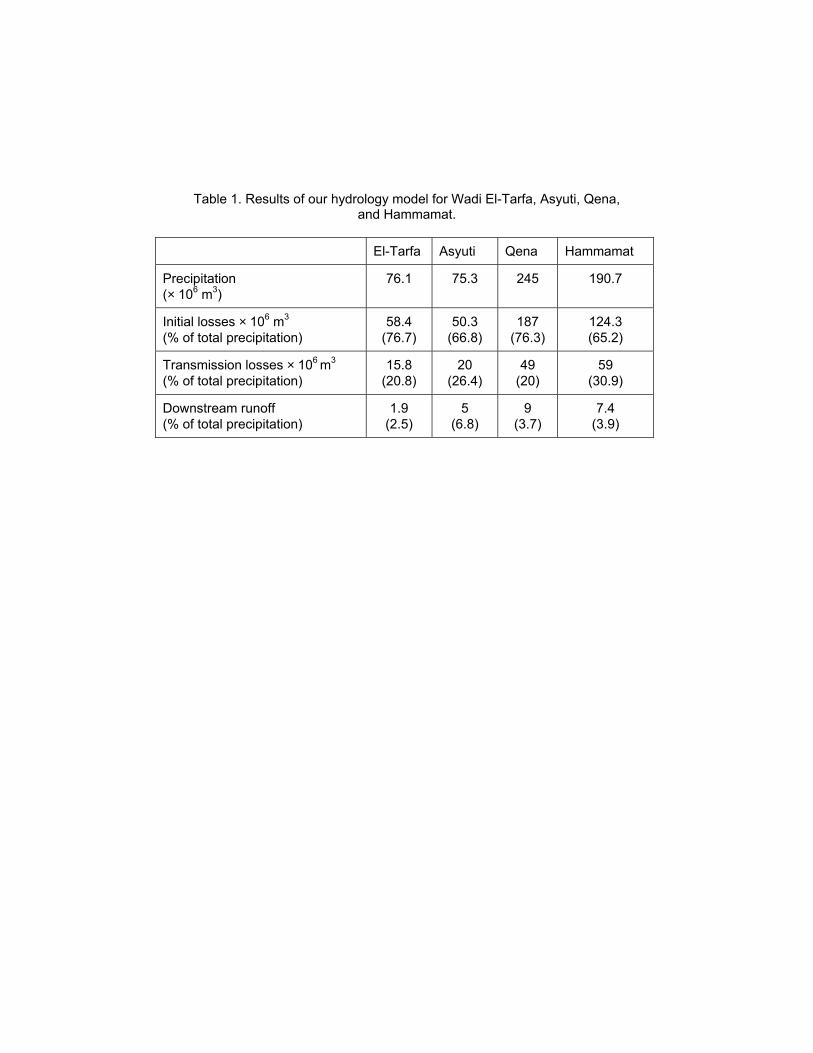
Table 1. Results of our hydrology model for Wadi El-Tarfa, Asyuti, Qena, and Hammamat.
El-Tarfa Asyuti Qena Hammamat
Precipitation (× 106 m3)
76.1 75.3 245 190.7
Initial losses × 106 m3 (% of total precipitation)
58.4 (76.7)
50.3 (66.8)
187 (76.3)
124.3 (65.2)
Transmission losses × 106 m3 (% of total precipitation)
15.8 (20.8)
20 (26.4)
49 (20)
59 (30.9)
Downstream runoff (% of total precipitation)
1.9 (2.5)
5 (6.8)
9 (3.7)
7.4 (3.9)
References
Craig, H. (1961). “Isotopic variations in meteoric waters”. Science 133, 1702-1703.
Coleman, M.L., Shepherd, T.J., Durham, J.J., Rouse, J.E., and Moore, G.R. 1982. “Reduction of water with zinc for hydrogen isotope analysis”. Analytical Chemistry 54, 993-995.
El Bakri, A., Tantawi, A., Blavoux, B., and Dray, M. (1992). “Sources of water recharge identified by isotopes in El Minya Governate (Nile valley, Middle Egypt)”. In Proceedings of an International Symposium on Isotope Techniques in Water Resources Development 1991, International Atomic Energy Agency, Vienna, 643-645.
EMA (1996). Climatic Atlas of Egypt. Egyptian Meteorological Authority, Ministry of Transport and Communications, Cairo, Egypt.
Gheith, H., and Sultan, M. (2001). “Assessment of the renewable groundwater resources of Wadi El-Arish, Sinai, Egypt: Modeling, remote sensing and GIS applications”, in Remote Sensing and Hydrology 2000, IAHS publication 267, ed. M. Owe et al., 451-454. Gheith, H., and Sultan, M. (2002). “Construction of a hydrology model for estimating wadi runoff and groundwater recharge in the Eastern Desert, Egypt”, Journal of Hydrology, in press.
IAEA/WMO (1998). Global network for isotopes in precipitation. The GNIP database. Release 2 May 1998, International Atomic Energy Agency/World Meteorological Organization, http://www.iaea.org/programs/ri/gnip/gnipmain.htm.
Klitzsch, E., List, F.K., and Pohlmann, G. (1987a). Geological Map of Egypt, Beni Suef Sheet. Scale 1:500,000. The Egyptian General Petroleum Corporation/Conoco, Cairo, Egypt.
Klitzsch, E., List, F.K., and Pohlmann, G. (1987b-e). Geological Map of Egypt, Asyut Sheet. Scale 1:500,000. The Egyptian General Petroleum Corporation/Conoco, Cairo, Egypt.
Legates, D.R., and Wilmott, C.J. (1997). Legates Surface and Ship Observation of Precipitation. ftp://daac.gsfc.nasa.gov/hydrology/precip/legates/README.legates_gauge_precip
Naim, G. (1995). Floods of Upper Egypt Governorates, Egyptian Geological Survey and Mining Authority, Cairo, Egypt.

Nicholson, S. (1997). Nicholson’s Africa Precipitation, National Center for Atmospheric Research. ftp://ncardata.edu/datasets/ds571.0/MASTER
NIMA (1991). CD: DTED147, National Imagery Mapping Agency, USA.
Plummer, L.N., Michel, R.L., Thurman, E.M., and Glynn, P.D. (1993). “Environmental tracers for age dating young ground water”. In Regional Ground-Water Quality, ed. W.M. Alley, Van Nostrand Reinhold, New York, USA, 255-294.
RIGW (1988). Hydrogeological Map of Egypt. Scale 1:2000,000. Research Institute for Groundwater, Ministry of Public Works and Water Resources, Cairo, Egypt.
Said, R. (1993). The Nile River: Geology, Hydrology, and Utilization. Pergamon, New York, USA.
Socki, R.A., Karlsson, H.R., and Gibson, E.K. (1992). “Extraction technique for the determination of oxygen-18 in water using pre-evacuated glass vials”. Analytical Chemistry 64, 829-831.
SCS (1985). National Engineering Handbook, Section 4: Hydrology, U.S. Department of Agriculture, Soil Conservation Service, Engineering Division, Washington, D.C., USA.
Sturchio, N.C., Sultan, M., Arehart, G.B., Sano, Y., Abo Kamar, Y., and Sayed, M. (1996). “Composition and origin of thermal waters in the Gulf of Suez area, Egypt”. Applied Geochemistry 11, 471-479.
Sultan, M., Sturchio, N., Hassan, F.A., Hamdan, M.A.R., Mahmood, A.M., El Alfy, Z., and Stein, T. (1997). “Precipitation source inferred from stable isotopic composition of Pleistocene groundwater and carbonate deposits in the Western Desert of Egypt”. Quaternary Geology 4, 29-37.
Sultan, M., Sturchio, N., Gheith, H., Abdel Hady, Y., and El Anbeawy, M. (2000). “Chemical and isotopic constraints on the origin of Wadi El Tarfa ground waters, Eastern Desert, Egypt”. Groundwater 38, 743-751.
USACE (1991), HEC-1 Version 4.1.1E, U.S. Army Corps of Engineers, Hydrologic Engineering Center, Davis, California, USA.
Walters, M.O. (1990). “Transmission losses in arid regions”. Journal of Hydraulic Engineering, ASCE, 116, 129-138.

SUDAN
EGYP
T WESTERN DESERTLI
BYA
NUBIAN
AQUIFER
Farafra
Bahariya
Qatara
Dakhla
Kharga
Baris AswanDam
Cairo
SINAI
Delta
Tushka Canal under construction
Ephemeral Valleys
Crystalline Rocks
Nile Valley and Delta
Oases
Tarfa
Asyuti
Kherit
Shait
0 200kmN
RE
D S
EA
HILLS
Natesh
EASTERN DESERT
Qena
El-Tor
El-Minia
QenaLuxor
Asyut
GizaHelwan
Nile River Valley
Suhag
Hurghada
Quseir
Asyut airpot
Hammamat
Groundwater flow direction
Depth to WT=12m
Depth to WT=8m
210
km
Wadi Deposits (Quaternary)
Silt and Clay (Holocene or Paleocene)
Flood Plain Deposits (Pliocene & Pleistocene)
Precambrian
Nubian Sandstone (Paleozoic & Mesozoic)
Massive Limestone (Eocene & Cretaceous)
20 0
km
River Nile+31
Sea Level
+40
+80m
-40
Precipitation
E
+500m
W-2000
-500
-1000
-1500
Sea Level
40
-100-80-60-40-20
02040
-15.0 -10.0 -5.0 0.0 5.0
δ18Ο
δD
Nile River
evaporation line(slope = 5.9)
Western desert paleowaters
Gulf of Suez thermal waters
Wadi Tarfa area waters
Sidi Barrani rainwater (IAEA)
global meteoric water line
02468
101214
0 200 400 600 800
Cl, mg/L
tritiu
m, T
U
Nile River
WS-2
WS-6
WS-7
WS-3WS-4

0
50
100
150
200
250
0.00 3.00 6.00 9.00 12.00 15.00 18.00 21.00 24.00 27.00 30.00 33.00 36.00
Time
Dis
char
ge m
3 /sec
Start (3hrs) End (18 hrs)
Observed
Calculated
Mareer Well
C
B
A
Location A B C Upstream Area (km2) 491 3626 5568
Upstream Rainfall m3 x106 11.1 60.9 76.1 Upstream Losses m3 x106 10 48 58.4 Total Upstream Transmission Losses m3 x106
0.4 9.5 15.8
Downstream Runoff m3 x106 0.7 3.4 1.9