Embed Size (px)
Citation preview
32nd International North Sea Flow Measurement Workshop 21-24 October 2014
Technical Paper
1
Orifice Plates with Drain Holes
Michael Reader-Harris, NEL David Addison, NEL
1 INTRODUCTION
Where a gas flow is continuously wet an orifice plate does not require a drain hole. However, a drain hole is appropriate where some liquid is introduced to the pipeline over a short period of time, but thereafter the gas flow is dry. In this case there is no need for wet-gas measurement; the problem is that during periods in which there is some liquid flow a pool of liquid will build up against the upstream face and thus the metering accuracy will be undermined even during the time when the flow is dry. Another installation where a drain hole was found appropriate was one where without a drain hole there was very significant accumulation of dirt; a new orifice plate with a drain hole allowed small particles of dirt to pass the plate and hence solved the problem. The drain-hole solution provides a liquid bypass in the plate allowing liquids in a gas stream to pass through the plate. While drain-hole plates are a cost-effective way of measuring gas with a very low liquid content, they are not as accurate in single-phase flow as the standard design. As the extent of this inaccuracy is not well documented and as industry is sceptical of the existing formula, drain-hole plates are not as widely used as they might be: new data have therefore been needed to give confidence in their use. ISO/TR 11583:2012 [1] covers wet-gas flow using orifice plates without drain holes. There is no accepted correlation for over-reading for orifice plates with drain holes in wet gas, and one is probably not needed. In many wet-gas flows through an orifice plate with a drain hole most of the liquid would pass through the orifice, not through the drain hole. Figure 1 shows a picture of an orifice plate with a drain hole. The plate is fitted between the flanges using the bolt holes around the plate circumference. The dashed line visible in Fig. 1 marks out the area of the plate that is exposed to the fluid within the pipe.
Flange fittings
drain hole
Area within dashed line was exposed to fluid within the pipe
Fig. 1 Annotated picture of an orifice plate with a drain hole
Bolt holes
Dowel hole
32nd International North Sea Flow Measurement Workshop 21-24 October 2014
Technical Paper
2
The drain hole is a smooth circular hole through the plate located at the bottom of the pipe and with the bottom of the hole aligned with the bottom edge of the upstream pipe. The upstream edge of the drain hole should be sharp. The diameter of the downstream pipe at the orifice plate should be very similar to the upstream pipe: if the downstream pipe were much smaller than the upstream it would partially or completely block the drain hole. Alignment of the upstream pipe, the orifice plate and the downstream pipe is particularly important when there is a drain hole: for example, the dowel holes in Fig. 1 achieve this alignment. There is a desire within industry to use orifice plates with drain holes, but ISO/TR 15377:2007 [2], the only reference document, is based on a very simple theoretical model: the measured orifice diameter, d, is corrected to a corrected orifice diameter, dc, to allow for the additional flowrate due to the orifice area represented by the drain hole of diameter d
h as shown in the following equation:
2
1 0.55 hc
dd d
d
= +
(1)
Equation (1) is based on the assumption that the value for Cε(1 - β4)
-0.5 for flow
through the drain hole is 10 % greater than the value for flow through the orifice. When Equation (1) is used to calculate the flowrate ISO/TR 15377:2007 states that the following additional percentage uncertainty should be added arithmetically to the discharge coefficient percentage uncertainty:
2
55 hd
d
. (2)
Since Equations (1) and (2) are not based on experiment there was a need for experimental data to improve the understanding of the physics of flow through drain holes and then to revise the standard. The project started with a brief literature survey and contacts with those with relevant experience. No published experimental data were found. One contributor’s experience was that drain holes as large as are permissible in ISO/TR 15377 were normal to avoid blockage, another’s that drain holes either larger or smaller may be used, and another’s that drain holes are typically 6 to 10 mm in diameter, regardless of pipe size. Although drain holes are sometimes not placed on the wall all contributors agreed that they should touch the wall. Blockage with solid material is a risk with drain holes and would not generally be detected but would lead to an error whose magnitude is equal to that of the drain hole correction. NOTE For β greater than around 0.4 (depending on drain hole size) a blockage could be
detected if the differential pressure were measured using two pairs of tappings, one
located on the top and the other on the side of the pipe: if the differential pressure were
the same with the two pairs of tappings a blockage would be assumed (see Fig. 4).
The correction required when there is liquid flowing through the drain hole is unknown but it is assumed that the flow is nearly always dry; so no correction to the total measured flow is required to take account of the small fraction of the time when liquid is flowing.
32nd International North Sea Flow Measurement Workshop 21-24 October 2014
Technical Paper
3
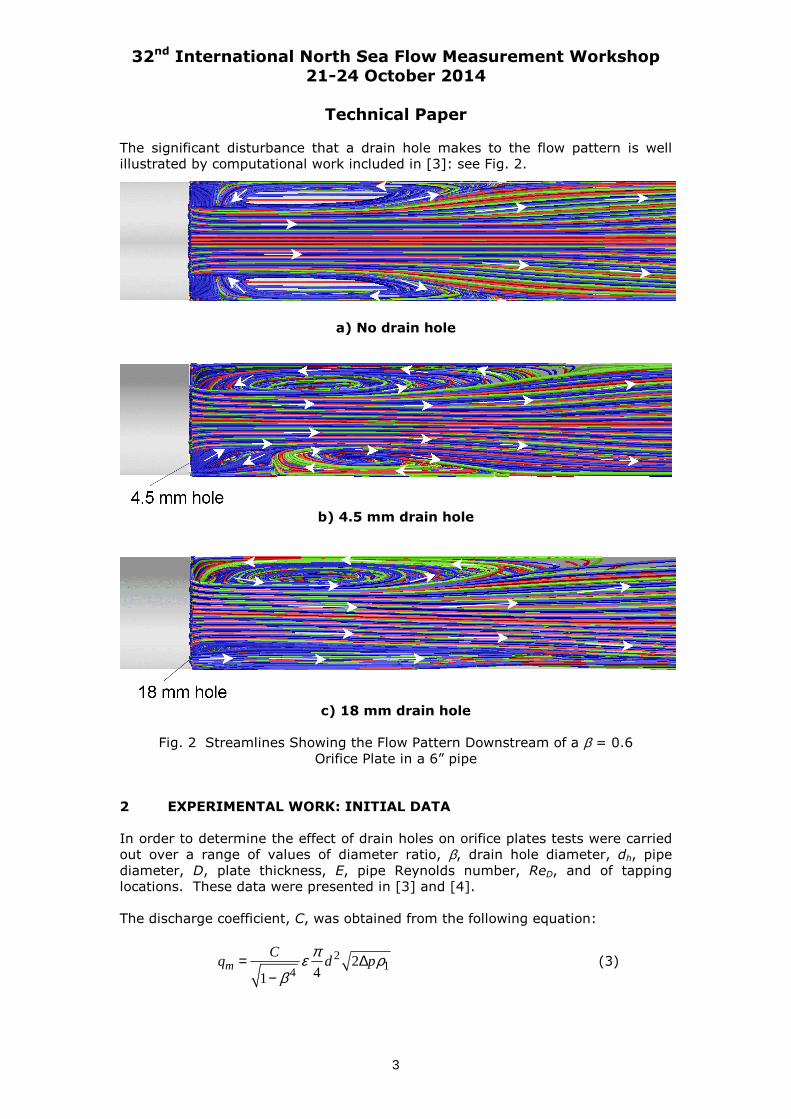
The significant disturbance that a drain hole makes to the flow pattern is well illustrated by computational work included in [3]: see Fig. 2.
a) No drain hole
b) 4.5 mm drain hole
c) 18 mm drain hole
Fig. 2 Streamlines Showing the Flow Pattern Downstream of a β = 0.6
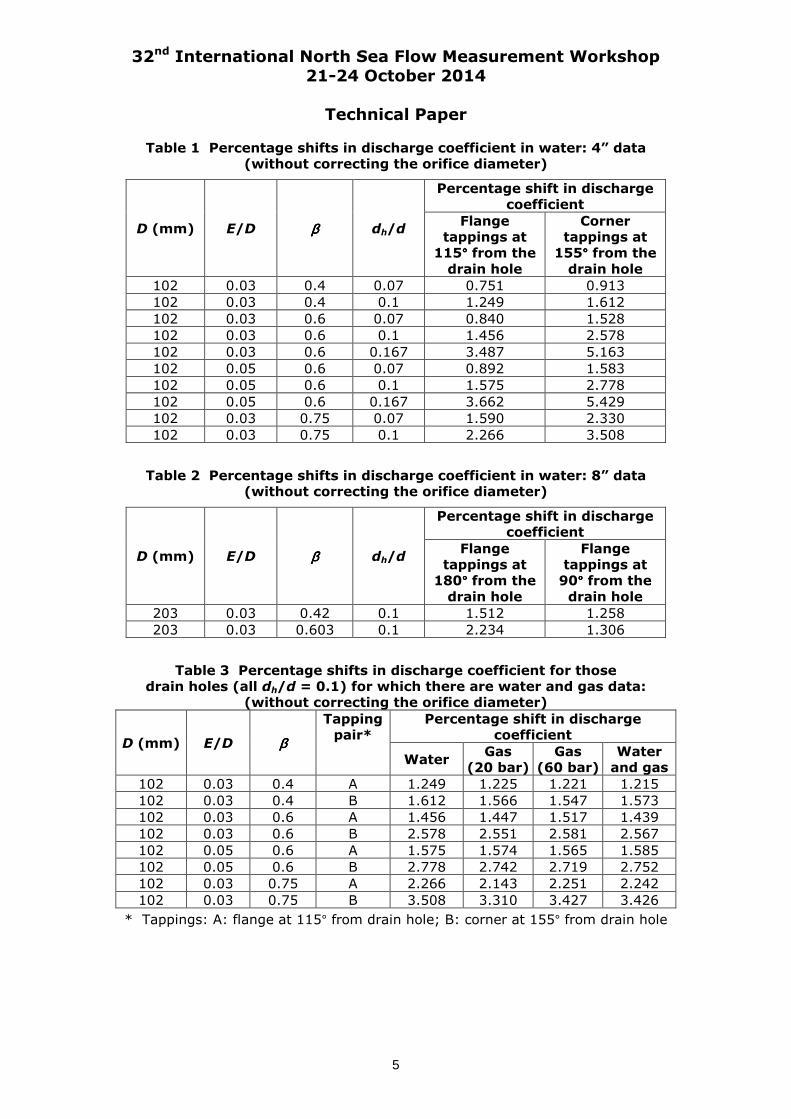
Orifice Plate in a 6” pipe 2 EXPERIMENTAL WORK: INITIAL DATA In order to determine the effect of drain holes on orifice plates tests were carried out over a range of values of diameter ratio, β, drain hole diameter, dh, pipe
diameter, D, plate thickness, E, pipe Reynolds number, ReD, and of tapping locations. These data were presented in [3] and [4]. The discharge coefficient, C, was obtained from the following equation:
2
14
241
mC
q d pπε ρ
β= ∆
− (3)
32nd International North Sea Flow Measurement Workshop 21-24 October 2014
Technical Paper
4
where qm is the mass flowrate of fluid, Δp is the differential pressure and ρ1 the
density at the upstream pressure tapping. ε is the expansibility as given by ISO
5167-2:2003. When a drain hole is included S, the percentage shift in C from that obtained with the same plate without a drain hole, was calculated. Note that the orifice diameter, d, is used for both calculations of discharge coefficient (not a corrected orifice diameter for the plate with a drain hole) and that throughout this paper β remains the ratio of orifice diameter, d, to pipe diameter. From physical
considerations it is reasonable to expect that the key parameters are dh/d, β,
E/dh, and L’2, where L’2 = l’2/D and l’2 is the distance between the downstream face of the orifice plate and the downstream pressure tapping. To achieve an appropriate pattern of test data an existing 4” orifice run with flange and corner tappings was used with new plates with β = 0.4, 0.6 and 0.75.
These three plates all had E = 3 mm. 3 mm is near the middle of the permissible
range of values in ISO 5167-2:2003 [5]. In the US E = 18 inch (3.175 mm) is
normal for this pipe size. It seemed reasonable to suppose that thicker plates might make a difference, as the flow within the drain hole is more likely to reattach within a thicker plate (relative to dh) than within a thinner one; so a plate with β = 0.6 and E = 5 mm was manufactured. Where E/D = 0.05 the plate
was designated as thick. The maximum permissible value of dh/d in ISO/TR 15377:2007 is 0.1; so dh = 0.1d was tested together with dh = 0.07d and, where possible, a higher value of dh too. The drain holes (like the orifices) were inserted using spark erosion (sometimes called Electrical Discharge Machining). All the plates with all the drain holes were tested in water, and, to examine whether there was an effect of Reynolds number, baselines and data with dh = 0.1d were obtained in gas (nitrogen) at nominal gauge pressures of 20 bar and 60 bar. To determine the effect of pipe diameter an 8” orifice run was constructed and tested in water with two orifice plates, β = 0.42 and 0.6. The internal diameter
upstream of the orifice plate was 202.56 mm; that downstream of the plate was 202.65 mm. Some of the data were taken with tappings on the side of the pipe (90° from the
drain hole) or on the top of the pipe (180° from the drain hole), but some of the
data were taken with tappings at 115° or 155° from the drain hole. All the shifts
in discharge coefficient taken in water are shown in Tables 1 and 2. Where data were taken in water and in gas, that is in the 4” pipe with dh/d = 0.1, the shifts are shown in Table 3. Details of the test work and of the analysis are given in [3].
There were sufficient data to show that Equation (1), the equation in 5.1.2 of ISO/TR 15377:2007, creates a bias but not sufficient to produce a reliable equation. The work showed that the effect of Reynolds number was negligible, but that more data were required, especially for small β, for smaller E/D and for a
wider range of pipe sizes.
32nd International North Sea Flow Measurement Workshop 21-24 October 2014
Technical Paper
5
Table 1 Percentage shifts in discharge coefficient in water: 4” data (without correcting the orifice diameter)
D (mm) E/D ββββ dh/d
Percentage shift in discharge coefficient
Flange tappings at
115°°°° from the
drain hole
Corner tappings at
155°°°° from the
drain hole
102 0.03 0.4 0.07 0.751 0.913
102 0.03 0.4 0.1 1.249 1.612
102 0.03 0.6 0.07 0.840 1.528
102 0.03 0.6 0.1 1.456 2.578
102 0.03 0.6 0.167 3.487 5.163
102 0.05 0.6 0.07 0.892 1.583
102 0.05 0.6 0.1 1.575 2.778
102 0.05 0.6 0.167 3.662 5.429
102 0.03 0.75 0.07 1.590 2.330
102 0.03 0.75 0.1 2.266 3.508
Table 2 Percentage shifts in discharge coefficient in water: 8” data (without correcting the orifice diameter)
D (mm) E/D ββββ dh/d
Percentage shift in discharge coefficient
Flange tappings at
180°°°° from the
drain hole
Flange tappings at
90°°°° from the
drain hole
203 0.03 0.42 0.1 1.512 1.258
203 0.03 0.603 0.1 2.234 1.306
Table 3 Percentage shifts in discharge coefficient for those drain holes (all dh/d = 0.1) for which there are water and gas data:
(without correcting the orifice diameter)
D (mm) E/D ββββ
Tapping pair*
Percentage shift in discharge coefficient
Water Gas
(20 bar) Gas
(60 bar) Water
and gas
102 0.03 0.4 A 1.249 1.225 1.221 1.215
102 0.03 0.4 B 1.612 1.566 1.547 1.573
102 0.03 0.6 A 1.456 1.447 1.517 1.439
102 0.03 0.6 B 2.578 2.551 2.581 2.567
102 0.05 0.6 A 1.575 1.574 1.565 1.585
102 0.05 0.6 B 2.778 2.742 2.719 2.752
102 0.03 0.75 A 2.266 2.143 2.251 2.242
102 0.03 0.75 B 3.508 3.310 3.427 3.426
* Tappings: A: flange at 115° from drain hole; B: corner at 155° from drain hole
32nd International North Sea Flow Measurement Workshop 21-24 October 2014
Technical Paper
6
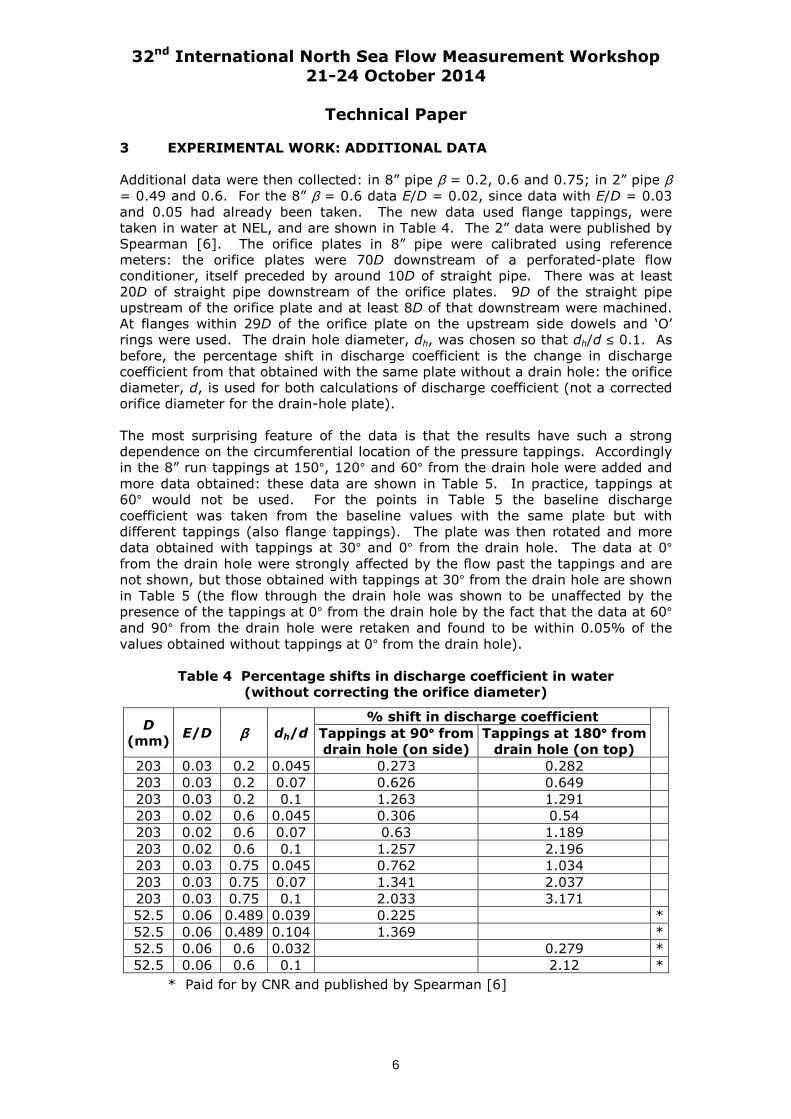
3 EXPERIMENTAL WORK: ADDITIONAL DATA Additional data were then collected: in 8” pipe β = 0.2, 0.6 and 0.75; in 2” pipe β
= 0.49 and 0.6. For the 8” β = 0.6 data E/D = 0.02, since data with E/D = 0.03
and 0.05 had already been taken. The new data used flange tappings, were taken in water at NEL, and are shown in Table 4. The 2” data were published by Spearman [6]. The orifice plates in 8” pipe were calibrated using reference meters: the orifice plates were 70D downstream of a perforated-plate flow conditioner, itself preceded by around 10D of straight pipe. There was at least 20D of straight pipe downstream of the orifice plates. 9D of the straight pipe upstream of the orifice plate and at least 8D of that downstream were machined. At flanges within 29D of the orifice plate on the upstream side dowels and ‘O’ rings were used. The drain hole diameter, dh, was chosen so that dh/d ≤ 0.1. As
before, the percentage shift in discharge coefficient is the change in discharge coefficient from that obtained with the same plate without a drain hole: the orifice diameter, d, is used for both calculations of discharge coefficient (not a corrected orifice diameter for the drain-hole plate). The most surprising feature of the data is that the results have such a strong dependence on the circumferential location of the pressure tappings. Accordingly in the 8” run tappings at 150°, 120° and 60° from the drain hole were added and
more data obtained: these data are shown in Table 5. In practice, tappings at 60° would not be used. For the points in Table 5 the baseline discharge
coefficient was taken from the baseline values with the same plate but with different tappings (also flange tappings). The plate was then rotated and more data obtained with tappings at 30° and 0° from the drain hole. The data at 0° from the drain hole were strongly affected by the flow past the tappings and are not shown, but those obtained with tappings at 30° from the drain hole are shown
in Table 5 (the flow through the drain hole was shown to be unaffected by the presence of the tappings at 0° from the drain hole by the fact that the data at 60° and 90° from the drain hole were retaken and found to be within 0.05% of the
values obtained without tappings at 0° from the drain hole).
Table 4 Percentage shifts in discharge coefficient in water
(without correcting the orifice diameter)
D (mm)
E/D ββββ dh/d
% shift in discharge coefficient
Tappings at 90°°°° from
drain hole (on side)
Tappings at 180°°°° from
drain hole (on top)
203 0.03 0.2 0.045 0.273 0.282
203 0.03 0.2 0.07 0.626 0.649
203 0.03 0.2 0.1 1.263 1.291
203 0.02 0.6 0.045 0.306 0.54
203 0.02 0.6 0.07 0.63 1.189
203 0.02 0.6 0.1 1.257 2.196
203 0.03 0.75 0.045 0.762 1.034
203 0.03 0.75 0.07 1.341 2.037
203 0.03 0.75 0.1 2.033 3.171
52.5 0.06 0.489 0.039 0.225 *
52.5 0.06 0.489 0.104 1.369 *
52.5 0.06 0.6 0.032 0.279 *
52.5 0.06 0.6 0.1 2.12 *
* Paid for by CNR and published by Spearman [6]
32nd International North Sea Flow Measurement Workshop 21-24 October 2014
Technical Paper
7
Table 5 Percentage shifts in discharge coefficient in water (without correcting the orifice diameter)
D (mm)
E/D ββββ dh/d
Percentage shift in discharge coefficient
Tappings at 150°°°°
from drain hole
Tappings at 120°°°°
from drain hole
Tappings at 60°°°°
from drain hole
Tappings at 30°°°°
from drain hole
203 0.03 0.42 0.1 1.446 1.354 1.209 Not taken
203 0.02 0.6 0.1 2.046 1.708 0.911 0.885
203 0.03 0.75 0.1 3.085 2.817 0.807 -0.410
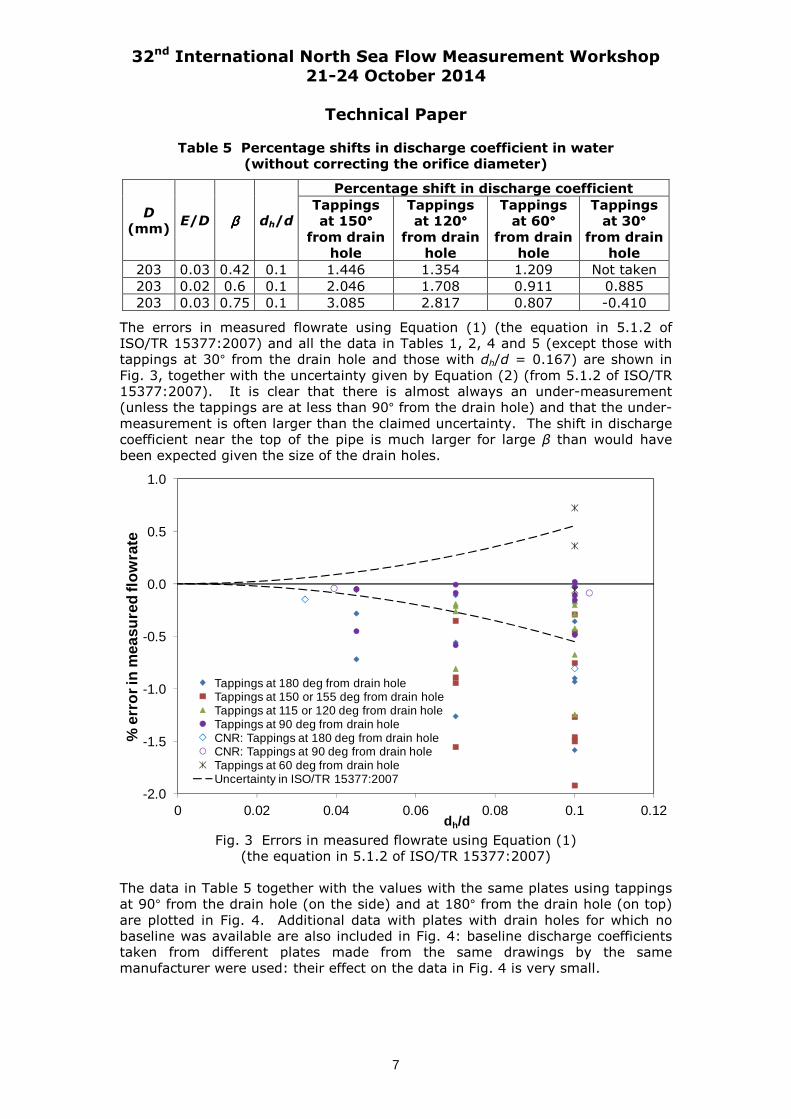
The errors in measured flowrate using Equation (1) (the equation in 5.1.2 of ISO/TR 15377:2007) and all the data in Tables 1, 2, 4 and 5 (except those with tappings at 30° from the drain hole and those with dh/d = 0.167) are shown in
Fig. 3, together with the uncertainty given by Equation (2) (from 5.1.2 of ISO/TR 15377:2007). It is clear that there is almost always an under-measurement (unless the tappings are at less than 90° from the drain hole) and that the under-
measurement is often larger than the claimed uncertainty. The shift in discharge coefficient near the top of the pipe is much larger for large β than would have been expected given the size of the drain holes.
-2.0
-1.5
-1.0
-0.5
0.0
0.5
1.0
0 0.02 0.04 0.06 0.08 0.1 0.12
% e
rro
r in
mea
sure
d fl
ow
rate
dh/d
Tappings at 180 deg from drain holeTappings at 150 or 155 deg from drain holeTappings at 115 or 120 deg from drain holeTappings at 90 deg from drain holeCNR: Tappings at 180 deg from drain holeCNR: Tappings at 90 deg from drain holeTappings at 60 deg from drain holeUncertainty in ISO/TR 15377:2007
Fig. 3 Errors in measured flowrate using Equation (1)
(the equation in 5.1.2 of ISO/TR 15377:2007)
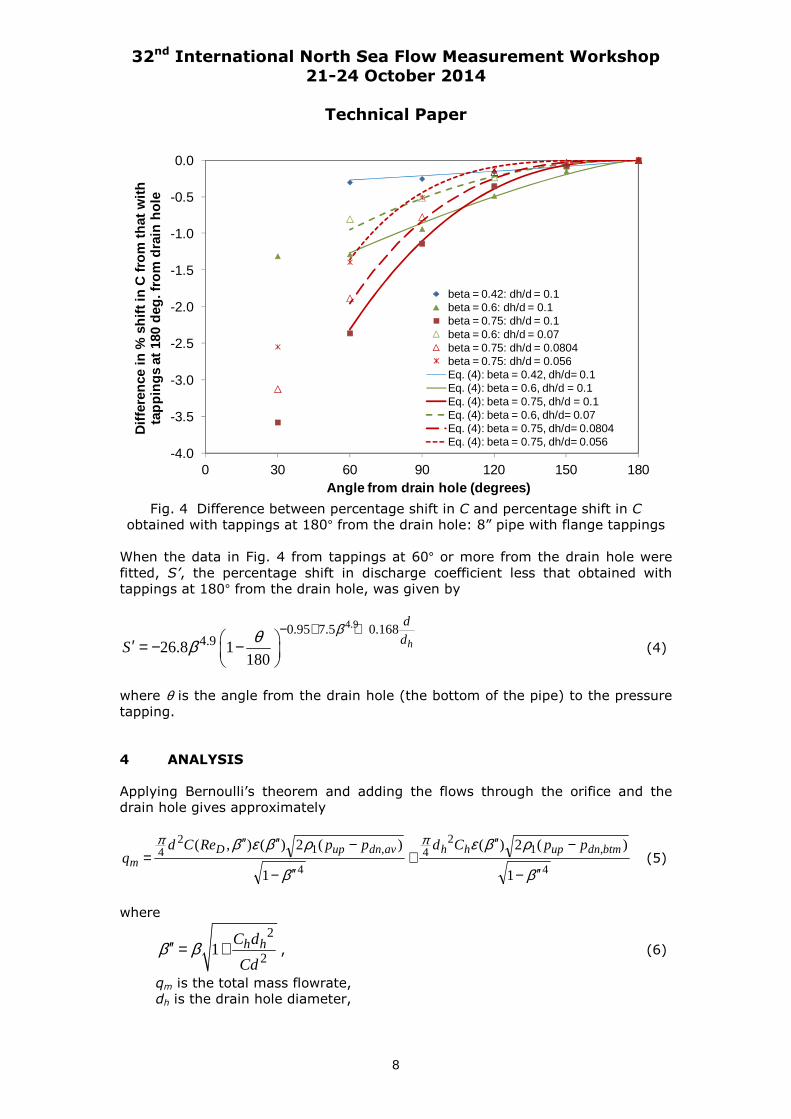
The data in Table 5 together with the values with the same plates using tappings at 90° from the drain hole (on the side) and at 180° from the drain hole (on top)
are plotted in Fig. 4. Additional data with plates with drain holes for which no baseline was available are also included in Fig. 4: baseline discharge coefficients taken from different plates made from the same drawings by the same manufacturer were used: their effect on the data in Fig. 4 is very small.
32nd International North Sea Flow Measurement Workshop 21-24 October 2014
Technical Paper
8
-4.0
-3.5
-3.0
-2.5
-2.0
-1.5
-1.0
-0.5
0.0
0 30 60 90 120 150 180
Dif
fere
nce
in %
sh
ift i
n C
fro
m t
hat
wit
h
tap
pin
gs
at 1
80 d
eg. f
rom
dra
in h
ole
Angle from drain hole (degrees)
beta = 0.42: dh/d = 0.1beta = 0.6: dh/d = 0.1beta = 0.75: dh/d = 0.1beta = 0.6: dh/d = 0.07beta = 0.75: dh/d = 0.0804beta = 0.75: dh/d = 0.056Eq. (4): beta = 0.42, dh/d= 0.1Eq. (4): beta = 0.6, dh/d = 0.1Eq. (4): beta = 0.75, dh/d = 0.1Eq. (4): beta = 0.6, dh/d= 0.07Eq. (4): beta = 0.75, dh/d= 0.0804Eq. (4): beta = 0.75, dh/d= 0.056
Fig. 4 Difference between percentage shift in C and percentage shift in C
obtained with tappings at 180° from the drain hole: 8” pipe with flange tappings
When the data in Fig. 4 from tappings at 60° or more from the drain hole were
fitted, S’, the percentage shift in discharge coefficient less that obtained with tappings at 180° from the drain hole, was given by
4.90.95 7.5 0.1684.926.8 1
180h
d
dSβθβ
− + + ′ = − −
(4)
where θ is the angle from the drain hole (the bottom of the pipe) to the pressure
tapping. 4 ANALYSIS Applying Bernoulli’s theorem and adding the flows through the orifice and the drain hole gives approximately
4
,12
4
4
,12
4
1
)(2)(
1
)(2)(),(
β
ρβε
β
ρβεβ ππ
′′−
−′′+
′′−
−′′′′=
btmdnuphhavdnupDm
ppCdppReCdq (5)
where
2
21 h hC d
Cdβ β′′ = + , (6)
qm is the total mass flowrate, dh is the drain hole diameter,
32nd International North Sea Flow Measurement Workshop 21-24 October 2014
Technical Paper
9
C is the discharge coefficient for the orifice with flange (or corner etc. as provided) tappings, Ch is the discharge coefficient for the drain hole with the differential pressure obtained near the bottom of the pipe (0° from the drain hole),
ε is the expansibility factor,
pup is the pressure at the upstream tapping, pdn,av is the average pressure on the wall on the pipe circumference at the downstream flange (or corner etc. as provided) location, pdn,btm is the pressure on the wall on the pipe circumference downstream of the drain hole near the bottom of the pipe (0° from the drain hole),
ρ1 is the density at the upstream pressure tapping.
The definition of β ′′ takes account of the different velocities in the drain hole and
in the orifice, although this effect is small. It is assumed that C and ε are
unaffected by the presence of the drain hole, except for the effect of change in diameter ratio. It might be that the discharge coefficient for the flow through the orifice is very
different from ( , )DC Re β ′′ owing to asymmetry, for example. However, where
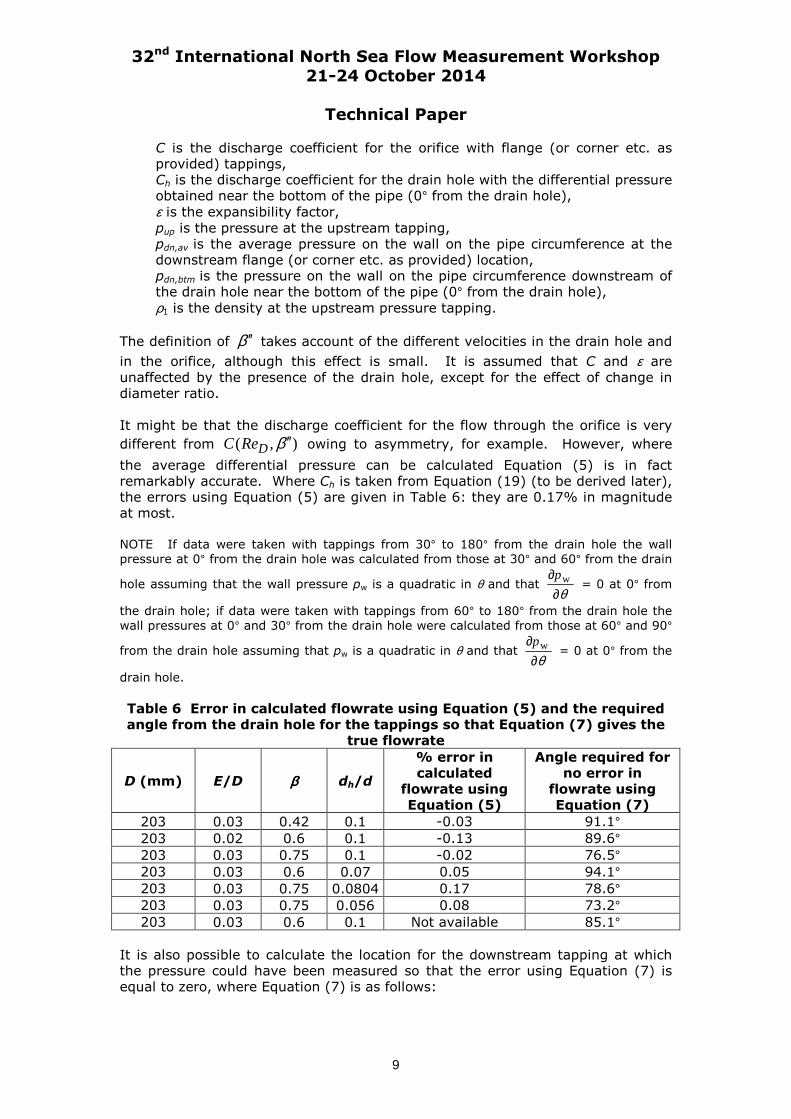
the average differential pressure can be calculated Equation (5) is in fact remarkably accurate. Where Ch is taken from Equation (19) (to be derived later), the errors using Equation (5) are given in Table 6: they are 0.17% in magnitude at most. NOTE If data were taken with tappings from 30° to 180° from the drain hole the wall
pressure at 0° from the drain hole was calculated from those at 30° and 60° from the drain
hole assuming that the wall pressure pw is a quadratic in θ and that θ∂
∂ wp = 0 at 0° from
the drain hole; if data were taken with tappings from 60° to 180° from the drain hole the
wall pressures at 0° and 30° from the drain hole were calculated from those at 60° and 90°
from the drain hole assuming that pw is a quadratic in θ and that θ∂
∂ wp = 0 at 0° from the
drain hole.
Table 6 Error in calculated flowrate using Equation (5) and the required angle from the drain hole for the tappings so that Equation (7) gives the
true flowrate
D (mm) E/D ββββ dh/d
% error in calculated
flowrate using Equation (5)
Angle required for no error in
flowrate using Equation (7)
203 0.03 0.42 0.1 -0.03 91.1° 203 0.02 0.6 0.1 -0.13 89.6° 203 0.03 0.75 0.1 -0.02 76.5° 203 0.03 0.6 0.07 0.05 94.1° 203 0.03 0.75 0.0804 0.17 78.6° 203 0.03 0.75 0.056 0.08 73.2° 203 0.03 0.6 0.1 Not available 85.1°
It is also possible to calculate the location for the downstream tapping at which the pressure could have been measured so that the error using Equation (7) is equal to zero, where Equation (7) is as follows:
32nd International North Sea Flow Measurement Workshop 21-24 October 2014
Technical Paper
10
4
,*12
4
4
,*12
4
1
)(2)(
1
)(2)(),(
β
ρβε
β
ρβεβ ππ
′′−
−′′+
′′−
−′′′′= dnuphhdnupD
m
ppCdppReCdq (7)
where pdn,* is the pressure at the downstream flange (or corner etc. as provided) location so that Equation (7) gives the true flowrate without angular correction.
These locations are given in Table 6. It is worth noting that where the angle has most effect (i.e. large β) on the shift in C there appears to be no effect of dh/d on the angular location at which there is no error in flowrate using Equation (7). Following the practice in ISO/TR 15377 the calculated flow is given by using a diameter d’ such that
4
,12
4
1
)(2)(),(
β
ρβεβπ
′−
−′′′=
measdnupDm
ppReCdq (8)
where
d
Dβ
′′ = , (9)
pdn,meas is the measured pressure at the downstream flange (or corner etc. as provided) location.
It is necessary to provide a formula for d ′ . Equating Equations (5) and (8) gives
−−
+−−
′′−
′−′′′′′′
=′
measdnup
btmdnuphh
measdnup
avdnup
D
D
pp
pp
Cd
Cd
pp
pp
ReC
ReC
d
d
,
,2
2
,
,4
4
2
2
1
1
)(),(
)(),(
ββ
βεββεβ
(10)
Since the second term is much smaller than the first the effect of change in
diameter ratio on hC
C is negligible. Moreover, in the second (much smaller) term
pdn,btm can be approximated by pdn,av. Then Equation (10) becomes
measdnup
avdnuphh
D
D
pp
pp
Cd
Cd
ReC
ReC
d
d
,
,2
2
4
4
2
21
1
1
)(),(
)(),(
−−
+
′′−
′−′′′′′′
=′
ββ
βεββεβ
(11)
From Equation (4) it might be reasonable to suppose that
n
avdnuph
topdnmeasdn ppd
dLapp
−−
′−=180
1)(,, ,2,,θβ (12)
where
pdn,top is the pressure on the wall on the pipe circumference at the downstream flange (or corner etc. as provided) location at the top of the pipe (180° from the drain hole).
32nd International North Sea Flow Measurement Workshop 21-24 October 2014
Technical Paper
11
n might be a function of 2,Lβ ′ and hd
d. The available data only require
, hdn
dβ
.
Equation (12) cannot be used for all θ ,because as θ tends to 0 p
θ∂∂
does not tend
to 0; moreover, if a and n are estimated from Equation (4), as hd
dtends to 0 p
becomes discontinuous and pdn,btm does not equal pdn,top. However, it is only necessary to assume that Equation (12) holds for θ ≥ 60° and
that θ*, the value of θ at which the tappings should be placed to give the flowrate
in accordance with Equation (7) (i.e. without correction for the angle from the drain hole), is the value of θ at which the average differential pressure round the
circumference is measured. Then
n
avdnuph
topdnavdn ppd
dLapp
−−
′−=180
*1)(,, ,2,,
θβ (13)
Eliminating pdn,top between Equations (12) and (13) gives
−−
−+−=−nn
avdnupmeasdnup aapppp180
*1
18011)( ,,
θθ (14)
Equation (11) becomes
nn
hh
D
D
aa
Cd
Cd
ReC
ReC
d
d
−−
−+
+
′′−
′−′′′′′′
=′
180*
1180
11
1
1
1
)(),(
)(),( 2
2
4
4
2
2
θθββ
βεββεβ
(15)
It remains to determine a, n and θ*. From Equation (4) it is to be expected that a
should be proportional to mβ . It is worth testing the possibility that a is
proportional to
khd
d
. As 2 2
h h
l L d
d dβ ′ ′ =
increases a should decrease, where 2l ′
is the distance from the downstream face of the orifice plate to the downstream
tapping and 22
lL
D
′′ = . Accordingly a might be expressed as
2expk
m h
h
d L da a a
d dβ
β ′ ′ ′′ = −
. (16)
Similarly from Equation (4) it is reasonable to expect that
m
h
dn n n n
dβ ′′ ′′ ′′′= + + . (17)
32nd International North Sea Flow Measurement Workshop 21-24 October 2014
Technical Paper
12
From Table 6 it is reasonable to assume that
fff ′′′−= βθ* . (18)
hC
Cis a function of
h h
E dE
d d Dβ
=
.
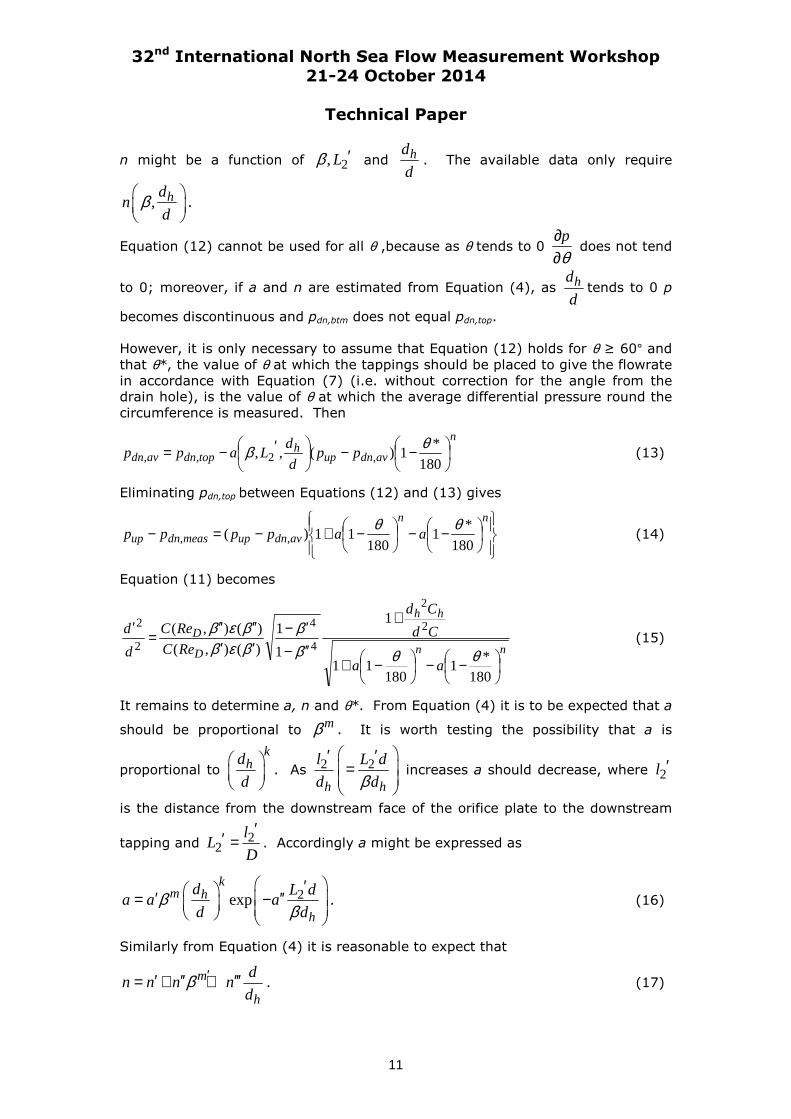
For an orifice whose axis is the pipe axis the effect of changing the ratio of the orifice (bore) thickness e to the orifice diameter d is to change the orifice from a thin orifice, in which it is as if e were as close as possible to 0 given that a square edge is required on the orifice, to a thick orifice, whose discharge coefficient is approximately 0.8 when e/d is a little greater than 1, because the flow has now reattached to the orifice bore. The discharge coefficient changes slowly where e/d is small but more rapidly around e/d = 0.7. This is well exhibited in a set of data from NBS (now NIST) (see Lansverk [7]) given in Fig. 5.
0
5
10
15
20
25
30
0.0 0.2 0.4 0.6 0.8 1.0 1.2
% c
han
ge
in d
isch
arg
e co
effi
cien
t
e/d Fig. 5 Shift in discharge coefficient from the value where e/d is close to 0:
4” β = 0.25 (no drain hole) from NBS (see Lansverk [7])
It is reasonable to suppose that for appropriate values of , ,C C r′ ′′ ′and r′′
if
( ) ( )if
if
h
h h hh
h
C E d r
C C r E d C E d rr E d r
C r rC r E d
′ ′≤ ′ ′′ ′′ ′− + − ′ ′′= < < ′′ ′−
′′ ′′ ≤
(19)
Since the discharge-coefficient data had been calculated as
+−
−=
1001
1
)(2)(),(
4
,12
4true,
SppReCdq
measdnupDm
β
ρβεβπ (20)
where S is the percentage increase in discharge coefficient, from Equations (8) and (20) the percentage error in the measured flow is
32nd International North Sea Flow Measurement Workshop 21-24 October 2014
Technical Paper
13
2 4
2 4( , ) ( ) 1
100 1( , ) ( )(1 0.01 ) 1
D
D
d C Re
d C Re S
β ε β ββ ε β β
′ ′ ′ − − ′+ −
(21)
To determine the coefficients in Equations (16) and (17) a value of a′′ was
assumed, what the data points in Fig. 4 for θ ≥ 60° would have been at 2L ′ = 0
was calculated, and then , , , , ,a m k n m n′ ′ ′ ′′ and n′′′ were calculated (given that Fig.
4 is for changes in discharge coefficient, Equation (12) for changes in pressure). As might have been expected from Equation (4) no significant improvement was
obtained with non-zero k or with m and m′ unequal.
Then the data on percentage errors in measured flowrate were examined: there are many solutions with almost equal r.m.s. error. One solution is given below, in
which the value of a′′ has been used to refit the data in Fig. 4.
The coefficients are as follows:
4.6 20.66 exp 0.15h
L da
dβ
β ′ = −
(22)
4.60.45 7.3 0.117h
dn
dβ= − + + (23)
6.46292* βθ −= (24)
≤≤≤+
≤=
h
hh
hh
dE
dEdE
dE
C
C
/9.0if33.1
9.0/5.0if/625.07675.0
5.0/if08.1
(25)
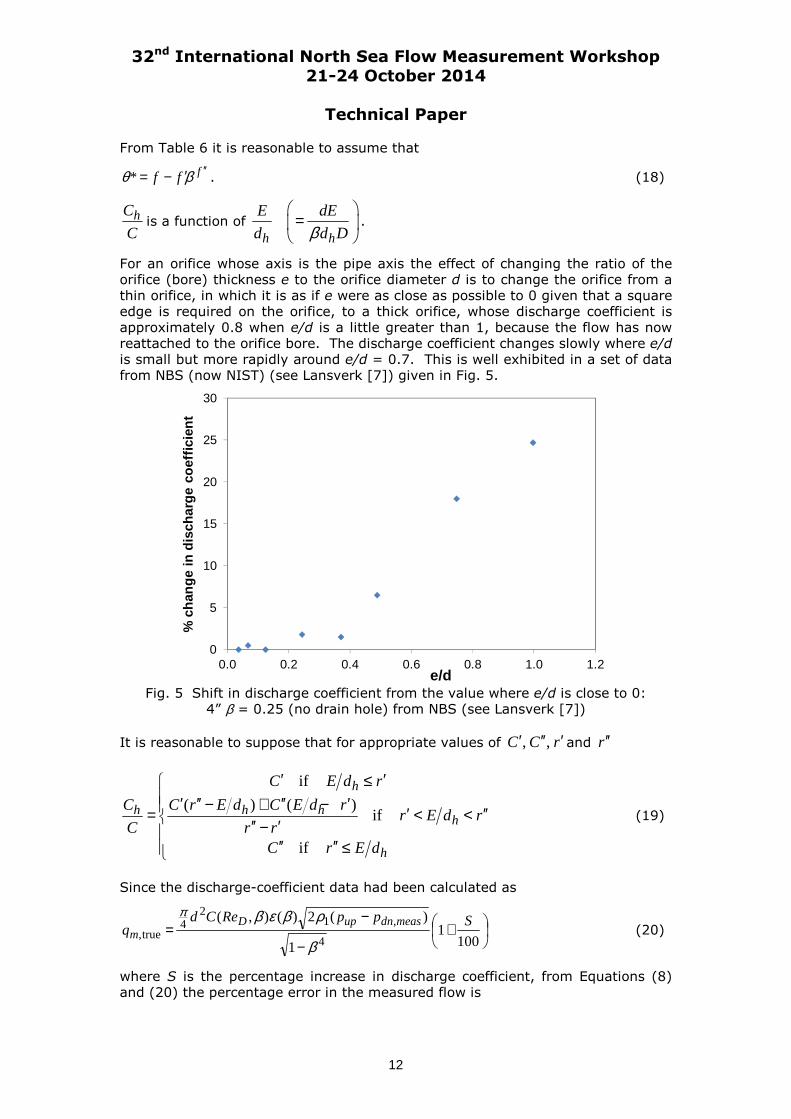
Equation (24) gives quite good agreement with the data in Table 6: see Fig. 6. Equation (24) is fitted to a wider range of data than those plotted in the figure. Equation (25) does not follow Fig. 5 exactly, but that is not surprising, since a drain hole is different from an orifice plate in that the fluid in a drain hole remains attached to the pipe wall.
Fig. 6 Angle from drain hole at which a tapping should be placed to give a calculated flowrate
without angular correction
50
55
60
65
70
75
80
85
90
95
100
0 0.1 0.2 0.3 0.4 0.5 0.6 0.7 0.8
θθ θθ* (d
eg.)
ββββ
Data in Table 6
Equation (24)
32nd International North Sea Flow Measurement Workshop 21-24 October 2014
Technical Paper
14
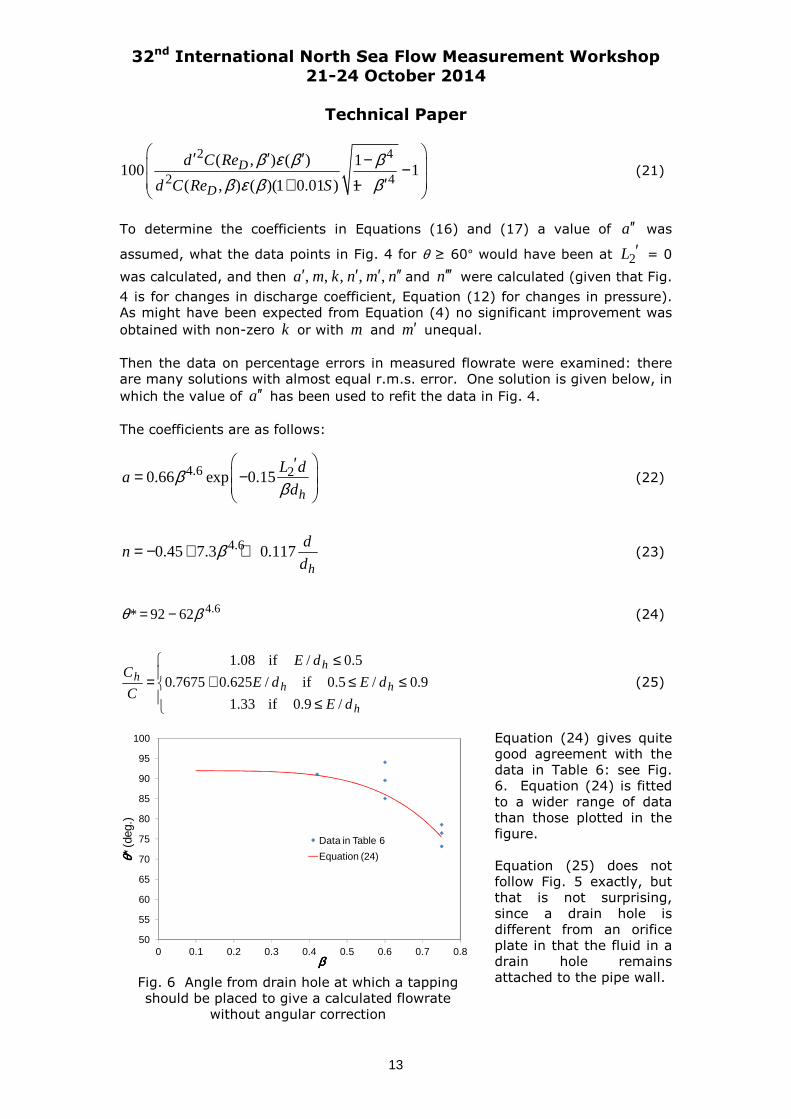
Fig. 7 shows the points included in Fig. 4 compared with Equation (12) using the coefficients from Equations (22) and (23).
-4.0
-3.5
-3.0
-2.5
-2.0
-1.5
-1.0
-0.5
0.0
0 30 60 90 120 150 180
Dif
fere
nce
in %
sh
ift i
n C
fro
m t
hat
wit
h
tap
pin
gs
at 1
80 d
eg. f
rom
dra
in h
ole
Angle from drain hole (degrees)
beta = 0.42: dh/d = 0.1beta = 0.6: dh/d = 0.1beta = 0.75: dh/d = 0.1beta = 0.6: dh/d = 0.07beta = 0.75: dh/d = 0.0804beta = 0.75: dh/d = 0.056From Eqs (12), (22) and (23): beta = 0.42, dh/d=0.1From Eqs (12), (22) and (23): beta = 0.6, dh/d=0.1From Eqs (12), (22) and (23): beta = 0.75, dh/d=0.1From Eqs (12), (22) and (23): beta = 0.6, dh/d=0.07From Eqs (12), (22) and (23): beta = 0.75, dh/d=0.0804From Eqs (12), (22) and (23): beta = 0.75, dh/d=0.056
Fig. 7 Difference between percentage shift in C and percentage shift in C
obtained with tappings at 180° from the drain hole: 8” pipe with flange tappings
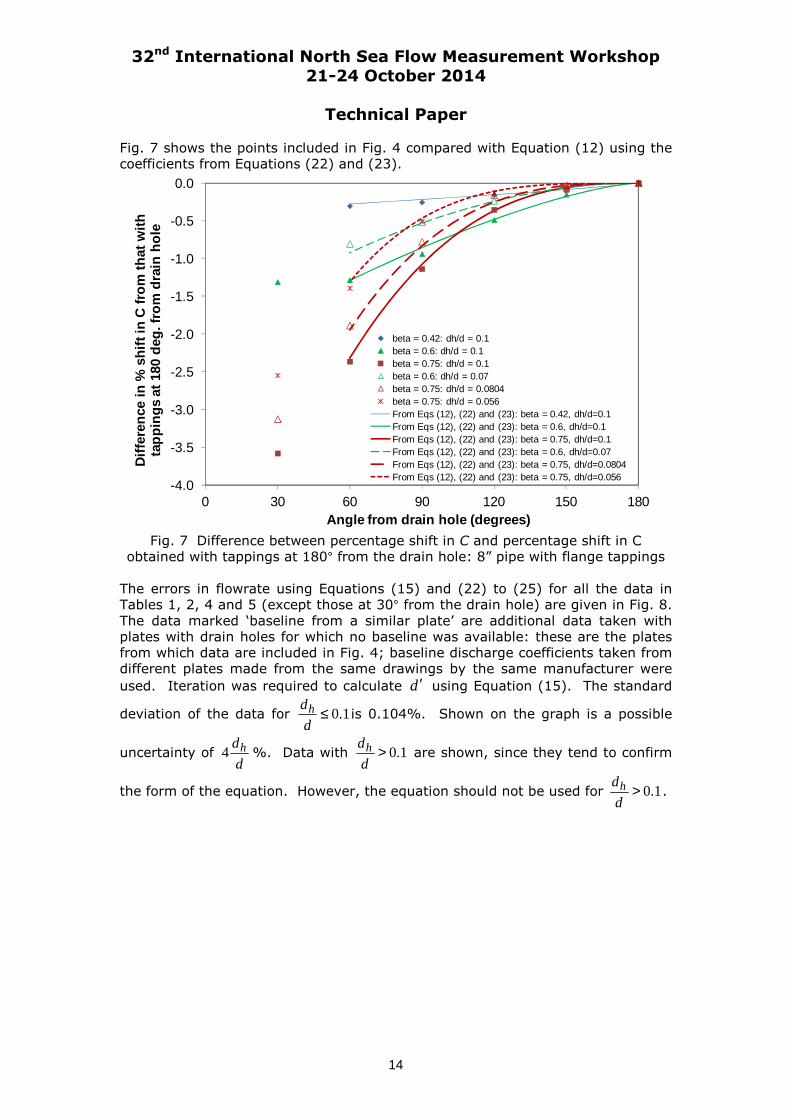
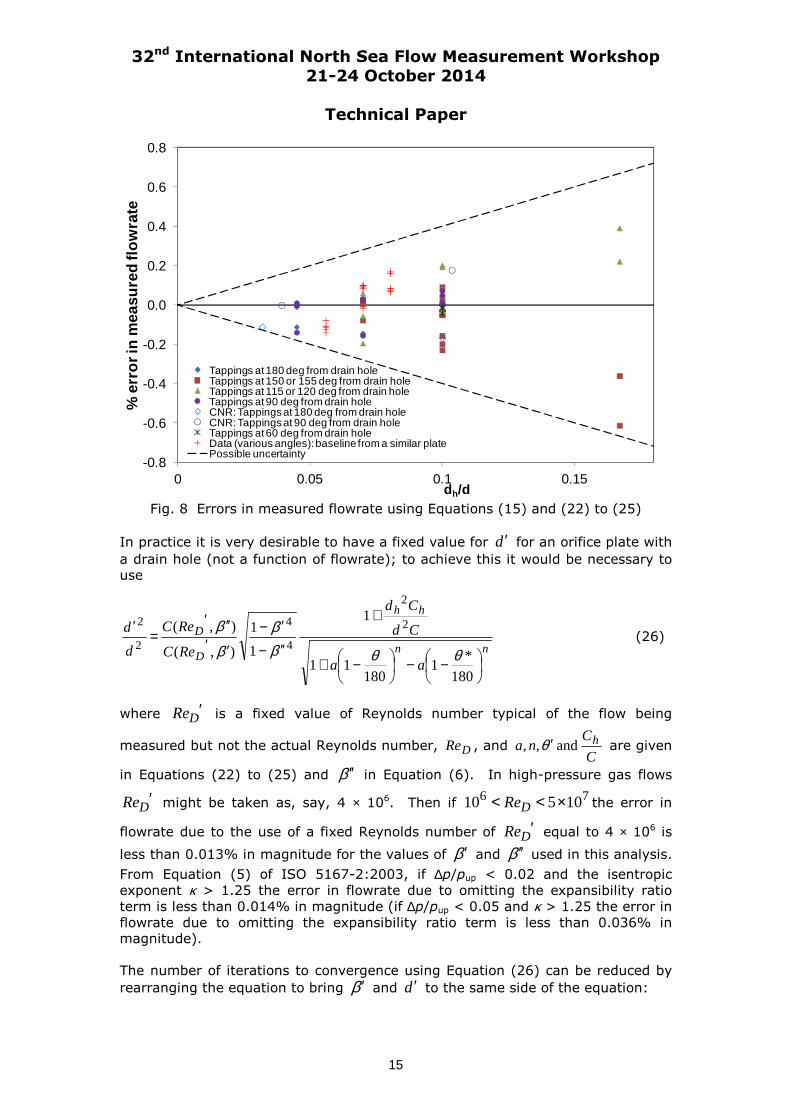
The errors in flowrate using Equations (15) and (22) to (25) for all the data in Tables 1, 2, 4 and 5 (except those at 30° from the drain hole) are given in Fig. 8.
The data marked ‘baseline from a similar plate’ are additional data taken with plates with drain holes for which no baseline was available: these are the plates from which data are included in Fig. 4; baseline discharge coefficients taken from different plates made from the same drawings by the same manufacturer were
used. Iteration was required to calculate d ′ using Equation (15). The standard
deviation of the data for 1.0≤d
dh is 0.104%. Shown on the graph is a possible
uncertainty of d
dh4 %. Data with 1.0>d
dh are shown, since they tend to confirm
the form of the equation. However, the equation should not be used for 1.0>d
dh .
32nd International North Sea Flow Measurement Workshop 21-24 October 2014
Technical Paper
15
-0.8
-0.6
-0.4
-0.2
0.0
0.2
0.4
0.6
0.8
0 0.05 0.1 0.15
% e
rro
r in
mea
sure
d fl
ow
rate
dh/d
Tappings at 180 deg from drain holeTappings at 150 or 155 deg from drain holeTappings at 115 or 120 deg from drain holeTappings at 90 deg from drain holeCNR: Tappings at 180 deg from drain holeCNR: Tappings at 90 deg from drain holeTappings at 60 deg from drain holeData (various angles): baseline from a similar platePossible uncertainty
Fig. 8 Errors in measured flowrate using Equations (15) and (22) to (25)
In practice it is very desirable to have a fixed value for d ′ for an orifice plate with
a drain hole (not a function of flowrate); to achieve this it would be necessary to use
nn
hh
D
D
aa
Cd
Cd
ReC
ReC
d
d
−−
−+
+
′′−
′−′′′′′
=′
180
*1
18011
1
1
1
),(
),( 2
2
4
4
2
2
θθββ
β
β (26)
where DRe ′ is a fixed value of Reynolds number typical of the flow being
measured but not the actual Reynolds number, DRe , and C
Cna hand,, θ ′ are given
in Equations (22) to (25) and β ′′ in Equation (6). In high-pressure gas flows
DRe ′ might be taken as, say, 4 × 10⁶. Then if 6 710 5 10DRe< < × the error in
flowrate due to the use of a fixed Reynolds number of DRe ′ equal to 4 × 10⁶ is
less than 0.013% in magnitude for the values of β ′ and β ′′ used in this analysis.
From Equation (5) of ISO 5167-2:2003, if ∆p/pup < 0.02 and the isentropic
exponent κ > 1.25 the error in flowrate due to omitting the expansibility ratio
term is less than 0.014% in magnitude (if ∆p/pup < 0.05 and κ > 1.25 the error in
flowrate due to omitting the expansibility ratio term is less than 0.036% in magnitude). The number of iterations to convergence using Equation (26) can be reduced by
rearranging the equation to bring β ′ and d ′ to the same side of the equation:
32nd International North Sea Flow Measurement Workshop 21-24 October 2014
Technical Paper
16
( )
25.0
42
2
2
24
1
180*
1180
11
),(
),(1
1
+
+
−−
−+
′′′′′
′′−
=′
β
θθ
βββ
Cd
Cd
aa
ReC
ReC
d
d
hh
nn
D
D
(27)
Moreover, if β ≤ 0.63 or β ≤ 0.7 and θ = 90° the ratio of discharge coefficients
),(
),(
β
β′′′′′
D
D
ReC
ReCcan be taken as equal to 1 with an error in flowrate of 0.016% or less
in magnitude: in this case there is no need to iterate: Equation (27) becomes
( )
o90and7.0
or63.0for
1
180*
1180
11
1
125.0
42
2
2
4
=≤≤
+
+
−−
−+
′′−
=′
θββ
β
θθ
β
Cd
Cd
aa
d
d
hh
nn
(28)
Equation (28) gives good results for the whole database, but there is insufficient evidence to use it for all situations. 5 CONCLUSIONS Recent data show that the existing drain-hole equation in ISO/TR 15377:2007 is unsatisfactory. The data on drain holes have a surprisingly strong dependence on the circumferential location of the pressure tappings, although very little dependence on Reynolds number. A new analysis is presented based on the assumption that, although the differential pressure itself is disturbed by the presence of the drain hole, the discharge coefficient for the orifice is unaffected by its presence provided that the mean differential pressure is used. On this basis
Equation (27) has been produced for d ′ , the corrected orifice diameter taking
account of the drain hole. More data would be good, but it is very desirable to amend ISO/TR 15377:2007, given that its equation leads to flowrate errors up to nearly 2% in magnitude, whereas the new equation gives errors less than 0.25% in magnitude. ACKNOWLEDGMENTS The work described in this paper was carried out as part of the National Measurement Office’s Engineering and Flow Programme, under the sponsorship of the Department for Business, Innovation and Skills. This paper is published by permission of the Managing Director, NEL.
32nd International North Sea Flow Measurement Workshop 21-24 October 2014
Technical Paper
17
NOTATION C Discharge coefficient
Ch Discharge coefficient for a drain hole
d Diameter of orifice
dc Corrected orifice diameter to allow for the additional flowrate due to a drain
hole following ISO/TR 15377:2007
dh Diameter of drain hole
d’ Corrected orifice diameter to allow for the additional flowrate due to a drain
hole
D Upstream internal pipe diameter
e Orifice bore thickness
E Orifice plate thickness
'2l Spacing from the downstream face of the orifice plate to the downstream
pressure tapping
'2L Spacing from the downstream face of the orifice plate to the downstream
pressure tapping divided by the pipe diameter (= Dl /'2 )
p Absolute static pressure of the fluid
pdn,av Average absolute static pressure on the wall on the pipe circumference at the
downstream flange (or corner etc. as provided) location
pdn,btm Absolute static pressure on the wall on the pipe circumference downstream
of the drain hole near the bottom of the pipe (0° from the drain hole)
pdn,meas Absolute static pressure measured at the downstream flange (or corner etc.
as provided) location
pdn,top Absolute static pressure on the wall on the pipe circumference at the
downstream flange (or corner etc. as provided) location at the top of the
pipe (180° from the drain hole)
pdn,* Absolute static pressure at the downstream flange (or corner etc. as
provided) location so that Equation (7) gives the true flowrate without
angular correction
pup Absolute static pressure at the upstream tapping
qm Mass flowrate
ReD Reynolds number referred to D
S Percentage shift in discharge coefficient
β Diameter ratio: β = d/D
∆p Differential pressure
ε Expansibility [expansion] factor
θ Angle between tappings and drain hole
θ* Value of θ at which the tappings should be placed to give a calculated
flowrate without correction for the angle from the drain hole
κ Isentropic exponent
ρ1 Density of the fluid at upstream pressure tapping
32nd International North Sea Flow Measurement Workshop 21-24 October 2014
Technical Paper
18
REFERENCES [1] INTERNATIONAL ORGANIZATION FOR STANDARDIZATION. Measurement of
wet gas flow by means of pressure differential devices inserted in circular cross-section conduits. Geneva: ISO/TR 11583:2012
[2] INTERNATIONAL ORGANIZATION FOR STANDARDIZATION. Measurement of fluid flow by means of pressure differential devices - Guidelines for the specification of orifice plates, nozzles and Venturi tubes beyond the scope of ISO 5167. Geneva: ISO/TR 15377:2007
[3] READER-HARRIS, M. J., HODGES, D., and RUSHWORTH, R. The effect of drain holes in orifice plates on the discharge coefficient. In Proc. 26th International North Sea Flow Measurement Workshop, St Andrews, Fife, 2008
[4] READER-HARRIS, M. J., HODGES, D., BARTON, N., and GRAHAM, E. Improvements in the measurement of gas flows with entrained liquids using orifice plates. Report No 2008/265 on Project No. FFRE45. East Kilbride, Glasgow: TUV NEL, 2008
[5] INTERNATIONAL ORGANIZATION FOR STANDARDIZATION. Measurement of fluid flow by means of pressure differential devices inserted in circular cross-section conduits running full - Part 2: Orifice plates. Geneva: ISO 5167-2:2003.
[6] SPEARMAN, E. P. Operational measurement experiences in North Sea applications. In Proc. 30th International North Sea Flow Measurement Workshop, St Andrews, Fife, 2012
[7] LANSVERK, N. B. Effects of abnormal conditions on accuracy of orifice measurement. ISHM (sent by Loy Upp), 1990