Embed Size (px)
Citation preview
Perception & Psychophysics1985, 37 (2), 125-134
Orientational anisotropy in thehuman visual system
BILL JENKINSUniversity of Western Australia, Nedlands, Australia
A global pattern/randomness threshold was used to investigate orientational anisotropy in thehuman visual system. Dynamic transpositionally symmetric textures were used, since they allowed the investigation of three theoretically derived variables, size, orientational uniformity,and numerosity, independently and in interaction. The detectability of correlation, as indexedby these thresholds, was found to be dependent on the size of the uniform point-pair elements,~d, and their orientation; larger tolerable ~d values were found in the vertical meridian. Increasingthe stimulus field size increased the absolute value of this threshold, but not the relative valueas a function of orientation. The thresholds were also found to be dependent on the orientationaluniformity of the point-pairs. Tolerable perturbation did not vary as a function of the uniformorientation until a critical point-pair size was exceeded. This critical point-pair size did vary asa function of orientation, falling quite distinctly from vertical, to horizontal, to oblique. The numberof point-pair elements comprising the textures did not affect the global pattern/randomness threshold. The implications of these data for the neural mechanisms underlying the "oblique effect"were examined, and it was concluded that an orientational anisotropy might exist in the lengthof receptive fields serving functional units selectively sensitive to orientation. It was also concluded,however, that this factor alone could not account for the various examples of the orientationalanisotropy in vision, and that any anisotropy measured in human vision might be the net productof more than one anisotropy existing within and between the various levels of processing in thehuman visual system.
Orientation selectivity is a major feature of the functional architecture of the macaque monkey visual cortex(Hubel & Wiesel, 1977). Evidence for a similar specificity in the human visual system has emerged from severaldifferent sources: from visual masking (e.g., Blakemore,Nachmias, & Sutton, 1970; Campbell & Kulikowski,1966; Houlihan & Sekuler, 1968; Parlee, 1969; Sekuler,1965), adaptation studies (e.g., Blakemore & Nachrnias,1971; Gibson, 1933; Gilinsky & Mayo, 1971; Movshon& Blakemore, 1973), and induction and aftereffects (e.g.,Blakemore, Carpenter, & Georgeson, 1970; Campbell &Maffei, 1970).
The reductive logic underlying these investigations isthe indirect argument that if stimulus A and stimulus Binteract psychophysically, but stimulus A and stimulus Cdo not, then a structure or process exists that is commonto A and B but not to C (see Braddick, Campbell, & Atkinson, 1978). A different behavioral argument has beenused by Sutherland (1957) to separate structures on thebasis of the capacity to discriminate: if an organism iscapable of discriminating between two stimuli on a single stimulus dimension, then, given no artifactual con-
This research was supported by a grant from the Australian ResearchGrants Scheme to the author (ARGS Grant A283l5l29). H. Jenkinsis thanked for her research assistance. The referees' comments werealso of great value.
The author's mailing address is: Department of Psychology, University of Western Australia, Nedlands, W.A. 6009, Australia.
founding, it must possess mechanisms that are selectivelysensitive along that dimension. One further argument canbe made to support the existence of independent neuralstructures in the human visual system: if we are differentially sensitive to particular values on anyone stimulusdimension, then it is probable that separate processes orstructures exist that reflect this differential sensitivity.
In the case of orientational selectivity, the anisotropyis well documented and ubiquitous (Appelle, 1972). Inhumans, there appears to be a difference in sensitivity between the horizontal, vertical, and oblique orientationsat the retina, with the visual system being less sensitiveto the latter. It is found in diverse areas: in symmetry detection (e.g., Jenkins, 1983a; Julesz, 1971), in patternreversal (e.g., Kitterle, Russell, & Nixon, 1974), in theextent of illusions (e.g., Anton, 1976), in acuity (e.g.,Emsley, 1925; Leibowitz, 1955), in adjusting lines tospecific angles (e.g., Jastrow, 1892), in detecting embedded figures (e.g., Appelle, 1976), in afterimage visibility (e.g., Atkinson, 1972), and in judgments of parallelness (e.g., Rochlin, 1955). Orientational anistropy hasalso been reported in studies of visual masking, adaptation, and aftereffects (e.g., Campbell & Kulikowski,1966; Campbell, Kulikowski, & Levinson, 1966; Furchner & Young, 1975; Green & Hoyle, 1964; Jastrow,1892; Kohler & Wallach, 1944).
Explanations to account for this orientational anisotropyare many and varied. Emsley (1925) proposed that thedifferential sensitivity was due to astigmatism, but revised
125 Copyright 1985 Psychonomic Society, Inc.
126 JENKINS
his opinion when he corrected for this factor and foundthat the anisotropy remained. His ambivalence towardsthis finding is mirrored in his term "residual astigmatism. " Any attempt to account for the anisotropy byreferring to the optics of the eye has to be discarded onthe basis of investigations that bypass the dioptrics (e. g.,Freeman & Thibos, 1973; Maffei & Campbell, 1970).In addition, the suggestion that the orientational anisotropyis the result of interaction with the environment (e.g.,Annis & Frost, 1973; Gregory, 1972) is unsatisfactory,since it does nothing to spell out the nature of the interaction or its locus.
More productively, Atkinson (1972) has put forwardthree possible explanations for the anisotropy in terms ofattributes of functional units at the cortical level. Her suggestions are: (1) that vertical and horizontal units havelonger receptive fields than oblique units (a "size"hypothesis); (2) that vertical and horizontal units are morefinely tuned, with a higher selectivity for orientation thanoblique units (a "selectivity" hypothesis); (3) that unitsserving the oblique orientation are less numerous thanthose serving other more perceptible orientations (a"numerosity" hypothesis).
It should be noted that these hypotheses are not mutually exclusive, neither are they directly testable using psychophysical techniques. Yet each identifies a single stimulus dimension that can be examined psychophysically.
The aim of this investigation was to determine whetherthe orientational anisotropy existed with respect to anyof the three derivative dimensions of size, orientationaluniformity, and numerosity, using a stimulus that couldbe manipulated along these dimensions.
Dynamic transpositionally symmetric textures allow thenecessary manipulations, since they comprise the sequential plotting of identical point-pairs randomly in space anduniformly over time. They have been used in other investigations to map spatial and temporal limits to the detection of correlation (Jenkins, 1983b), the detection ofbilateral symmetry (Jenkins, 1982, 1983a), and the spatial and temporal tolerance for the detection ofpattern andmotion (Jenkins, 1983c; Morgan & Ward, 1980). The useof dynamic textures allows the investigation of both spatial and temporal attributes of the visual system; but moreimportantly to the specific aim of this investigation, thesetextures allow the simultaneous manipulation of the number of stimulus elements presented within a given areaat the retina, their orientational uniformity, and their size.
The value of using dynamic point-pair textures to investigate these variables is also enhanced by theoreticalspeculation (Glass, 1969; Glass & Perez, 1973; Glass &Switkes, 1976; Jenkins, 1983b) that the neural structuresinvolved in the detection of structure in transpositionallysymmetric textures comprise functional units at the cortical level that can be activated by point-pair elements.So, although direct evaluation of Atkinson's hypothesesis not possible psychophysically, the experimental resultsmay provide the basis for further speculation.
GENERAL METHOD
The following description is an account of the methods that werecommon to all the experiments reported.
Experimental SituationAll experiments utilized dynamic dot textures plotted on a dis
play oscilloscope under computer control. Subjects sat viewing theoscilloscope binocularly, at a distance of 57.3 em. The diameterof the circular dot field subtended5" of visual angle (5-em diameter),and the viewing distance was maintained by the use of a chin-andforehead restraint for the subjects.
There was sufficient illumination for the subject to see the faceof the oscilloscope, so that convergence and accommodation couldbe maintained at the appropriate distance. The luminance of theoscilloscope face, without stimulus, was 1.0 cd/m'.
Dlumination of the oscilloscope face was provided from the frontby a Carousel projector with a filtered lens that approximated thecolor of the dots comprising the dot fields. The dynamic stimulusfield luminance was maintained at 1.2 log units above thresholdthroughout all experiments. For all experiments, the laboratory wasdimly illuminated, so that the subjects did not undergo any radicalchange in visual sensitivity while waiting to participate in the experiments.
ApparatusThe experiments were run under the control of a PDP-8/Bcom
puter, manufactured by the Digital Equipment Corporation. Interfaced to this computer was a fast display oscilloscope for presentation of the stimuli, a Hewlett-Packard 1332A oscilloscope equippedwith an ultrashort P24 phosphor. The intensity of a point plottedon this type of phosphor has a single peak with a maximum spectral energy emission at 510 nm, and fades to 10% of its originalbrightness in 1.5 usee. The effective physical duration of each pointis therefore taken to be approximately 1.5 usee,
Generation of StimuliThe dynamic dot fields were plotted on an oscilloscope face within
a square 9 x 9 em region. This region was a 256 x 256 matrix,so that the location of any point was given by one of 256 possiblex values and one of 256 possible y values.
A single random point could be plotted by obtaining a randomnumber between 0 and 255 for x and, similarly, a random numberfor y. The numbers were obtained using the computer's randomnumber generator. These two coordinates, together with an intensityvalue, were then inserted into the appropriate locations in a computerplotting subroutine. The intensity value was held constant duringall experiments. Once these valueshadbeen inserted, the next sectionin the program plotted the point at the specified coordinates on theoscilloscope screen.
The psychophysical method used was a two-alternative forcedchoice; the alternatives were a random-dot texture and a point-pairtexture constructed as described below:
Dynamic random dot textures. These were constructed by thesequential plotting of random points, where each point was independent of any other point. The points were plotted at the rate of oneevery 60.8 p.sec. Since the total duration of the stimulus field wasI sec, the computer plotted 16,446 points. However, the numberof points actually seen by the observer was subject to temporal andspatial constraints.
The temporal constraint was provided by the observer himself,with his limited integration period, which is approximately 130 msecfor dynamic visual noise of the intensity used. At anyone instant,he could see only the number of points that were plotted withinthis period (approximately 2,138 points). He could, of course, seethis many points for the full stimulus duration of I sec.
The spatial constraint was imposed externally, and was given bythe fact that the area of 9 x 9 em was masked, with the exception
of a circular region concentric with the square and with a radiusof 2.5 cm. The area of such a circle is 19.64 em", So the proportion of dots seen within this circular area was 19.64/81 = 0.242;and therefore the average number of dots seen was 2,138 x 0.242= 517 points, which corresponds to a density of 517/19.64 = 26points/em" (or 26 points per square degree of visual angle, giventhe viewing distance of 57.3 em).
Dynamic random point-pair textures. These fields were constructed by the sequential plotting of identical point-pairs. Eachpoint-pair was determined in the same manner: after the x and yvalues of the origin point were determined randomly, the y valuewas incremented by a constant for vertical point-pairs. The newy value, together with the original x value, specified the coordinatesof the partner point. Both points were then plotted on the oscilloscope screen (within a period of 5 J.lsec). The increment in all theexperiments is specified as within point -pair separation, ~d, andis measured in degrees of visual angle.
The point-pairs were plotted at a rate of one pair every 121.6 J.lSec.To obtain a stimulus duration of I sec, this meant that 8,223 pointpairs were plotted by the computer. As in the case of the randomdot fields, however, the temporal integration period of approximately130 msec and the 5-cm-diam mask resulted in approximately 258point-pairs' being perceptually available, providing an average density of approximately 26 points per square degree of visual angle,the same as for the random-dot field.
Given the circularity of the stimulus texture, the various pointpair orientations, vertical, horizontal, and oblique, were obtainedsimply by rotating the oscilloscope to the appropriate orientation.Because pilot measurements revealed no difference between obliquesof 45° or 135° only 45° data are reported.
Experimental ProcedureThe psychophysical method used was a temporal two-alternative
forced-choice technique, where one stimulus comprised point-pairsand the other an equally dense field of random points. On each trialthe presentation order of the two fields was random and the subject was required to identify and signal the temporal location ofthe point-pair stimulus. If the subject was unsure, he was instructedto guess.
Each session comprised 100 trials, 20 trials ofeach of five valuesof the independent variable presented randomly. The order of stimulus location within each trial was also random. Five sessions werecompleted by each subject for each experimental condition.
To initiate a trial, the subject depressed one of the two handheldpushbuttons, and the stimulus sequence commenced immediately.Two dot fields appeared on the screen sequentially, each of 1 secduration and both separated by a l-sec interstimulus interval. Thesubject then identified the temporal location of the point-pair stimulusand pressed the pushbutton corresponding to "first" or "second,"as appropriate. This decision was signaled to the computer, anddisplay parameters were then computed for the next trial (computing time, approximately 10 msec); the subject was then free to initiate the next trial. There was no pressure to complete a sessionwithin a given time limit, but in practice it was found that eachset of 100 trials was completed in approximately 15 min. At theconclusion of each session, the computer printed out the results onthe teletypewriter.
SubjectsThe sequence of events outlined in the preceding section was con
ducted with three observers, all of whom had normal or correctedto-normal vision.
Correlation Detection LimitAs the within-point-pair separation (~d) is increased or the orien
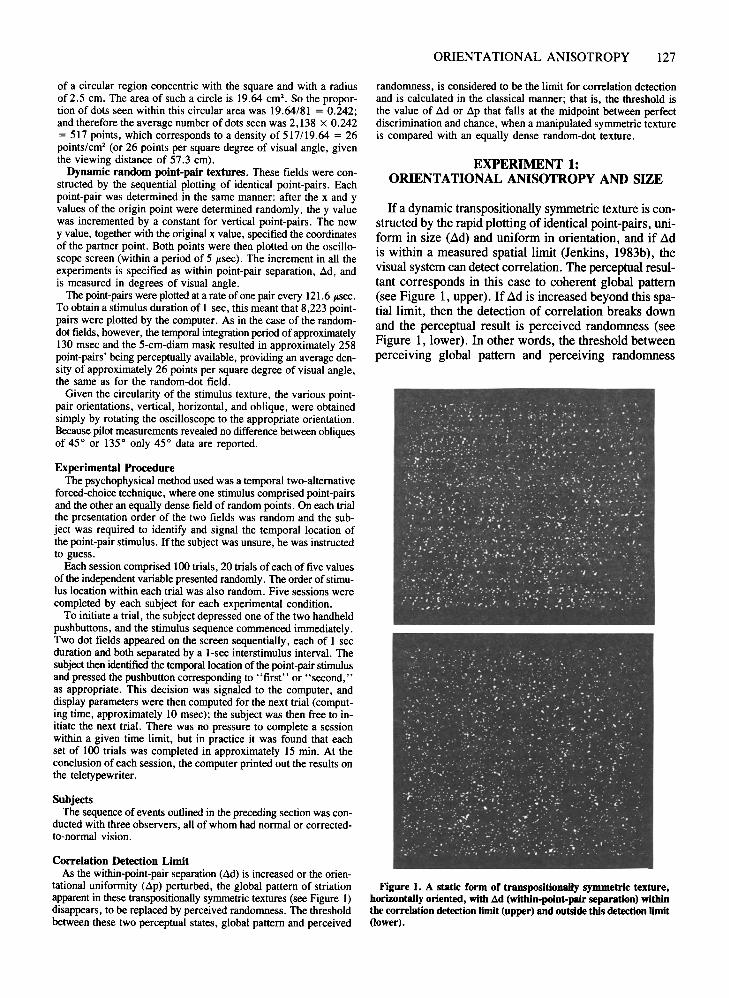
tational uniformity (~p) perturbed, the global pattern of striationapparent in these transpositionally symmetric textures (see Figure 1)disappears, to be replaced by perceived randomness. The thresholdbetween these two perceptual states, global pattern and perceived
ORIENTATIONAL ANISOTROPY 127
randomness, is considered to be the limit for correlation detectionand is calculated in the classical manner; that is, the threshold isthe value of ~d or ~p that falls at the midpoint between perfectdiscrimination and chance, when a manipulated symmetric textureis compared with an equally dense random-dot texture.
EXPERIMENT 1:ORIENTATIONAL ANISOTROPY AND SIZE
If a dynamic transpositionally symmetric texture is constructed by the rapid plotting of identical point-pairs, uniform in size (zsd) and uniform in orientation, and if ~dis within a measured spatial limit (Jenkins, 1983b), thevisual system can detect correlation. The perceptual resultant corresponds in this case to coherent global pattern(see Figure 1, upper). If~d is increased beyond this spatiallimit, then the detection of correlation breaks downand the perceptual result is perceived randomness (seeFigure 1, lower). In other words, the threshold betweenperceiving global pattern and perceiving randomness
Figure 1. A static form of transpositionally symmetric texture,horizontally oriented, with .:id (within-point-pair separation) withinthe correlation detection limit (upper) and outside this detection limit(lower).
128 JENKINS
--
SUBJECT: B
SUBJECT C
-c.....
", ....'0.
\\
\\•~
\':0 _.---
50 0.56 1.12 1.68 2.24 2.80
lid(degrees of visual angle)
100 o VERTICAL• OBLIQUE
90 o HORIZONT AL
80SUBJECT A
70
60
70
80
z 60o~ 50
~ 100~
II:o 90(J)
Ci 80~
oUJ 70II:II:o 60o!Z 50UJo 100II:UJQ. 90
Ifa dynamic transpositionally symmetric texture is constructed by the rapid plotting of identical point-pairs, with
EXPERIMENT 2:ORIENTATIONAL ANISOTROPY AND
ORIENTATIONAL UNIFORMITY
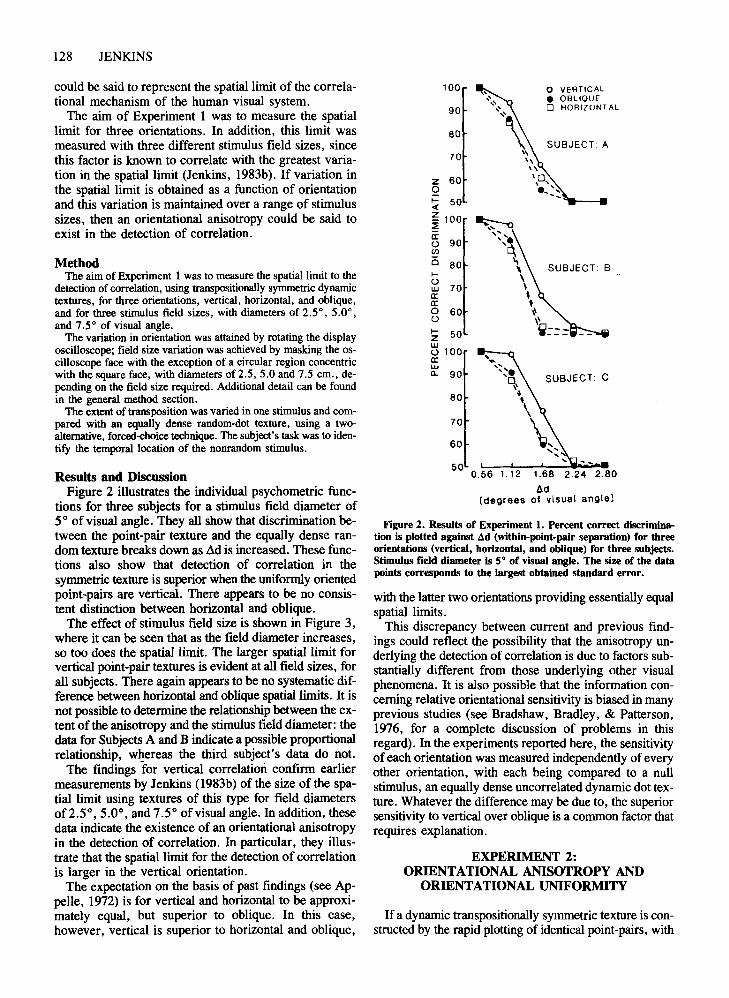
Figure 2. Results of Experiment 1. Percent correct discrimination is plotted against ~d (within-point-pair separation) for threeorientations (vertical, horizontal, and oblique) for three subjects.Stimulus field diameter is 5° of visual angle. The size of the datapoints corresponds to the largest obtained standard error.
with the latter two orientations providing essentially equalspatial limits.
This discrepancy between current and previous findings could reflect the possibility that the anisotropy underlying the detection of correlation is due to factors substantially different from those underlying other visualphenomena. It is also possible that the information concerning relative orientational sensitivity is biased in manyprevious studies (see Bradshaw, Bradley, & Patterson,1976, for a complete discussion of problems in thisregard). In the experiments reported here, the sensitivityofeach orientation was measured independently of everyother orientation, with each being compared to a nullstimulus, an equally dense uncorrelated dynamic dot texture. Whatever the difference may be due to, the superiorsensitivity to vertical over oblique is a common factor thatrequires explanation.
MethodThe aim of Experiment I was to measure the spatial limit to the
detection of correlation, using transpositionally symmetric dynamictextures, for three orientations, vertical, horizontal, and oblique,and for three stimulus field sizes, with diameters of 2.5 0
, 5.00,
and 7.5 0 of visual angle.The variation in orientation was attained by rotating the display
oscilloscope; field size variation was achieved by masking the oscilloscope face with the exception of a circular region concentricwith the square face, with diameters of 2.5, 5.0 and 7.5 cm., depending on the field size required. Additional detail can be foundin the general method section.
The extent of transposition was varied in one stimulus and compared with an equally dense random-dot texture, using a twoalternative, forced-choice technique. The subject's task was to identify the temporal location of the nonrandom stimulus.
could be said to represent the spatial limit of the correlational mechanism of the human visual system.
The aim of Experiment 1 was to measure the spatiallimit for three orientations. In addition, this limit wasmeasured with three different stimulus field sizes, sincethis factor is known to correlate with the greatest variation in the spatial limit (Jenkins, 1983b). If variation inthe spatial limit is obtained as a function of orientationand this variation is maintained over a range of stimulussizes, then an orientational anisotropy could be said toexist in the detection of correlation.
Results and DiscussionFigure 2 illustrates the individual psychometric func
tions for three subjects for a stimulus field diameter of5° of visual angle. They all show that discrimination between the point-pair texture and the equally dense random texture breaks down as Ad is increased. These functions also show that detection of correlation in thesymmetric texture is superior when the uniformly orientedpoint-pairs are vertical. There appears to be no consistent distinction between horizontal and oblique.
The effect of stimulus field size is shown in Figure 3,where it can be seen that as the field diameter increases,so too does the spatial limit. The larger spatial limit forvertical point-pair textures is evident at all field sizes, forall subjects. There again appears to be no systematic difference between horizontal and oblique spatial limits. It isnot possible to determine the relationship between the extent of the anisotropy and the stimulus field diameter: thedata for Subjects A and B indicate a possible proportionalrelationship, whereas the third subject's data do not.
The findings for vertical correlation confirm earliermeasurements by Jenkins (1983b) of the size of the spatial limit using textures of this type for field diametersof2.5°, 5.0°, and 7.5° of visual angle. In addition, thesedata indicate the existence of an orientational anisotropyin the detection of correlation. In particular, they illustrate that the spatial limit for the detection of correlationis larger in the vertical orientation.
The expectation on the basis of past findings (see Appelle, 1972) is for vertical and horizontal to be approximately equal, but superior to oblique. In this case,however, vertical is superior to horizontal and oblique,

ORIENTATIONAL ANISOTROPY 129
Figure 3. Thresholds for the detection of correlation are plottedagainst stimulus field diameter, for three orientations, vertical (hollow circle), horizontal (hollowsquare), and oblique (solid circle) andthree subjects. Threshold values correspond to 75% correct discrimination. The size of the data points corresponds to the largest standard error obtained.
uniform .1d and uniform orientation, the visual systemcan detect the correlation. But if .1d is extended beyonda particular value of .1d, then the detection of correlationbreaks down (Jenkins, 1983b). The value of .1d corresponding to the threshold between detecting and not detecting the uniformity varies as a function of the uniformorientation (see Experiment 1).
A similar breakdown in detectability of the uniformstructure in similar static patterns that occurs as a resultof the perturbation of the orientational uniformity, .1p,has also been reported (e.g., Glass & Switkes, 1976).However, these investigators kept ad constant; given that.1d has been shown to be a crucial variable in the detection of correlation, as is the axis of uniform orientation,the aim of Experiment 2 was to measure the tolerance for
SUBJECT C
MethodThe aim of Experiment 2 was to measure the effect of perturb
ing orientational uniformity on the detection ofcorrelation, for threeorientations (vertical, horizontal, and oblique), for two differentstimulus field diameters (5.0 and 7.5 em), and for several valuesOfdd (7.5-cmdiameter-0.7°, 0.9°, 1.1°,1.3°, 1.5°, 1.7°, and1.9° of visual angle; 5.0-cm diameter-O.7°,0.9°, 1.1 0, and 1.3°of visual angle). The threshold value of dp was measured independently for each value of dd. Within each session, a value ofdd was selected and kept constant; this variable was blocked. Fivevalues of dp were selected. Each session comprised 100 trials, 20trials of each value of dp. These were presented randomly. Thesubjects were aware of the axis of orientational uniformity. Fivesessions were completed by each subject for each value of dd.
Perturbation was achieved by displacing one point of the correlated pair to the left or the right of its true alignment (at randomwithin a given dynamic texture). The varying amounts of incrementor decrement, reported here, for technical reasons, as the absoluteamount of displacement, dp, enabled the orientational uniformityto be perturbed. This method results in a systematic covariationbetween dp and dd; however, polar manipulation, which wouldhave avoided this problem, was not possible due to the resolutionlimits of the display oscilloscope. Accurate compensation of minorvariation in dd was not possible. To limit this technical problem,values of dd were selected that fell within the region of perfect discrimination when dd was the sole variable (see Experiment 1). Anyperformance variation, therefore, with manipulation of dp, was considered to be due to this factor alone.
The subject was presented with two dynamic textures, one a transpositionally symmetric texture, with a particular value of dd anddp, and an equally dense random-dot texture. Values of dd < 0.7°of visual angle were not investigated, since pilot investigations hadrevealed that orientational pertubation in this case did not resultin perceived randomness.
Additional experimental details are contained in the generalmethod; threshold dp was calculated as for threshold dd.
the perturbation of orientational uniformity as a functionof several different values of .1d, along three axes of uniform orientation: vertical, horizontal, and oblique.
Results and DiscussionThe results of Experiment 2 are illustrated in Figure 4,
and they are plotted as threshold values of .1p for threeorientations and for two stimulus field diameters.Representative data for one subject are plotted. The othersubjects provided data that were qualitatively identical.
The relationship between orientation and threshold .1pis complex and is best exemplified by examining the dataobtained using the 7.5°-diam stimulus field. An orientational anisotropy is evident for some, but not all, valuesof .1d.
For ad = 0.7° and 0.9°, threshold zip does not varysystematically for the three orientations, and its value appears to be independent of .1d. For ad = 1.1° and 1.3°,the anisotropy begins to emerge with tolerable .1p for theoblique orientation declining rapidly, whereas there is noconsistent variation in threshold .1p for the vertical andhorizontal orientations. For these orientations, threshold.1p remains at approximately the same value as that forthe smaller values of .1d. For zsd = 1.5° and 1.7°, theorientational anisotropy is extended to include differencesbetween threshold .1p for vertical and horizontal.
SUBJECT A
~"""""/
N
,/'".1
"."~:.,
2.5 5.0 7.5
STIMULUS FIELD DIAMETER(degrees of visual angle)
0.6
2.2
1.8
1.4
10
0.6OJ
Olc 2.2Cll
Cll:l
'" 1.8>
"0
'" 1.4OJOJ~
OlOJ 1.0u
u<I 0.60..J0 2.2:I:U)wa::I: 1.8I-
1.4
1.0
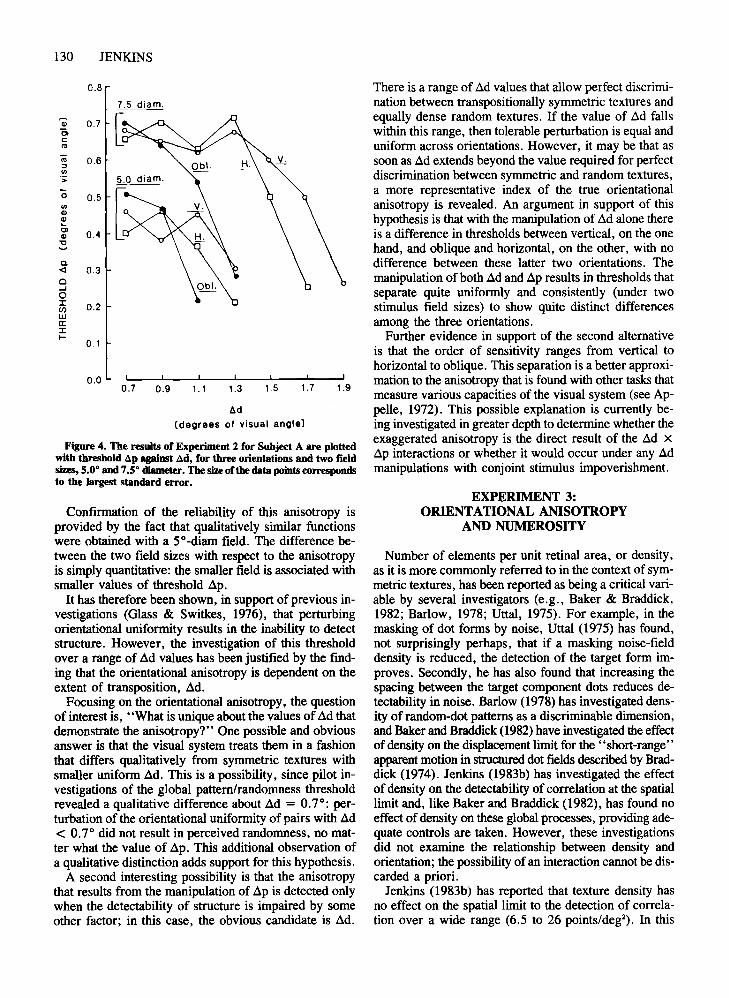
Figure 4. The results of Experiment 2 for Subject A are plottedwith threshold .&p against .&d, for threeorientations and two fieldsizes, 5.0· and 7.so diameter. The size of the data points correspondsto the largest standard error.
There is a range of ad values that allow perfect discrimination between transpositionally symmetric textures andequally dense random textures. If the value of ad fallswithin this range, then tolerable perturbation is equal anduniform across orientations. However, it may be that assoon as ad extends beyond the value required for perfectdiscrimination between symmetric and random textures,a more representative index of the true orientationalanisotropy is revealed. An argument in support of thishypothesis is that with the manipulation of ad alone thereis a difference in thresholds between vertical, on the onehand, and oblique and horizontal, on the other, with nodifference between these latter two orientations. Themanipulation of both ad and ap results in thresholds thatseparate quite uniformly and consistently (under twostimulus field sizes) to show quite distinct differencesamong the three orientations.
Further evidence in support of the second alternativeis that the order of sensitivity ranges from vertical tohorizontal to oblique. This separation is a better approximation to the anisotropy that is found with other tasks thatmeasure various capacities of the visual system (see Appelle, 1972). This possible explanation is currently being investigated in greater depth to determine whether theexaggerated anisotropy is the direct result of the ad xap interactions or whether it would occur under any admanipulations with conjoint stimulus impoverishment.
1.91.71.51.31.1
tld(degrees of visual angle)
0.7 0.90.0
130 JENKINS
0.8
7.5 diam.
Q; 0.70>c:
'"iU 0.6::J(/)
's
'0 0.5(/)Q)Q)..0> 0.4Q)
1::J
Q
<l 0.3o...J0J: 0.2fI)U.Ja::J:f-
0.1
Confirmation of the reliability of this anisotropy isprovided by the fact that qualitatively similar functionswere obtained with a 5°-diam field. The difference between the two field sizes with respect to the anisotropyis simply quantitative: the smaller field is associated withsmaller values of threshold ap.
It has therefore been shown, in support of previous investigations (Glass & Switkes, 1976), that perturbingorientational uniformity results in the inability to detectstructure. However, the investigation of this thresholdover a range of ad values has been justified by the finding that the orientational anisotropy is dependent on theextent of transposition, ad.
Focusing on the orientational anisotropy, the questionof interest is, "What is unique about the values of ad thatdemonstrate the anisotropy?" One possible and obviousanswer is that the visual system treats them in a fashionthat differs qualitatively from symmetric textures withsmaller uniform ad. This is a possibility, since pilot investigations of the global pattern/randomness thresholdrevealed a qualitative difference about ad = 0.7°: perturbation of the orientational uniformity of pairs with ad< 0.7° did not result in perceived randomness, no matter what the value of ap. This additional observation ofa qualitative distinction adds support for this hypothesis.
A second interesting possibility is that the anisotropythat results from the manipulation of ap is detected onlywhen the detectability of structure is impaired by someother factor; in this case, the obvious candidate is ad.
EXPERIMENT 3:ORIENTATIONAL ANISOTROPY
AND NUMEROSITY
Number of elements per unit retinal area, or density,as it is more commonly referred to in the context of symmetric textures, has been reported as being a critical variable by several investigators (e.g., Baker & Braddick,1982; Barlow, 1978; Uttal, 1975). For example, in themasking of dot forms by noise, Uttal (1975) has found,not surprisingly perhaps, that if a masking noise-fielddensity is reduced, the detection of the target form improves. Secondly, he has also found that increasing thespacing between the target component dots reduces detectability in noise. Barlow (1978) has investigated density of random-dot patterns as a discriminable dimension,and Baker and Braddick (1982) have investigated the effectof density on the displacement limit for the "short-range"apparent motion in structured dot fields described by Braddick (1974). Jenkins (1983b) has investigated the effectof density on the detectability of correlation at the spatiallimit and, like Baker and Braddick (1982), has found noeffect of density on these global processes, providing adequate controls are taken. However, these investigationsdid not examine the relationship between density andorientation; the possibility of an interaction cannot be discarded a priori.
Jenkins (1983b) has reported that texture density hasno effect on the spatial limit to the detection of correlation over a wide range (6.5 to 26 points/deg"). In this
study, however, the correlation limit was measured forvertical transpositionally symmetric textures only; noother orientation was investigated.
Although texture density has no effect on this limit, theexistence of an interaction, as found in the previous experiment, cannot be discounted. The aim of this investigation, therefore, was to investigate the effect of densityon the detection of correlation, for three orientations. Thevariable selected to provide a basis for examining the effect of density was ~d.
MethodExperiment 1 was repeated, but with one field size, 5-cm diam
eter, for three texture densities. Even variation in density of dynamic textures was achieved by manipulating the plotting rate. Thethree plotting rates used resulted in three apparent texture densities of 26, 12, and 6.5 points/deg", The experimental procedureis described in the general method, and was exactly the same asExperiment 1.
Results and DiscussionThe results of Experiment 3 are illustrated in Figure 5
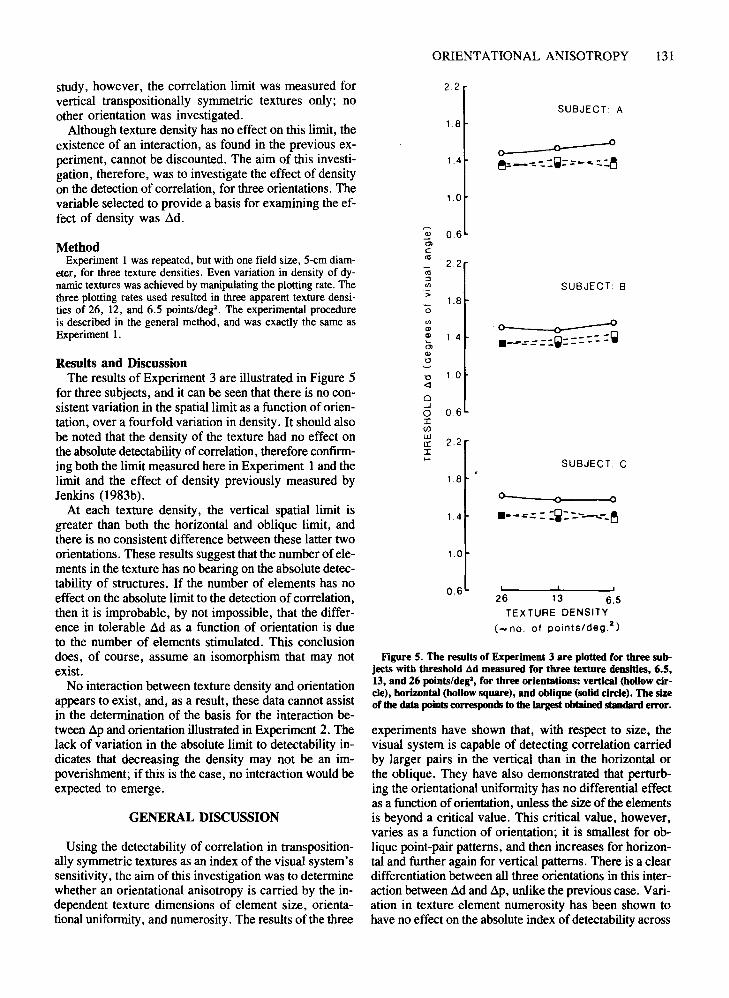
for three subjects, and it can be seen that there is no consistent variation in the spatial limit as a function of orientation, over a fourfold variation in density. It should alsobe noted that the density of the texture had no effect onthe absolute detectability ofcorrelation, therefore confirming both the limit measured here in Experiment I and thelimit and the effect of density previously measured byJenkins (1983b).
At each texture density, the vertical spatial limit isgreater than both the horizontal and oblique limit, andthere is no consistent difference between these latter twoorientations. These results suggest that the number of elements in the texture has no bearing on the absolute detectability of structures. If the number of elements has noeffect on the absolute limit to the detection ofcorrelation,then it is improbable, by not impossible, that the difference in tolerable ~d as a function of orientation is dueto the number of elements stimulated. This conclusiondoes, of course, assume an isomorphism that may notexist.
No interaction between texture density and orientationappears to exist, and, as a result, these data cannot assistin the determination of the basis for the interaction between ~p and orientation illustrated in Experiment 2. Thelack of variation in the absolute limit to detectability indicates that decreasing the density may not be an impoverishment; if this is the case, no interaction would beexpected to emerge.
GENERAL DISCUSSION
Using the detectability of correlation in transpositionally symmetric textures as an index of the visual system'ssensitivity, the aim of this investigation was to determinewhether an orientational anisotropy is carried by the independent texture dimensions of element size, orientational uniformity, and numerosity. The results of the three
ORIENTATIONAL ANISOTROPY 131
2.2
SUBJECT A1.8
..0--..{)
<>-1.4 ~:_-:.-:.:~=::_c.~~
1.0
~
06Q)
0>C<1l
2.2<1l:::Il/J SUBJECT B:>
1.8"0l/J.~Q)
Q) 1.4 .-.:'==::~==:::::::~0>Q)
"0
"0 1.0<l
0--'0 0.6I(f)
UJ 2.2II:If- SUBJECT C
1.8
0.....- 0() 0
1.4 .-- -- - -~--- - ~---- --~-
1.0
0.6,
26 13 6.5TEXTURE DENSITY
(- no. of points/deg. 2)
Figure 5. The results of Experiment 3 are plotted for three subjects with threshold ad measured for three texture densities, 6.5,13, and 26 points/deg', for three orientations: vertical (hoUowcircle), horizontal (hollow square), and oblique (solid circle). The sizeof the data pointscorresponds to the largest obtainedstandard error.
experiments have shown that, with respect to size, thevisual system is capable of detecting correlation carriedby larger pairs in the vertical than in the horizontal orthe oblique. They have also demonstrated that perturbing the orientational uniformity has no differential effectas a function of orientation, unless the size of the elementsis beyond a critical value. This critical value, however,varies as a function of orientation; it is smallest for oblique point-pair patterns, and then increases for horizontal and further again for vertical patterns. There is a cleardifferentiation between all three orientations in this interaction between ~d and ~p, unlike the previous case. Variation in texture element numerosity has been shown tohave no effect on the absolute index of detectability across
132 JENKINS
orientations, neither does it enhance any relative difference, as a function of orientation, in this index.
Further, it was found that increasing the stimulus fieldsize increased the absolute detectability of the correlationin the symmetric textures, and this may be attributed, atleast tentatively, to the size of the area stimulated, sincevariation in number of elements, a natural concomitant(see Experiment 3), did nothing to affect the threshold.<:ld. A possible interaction cannot be ruled out. Increasing the field size, however, did nothing to alter the relative variation in threshold .<:ld as a function of orientation.It is not possible, on examining the data available (seeFigure 3), to determine whether there is an absolute difference in the relative variation as a function of field sizeor whether the relative difference is a constant proportion. Further investigation may clarify this issue.
It is perhaps unnecessary to point out that of the visualprocesses of a fundamental nature that could carry anorientational anisotropy, the integration of informationover retinal space is just one. Additional processes includetemporal integration and spatial differentiation. In addition, most of the phenomena that exhibit the orientationalanisotropy rely not only upon a combination of the aboveprocesses, but also on cognitive and judgmental processes.It is possible that further anisotropies exist at each of thesehigher levels also. It may be that any given net anisotropyis the result of the operation of any or all anisotropies thatexist at many different levels.
However, given that Atkinson's (1972) hypotheses were
responsible for the identification of the three variables ofinterest in relation to the orientational anisotropy, it maybe constructive to speculate on the extent to which thedata obtained in these experiments can be accounted forby reference to functional units with elongated receptivefields in the human visual system.
The data cannot elaborate on the "numerosity"hypothesis, since psychophysical data cannot be considered as evidence where specific cell counts are required .However, with respect to the other two hypotheses, thedata may contribute.
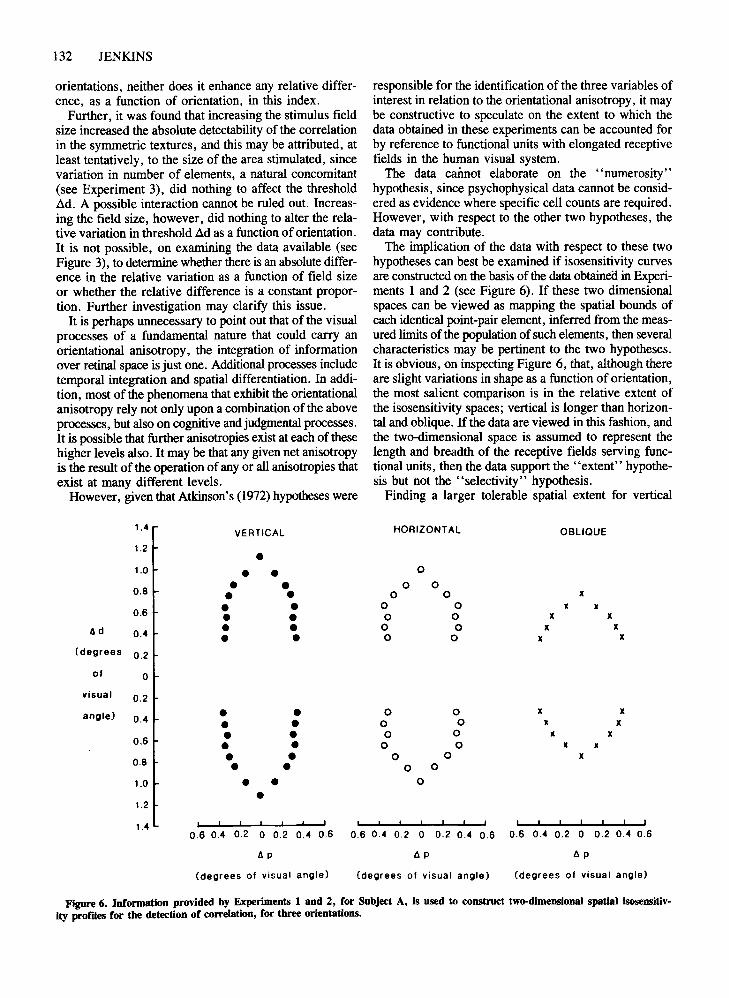
The implication of the data with respect to these twohypotheses can best be examined if isosensitivity curvesare constructed on the basis of the data obtained in Experiments 1 and 2 (see Figure 6). If these two dimensionalspaces can be viewed as mapping the spatial bounds ofeach identical point-pair element, inferred from the measured limits of the population of such elements, then severalcharacteristics may be pertinent to the two hypotheses.It is obvious, on inspecting Figure 6, that, although thereare slight variations in shape as a function oforientation,the most salient comparison is in the relative extent ofthe isosensitivity spaces; vertical is longer than horizontal and oblique. If the data are viewed in this fashion, andthe two-dimensional space is assumed to represent thelength and breadth of the receptive fields serving functional units, then the data support the "extent" hypothesis but not the "selectivity" hypothesis.
Finding a larger tolerable spatial extent for vertical
1.4VERTICAL HORIZONTAL OBLIaUE
1.2 •1.0 • • 0
0.8 • • 0 0
• • 0 0 x
0.6 • • 0 0 x x• • 0 0 x x
Ad 0.4 • • 0 0 x x
• • 0 0 x x(degrees 0.2
01 0
visual 0.2
angle) • • 0 0 x x0.4 • • 0 0 x x
• • 0 0 x x0.6 • • 0 0 x x0.8 • • 0 0 x
• • 0 0
1.0 • • 0
•1.2
1.40.6 0.4 0.2 0 0.2 0.4 0.6 0.6 0.4 0.2 0 0.2 0.4 0.6 0.6 0.4 0.2 0 0.2 0.4 0.6
Ap lip lip
(degrees 01 visual angle) (degrees 01 visual angle) (degrees 01 visual angle)
Figure 6. Information provided by Experiments 1 and 2, for Subject A, is used to construct two-dimensional spatial isosensitiv-ity profdes for the detection of correlation, for three orientations.
correlation is novel; but accounting for the data bypostulating longer functional unit receptive fields in thevertical raises many questions. It is useful to consider the"size" hypothesis as accounting for the obtained data,but the most obvious question remains: How can such astructural characteristic account for vertical sensitivity ingeneral? The problems raised by such a question drawattention to the proposal earlier in this discussion thatorientational anisotropies may exist at all levels of thevisual process, and that more than one anisotropy mayexist in one level.
Additional questions that the data raise relate to the functional importance of the orientational anisotropy to visionin general and to the detection of correlation in particular. With respect to the former, the argument has beenexpressed that we are more sensitive to verticals becauseof the predominance of verticality in our environment(e.g., Annis & Frost, 1973), and that therefore the organism is advantaged if it is sensitive to verticals. Thisargument highlights several problems, but one in particular is of relevance to this discussion, and that is the implicit assumption that greater spatial integration or sensitivity in the vertical meridian is advantageous. This maynot be the case, however, and it seems less than cautiousto attribute functional gain to a visual process simply because of its quantitative value, relative or absolute.
This point can be further illustrated in the specific caseof the detection of correlation. If the correlation mechanism can operate over a larger spatial range at the retinavertically than horizontally or obliquely, does this meanthat detecting correlations vertically is more critical thandetecting them in other orientations? The problem highlighted here is that unless the functions of identifiedprocesses or mechanisms are known, imbuing measureddifferences with functional value is hazardous.
The human visual system's sensitivity to correlation intranspositionally symmetric textures was measured usingthe global pattern/randomness threshold as an index ofthis sensitivity. These thresholds were found to bedependent on the size of the point-pair element, where the tolerable size varied as a function of orientation, with the system allowing a larger tolerable .:ld in the vertical meridian.Increasing the stimulus field size increased the absolutevalue of this threshold, but not the relative value as a function of orientation. The thresholds were also found to bedependent on the orientational uniformity of the pointpairs. Tolerable perturbation did not vary as a functionof the uniform orientation until a critical point-pair sizewas exceeded. This critical point-pair size did vary as afunction of orientation, falling quite distinctly from vertical, to horizontal, to oblique. The number of point-pairelements comprising the textures did not affect the globalpattern/ran~omness threshold.
REFERENCES
ANNIS, R. C., & FROST, B. C. (1973). Humanvisual ecology and orientation anisotropies in acuity. Science, 182, 729-731.
ORIENTATIONAL ANISOTROPY 133
ANTON, B. S. (1976). Poggendorff illusion as a function of orientationof transversals and parallel lines. Perceptual and Motor Skills, 43,83-90.
APPELLE, S. (1972). Perceptionand discrimination as a function of stimulus orientation: The "oblique effect" in man and animals. Psychological Bulletin, 78, 266-278.
ApPELLE, S. (1976). Figure embeddedness depends on contour orientation. Perception & Psychophysics, 19, 109-112.
ATKINSON, J. (1972). The effect of size, retinal locus, and orientationon the visibility of a single afterimage. Perception & Psychophysics,12,213-217.
BAKER, C. L., & BRADDICK, O. J. (1982). The basis of area and dotnumber effects in random dot motion perception. Vision Research,22, 1253-1259.
BARLOW, H. B. (1978). The efficiency of detecting changes of densityin random dot patterns. Vision Research, 18, 637-650.
BLAKEMORE, C. B., CARPENTER, R. H. S., & GEORGESON, M. A. (1970).Lateral inhibition between orientation detectors in the human visualsystem. Nature, 228, 37-39.
BLAKEMORE, C. B., & NACHMIAS, J. (1971). The orientational specificityof two visualafter-effects. Journal ofPhysiology (London),213,157-174.
BLAKEMORE, C. 8., NACHMIAS, J., & SUTTON, P. (1970). The perceivedspatial frequency shift: Evidence for frequency selective neurons inthe human brain. Journal of Physiology (London), 210, 727-750.
BRADDICK, O. J. (1974). A short range process in apparent motion. Vision Research, 14,519-527.
BRADDICK, O. J., CAMPBELL, F. W., & ATKINSON, J. (1978). Channels in vision: Basicaspects. In R. Held, H. Leibowitz, & H. L. Teuber(Eds.), Handbook of sensory physiology (Vol. VIII): Perception.Heidelburg: Springer-Verlag.
BRADSHAW, J., BRADLEY, D. & PATTERSON, K. (1976). The perception and identification of mirror-reversed patterns. Quarterly Journal of Experimental Psychology, 28, 221-246.
CAMPBELL, F. W., & KULIKOWSKI, J. J. (1966). Orientation selectivityin the human visual system. Journal of Physiology (London), 187,437-445.
CAMPBELL, F. W., KULIKOWSKI, J. J., & LEVINSON, J. (1966). Theeffect of orientation on the visual resolution of gratings. Journal ofPhysiology (London), 187, 427-436.
CAMPBELL, F. W., & MAFFEI, L. (1970). Electrophysiological evidencefor the existence of orientation and size detectors in the human visualsystem. Journal of Physiology (London), 207, 635-652.
EMSLEY, H. H. (1925). Irregular astigmatism of the eye: Effect of correcting lenses. Transactions of the Optical Society, 27, 28-42.
FREEMAN, R. D., & THIBOS, L. N. (1973). Electrophysiological evidence that abnormal early visual experience can modify the humanbrain. Science, 180, 876-878.
FURCHNER, C. S., & YOUNG, S. J. (1975). Recovery from adaptationas a function of stimulus orientation. Perception & Psychophysics,17, 117-124.
GIBSON, J. J. (1933). Adaptation, after-effect and contrast in perception of curved lines. Journal ofExperimental Psychology, 16, 1-31.
GILINSKY, A. S., & MAYO, T. H. (1971). Inhibitory effects of orienta-.tional adaptation. Journal of the Optical Society of America, 61,1710-1714.
GLASS, L. (1969). Moireeffectfrom randomdots. Nature, 223,578-580.GLASS, L., & PEREZ, R. (1973). Perception of random dot interference
patterns. Nature, 246, 360-362.GLASS, L., & SWITKES, E. (1976). Pattern recognitionin humans: Corre
lations which cannot be perceived. Perception, S, 67-72.GREEN, R. T., & HOYLE, E. M. (1964). The influence of spatial orien
tation on the Poggendorf illusion. Acta Psychologica, 22, 348-366.GREGORY, R. L. (1972). Cognitive contours. Nature, 238, 51-52.HOULIHAN, K., & SEKULER, R. W. (1968). Contour interactionin visual
masking. Journal of Experimental Psychology, 77, 281-285.HUBEL, D. H., & WIESEL, T. N. (1977). Ferrier lecture: Functional
architecture of macaque monkey visual cortex. Proceedings of theRoyal Society, London, Series B, 198, I-59.
JASTROW, J. (1892). On the judgement of angles and positionsof lines.American Journal of Psychology, S, 214-248.
134 JENKINS
JENKINS, B. (1982). Redundancy in the perception of bilateral symmetryin dot textures. Perception & Psychophysics, 32, 171-177.
JENKINS, B. (1983a). Componentprocessesin theperceptionof bilaterallysymmetric dot textures. Perception & Psychophysics, 34, 433-440.
JENKINS, B. (1983b). Spatial limits to the detection of transpositionalsymmetry in dynamic dot textures. Journal ofExperimental Psychology: Human Perception and Performance, 9, 258-269.
JENKINS, B. (1983c). Temporal limits to the detection of correlationin transpositionally symmetric textures. Perception & Psychophysics,33,79-84.
JULESZ, B. (1971). Foundations ofcyclopean perception. Chicago andLondon: University of Chicago Press.
KITTERLE, F. L., RUSSELL, S. K., '" NIXON, H. (1974). Pattern alternation:Effectsof spatialfrequencyandorientation. Perception & Psychophysics, 16, 543-546.
KOHLER, W., '" WALLACH, H. (1944). Figural after-effects: An investigationof visualprocesses.Proceedings ofthe American PhilosophicalSociety, 88, 269-357.
LEIBOWITZ, H. W. (1955). Some factors influencingthe variability ofvernier adjustments. American Journal ofPsychology, 68, 266-273.
MAFFEI, L., '" CAMPBELL, F. W. (1970). Neurophysiologicallocaliza-
tion of the vertical and horizontalvisual coordinates in man. Science,167, 386-387.
MORGAN, M. J., '" WARD, R. (1980). Conditions for motion flow indynamic visual noise. Vision Research, 20, 431-435.
MOVSHON, J. A., '" BLAKEMORE, C. B. (1973). Orientational specificity and spatial selectivity in human vision. Perception, 2, 53-60.
PARLEE, M. B. (1969). Visual background masking of a single line bya single line. Vision Research, 9, 199-205.
ROCHLIN, A. M. (1955). The effect of tilt on the visual perception ofparallelness. American Journal of Psychology, 68, 223-236.
SEKULER, R. W. (1965). Spatial and temporal determinants of visualbackwardmasking.Journal ofExperimental Psychology, 70, 401-406.
SUTHERLAND, N. S. (1957). Visualdiscriminationof orientationby octopus. British Journal of Psychology, 48, 55-71.
UTTAL, W. R. (1975). An autocorrelational theory ofform detection,Hillsdale, NJ: Erlbaum.
(Manuscript received May io, 1984;revision accepted for publication January 4, 1985.)