Embed Size (px)
Citation preview
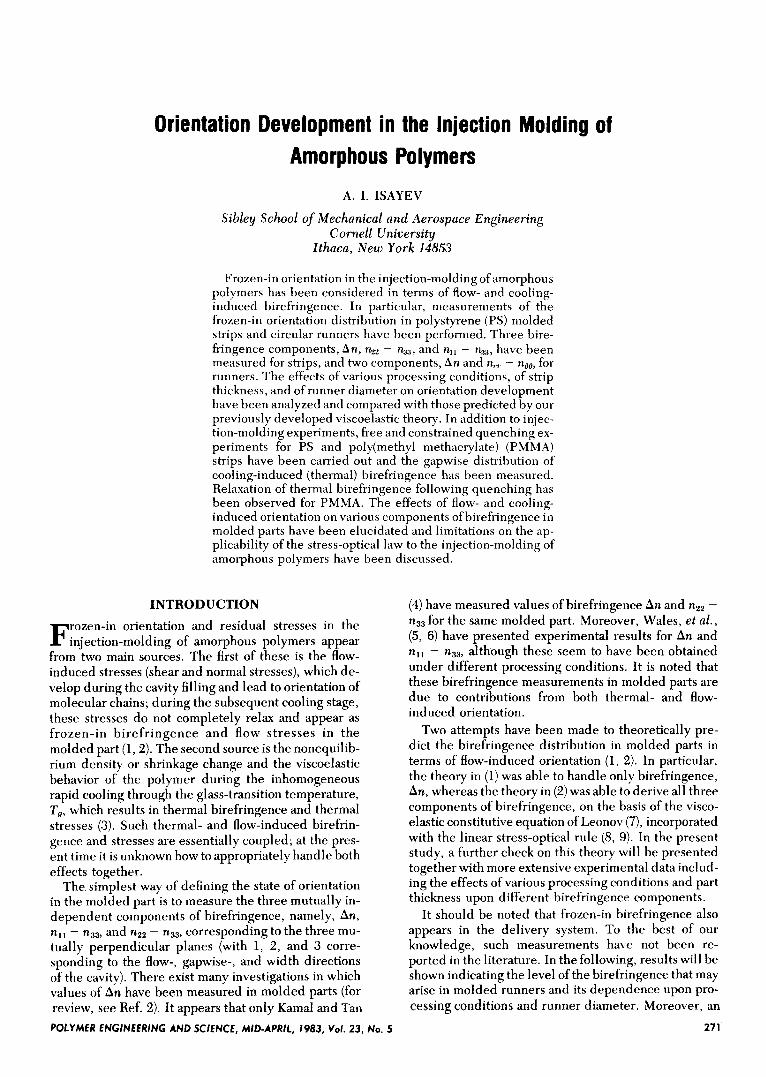
Orientation Development in the Injection Molding of Amorphous Polymers
A. I. ISAYEV
Sibley School of Mechanical and Aerospace Engineering Cornell University
Ithaca, New York 14853
Frozen-in orientation in the injection-molding of amorphous polymers has been considered in terms of flow- and cooling- induced birefringence. In particular, measurements of the frozen-in orientation distribution in polystyrene (PS) molded strips and circular runners have been performed. Three bire- fringence components, An, n22 - Q ~ , and n,, - kJ, have been measured for strips, and two components, An and n,, - nee, for runners. The effects of various processing conditions, of strip thickness, and of runner diameter on orientation development have been analyzed and compared with those predicted by our previously developed viscoelastic theory. In addition to injec- tion-molding experiments, free and constrained quenching ex- periments for P S and poly(methy1 methacrylate) (PMMA) strips have been carried out and the gapwise distribution of cooling-induced (thermal) birefringence has been measured. Relaxation of thermal birefringence following quenching has been observed for PMMA. The effects of flow- and cooling- induced orientation on various components ofbirefringence in molded parts have been elucidated and limitations on the ap- plicability of the stress-optical law to the injection-molding of amorphous polymers have been discussed.
INTRODUCTION rozen-in orientation and residual stresses in the F injection-molding of amorphous polymers appear
from two main sources. The first of these is the flow- induced stresses (shear and normal stresses), which de- velop during the cavity filling and lead to orientation of molecular chains; during the subsequent cooling stage, these stresses do not completely relax and appear as frozen-in birefringence and flow stresses in the molded part (1,2). The second source is the nonequilib- rium density or shrinkage change and the viscoelastic behavior of the polymer during the inhomogeneous rapid cooling through the glass-transition temperature, T,, which results in thermal birefringence and thermal stresses (3). Such thermal- and flow-induced birefrin- gence and stresses are essentially coupled; at the pres- ent time it is unknown how to appropriately handle both effects together.
The simplest way of defining the state of orientation in the molded part is to measure the three mutually in- dependent components of birefringence, namely, An, n , , - n33, and nZ2 - n33, corresponding to the three mu- tually perpendicular planes (with 1, 2, and 3 corre- sponding to the flow-, gapwise-, and width directions of the cavity). There exist many investigations in which values of An have been measured in molded parts (for review, see Ref. 2). I t appears that only Kamal and Tan POLYMER ENGINEERING AND SCIENCE, MID-APRIL, 1983, Vol. 23, No. 5
(4) have measured values of birefringence An and nZ2 - ng3 for the same molded part. Moreover, Wales, et al., (5, 6 ) have presented experimental results for An and n, , - n33, although these seem to have been obtained under different processing conditions. It is noted that these birefringence measurements in molded parts are due to contributions from both thermal- and flow- induced orientation.
Two attempts have been made to theoretically pre- dict the birefringence distribution in molded parts in terms of flow-induced orientation (1, 2). In particular, the theory in (1) was able to handle only birefringence, An, whereas the theory in (2) was able to derive all three components of birefringence, on the basis of the visco- elastic constitutive equation of Leonov (7), incorporated with the linear stress-optical rule (8, 9). In the present study, a further check on this theory will be presented together with more extensive experimental data includ- ing the effects of various processing conditions and part thickness upon different birefringence components.
It should be noted that frozen-in birefringence also appears in the delivery system. To the best of our knowledge, such measurements have not been re- ported in the literature. In the following, results will be shown indicating the level of the birefringence that may arise in molded runners and its dependence upon pro- cessing conditions and runner diameter. Moreover, an
27 1
A. I. Isayec
attempt will be made at predicting these frozen-in bire- fringence distributions.
In addition to flow-induced orientation, the injec- tion-molding of polymers gives rise to thermal orienta- tion. There exist a few papers where thermally-induced birefringence in freely quenched polymer strips has been measured (10-12). According to (E), the thermal stress distribution in quenched strips can be derived from birefringence measurements by making use of the linear stress-optical rule with constant stress-optical coefficient, C, corresponding to the glassy state of the polymer. On the other hand, according to (11), the thermal-stress distribution in quenched strips can be calculated by means of the linear stress-optical rule but based upon the difference between the thermal bire- fringence measured in quenched strips and the “resid- ual birefringence,” which remains in slices having thicknesses less than 0.001 meter. However, as will be shown, the relationship between frozen-in thermal bi- refringence and stresses in polymeric materials is not as simple as depicted in papers (11, 12). Moreover, experi- mental data will be shown in the present study concern- ing thermal birefringence in constrained and freely quenched strips together with evidence of thermal- birefringence relaxation.
EXPERIMENTAL Materials and Methods of Investigation
The material under investigation was polystyrene (PS) Styron 678U (Dow Chemical). Straight-gated rec- tangular strips of two different thicknesses and two open-ended circular runners of different diameters were used in the investigation. Molding was carried out on an 800-ton Beloit Machine with a shot size of ~ 2 . 5 X
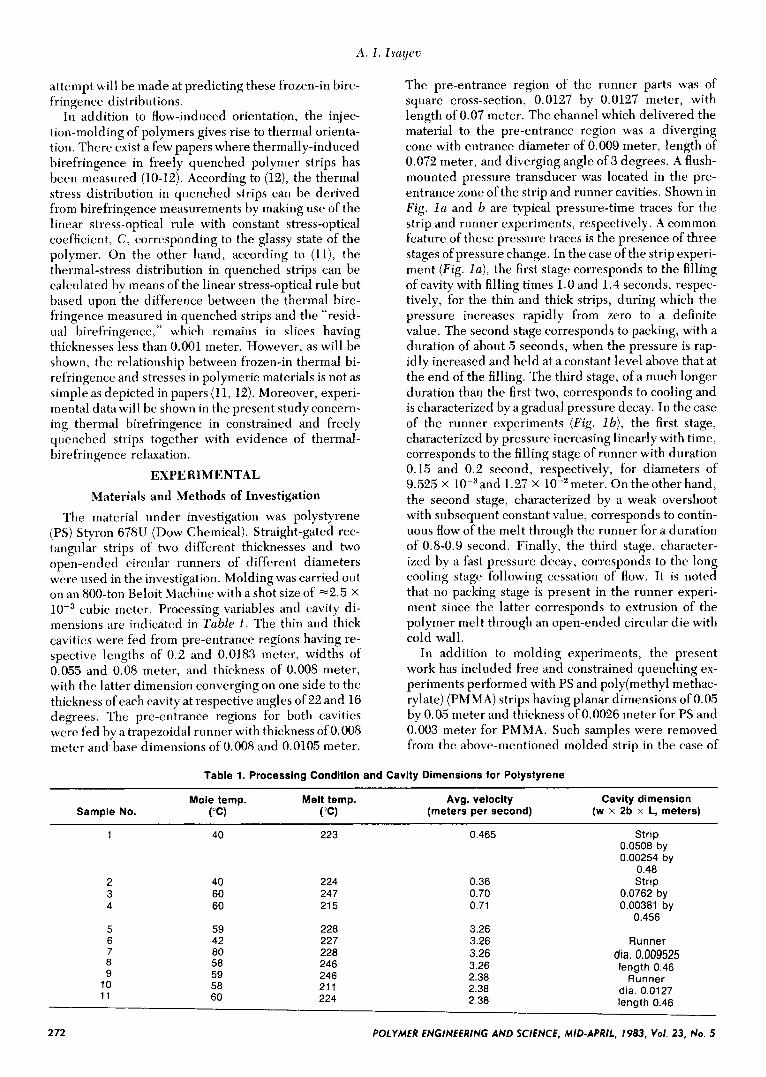
cubic meter. Processing variables and cavity di- mensions are indicated in Table 1. The thin and thick cavities were fed from pre-entrance regions having re- spective lengths of 0.2 and 0.0183 meter, widths of 0.055 and 0.08 meter, and thickness of 0.008 meter, with the latter dimension converging on one side to the thickness of each cavity at respective angles of 22 and 16 degrees. The pre-entrance regions for both cavities were fed by a trapezoidal runner with thickness of 0.008 meter and base dimensions of 0.008 and 0.0105 meter.
Table 1. Processing Condition a
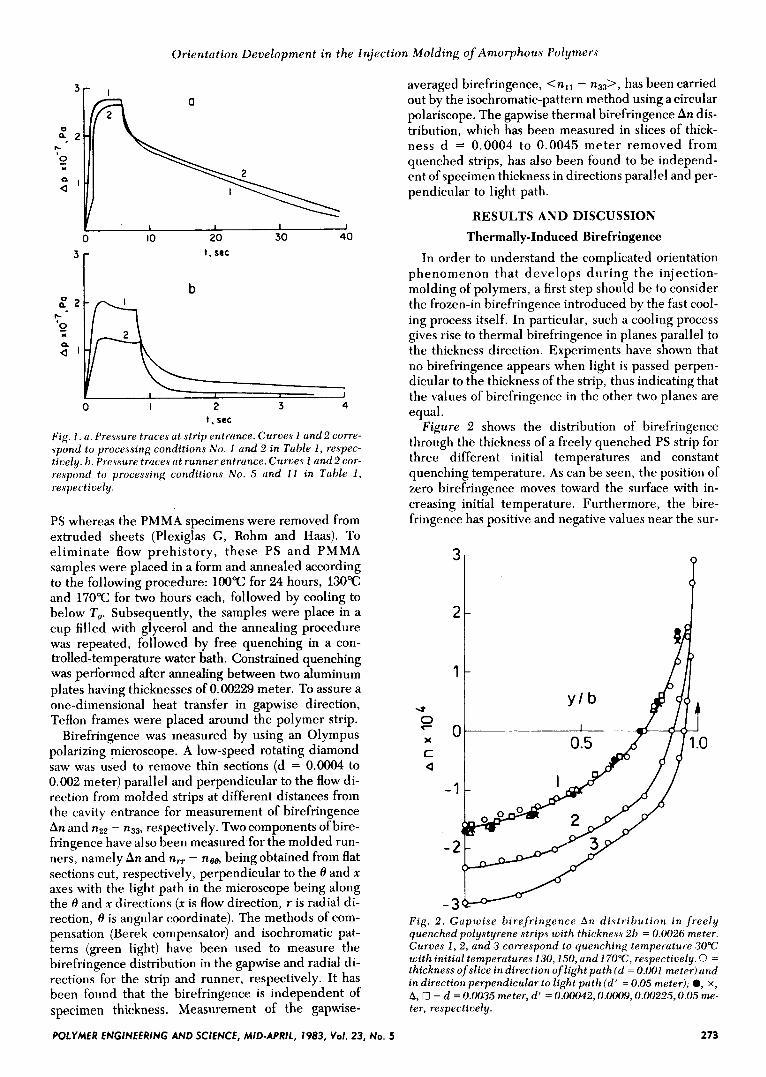
The pre-entrance region of the runner parts was of square cross-section, 0.0127 by 0.0127 meter, with length of 0.07 meter. The channel which delivered the material to the pre-entrance region was a diverging cone with entrance diameter of 0.009 meter, length of 0.072 meter, and diverging angle of 3 degrees. A flush- mounted pressure transducer was located in the pre- entrance zone of the strip and runner cavities. Shown in Fig. l a and b are typical pressure-time traces for the strip and runner experiments, respectively. A common feature of these pressure traces is the presence of three stages of pressure change. In the case of the strip experi- ment (Fig. l a ) , the first stage corresponds to the filling of cavity with filling times 1.0 and 1.4 seconds, respec- tively, for the thin and thick strips, during which the pressure increases rapidly from zero to a definite value. The second stage corresponds to packing, with a duration of about 5 seconds, when the pressure is rap- idly increased and held at a constant level above that at the end of the filling. The third stage, of a much longer duration than the first two, corresponds to cooling and is characterized by a gradual pressure decay. In the case of the runner experiments (Fig. Ib), the first stage, characterized by pressure increasing linearly with time, corresponds to the filling stage of runner with duration 0.15 and 0.2 second, respectively, for diameters of 9.525 x lW3and 1.27 x 10-’meter. On theother hand, the second stage, characterized by a weak overshoot with subsequent constant value, corresponds to contin- uous flow of the melt through the runner for a duration of 0.8-0.9 second. Finally, the third stage, character- ized by a fast pressure decay, corresponds to the long cooling stage following cessation of flow. It is noted that no packing stage is present in the runner experi- ment since the latter corresponds to extrusion of the polymer melt through an open-ended circular die with cold wall.
In addition to molding experiments, the present work has included free and constrained quenching ex- periments performed with PS and poly(methy1 methac- rylate) (PMMA) strips having planar dimensions of 0.05 by 0.05 meter and thickness of 0.0026 meter for PS and 0.003 meter for PMMA. Such samples were removed from the above-mentioned molded strip in the case of
ind Cavity Dimensions for Polystyrene
Mole temp. Melt temp. Avg. velocity Cavity dimension Sample No. (“C) (“C) (meters per second) (w x 2b x L, meters)
1 40 223 0 465 Strip 0.0508 by 0.00254 by
0.48 2 40 224 0 36 Strip
0.0762 by 3 60 247 0.70 0.00381 by 4 60 21 5 0.71
0.456 5 59 228 3.26
Runner 6 42 227 3.26
8 58 246 3.26 length 0.46 9 59 246 2.38 Runner
10 58 21 1 2.38 dia 0.0127 224 2 38 length 0.46 11 60
7 80 228 3.26 dia. 0.009525
2 72 POLYMER ENGINEERING AND SCIENCE, MID-APRIL, 1983, Vol. 23, NO. 5
Orientut ion Deve lopment in the Injection Molding of Amorphous Polymers
31- I
0
I 0 10 20 30 40
t , scc
b
I \ I - - 0 I 2 3 4
t . scc
F i g . 1.11. Pressure truces ut strip entrunce. Curves 1 und2 corre- spond to processing conditions No. 1 and 2 in Tuhle 1 , respec- tiuely. h. Pressure truces ut runnerentrance. Curves 1 und2 cor- respond to processing conditions N o . 5 rind 1 1 in Tuhle 1 , respectively.
PS whereas the PMMA specimens were removed from extruded sheets (Plexiglas G, Rohm and Haas). To eliminate flow prehistory, these PS and P M M A samples were placed in a form and annealed according to the following procedure: 100°C for 24 hours, 130°C and 170°C for two hours each, followed by cooling to below TB' Subsequently, the samples were place in a cup filled with glycerol and the annealing procedure was repeated, followed by free quenching in a con- trolled-temperature water bath. Constrained quenching was performed after annealing between two aluminum plates having thicknesses of 0.00229 meter. To assure a one-dimensional heat transfer in gapwise direction, Teflon frames were placed around the polymer strip.
Birefringence was measured by using an Olympus polarizing microscope. A low-speed rotating diamond saw was used to remove thin sections (d = 0.0004 to 0.002 meter) parallel and perpendicular to the flow di- rection from molded strips at different distances from the cavity entrance for measurement of birefringence An and nzz - nS3, respectively. Two components of bire- fringence have also been measured for the molded run- ners, namely An and nrr - neA being obtained from flat sections cut, respectively, perpendicular to the 8 and x axes with the light path in the microscope being along the 9 and x directions (x is flow direction, r is radial di- rection, 8 is angular coordinate). The methods of com- pensation (Berek compensator) and isochromatic pat- terns (green light) have been used to measure the birefringence distribution in the gapwise and radial di- rections for the strip and runner, respectively. It has been found that the birefringence is independent of specimen thickness. Measurement of the gapwise-
averaged birefringence, <n, , - nsa>, has been carried out by the isochromatic-pattern method using a circular polariscope. The gapwise thermal birefringence An dis- tribution, which has been measured in slices of thick- ness d = 0.0004 to 0.0045 meter removed from quenched strips, has also been found to be independ- ent of specimen thickness in directions parallel and per- pendicular to light path.
RESULTS AND DISCUSSION
Thermally-Induced Birefringence
In order to understand the complicated orientation phenomenon that develops during the injection- molding of polymers, a first step should be to consider the frozen-in birefringence introduced by the fast cool- ing process itself. In particular, such a cooling process gives rise to thermal birefringence in planes parallel to the thickness direction. Experiments have shown that no birefringence appears when light is passed perpen- dicular to the thickness of the strip, thus indicating that the values of birefringence in the other two planes are equal.
Figure 2 shows the distribution of birefringence through the thickness of a freely quenched PS strip for three different initial temperatures and constant quenching temperature. As can be seen, the position of zero birefringence moves toward the surface with in- creasing initial temperature. Furthermore, the bire- fringence has positive and negative values near the sur-
2 3l U z
a
X
C
1
0
-1
- 2
- 3 F i g . 2 . Gupwise birefringence An distribution in freely quenched polystyrene strips with thickness 2h = 0.0026 meter. Curves 1 , 2 , und 3 correspond to quenching temperuture 30°C with initiul temperutures 130,150, und 170°C, respectively. 0 = thickness of slice in direction of light puth (d = 0.001 meter) und in direction perpendicular to light puth (d' = 0.05 meter); 0, x, A, 0 - d = 0.0035 meter, d' = 0.00042,0.0009,0.00225,0.05 me- ter, respectiuely.
273 POLYMER ENGINEERING A N D SCIENCE, MID-APRIL, 1983, Vol. 23, N o . 5
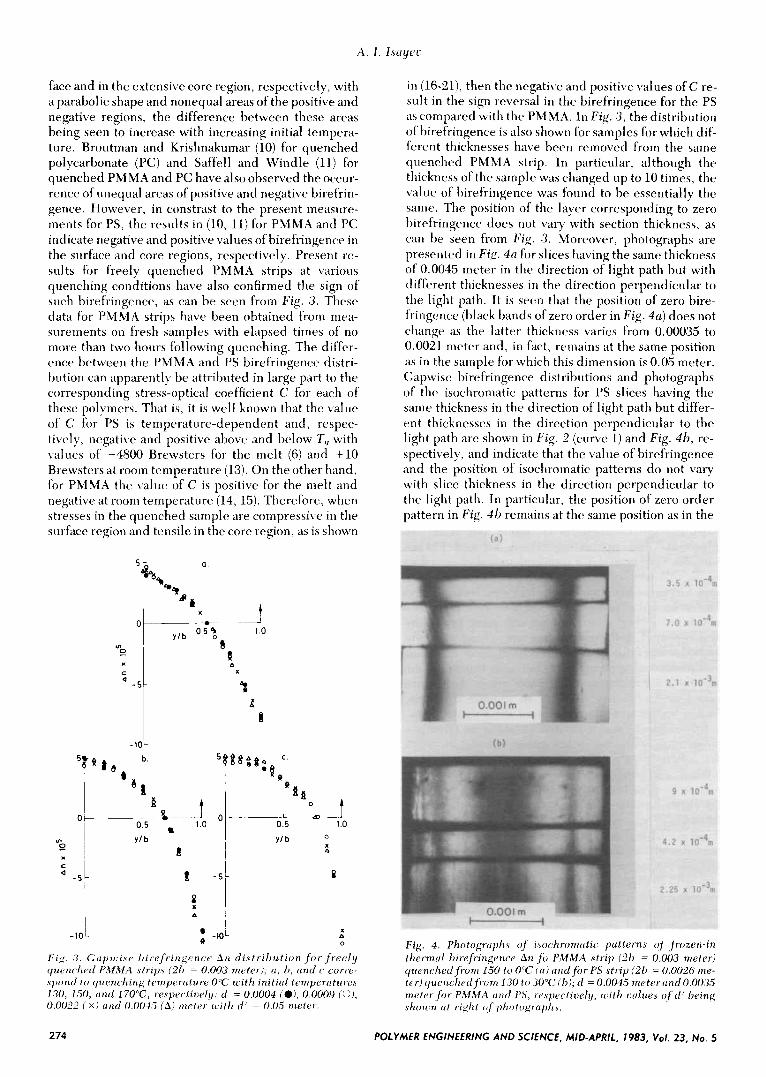
face and in the extensive core region, respectively, with a parabolic shape and nonequal areas of the positive and negative regions, the difference between these areas being seen to increase with increasing initial tempera- ture. Broutman and Krishnakumar (10) for quenched polycarbonate (PC) and Saffell and Windle (11) for quenched PMMA and PC have also observed the occur- rence of uneqiial areas of positive and negative birefrin- gence. However, in constrast to the present measure- ments for PS, the results in (10, 11) for PMMA and PC indicate negative and positive values of birefringence in the surface and core regions, respectively. Present re- sults for freely quenched PMMA strips at various quenching conditions have also confirmed the sign of such birefringence, as can be seen from Fig . 3. These data for PMMA strips have been obtained from mea- surements on fresh samples with elapsed times of no more than two hours following quenching. The differ- ence between the PMMA and PS birefringence distri- bution can apparently be attrihuted in large part to the corresponding stress-optical coefficient C for each of these polymers. That is, it is well known that the value of C for PS is temperature-dependent and, respec- tively, negative and positive above and below T , with values of -4800 Brewsters for the melt (6) and +10 Brewsters at room temperature (13). On the other hand, for PMMA the value of C is positive for the melt and negative at room temperature (14, 15). Therefore, when stresses in the quenched sample are compressive in the surface region and tensile in the core region, as is shown
t
4 - 5
-10 I
0 X
q.
h 8
1.0 v l 0.5 1.0
~ -1OL " L : -10 X A
0
Fig, 3 . Cripttiise hirefringencr A n distri l jutioti f o r f r e e l y ciuenrhed PMMA $trip.s (21) = 0.003 meter); (I, h, arid c corn,- .vpond t o quenching temperciture 0°C wi th initicil tempeniturct 1 3 0 . 150, ( i i d 1 T O T , respecticely; d = 0.0004 (O), 0.0009 ((I), 0.0022 ( X i u i i d 0,0045 ( A ) metrr icith d' = 0.05 meter.
in (16-211, then the negative and positive values of C re- sult in the sign reversal in the birefringence for the PS a s compared with the PMMA. In Fig . 3 , the distribution of birefringence is also shown for samples for which dif- ferent thicknesses have been removed from the same quenched PMMA strip. In particular, although the thickness of the sample was changed up to 10 times, the value of birefringence was found to be essentially the same. The position of the layer corresponding to zero birefringence does not vary with section thickness, as can be seen from F i g . 3. Moreover, photographs are presented in Fig . 40 for slices having the same thickness of 0.0045 meter in the direction of light path but with different thicknesses in the direction perpendicular to the light path. It is seen that the position of zero bire- fringence (black bands of zero order in Fig. 4u) does not change as the latter thickness varies from 0.00035 to 0.0021 meter and, in fact, remains at the same position a s in the sample for which this dimension is 0.05 meter. Gapwise birefringence distributions and photographs of the isochromatic patterns for PS slices having the same thickness in the direction of light path but differ- ent thicknesses in the direction perpendicular to the light path are shown in F i g . 2 (curve 1) and Fig. 417, re- spectively, and indicate that the value of birefringence and the position of isochromatic patterns do not vary with slice thickness in the direction perpendicular to the light path. In particular, the position of zero order pattern in Fig . 411 remains at the same position as in the
Fig . 4 . Photogruphs of i.mchronwtic patterns o j frozen-in thermal birefriiigc.iice A n fo P M M A strip (211 = 0.003 meter) quenched from 150 to 0°C ( 1 1 ) rrridfior-PS s f r ip (21) = 0.0026 me- t c r ) queiidwtl f rom 130 to 30°C (17); d = 0.0045 metercind0.0035 meter f o r PMkf.4 r i r i t l P S , rc~.,pecticel~y, zcith onlues of d' being .vlio i s r i ri t right of p h o togr(ip1is.
274 POLYMER ENGINEERING AND SCIENCE, MID-APRIL, 1983, Vol. 23, NO. 5
Orientation Deuelopment in the Injection Molding of Amorphous Polymers
sample for which dimension d' = 0.05 meter. On the other hand, in the measurements of Saffell and Windle (11), the value of birefringence was found to be depend- ent upon this thickness dimension for values larger than 0.001 meter and independent for smaller values. Thus, Saffell and Windle have introduced the concept of "re- sidual birefringence," which remains in the quenched polymer slice at thicknesses less than 0.001 meter. A possible cause of such an effect in their experiments is unknown. Finally, it might be noted that the birefrin- gence measurements of injection-molded strips, re- ported below were also found to be independent of slice thickness as in the present measurements for the quenched strip.
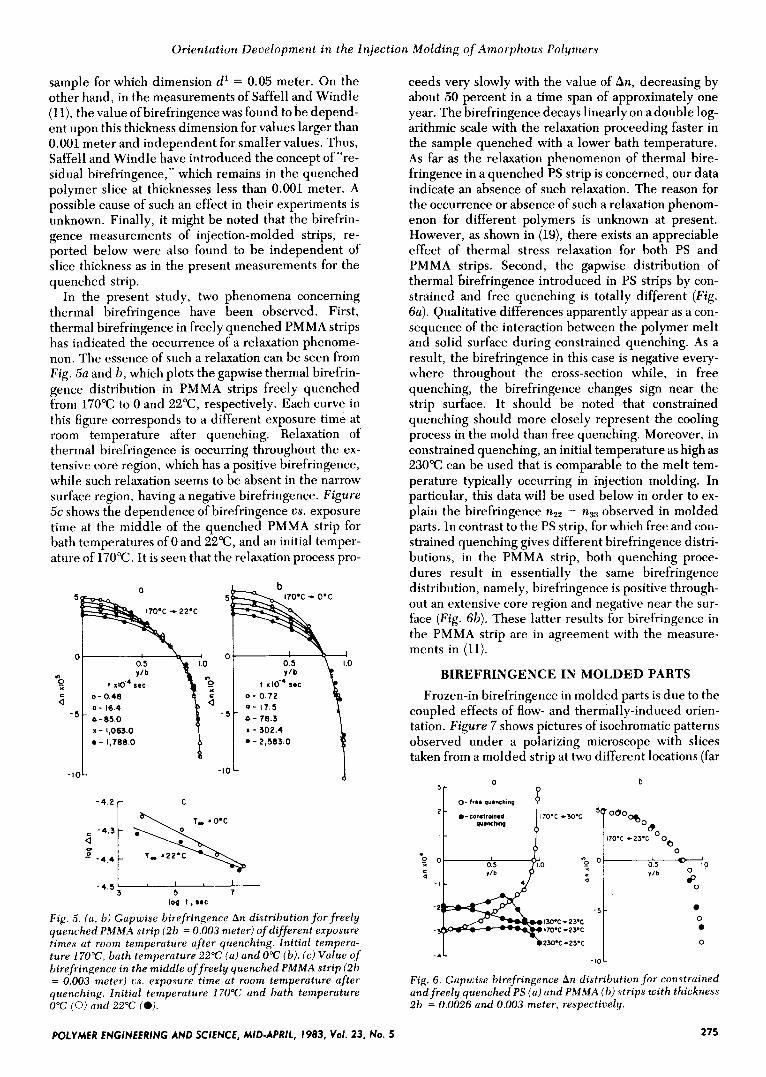
In the present study, two phenomena concerning thermal birefringence have been observed. First, thermal birefringence in freely quenched PMMA strips has indicated the occurrence of a relaxation phenome- non. The essence of such a relaxation can be seen from F i g . 5a and h, which plots the gapwise thermal birefrin- gence distribution in PMMA strips freely quenched from 170°C to 0 and 22"C, respectively. Each curve in this figure corresponds to a different exposure time at room temperature after quenching. Relaxation of thermal birefringence is occurring throughout the ex- tensive core region, which has a positive birefringence, while such relaxation seems to be absent in the narrow surface region, having a negative birefringence. Figure 5c shows the dependence of birefringence US. exposure time at the middle of the quenched PMMA strip for bath temperatures of 0 and 22"C, and an initial temper- ature of 170°C. It is seen that the relaxation process pro-
" 1 b 5 5
0 n 0 " I 0.5
I a - 11788.0 b I *-2,583.0
-10 1 -4.2 r C
i l -10
-4.5 3 5 log t , sac
F i g . 5 . ( u , h) Gapwise birefringence An distri..Ation for free., quenched PMMA strip (2b = 0.003 meter) of dijferent exposure times at room temperuture ufter quenching. Initid temperu- ture 1 70°C, buth temperuture 22°C ( u ) und 0°C (b). ( c ) Value of birefringence in the middle of freely quenched PMMA strip (2b = 0.003 meter) us. exposure time ut room temperuture ufter quenching. Initid temperuture 170°C und buth temperuture 0°C (0) and 22°C (0).
ceeds very slowly with the value of An, decreasing by about 50 percent in a time span of approximately one year. The birefringence decays linearly on a double log- arithmic scale with the relaxation proceeding faster in the sample quenched with a lower bath temperature. As far as the relaxation phenomenon of thermal bire- fringence in a quenched PS strip is concerned, our data indicate an absence of such relaxation. The reason for the occurrence or absence of such a relaxation phenom- enon for different polymers is unknown at present. However, as shown in (19), there exists an appreciable effect of thermal stress relaxation for both PS and PMMA strips. Second, the gapwise distribution of thermal birefringence introduced in PS strips by con- strained and free quenching is totally different (Fig . 6a). Qualitative differences apparently appear as a con- sequence of the interaction between the polymer melt and solid surface during constrained quenching. As a result, the birefringence in this case is negative every- where throughout the cross-section while, in free quenching, the birefringence changes sign near the strip surface. It should be noted that constrained quenching should more closely represent the cooling process in the mold than free quenching. Moreover, in constrained quenching, an initial temperature as high as 230°C can be used that is comparable to the melt tem- perature typically occurring in injection molding. In particular, this data will be used below in order to ex- plain the birefringence nZ2 - n33 observed in molded parts. In contrast to the PS strip, for which free and con- strained quenching gives different birefringence distri- butions, in the PMMA strip, both quenching proce- dures result in essentially the same birefringence distribution, namely, birefringence is positive through- out an extensive core region and negative near the sur- face ( F i g . 6b). These latter results for birefringence in the PMMA strip are in agreement with the measure- ments in (11).
BIREFRINGENCE IN MOLDED PARTS Frozen-in birefringence in molded parts is due to the
coupled effects of flow- and thermally-induced orien- tation. Figure 7 shows pictures of isochromatic patterns observed under a polarizing microscope with slices taken from a molded strip at two different locations (far
b
1M.C * 23.C 170-c -23-c
2M.C-23.C
0
0
F i g . 6 . Gupwise birefringence An distribution for constrained und freely quenched P S ( u ) und PMMA ( h ) strips with thickness 2b = 0.0026 und 0.003 meter, respectively.
POLYMER ZNGINEERING AND SCIENCE, MID-APRIL, 1983, VOI. 23, NO. 5 275
A. 1. IsuyeG
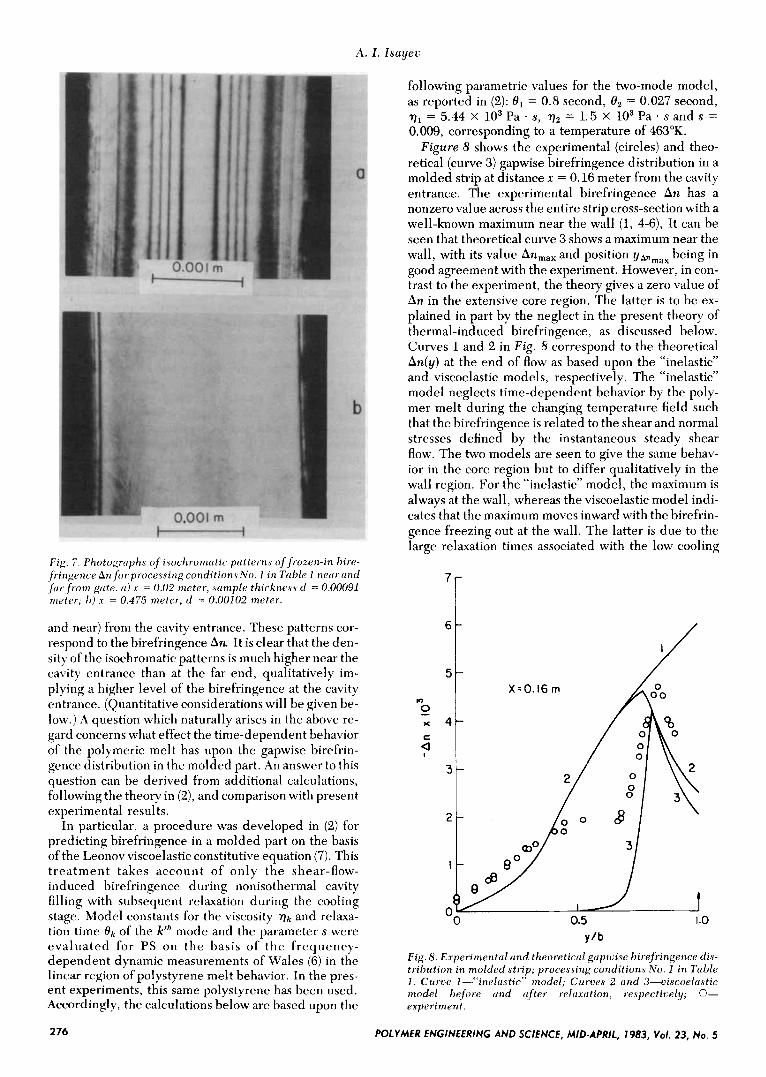
Fig. 7. Photogniphr. ($ isochroniatic pcitterns of frozen-in bire- fringence An for processing conditions N o . 1 in Tuble 1 necirand fur f rom gcite. (1) s = 0.02 meter, sumple thickness ct = 0.00091 meter; 1)) s = 0.475 meter, d = 0.00102 meter.
and near) from the cavity entrance. These patterns cor- respond to the birefringence An. It is clear that the den- sity of the isochromatic patterns is much higher near the cavity entrance than at the far end, qualitatively im- plying a higher level of the birefringence at the cavity entrance. (Quantitative considerations will be given be- low.) A question which naturally arises in the above re- gard concerns what effect the time-dependent behavior of the polymeric melt has upon the gapwise birefrin- gence distribution in the molded part. An answer to this question can be derived from additional calculations, following the theory in (2), and comparison with present experimental results.
In particular, a procedure was developed in (2) for predicting birefringence in a molded part on the basis of the Leonov viscoelastic constitutive equation (7). This t reatment takes account of only the shear-flow- induced birefringence during nonisothermal cavity filling with subsequent relaxation during the cooling stage. Model constants for the viscosity q k and relaxa- tion time O k of the kth mode and the parameter s were evaluated for PS on t h e basis of t h e frequency- dependent dynamic measurements of Wales (6) in the linear region of polystyrene melt behavior. In the pres- ent experiments, this same polystyrene has been used. Accordingly, the calculations below are based upon the
following parametric values for the two-mode model, as reported in (2): O1 = 0.8 second, O2 = 0.027 second, ql = 5.44 x lo3 Pa * s, qz = 1.5 x lo3 Pa s and s = 0.009, corresponding to a temperature of 463°K.
Figure 8 shows the experimental (circles) and theo- retical (curve 3) gapwise birefringence distribution in a molded strip at distance x = 0.16 meter from the cavity entrance. The experimental birefringence An has a nonzero value across the entire strip cross-section with a well-known maximum near the wall (1, 4-6), It can be seen that theoretical curve 3 shows a maximum near the wall, with its value Anmax and position yanma, being in good agreement with the experiment. However, in con- trast to the experiment, the theory gives a zero value of An in the extensive core region. The latter is to be ex- plained in part by the neglect in the present theory of thermal-induced birefringence, as discussed below. Curves 1 and 2 in Fig . 8 correspond to the theoretical An(y) at the end of flow as based upon the “inelastic” and viscoelastic models, respectively. The “inelastic” model neglects time-dependent behavior by the poly- mer melt during the changing temperature field such that the birefringence is related to the shear and normal stresses defined by the instantaneous steady shear flow. The two models are seen to give the same behav- ior in the core region but to differ qualitatively in the wall region. For the “inelastic” model, the maximum is always at the wall, whereas the viscoelastic model indi- cates that the maximum moves inward with the birefrin- gence freezing out at the wall. The latter is due to the large relaxation times associated with the low cooling
fn = I x 4
Y/b Fig. 8 . Experimental und theoreticcil gupwise birefringence dis- tribution in molded strip; processing conditions No. 1 in Table I . Curtie I-“inelustic” model; Curves 2 urid 3-viscoelastic model before und ufter reluxution, respectitiely; 0- experiment.
276 POLYMER ENGINEERING AND SCIENCE, MID-APRIL, 1983, voi. 23, N ~ . 5
Orientution Development in the Injection Molding of Amorphous Polymers
temperature. Correspondingly, the two models give the same An(y) in the core due to small relaxation times at the high melt temperature. These presented results indicate the importance of unsteadiness upon flow bi- refringence during cavity filling, although this effect has been found to have little influence on the pressure gradient (2).
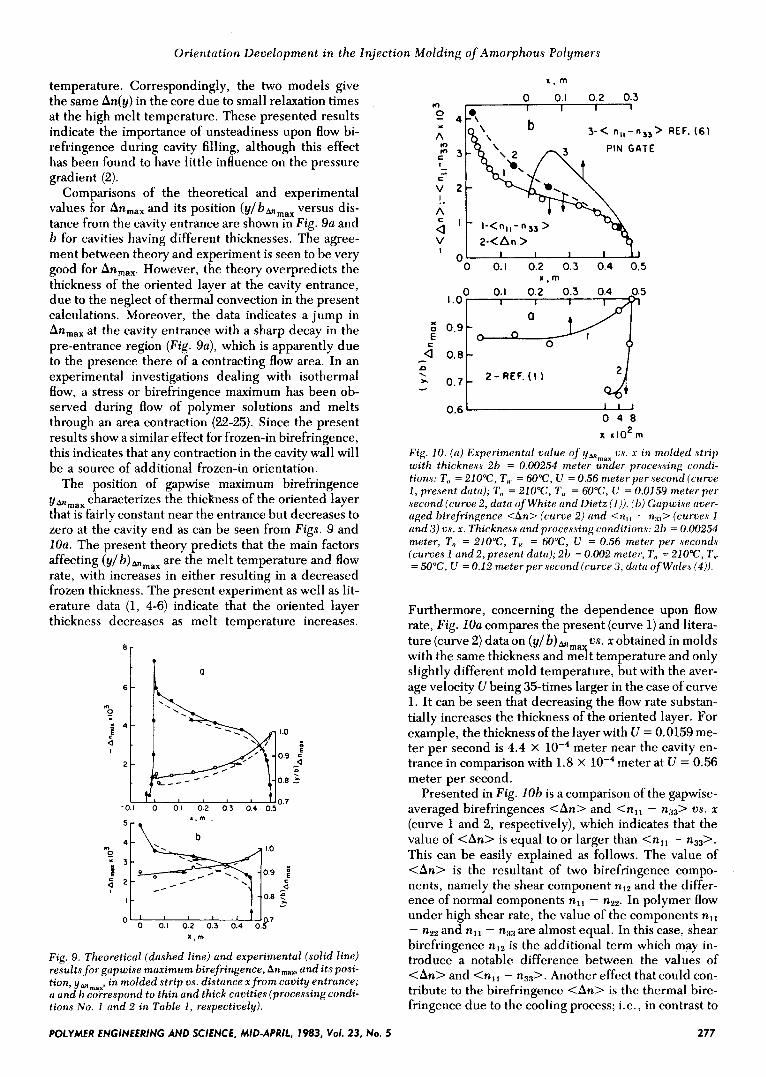
Comparisons of the theoretical and experimental values for Anmax and its position (y/bmma, versus dis- tance from the cavity entrance are shown in Fig. 9a and b for cavities having different thicknesses. The agree- ment between theory and experiment is seen to be very good for Anmax However, the theory overpredicts the thickness of the oriented layer at the cavity entrance, due to the neglect of thermal convection in the present calculations. Moreover, the data indicates a jump in Anmax at the cavity entrance with a sharp decay in the pre-entrance region (Fig. 9a), which is apparently due to the presence there of a contracting flow area. In an experimental investigations dealing with isothermal flow, a stress or birefringence maximum has been ob- served during flow of polymer solutions and melts through an area contraction (22-25). Since the present results show a similar effect for frozen-in birefringence, this indicates that any contraction in the cavity wall will be a source of additional frozen-in orientation.
The position of gapwise maximum birefringence ymmax characterizes the thickness of the oriented layer that is fairly constant near the entrance but decreases to zero at the cavity end as can be seen from Figs. 9 and IOU. The present theory predicts that the main factors affecting ( t ~ / b ) ~ , , , are the melt temperature and flow rate, with increases in either resulting in a decreased frozen thickness. The present experiment as well as lit- erature data (1, 4-6) indicate that the oriented layer thickness decreases as melt temperature increases.
0.9 c . - . n . b,l.o ~
I - Q - - - 0.8 5 a
0.7 0 0.1 0.2 0 .3 0.4 0.5
X . m
Fig. 9. Theoreticul (dashed line) and experimental (solid line) results for gupwise muximum birefringence, An,,, und its posi- tion, yanmai in molded strip us. distance x from cavity entrunce; a and b correspond to thin and thick cavities (processing condi- tions No. 1 und 2 in Table I , respectively).
POLYMER ENGINEERING AND SCIENCE, MID-APRIL, 1983, Vol. 23, NO. 5
m
0 4
A
cz 3 I
C
- * v 2 !-
A = I
V a
0 0.1 0.2 0.3
3-< nIl-n3,>
PIN GATE
0 0.1 0.2 0.3 0.4 0.5 x , m
0 0.1 0.2 0.3 0.4 -0.5 1.01 I 1 I 1 A1
REF. (6)
0.6 1 1 1
0 4 8 x r1O2m
F i g . 10. ( ( 1 ) Experimentol value ofyBtmax w. x in molded strip with thickness 2h = 0.00254 meter under proceasing condi- tions: T,, = 210°C, T,. = 60T, U = 0.56 meter per second (curve 1 , present data); T,, = 210"C, T,. = 60T, U = 0.0159 meter per .second (curve 2, dutu of White and Dietz ( 1 ) ) . (1)) Gopwize w e r - aged birefringence <An> (curue 2 ) und <n , , - nnR> (curues I and3) us. x. Thickness und processing conditions: 211 = 0.00254 meter, T,, = 210°C, T,,. = 60T, U = 0.56 meter per .second.s (curves 1 und 2, present datu); 2b = 0.002 meter, T,, = 210"C, T,,. = SOT, U = 0.12 meter per second (curve 3, dutu ofWo1e.s (4) ) .
Furthermore, concerning the dependence upon flow rate, Fig. 10a compares the present (curve 1) and litera- ture (curve 2) data on (y/b)&,, vs. x obtained in molds with the same thickness and melt temperature and only slightly different mold temperature, but with the aver- age velocity U being 35-times larger in the case of curve 1. It can be seen that decreasing the flow rate substan- tially increases the thickness of the oriented layer. For example, the thickness of the layer with U = 0.0159 me- ter per second is 4.4 x meter near the cavity en- trance in comparison with 1.8 x meter at U = 0.56 meter per second.
Presented in Fig. lob is a comparison of the gapwise- averaged birefringences <An> and <n, , - n3,> vs. x (curve 1 and 2, respectively), which indicates that the value of <An> is equal to or larger than <n,, - n33>. This can be easily explained as follows. The value of <An> is the resultant of two birefringence compo- nents, namely the shear component nI2 and the differ- ence of normal components nll - nzz. In polymer flow under high shear rate, the value of the components n,, - nz2 and n,, - n3, are almost equal. In this case: shear birefringence nI2 is the additional term which may in- troduce a notable difference between the values of <An> and <rill - n3,>. Another effect that could con- tribute to the birefringence <An> is the thermal bire- fringence due to the cooling process; i.e., in contrast to
2 77
A. I. 1 . s ~ yeu
n , , - nZ2, the birefringence rill - n3, due to cooling should be zero.
It is interesting to compare the present results for <rill - n3,> with that of Wales (6), shown as curve 3 in Fig. 10b. This comparison is for the same melt tempera- ture of 210°C but with other conditions being different in the two experiments. Accordingly, the comparison is to be viewed on a qualitative basis. In particular, the re- sults from (6) indicate that <rill - n,+ us. I passes through a maximum near the cavity entrance whereas, in the present experiment, the sharp maximum has ap- parently moved upstream of the cavity entrance. Such a difference can be explained on the basis of gate geome- try, namely a pin-gate cavity in (6) as compared with a straight-gate cavity with contraction area in the present experiment. It is clear that a pin-gate cavity creates fa- vorable conditions for relaxation, whereas the straight gate with contraction entrance is the source of local stress concentration.
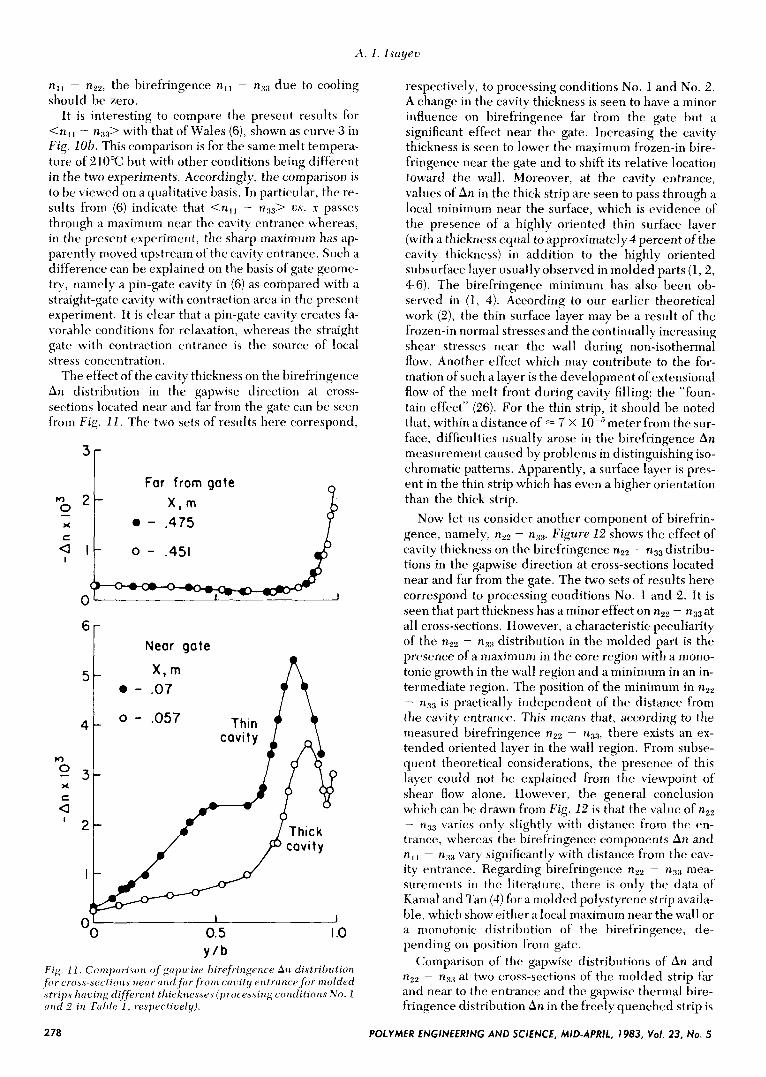
The effect of the cavity thickness on the birefringence An distribution in the gapwise direction at cross- sections located near and far from the gate can be seen from Fig . 11. The two sets of results here correspond,
’r I Far from gate n
B O - .451
‘[ Near gate
1 o - .057 4
*)
0 - X
t a
I
n Thin i i
J
OO IF 0.5 I .o Y / b
Fig . 11, Compcirison of gcipwise birefringence A n distrihution f o t - cror-.rectiort.s iienr and f ( i r f roni ccicity entrcince for molded .strip$ h(icing different t1iicknese.u (p i -~ce . s~s ing conditionn N o . 1 c i r i c i 2 i n Tcihle I , respectioely).
respectively, to processing conditions No. 1 and No. 2 . A change in the cavity thickness is seen to have a minor influence on birefringence far from the gate but a significant effect near the gate. Increasing the cavity thickness is seen to lower the maximum frozen-in bire- fringence near the gate and to shift its relative location toward the wall. Moreover, at the cavity entrance, values of An in the thick strip are seen to pass through a local minimum near the surface, which is evidence of the presence of a highly oriented thin surface layer (with a thickness equal to approximately4 percent of the cavity thickness) in addition to the highly oriented subsurface layer usually observed in molded parts (1,2, 4-6). The birefringence minimum has also been ob- served in (1, 4). According to our earlier theoretical work (Z) , the thin surface layer may be a result of the frozen-in normal stresses and the continually increasing shear stresses near the wall during non-isothermal flow. Another effect which may contribute to the for- mation of such a layer is the development of extensional flow of the melt front during cavity filling: the “foun- tain effect” (26). For the thin strip, it should be noted that, within a distance of = 7 x meter from the sur- face, difficulties usually arose in the birefringence An measurement caused by problems in distinguishing iso- chromatic patterns. Apparently, a surface layer is pres- ent in the thin strip which has even a higher orientation than the thick strip.
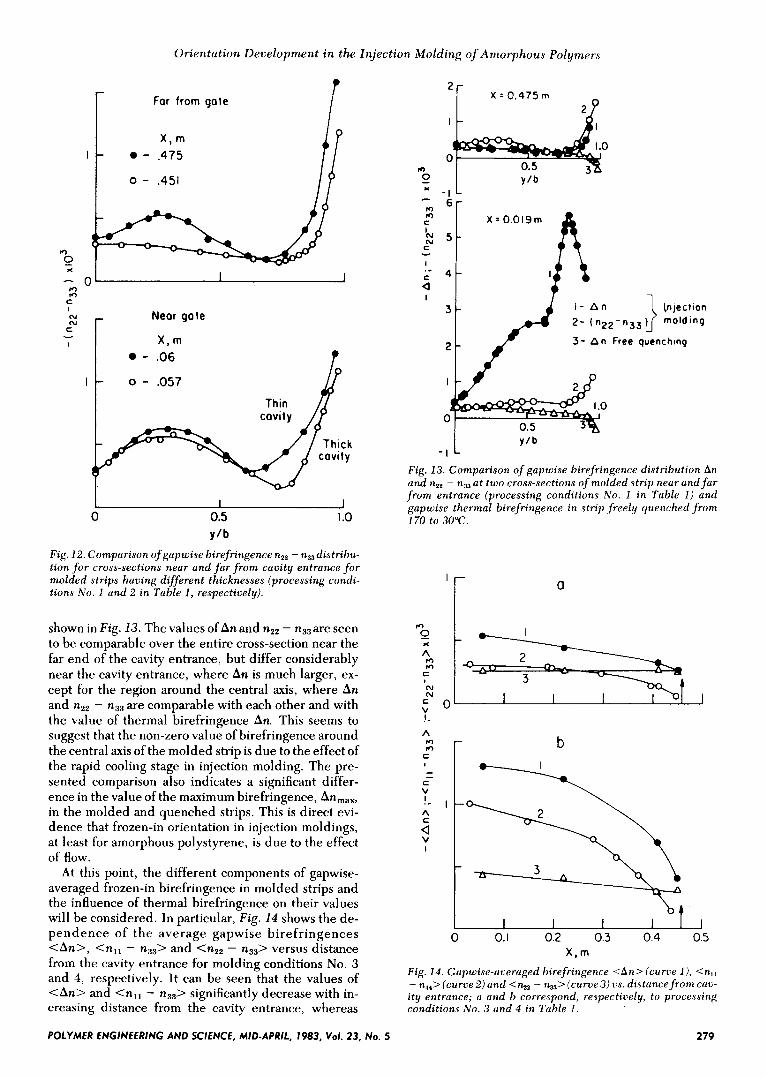
Now let us consider another component of birefrin- gence, namely, nzz - n33. Figure 12 shows the effect of cavity thickness on the birefringence nzz - n3, distribu- tions in the gapwise direction at cross-sections located near and far from the gate. The two sets of results here correspond to processing conditions No. 1 and 2. It is seen that part thickness has a minor effect on nz2 - r ~ , ~ a t all cross-sections. However, a characteristic peculiarity of the nz2 - n3, distribution in the molded part is the presence of a maximum in the core region with a mono- tonic growth in the wall region and a minimum in an in- termediate region. The position of the minimum in nz2 - n3, is practically independent of the distance from the cavity entrance. This means that, according to the measured birefringence nz2 - n3,, there exists an ex- tended oriented layer in the wall region. From subse- quent theoretical considerations, the presence of this layer could not be explained from the viewpoint of shear flow alone. However, the general conclusion which can be drawn from Fig . 12 is that the value of nZ2 - n3, varies only slightly with distance from the en- trance, whereas the birefringence components An and nl1 - vary significantly with distance from the cav- ity entrance. Regarding birefringence nz2 - n3, mea- surements in the literature, there is only the data of Kamal and Tan (4) for a molded polystyrene strip availa- ble, which show either a local maximum near the wall or a monotonic distribution of the birefringence, de- pending on position from gate.
Comparison of the gapwise distributions of An and nz2 - n33 at two cross-sections of the molded strip far and near to the entrance and the gapwise thermal bire- fringence distribution An in the freely quenched strip is
278 POLYMER ENGINEERING AND SCIENCE, MID-APRIL, 1983, Vol. 23, No. 5
Orientation Development in the Injection Molding of Amorphous Polymers
lo 0 X - m m c I N N c I 1
Far from gate
XI l-n I - 0 - .475
0 - .451
I I
Near gate
- .06
L 1 1 0 0.5 I .o
Y/b Fig. 12. Comparison of gapwise birefringence nZ2 - n,,distrihu- tion f o r cross-sections near and fa r f rom cavity entrance f o r molded strips having dyferent thicknesses (processing condi- tions No. 1 and 2 in Table 1 , respectively).
shown in Fig. 13. The values of An and nZ2 - n33are seen to be comparable over the entire cross-section near the far end of the cavity entrance, but differ considerably near the cavity entrance, where An is much larger, ex- cept for the region around the central axis, where An and nZ2 - n33 are comparable with each other and with the value of thermal birefringence An. This seems to suggest that the non-zero value of birefringence around the central axis of the molded strip is due to the effect of the rapid cooling stage in injection molding. The pre- sented comparison also indicates a significant differ- ence in the value of the maximum birefringence, An,,,, in the molded and quenched strips. This is direct evi- dence that frozen-in orientation in injection moldings, at least for amorphous polystyrene, is due to the effect of flow.
At this point, the different components of gapwise- averaged frozen-in birefringence in molded strips and the influence of thermal birefringence on their values will be considered. In particular, Fig. 14 shows the de- pendence of the average gapwise birefringences <An>, <n,, - n3,> and <nz2 - nB3> versus distance from the cavity entrance for molding conditions No. 3 and 4, respectively. It can be seen that the values of <An> and <rill - n3,> significantly decrease with in- creasing distance from the cavity entrance, whereas
0 0
m 0 - - 1 L c
m m C
AI N C
I
C
- . - Q I
6 r X = 0.019m
4
I
0 0
Y/b - I 1
Fig. 13. Comparison of gapwise birefringence distribution An and nZ2 - nS at two cross-sections of molded strip near and f a r f rom entrance (processing conditions No. 1 in Table I) and gapwise thermal birefringence in strip freely quenched from 170 to 30°C.
'i a
c N N c n v w !- A
C z r - - c V
A !- I
a c
v I
b
I I I I I I I 0 0. I 0.2 0.3 0.4 0.5
x, m Fig. 14. Gapwise-averaged birefringence <An> (curve l ) , <nl, - n,,> (curve2) and <%* - n3,> (curve 3) cs. distance f rom cav- ity entrance; a and b correspond, respectiuely, to processing conditions No. 3 and 4 in Table I .
POLYMER ENGINEERING AND SCIENCE, MID-APRIL, 1983, Vol. 23, No. 5 279
A. 1. lsciyec
<nzz - nBB> is fairly independent or only weakly de- pendent upon x. Values of <An> at any cross-section are seen to be higher than the values of <rill - n3,>. This is mainly due to the contribution of the shear inlz) and thermal birefringence in An and an absence of such an effect in <rill - n3,> which, at high shear rates, be- comes equal to <rill - nZz>, another component of the birefringence <An>. Values of <nz2 - n3,>, at the cav- ity entrance are lower than values of <An> or <rill - n3B> while, at the far end of the cavity, <nzz - n3,> becomes larger than <n,, - nB3> and comparable to <An>. At the cavity entrance, the flow effect on bire- fringence is dominant and it is well known (6) that the flow birefringence nZ2 - n3, is much smaller than the flow birefringence for An or nll - n3,. On the other hand, at the far end of the cavity the thermal effect on birefringence is prevailing and the thermal birefrin- gence An is dominant and becomes equal to nZ2 - n3, while n,, - n3, becomes zero.
The influence of melt temperature on the gapwise- averaged birefringences <An>, <rill - n33> and <nzz - n,,> can be seen by comparing corresponding curves in Figs . 14a and 14b. In general, increasing the melt temperature decreases all components of birefrin- gence. This is mainly due to a lower flow birefringence during cavity filling and also a faster relaxation of flow birefringence after mold filling at higher tempera- tures. On the other hand, increasing the melt tempera- ture should increase the level of birefringence due to thermal effects (see Fig. 2 ) . However, since the thermal birefringence contributes only a small portion to <An> in the gate region and has no effect on <rill - n3,> at all, these values show a more marked decline with in- creasing melt temperature than does <nzz - n&, for which the thermal birefringence, as will be seen below, contributes a significant portion. Increasing the melt temperature also significantly decreases the value of the birefringence maximum Anmax in the gapwise direc- tion and moves its position, ( ~ / b ) ~ ~ , , , ~ ~ , towards the wall. On the other hand, increasing the mold tempera- ture slightly decreases the gapwise-averaged birefrin- gence components <An>, <rill - nB3> together with the maximum of birefringence An in the gapwise direc- tion with its position, ( z J / ~ ) ~ ~ ~ ~ ~ , being moved slightly closer to the wall.
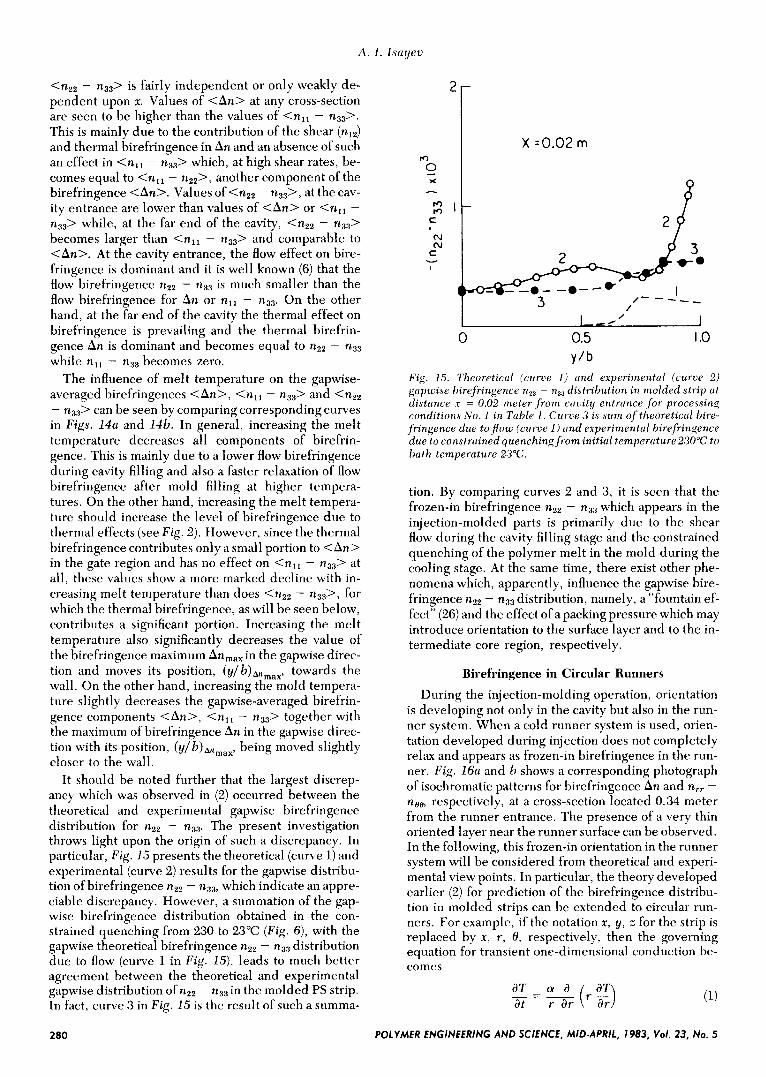
It should be noted further that the largest discrep- ancy which was observed in (2) occurred between the theoretical and experimental gapwise birefringence distribution for nZ2 - n3,. The present investigation throws light upon the origin of such a discrepancy. In particular, Fig. 15 presents the theoretical (curve 1) and experimental (curve 2) results for the gapwise distribu- tion of birefringence nZ2 - n3,, which indicate an appre- ciable discrepancy. However, a summation of the gap- wise birefringence distribution obtained in the con- strained quenching from 230 to 23°C (Fig . 6 ) , with the gapwise theoretical birefringence nZ2 - nB3 distribution due to flow (curve 1 in Fig . 15), leads to much better agreement between the theoretical and experimental gapwise distribution of nZ2 - n3, in the molded PS strip. In fact, curve 3 in Fig. 15 is the result of such a summa-
m 0 X
m rr)
C , N N c Y
I
/ I I 0 1 0 0.5 I .o
Y 'b Fig. 15. Theoretical (curve 1 ) und experimentul (curve 2 ) gapwise birefringence nZ2 - n:)3 distribution in molded strip cit distance x = 0.02 meter f rom ccivity entrunce f o r processing conditions N o . 1 in Table 1 . Curtie 3 i s sum of theoreticul bire- fringence due t o j o w (curwe I) und experimentul birefringence due to construined quenching from initiul temperuture 230°C to bath temperuture 23°C.
tion. By comparing curves 2 and 3 , it is seen that the frozen-in birefringence nZ2 - n3, which appears in the injection-molded parts is primarily due to the shear flow during the cavity filling stage and the constrained quenching of the polymer melt in the mold during the cooling stage. At the same time, there exist other phe- nomena which, apparently, influence the gapwise bire- fringence n22 - nB3 distribution, namely, a "fountain ef- fect" (26) and the effect of a packing pressure which may introduce orientation to the surface layer and to the in- termediate core region, respectively.
Birefringence in Circular Runners
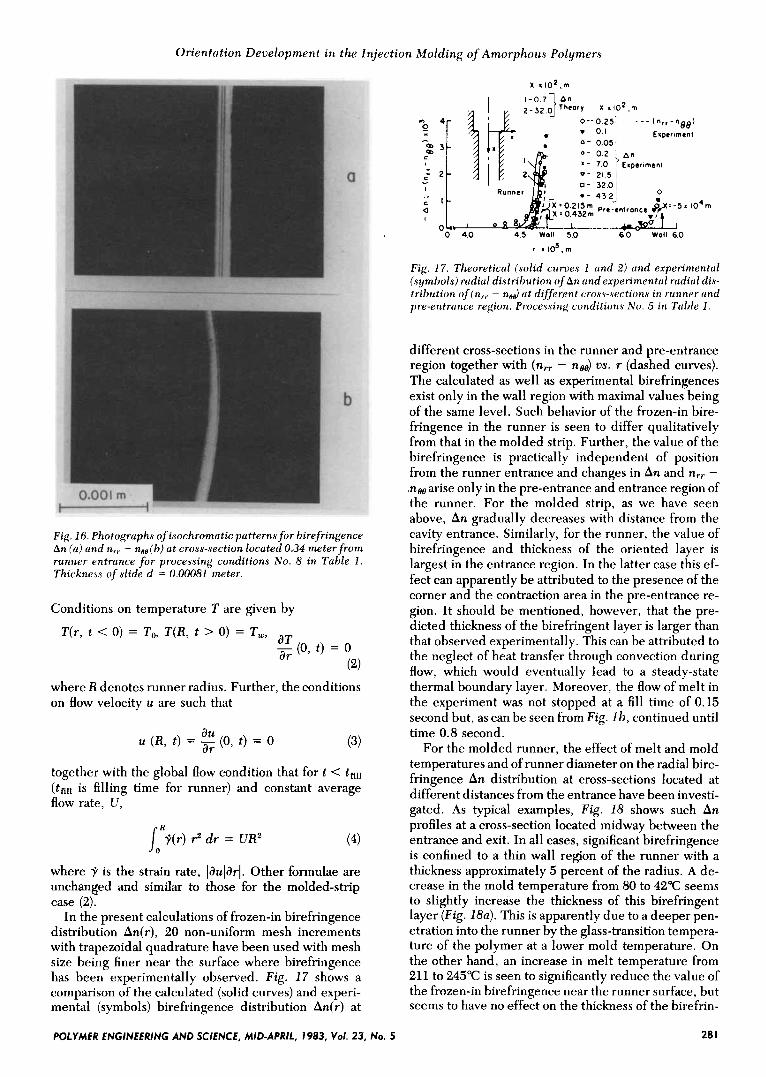
During the injection-molding operation, orientation is developing not only in the cavity but also in the run- ner system. When a cold runner system is used, orien- tation developed during injection does not completely relax and appears as frozen-in birefringence in the run- ner. Fig. 16a and b shows a corresponding photograph of isochromatic patterns for birefringence An and nrr - noo, respectively, at a cross-section located 0.34 meter from the runner entrance. The presence of a very thin oriented layer near the runner surface can be observed. In the following, this frozen-in orientation in the runner system will be considered from theoretical and experi- mental view points. In particular, the theory developed earlier (2) for prediction of the birefringence distribu- tion in molded strips can be extended to circular run- ners. For example, if the notation x, y, z for the strip is replaced by x, r, 19, respectively. then the governing equation for transient one-dimensional conduction be- comes
280 POLYMER ENGINEERING AND SCIENCE, MID-APRIL, 1983, Vol. 23, NO. 5
Orientut ion Deve lopment in the lnject ion Molding of Amorphous Polymers
Fig. 16. Photographs of isochromutic putternsfor birefringence An (u) und n,, - noo(b) ut cross-section locuted 0.34 meter from runner entrunce for processing conditions No. 8 in Tuhle I. Thickness of slide d = 0.00081 meter.
Conditions on temperature T are given by
where R denotes runner radius. Further, the conditions on flow velocity u are such that
(3) au
u ( R , t ) = - (0, t ) = 0 d r
together with the global flow condition that for t < tfin (tn,, is filling time for runner) and constant average flow rate, U ,
lo..y(r) r 2 dr = UP (4)
where 7 is the strain rate, laularl. Other formulae are unchanged and similar to those for the molded-strip case (2).
In the present calculations of frozen-in birefringence distribution An(r), 20 non-uniform mesh increments with trapezoidal quadrature have been used with mesh size being finer near the surface where birefringence has been experimentally observed. Fig. 17 shows a comparison of the calculated (solid curves) and experi- mental (symbols) birefringence distribution An(r) at
+ OO ‘ t 4.0 4.5 Wall 5 0 6.0 Wall 6.0
I . I O ~ . ~
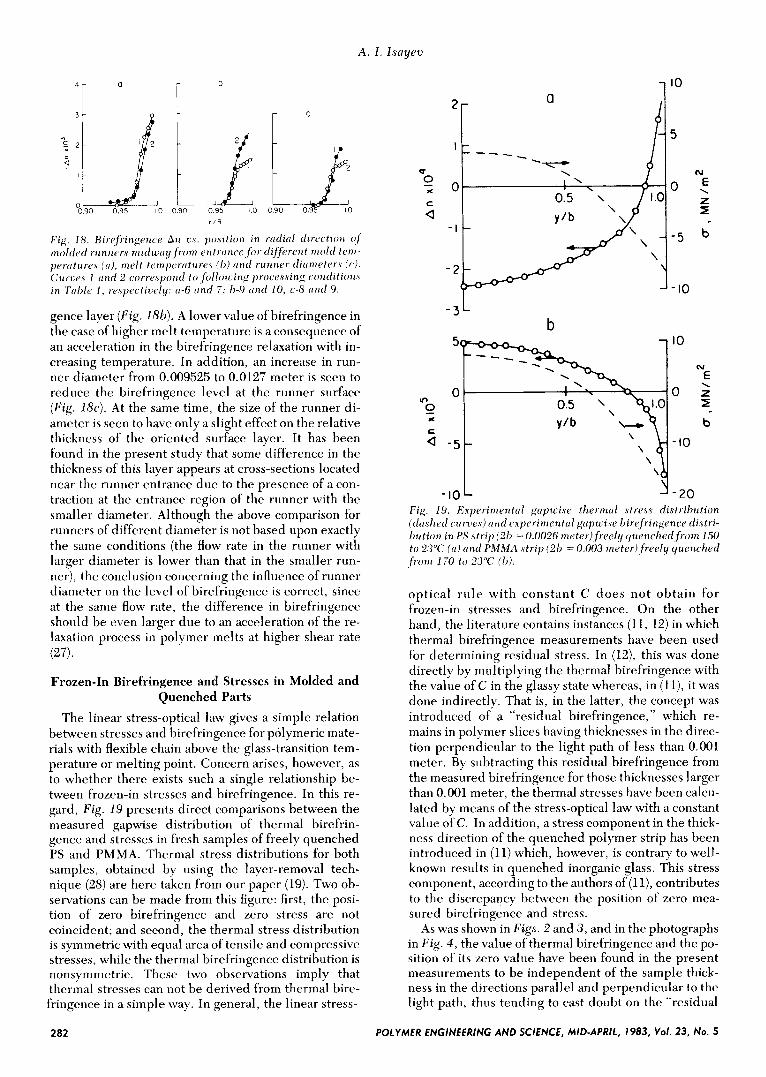
Fig. 17. Theoreticcil (solid curue.s 1 cind 2) and experimental (symbols) rcidicil distribution of An und experimentcrl riidicil dis- tribution of(n,, - nee) ( i t different cross-sections in runner cind pre-entrance region. Processing conditions N o . 5 in Table 1 .
different cross-sections in the runner and pre-entrance region together with (n,, - nee) vs. r (dashed curves). The calculated as well as experimental birefringences exist only in the wall region with maximal values being of the same level. Such behavior of the frozen-in bire- fringence in the runner is seen to differ qualitatively from that in the molded strip. Further, the value of the birefringence is practically independent of position from the runner entrance and changes in An and n,, - ,neearise only in the pre-entrance and entrance region of the runner. For the molded strip, as we have seen above, An gradually decreases with distance from the cavity entrance. Similarly, for the runner, the value of birefringence and thickness of the oriented layer is largest in the entrance region. In the latter case this ef- fect can apparently be attributed to the presence of the corner and the contraction area in the pre-entrance re- gion. It should be mentioned, however, that the pre- dicted thickness of the birefringent layer is larger than that observed experimentally. This can be attributed to the neglect of heat transfer through convection during flow, which would eventually lead to a steady-state thermal boundary layer. Moreover, the flow of melt in the experiment was not stopped at a fill time of 0.15 second but, as can be seen from Fig. 1 b, continued until time 0.8 second.
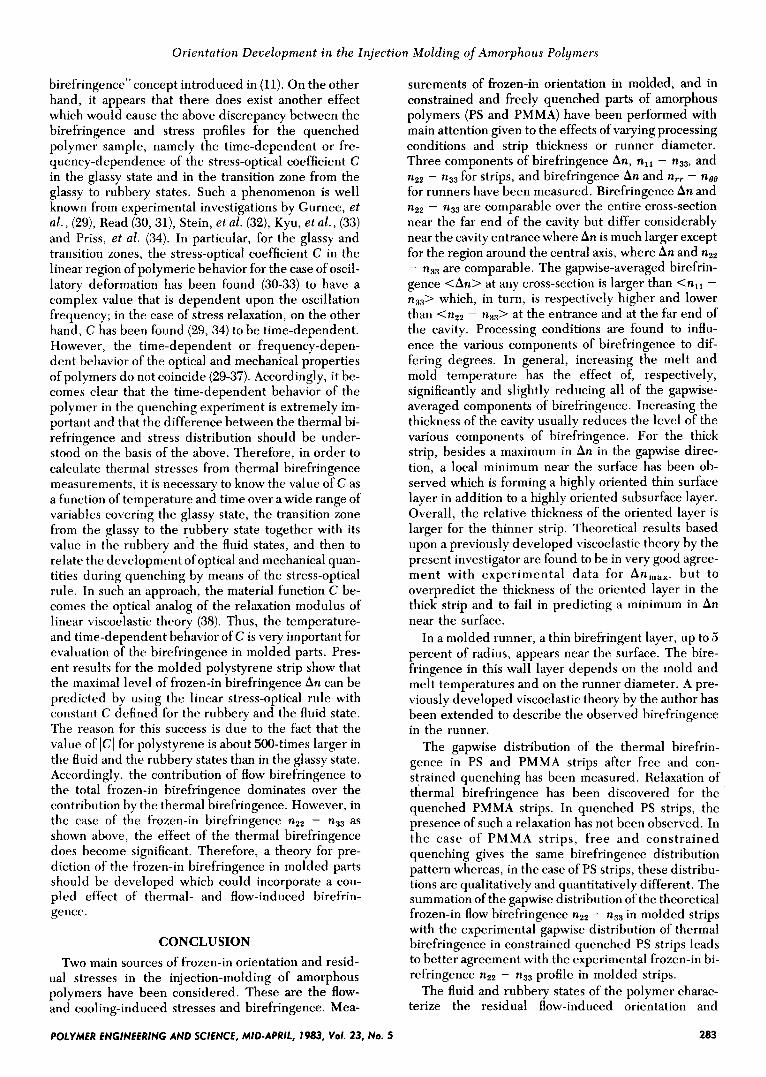
For the molded runner, the effect of melt and mold temperatures and of runner diameter on the radial bire- fringence An distribution at cross-sections located at different distances from the entrance have been investi- gated. As typical examples, Fig. 18 shows such An profiles at a cross-section located midway between the entrance and exit. In all cases, significant birefringence is confined to a thin wall region of the runner with a thickness approximately 5 percent of the radius. A de- crease in the mold temperature from 80 to 42°C seems to slightly increase the thickness of this birefringent layer (Fig . 18a). This is apparently due to a deeper pen- etration into the runner by the glass-transition tempera- ture of the polymer at a lower mold temperature. On the other hand, an increase in melt temperature from 211 to 245°C is seen to significantly reduce the value of the frozen-in birefringence near the runner surface, but seems to have no effect on the thickness of the birefrin-
POLYMER ENGINEERING AND SCIENCE, MID-APRIL, 1983, Vol. 23, NO. 5 281
A . I . lsayev
4
3
,, 2 2
a I
0
/ b
I I.
K I R
r l R
F i g . 18. Bircfringence A n us . position i n rtrdictl dzrcction o f nioltied runners ni idicci 11 f r o m en t rcr rice for different ni old tcni - prtrttirc,.\ (o), melt terripercitures (11) trnd runner tlitrnieters i c i . Curcc,.s 1 ( i n d 2 coi-respond to fo l lowing proces.\ing cwndi t ions in Tnblr 1 , r-c~.\pectiwly: (1-6 trnd 7; 11-9 trnd 10; c-8 t r d 9.
gence layer (F ig . 186). A lower value of birefringence in the case of higher melt temperature is a consequence of an acceleration in the birefringence relaxation with in- creasing temperature. In addition, an increase in run- ner diameter from 0.009525 to 0.0127 meter is seen to reduce the birefringence level at the runner surface (F ig . 18c). At the same time, the size of the runner di- ameter is seen to have only a slight effect on the relative thickness of the oriented surface layer. It has been found in the present study that some difference in the thickness of this layer appears at cross-sections located near the runner entrance due to the presence of a con- traction at the entrance region of the runner with the smaller diameter. Although the above comparison for runners of different diameter is not based upon exactly the same conditions (the flow rate in the runner with larger diameter is lower than that in the smaller run- ner), the conclusion concerning the influence of runner diameter on the level of birefringence is correct, since at the same flow rate, the difference in birefringence should be even larger due to an acceleration of the re- laxation process in polymer melts at higher shear rate (27).
Frozen-In Birefringence and Stresses in Molded and Quenched Parts
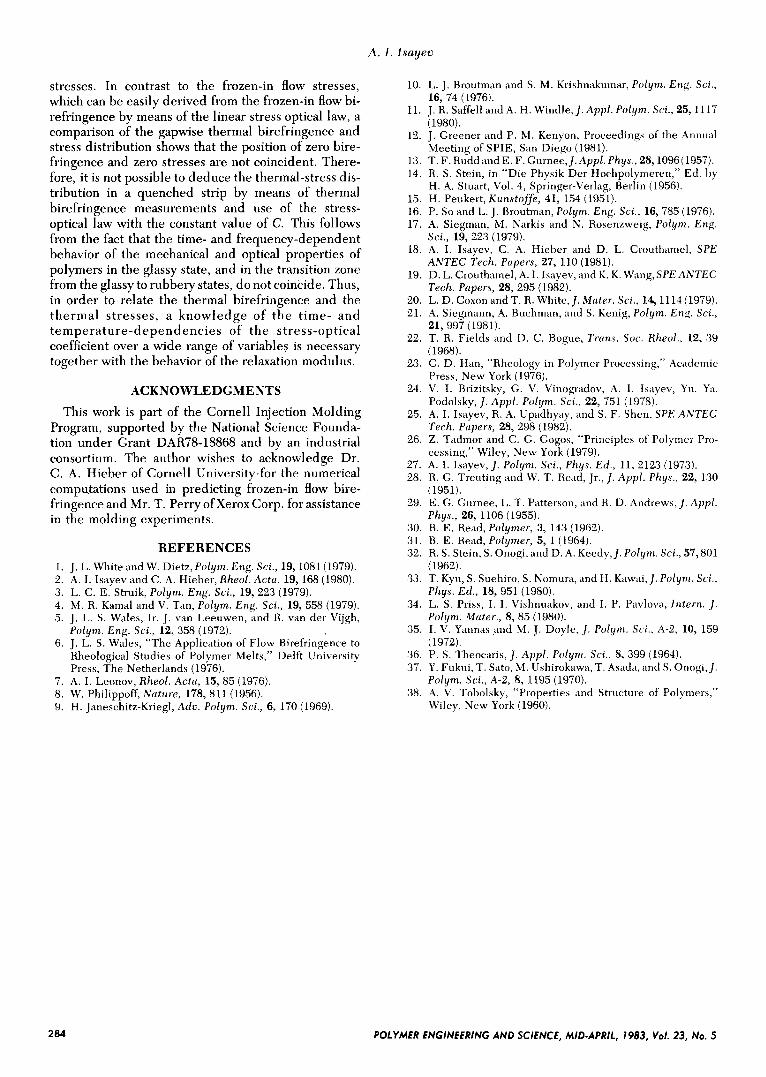
The linear stress-optical law gives a simple relation between stresses and birefringence for polymeric mate- rials with flexible chain above the glass-transition tem- perature or melting point. Concern arises, however, as to whether there exists such a single relationship be- tween frozen-in stresses and birefringence. In this re- gard, Fig. 19 presents direct comparisons between the measured gapwise distribution of thermal birefrin- gence and stresses in fresh samples of freely quenched PS and PMMA. Thermal stress distributions for both samples, obtained by using the layer-removal tech- nique (28) are here taken from our paper (19). Two ob- servations can be made from this figure: first, the posi- tion of zero birefringence and zero stress are not coincident; and second, the thermal stress distribution is symmetric with equal area of tensile and compressive stresses, while the thermal birefringence distribution is nonsymmetric. These two observations imply that thermal stresses can not be derived from thermal bire- fringence in a simple way. In general, the linear stress-
P 4! X
c a
-3L b
110
- I 0 Fig. 19. E x p ~ r i n i e n t o l gtrpwise thermcil .stress distr ibut ion (dnsheti curve.\) cind experiniental gcipuise hirefringence di.stri- bnt ion in PS .strip (21) = 0.0026 meter ) f r ee l y y u e n c h e d f r o m 150 t o 23°C ( ( 1 ) ciitd P M M A .strip (211 = 0.00.3 meter) freely quenched from 170 t o 23°C iii).
optical ru le with constant C does not obtain for frozen-in stresses and birefringence. On the other hand, the literature contains instances (11, 12) in which thermal birefringence measurements have been used for determining residual stress. In (12), this was done directly by multiplying the thermal birefringence with the value of C in the glassy state whereas, in ( l l ) , it was done indirectly. That is, in the latter, the concept was introduced of a “residual birefringence,” which re- mains in polymer slices having thicknesses in the direc- tion perpendicular to the light path of less than 0.001 meter. By subtracting this residual birefringence from the measured birefringence for those thicknesses larger than 0.001 meter, the thermal stresses have been calcu- lated by means of the stress-optical law with a constant value of C. In addition, a stress component in the thick- ness direction of the quenched polymer strip has been introduced in (11) which, however, is contrary to well- known results in quenched inorganic glass. This stress component, according to the authors of (11), contributes to the discrepancy between the position of zero mea- sured birefringence and stress.
As was shown in F i g s . 2 and 3, and in the photographs in Fig. 4 , the value of thermal birefringence and the po- sition of its zero value have been found in the present measurements to be independent of the sample thick- ness in the directions parallel and perpendicular to the light path, thus tending to cast doubt on the “residual
282 POLYMER ENGINEERING AND SCIENCE, MID-APRIL, 1983, Vol. 23, No. 5
Orientution Development in the Injection Molding of Amorphous Polymers
birefringence” concept introduced in (11). On the other hand, it appears that there does exist another effect which would cause the above discrepancy between the birefringence and stress profiles for the quenched polymer sample, namely the time-dependent or fre- quency-dependence of the stress-optical coefficient C in the glassy state and in the transition zone from the glassy to rubbery states. Such a phenomenon is well known from experimental investigations by Gurnee, et al., (29), Read (30, 31), Stein, et al. (32), Kyu, et al., (33) and Priss, et ul. (34). In particular, for the glassy and transition zones, the stress-optical coefficient C in the linear region of polymeric behavior for the case of oscil- latory deformation has been found (30-33) to have a complex value that is dependent upon the oscillation frequency; in the case of stress relaxation, on the other hand, C has been found (29,34) to be time-dependent. However, the time-dependent or frequency-depen- dent behavior of the optical and mechanical properties of polymers do not coincide (29-37). Accordingly, it be- comes clear that the time-dependent behavior of the polymer in the quenching experiment is extremely im- portant and that the difference between the thermal bi- refringence and stress distribution should be under- stood on the basis of the above. Therefore, in order to calculate thermal stresses from thermal birefringence measurements, it is necessary to know the value of C as a function of temperature and time over a wide range of variables covering the glassy state, the transition zone from the glassy to the rubbery state together with its value in the rubbery and the fluid states, and then to relate the development of optical and mechanical quan- tities during quenching by means of the stress-optical rule. In such an approach, the material function C be- comes the optical analog of the relaxation modulus of linear viscoelastic theory (38). Thus, the temperature- and time-dependent behavior of C is very important for evaluation of the birefringence in molded parts. Pres- ent results for the molded polystyrene strip show that the maximal level of frozen-in birefringence An can be predicted by using the linear stress-optical rule with constant C defined for the rubbery and the fluid state. The reason for this success is due to the fact that the value of ICI for polystyrene is about 500-times larger in the fluid and the rubbery states than in the glassy state. Accordingly, the contribution of flow birefringence to the total frozen-in birefringence dominates over the contribution by the thermal birefringence. However, in the case of the frozen-in birefringence nZ2 - n33 as shown above, the effect of the thermal birefringence does become significant. Therefore, a theory for pre- diction of the frozen-in birefringence in molded parts should be developed which could incorporate a cou- pled effect of thermal- and flow-induced birefrin- gence.
CONCLUSION Two main sources of frozen-in orientation and resid-
ual stresses in the injection-molding of amorphous polymers have been considered. These are the flow- and cooling-induced stresses and birefringence. Mea-
POLYMER ENGINEERING AND SCIENCE, MID-APRIL, 1983, VO/. 23, NO. 5
surements of frozen-in orientation in molded, and in constrained and &eely quenched parts of amorphous polymers (PS and PMMA) have been performed with main attention given to the effects of varying processing conditions and strip thickness or runner diameter. Three components of birefringence An, n , , - n33, and nZ2 - n33 for strips, and birefringence An and nrr - nee for runners have been measured. Birefringence An and nzz - n33 are comparable over the entire cross-section near the far end of the cavity but differ considerably near the cavity entrance where An is much larger except for the region around the central axis, where An and nZ2 - n33 are comparable. The gapwise-averaged birefrin- gence <An> at any cross-section is larger than <rill - na3> which, in turn, is respectively higher and lower than <nZ2 - ne3> at the entrance and at the far end of the cavity. Processing conditions are found to influ- ence the various components of birefringence to dif- fering degrees. In general, increasing the melt and mold temperature has the effect of, respectively, significantly and slightly reducing all of the gapwise- averaged components of birefringence. Increasing the thickness of the cavity usually reduces the level of the various components of birefringence. For the thick strip, besides a maximum in An in the gapwise direc- tion, a local minimum near the surface has been ob- served which is forming a highly oriented thin surface layer in addition to a highly oriented subsurface layer. Overall, the relative thickness of the oriented layer is larger for the thinner strip. Theoretical results based upon a previously developed viscoelastic theory by the present investigator are found to be in very good agree- ment with experimental data for An,,,,,, but to overpredict the thickness of the oriented layer in the thick strip and to fail in predicting a minimum in An near the surface.
In a molded runner, a thin birefringent layer, up to 5 percent of radius, appears near the surface. The bire- fringence in this wall layer depends on the mold and melt temperatures and on the runner diameter. A pre- viously developed viscoelastic theory by the author has been extended to describe the observed birefringence in the runner.
The gapwise distribution of the thermal birefrin- gence in PS and PMMA strips after free and con- strained quenching has been measured. Relaxation of thermal birefringence has been discovered for the quenched PMMA strips. In quenched PS strips, the presence of such a relaxation has not been observed. In the case of PMMA strips, free and constrained quenching gives the same birefringence distribution pattern whereas, in the case of PS strips, these distribu- tions are qualitatively and quantitatively different. The summation of the gapwise distribution of the theoretical frozen-in flow birefringence nz2 - n33 in molded strips with the experimental gapwise distribution of thermal birefringence in constrained quenched PS strips leads to better agreement with the experimental frozen-in bi- refringence n22 - n33 profile in molded strips.
The fluid and rubbery states of the polymer charac- terize the residual flow-induced orientation and
283
A, I . Isayev
stresses. In contrast to the frozen-in flow stresses, which can be easily derived from the frozen-in flow bi- refringence by means of the linear stress optical law, a comparison of the gapwise thermal birefringence and stress distribution shows that the position of zero bire- fringence and zero stresses are not coincident. There- fore, it is not possible to deduce the thermal-stress dis- tribution in a quenched strip by means of thermal birefringence measurements and use of the stress- optical law with the constant value of C. This follows from the fact that the time- and frequency-dependent behavior of the mechanical and optical properties of polymers in the glassy state, and in the transition zone from the glassy to rubbery states, do not coincide. Thus, in order to relate the thermal birefringence and the thermal stresses, a knowledge of t he time- and temperature-dependencies of the stress-optical coefficient over a wide range of variables is necessary together with the behavior of the relaxation modulus.
ACKNOWLEDGMENTS
This work is part of the Cornell Injection Molding Program, supported by the National Science Founda- tion under Grant DAR78-18868 and by an industrial consortium. The author wishes to acknowledge Dr. C. A. Hieber of Cornell University-for the numerical computations used in predicting frozen-in flow bire- fringence and Mr. T. Perry of Xerox Corp. for assistance in the molding experiments.
REFERENCES 1. J. L. White and W. Dietz, Polyrn. Eng. Sci., 19, 1081 (1979). 2. A. I. Isayev and C. A. Hieher, Rheol. Actu. 19, 168 (1980). 3. L. C. E. Struik, Polym. Eng. Sci., 19, 223 (1979). 4. M. R. Kamal and V. Tan, Polyrn. Eng. Sci., 19, 558 (1979). 5. J. L. S. Wales, Ir. J. van Leeuwen, and R. van der Vijgh,
Polym. Eng. Sci., 12, 358 (1972). 6. J. L. S. Wales, “The Application of Flow Birefringence to
Rheological Studies of Polymer Melts,” Delft University Press, The Netherlands (1976).
7. A. I. Leonov, Rheol. Actn, 15, 85 (1976). 8. W. Philippoff, Nuture, 178, 811 (1956). 9. H. Janeschitz-Kriegl, Adu. Polym. Sci., 6, 170 (1969).
10. L. J. Broutman and S. M. Krishnakumar, Polyn~. Eng. Sci.,
11. J. R. Saffell and A. H. Windle,J. Appl. Polym. Sci., 25, 1117
12. J. Greener and P. M. Kenyon, Proceedings of the Annual
13. T. F. Rudd and E. F. Curnee,]. Appl. Phys., 28,1096( 1957). 14. R. S. Stein, in “Die Physik Der Hochpolymeren,” Ed. b y
15. H. Peukert, Kunstoffe, 41, 154 (1951). 16. P. So and L. J. Broutman, Polym. Eng. Sci., 16,785 (1976). 17. A. Siegman, M. Narkis and N. Rosenzweig, Polym. Eng.
18. A. I . Isayev, C. A. Hieber and D. L. Crouthamel, S P E
19. D. L. Crouthamel, A. 1. Isayev, and K. K. Wang, SPE ANTEC
20. L. D. Coxon and T. R. White, J. Muter. Sci., 1411 14 (1979). 21. A. Siegmann, A. Buchman, and S. Kenig, Polym. Eng. Sci.,
22. T. R. Fields and D. C. Rogue, Truns. Soc. Rheol., 12, 39
23. C. D. Han, “Rheology in Polymer Processing,” Academic
24. V. I. Brizitsky, G. V. Vinogradov, A. I. Isayev, Yu. Ya.
25. A. I. Isayev, R. A. Upadhyay, and S. F. Shen, S P E ANTEC
26. Z. Tadmor and C. G. Gogos, “Principles of Polymer Pro-
27. A. I. Isayev, J. Polym. Sci., Phys. Ed., 11, 2123 (1973). 28. R. G . Treuting and W. T. Read, Jr., J . Appl. Phys., 22, 1.30
29. E. G. Gurnee, L. T. Patterson, and R. D. .4ndrews, J . Appl.
30. B. E. Read, Polymer, 3 , 143 (1962). 31. B . E. Read, Polymer, 5, 1 (1964). 32. R. S. Stein, S. Onogi, and D. A. Keedy,J. Polym. Sci., 57,801
33. T. Kyu, S. Suehiro, S. Nomnra, and H. Kawai,J. Polyni. Sci.,
34. L. S. Priss, I . I. Vishnuakov, and I. P. Pavlova, Intern. J .
35. I. V. Yannas and M . J. Doyle, J . Polym. Sci., A-2, 10, 159
:36. P. S. Theocaris, J . Appl. Polym. Sci., 8, 399 (1964). 37. Y. Fukui, T. Sato, M. Ushirokawa, T. Asuda, and S. Onogi,J.
38. A. V. Tobolsky, “Properties and Structure of Polymers,”
16, 74 (1976).
(1980).
Meeting of SPIE, San Diego (1981).
H. A. Stuart, Vol. 4, Springer-Verlag, Berlin (1956).
Sci., 19, 223 (1979).
ANTEC Tech. Pupers, 27, 110 (1981).
Tech. Pupers, 28, 295 (1982).
21, 997 (1981).
( 1968).
Press, New York (1976).
Podolsky, J . Appl. Polym. Sci., 22, 751 (1978).
Tech. Papers, 28, 298 (1982).
cessing,” Wiley, New York (1979).
(1951).
Phys., 26, 1106 (1955).
(1962).
Phys. Ed., 18, 951 (1980).
Polym. Muter., 8, 85 (1980).
(1972).
Polyrn. Sci., A-2, 8, 1195 (1970).
Wiley, New York (1960).
2 84 POLYMER ENGINEERING AND SCIENCE, MID-APRIL, 1983, Val. 23, NO. 5