Embed Size (px)
Citation preview
0
ORIENT GREEN POWER
Investor PresentationFY12 Results
Leading Diversified Renewable Energy Generator
Biomass Wind Small Hydel
1
DisclaimerThis presentation is strictly confidential and may not be copied, published, distributed or transmitted. The information in this presentationis being provided by the company.This presentation has been prepared for information purpose and is not an offer or invitation to buy or sell any securities, nor shall part,or all, of this presentation form the basis of, or be relied on in connection with, any contract or investment decision in relation to anysecurities.This presentation contains forward‐looking statements based on the currently held beliefs and assumptions of the management of OrientGreen Power Company Limited, which are expressed in good faith and, in their opinion, reasonable. Forward‐looking statements involveknown and unknown risks, uncertainties and other factors, which may cause the actual results, financial condition, performance, orachievements of Orient Green Power Company Limited or industry results, to differ materially from the results, financial condition,performance or achievements expressed or implied by such forward‐looking statements. The risks and uncertainties relating to thesestatements include, but are not limited to, risks and uncertainties regarding expansion plans and the benefits there from, fluctuations inour earnings, our ability to manage growth and implement strategies, intense competition in our business including those factors whichmay affect our cost advantage, costs of raw materials, wage increases in India, our ability to attract and retain highly skilledprofessionals, time and cost overruns, changes in technology, availability of financing, our ability to successfully complete and integrateour expansion plans, liabilities, political instability and general economic conditions affecting our industries. Given these risks,uncertainties and other factors, recipients of this document are cautioned not to place undue reliance on these forward‐lookingstatements. Orient Green Power Company Limited disclaims any obligation to update these forward‐looking statements to reflect futureevents or developments.This presentation is not an offer of securities for sale in the United States. Securities may not be offered or sold in the United Statesabsent registration or an exemption from registration. No shares or other securities may be offered or sold other than in compliance withthe laws of relevant jurisdictions, including the United States Securities Act of 1933, as amended.By viewing this presentation you acknowledge that you will be solely responsible for your own assessment of the market and the marketposition of Orient Green Power Company Limited and that you will conduct your own analysis and be solely responsible for forming yourown view of the potential future performance of the business of Orient Green Power Company Limited.Unless otherwise indicated, the information contained herein is preliminary and indicative and is based on management information,current plans and estimates as on September 30, 2009. Industry and market‐related information is obtained or derived from industrypublications and other sources and has not been verified by us. The information contained in this presentation is only current as of thedate of this presentation and is subject to change without notice. Orient Green Power Company Limited may alter, modify or otherwisechange in any manner the content of this presentation, without obligation to notify any person of such revision or changes. Personsrelying on the information in this presentation should do so at their own risk and Orient Green Power Company Limited shall not beresponsible for any kind of consequences or liability to any person arising out of, relying and acting upon any such information.
2
Financial Results& Operating Highlights
FY12
Financial Results& Operating Highlights
FY12
3
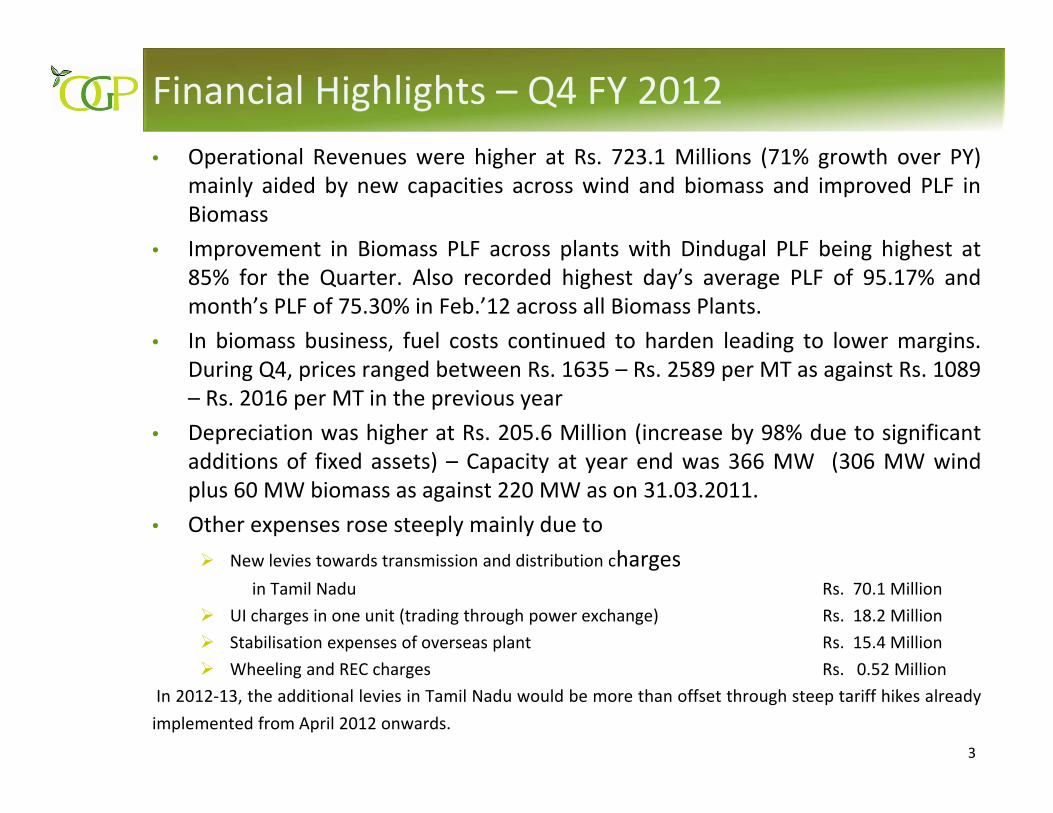
Financial Highlights – Q4 FY 2012• Operational Revenues were higher at Rs. 723.1 Millions (71% growth over PY)
mainly aided by new capacities across wind and biomass and improved PLF inBiomass
• Improvement in Biomass PLF across plants with Dindugal PLF being highest at85% for the Quarter. Also recorded highest day’s average PLF of 95.17% andmonth’s PLF of 75.30% in Feb.’12 across all Biomass Plants.
• In biomass business, fuel costs continued to harden leading to lower margins.During Q4, prices ranged between Rs. 1635 – Rs. 2589 per MT as against Rs. 1089– Rs. 2016 per MT in the previous year
• Depreciation was higher at Rs. 205.6 Million (increase by 98% due to significantadditions of fixed assets) – Capacity at year end was 366 MW (306 MW windplus 60 MW biomass as against 220 MW as on 31.03.2011.
• Other expenses rose steeply mainly due toNew levies towards transmission and distribution charges
in Tamil Nadu Rs. 70.1 MillionUI charges in one unit (trading through power exchange) Rs. 18.2 MillionStabilisation expenses of overseas plant Rs. 15.4 MillionWheeling and REC charges Rs. 0.52 Million
In 2012‐13, the additional levies in Tamil Nadu would be more than offset through steep tariff hikes alreadyimplemented from April 2012 onwards.
Financial Highlights – Q4 FY 2012• Interest rose steeply from Rs. 212.7 Million to Rs. 404.3
Million mainly due to following reasons :Increased borrowings during Q4 2011‐12Increase in interest rates by about 1 ‐2 % p.a.Foreign exchange fluctuation in overseas company
• Loss before Tax was at Rs. 561.91 Million as against PBT ofRs. 14.00 Million in Q4 2010‐11
• Loss after Minority Interest was at Rs. 460.2 Cr. as againstRs. 16.6 Million PAT in Q4 2010‐11
• Quarter also saw new revenue stream in the form RECaggregating to Rs.165.9 Million
5
Financial Highlights – FY 2012
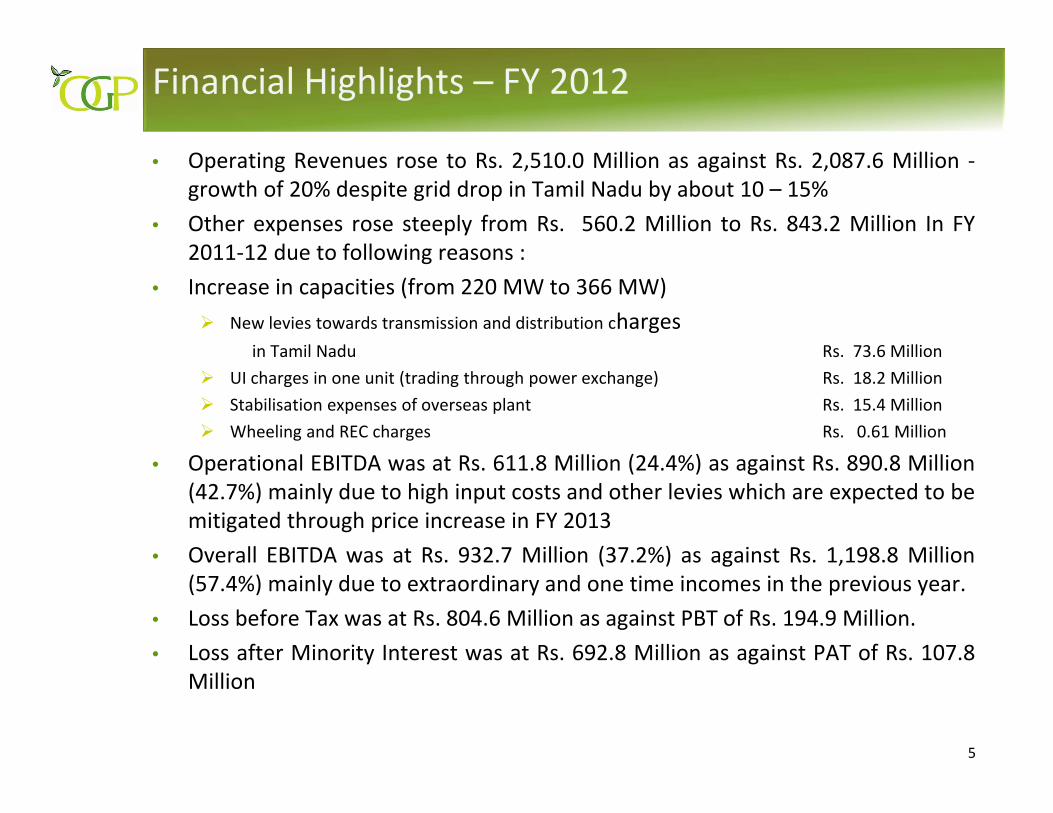
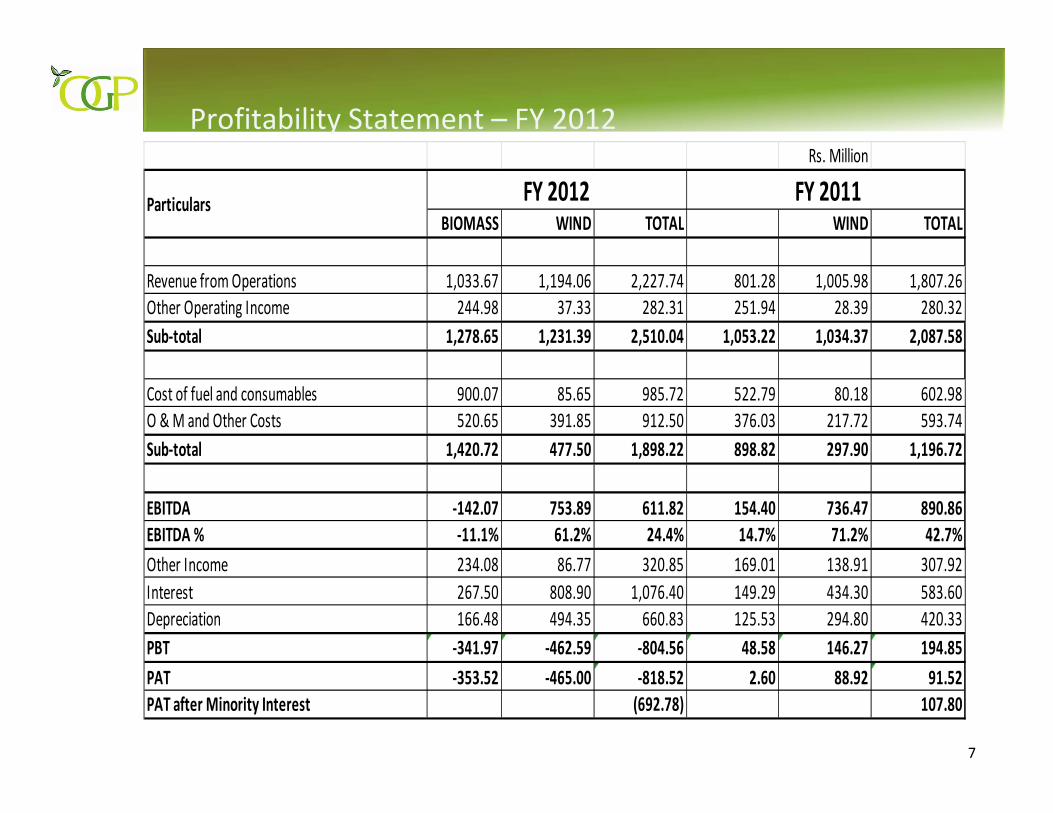
• Operating Revenues rose to Rs. 2,510.0 Million as against Rs. 2,087.6 Million ‐growth of 20% despite grid drop in Tamil Nadu by about 10 – 15%
• Other expenses rose steeply from Rs. 560.2 Million to Rs. 843.2 Million In FY2011‐12 due to following reasons :
• Increase in capacities (from 220 MW to 366 MW)New levies towards transmission and distribution charges
in Tamil Nadu Rs. 73.6 MillionUI charges in one unit (trading through power exchange) Rs. 18.2 MillionStabilisation expenses of overseas plant Rs. 15.4 MillionWheeling and REC charges Rs. 0.61 Million
• Operational EBITDA was at Rs. 611.8 Million (24.4%) as against Rs. 890.8 Million(42.7%) mainly due to high input costs and other levies which are expected to bemitigated through price increase in FY 2013
• Overall EBITDA was at Rs. 932.7 Million (37.2%) as against Rs. 1,198.8 Million(57.4%) mainly due to extraordinary and one time incomes in the previous year.
• Loss before Tax was at Rs. 804.6 Million as against PBT of Rs. 194.9 Million.• Loss after Minority Interest was at Rs. 692.8 Million as against PAT of Rs. 107.8
Million
6
Profitability Statement – Q4 FY 2012
Rs. Million
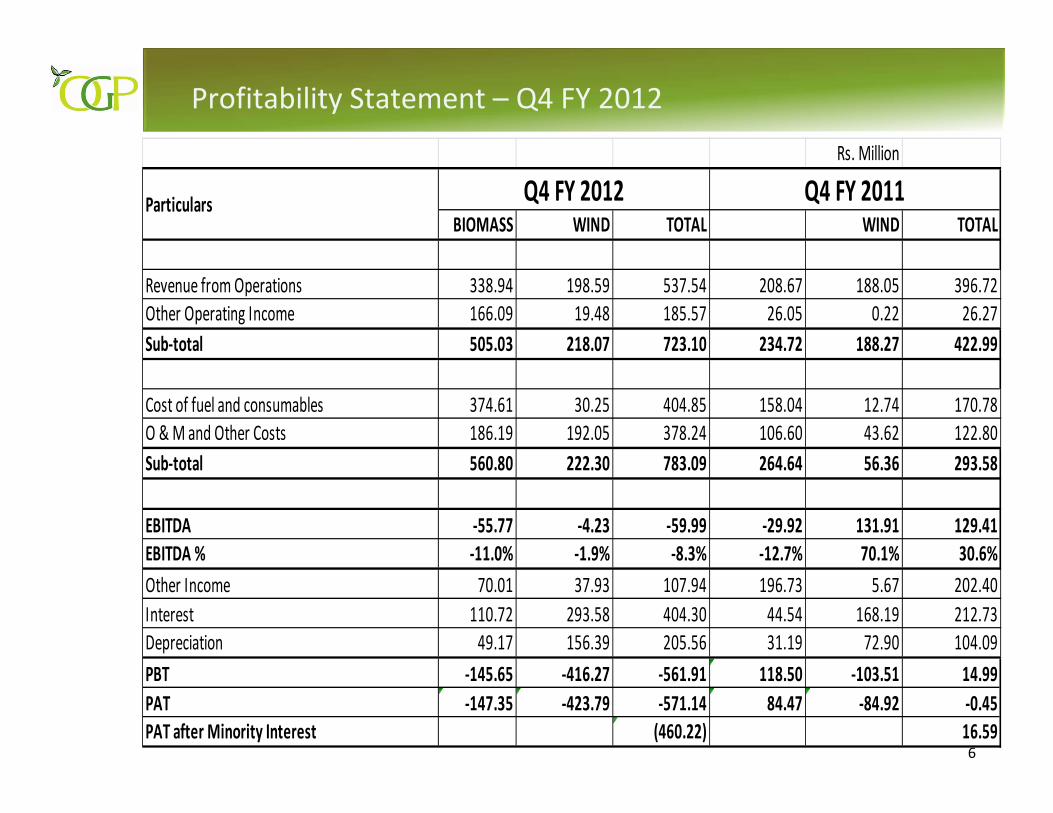
BIOMASS WIND TOTAL WIND TOTAL
Revenue from Operations 338.94 198.59 537.54 208.67 188.05 396.72 Other Operating Income 166.09 19.48 185.57 26.05 0.22 26.27 Sub‐total 505.03 218.07 723.10 234.72 188.27 422.99
Cost of fuel and consumables 374.61 30.25 404.85 158.04 12.74 170.78 O & M and Other Costs 186.19 192.05 378.24 106.60 43.62 122.80 Sub‐total 560.80 222.30 783.09 264.64 56.36 293.58
EBITDA ‐55.77 ‐4.23 ‐59.99 ‐29.92 131.91 129.41 EBITDA % ‐11.0% ‐1.9% ‐8.3% ‐12.7% 70.1% 30.6%Other Income 70.01 37.93 107.94 196.73 5.67 202.40 Interest 110.72 293.58 404.30 44.54 168.19 212.73 Depreciation 49.17 156.39 205.56 31.19 72.90 104.09 PBT ‐145.65 ‐416.27 ‐561.91 118.50 ‐103.51 14.99 PAT ‐147.35 ‐423.79 ‐571.14 84.47 ‐84.92 ‐0.45 PAT after Minority Interest (460.22) 16.59
Particulars Q4 FY 2012 Q4 FY 2011
7
Profitability Statement – FY 2012 Rs. Million
BIOMASS WIND TOTAL WIND TOTAL
Revenue from Operations 1,033.67 1,194.06 2,227.74 801.28 1,005.98 1,807.26 Other Operating Income 244.98 37.33 282.31 251.94 28.39 280.32 Sub‐total 1,278.65 1,231.39 2,510.04 1,053.22 1,034.37 2,087.58
Cost of fuel and consumables 900.07 85.65 985.72 522.79 80.18 602.98 O & M and Other Costs 520.65 391.85 912.50 376.03 217.72 593.74 Sub‐total 1,420.72 477.50 1,898.22 898.82 297.90 1,196.72
EBITDA ‐142.07 753.89 611.82 154.40 736.47 890.86 EBITDA % ‐11.1% 61.2% 24.4% 14.7% 71.2% 42.7%Other Income 234.08 86.77 320.85 169.01 138.91 307.92 Interest 267.50 808.90 1,076.40 149.29 434.30 583.60 Depreciation 166.48 494.35 660.83 125.53 294.80 420.33 PBT ‐341.97 ‐462.59 ‐804.56 48.58 146.27 194.85 PAT ‐353.52 ‐465.00 ‐818.52 2.60 88.92 91.52 PAT after Minority Interest (692.78) 107.80
Particulars FY 2012 FY 2011
8
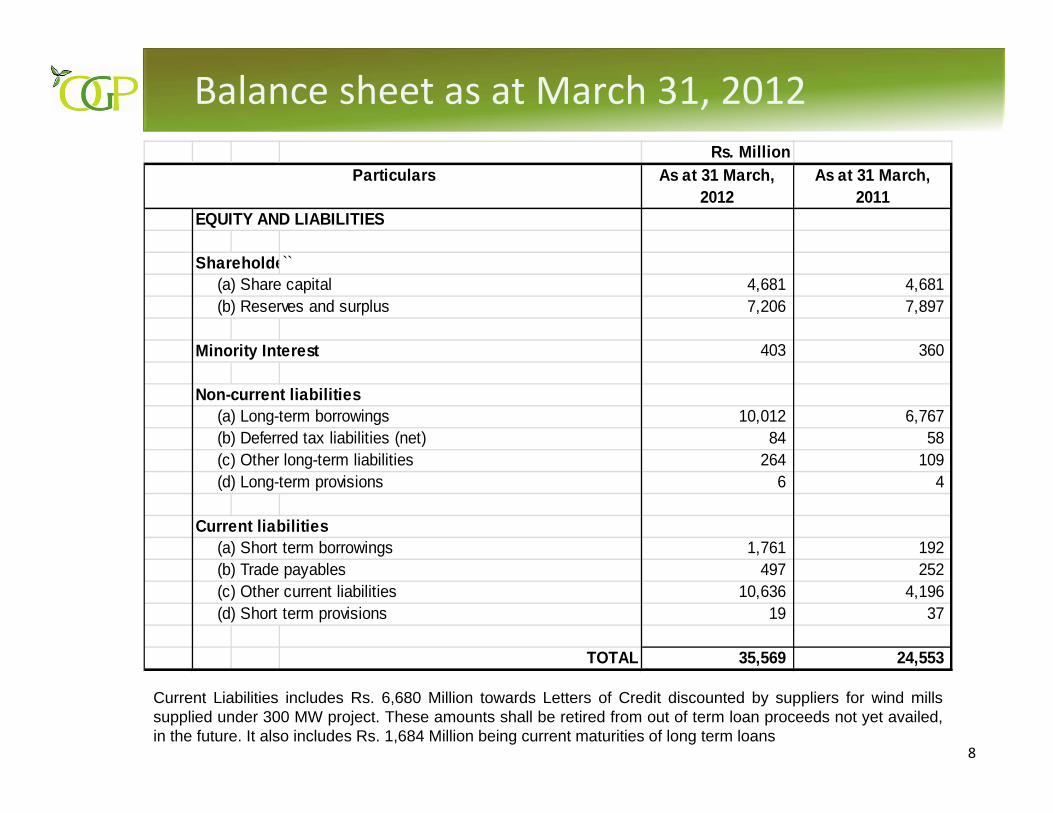
Balance sheet as at March 31, 2012
Current Liabilities includes Rs. 6,680 Million towards Letters of Credit discounted by suppliers for wind millssupplied under 300 MW project. These amounts shall be retired from out of term loan proceeds not yet availed,in the future. It also includes Rs. 1,684 Million being current maturities of long term loans
Rs. MillionAs at 31 March,
2012As at 31 March,
2011 EQUITY AND LIABILITIES
Shareholde `(a) Share capital 4,681 4,681 (b) Reserves and surplus 7,206 7,897
Minority Interest 403 360
Non-current liabilities (a) Long-term borrowings 10,012 6,767
(b) Deferred tax liabilities (net) 84 58 (c) Other long-term liabilities 264 109 (d) Long-term provisions 6 4
Current liabilities
(a) Short term borrowings 1,761 192 (b) Trade payables 497 252 (c) Other current liabilities 10,636 4,196 (d) Short term provisions 19 37
TOTAL 35,569 24,553
Particulars
9
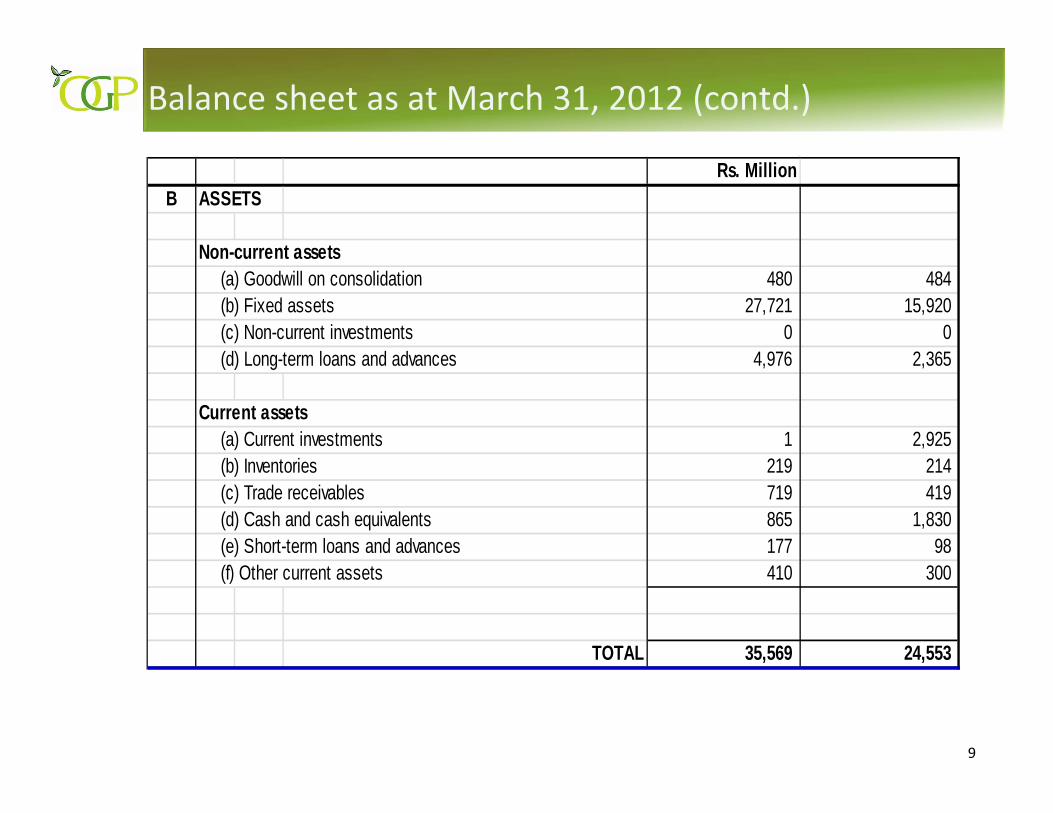
Balance sheet as at March 31, 2012 (contd.)
Rs. MillionB ASSETS
Non-current assets(a) Goodwill on consolidation 480 484 (b) Fixed assets 27,721 15,920 (c) Non-current investments 0 0 (d) Long-term loans and advances 4,976 2,365
Current assets
(a) Current investments 1 2,925 (b) Inventories 219 214 (c) Trade receivables 719 419 (d) Cash and cash equivalents 865 1,830 (e) Short-term loans and advances 177 98 (f) Other current assets 410 300
TOTAL 35,569 24,553
Wind OperationsWind Operations
11
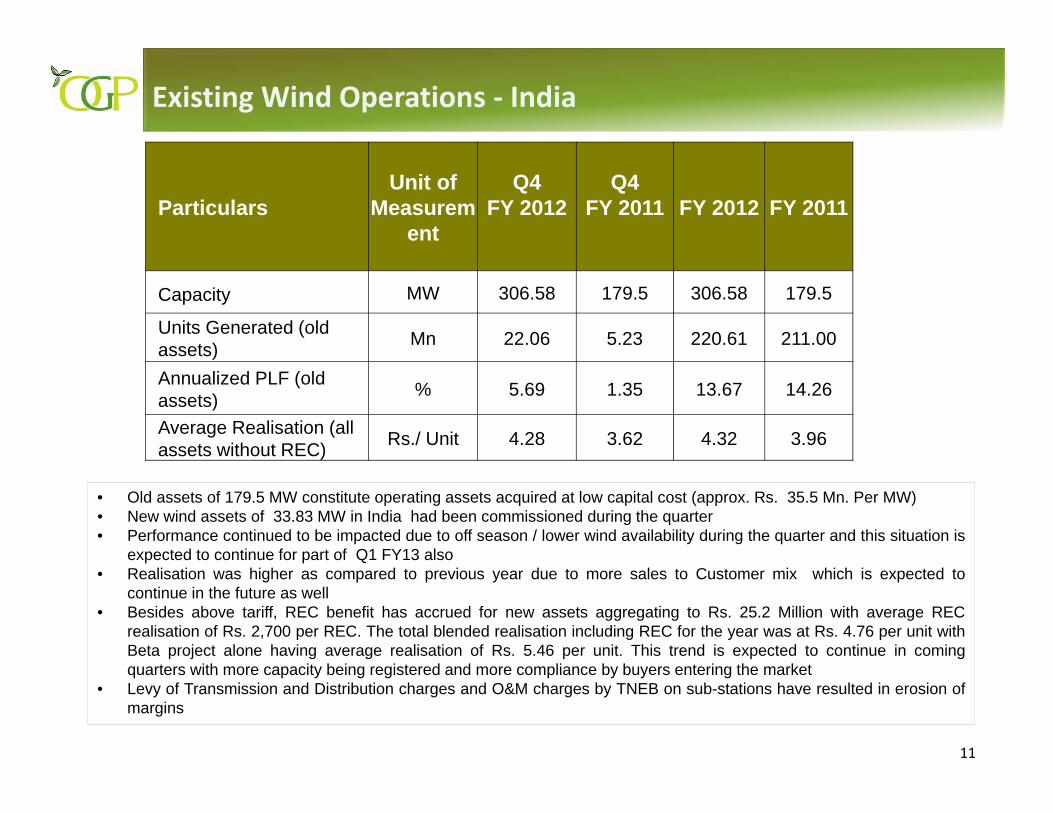
Existing Wind Operations ‐ India
ParticularsUnit of
Measurement
Q4 FY 2012
Q4 FY 2011 FY 2012 FY 2011
Capacity MW 306.58 179.5 306.58 179.5
Units Generated (oldassets) Mn 22.06 5.23 220.61 211.00
Annualized PLF (old assets) % 5.69 1.35 13.67 14.26
Average Realisation (all assets without REC) Rs./ Unit 4.28 3.62 4.32 3.96
• Old assets of 179.5 MW constitute operating assets acquired at low capital cost (approx. Rs. 35.5 Mn. Per MW)• New wind assets of 33.83 MW in India had been commissioned during the quarter• Performance continued to be impacted due to off season / lower wind availability during the quarter and this situation is
expected to continue for part of Q1 FY13 also• Realisation was higher as compared to previous year due to more sales to Customer mix which is expected to
continue in the future as well• Besides above tariff, REC benefit has accrued for new assets aggregating to Rs. 25.2 Million with average REC
realisation of Rs. 2,700 per REC. The total blended realisation including REC for the year was at Rs. 4.76 per unit withBeta project alone having average realisation of Rs. 5.46 per unit. This trend is expected to continue in comingquarters with more capacity being registered and more compliance by buyers entering the market
• Levy of Transmission and Distribution charges and O&M charges by TNEB on sub-stations have resulted in erosion ofmargins
12
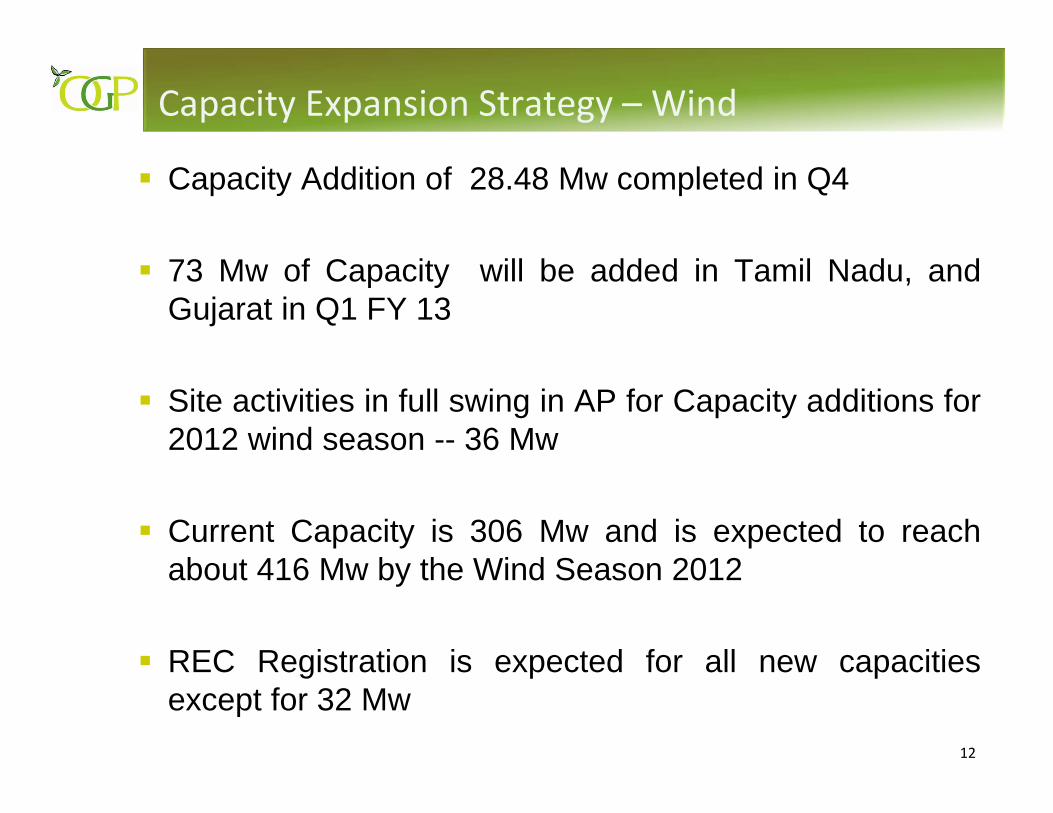
Capacity Expansion Strategy – Wind
Capacity Addition of 28.48 Mw completed in Q4
73 Mw of Capacity will be added in Tamil Nadu, andGujarat in Q1 FY 13
Site activities in full swing in AP for Capacity additions for2012 wind season -- 36 Mw
Current Capacity is 306 Mw and is expected to reachabout 416 Mw by the Wind Season 2012
REC Registration is expected for all new capacitiesexcept for 32 Mw
13
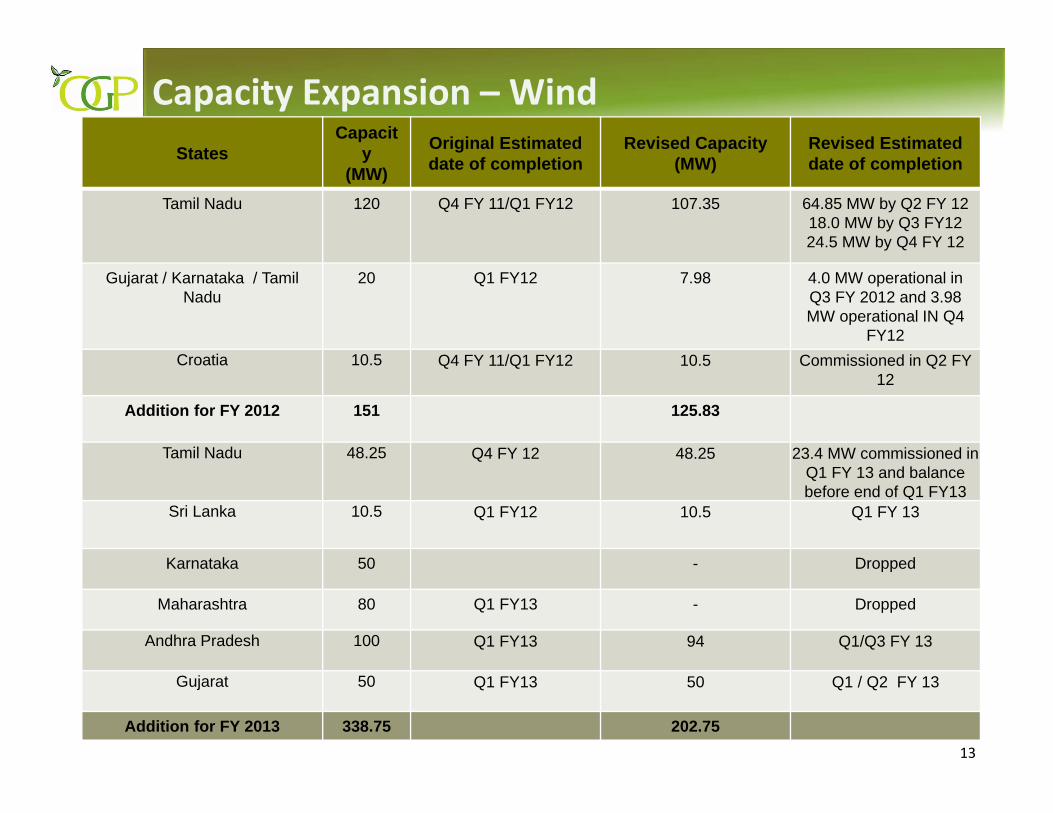
Capacity Expansion – WindStates
Capacity
(MW)
Original Estimated date of completion
Revised Capacity (MW)
Revised Estimated date of completion
Tamil Nadu 120 Q4 FY 11/Q1 FY12 107.35 64.85 MW by Q2 FY 1218.0 MW by Q3 FY1224.5 MW by Q4 FY 12
Gujarat / Karnataka / TamilNadu
20 Q1 FY12 7.98 4.0 MW operational in Q3 FY 2012 and 3.98 MW operational IN Q4
FY12Croatia 10.5 Q4 FY 11/Q1 FY12 10.5 Commissioned in Q2 FY
12
Addition for FY 2012 151 125.83
Tamil Nadu 48.25 Q4 FY 12 48.25 23.4 MW commissioned in Q1 FY 13 and balance before end of Q1 FY13
Sri Lanka 10.5 Q1 FY12 10.5 Q1 FY 13
Karnataka 50 - Dropped
Maharashtra 80 Q1 FY13 - Dropped
Andhra Pradesh 100 Q1 FY13 94 Q1/Q3 FY 13
Gujarat 50 Q1 FY13 50 Q1 / Q2 FY 13
Addition for FY 2013 338.75 202.75
14
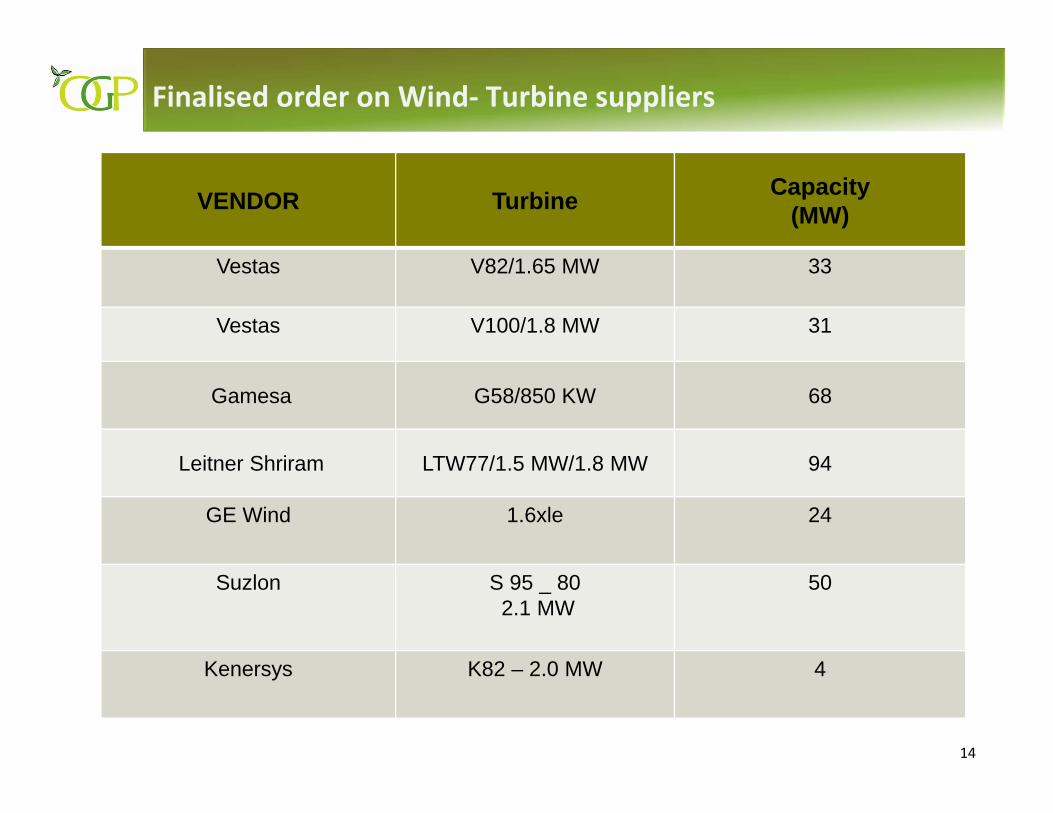
Finalised order on Wind‐ Turbine suppliers
VENDOR Turbine Capacity(MW)
Vestas V82/1.65 MW 33
Vestas V100/1.8 MW 31
Gamesa G58/850 KW 68
Leitner Shriram LTW77/1.5 MW/1.8 MW 94
GE Wind 1.6xle 24
Suzlon S 95 _ 802.1 MW
50
Kenersys K82 – 2.0 MW 4
Biomass OperationsBiomass Operations
16
Existing Biomass Operations
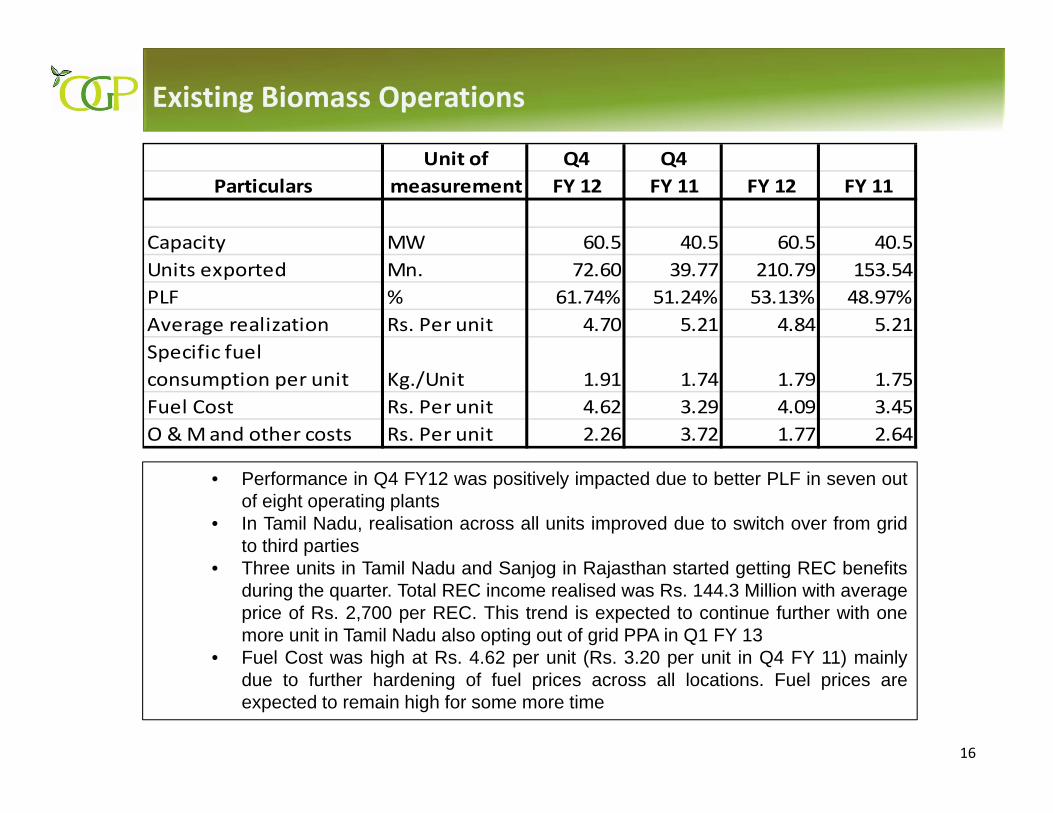
• Performance in Q4 FY12 was positively impacted due to better PLF in seven outof eight operating plants
• In Tamil Nadu, realisation across all units improved due to switch over from gridto third parties
• Three units in Tamil Nadu and Sanjog in Rajasthan started getting REC benefitsduring the quarter. Total REC income realised was Rs. 144.3 Million with averageprice of Rs. 2,700 per REC. This trend is expected to continue further with onemore unit in Tamil Nadu also opting out of grid PPA in Q1 FY 13
• Fuel Cost was high at Rs. 4.62 per unit (Rs. 3.20 per unit in Q4 FY 11) mainlydue to further hardening of fuel prices across all locations. Fuel prices areexpected to remain high for some more time
Unit of Q4 Q4Particulars measurement FY 12 FY 11 FY 12 FY 11
Capacity MW 60.5 40.5 60.5 40.5Units exported Mn. 72.60 39.77 210.79 153.54PLF % 61.74% 51.24% 53.13% 48.97%Average realization Rs. Per unit 4.70 5.21 4.84 5.21Specific fuel consumption per unit Kg./Unit 1.91 1.74 1.79 1.75Fuel Cost Rs. Per unit 4.62 3.29 4.09 3.45O & M and other costs Rs. Per unit 2.26 3.72 1.77 2.64
17
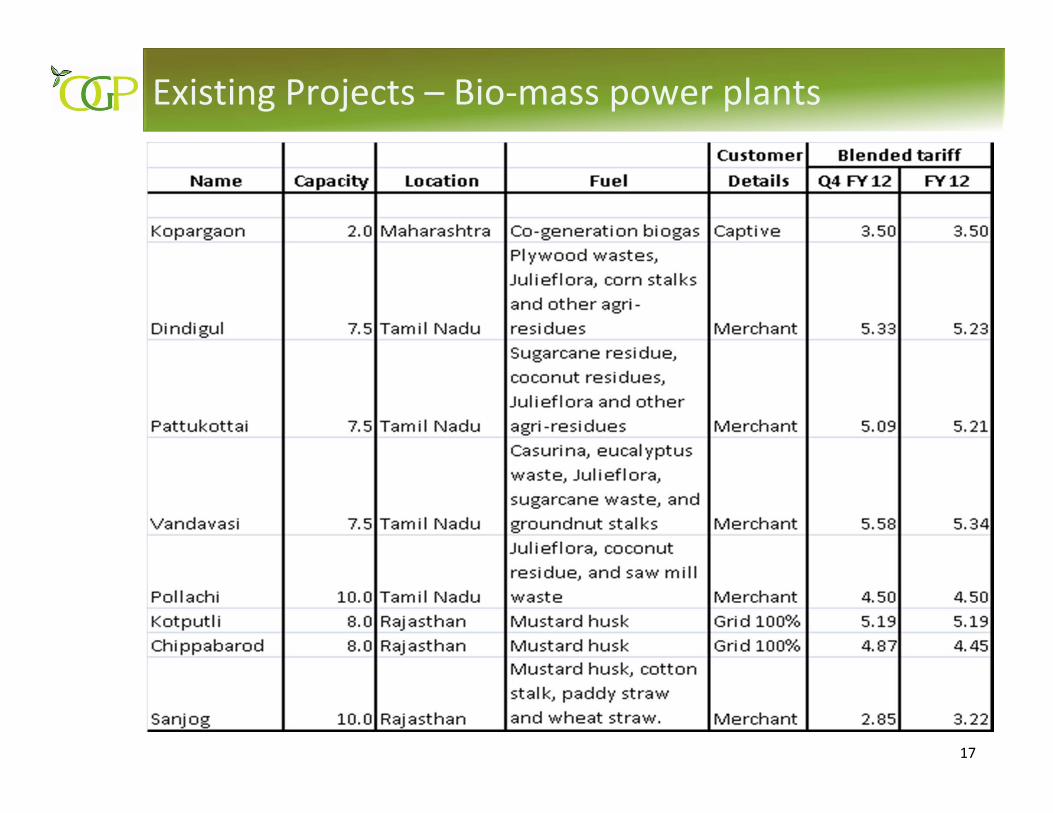
Existing Projects – Bio‐mass power plants
18
Biomass Performance review
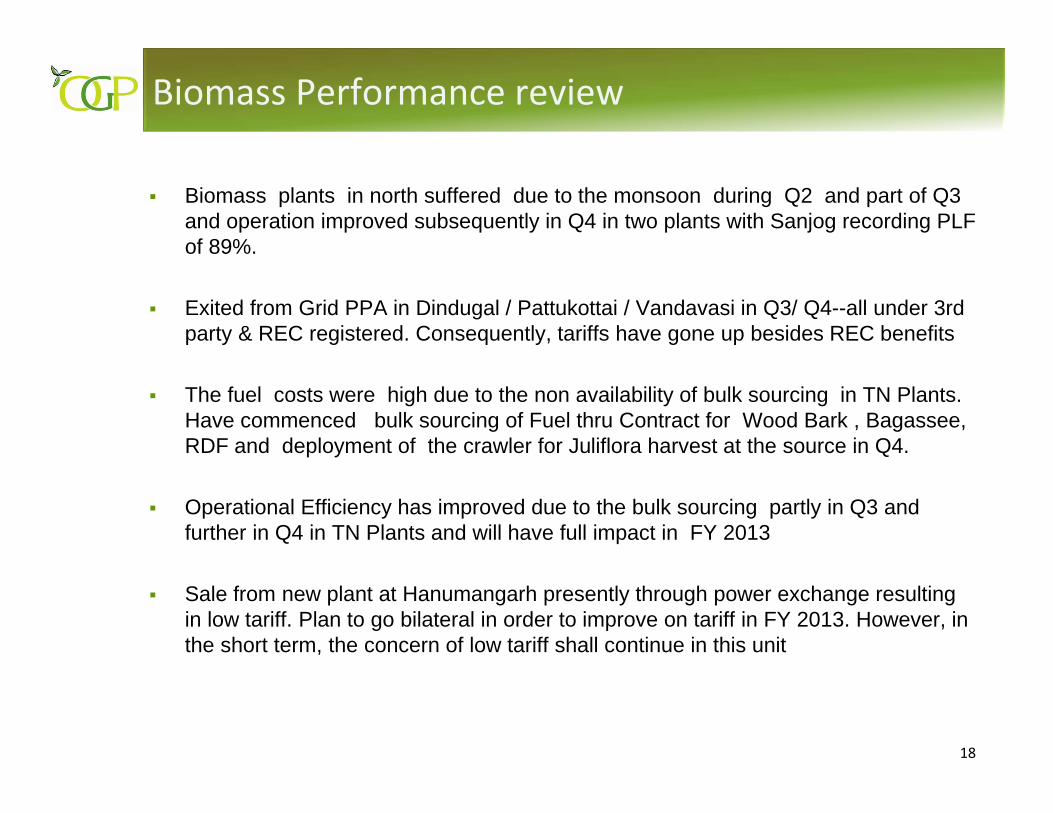
Biomass plants in north suffered due to the monsoon during Q2 and part of Q3 and operation improved subsequently in Q4 in two plants with Sanjog recording PLF of 89%.
Exited from Grid PPA in Dindugal / Pattukottai / Vandavasi in Q3/ Q4--all under 3rd party & REC registered. Consequently, tariffs have gone up besides REC benefits
The fuel costs were high due to the non availability of bulk sourcing in TN Plants. Have commenced bulk sourcing of Fuel thru Contract for Wood Bark , Bagassee, RDF and deployment of the crawler for Juliflora harvest at the source in Q4.
Operational Efficiency has improved due to the bulk sourcing partly in Q3 and further in Q4 in TN Plants and will have full impact in FY 2013
Sale from new plant at Hanumangarh presently through power exchange resulting in low tariff. Plan to go bilateral in order to improve on tariff in FY 2013. However, in the short term, the concern of low tariff shall continue in this unit
19
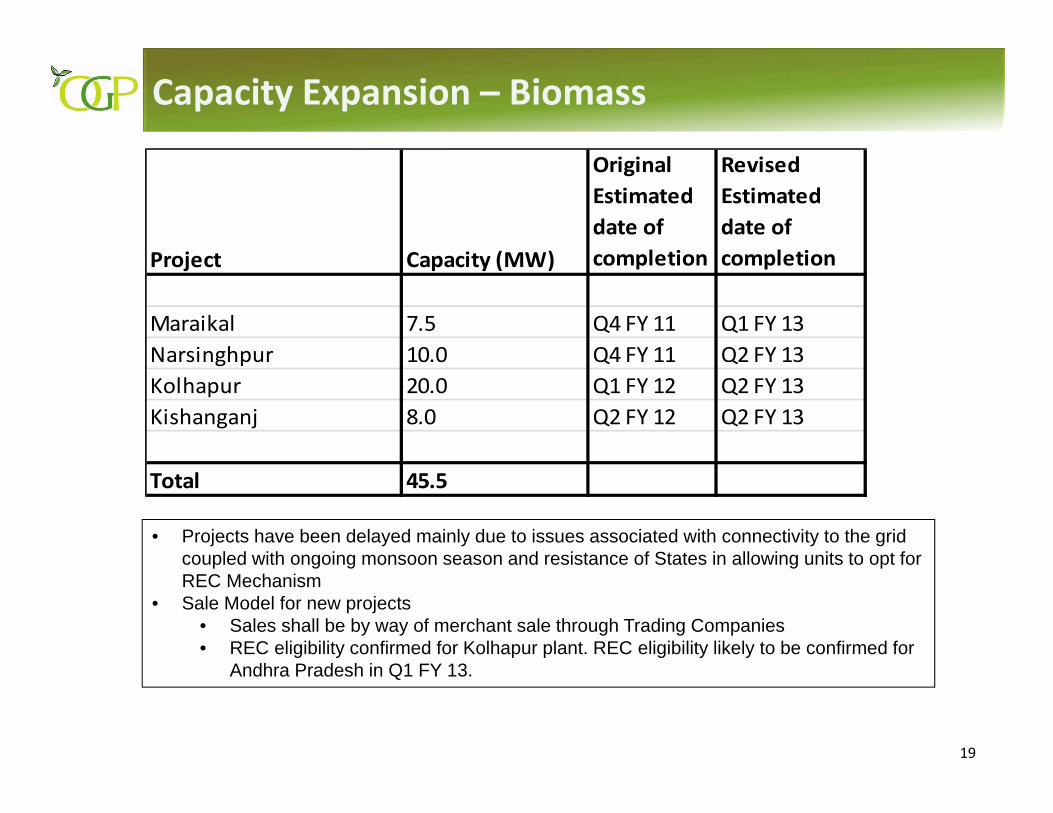
Capacity Expansion – Biomass
• Projects have been delayed mainly due to issues associated with connectivity to the grid coupled with ongoing monsoon season and resistance of States in allowing units to opt for REC Mechanism
• Sale Model for new projects• Sales shall be by way of merchant sale through Trading Companies• REC eligibility confirmed for Kolhapur plant. REC eligibility likely to be confirmed for
Andhra Pradesh in Q1 FY 13.
Project Capacity (MW)
Original Estimated date of completion
Revised Estimated date of completion
Maraikal 7.5 Q4 FY 11 Q1 FY 13Narsinghpur 10.0 Q4 FY 11 Q2 FY 13Kolhapur 20.0 Q1 FY 12 Q2 FY 13Kishanganj 8.0 Q2 FY 12 Q2 FY 13
Total 45.5
Regulatory EnvironmentRegulatory Environment
21
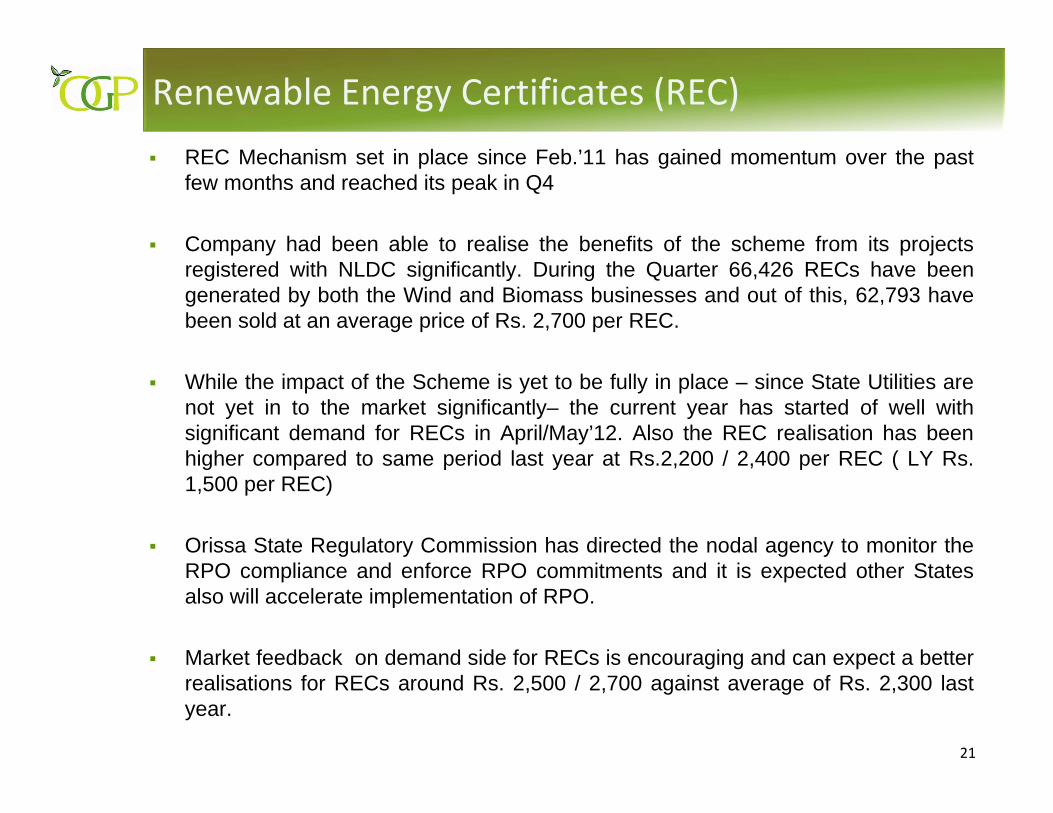
Renewable Energy Certificates (REC)REC Mechanism set in place since Feb.’11 has gained momentum over the pastfew months and reached its peak in Q4
Company had been able to realise the benefits of the scheme from its projectsregistered with NLDC significantly. During the Quarter 66,426 RECs have beengenerated by both the Wind and Biomass businesses and out of this, 62,793 havebeen sold at an average price of Rs. 2,700 per REC.
While the impact of the Scheme is yet to be fully in place – since State Utilities arenot yet in to the market significantly– the current year has started of well withsignificant demand for RECs in April/May’12. Also the REC realisation has beenhigher compared to same period last year at Rs.2,200 / 2,400 per REC ( LY Rs.1,500 per REC)
Orissa State Regulatory Commission has directed the nodal agency to monitor theRPO compliance and enforce RPO commitments and it is expected other Statesalso will accelerate implementation of RPO.
Market feedback on demand side for RECs is encouraging and can expect a betterrealisations for RECs around Rs. 2,500 / 2,700 against average of Rs. 2,300 lastyear.
22
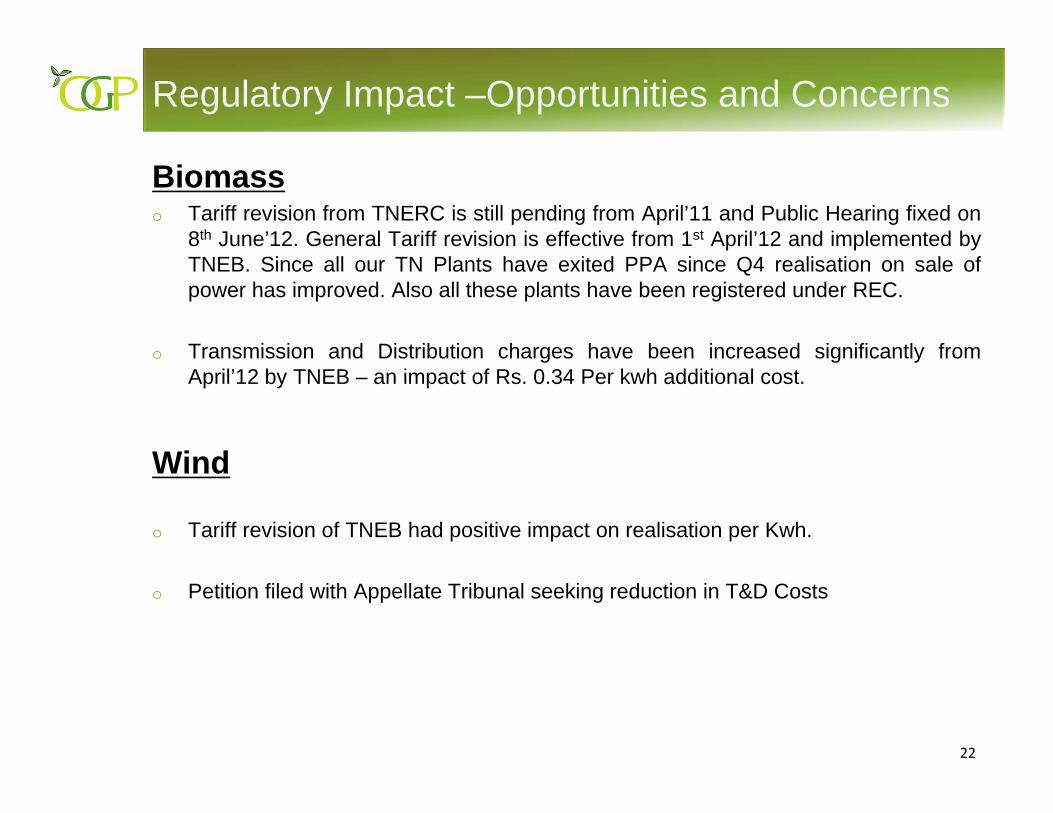
Regulatory Impact –Opportunities and Concerns
Biomasso Tariff revision from TNERC is still pending from April’11 and Public Hearing fixed on
8th June’12. General Tariff revision is effective from 1st April’12 and implemented byTNEB. Since all our TN Plants have exited PPA since Q4 realisation on sale ofpower has improved. Also all these plants have been registered under REC.
o Transmission and Distribution charges have been increased significantly fromApril’12 by TNEB – an impact of Rs. 0.34 Per kwh additional cost.
Wind
o Tariff revision of TNEB had positive impact on realisation per Kwh.
o Petition filed with Appellate Tribunal seeking reduction in T&D Costs
23
Wind Business Outlook
Post Mar.’12 have added 24 Mw of Wind capacity in Tamil Nadu.Further 24 Mw will get added in June’12 in Tamilnadu and 97 Mw byJune/July’12 in AP/Gujarat/ Sri Lanka taking over all capacity to 452Mw by Q1
Transmission inadequacy continues to be an issue in Tamilnadu. It isexpected that grid back down will impact to the tune of 10-15% in thisseason also as in last year
Company is in the process of reducing interest costs thru ECB andother refinancing avenues and same will impact business positively inthe current year
Though GBI and Accelerated Depreciation have been with drawn fromApril’12 , Industry expects that GBI continuation for this year also
Resistance seen in some States like AP/Gujarat for REC Projects
24
Biomass Business Outlook
• With all Tamilnadu based plants on Third Party sale of power ( 32.5Mw) and with REC eligibility significant improvements in revenuesexpected
• Biomass plant performance has improved in Q4 to 62.6%compared to Q3 37.2% ( as some plants were stopped for switchover to 3rd part sale)
• Additional capacities planned 45.5 Mw in Q1/Q2 will take the totalCapacity to 105.5 Mw by Q2
• Energy plantations commenced in some of our Wind Farm landsand plans are on to extend the same in other areas also byencouraging contract farming in unused lands available inneighboring villages
25
Overall Business Outlook
• While short term challenges in terms of fuel cost and availability are likelyto continue, revenue optimisation measures (moving out of PPA, increasein REC revenues, etc.) would lead to improved margins
• New capacities being added consistently would lead to better economiesof scale resulting in lower cost of generation
• Tariff increase for Wind business in Tamil Nadu and Biomass business inRajasthan would provide good upside to revenues and margins
• Sourcing of lower cost fuel through various initiatives is expected to startyielding positive results in coming quarters
• Refinancing through low cost rupee as ell as ECB loans with morestaggered tenors would lead to improved cash flows
• The company expects to pursue further deleveraging measures to improvethe financial health and cash flows in the coming quarters

26