Embed Size (px)
Citation preview
Fachbereich Biologie / Chemie
Institut für Chemie neuer Materialien
Dissertation
Zur Erlangung des Grades eines Doktors der Naturwissenschaften
– Dr. rer. nat. –
Organometallic Polymer - Graphene
Nanocomposites: Promising Battery Materials
vorgelegt von
Seyyed Mohsen Beladi Mousavi
Osnabrück 2016
i
This doctoral thesis was carried out at the Institut für Chemie neuer Materialien,
Fachbereiche Biologe / Chemie, Universität Osnabrück, Germany, under the supervision
of Prof. Dr. Lorenz Walder. The studies were performed in the period from Feb. 2012 to
Nov. 2016.
Hauptberichterstatter: Prof. Dr. Lorenz Walder, Universität Osnabrück
Zweitberichtestatter: Prof. Dr. Martin Steinhart, Universität Osnabrück
Weitere Mitglieder: Prof. Dr. Markus Haase and Dr. Ulrich Wahlbrink
Universität Osnabrück

ii
This thesis is dedicated to my mom and dad

iii
Acknowledgments
First and foremost, I would like to express my sincere gratitude to my advisor Prof.
Lorenz Walder for the continuous support of my research. His patience, motivation and
immense knowledge added considerably to my graduate experience. I appreciate all his
contributions of time and ideas to make my Ph.D. experience productive and stimulating.
Besides my advisor, I would like to thank the rest of my thesis committee: Prof.
Dr. Martin Steinhart, Prof. Dr. Markus Haase, and Dr. Karsten Kömpe for their
encouragement, and insightful comments.
I thank my fellow labmates: Dr. Liang Cheng Cao, Dr. Veronica-Alina Constantin,
Shamaila Sadaf, Marco Schleutker, Patrick Harpel, Sascha Dumstorff, Jonas Klein, Masih
Bahar, Arsalan Mahmood and Ann-Kristin Hennecke for the stimulating discussions, for
the late evenings we were working together, and for all the fun we have had in the last
few years. In particular, I am grateful to Mrs. Simona Webersinn and Mrs. Christine
Schulz-Kölbel for the friendly environment in the lab and their continued support
regarding the laboratory and administrative works.
My special thanks go to my friends Hamid Asiayee, Mariam Hosseini, Behnam
Abbasi, Dr. Marius Ciobanu, Audrey Bonvin, Dr. Ana Maria Lepadatu, Pierre Bonifait,
Ioana Ciupitu, Alex Ciupitu, Bárbara Rotstein, Xihomara Casallas, Martin Frosinn,
Nadine Diek, Ali Arabi and Davood Gheydari for their continuous support and all the
great time, we spent together during the course of this study.
I would like to thank Miriam for her understanding and constant support, which
did not let me feel homesick.
Finally, but by no means least, thanks go to my loving mom and dad, and my
brothers Saeed, Vahid and Davood for providing me with unfailing support and
continuous encouragement throughout my years of study and through the process of
researching and writing this thesis. This accomplishment would not have been possible
without them.
Thank you very much, everyone!
Osnabrück, November 21, 2016.
Mohsen
iv
Table of Contents
Thesis abstract………………………………………………………………………….. 1
Chapter 1. Introduction………………………………………………………………… 2
1.1. Battery materials: Inorganic versus organic……………………………………...... 3
1.2. Organic battery materials...………………………………………………………... 4
1.3. Advantages and challenges of organic electrodes…………………………………. 7
1.4. Motivations and methods of the present thesis…………………………………..... 10
Chapter 2. Poly(vinylferrocene) - Reduced Graphene Oxide as a High Power / High
Capacity Cathodic Battery Material…………………………………………………….
15
2.1. Overview…………………………………………………………………………... 15
2.2. Introduction………………………………………………………………………... 17
2.3. Formation and characterization of PVFc@GO supramolecular complex…………. 20
2.3.1. Introduction…………………………………………………………………... 20
2.3.2. Method: zeta potential……………………………………………………… 21
2.3.3. Experimental section…………………………………………………………. 24
2.3.3.1. Instruments……………………………………………………………… 24
2.3.3.2. Chemicals………………………………………………………………….. 24
2.3.3.3. Oxidation of poly(vinylferrocene) (PVFc)……………………………… 25
2.3.3.4. Zeta potential measurements …………………………………………… 27
2.3.3.5. Modeling………………………………………………………………… 28
2.3.3.6. Atomic Forace Microscopy (AFM)…………………………………… 28
2.3.4. Results and Discussion……………………………………………………...... 28
2.3.4.1. Zeta potential measurement…………………………………………….. 28
2.3.4.2. UV-Vis measurement……………………………………………………. 30
2.3.4.3. Molecular modeling…………………………………………………….. 31
2.3.4.4. Morphology of PVFc@GO complex in dry state……………………...... 33
2.3.5. Summary…………………………………………………………………… 35
2.4. Electrocatalytic transformation of (PVFc@GO)n@CC to (PVFc@rGO)n@CC by
viologen…………………………………………………………………………………
37
2.4.1. Introduction…………………………………………………………………... 37
2.4.2. Experimental section…………………………………………………………. 38
2.4.2.1. Instruments…………………….................................................................... 38
2.4.2.2. Chemicals………….................................................................................. 39
v
2.4.2.3. Preparation of PVFc@GO solutions with varying PVFcx+
/ GOm-
ratio 39
2.4.2.4. Electrochemical measurements and electrode preparation…………...... 40
2.4.2.5. Electrochemical transformation of (PVFc@GO)n@CC to
(PVFc@rGO)n@CC ……………………………………………………
40
2.4.2.6. Electrochemical Quartz Crystal Microbalance (EQCM)………………. 40
2.4.2.7. Conductivity…………………………………………………………...... 41
2.4.2.8. Raman spectroscopy…………………………………………………...... 41
2.4.2.9. Electrochemical AFM……….………………………………………… 42
2.4.3. Results and Discussion……………………………………………………...... 42
2.4.3.1. Cyclic voltammetry……………………………………………………… 44
2.4.3.2. EQCM…………………………………………………………………… 48
2.4.3.3. Electrochemical-AFM…………………………………………………... 51
2.4.3.4. Raman spectroscopy…………………………………………………...... 56
2.4.3.5. Thermogravimetric analysis…………………………………………...... 56
2.4.3.6. Electrical conductivity…………………………………………………... 57
2.4.4. Summary………………………………………………………………...…… 57
2.5. Energy Storage Performances……………………………………………………... 59
2.5.1. Introduction…………………………………………………………………... 59
2.5.2. Experimental………………………………………………………………..... 60
2.5.2.1. Instruments……………………………………………............................ 60
2.5.2.2. Chemicals…………………………………………….............................. 60
2.5.2.3. Battery performance tests……………………………………………...... 60
2.5.3. Results and discussion………………………………………………………... 60
2.5.4. Summary…………………………...………………………………………… 65
Chapter 3. Summary and Outlook……………………………………..………………. 67
3.1. Summary……………………………………………………………...…………… 67
3.2. Outlook…………………………………………………………………………...... 70
References……………………………………………………………………………… 71
Abbreviation……………………………………………………………………………. 74
Curriculum Vitae……………………………………………………………………...... 75
Declaration……………………………………………………………………………... 76
1
Thesis abstract
Preparation, structural analysis, and electrochemical performance of a new
cathodic battery material, consisting of a nanocomposite of poly(vinylferrocene) (PVFc)
(Eox: 0.4 V vs. Ag/AgCl) and reduced graphene oxide (rGO), are described. The
nanocomposite shows the highest charge-discharge efficiency (at a rate of 100 A g-1
) ever
reported for any organic / organomatellic battery material. Remarkably, the composite is
“thickness scalable” up to 0.21 mAh cm-2
(770 mC cm−2
at 29 μm film thickness) on a flat
surface with > 99% coloumbic efficiency, exhibiting a specific capacity density of 114
mAh g−1
. The composite material is binder free and the charge storing material (PVFc)
accounts for > 88% of the total weight of the cathodic material. The secret behind such a
performance is the electrostatic interaction between the redox polymer in its oxidized
state (exhibiting positive charge) and the original filler i.e., graphene oxide (GO) with
negative surface charge. This self-assembling step is analyzed by zeta potential
measurements, and a modeling study confirms the experimentally found heavy polymer
loading on the GO (in aqueous solution). The efficient self-assembly led to composites
with high ratio of redox polymer / GO where all polymers are in close contact with GO
sheets. The stable colloidal solution was casted on the surface of a flat current collector
and the insulating GO was electrochemically transformed to conductive reduced graphene
oxide (rGO). The GO / rGO transformation was catalyzed by methyl viologen dichloride
(MV++
) working as a redox shuttle (solublized in the aqueous electrolyte) and thereby
accelerating the electron transfer to GO. Complete GO / rGO transformation and the
quantitative ion breathing of the composite are found by means of electrochemical quartz
crystal microbalance and electrochemical AFM. Further work in the field was done, but
as it is part of a pendant patent application, will not be mention in this thesis.
2
Chapter 1
Introduction
Burning fossil fuels and biomass are the most known energy sources, which are
widely used for different applications. However, the unavoidable subsequent gas emission
causes environmental pollution and results in global warming, which could have
problematic consequences. Moreover, these resources are non-renewable. On the
contrary, the green energy sources such as solar radiation, wind, and waves are
renewable. However the limitation in time and place of energy generation of renewable
sources clearly indicates their dependency on energy carriers and / or energy storages.
Energy carriers are the electricity grid, electromagnetic waves, chemical energy and
batteries. The latter two are “portable energy sources”. However, batteries, in contrast to
fossil fuels, can convert stored chemical energy to electrical energy with a high efficiency
and additionally do not produce gaseous exhaust. The portable energy storages are crucial
in the modern mobile society for many applications ranging from small scale energy
storages such as cellular telephones, smart watches and laptops to bigger scales such as
electrical vehicles.1
Each cell of a battery consists of a cathode (reductant) and an anode (oxidant), that
are separated by the electrolyte, which transfers ions during the electrochemical reaction
inside the active battery materials. During a discharge cycle, two reversible
electrochemical reactions, an oxidation and a reduction, happen in the two battery
materials, the anode and the cathode, respectively. An external current (I) over a specific
time (Δt) at a voltage (V) is provided. The difference between the redox potentials of the
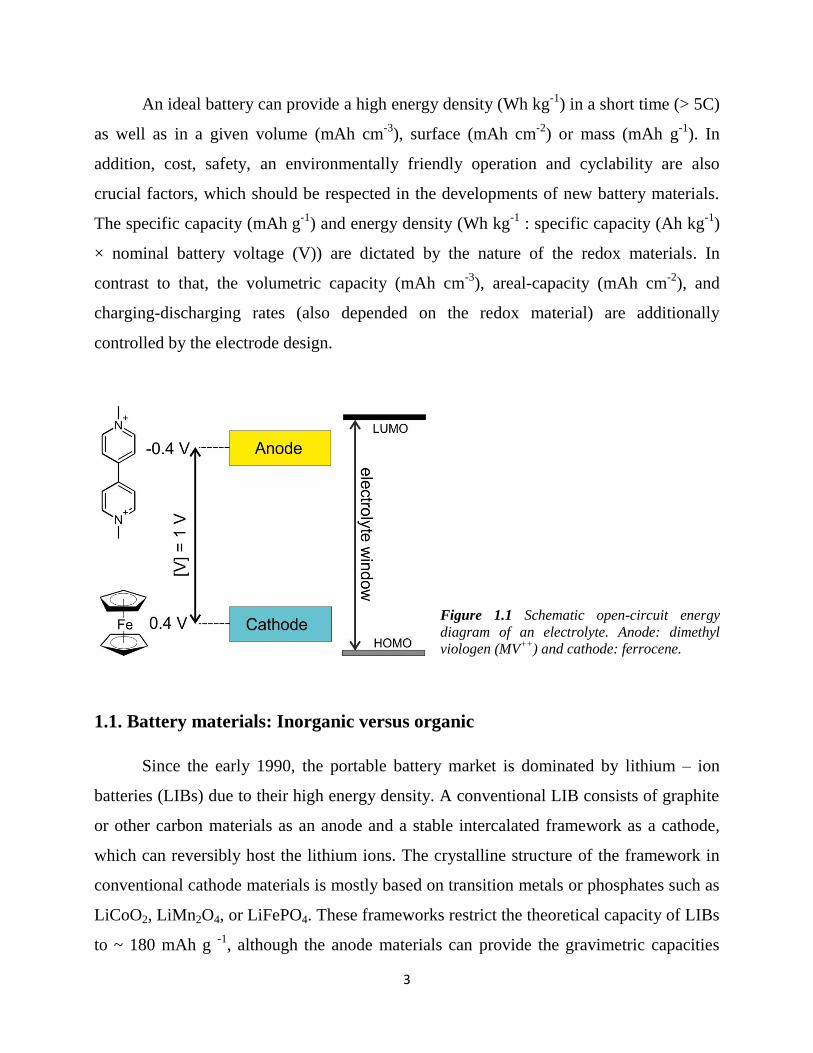
anode and the cathode is the theoretical voltage (V [V]) of the battery. In order to prevent
the irreversible oxidation / reduction of the electrolyte, the redox potential of anodes and
cathodes of a thermodynamically stable battery have to be between the LUMO and the
HOMO of the electrolyte i.e., the electrolyte window (Figure 1.1). The electrolyte
window of the aqueous electrolyte is limited to max. 1.23 V, while it is > 3 V in organic
solvents.2
3
An ideal battery can provide a high energy density (Wh kg-1
) in a short time (> 5C)
as well as in a given volume (mAh cm-3
), surface (mAh cm-2
) or mass (mAh g-1
). In
addition, cost, safety, an environmentally friendly operation and cyclability are also
crucial factors, which should be respected in the developments of new battery materials.
The specific capacity (mAh g-1
) and energy density (Wh kg-1
: specific capacity (Ah kg-1
)
× nominal battery voltage (V)) are dictated by the nature of the redox materials. In
contrast to that, the volumetric capacity (mAh cm-3
), areal-capacity (mAh cm-2
), and
charging-discharging rates (also depended on the redox material) are additionally
controlled by the electrode design.
Figure 1.1 Schematic open-circuit energy
diagram of an electrolyte. Anode: dimethyl
viologen (MV++
) and cathode: ferrocene.
1.1. Battery materials: Inorganic versus organic
Since the early 1990, the portable battery market is dominated by lithium – ion
batteries (LIBs) due to their high energy density. A conventional LIB consists of graphite
or other carbon materials as an anode and a stable intercalated framework as a cathode,
which can reversibly host the lithium ions. The crystalline structure of the framework in
conventional cathode materials is mostly based on transition metals or phosphates such as
LiCoO2, LiMn2O4, or LiFePO4. These frameworks restrict the theoretical capacity of LIBs
to ~ 180 mAh g -1
, although the anode materials can provide the gravimetric capacities
4
> 1000 mAh g-1
.3 Hence, many researches are still concerned with developing novel, high
capacity cathode materials for conventional LIBs, e.g., vanadium-oxide based batteries
with theoretical capacity > 400 mAh g-1
(However, their capacities are depended on many
redox states (V2+
to V5+
) in a broad potential range (> 2V)4 and additionally they have a
short cycle life).
In conventional LIBs, the rate of the (de)intercalation of Li-ions is mainly limited
by the diffusion of Li-ions into the crystalline cathodic host structure. Smaller crystals
provide shorter paths; however, the syntheses of the small crystals are often very
expensive. Moreover, there are still serious safety concerns due to the unwanted reaction
between the electrode materials and the electrolyte (i) and the flammability of the organic
electrolyte (ii). Some other essential requirements for today’s market related to Internet of
Things (IoT) are still not easily feasible with classical LIBs, such as flexibility, long cycle
life, efficient processing e.g., spraying and roll to roll, efficient operation in aqueous
electrolyte and absence of toxic and non-renewable materials. This has triggered
considerable research attention toward more advanced battery materials such as Li-O2, Li-
S and Li-organic batteries. Interestingly, the research and industrial attention towards
organic materials for energy storage application, as compared to inorganic electrodes is
negligible. This is historically due to the fast developments of LIBs. However, the use of
organic or organometallic redox compounds could overcome many of the mentioned
problems of the LIBs, as it will be discussed in the following sections.
1.2. Organic battery materials
A reversible electrochemical redox reaction is the first requirement for any
electrode material candidate to be used as an anode or cathode. Elemental substances
(e.g., Li, Na, C, O2, S, Si, P, Sn, I2), transitional metals (e.g., Co, Mn, V, Ti, Fe, Ni), and
organic materials (monomers, oligomers, denderimers and polymers) are theoretically
possible candidates for secondary batteries. Redox active organic molecules consist
5
usually of a -conjugated structure and atoms with lone pair electrons such as O, N and S.
The conjugated structure accelerates the charge delocalization of the redox product.5 In
other cases e.g. in the case of Tempo, the electrophore is localized and tert. butyl groups
protect the radical from dimerization. As well known from Marcus-Hush theory, the
kinetics of a reversible redox reaction of organic molecules depend on the reaction
mechanism, e.g., in a disulfide, the reductive breaking of the S-S bond and its oxidative
formation from two S–
is slow and needs therefore a high activation energy. Bond
breaking and bond formation is obviously not involved in the redox processes of a tempo
radical, viologen or ferrocene and fast kinetics are therefore expected. Anyhow, the
electron transfer is not the only possible rate determining step, it can as well be the
movement of counterions.
The redox reaction of an organic electrode is based on the reversible redox reaction
of the organic functional groups:
N-type organic: N + e– + C
+ ↔ N
– C
+
P-type organic: P+A
– + e
– ↔ P + A
–
B-type organic: B + e– + C
+ ↔ B
– C
+ / B – e
– + A
- ↔ B
+A
-
while N = neutral state of n-type organic, P = neutral state of p-type organic, B = neutral
state of bipolar organic, C = cations, e.g., H+, Li
+, Na
+, B
+, NH4
+ and etc, and A = anions
e.g., Cl–, Br
–, I
–, ClO4
–, PF6
– and etc. The cathodic materials in LIBs are limited to the
specific radius of Li+. However, in n-type or p-type redox organic material, replacing
counterions, do not essentially affect the electrochemical responses.
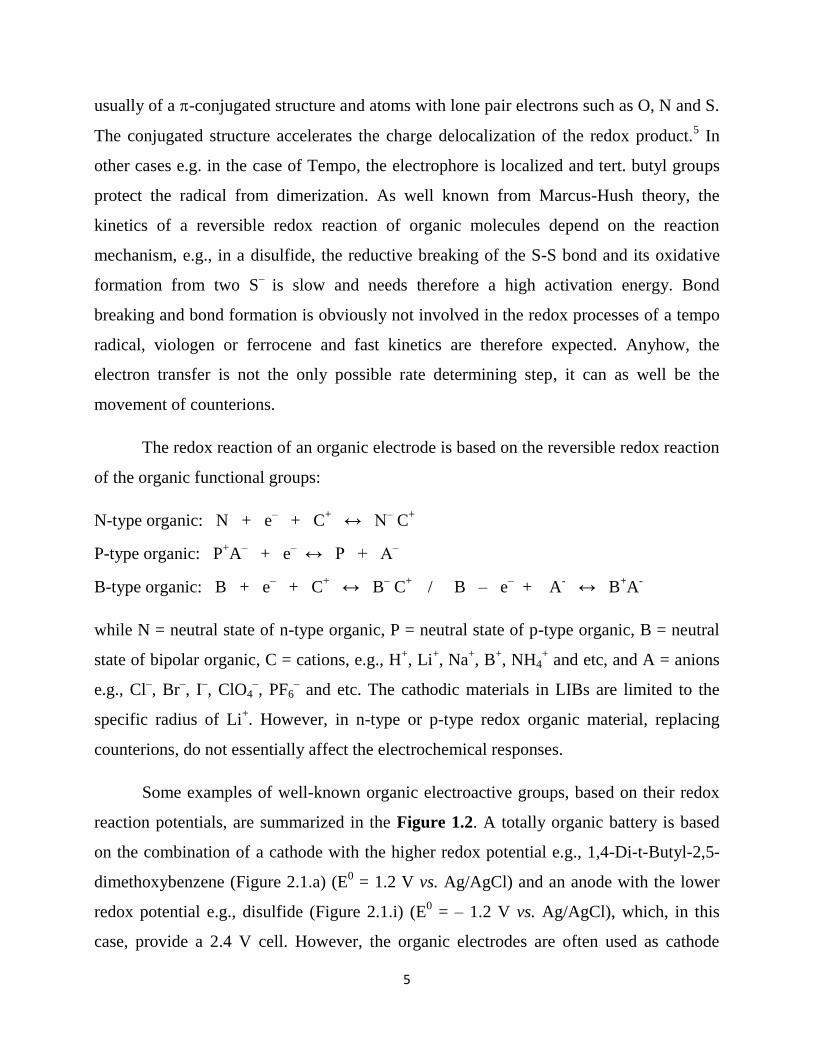
Some examples of well-known organic electroactive groups, based on their redox
reaction potentials, are summarized in the Figure 1.2. A totally organic battery is based
on the combination of a cathode with the higher redox potential e.g., 1,4-Di-t-Butyl-2,5-
dimethoxybenzene (Figure 2.1.a) (E0 = 1.2 V vs. Ag/AgCl) and an anode with the lower
redox potential e.g., disulfide (Figure 2.1.i) (E0 = – 1.2 V vs. Ag/AgCl), which, in this
case, provide a 2.4 V cell. However, the organic electrodes are often used as cathode
6
materials in combination with inorganic anode material e.g., lithium. For instance, the
combination of Ferrocene / Li provide a ~3.7 V battery (Li / Li+ is -3.26 vs. Ag/AgCl).
Figure 1.2. Redox potentials of some well-known electroactive organic molecules. (Li/Li+ is -3.26 vs.
Ag/AgCl); a) 1,4-Di-t-Butyl-2,5-dimethoxybenzene, b) 9-Methylcarbazole, c) (2,2,6,6-
Tetramethylpiperidin-1-yl)oxyl (TEMPO), d) Ferrocene, e) Dimethyviologen, f) 2,6-Dimethylpyrrolo[3,4-
f]isoindole-1,3,5,7(2H,6H)-tetrone, g) Anthraquinone, h) Cobaltocenium, i) (α,α′-dithio-o-xylene), j)
Polymeric sulfure.
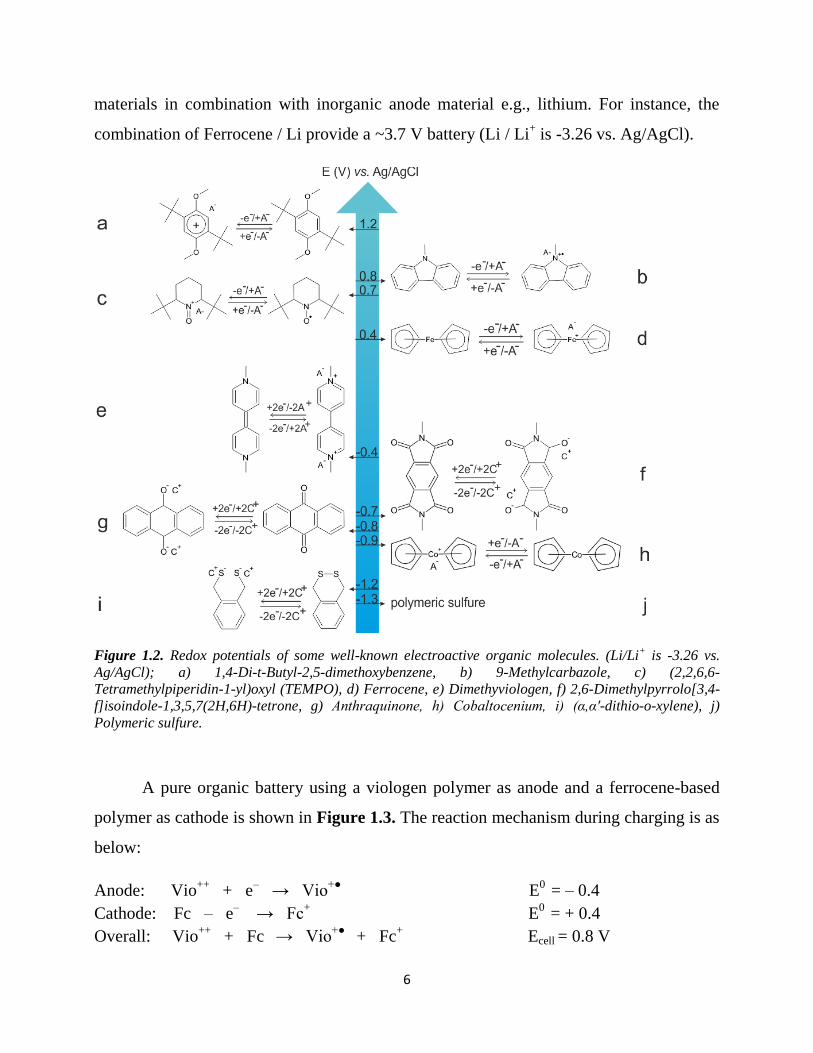
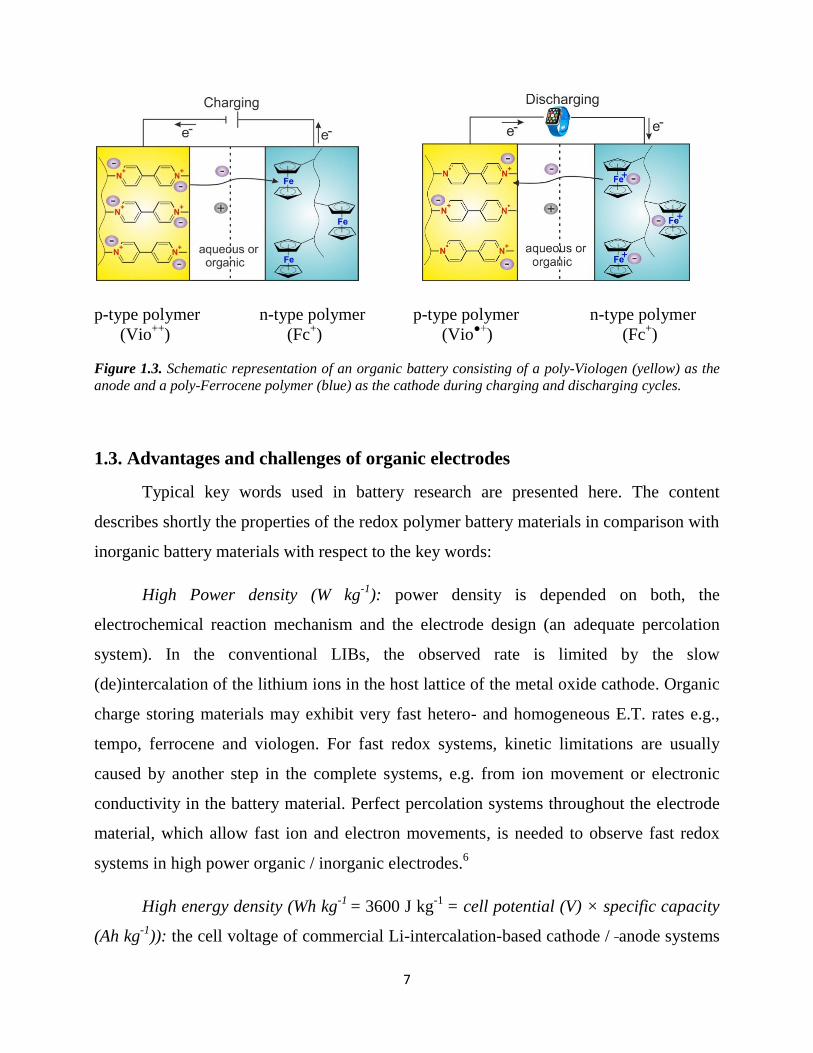
A pure organic battery using a viologen polymer as anode and a ferrocene-based
polymer as cathode is shown in Figure 1.3. The reaction mechanism during charging is as
below:
Anode: Vio++
+ e– → Vio
+● E
0 = – 0.4
Cathode: Fc – e– → Fc
+ E
0 = + 0.4
Overall: Vio++
+ Fc
→ Vio+●
+ Fc+ Ecell = 0.8 V
7
p-type polymer n-type polymer p-type polymer n-type polymer
(Vio++
) (Fc+) (Vio
●+) (Fc
+)
Figure 1.3. Schematic representation of an organic battery consisting of a poly-Viologen (yellow) as the
anode and a poly-Ferrocene polymer (blue) as the cathode during charging and discharging cycles.
1.3. Advantages and challenges of organic electrodes
Typical key words used in battery research are presented here. The content
describes shortly the properties of the redox polymer battery materials in comparison with
inorganic battery materials with respect to the key words:
High Power density (W kg-1
): power density is depended on both, the
electrochemical reaction mechanism and the electrode design (an adequate percolation
system). In the conventional LIBs, the observed rate is limited by the slow
(de)intercalation of the lithium ions in the host lattice of the metal oxide cathode. Organic
charge storing materials may exhibit very fast hetero- and homogeneous E.T. rates e.g.,
tempo, ferrocene and viologen. For fast redox systems, kinetic limitations are usually
caused by another step in the complete systems, e.g. from ion movement or electronic
conductivity in the battery material. Perfect percolation systems throughout the electrode
material, which allow fast ion and electron movements, is needed to observe fast redox
systems in high power organic / inorganic electrodes.6
High energy density (Wh kg-1
= 3600 J kg-1
= cell potential (V) × specific capacity
(Ah kg-1
)): the cell voltage of commercial Li-intercalation-based cathode / anode systems
8
can deliver > 3.5 V, a value higher than most organic materials / Li combinations, and not
attainable by any organic / organic systems. However, organic materials can achieve
higher capacities compared to traditional LIBs (with maximum specific capacities of
180 mAh g-1
) and this can compensate the lower voltage of organic systems. For example,
the theoretical energy density of dimethyl viologen is ~ 820 Wh kg-1
(theoretical capacity
= 288 mAh g-1
× redox potential versus Li = 2.86 V), which is therefore higher than the
one of the established Li / LiCoO2, ~550 Wh kg-1
.7
Dissolution: the dissolution of molecular organic redox material during the
charging-discharging process is a big drawback, which finally results in a low cyclability.
The use of polymeric organic electrophores can circumvent this problem.
Intercalation: In the case of inorganic electroactive metal oxides or phosphates
with crystalline fixed places, Li+ ions (de-)intercalate between the lattice layers to
compensate the charge introduced by oxidation / reduction. In the case of an electroactive
redox polymer the subunits are generally amorphous and Li ions percolate within an
organic porous system for charge compensation of the redox subunits. The rigid
crystalline host is structurally restrained and does not change its shape during an
oxidation / reduction cycle, but in contrast to this, the organic or organometallic redox
polymer can adopt its best conformation during the redox process, leading generally to a
thickness change, a phenomenon described as “breathing”.
Structure redox tuning: The search for new types of inorganic materials has not
been very successful in recent years in spite of a huge amount of research invested in this
field, but mainly focused on a few structures. I believe that the synthesis of novel organic
redox polymers with optimized properties has a bigger chance to deliver useful
compounds because the synthetic variability is much larger than in the case of inorganic
materials. Effectively, the electrophores shown in Figure 1.2 is only a small non-
representative selection of possibilities.8
9
Low volumetric mass density (mAh cm-3
): the mass density of organic redox
materials is lower (1-1.5 g cm-3
) than that one of inorganic ones (CoO2: 6.4 g/cm3,
LiFePO4: 3.6 g cm-3
). This is due to heavy elements content and dens crystalline state of
inorganic materials. In devices, in which only high gravimetric density counts, this will
not considered as a disadvantage of the redox polymers, however, the volumetric energy
may play a role for applications with restricted place available, i.e. for smart watches,
mobile phones and electric vehicle.
Environmentally friendly: the finite resources of transition metals, their expensive
synthesis and recycling, as well as the danger of environmental pollution, if they are not
recycled, lead to the conclusion, that traditional LIBs are not sustainable. On the contrary,
organic redox materials can principally be prepared by synthesis from biomass, and they
are recyclable via the natural carbon dioxide cycle. Thus, redox polymers can be
considered as CO2 neutral.
Flexibility: Amorphous redox polymers are – in contrast to metal oxides or
phosphates - naturally flexible, and thus, allow principally the production of thin and
wearable batteries.
Low electronic conductivity: The single charge storing sites in a battery material
need to be able to exchange electrons with each other, according to either a band structure
model for crystalline solids, e.g. LiFePO4 or a backbone-poly thiophene, or according to
an electron hopping mechanism as for example for poly-Ferrocene. The charge
propagation mechanism has been discussed thoroughly in literature. It is absolutely not
trivial to distinguish limitations set by the electron propagation and those set by the
counterion movement. The addition of large amounts of conductive carbon is used to
increase the conductivity. However, this technique results in a lower specific capacity.
Due to the low mass density and high surface area of the organic compounds, a larger
amount of conductive carbon is necessary for organic redox materials compared to
crystalline inorganic materials.
10
Cheap: the organic electrode materials that may be principally prepared from
biomass sources are cheap and in contrast to LIBs, recycling is not necessary.
1.4. Motivations and methods of the present thesis
The main goal of the current thesis is to overcome the known limitations of the
organic electrodes such as low cyclability and low areal-capacity, and taking advantage of
the organic material’s high power-density. Small redox organic materials suffer from easy
dissolution in the electrolyte upon charging-discharging. This results in a fast loss of
capacity. Moreover, the dissolved molecules can shuttle between electrodes, which results
in self-discharging of the battery. The synthesis of polymeric redox material has been
shown as a reliable method to overcome the dissolution problem. However, considering
theoretical application, a simple synthesis route and choose of cheap raw materials are
crucial.
The factors influencing the areal-capacity (mAh cm-2
) are the theoretical capacity
of the redox material (Ctheoretical, mAh g-1
) and the construction of excellent percolation
paths for ions and electrons in the thick layers. The molecular weight of the organic
molecule (MW), which stabilizes the redox active unit and the number of redox states (n)
are important factors in the theoretical capacity of the redox molecule:
Eq. 1.1
where n is the number of involved electrons, F the Faraday constant, and Mw the molar
mass of the redox unit. The theoretical capacity can be increased by the synthesis of redox
organic units with low molar mass or by enabling a multi-redox reaction on one unit. An
excellent electronic and ionic conductivity of the active layer are also crucial factors for
the preparation of high areal capacity electrodes. Redox polymers have no / little
electronic conductivity (except conducting polymers e.g., polyaniline, which suffer from
11
low theoretical capacity), which limits their performance for battery application. There
have been many methods proposed to overcome this problem e.g., drop casting a thin
layer of polymer on the current collector; 9 electropolymerization on the surface of
electrode,10-11
spin-coating12
and others. The data obtained by electrochemical
measurements such as diffusion coefficient and electron transfer rate showed that in films
thicker than 200 nm ionic and electronic conductivity are limiting factors, which decrease
the electrode performance. Therefore, there have been many methods suggested to defeat
this problem. The synthesis of composites based on redox polymers / conductive fillers is
a known method, which is widely used, even in the state of the art of Li-ion13
and Li-S14
batteries. The conductive fillers are mainly nanostructured carbon materials e.g., graphite
and carbon nanotube. The addition of conductive polymers is also known, however, these
polymers are – in contrary to conductive carbons - just conductive in a specific potential
range (their doped state), which limits their application. Insertion of conductive carbon in
the polymer matrix provides conductivity throughout the composite, which accelerate the
electron / ion transfer from the current collector to the redox sites and vice versa. A high
rate response can be achieved when the redox sites are in direct / close contact to the
conductive fillers to enable a barrier-free electron transport. In addition to electron
conductivity, ionic conductivity is also an important factor in a fast charge-discharge
process. This is achieved through a porous system, which is mechanically stable after
several penetration / de-penetration cycles of electrolyte. It is reported that the necessary
amount of conductive additive in the polymers with large aromatic backbone such as
poly-Imides15
or poly-Anhydrides16
are less than in non-aromatic polymers. Electron-
hoping in non-aromatic polymers such as poly-Tempo and poly-Ferrocene also decreases
the necessary amount of conductive fillers.17
Anyway, addition of a large quantity of
conductive fillers (40-90 w% of the composite weight) to the redox organic materials is
necessary, which results in a considerable capacity loss of the composite. This is probably
due to the high surface area of organic materials. Hence, it is crucial to develop the
polymer-filler composites using the least amount of fillers with high utilization of redox
materials and considerably enhanced electrochemical response.18
Moreover, this
12
composite materials have to be scalable i. e., keep the high electrochemical performance
in the layers with thicknesses > 20 µm.
Recent studies on nanocomposites have shown that addition of 2% nanofillers e.g.,
exfoliated nanoclays19
and graphite nanoplatelets20
into the polymer matrix can
dramatically change the polymer’s properties. Beside the inherent properties of the
nanofiller, taking advantage of the high surface area of the nanofiller by optimizing the
dispersion quality, interface chemistry and nanoscale morphology have significant effect
on the polymer properties. The enormous interfacial area provided by well-dispersed
nanoparticles could affect the behavior of polymer matrix for several radii of gyration.21
Exfoliated graphite nano-platelets, carbon nanotubes and amorphous carbon have high
surface area. The highest electronic conductivity per mass and the highest surface to
volume ratio can be achieved by interconnected single graphene sheets, which are in close
contact with the redox active polymers. Graphene has already been used for the
development of battery materials, 6, 18
electrochromic devices,22
sensors,23
perovskite solar
cells 24-25
and others. Although graphene can provide a high surface area, it suffers from
low solubility in organic and aqueous media. This hampers the intended tight contact
between graphene single sheets and the polymer during synthesis and leads to phase
separation preventing the construction of the electron and / or ion percolating system on a
nanometer scale.26
In other words, strong interaction between the carbon fillers e.g.,
graphene or CNT and the redox polymers is a vital step towards tight contact and this
implies homogeneous dispersions of the partners prior to contact and high affinity
between components after contact. Well-dispersed carbon-based filler provides higher
surface areas and that results in more efficient neighboring interaction upon contact with
the polymer chains based inter alia on π- π stacking interaction,27
but the same type of
interaction makes it difficult to disperse e.g., graphene prior to contact with the polymer.
On the other hand, graphene oxide (GO), synthesized by chemical oxidation of graphite,28
or partially oxidized CNTs are bearing many oxygen-containing functional groups
(hydroxyl and epoxide functional groups on the basal plane of the sheets and carbonyl and
carboxyl groups at the sheet or tube edges), which make the ~1nm-thick-GO sheets and
13
tubes hydrophilic and therefore readily dispersible in polar solvents.28
For the last part of
the introduction the focus will be exclusively on GO, but the arguments for oxidized
CNTs are similar. Notably, the negative surface charge of GO prevents the association of
single GO sheets with each other, but it allows for self-assembling of individual GO
sheets with poly cationic polymers e.g., polyethyleneimine29
and poly(1-vinyl-3-
ethylimideazolium)bromide 30
. The efficient interaction of positively charged polymers
with negatively charged, individual GO sheets allows the preparation of suspensions with
high polymern+
/ GOm-
ratios, in which polymers are in direct / close contact to individual
GO sheets. Other reports also show electrostatic interaction of bio-molecules such as
peptides, proteins and amino acids 31-32
with GO sheets. In case of electroactive polymers,
it may be sufficient to oxidize them partially in order to generate polymern+
and to achieve
molecular wrapping, in other cases the positive charges have to be introduced on purpose
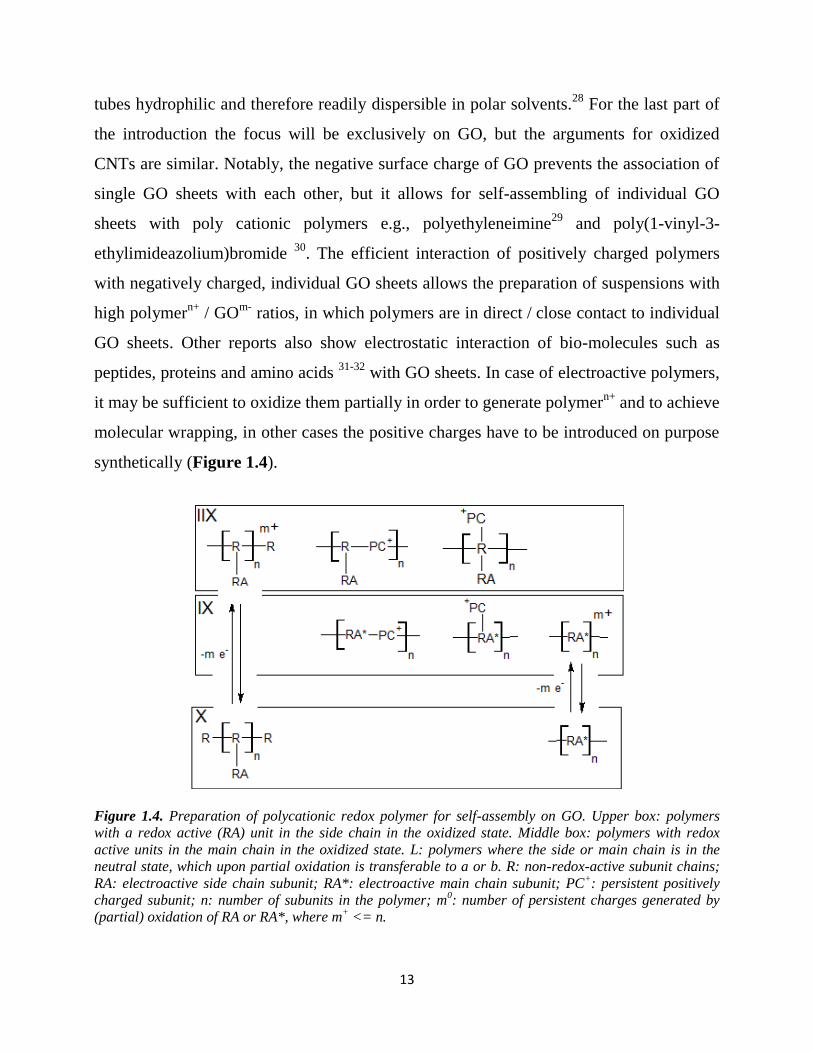
synthetically (Figure 1.4).
Figure 1.4. Preparation of polycationic redox polymer for self-assembly on GO. Upper box: polymers
with a redox active (RA) unit in the side chain in the oxidized state. Middle box: polymers with redox
active units in the main chain in the oxidized state. L: polymers where the side or main chain is in the
neutral state, which upon partial oxidation is transferable to a or b. R: non-redox-active subunit chains;
RA: electroactive side chain subunit; RA*: electroactive main chain subunit; PC+: persistent positively
charged subunit; n: number of subunits in the polymer; m0: number of persistent charges generated by
(partial) oxidation of RA or RA*, where m+ <= n.
a
14
In any case, if the wrapping is perfect, the distance between GO and the redox
centers is small, thus, electron transfer between GO in a conductive form and the
polymeric redox centers is possible. The surface of GO, depending on the polymer / GO
ratio, can be covered by a single or by multiple layers of the polymer. The specific
capacities at large current densities are tunable by the optimization of polymer / GO ratio.
The optimized ratio provides perfect ion and electron percolation system throughout the
composite layer, which is an important goal in this thesis. GO has only a minor
conductivity, but becomes conductive upon reduction.33
It can be reduced chemically,
thermally, and electrochemically to so-called "reduced graphene oxide" (rGO), a process
which regenerates many sp2 carbons at the periphery and within the plane of the original
graphene network and doing so, conductivity is re-established. Chemical reduction often
employs hazardous chemicals e.g., hydrazine.34
Thermal reduction of GO occurs in the
temperatures (> 600°C), in which many of organic polymers are not stable.35
The
electrochemical reduction technique, using a surface confined graphene oxide layer on the
electrode, is most adequate for GO modified electrode surfaces. The formation of a stable
redox polymer / GO colloidal solution and its application onto the current collector prior
to GO-rGO transition provides electrode, in which redox polymers are in contact with
individual sheets of conductive fillers i.e., rGO.
15
Chapter 2
Poly(vinylferrocene) - Reduced Graphene Oxide as a High Power /
High Capacity Cathodic Battery Material
Some parts of this chapter were published in “Adv. Energy Mater. 10.1002/aenm.201600108”
2.1. Overview
This Chapter is divided to 5 subchapters. After a short overview in the current
subchapter on the composite preparation and the characterization methods, the next
subchapter (2.2) will give an introduction on the state of the art organic battery materials
with main focus on the cathodic materials such as poly-Ferrocene and poly-Tempo. The
importance of using little wt% of conductive fillers is also discussed. In the subchapter
2.3, electrostatic interaction of GO and partially oxidized PVFc is investigated (Scheme
2.1 - I). Zeta potential and Vis measurements are used to characterize the supramolecular
formation of PVFc@GO in the aqueous solution and atomic force microscopy (AFM)
images exhibited the morphology of the composite in the dried state. In the subchapter
2.4, film formation of PVFc@GO on the current collector i.e., (PVFc@GO)@CC
(Scheme 2.1 – II) and electrocatalytic transformation of (PVFc@GO)@CC to
(PVFc@rGO)@CC is described (Scheme 2.1 – III). The electrocatalytic reduction is
evidenced by cyclic voltammetry (CV) and electrochemical quartz crystal microbalance
(EQCM). Raman measurements and a thermogravimetric method have also been used in
this subchapter to show the quality of GO / rGO transformation. Furthermore, the
dynamic of charging-discharging composite material on the current collector including
height change and weight change using Electrochemical-AFM (EC-AFM) and EQCM,
respectively, are studied. In the last subchapter (2.5), the energy storage performance of
the composite material including charge-discharge rate, thickness scalability and
cyclability is investigated. These measurements were performed by voltammetric and
galvanostatic techniques.
16
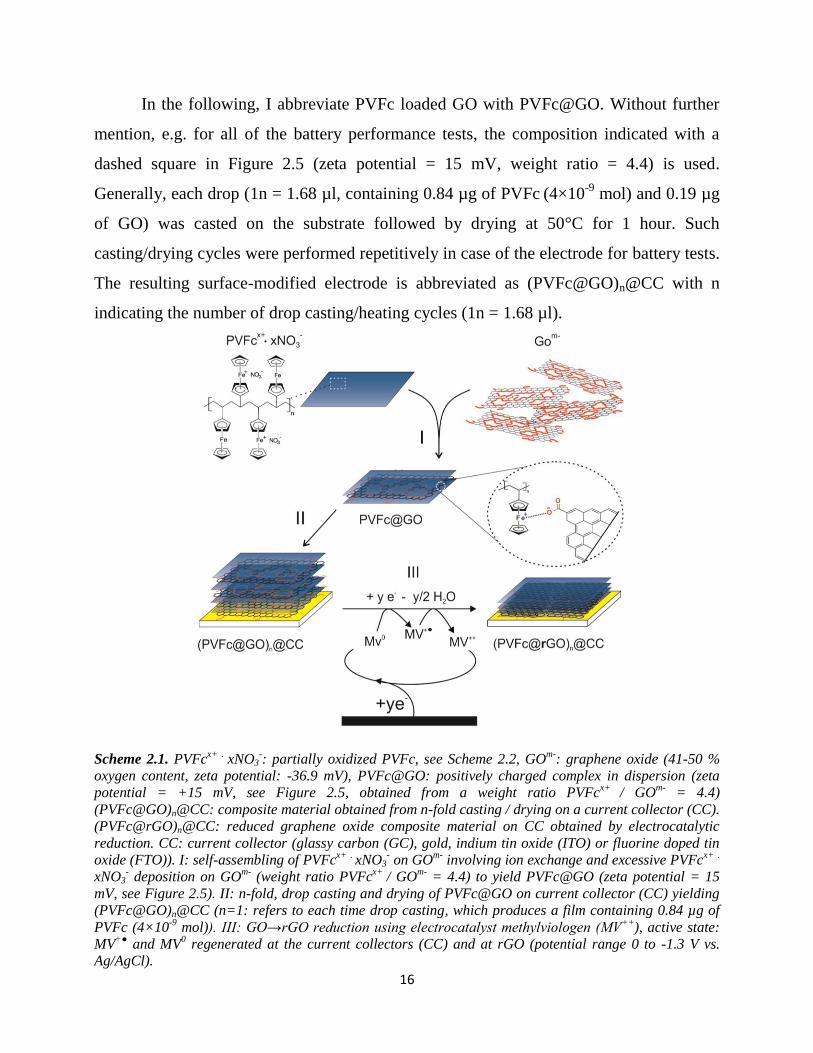
In the following, I abbreviate PVFc loaded GO with PVFc@GO. Without further
mention, e.g. for all of the battery performance tests, the composition indicated with a
dashed square in Figure 2.5 (zeta potential = 15 mV, weight ratio = 4.4) is used.
Generally, each drop (1n = 1.68 µl, containing 0.84 µg of PVFc (4×10
-9 mol) and 0.19 µg
of GO) was casted on the substrate followed by drying at 50°C for 1 hour. Such
casting/drying cycles were performed repetitively in case of the electrode for battery tests.
The resulting surface-modified electrode is abbreviated as (PVFc@GO)n@CC with n
indicating the number of drop casting/heating cycles (1n = 1.68 µl).
Scheme 2.1. PVFcx+ .
xNO3-: partially oxidized PVFc, see Scheme 2.2, GO
m-: graphene oxide (41-50 %
oxygen content, zeta potential: -36.9 mV), PVFc@GO: positively charged complex in dispersion (zeta
potential = +15 mV, see Figure 2.5, obtained from a weight ratio PVFcx+
/ GOm-
= 4.4)
(PVFc@GO)n@CC: composite material obtained from n-fold casting / drying on a current collector (CC).
(PVFc@rGO)n@CC: reduced graphene oxide composite material on CC obtained by electrocatalytic
reduction. CC: current collector (glassy carbon (GC), gold, indium tin oxide (ITO) or fluorine doped tin
oxide (FTO)). I: self-assembling of PVFcx+
. xNO3
- on GO
m- involving ion exchange and excessive PVFc
x+ .
xNO3- deposition on GO
m- (weight ratio PVFc
x+ / GO
m- = 4.4) to yield PVFc@GO (zeta potential = 15
mV, see Figure 2.5). II: n-fold, drop casting and drying of PVFc@GO on current collector (CC) yielding
(PVFc@GO)n@CC (n=1: refers to each time drop casting, which produces a film containing 0.84 µg of
PVFc (4×10⁻⁹
mol)). III: GO→rGO reduction using electrocatalyst methylviologen (MV++
), active state:
MV+●
and MV0 regenerated at the current collectors (CC) and at rGO (potential range 0 to -1.3 V vs.
Ag/AgCl).
17
2.2. Introduction
Energy density, power density, low cost and long cycle life are the main factors for
mobile battery applications.36-37
Li–ion batteries, which are based on the intercalation
concept of Li+ in the anodic and cathodic materials dominate today's rechargeable battery
market for small mobile up to automotive applications. However, costs, safety concerns,
restricted energy and power densities are still a problem.38-39
The Li–ion batteries’
restricted energy and power density originates mainly from the cathodic battery material,
consisting of a stable intercalation framework, e.g., electroactive transition–metal oxides
or phosphates. Rapid charging and discharging are limited by slow (de)intercalation of
lithium ions and by low electronic conductivity.
Organic materials can provide a light weight framework with a higher specific
capacity as compared to inorganic materials.8 Their oxidation potential can be tuned by
chemical synthesis and their electronic conductivity can be optimized on the molecular
level. Furthermore, they are potentially cheap and recyclable.8 Sulfide–, free radical–,
and aromatic carbonyl–based conductive or non-conductive materials, e.g. ferrocenes or
viologens have been studied as organic energy storage materials.8, 10, 40-43
Ferrocene-based materials have shown unique properties such as air stability, fast
electrochemical kinetics and a stable voltage plateau leading to the development of the
ferrocene–based reference electrode, and cathodic battery material.44-49
Moreover,
ferrocene-based materials, especially side–chain attached polymeric ferrocenes, have
attracted much attention in the field of "redox responsive materials / polymers" e.g. redox
triggered release of a dye from patchy nanocapsules,50
in catalysis modulation,51
for
switching surface wettability,52
and some other applications such as memory devices,
nanoparticle synthesis and permselective membrane gating.53
There have been several
reports on ferrocene–based polymer batteries with ferrocene either in the backbone of the
polymer chain or as pendant group of the chain.46-47, 54-57
Side–chain ferrocene–containing
polymers are electrically insulating, which limits their use as energy storage material to
small thicknesses if fast charging / discharging kinetics are required. The electronic
18
conductivity can be enhanced by incorporation of conductive polymers / carbon materials.
It has been shown that for nanocomposites, the addition of a small quantity of filler can be
sufficient as long as the dispersion quality, interfacial chemistry and the nanoscale
morphology are optimized.21
Exfoliated and well–dispersed fillers such as graphite
nanoplatelets,20, 58
carbon nanotubes (CNTs)59-60
and nanoclays19
increase the interfacial
areas, which affect the behavior of the neighboring polymer matrix to the distance of
several radii of gyration.21, 61-62
From a theoretical perspective, the highest electronic
conductivity per mass and the highest surface to area ratio can be achieved for
interconnected single graphene sheets, which are in close contact with the redox
polymers. However, owing to the poor solubility of graphene sheets in water and organic
solvents, the preparation of graphene single sheets and their controlled molecular
interaction with redox polymers is difficult.
In contrast to pristine graphite, graphite oxide is heavily oxygenated, bearing
hydroxyl and epoxide functional groups on its basal planes and carbonyl and carboxylic
groups on its sheet edges.63-64
Its hydrophilic nature allows graphite oxide to readily swell
and disperse in water, producing 1nm thick graphene oxide (GO) sheets upon mild
ultrasonic treatment.65
In fact, exfoliation of graphite oxide is the most efficient way to
produce suspensions of carbon sheets, making it an ideal filler for polymer
nanocomposites.66
Unlike graphite, GO is electrically insulating, which is inappropriate
for conductive filler applications. Partial restoration of the extended graphitic sp2
carbons
network by different types of reduction of GO to reduced graphene oxide (rGO) is
possible. The reduction can be chemical, thermal, or electrochemical with the latter
reported as especially mild.67
There are also indications in literature that viologen may
electrocatalyse the reduction of GO to rGO.68-69
The reduction reestablishes electronic
conductivity, but leads also to irreversible coagulation of rGO and again tight interaction
of a single rGO sheets with polymer strands is difficult after the reduction step.66
Some
successful efforts have been reported to stabilize graphene or rGO in solution, for
example, by chemical functionalization or by using non–covalent interaction with
surfactants providing stable platelets of graphene sheets in aqueous solution.33, 70
19
However, the weight increase introduced with such additives just for dispersibility
reasons has a negative impact on the specific capacity of the final battery material. It is
therefore a challenging task to find electroactive polymers able to directly disperse single
sheet graphene, rGO or GO (followed by GO / rGO transformation) without the use of
dispersing agents with negative ballast implications in the final composite material.
In the present chapter a way to disperse negatively charged GO single sheets with
partially oxidized poly(vinylferrocene) by electrostatic interactions using polymer / GO
weight ratios up to 10:1 is shown. Zeta potential measurements, electrochemical results
and AFM studies show tight molecular interactions. Achieving a high weight ratio of
electron storage material to conductive filler combined with excellent percolation paths
for ions and electrons was a main goal of this study. It is shown that individual GO sheets
are well–dispersed throughout the polymer matrix and that is achieved in the current case
by supramolecular polymer–GO complex formation prior to the polymer–GO / polymer–
rGO transformation. For this purpose the stable colloidal polymer-GO solution was
directly deposited on the current collector, and electrochemically reduced to polymer-rGO
using methyl viologen dichloride (MV++
) as homogenous electrocatalyst (Scheme 2.1).
The reductive removal of oxygen–containing functional groups was monitored by
Electrochemical Quartz Crystal Microbalance (EQCM), and the electrocatalytic role of
MV++
was demonstrated by cyclic voltammetry (CV). Electrochemical tests have shown
that after GO / rGO transformation the electronic and ionic conductivity of PVFc where
significantly enhanced; e. g., a film of (PVFc@rGO)@GC with a specific capacity of
5.8 mC cm-2
was > 98% charged / discharged in less than 3 seconds, and increasing the
layer thickness up to ca. 29 µm yielded a capacity of 770 mC cm-2
accompanied by just
1% capacity fade. These values are significantly higher than previously reported nitroxide
radical polymers, which provided best capacities smaller than 150 mC cm-2
.71-74
20
2.3. Formation and characterization of PVFc@GO supramolecular complex
2.3.1. Introduction
A complex of molecules, which are held together by non-covalent bonds (e.g.,
electrostatic, H bonding or π-π interaction) is called a supramolecular assembly. The
supramolecular assemblies can involve small molecules e.g., dimmers of acetic acid in the
gas phase, or it can involve larger subunits to yield complexes in the nanometer to
micrometer range hold together by so called weak non-covalent interactions. Based on the
surface charge of all components dispersed in aqueous solution and the recalling
supramolecular assembly, stable colloidal solutions can be achieved for the components
as well as the supramolecular complexes.
Graphene oxide (GO) consist of aromatic graphitic domains separated by sp3
carbons, which are decorated by oxygen-containing functional groups such as hydroxyl,
epoxy and carboxylic. Hydroxyl groups of GO allows hydrogen bonds with molecules
containing hydroxyl groups.75
Negative charge of GO resulted from ionization of
carboxyl groups (-COOH)76
allows electrostatic interaction with positively charged
molecules. The graphitic domains of GO allows π-π interaction with π-conjugated
materials.18
Also, GO can be dispersed in various solvent e.g., water, DMF, DMSO and
ethylene glycol, which is due to its amphiphilicity (hydrophilic edges arise from oxygen-
containing functional groups and hydrophobic central basal plane originated from the
graphitic domains). Therefore, The supramolecular assembly of GO is possible by
different non-covalent bonds in various interfaces. Also, many functional groups on GO
allow hybridization with a big variety of materials such as DNA, metal oxides, polymers,
inorganic nanoparticles and others.77-80
The interaction of GO with other components bound by covalent or supramolecular
interaction has been studied by different methods. For example, GO can quench the
florescence of several dye-labeled peptides for biosensing81
or can quench the fluorescent
assay of biomolecules such as amino acids and proteins.32
This quenching process is
studied by florescence spectroscopy. Another method which has been extensively used to
21
investigate the aqueous dispersibility of GO at various pH values,82
as well as GO’s
interaction with other charged materials e.g., organic polymers is zeta potential
measurement (ζ).29
Zeta potential is an important factor in many applications such as
characterization of biomedical polymers,83
electrokinetic transport of particles84
or blood
cells85
and microfluidics.86
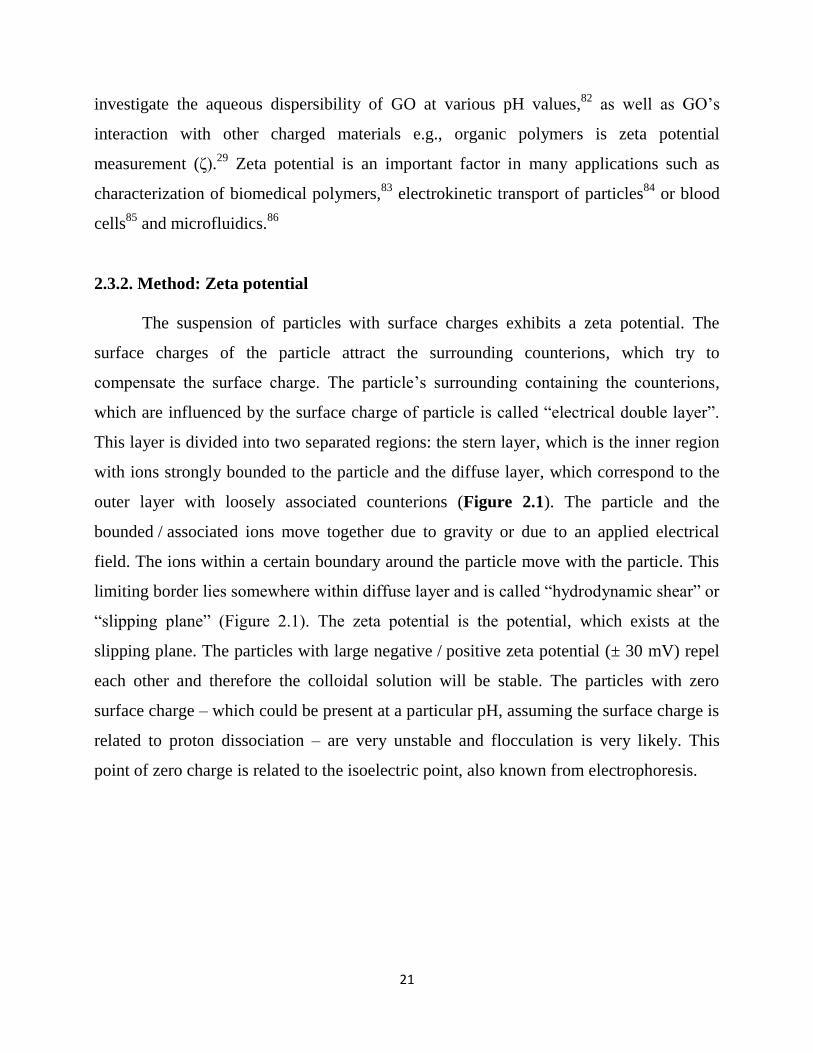
2.3.2. Method: Zeta potential
The suspension of particles with surface charges exhibits a zeta potential. The
surface charges of the particle attract the surrounding counterions, which try to
compensate the surface charge. The particle’s surrounding containing the counterions,
which are influenced by the surface charge of particle is called “electrical double layer”.
This layer is divided into two separated regions: the stern layer, which is the inner region
with ions strongly bounded to the particle and the diffuse layer, which correspond to the
outer layer with loosely associated counterions (Figure 2.1). The particle and the
bounded / associated ions move together due to gravity or due to an applied electrical
field. The ions within a certain boundary around the particle move with the particle. This
limiting border lies somewhere within diffuse layer and is called “hydrodynamic shear” or
“slipping plane” (Figure 2.1). The zeta potential is the potential, which exists at the
slipping plane. The particles with large negative / positive zeta potential (± 30 mV) repel
each other and therefore the colloidal solution will be stable. The particles with zero
surface charge – which could be present at a particular pH, assuming the surface charge is
related to proton dissociation – are very unstable and flocculation is very likely. This
point of zero charge is related to the isoelectric point, also known from electrophoresis.
22
Figure 2.1. Schematic
representation of the
distribution of cations around
a particle with negative
surface charge in solution.
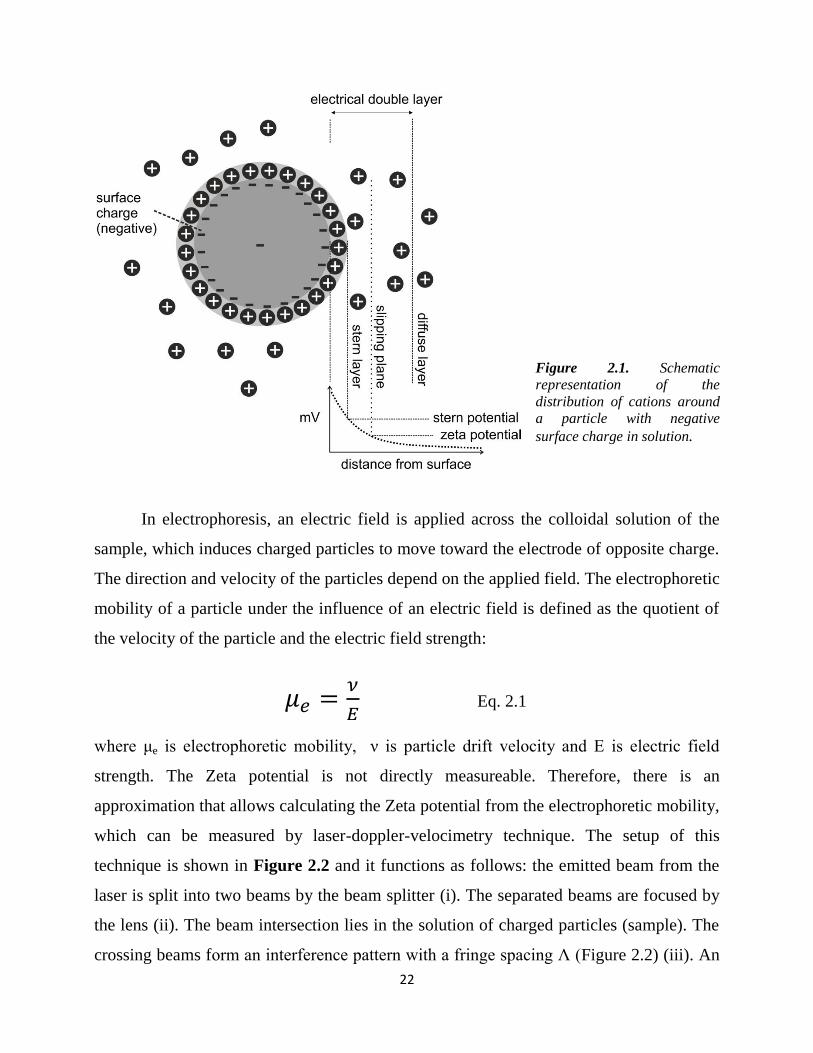
In electrophoresis, an electric field is applied across the colloidal solution of the
sample, which induces charged particles to move toward the electrode of opposite charge.
The direction and velocity of the particles depend on the applied field. The electrophoretic
mobility of a particle under the influence of an electric field is defined as the quotient of
the velocity of the particle and the electric field strength:
Eq. 2.1
where μe is electrophoretic mobility, ν is particle drift velocity and E is electric field
strength. The Zeta potential is not directly measureable. Therefore, there is an
approximation that allows calculating the Zeta potential from the electrophoretic mobility,
which can be measured by laser-doppler-velocimetry technique. The setup of this
technique is shown in Figure 2.2 and it functions as follows: the emitted beam from the
laser is split into two beams by the beam splitter (i). The separated beams are focused by
the lens (ii). The beam intersection lies in the solution of charged particles (sample). The
crossing beams form an interference pattern with a fringe spacing Ʌ (Figure 2.2) (iii). An
23
electrical field is applied through the sample, which causes a flow of the charged particles
(iv). While the particles pass through the interference pattern, they scatter the light and
thus produce a scattering signal (v) with a shifted frequency compared to the incident
beam. The scattered signal is then focused by the second lens (vi) and detected by the
detector (vii) (Figure 2.2). The electrophoretic mobility can be calculated from the
measured Doppler frequency shift. By application of Smoluchowski theories,87
the
measured particle mobility can be converted to the Zeta potential as shown in Henry’s
equation:
Eq. 2.2
where UE is electrophoretic mobility, z zeta potential, ε dielectric constant, η viscosity
and f(Ka) Henry’s function (f(Ka) in aqueous solution is often 1.5 and in non-aqueous
solution is 1).
Figure 2.2. Principles of laser Doppler velocimetry.
24
2.3.3. Experimental section
2.3.3.1. Instruments
Vis absorption spectra were measured using a photodiode array agilent 8452 UV-
visible spectrophotometer (Hewlett Packard). Zeta potential values were obtained using a
Zetasizer nano ZS (Malvern Instruments, Model ZEN3600) at 25°C with a 633nm laser in
a DTS1070 cell. The sonification was performed using ultrasonic bath (VWR
USC300TH, 80W). AFM images were captured with Flex-Axiom “Nanosurf” using
supersharp silicon probe (SSS-NCLR, NANOSENSORSTM) in dry state.
2.3.3.2. Chemicals
All the chemicals and solvents were from Sigma–Aldrich and used as received
without further purification, unless otherwise stated. Solvents for the electrochemistry and
spectroscopy were of 99.9% purity. Acetonitrile and diethyl ether were from Sigma
Aldrich (> 99.9%). Silver nitrate (AgNO3) was purchased from Fluka (> 99.0% purity).
Graphene oxide (GO) was from “Graphenea” delivered as an aqueous solution (4 mg
GO in 1 mL H2O); elemental analysis: carbon: 49 – 56%, hydrogen: 0 – 1%, nitrogen: 0 –
1%, sulfur: 0 – 2% and, oxygen: 41 – 50%; monolayer content (measured in 0.5 mg/mL):
>95%; pH: 2.2 – 2.5. The cellulose membrane for dialysis tubing was from
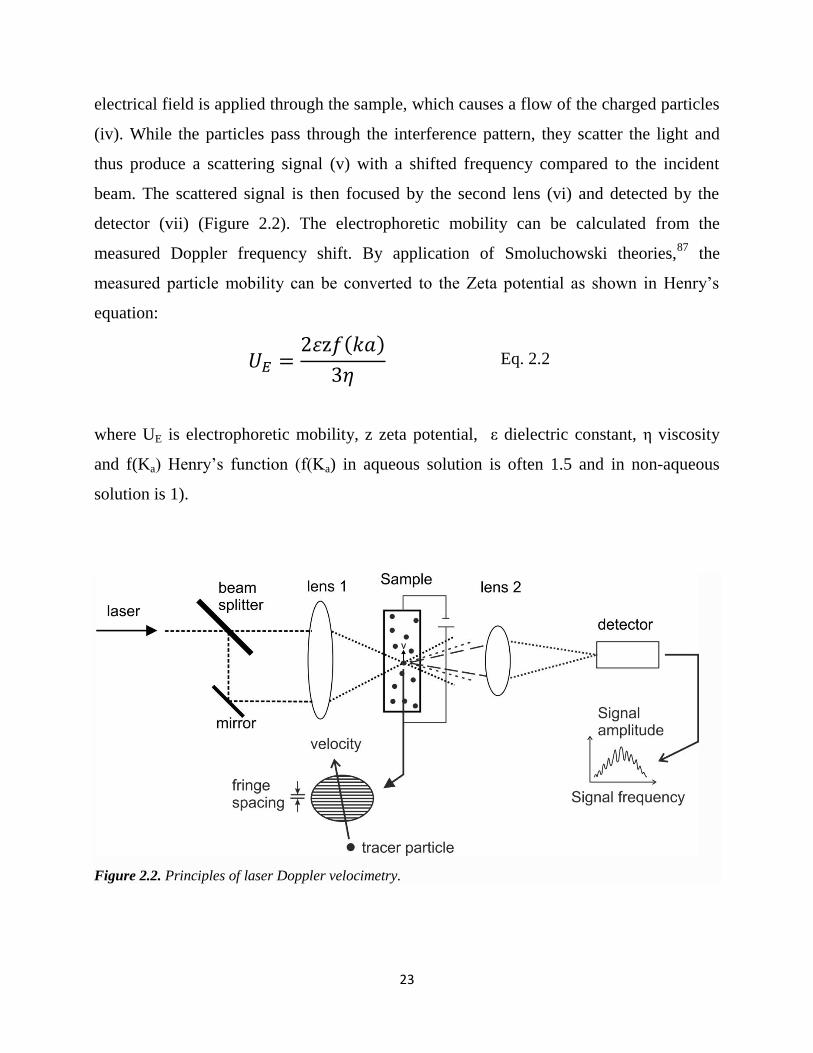
“SPECTRUMLABS” with MWCO: 3.5 kDa. PVFc was delivered with following
characteristics: 88 size exclusion chromatography (conventional vs PS standards), RI 7070
g/mol, Mn – Mw 8870 g mol-1
and PDI 1.26. SEC-MALLS RI: Mw: 11640 g/mol. H
NMR (CDCl3): δ = 0.80-2.70 (H1,2
), 3.65- 4.55 (H4-6
). 13
C NMR (CDCl3): δ = 33 (C1), 43 (C
2), 67
(C4,5
), 68.5 (C6), 95.5 (C
3).
25
The purity of PVFc was further assessed by a Vis absorbance in diethyl ether using
(monomeric ferrocene) = 420 as a standard,89 shows 98% of the expected subunits (see
Figure 2.3 and subchapter 2.3.3.3 for more details). Additionally, the observed coulombs
(integral of cathodic peak) of a thin polymer layer (200 nm) obtained from a cyclic
voltammetry test shows > 96% of the applied subunits (see Figure 2.23 and subchapter
2.5.3 for more details).
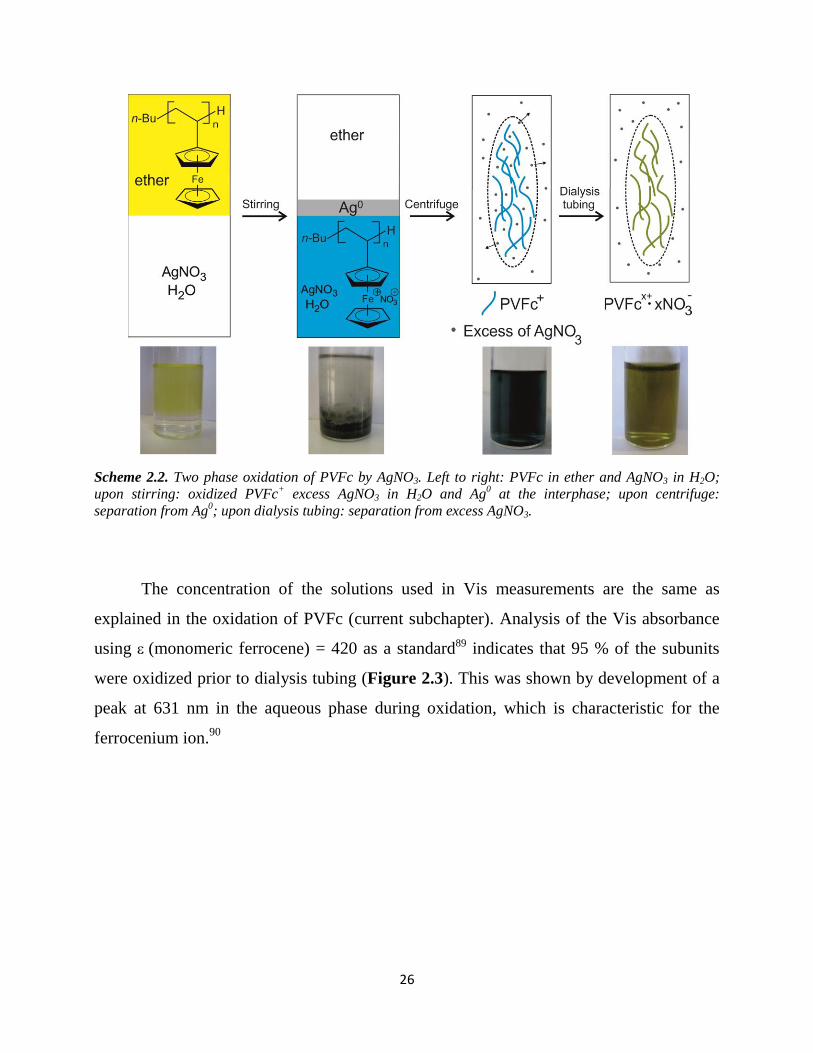
2.3.3.3. Oxidation of poly(vinylferrocene) (PVFc)
50 mg PVFc (see 2.3.3.2 for details) was dispersed in diethyl ether (300 ml), then
0.1M AgNO3 (50 ml) was added (scheme 2.2). The resulting biphasic solution was
agitated by mechanical stirring (1300 rpm) for 50 min. The end of the reaction was
indicated by the disappearance of yellow color in the organic phase and appearance of
blue color in the aqueous phase. Precipitated Ag0 between the two phases was removed
by filtration. The blue aqueous phase was isolated and centrifuged to remove remaining
silver particles. The excess of AgNO3 was removed by dialysis tubing of the aqueous
phase (extracting compartment: agitated water for four days, daily exchanged). Separation
of the phases and dialysis of the aqueous phase - to get rid of excess Ag+ ions - yielded a
green aqueous solution of partially oxidized PVFc (PVFcx+ .
xNO3-), which was stable
over 8 months (Scheme 2.2).
26
Scheme 2.2. Two phase oxidation of PVFc by AgNO3. Left to right: PVFc in ether and AgNO3 in H2O;
upon stirring: oxidized PVFc+ excess AgNO3 in H2O and Ag
0 at the interphase; upon centrifuge:
separation from Ag0; upon dialysis tubing: separation from excess AgNO3.
The concentration of the solutions used in Vis measurements are the same as
explained in the oxidation of PVFc (current subchapter). Analysis of the Vis absorbance
using (monomeric ferrocene) = 420 as a standard89 indicates that 95 % of the subunits
were oxidized prior to dialysis tubing (Figure 2.3). This was shown by development of a
peak at 631 nm in the aqueous phase during oxidation, which is characteristic for the
ferrocenium ion.90
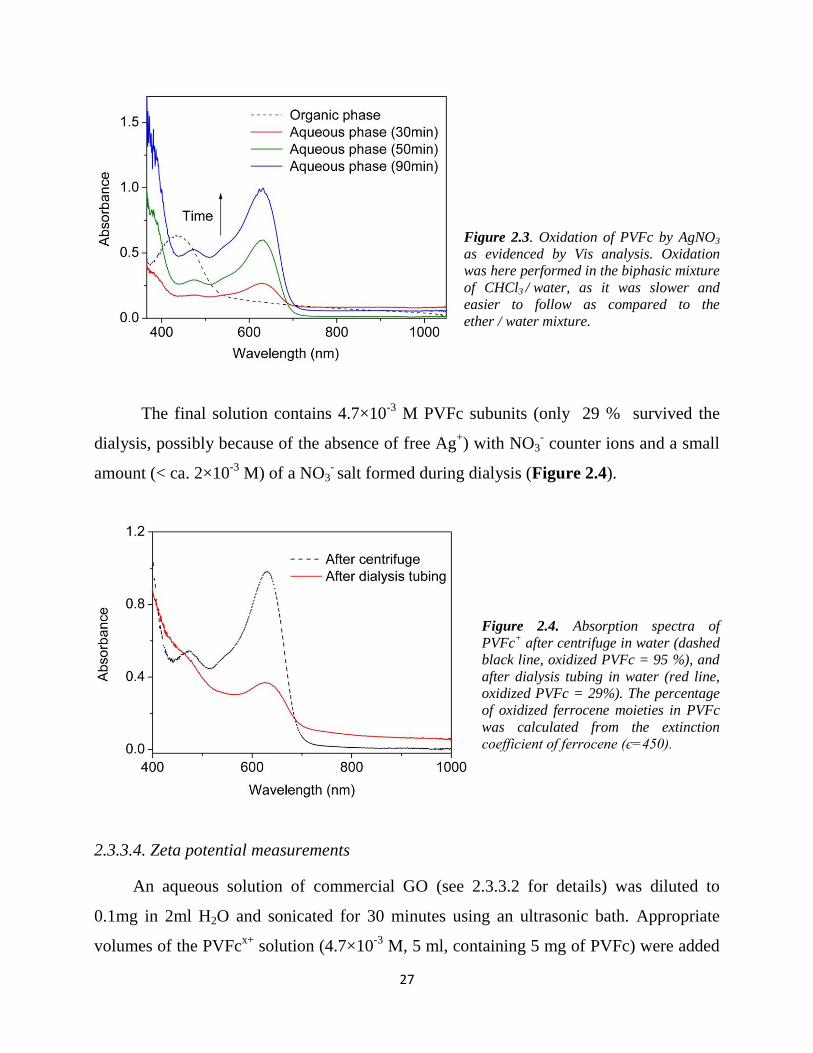
27
Figure 2.3. Oxidation of PVFc by AgNO3
as evidenced by Vis analysis. Oxidation
was here performed in the biphasic mixture
of CHCl3 / water, as it was slower and
easier to follow as compared to the
ether / water mixture.
The final solution contains 4.7×10⁻³
M PVFc subunits (only 29 % survived the
dialysis, possibly because of the absence of free Ag+) with NO3
- counter ions and a small
amount (< ca. 2×10⁻³
M) of a NO3- salt formed during dialysis (Figure 2.4).
Figure 2.4. Absorption spectra of
PVFc+ after centrifuge in water (dashed
black line, oxidized PVFc = 95 %), and
after dialysis tubing in water (red line,
oxidized PVFc = 29%). The percentage
of oxidized ferrocene moieties in PVFc
was calculated from the extinction
coefficient of ferrocene (є=450).
2.3.3.4. Zeta potential measurements
An aqueous solution of commercial GO (see 2.3.3.2 for details) was diluted to
0.1mg in 2ml H2O and sonicated for 30 minutes using an ultrasonic bath. Appropriate
volumes of the PVFcx+
solution (4.7×10⁻³
M, 5 ml, containing 5 mg of PVFc) were added
28
under sonification over 10 min to 0.1 ml of the GO solution and the final mixtures were
diluted to 1ml under sonification for another 5 min. The polymer solutions with same
concentration were prepared accordingly. 0.8 ml of the dispersions was measured in a
DTS1070 cell (see 2.3.3.1 for details). An average value was calculated from six
subsequent measurements.
2.3.3.5. Modeling
The following programs were used: Hyperchem (HyperChem(TM) Professional
8.0.8, Hypercube, Inc., 1115 NW 4th Street, Gainesville, Florida 32601, USA), Arguslab
(M. Thompson, ArgusLab 4.0.1, Planaria software LLC, Seattle, Wash, USA,
HTTP://www.arguslab.com, 2004), Gabedit 2.4.891
and MOPAC (J. Stewart,
MOPAC2012, Stewart Computational Chemistry, Colorado Springs, CO, USA,
HTTP://OpenMOPAC.net, 2012). Modeling was performed by Lorenz Walder.
2.3.3.6. Atomic Force Microscopy (AFM)
The electrodes were prepared by drop casting of GO (ca. 20 µg cm-2
) or
PVFcx+ .
xNO3- (ca. 12 µg cm
-2)
or PVFc@GO solution (PVFc / GO = 1, ca. 14.7 µg cm
-2)
on the glassy carbon electrode followed by drying at 50°C for 1 hour results in GO@GC
or (PVFcx+ .
xNO3-)@GC or (PVFc@GO)n@CC, respectively. The AFM images were
captured by Shamaila Sadaf.
2.3.4. Results and Discussion
2.3.4.1. Zeta potential measurement
A strong electrostatic interaction and a stable contact between PVFcx+
. xNO3
- and
GOm-
are key factors for producing a composite, in which GO is homogenously
distributed in the polymer matrix. The quality of the PVFc@GO dispersion is crucial for
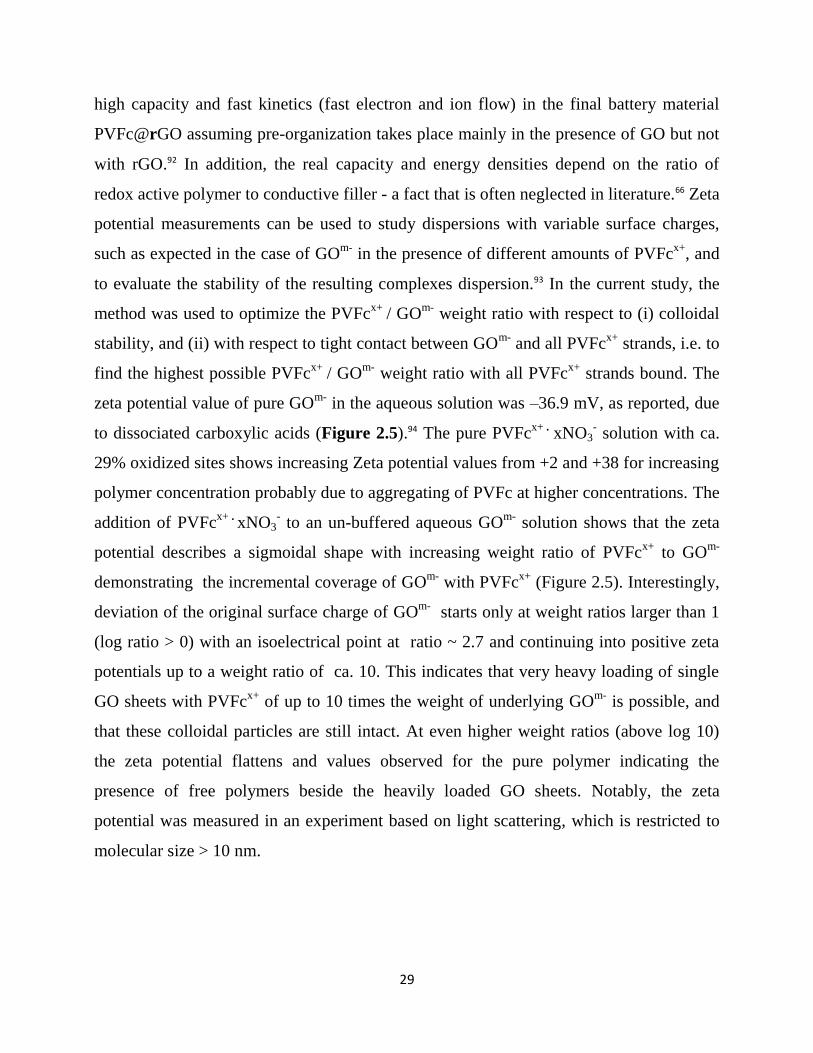
29
high capacity and fast kinetics (fast electron and ion flow) in the final battery material
PVFc@rGO assuming pre-organization takes place mainly in the presence of GO but not
with rGO.92 In addition, the real capacity and energy densities depend on the ratio of
redox active polymer to conductive filler - a fact that is often neglected in literature.66 Zeta
potential measurements can be used to study dispersions with variable surface charges,
such as expected in the case of GOm-
in the presence of different amounts of PVFcx+
, and
to evaluate the stability of the resulting complexes dispersion.93 In the current study, the
method was used to optimize the PVFcx+
/ GOm-
weight ratio with respect to (i) colloidal
stability, and (ii) with respect to tight contact between GOm-
and all PVFcx+
strands, i.e. to
find the highest possible PVFcx+
/ GOm-
weight ratio with all PVFcx+
strands bound. The
zeta potential value of pure GOm-
in the aqueous solution was –36.9 mV, as reported, due
to dissociated carboxylic acids (Figure 2.5).94 The pure PVFcx+ .
xNO3- solution with ca.
29% oxidized sites shows increasing Zeta potential values from +2 and +38 for increasing
polymer concentration probably due to aggregating of PVFc at higher concentrations. The
addition of PVFcx+ .
xNO3- to an un-buffered aqueous GO
m- solution shows that the zeta
potential describes a sigmoidal shape with increasing weight ratio of PVFcx+
to GOm-
demonstrating the incremental coverage of GOm-
with PVFcx+
(Figure 2.5). Interestingly,
deviation of the original surface charge of GOm-
starts only at weight ratios larger than 1
(log ratio > 0) with an isoelectrical point at ratio ~ 2.7 and continuing into positive zeta
potentials up to a weight ratio of ca. 10. This indicates that very heavy loading of single
GO sheets with PVFcx+
of up to 10 times the weight of underlying GOm-
is possible, and
that these colloidal particles are still intact. At even higher weight ratios (above log 10)
the zeta potential flattens and values observed for the pure polymer indicating the
presence of free polymers beside the heavily loaded GO sheets. Notably, the zeta
potential was measured in an experiment based on light scattering, which is restricted to
molecular size > 10 nm.
30
Figure 2.5. Zeta potential of GOm-
(0.05
w%, -36.9 mV) in the presence of
increasing amounts of PVFcx+ .
xNO3- given
as log (weight ratio) (-●- black); and zeta
potential of PVFcx+ .
xNO3-
at different
subunit concentrations (-■- red). Notably,
the PVFcx+ .
xNO3-
concentration axis is
valid for both curves. Preparation of the
solutions is explained in the subchapter
2.3.3.4.
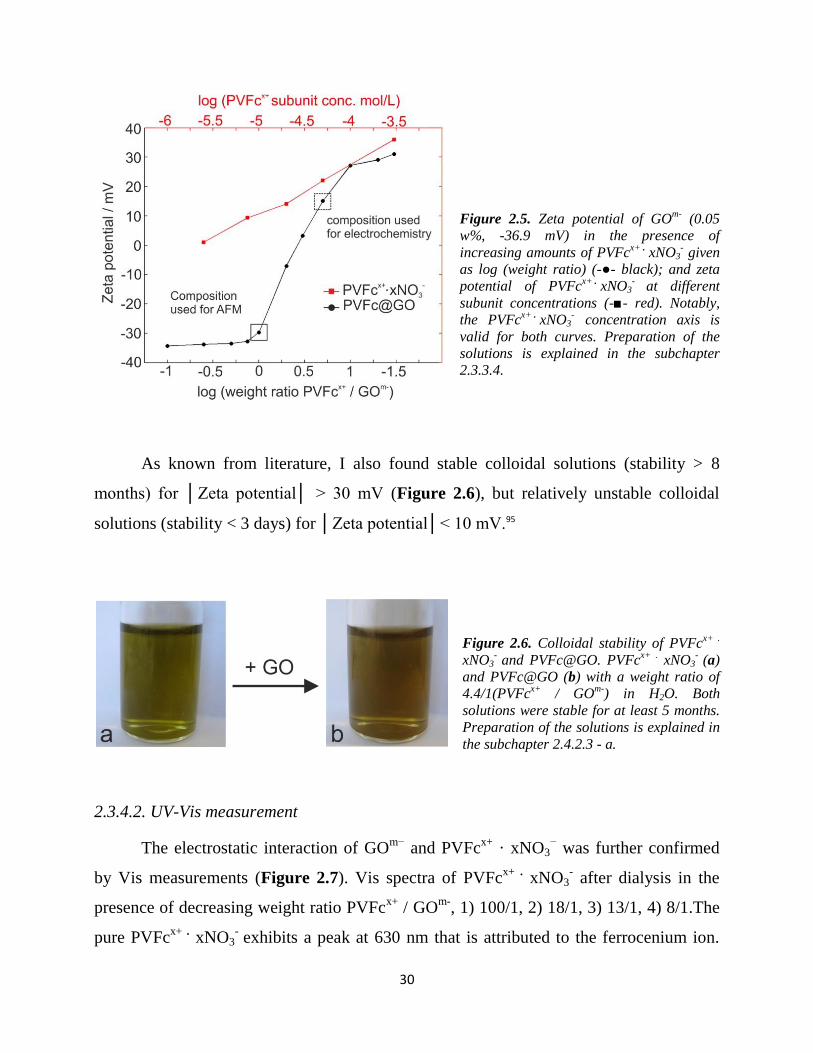
As known from literature, I also found stable colloidal solutions (stability > 8
months) for │Zeta potential│ > 30 mV (Figure 2.6), but relatively unstable colloidal
solutions (stability < 3 days) for │Zeta potential│< 10 mV.95
Figure 2.6. Colloidal stability of PVFcx+ .
xNO3-
and PVFc@GO. PVFcx+ .
xNO3-
(a)
and PVFc@GO (b) with a weight ratio of
4.4/1(PVFcx+
/ GOm-
) in H2O. Both
solutions were stable for at least 5 months.
Preparation of the solutions is explained in
the subchapter 2.4.2.3 - a.
2.3.4.2. UV-Vis measurement
The electrostatic interaction of GOm−
and PVFcx+
· xNO3− was further confirmed
by Vis measurements (Figure 2.7). Vis spectra of PVFcx+ .
xNO3- after dialysis in the
presence of decreasing weight ratio PVFcx+
/ GOm-
, 1) 100/1, 2) 18/1, 3) 13/1, 4) 8/1.The
pure PVFcx+ .
xNO3- exhibits a peak at 630 nm that is attributed to the ferrocenium ion.
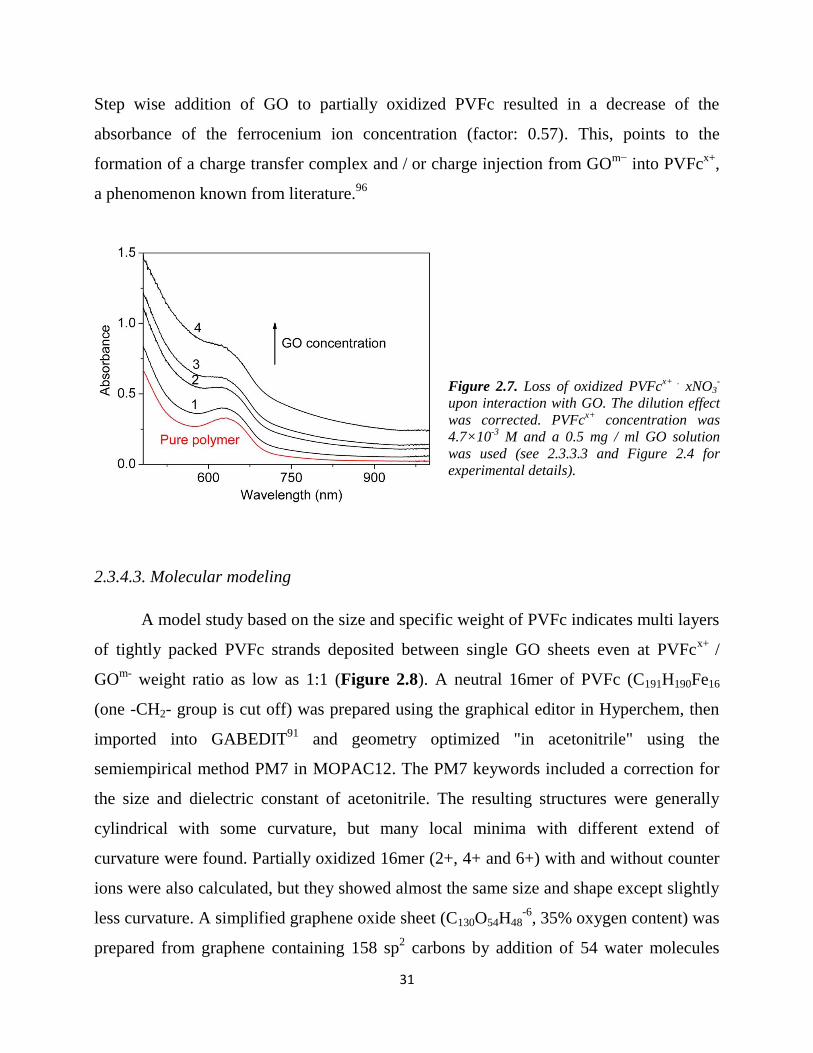
31
Step wise addition of GO to partially oxidized PVFc resulted in a decrease of the
absorbance of the ferrocenium ion concentration (factor: 0.57). This, points to the
formation of a charge transfer complex and / or charge injection from GOm−
into PVFcx+
,
a phenomenon known from literature.96
Figure 2.7. Loss of oxidized PVFcx+ .
xNO3-
upon interaction with GO. The dilution effect
was corrected. PVFcx+
concentration was
4.7×10⁻³
M and a 0.5 mg / ml GO solution
was used (see 2.3.3.3 and Figure 2.4 for
experimental details).
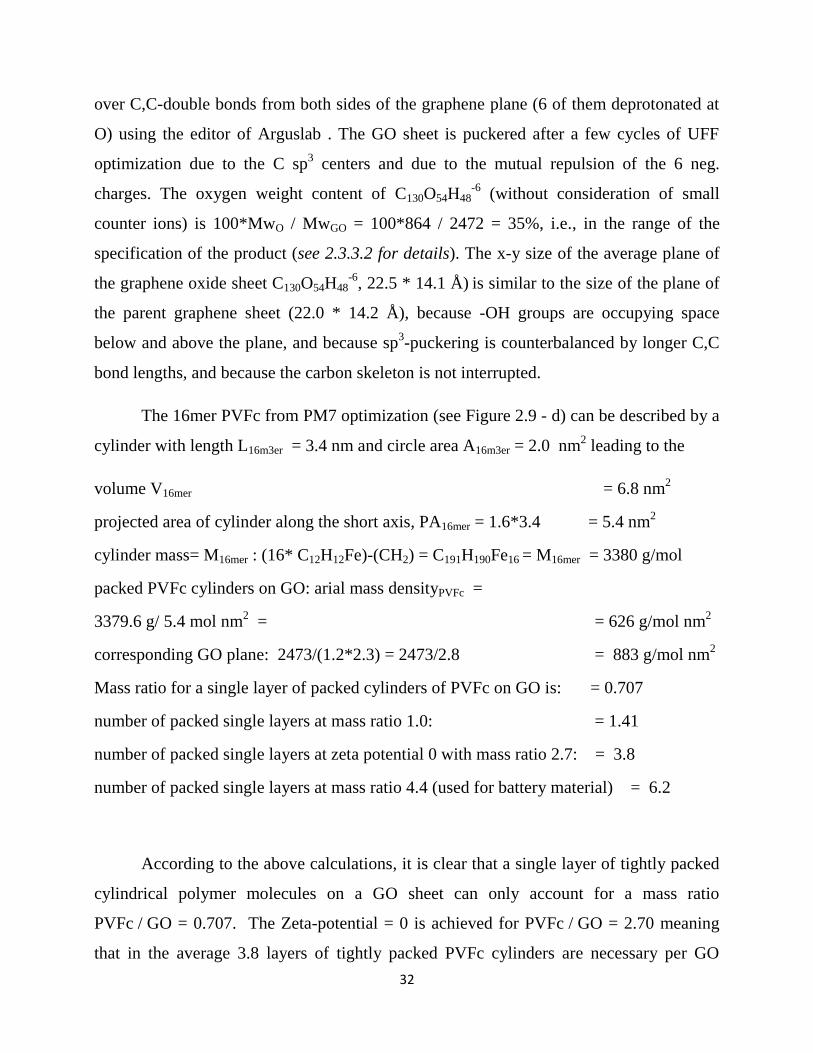
2.3.4.3. Molecular modeling
A model study based on the size and specific weight of PVFc indicates multi layers
of tightly packed PVFc strands deposited between single GO sheets even at PVFcx+
/
GOm-
weight ratio as low as 1:1 (Figure 2.8). A neutral 16mer of PVFc (C191H190Fe16
(one -CH2- group is cut off) was prepared using the graphical editor in Hyperchem, then
imported into GABEDIT91
and geometry optimized "in acetonitrile" using the
semiempirical method PM7 in MOPAC12. The PM7 keywords included a correction for
the size and dielectric constant of acetonitrile. The resulting structures were generally
cylindrical with some curvature, but many local minima with different extend of
curvature were found. Partially oxidized 16mer (2+, 4+ and 6+) with and without counter
ions were also calculated, but they showed almost the same size and shape except slightly
less curvature. A simplified graphene oxide sheet (C130O54H48-6
, 35% oxygen content) was
prepared from graphene containing 158 sp2 carbons by addition of 54 water molecules
32
over C,C-double bonds from both sides of the graphene plane (6 of them deprotonated at
O) using the editor of Arguslab . The GO sheet is puckered after a few cycles of UFF
optimization due to the C sp3 centers and due to the mutual repulsion of the 6 neg.
charges. The oxygen weight content of C130O54H48-6
(without consideration of small
counter ions) is 100*MwO / MwGO = 100*864 / 2472 = 35%, i.e., in the range of the
specification of the product (see 2.3.3.2 for details). The x-y size of the average plane of
the graphene oxide sheet C130O54H48-6
, 22.5 * 14.1 Å) is similar to the size of the plane of
the parent graphene sheet (22.0 * 14.2 Å), because -OH groups are occupying space
below and above the plane, and because sp3-puckering is counterbalanced by longer C,C
bond lengths, and because the carbon skeleton is not interrupted.
The 16mer PVFc from PM7 optimization (see Figure 2.9 - d) can be described by a
cylinder with length L16m3er = 3.4 nm and circle area A16m3er = 2.0 nm2 leading to the
volume V16mer = 6.8 nm2
projected area of cylinder along the short axis, PA16mer = 1.6*3.4 = 5.4 nm2
cylinder mass= M16mer : (16* C12H12Fe)-(CH2) = C191H190Fe16 = M16mer = 3380 g/mol
packed PVFc cylinders on GO: arial mass densityPVFc =
3379.6 g/ 5.4 mol nm2 = = 626 g/mol nm
2
corresponding GO plane: 2473/(1.2*2.3) = 2473/2.8 = 883 g/mol nm2
Mass ratio for a single layer of packed cylinders of PVFc on GO is: = 0.707
number of packed single layers at mass ratio 1.0: = 1.41
number of packed single layers at zeta potential 0 with mass ratio 2.7: = 3.8
number of packed single layers at mass ratio 4.4 (used for battery material) = 6.2
According to the above calculations, it is clear that a single layer of tightly packed
cylindrical polymer molecules on a GO sheet can only account for a mass ratio
PVFc / GO = 0.707. The Zeta-potential = 0 is achieved for PVFc / GO = 2.70 meaning
that in the average 3.8 layers of tightly packed PVFc cylinders are necessary per GO
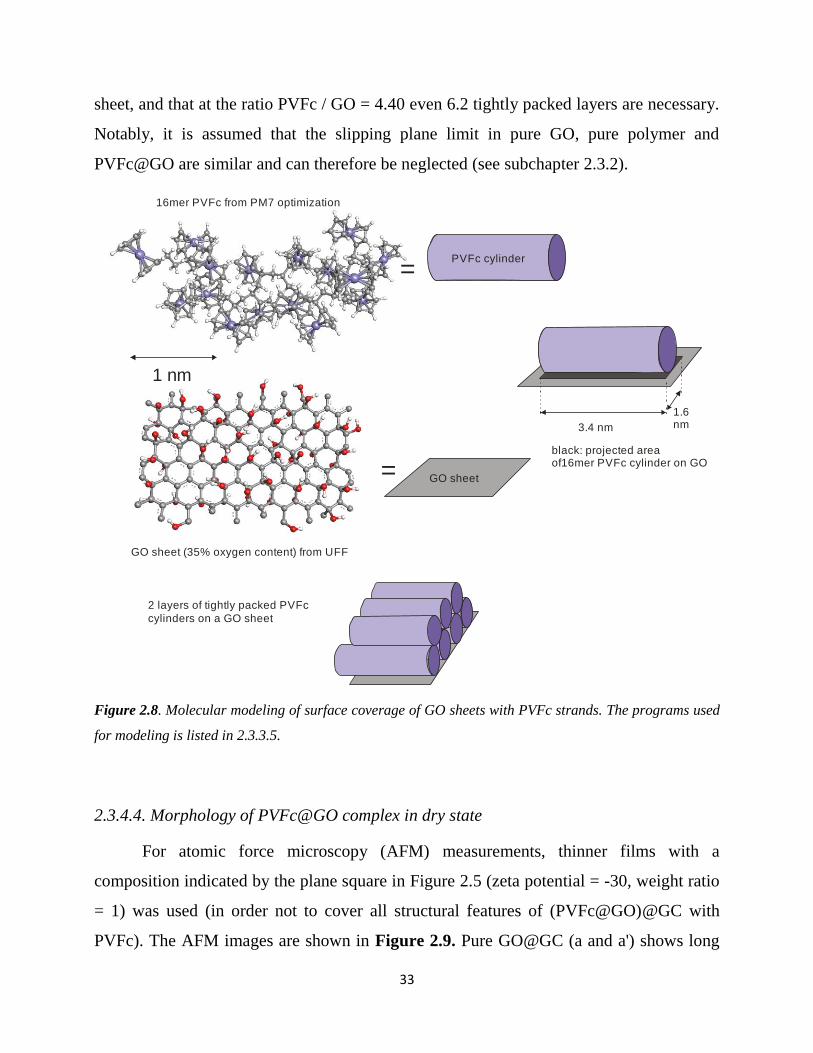
33
sheet, and that at the ratio PVFc / GO = 4.40 even 6.2 tightly packed layers are necessary.
Notably, it is assumed that the slipping plane limit in pure GO, pure polymer and
PVFc@GO are similar and can therefore be neglected (see subchapter 2.3.2).
Figure 2.8. Molecular modeling of surface coverage of GO sheets with PVFc strands. The programs used
for modeling is listed in 2.3.3.5.
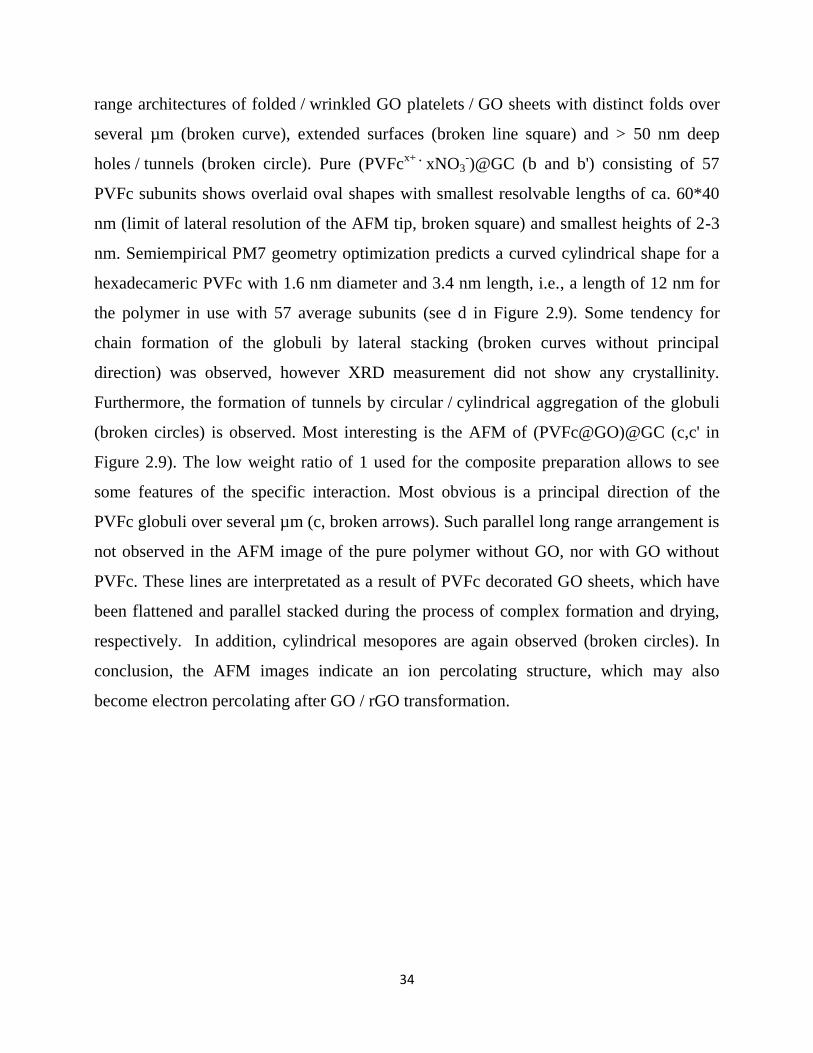
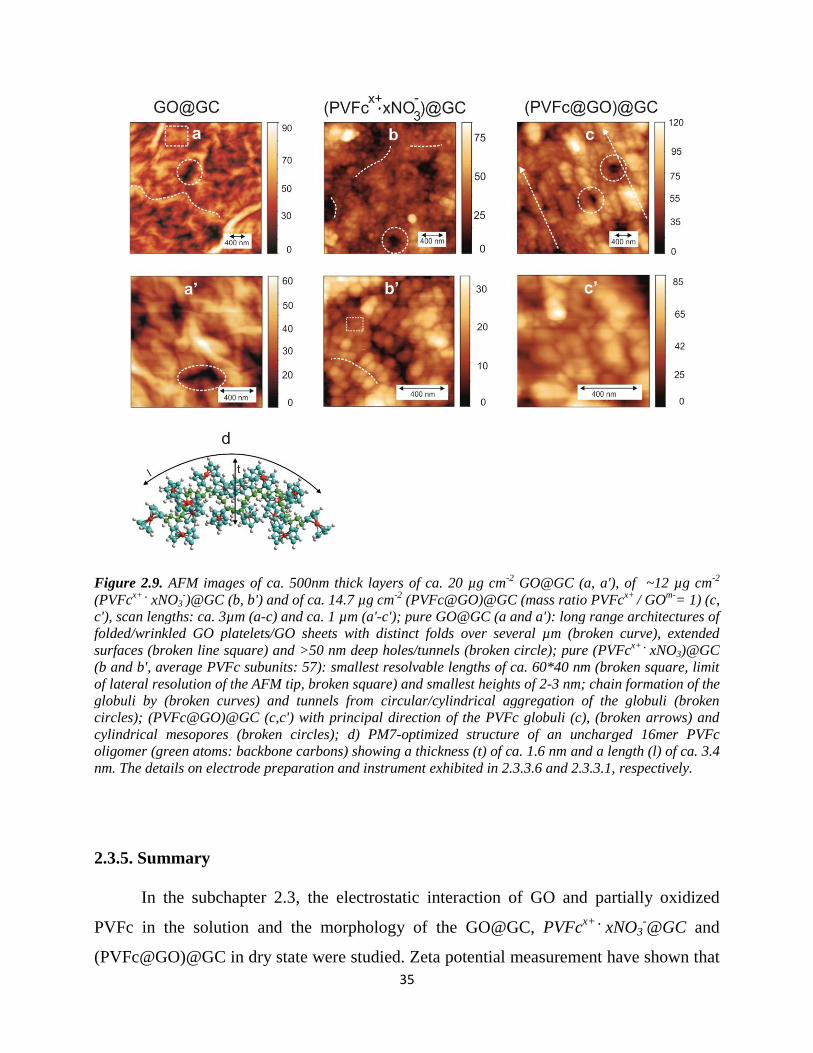
2.3.4.4. Morphology of PVFc@GO complex in dry state
For atomic force microscopy (AFM) measurements, thinner films with a
composition indicated by the plane square in Figure 2.5 (zeta potential = -30, weight ratio
= 1) was used (in order not to cover all structural features of (PVFc@GO)@GC with
PVFc). The AFM images are shown in Figure 2.9. Pure GO@GC (a and a') shows long
1 nm
16mer PVFc from PM7 optimization
GO sheet (35% oxygen content) from UFF
=
=black: projected areaof16mer PVFc cylinder on GO
3.4 nm
1.6nm
PVFc cylinder
GO sheet
2 layers of tightly packed PVFc
cylinders on a GO sheet
34
range architectures of folded / wrinkled GO platelets / GO sheets with distinct folds over
several µm (broken curve), extended surfaces (broken line square) and > 50 nm deep
holes / tunnels (broken circle). Pure (PVFcx+ .
xNO3-)@GC (b and b') consisting of 57
PVFc subunits shows overlaid oval shapes with smallest resolvable lengths of ca. 60*40
nm (limit of lateral resolution of the AFM tip, broken square) and smallest heights of 2-3
nm. Semiempirical PM7 geometry optimization predicts a curved cylindrical shape for a
hexadecameric PVFc with 1.6 nm diameter and 3.4 nm length, i.e., a length of 12 nm for
the polymer in use with 57 average subunits (see d in Figure 2.9). Some tendency for
chain formation of the globuli by lateral stacking (broken curves without principal
direction) was observed, however XRD measurement did not show any crystallinity.
Furthermore, the formation of tunnels by circular / cylindrical aggregation of the globuli
(broken circles) is observed. Most interesting is the AFM of (PVFc@GO)@GC (c,c' in
Figure 2.9). The low weight ratio of 1 used for the composite preparation allows to see
some features of the specific interaction. Most obvious is a principal direction of the
PVFc globuli over several µm (c, broken arrows). Such parallel long range arrangement is
not observed in the AFM image of the pure polymer without GO, nor with GO without
PVFc. These lines are interpretated as a result of PVFc decorated GO sheets, which have
been flattened and parallel stacked during the process of complex formation and drying,
respectively. In addition, cylindrical mesopores are again observed (broken circles). In
conclusion, the AFM images indicate an ion percolating structure, which may also
become electron percolating after GO / rGO transformation.
35
Figure 2.9. AFM images of ca. 500nm thick layers of ca. 20 µg cm-2
GO@GC (a, a'), of ~12 µg cm-2
(PVFcx+ .
xNO3-)@GC (b, b') and of ca. 14.7 µg cm
-2 (PVFc@GO)@GC (mass ratio PVFc
x+ / GO
m-= 1) (c,
c'), scan lengths: ca. 3µm (a-c) and ca. 1 µm (a'-c'); pure GO@GC (a and a'): long range architectures of
folded/wrinkled GO platelets/GO sheets with distinct folds over several µm (broken curve), extended
surfaces (broken line square) and >50 nm deep holes/tunnels (broken circle); pure (PVFcx+ .
xNO3)@GC
(b and b', average PVFc subunits: 57): smallest resolvable lengths of ca. 60*40 nm (broken square, limit
of lateral resolution of the AFM tip, broken square) and smallest heights of 2-3 nm; chain formation of the
globuli by (broken curves) and tunnels from circular/cylindrical aggregation of the globuli (broken
circles); (PVFc@GO)@GC (c,c') with principal direction of the PVFc globuli (c), (broken arrows) and
cylindrical mesopores (broken circles); d) PM7-optimized structure of an uncharged 16mer PVFc
oligomer (green atoms: backbone carbons) showing a thickness (t) of ca. 1.6 nm and a length (l) of ca. 3.4
nm. The details on electrode preparation and instrument exhibited in 2.3.3.6 and 2.3.3.1, respectively.
2.3.5. Summary
In the subchapter 2.3, the electrostatic interaction of GO and partially oxidized
PVFc in the solution and the morphology of the GO@GC, PVFcx+ .
xNO3-@GC and
(PVFc@GO)@GC in dry state were studied. Zeta potential measurement have shown that
36
the negative surface charge of GO, along addition of PVFcx+
, turned to positive, which
shows the surface coverage of GO by the cationic polymer. This electrostatic interaction
was further evidenced by Vis measurement, which showed formation of a charge transfer
complex and / or charge injection from GOm−
into PVFcx+
. Modeling showed that at the
stable colloidal regions (zeta potential > 15 mV), multilayer of PVFc are surrounding the
GO sheets. Therefore, in the PVFc / GO = 4.4, which was used for battery application,
polymers are in direct / close contact to GO sheets, which is very important for high rate
devices. AFM images showed that each of GO alone and polymer alone construct
hole / tunnels upon film formation. However, AFM images of composite showed long
range arrangement of PVFc strands – which was not observed in the polymer alone – that
are probably polymers patterned by GO sheets. Furthermore, the composite material has
cylindrical mesopores, which can provide an excellent ion percolating system.
37
2.4. Electrocatalytic transformation of (PVFc@GO)n@CC to
(PVFc@rGO)n@CC by viologen
2.4.1. Introduction
The supramolecular formation of graphene oxide and PVFcx+
was shown in the
previous subchapter (2.3). However, due to the lack of conductivity in this composite, a
GO/rGO transformation step prior to battery tests in necessary. Thus, in this subchapter a
method to transform the non-conductive GO-polymer to conductive rGO-polymer will be
described.
Graphene possesses unique electrical and mechanical properties, which make it an
ideal candidate for many energy-related applications such as batteries, supercapacitors,
solar cells and etc.6, 18, 22-25
Therefore, there have been many methods suggested to
synthesize graphene e.g., chemical vapor deposition (CDV), plasma enhanced CDV,
electric arc discharge and others.97-99
However, considering mass production and
synthesis cost, the oxidation of graphite to graphite oxide, its conversion to graphene
oxide (GO) and the subsequent reduction of GO is the most promising method.67
Notably,
this method is compatible with the intermediate PVFc@GO composite described in the
previous subchapter.
Based on different models proposed for the molecular structure of GO such as
Hoffmann, Ruess, Nakajima–Matsuo, and Lerf–Klinowski, a sheets of GO possesses
many oxygen-containing functional groups such as cyrboxyl, hydroxyl, exopxy and keto
on the basal planes and the edge of the sheets.63-64, 100
During graphite / GO transition, the
conjugating domains of graphite bearing sp2 carbons are converted to the non-conjugated
sp3 carbons. As a result, the electronic conjugation of the graphite is disturbed in GO.
Reduction of GO regenerates the electronic conjugation in reduced graphene oxide (rGO)
and therefore conductivity is reestablished. The electronic conductivity of rGO is 200-
2400 S m-1
(depending on the reduction method),101-102
which is comparable with pure
graphite 2500 ± 15 S m-1
.103
38
Chemical-, thermal- and electrochemical-reduction are the most promising
methods reported to reduce GO. Chemical methods use reducing agents e.g., hydrazine
and hydroquinone.34
The reduction quality is very promising, however, hydrazine is
hazardous and may damage the environment. GO reduction by metals e.g., Fe, Al and Zn
has also attracted much attention, but remaining metal impurities are a big drawback.104-
106 Thermal reduction can efficiently remove the oxygen-containing functional groups of
GO, however, GO reduction by this method needs high temperatures (> 600°C).35
For the
case of GO composites with organic polymers, the possible instability of the polymer
material at such temperatures makes this method less general. The electrochemical
reduction of GO is green (no toxic solvents / additive are used), fast and the synthesized
rGO is contaminant free.107-108
Moreover, the electrical conductivity and electrochemical
stability of rGO synthesized by the electrochemical method are higher than for previous
methods. This is probably due to the small residual defects remaining after chemical and
thermal reduction.67
The electrochemical reduction process is very simple, i.e., application
of a cathodic potential (-1.5 V vs. SCE) to the GO electrode in an acidic environment,
however, the exact mechanism is still unclear. In spite of the mentioned advantages of the
electrochemical method, the reduction of the electrodes with thick layers of GO is very
slow and inefficient.
2.4.2. Experimental section
2.4.2.1. Instruments
Cyclic voltammetry analyses using Autolab potentiostat (PGSTAT 20) interfaced
to a computer with the GPS software (version 4.9). The EQCM experiments were
conducted in a three–electrode cell from ALS Co., Ltd, Japan (EQCM Flow cell kit)
under potential scanning condition using a 5 MHz quartz crystal resonator metalized with
gold electrodes. The potential was controlled by a potentiostat (Gamry, Interface 1000)
and a frequency analyzer (Gamry, EQCM 10M). Conductivity was measured with an
Interdigitated Microsensor Electrode (IME) from “ABTECH Scientific, Inc.” with 50
39
digit pairs (IME 1525.3-M-Au-U) (surface 0.15×0.3 cm).109
Raman spectra were recorded
with the confocal Raman spectrometer LabRAM HR Evolution equipped with a second
harmonic 532 nm Nd-YAG laser for excitation and the duoscan option.
Thermogravimetric analysis was performed on a Netzsch STA 449 C at a heating rate of
10°C min-1
in the range of 25 to 550 °C under nitrogen flow. AFM images were captured
with Flex-Axiom “Nanosurf.
2.4.2.2. Chemicals
All the chemicals and solvents were from Sigma–Aldrich and used as received
without further purification, unless otherwise stated. Solvents for the electrochemistry and
spectroscopy were of 99.9% purity. Lithium perchlorate from Sigma (99.99% purity).
Methyl viologen dichloride hydrate from Sigma – Aldrich (>98% purity). PVFc and GO
as described in the subchapter 2.3.3.2. Oxo-G was synthesized according to the previously
described method.110
Flakes of oxo-G have an average density of lattice defects of about
0.5%-0.8% with rather large flake size of 1-10 micrometer and dispersion with a flake
size smaller than 1 micrometer.111
2.4.2.3. Preparation of PVFc@GO solutions with varying PVFcx+
/ GOm-
ratio
An aqueous solution of commercial GO was diluted to 1 mg / 2 ml and sonicated for
30 minutes using an ultrasonic bath. a) Weight ratio 4.4:1 PVFcx+
/ GOm-
: the GO solution
(2.27 ml, containing 1.14 mg GO) was drop wise added to the PVFcx+ .
nNO3- solution (5
ml, containing 5 mg of PVFc) under sonification over 10 min. Then, 2.73 ml distilled
water was added (increasing the volume to 10 ml) and the sonification was continued for
another 30 minutes. b) other PVFcx+
/ GOm-
ratios: the same procedure as in a) using the
same amount of polymer solution, but varying the amount of GO solution for the desired
ratio and adjusting the water addition for a final 10 ml volume.
40
2.4.2.4. Electrochemical measurements and electrode preparation
The electrochemical reduction of the composite was performed in the surface
confined state on a glassy carbon (GC) electrode (surface: 0.071 cm2, Metrohm,
6.0804.010) or on a 0.5 inch quartz crystal resonators (surface: 0.28 cm2 gold electrodes,
KVG Quartz Crystal Technology GmbH) or on FTO or ITO (active surface: ca. 1 cm2,
“Aldrich”). GC was polished with alumina powder, then rinsed thoroughly with water,
and dried in the oven at 50°C. The electrodes were prepared by drop casting of a
PVFc@GO solution (“a” and “b” in 2.4.2.3) on the current collector followed by drying at
50°C for one hour resulting in (PVFc@GO)n@CC, with n = 1 meaning 1.68µl of solution
(0.84 µg PVFcx+
and 0.19µg GO). In the case of layers with n > 4, bigger drops in the
range between 5-20 µl were also used.
2.4.2.5. Electrochemical transformation of (PVFc@GO)n@CC to (PVFc@rGO)n@CC
In all of the electrochemical reduction experiments an aqueous solution of 0.1 M
LiClO4 / 4 mM methyl viologen dichloride (MV++
) was used as the
electrolyte / electrocatalyst. After reduction, the (PVFc@rGO)n@CC electrode was
washed in distilled water to remove all MV++
and dried at 50°C for 30 min.
2.4.2.6. Electrochemical Quartz Crystal Microbalance (EQCM):
EQCM is an acoustic sensing method, which functions based on the inverse
piezoelectric effect measuring the mass adsorption or the fluid viscosity of the
surrounding media. The mass change due to film deposition, GO / rGO transition and
composite “breathing” on the gold surface of oscillating quartz crystal causes a change in
the resonance frequency as described by the Sauerbrey equation:
m Eq. 2.3
41
where Δf is the change of the frequency in Hz, Cf is the calibration constant (the
calibration constant for a 5 MHz At-cut quartz crystal in air is 56.6 Hz µg-1
cm2), and m is
the mass change (g cm-2
). This technique is very sensitive to small mass changes (< 0.4 ng
cm-2
for a 5 MHz quartz crystal). Electrodes were prepared as described in section 2.4.2.4
i.e., (PVFc@GO)14@Au (mass density 51.5 µg cm-2
) and the electrolyte is 0.1 M
LiClO4 / H2O + 4 mM MV++
at v = 20 mV s-1
.
2.4.2.7. Conductivity
A droplet of (PVFc@GO)0.5 (PVFcx+
/ GOm-
= 4.4) was drop casted on the
interdigitated electrode region and dried at 50°C for one hour yielding
(PVFc@GO)0.5@IME. Both electrodes of the interdigitated sensor were parallel
connected and polarized for 20 s at -1.2 V under electrocatalytic conditions, as described
for the preparation of electrodes for battery tests (2.4.2.4 and 2.4.2.5) to yield
(PVFc@rGO)0.5@IME. After drying, the specific conductivity of (PVFc@rGO) 0.5@IME
= 7.2×10⁻⁴
S cm-1
was determined from the measured resistance (180 Ω), after correction
for the active surface (0.045cm2), and use of the Zaretsky cell constant (0.13 cm
-1) of the
sensor.109
2.4.2.8. Raman spectroscopy
The laser power was set to 0.5 mW and focused by a 50x objective with NA = 0.8.
The duoscan option was used to collect average spectra of oxo-G and reduced oxo-G in a
spectra range of 3000-3400 cm-1
using a 600 line / mm grid. The acquisition time was
about 30 min per spectrum. Raman spectra were obtained from an area of 20x20 µm at a
laser power of 0.5 mW (532 nm) with an accumulation time of 30 min. The Raman
spectra of rGO from MV electrocatalyzed reduction are average spectra. They relate,
according to the model introduced in the literature,112-114
to a distance of defects of
roughly 2.5 nm, which correlates to a density of defects of 0.5 %, taking the lattice
42
constant of graphene into account. Synthesis and Raman spectroscopy measurements of
Oxo-G were performed by Siegfried Eigler, and Christian E. Halbig.
2.4.2.9. Electrochemical AFM
AFM images were captured with Flex-Axiom “Nanosurf” using PointProbe® Plus
contact Mode Short Cantilever -Au Coating probe (PPP-NCSTAuD
NANOSENSORSTM) for EC-AFM on the Electrochemistry Stage ECS 204 in aqueous
0.1 M KCl (including 4mM MV++
for the GO-rGO transition). The potential of the
modified GC electrode was stepped vs. a Ag/AgCl reference using a Pt wire counter
electrode and a potentiostat (Gamry, Interface 1000).
2.4.3. Results and Discussion
Unlike graphite, GO is electronically insulating and has to be transformed into
conductive rGO.115
Among the well–known methods of GO reduction such as chemical,
thermal and electrochemical, the latter is faster and the toxic solvents can be replaced by
water.107, 116
It has been demonstrated that the oxygen–containing functional groups of GO
can be reductively eliminated under acidic conditions (pH = 5) by applying a negative
potential of –1.5 V (vs. SCE).107,116
The electrochemical reduction yields highly
conductive rGO but the reduction process of thick layers are slow.108,116
In the present
study, the same sluggish GO / rGO transformation for (PVFc@GO)@GC was observed,
which was essentially even slower than in the absence of PVFc. This is possibly due to
the insulating polymers, which segregate GO sheets. Therefore a new electrocatalytic
method for the GO / rGO transformation using methyl viologen dichloride (MV++
) as an
electrocatalyst dissolved in the electrolyte solution is developed. This method shows fast
and efficient GO / rGO transformation in a lower potential (smaller than -1V vs. SCE),
which is applicable even in the thick layers (> 30 µm). The idea is based on reports
claiming that reduced viologen can transfer electrons to GO sheets and that 4-
43
cyanopyridinium is able to reduce GO upon reductive dimerization.68-69
Anyhow, there
are no reports on the deliberate use of MV++
additions to the solution for the
electrocatalytic reduction of GO composites at an electrode. A general overview of the
GO reduction procedure is shown in Scheme 2.3. (PVFc@GO)@CC as the working
electrode is immersed in the electrolyte solution, which consist MV++
and supporting salts
(Scheme 2.3a). Upon applying cathodic potential (< -0.4 V vs. Ag/AgCl), the MV++
molecules diffuse into the composite layer and reduce at the surface of CC
(MV++
→MV+●
→MV0) (Scheme 2.3d). The reduced MV molecules transfer electrons to
the GO sheets and in this manner catalyze its transformation to rGO (Scheme 2.3b-c).
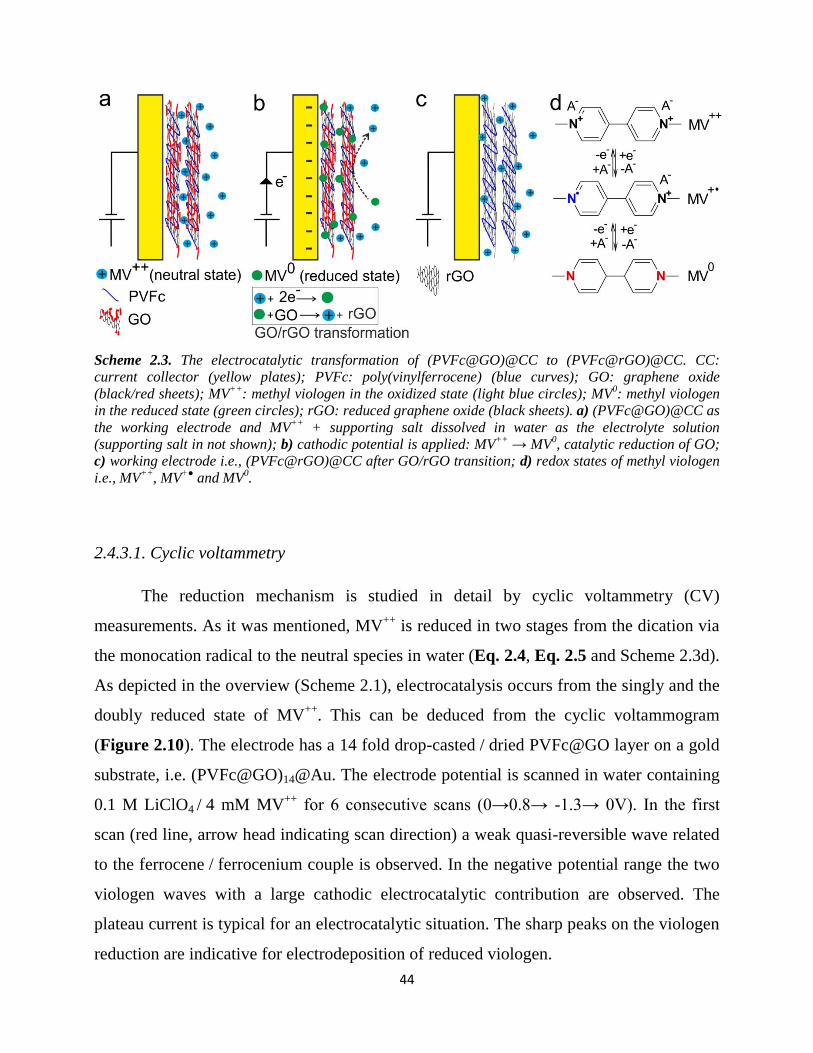
44
Scheme 2.3. The electrocatalytic transformation of (PVFc@GO)@CC to (PVFc@rGO)@CC. CC:
current collector (yellow plates); PVFc: poly(vinylferrocene) (blue curves); GO: graphene oxide
(black/red sheets); MV++
: methyl viologen in the oxidized state (light blue circles); MV0: methyl viologen
in the reduced state (green circles); rGO: reduced graphene oxide (black sheets). a) (PVFc@GO)@CC as
the working electrode and MV++
+ supporting salt dissolved in water as the electrolyte solution
(supporting salt in not shown); b) cathodic potential is applied: MV++
→ MV0, catalytic reduction of GO;
c) working electrode i.e., (PVFc@rGO)@CC after GO/rGO transition; d) redox states of methyl viologen
i.e., MV++
, MV+●
and MV0.
2.4.3.1. Cyclic voltammetry
The reduction mechanism is studied in detail by cyclic voltammetry (CV)
measurements. As it was mentioned, MV++
is reduced in two stages from the dication via
the monocation radical to the neutral species in water (Eq. 2.4, Eq. 2.5 and Scheme 2.3d).
As depicted in the overview (Scheme 2.1), electrocatalysis occurs from the singly and the
doubly reduced state of MV++
. This can be deduced from the cyclic voltammogram
(Figure 2.10). The electrode has a 14 fold drop-casted / dried PVFc@GO layer on a gold
substrate, i.e. (PVFc@GO)14@Au. The electrode potential is scanned in water containing
0.1 M LiClO4 / 4 mM MV++
for 6 consecutive scans (0→0.8→ -1.3→ 0V). In the first
scan (red line, arrow head indicating scan direction) a weak quasi-reversible wave related
to the ferrocene / ferrocenium couple is observed. In the negative potential range the two
viologen waves with a large cathodic electrocatalytic contribution are observed. The
plateau current is typical for an electrocatalytic situation. The sharp peaks on the viologen
reduction are indicative for electrodeposition of reduced viologen.
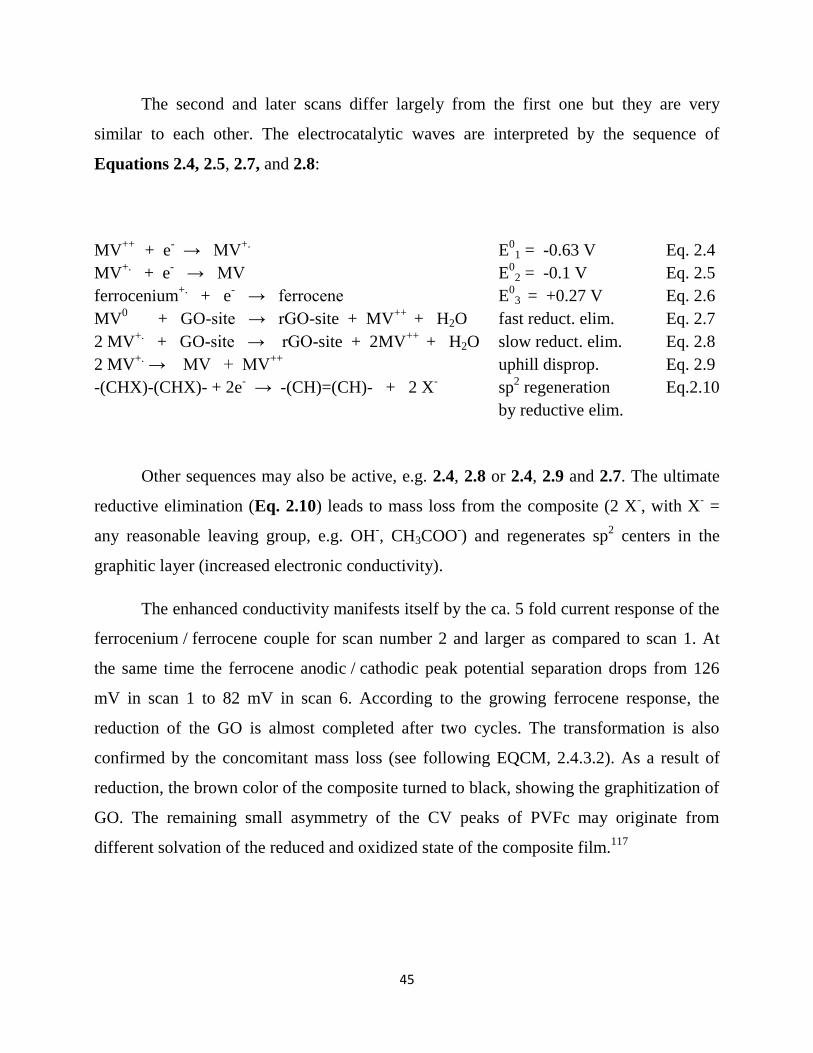
45
The second and later scans differ largely from the first one but they are very
similar to each other. The electrocatalytic waves are interpreted by the sequence of
Equations 2.4, 2.5, 2.7, and 2.8:
MV++
+ e- → MV
+. E
01 = -0.63 V Eq. 2.4
MV+.
+ e- → MV E
02 = -0.1 V Eq. 2.5
ferrocenium+.
+ e- → ferrocene E
03 = +0.27 V Eq. 2.6
MV0 + GO-site → rGO-site + MV
++ + H2O fast reduct. elim. Eq. 2.7
2 MV+.
+ GO-site → rGO-site + 2MV++
+ H2O slow reduct. elim. Eq. 2.8
2 MV+.
→ MV + MV++
uphill disprop. Eq. 2.9
-(CHX)-(CHX)- + 2e- → -(CH)=(CH)- + 2 X
- sp
2 regeneration
by reductive elim.
Eq.2.10
Other sequences may also be active, e.g. 2.4, 2.8 or 2.4, 2.9 and 2.7. The ultimate
reductive elimination (Eq. 2.10) leads to mass loss from the composite (2 X-, with X
- =
any reasonable leaving group, e.g. OH-, CH3COO
-) and regenerates sp
2 centers in the
graphitic layer (increased electronic conductivity).
The enhanced conductivity manifests itself by the ca. 5 fold current response of the
ferrocenium / ferrocene couple for scan number 2 and larger as compared to scan 1. At
the same time the ferrocene anodic / cathodic peak potential separation drops from 126
mV in scan 1 to 82 mV in scan 6. According to the growing ferrocene response, the
reduction of the GO is almost completed after two cycles. The transformation is also
confirmed by the concomitant mass loss (see following EQCM, 2.4.3.2). As a result of
reduction, the brown color of the composite turned to black, showing the graphitization of
GO. The remaining small asymmetry of the CV peaks of PVFc may originate from
different solvation of the reduced and oxidized state of the composite film.117
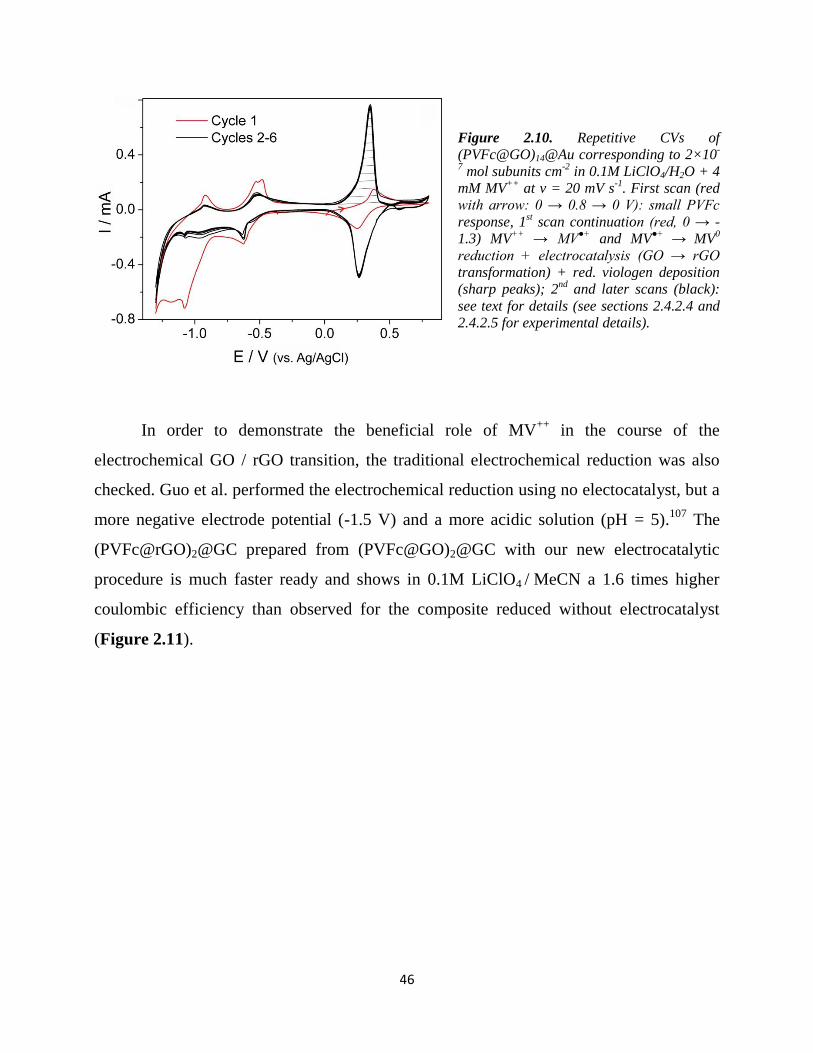
46
Figure 2.10. Repetitive CVs of
(PVFc@GO)14@Au corresponding to 2×10-
7 mol subunits cm
-2 in 0.1M LiClO4/H2O + 4
mM MV++
at v = 20 mV s-1
. First scan (red
with arrow: 0 → 0.8 → 0 V): small PVFc
response, 1st scan continuation (red, 0 → -
1.3) MV++
→ MV●+
and MV●+
→
MV0
reduction + electrocatalysis (GO → rGO
transformation) + red. viologen deposition
(sharp peaks); 2nd
and later scans (black):
see text for details (see sections 2.4.2.4 and
2.4.2.5 for experimental details).
In order to demonstrate the beneficial role of MV++
in the course of the
electrochemical GO / rGO transition, the traditional electrochemical reduction was also
checked. Guo et al. performed the electrochemical reduction using no electocatalyst, but a
more negative electrode potential (-1.5 V) and a more acidic solution (pH = 5).107
The
(PVFc@rGO)2@GC prepared from (PVFc@GO)2@GC with our new electrocatalytic
procedure is much faster ready and shows in 0.1M LiClO4 / MeCN a 1.6 times higher
coulombic efficiency than observed for the composite reduced without electrocatalyst
(Figure 2.11).
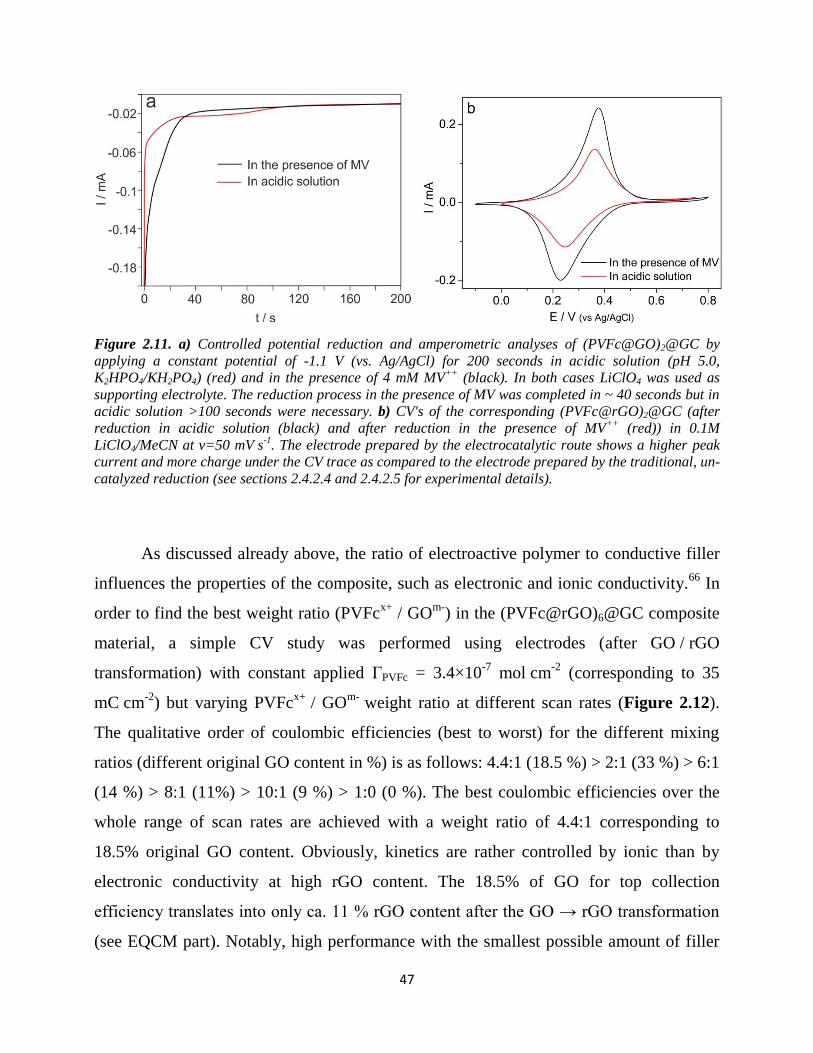
47
Figure 2.11. a) Controlled potential reduction and amperometric analyses of (PVFc@GO)2@GC by
applying a constant potential of -1.1 V (vs. Ag/AgCl) for 200 seconds in acidic solution (pH 5.0,
K2HPO4/KH2PO4) (red) and in the presence of 4 mM MV++
(black). In both cases LiClO4 was used as
supporting electrolyte. The reduction process in the presence of MV was completed in ~ 40 seconds but in
acidic solution >100 seconds were necessary. b) CV's of the corresponding (PVFc@rGO)2@GC (after
reduction in acidic solution (black) and after reduction in the presence of MV++
(red)) in 0.1M
LiClO4/MeCN at v=50 mV s-1
. The electrode prepared by the electrocatalytic route shows a higher peak
current and more charge under the CV trace as compared to the electrode prepared by the traditional, un-
catalyzed reduction (see sections 2.4.2.4 and 2.4.2.5 for experimental details).
As discussed already above, the ratio of electroactive polymer to conductive filler
influences the properties of the composite, such as electronic and ionic conductivity.66
In
order to find the best weight ratio (PVFcx+
/ GOm-
) in the (PVFc@rGO)6@GC composite
material, a simple CV study was performed using electrodes (after GO / rGO
transformation) with constant applied ΓPVFc = 3.4×10⁻⁷
mol cm-2
(corresponding to 35
mC cm-2
) but varying PVFcx+
/ GOm-
weight ratio at different scan rates (Figure 2.12).
The qualitative order of coulombic efficiencies (best to worst) for the different mixing
ratios (different original GO content in %) is as follows: 4.4:1 (18.5 %) > 2:1 (33 %) > 6:1
(14 %) > 8:1 (11%) > 10:1 (9 %) > 1:0 (0 %). The best coulombic efficiencies over the
whole range of scan rates are achieved with a weight ratio of 4.4:1 corresponding to
18.5% original GO content. Obviously, kinetics are rather controlled by ionic than by
electronic conductivity at high rGO content. The 18.5% of GO for top collection
efficiency translates into only ca. 11 % rGO content after the GO → rGO transformation
(see EQCM part). Notably, high performance with the smallest possible amount of filler
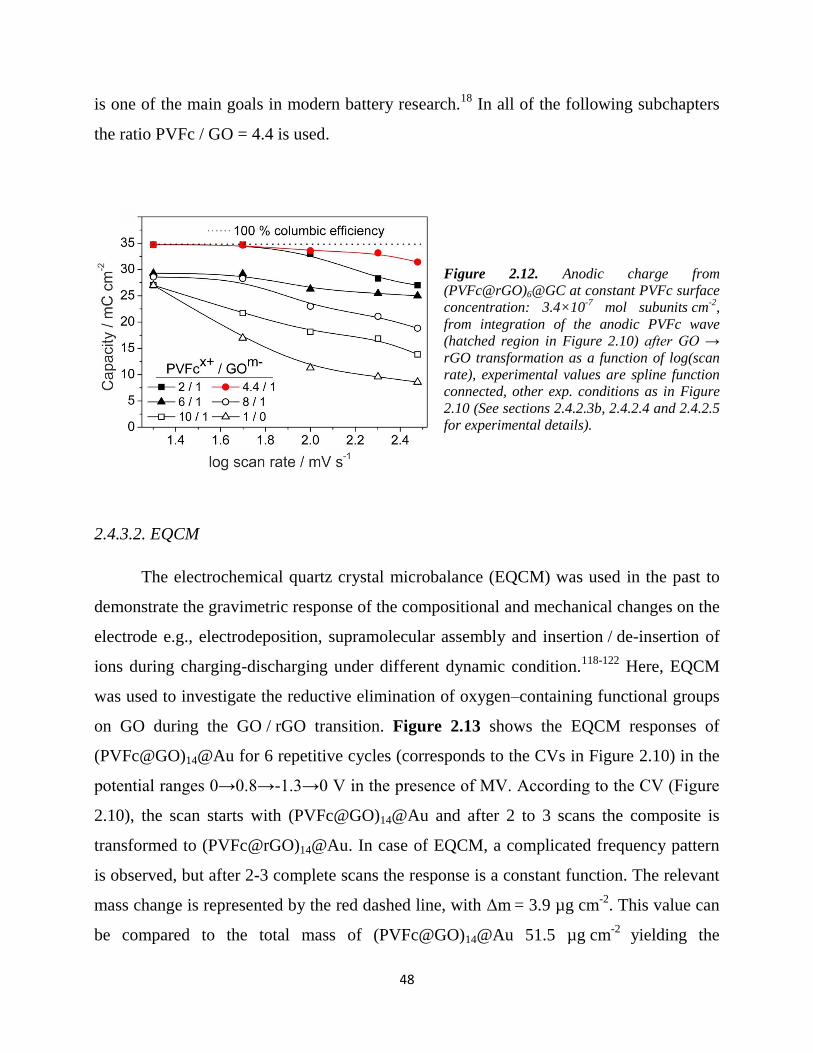
48
is one of the main goals in modern battery research.18
In all of the following subchapters
the ratio PVFc / GO = 4.4 is used.
Figure 2.12. Anodic charge from
(PVFc@rGO)6@GC at constant PVFc surface
concentration: 3.4×10⁻⁷
mol subunits cm-2
,
from integration of the anodic PVFc wave
(hatched region in Figure 2.10) after GO →
rGO transformation as a function of log(scan
rate), experimental values are spline function
connected, other exp. conditions as in Figure
2.10 (See sections 2.4.2.3b, 2.4.2.4 and 2.4.2.5
for experimental details).
2.4.3.2. EQCM
The electrochemical quartz crystal microbalance (EQCM) was used in the past to
demonstrate the gravimetric response of the compositional and mechanical changes on the
electrode e.g., electrodeposition, supramolecular assembly and insertion / de-insertion of
ions during charging-discharging under different dynamic condition.118-122
Here, EQCM
was used to investigate the reductive elimination of oxygen–containing functional groups
on GO during the GO / rGO transition. Figure 2.13 shows the EQCM responses of
(PVFc@GO)14@Au for 6 repetitive cycles (corresponds to the CVs in Figure 2.10) in the
potential ranges 0→0.8→-1.3→0 V in the presence of MV. According to the CV (Figure
2.10), the scan starts with (PVFc@GO)14@Au and after 2 to 3 scans the composite is
transformed to (PVFc@rGO)14@Au. In case of EQCM, a complicated frequency pattern
is observed, but after 2-3 complete scans the response is a constant function. The relevant
mass change is represented by the red dashed line, with Δm = 3.9 µg cm-2
. This value can
be compared to the total mass of (PVFc@GO)14@Au 51.5 µg cm-2
yielding the
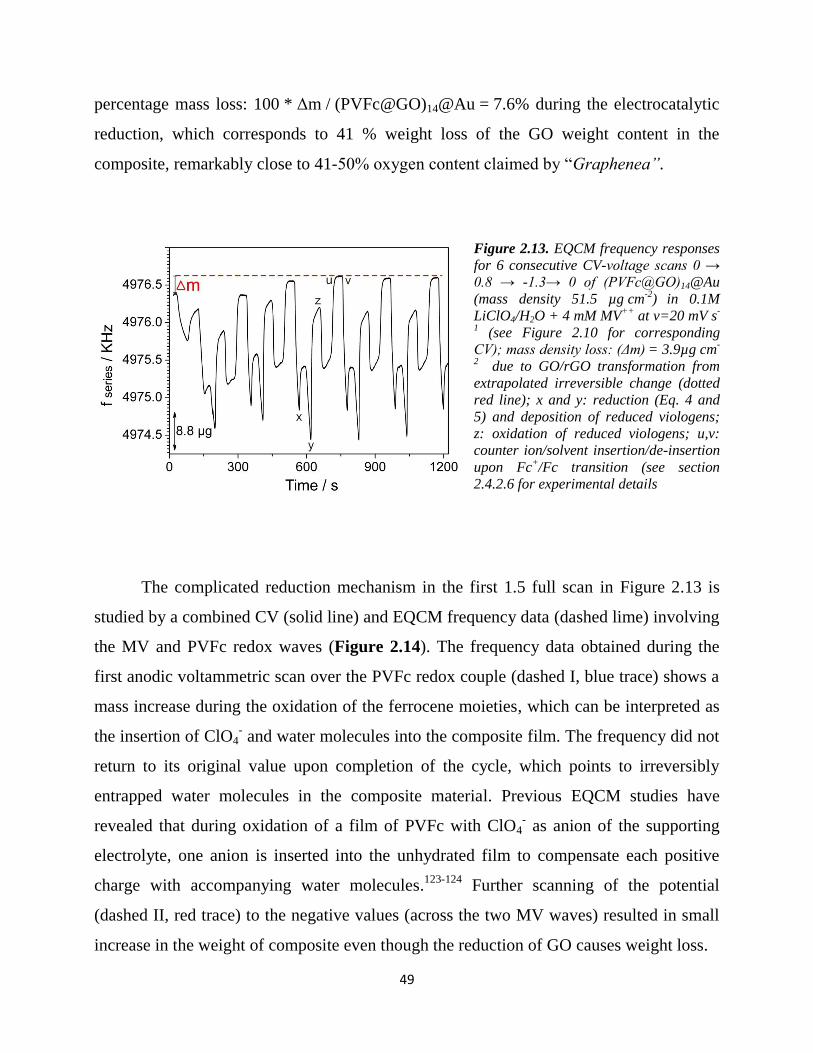
49
percentage mass loss: 100 * Δm / (PVFc@GO)14@Au = 7.6% during the electrocatalytic
reduction, which corresponds to 41 % weight loss of the GO weight content in the
composite, remarkably close to 41-50% oxygen content claimed by “Graphenea”.
Figure 2.13. EQCM frequency responses
for 6 consecutive CV-voltage scans 0 →
0.8 → -1.3→ 0 of (PVFc@GO)14@Au
(mass density 51.5 µg cm-2
) in 0.1M
LiClO4/H2O + 4 mM MV++
at v=20 mV s-
1 (see Figure 2.10 for corresponding
CV); mass density loss: (Δm) = 3.9µg cm-
2 due to GO/rGO transformation from
extrapolated irreversible change (dotted
red line); x and y: reduction (Eq. 4 and
5) and deposition of reduced viologens;
z: oxidation of reduced viologens; u,v:
counter ion/solvent insertion/de-insertion
upon Fc+/Fc transition (see section
2.4.2.6 for experimental details
The complicated reduction mechanism in the first 1.5 full scan in Figure 2.13 is
studied by a combined CV (solid line) and EQCM frequency data (dashed lime) involving
the MV and PVFc redox waves (Figure 2.14). The frequency data obtained during the
first anodic voltammetric scan over the PVFc redox couple (dashed I, blue trace) shows a
mass increase during the oxidation of the ferrocene moieties, which can be interpreted as
the insertion of ClO4- and water molecules into the composite film. The frequency did not
return to its original value upon completion of the cycle, which points to irreversibly
entrapped water molecules in the composite material. Previous EQCM studies have
revealed that during oxidation of a film of PVFc with ClO4- as anion of the supporting
electrolyte, one anion is inserted into the unhydrated film to compensate each positive
charge with accompanying water molecules.123-124
Further scanning of the potential
(dashed II, red trace) to the negative values (across the two MV waves) resulted in small
increase in the weight of composite even though the reduction of GO causes weight loss.
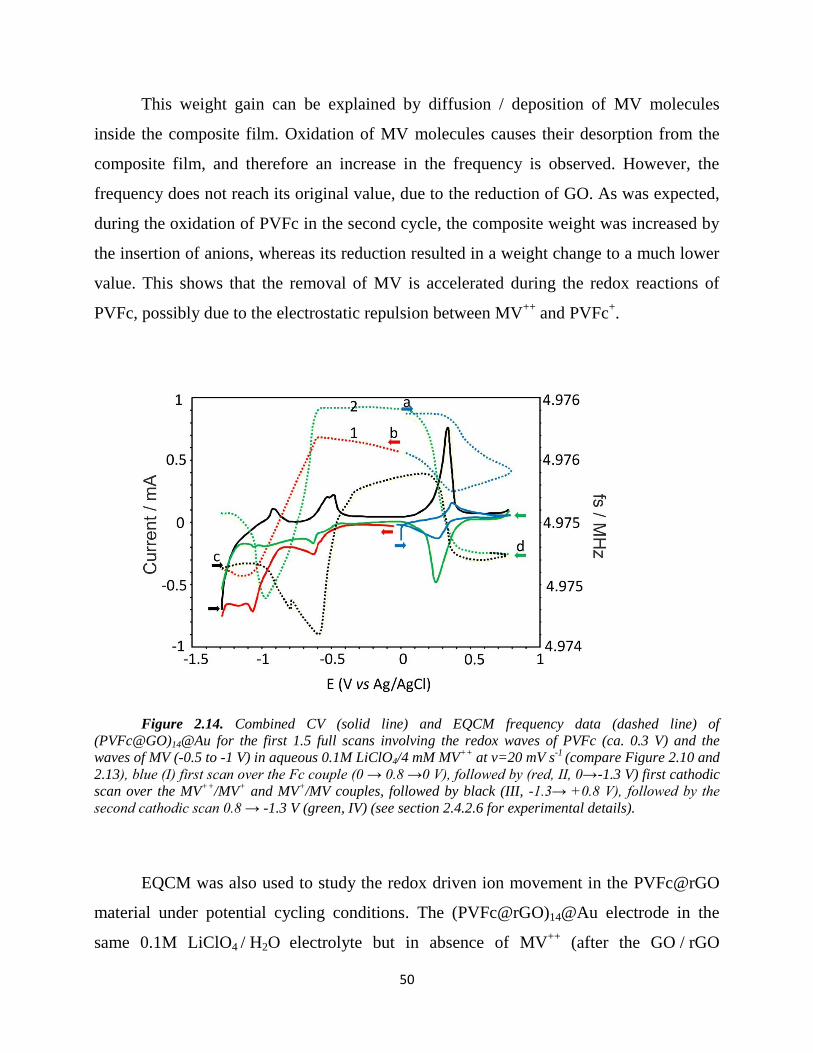
50
This weight gain can be explained by diffusion / deposition of MV molecules
inside the composite film. Oxidation of MV molecules causes their desorption from the
composite film, and therefore an increase in the frequency is observed. However, the
frequency does not reach its original value, due to the reduction of GO. As was expected,
during the oxidation of PVFc in the second cycle, the composite weight was increased by
the insertion of anions, whereas its reduction resulted in a weight change to a much lower
value. This shows that the removal of MV is accelerated during the redox reactions of
PVFc, possibly due to the electrostatic repulsion between MV++
and PVFc+.
Figure 2.14. Combined CV (solid line) and EQCM frequency data (dashed line) of
(PVFc@GO)14@Au for the first 1.5 full scans involving the redox waves of PVFc (ca. 0.3 V) and the
waves of MV (-0.5 to -1 V) in aqueous 0.1M LiClO4/4 mM MV++
at v=20 mV s-1
(compare Figure 2.10 and
2.13), blue (I) first scan over the Fc couple (0 → 0.8 →0 V), followed by (red, II, 0→-1.3 V) first cathodic
scan over the MV++
/MV+ and MV
+/MV couples, followed by black (III, -1.3→ +0.8 V), followed by the
second cathodic scan 0.8 → -1.3 V (green, IV) (see section 2.4.2.6 for experimental details).
EQCM was also used to study the redox driven ion movement in the PVFc@rGO
material under potential cycling conditions. The (PVFc@rGO)14@Au electrode in the
same 0.1M LiClO4 / H2O
electrolyte but in absence of MV++
(after the GO / rGO
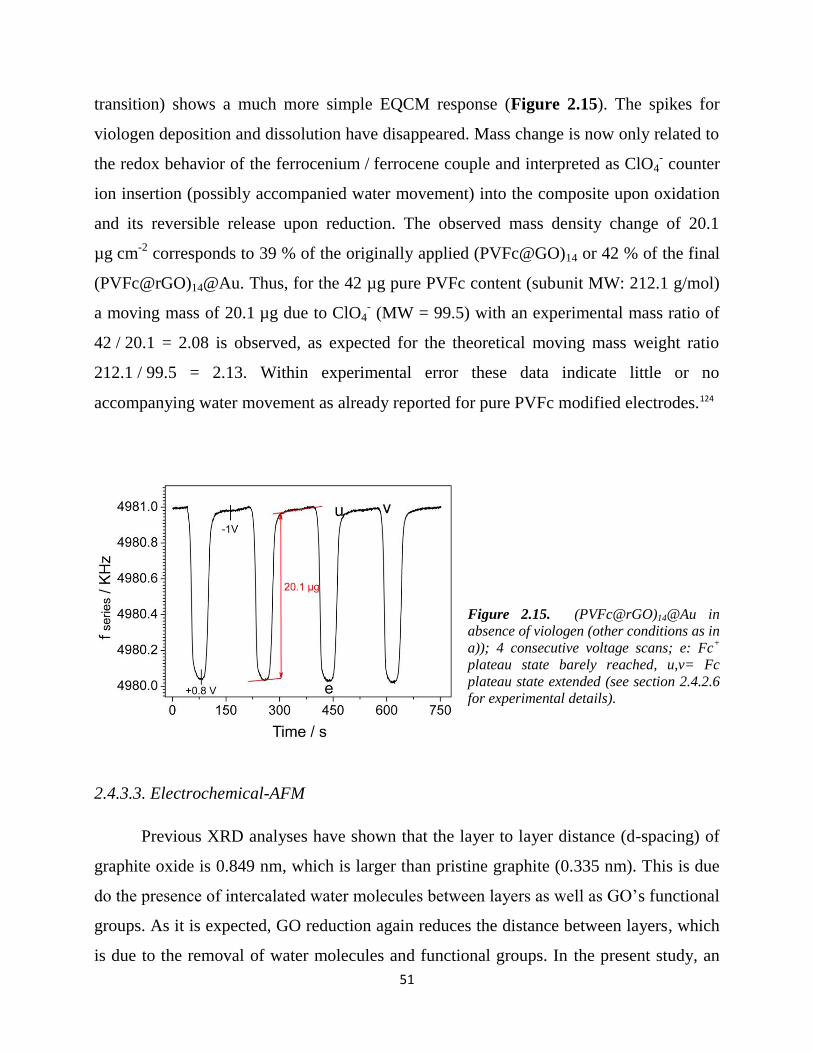
51
transition) shows a much more simple EQCM response (Figure 2.15). The spikes for
viologen deposition and dissolution have disappeared. Mass change is now only related to
the redox behavior of the ferrocenium / ferrocene couple and interpreted as ClO4- counter
ion insertion (possibly accompanied water movement) into the composite upon oxidation
and its reversible release upon reduction. The observed mass density change of 20.1
µg cm-2
corresponds to 39 % of the originally applied (PVFc@GO)14 or 42 % of the final
(PVFc@rGO)14@Au. Thus, for the 42 µg pure PVFc content (subunit MW: 212.1 g/mol)
a moving mass of 20.1 µg due to ClO4- (MW = 99.5) with an experimental mass ratio of
42 / 20.1 = 2.08 is observed, as expected for the theoretical moving mass weight ratio
212.1 / 99.5 = 2.13. Within experimental error these data indicate little or no
accompanying water movement as already reported for pure PVFc modified electrodes.124
Figure 2.15. (PVFc@rGO)14@Au in
absence of viologen (other conditions as in
a)); 4 consecutive voltage scans; e: Fc+
plateau state barely reached, u,v= Fc
plateau state extended (see section 2.4.2.6
for experimental details).
2.4.3.3. Electrochemical-AFM
Previous XRD analyses have shown that the layer to layer distance (d-spacing) of
graphite oxide is 0.849 nm, which is larger than pristine graphite (0.335 nm). This is due
do the presence of intercalated water molecules between layers as well as GO’s functional
groups. As it is expected, GO reduction again reduces the distance between layers, which
is due to the removal of water molecules and functional groups. In the present study, an
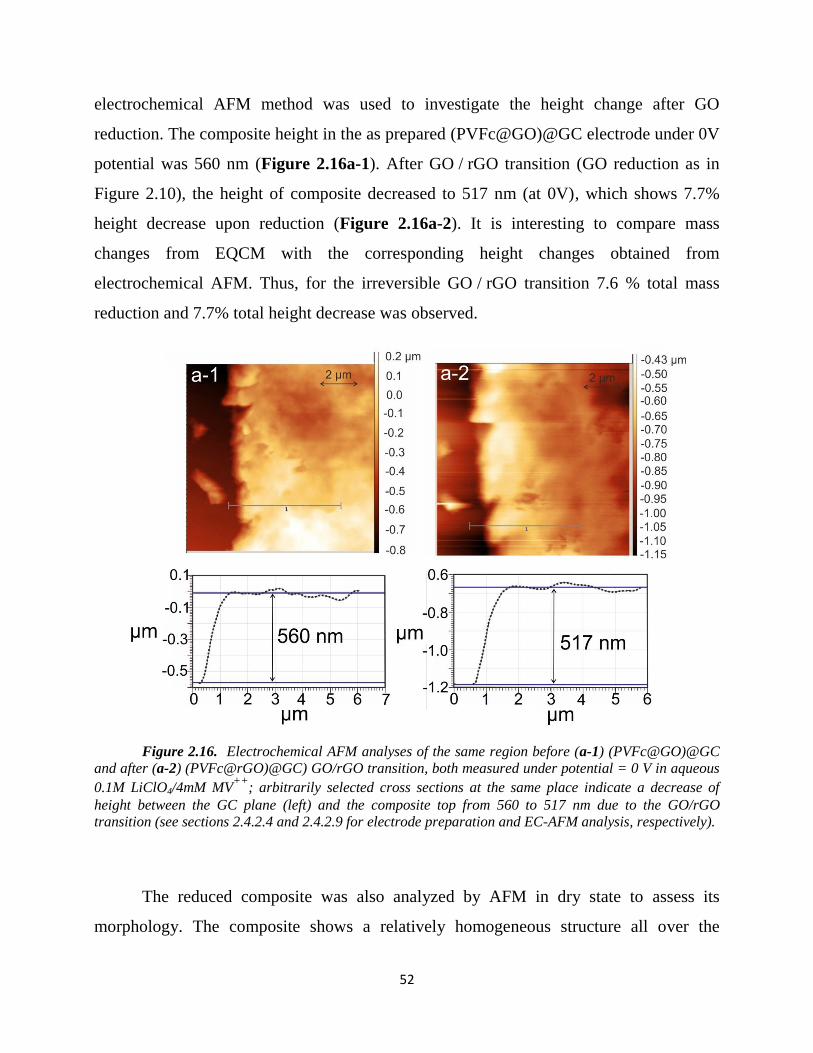
52
electrochemical AFM method was used to investigate the height change after GO
reduction. The composite height in the as prepared (PVFc@GO)@GC electrode under 0V
potential was 560 nm (Figure 2.16a-1). After GO / rGO transition (GO reduction as in
Figure 2.10), the height of composite decreased to 517 nm (at 0V), which shows 7.7%
height decrease upon reduction (Figure 2.16a-2). It is interesting to compare mass
changes from EQCM with the corresponding height changes obtained from
electrochemical AFM. Thus, for the irreversible GO / rGO transition 7.6 % total mass
reduction and 7.7% total height decrease was observed.
Figure 2.16. Electrochemical AFM analyses of the same region before (a-1) (PVFc@GO)@GC
and after (a-2) (PVFc@rGO)@GC) GO/rGO transition, both measured under potential = 0 V in aqueous
0.1M LiClO4/4mM MV++
; arbitrarily selected cross sections at the same place indicate a decrease of
height between the GC plane (left) and the composite top from 560 to 517 nm due to the GO/rGO
transition (see sections 2.4.2.4 and 2.4.2.9 for electrode preparation and EC-AFM analysis, respectively).
The reduced composite was also analyzed by AFM in dry state to assess its
morphology. The composite shows a relatively homogeneous structure all over the
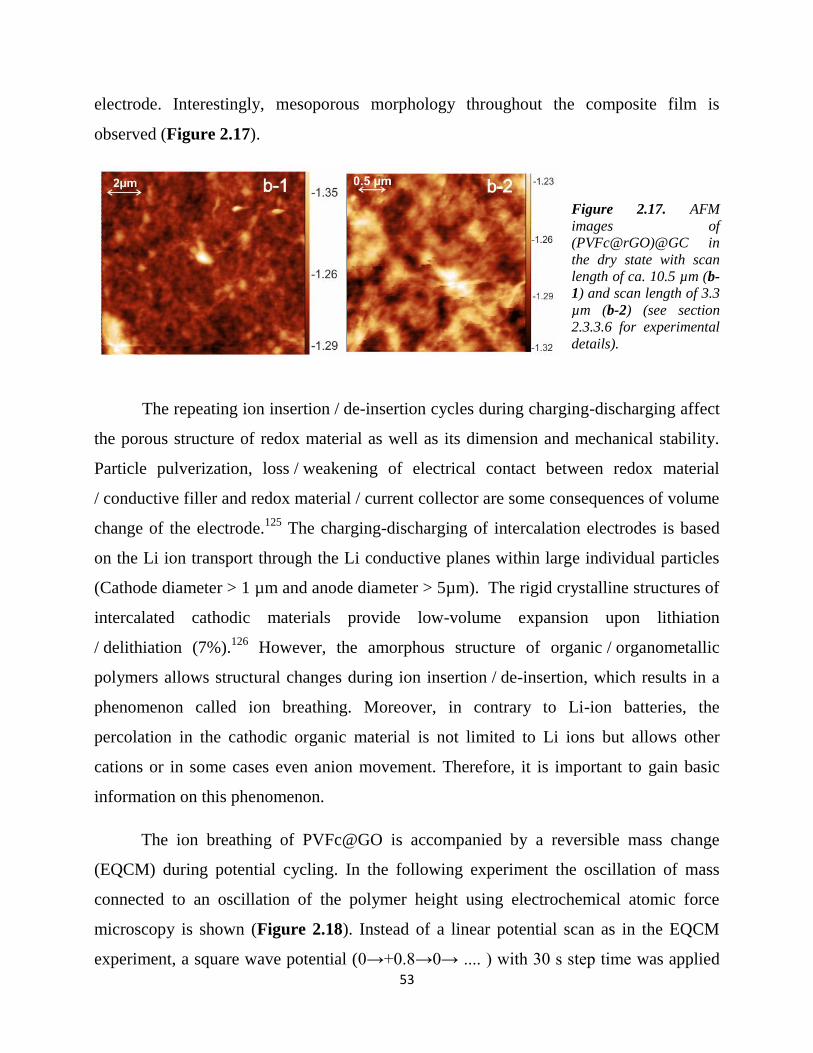
53
electrode. Interestingly, mesoporous morphology throughout the composite film is
observed (Figure 2.17).
Figure 2.17. AFM
images of
(PVFc@rGO)@GC in
the dry state with scan
length of ca. 10.5 µm (b-
1) and scan length of 3.3
µm (b-2) (see section
2.3.3.6 for experimental
details).
The repeating ion insertion / de-insertion cycles during charging-discharging affect
the porous structure of redox material as well as its dimension and mechanical stability.
Particle pulverization, loss / weakening of electrical contact between redox material
/ conductive filler and redox material / current collector are some consequences of volume
change of the electrode.125
The charging-discharging of intercalation electrodes is based
on the Li ion transport through the Li conductive planes within large individual particles
(Cathode diameter > 1 µm and anode diameter > 5µm). The rigid crystalline structures of
intercalated cathodic materials provide low-volume expansion upon lithiation
/ delithiation (7%).126
However, the amorphous structure of organic / organometallic
polymers allows structural changes during ion insertion / de-insertion, which results in a
phenomenon called ion breathing. Moreover, in contrary to Li-ion batteries, the
percolation in the cathodic organic material is not limited to Li ions but allows other
cations or in some cases even anion movement. Therefore, it is important to gain basic
information on this phenomenon.
The ion breathing of PVFc@GO is accompanied by a reversible mass change
(EQCM) during potential cycling. In the following experiment the oscillation of mass
connected to an oscillation of the polymer height using electrochemical atomic force
microscopy is shown (Figure 2.18). Instead of a linear potential scan as in the EQCM
experiment, a square wave potential (0→+0.8→0→ .... ) with 30 s step time was applied
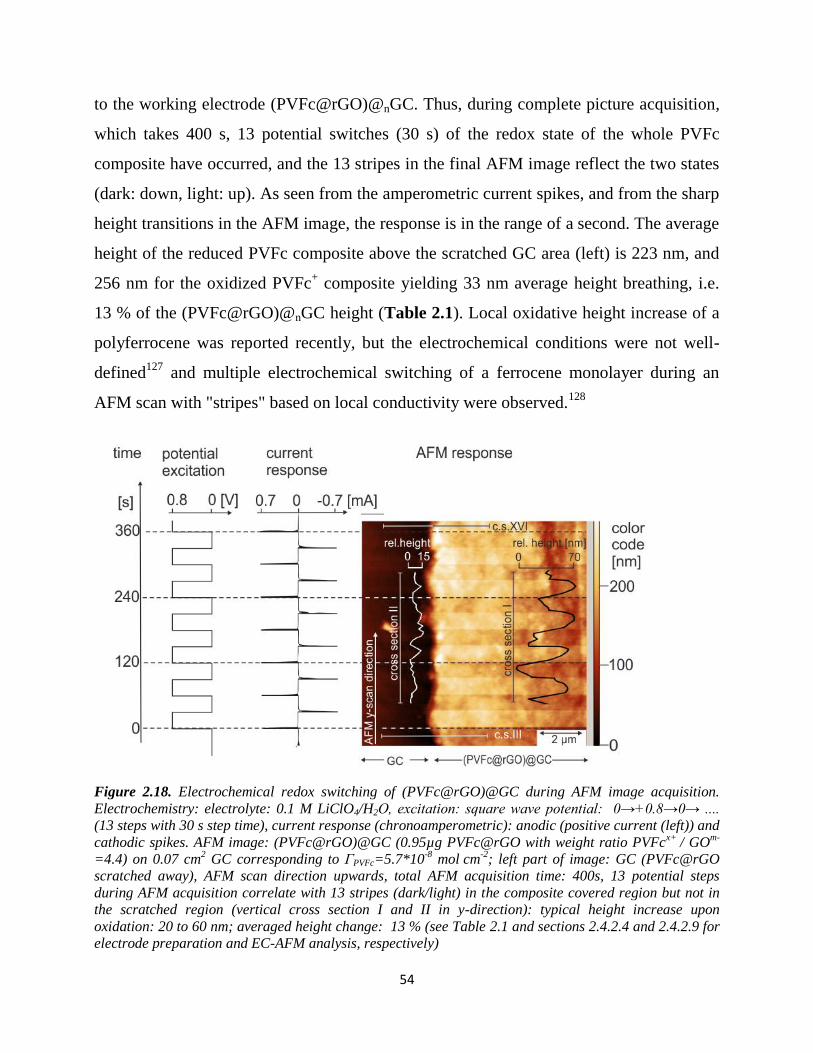
54
to the working electrode (PVFc@rGO)@nGC. Thus, during complete picture acquisition,
which takes 400 s, 13 potential switches (30 s) of the redox state of the whole PVFc
composite have occurred, and the 13 stripes in the final AFM image reflect the two states
(dark: down, light: up). As seen from the amperometric current spikes, and from the sharp
height transitions in the AFM image, the response is in the range of a second. The average
height of the reduced PVFc composite above the scratched GC area (left) is 223 nm, and
256 nm for the oxidized PVFc+ composite yielding 33 nm average height breathing, i.e.
13 % of the (PVFc@rGO)@nGC height (Table 2.1). Local oxidative height increase of a
polyferrocene was reported recently, but the electrochemical conditions were not well-
defined127
and multiple electrochemical switching of a ferrocene monolayer during an
AFM scan with "stripes" based on local conductivity were observed.128
Figure 2.18. Electrochemical redox switching of (PVFc@rGO)@GC during AFM image acquisition.
Electrochemistry: electrolyte: 0.1 M LiClO4/H2O, excitation: square wave potential: 0→+0.8→0→ ....
(13 steps with 30 s step time), current response (chronoamperometric): anodic (positive current (left)) and
cathodic spikes. AFM image: (PVFc@rGO)@GC (0.95µg PVFc@rGO with weight ratio PVFcx+
/ GOm-
=4.4) on 0.07 cm2 GC corresponding to ΓPVFc=5.7*10
-8 mol cm
-2; left part of image: GC (PVFc@rGO
scratched away), AFM scan direction upwards, total AFM acquisition time: 400s, 13 potential steps
during AFM acquisition correlate with 13 stripes (dark/light) in the composite covered region but not in
the scratched region (vertical cross section I and II in y-direction): typical height increase upon
oxidation: 20 to 60 nm; averaged height change: 13 % (see Table 2.1 and sections 2.4.2.4 and 2.4.2.9 for
electrode preparation and EC-AFM analysis, respectively)
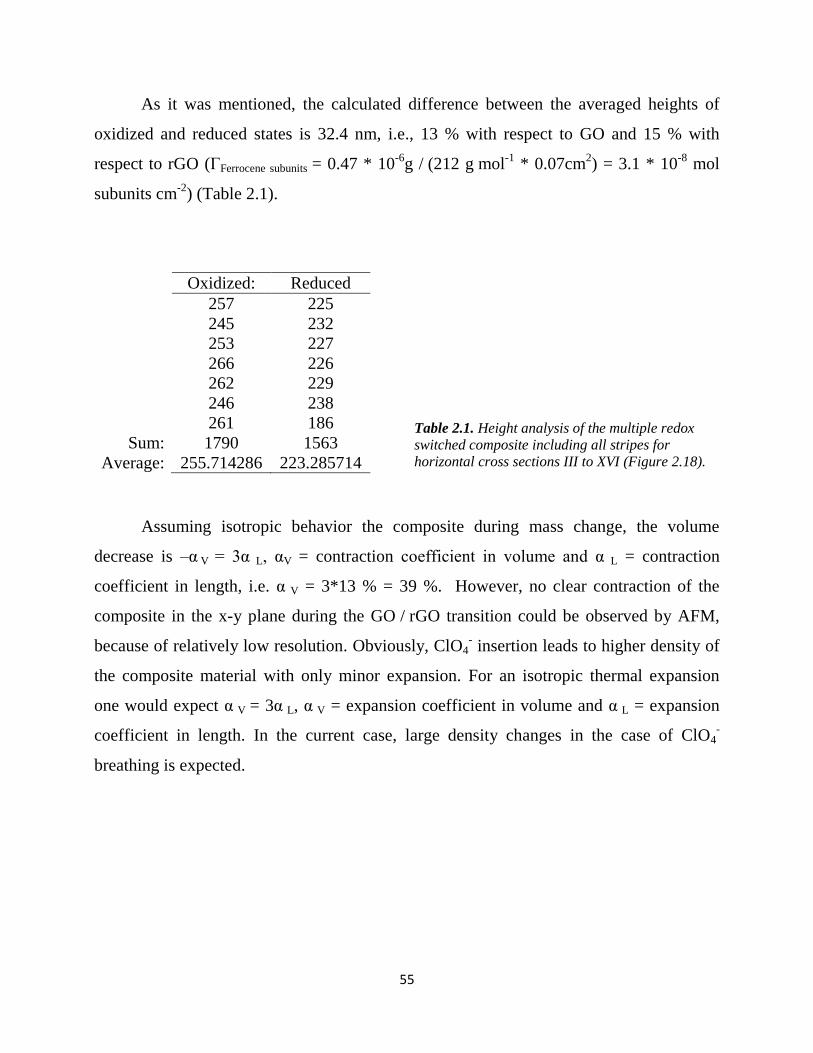
55
As it was mentioned, the calculated difference between the averaged heights of
oxidized and reduced states is 32.4 nm, i.e., 13 % with respect to GO and 15 % with
respect to rGO (ΓFerrocene subunits = 0.47 * 10-6
g / (212 g mol-1
* 0.07cm2) = 3.1 * 10
-8 mol
subunits cm-2
) (Table 2.1).
Oxidized: Reduced
257 225
245 232
253 227
266 226
262 229
246 238
261 186
Sum: 1790 1563
Average: 255.714286 223.285714
Table 2.1. Height analysis of the multiple redox
switched composite including all stripes for
horizontal cross sections III to XVI (Figure 2.18).
Assuming isotropic behavior the composite during mass change, the volume
decrease is –α V = 3α L, αV = contraction coefficient in volume and α L = contraction
coefficient in length, i.e. α V = 3*13 % = 39 %. However, no clear contraction of the
composite in the x-y plane during the GO / rGO transition could be observed by AFM,
because of relatively low resolution. Obviously, ClO4- insertion leads to higher density of
the composite material with only minor expansion. For an isotropic thermal expansion
one would expect α V = 3α L, α V = expansion coefficient in volume and α L = expansion
coefficient in length. In the current case, large density changes in the case of ClO4-
breathing is expected.
56
2.4.3.4. Raman spectroscopy
The Raman spectroscopic quality of the rGO obtained by chemical and the
electrocatalytic method were compared. For this purpose a well characterized GO, i.e.
oxo-functionalized graphene oxide (oxo-G)110, 129-130
reduced by established chemical
reduction methods,112-114
and reduced electrocatalytically was used (Figure 2.19a). The
G-band at 1585 cm-1
is assigned to the first–order scattering of the E2g phonon from sp2
carbon (graphene lattice) and the D-band at 1340 cm-1
is a breathing mode of point
phonons of A1g symmetry, which needs activation by a defect. Sharpening of both bands
as well as the increase of the ratio of ID / IG (from 1 to 2.6) upon reduction are evidence
for the high quality of reduction using MV++
(according to the model introduced in the
literature, distance of defects: 2.5 nm, defect density: 0.5%), which is comparable to the
best results obtained with chemical reduction procedures112-114
(details: Experimental
Section). The D’ band at 1618 cm-1
(in Oxo-G was covered under the G band) was
observed after reduction.110, 129-130
2.4.3.5. Thermogravimetric analysis
Thermogravimetric analysis (TGA) was performed to further evaluate the level of
reduction of the GO (Figure 2.19b). The PVFc showed > 95% weight loss at 470°C,
which was due to the decomposition of the polymer backbone.131-132
The GO sample
showed a sigmoidal weight loss (ca. 38%) centered around 180oC probably due to loss of
interlamellar water at lower temperature and loss of oxygen–containing functionalities at
higher temperatures.133
The weight loss of 38% compares well with the oxygen content
claimed by the provider, but 470oC is not sufficient for complete removal of all
functionalities. Interestingly, the PVFc@rGO composite did not show any weight loss up
to 390°C, pointing to the removal of majority of GO functional groups upon its
transformation to rGO.133-134
The electrochemical changes of a thermally reduced
composite is not studied.
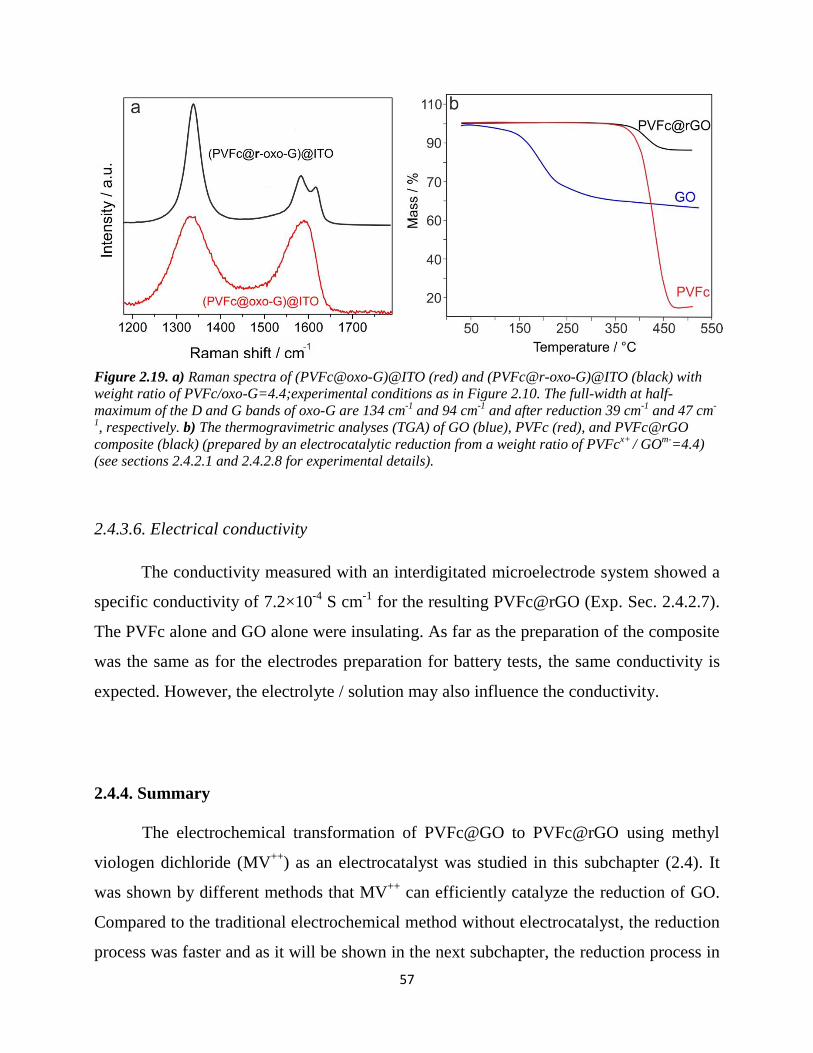
57
Figure 2.19. a) Raman spectra of (PVFc@oxo-G)@ITO (red) and (PVFc@r-oxo-G)@ITO (black) with
weight ratio of PVFc/oxo-G=4.4;experimental conditions as in Figure 2.10. The full-width at half-
maximum of the D and G bands of oxo-G are 134 cm-1
and 94 cm-1
and after reduction 39 cm-1
and 47 cm-
1, respectively. b) The thermogravimetric analyses (TGA) of GO (blue), PVFc (red), and PVFc@rGO
composite (black) (prepared by an electrocatalytic reduction from a weight ratio of PVFcx+
/ GOm-
=4.4)
(see sections 2.4.2.1 and 2.4.2.8 for experimental details).
2.4.3.6. Electrical conductivity
The conductivity measured with an interdigitated microelectrode system showed a
specific conductivity of 7.2×10⁻⁴
S cm-1
for the resulting PVFc@rGO (Exp. Sec. 2.4.2.7).
The PVFc alone and GO alone were insulating. As far as the preparation of the composite
was the same as for the electrodes preparation for battery tests, the same conductivity is
expected. However, the electrolyte / solution may also influence the conductivity.
2.4.4. Summary
The electrochemical transformation of PVFc@GO to PVFc@rGO using methyl
viologen dichloride (MV++
) as an electrocatalyst was studied in this subchapter (2.4). It
was shown by different methods that MV++
can efficiently catalyze the reduction of GO.
Compared to the traditional electrochemical method without electrocatalyst, the reduction
process was faster and as it will be shown in the next subchapter, the reduction process in
58
thick layers (29 µm) was possible. The electrocatalytic role of MV++
, as well as efficient
reduction of GO to rGO was shown by CV and EQCM. The irreversible GO / rGO
transition resulted in 7.6% total mass reduction and 7.7% total height decrease. For the
reversible ClO4− ion breathing, 42% mass increase upon oxidation was observed, which
was accompanied by only 13% total height increase. The excellent quality of the MV
catalyzed reduction was further shown by Raman spectroscopy and TGA.
59
2.5. Energy Storage Performances
2.5.1. Introduction
Ferrocene is a well-known reference electrode for electrochemical measurements.
This is due to its remarkable electrochemical behavior in non-aqueous solution such as
fast kinetics, reversibility, invariant redox potential toward other solutes, and air
stability.135
The redox potential (3.5 V vs. Li/Li+), as well as the high specific capacity
(144 mAh g-1
) make ferrocene also a good candidate for high energy battery applications.
Polymeric forms of ferrocene have been used for electron storage materials. Ferrocenes’s
subunit pendant on a main chain backbone shows not only reversible redox behavior, but
also conductivity through electron hopping between redox sites.136
However, the resulting
conductivity is not enough for fast charging - discharging, nor for the preparation of the
high areal-capacity electrodes. Therefore, many attempts shifted toward enhancing the
conductivity through incorporation of conductive polymers into the poly-Forreocene
backbone or simply by addition of conductive fillers to the electrode matrix e.g., carbon
fiber. Thus, Goodenough et al., have reported a ferrocene–containing polypyrrole
cathodic material with 65 mAh g-1
at 0.2 C and up to 2 µm thickness.45
Su; et al., reported
on ferrocene-pyrrole-, ferrocene-triphenylamine-, and ferrocene-aniline polymers
reaching 68 to 104 mAh g-1
, but these values do not include the weighted additional
binder and conductive material used (50 wt%).54, 56-57
Notably, poly-pyrrole, -trialylamine
or -aniline contribute capacitive properties into the material yielding an undesirable
potential dependence in charging / discharging curves. In other cases, the conductivity of
ferrocene–based polymer battery materials was achieved by loading carbon fillers in the
polymer matrixes. The amount of active redox polymer in the final composition of the
electrode was 40% for poly(ferrocenylsilane)47
and only 10% for poly(ethynylferrocene),
for poly(vinylferrocene) (PVFc) and polyferrocene.46
The reported specific capacities (95
to 115 mAh g-1
) do not include the additional conductive agents and binders. If they are
included the above values drop to 9.5 to 46 mAh g-1
, respectively, which considerably
decreases the specific capacity of the electrodes. Therefore, in spite of the high capacity
60
of ferrocene (144 mAh g-1
), preparation of its polymeric form, as well as providing
conductivity in the electrode materials significantly decreased the capacity so far.
2.5.2. Experimental
2.5.2.1. Instrument
The CVs and galvanostatic measurements were performed using an Autolab
potentiostat (PGSTAT 20) interfaced to a computer with the GPS software (version 4.9).
2.5.2.2. Chemicals
The chemicals and solvents were purchased as it is mentioned in the section
2.4.2.2. Ethylene carbonate (anhydrous, 99%) and dimethyl carbonate (anhydrous, >
99%) are from Sigma-Aldrich.
2.5.2.3. Battery performance tests
The electrodes were prepared as it is explained in 2.4.2.4 and 2.4.2.5. Most battery
performance tests were done in anhydrous 0.1M LiClO4/MeCN, and a few in 0.1M
LiClO4 / EC-DMC using the polymer or composite (PVFc / GO = 4.4) modified GC
working electrode.
2.5.3. Results and discussion
The electrochemical performance of the composite material was characterized by
CV and by galvanostatic charge–discharge tests on (PVFc@rGO)n@GC electrodes
(chapter 2.4 and Experimental Section). In Figure 2.20a CVs of pure (PVFcx+ .
xNO3-
)2@GC and (PVFc@rGO)2@GC in 0.1 M LiClO4 / H2O electrolyte are shown. As already
discussed in chapter 2.4, the reversible wave at ca. 0.3 V is attributed to the fast, surface
confined ferrocenium / ferrocene couple (Eq. 2.6). Kinetics and the amount of injectable
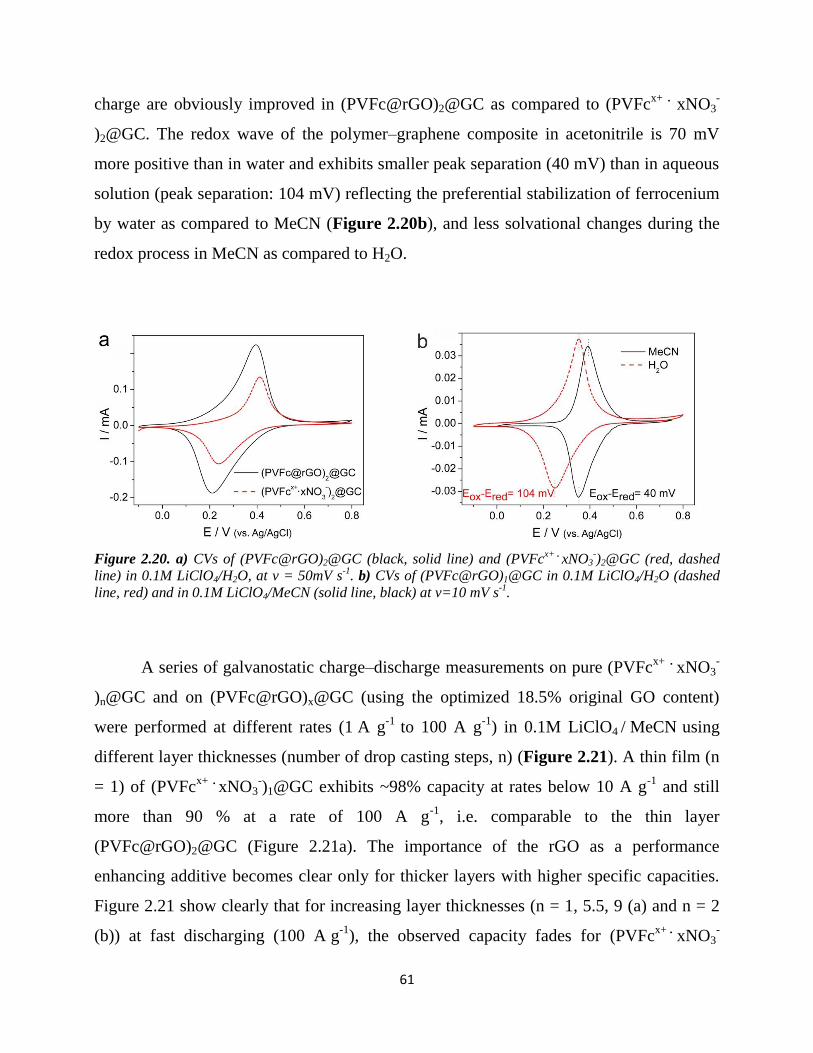
61
charge are obviously improved in (PVFc@rGO)2@GC as compared to (PVFcx+ .
xNO3-
)2@GC. The redox wave of the polymer–graphene composite in acetonitrile is 70 mV
more positive than in water and exhibits smaller peak separation (40 mV) than in aqueous
solution (peak separation: 104 mV) reflecting the preferential stabilization of ferrocenium
by water as compared to MeCN (Figure 2.20b), and less solvational changes during the
redox process in MeCN as compared to H2O.
Figure 2.20. a) CVs of (PVFc@rGO)2@GC (black, solid line) and (PVFcx+ .
xNO3-)2@GC (red, dashed
line) in 0.1M LiClO4/H2O, at v = 50mV s-1
. b) CVs of (PVFc@rGO)1@GC in 0.1M LiClO4/H2O (dashed
line, red) and in 0.1M LiClO4/MeCN (solid line, black) at v=10 mV s-1
.
A series of galvanostatic charge–discharge measurements on pure (PVFcx+
. xNO3
-
)n@GC and on (PVFc@rGO)x@GC (using the optimized 18.5% original GO content)
were performed at different rates (1 A g-1
to 100 A g-1
) in 0.1M LiClO4 / MeCN using
different layer thicknesses (number of drop casting steps, n) (Figure 2.21). A thin film (n
= 1) of (PVFcx+ .
xNO3-)1@GC exhibits ~98% capacity at rates below 10 A g
-1 and still
more than 90 % at a rate of 100 A g-1
, i.e. comparable to the thin layer
(PVFc@rGO)2@GC (Figure 2.21a). The importance of the rGO as a performance
enhancing additive becomes clear only for thicker layers with higher specific capacities.
Figure 2.21 show clearly that for increasing layer thicknesses (n = 1, 5.5, 9 (a) and n = 2
(b)) at fast discharging (100 A g-1
), the observed capacity fades for (PVFcx+ .
xNO3-
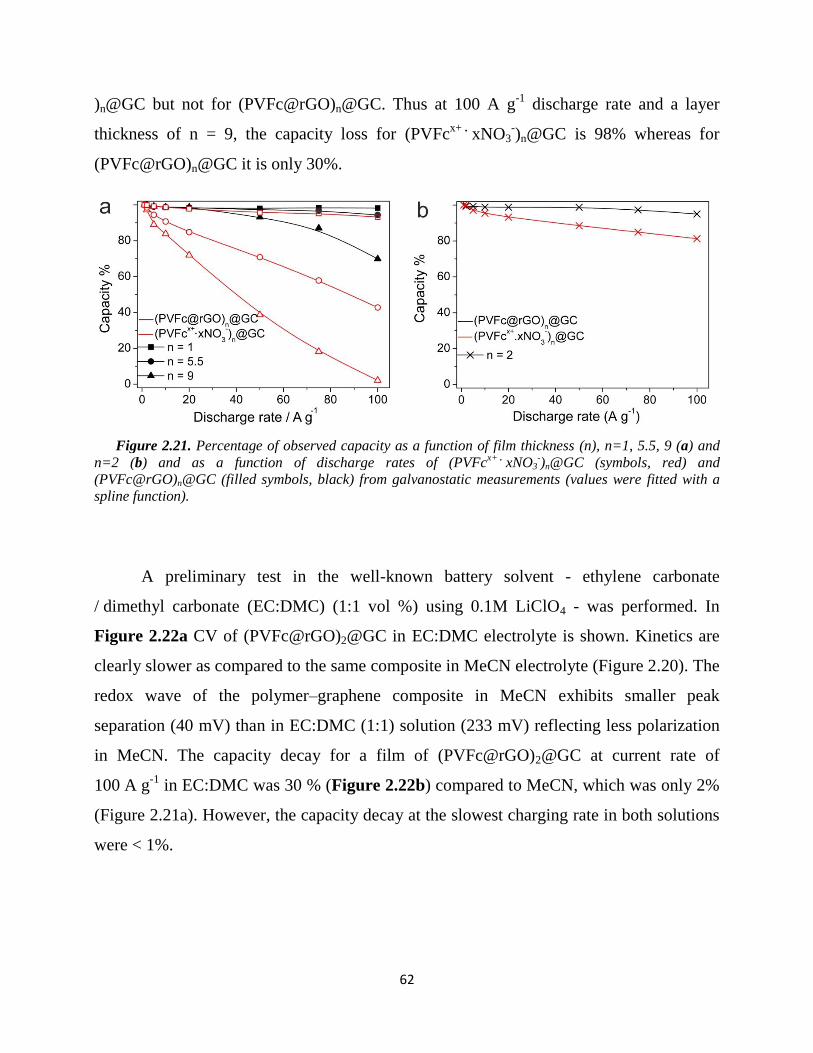
62
)n@GC but not for (PVFc@rGO)n@GC. Thus at 100 A g-1
discharge rate and a layer
thickness of n = 9, the capacity loss for (PVFcx+ .
xNO3-)n@GC is 98% whereas for
(PVFc@rGO)n@GC it is only 30%.
Figure 2.21. Percentage of observed capacity as a function of film thickness (n), n=1, 5.5, 9 (a) and
n=2 (b) and as a function of discharge rates of (PVFcx+ .
xNO3-)n@GC (symbols, red) and
(PVFc@rGO)n@GC (filled symbols, black) from galvanostatic measurements (values were fitted with a
spline function).
A preliminary test in the well-known battery solvent - ethylene carbonate
/ dimethyl carbonate (EC:DMC) (1:1 vol %) using 0.1M LiClO4 - was performed. In
Figure 2.22a CV of (PVFc@rGO)2@GC in EC:DMC electrolyte is shown. Kinetics are
clearly slower as compared to the same composite in MeCN electrolyte (Figure 2.20). The
redox wave of the polymer–graphene composite in MeCN exhibits smaller peak
separation (40 mV) than in EC:DMC (1:1) solution (233 mV) reflecting less polarization
in MeCN. The capacity decay for a film of (PVFc@rGO)2@GC at current rate of
100 A g-1
in EC:DMC was 30 % (Figure 2.22b) compared to MeCN, which was only 2%
(Figure 2.21a). However, the capacity decay at the slowest charging rate in both solutions
were < 1%.
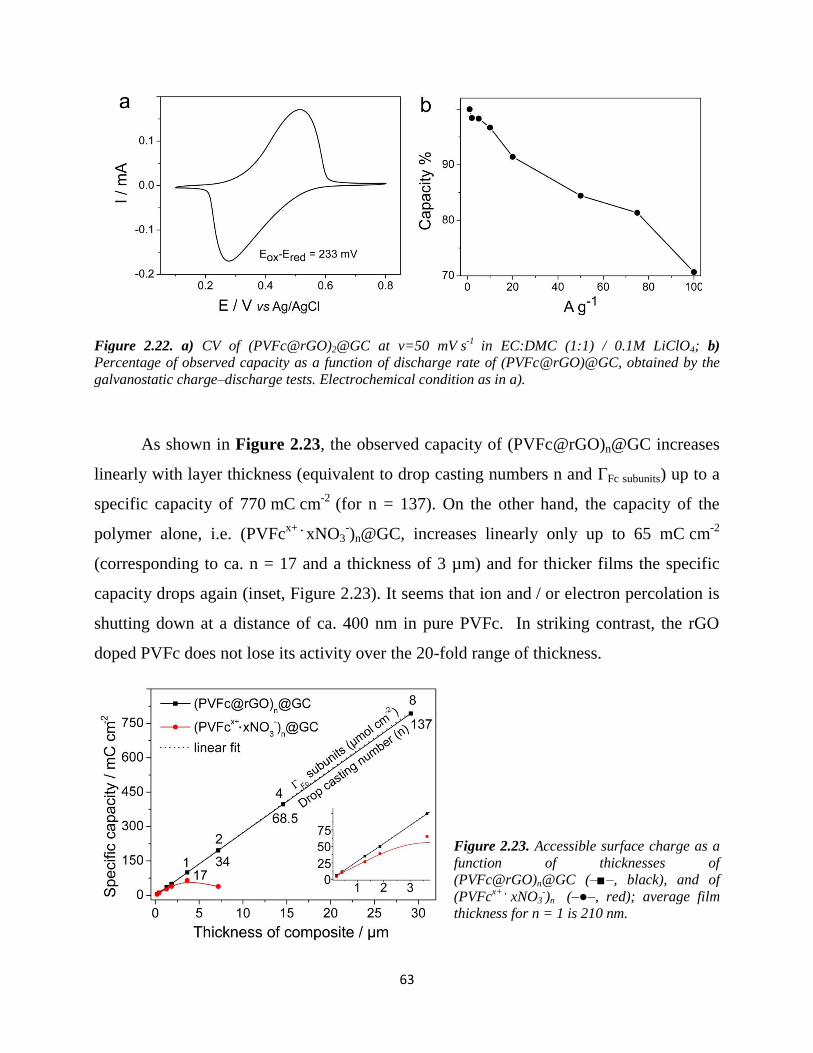
63
Figure 2.22. a) CV of (PVFc@rGO)2@GC at v=50 mV s-1
in EC:DMC (1:1) / 0.1M LiClO4; b)
Percentage of observed capacity as a function of discharge rate of (PVFc@rGO)@GC, obtained by the
galvanostatic charge–discharge tests. Electrochemical condition as in a).
As shown in Figure 2.23, the observed capacity of (PVFc@rGO)n@GC increases
linearly with layer thickness (equivalent to drop casting numbers n and ΓFc subunits) up to a
specific capacity of 770 mC cm-2
(for n = 137). On the other hand, the capacity of the
polymer alone, i.e. (PVFcx+ .
xNO3-)n@GC, increases linearly only up to 65 mC cm
-2
(corresponding to ca. n = 17 and a thickness of 3 µm) and for thicker films the specific
capacity drops again (inset, Figure 2.23). It seems that ion and / or electron percolation is
shutting down at a distance of ca. 400 nm in pure PVFc. In striking contrast, the rGO
doped PVFc does not lose its activity over the 20-fold range of thickness.
Figure 2.23. Accessible surface charge as a
function of thicknesses of
(PVFc@rGO)n@GC (–■–, black), and of
(PVFcx+ .
xNO3-)n (–●–, red); average film
thickness for n = 1 is 210 nm.
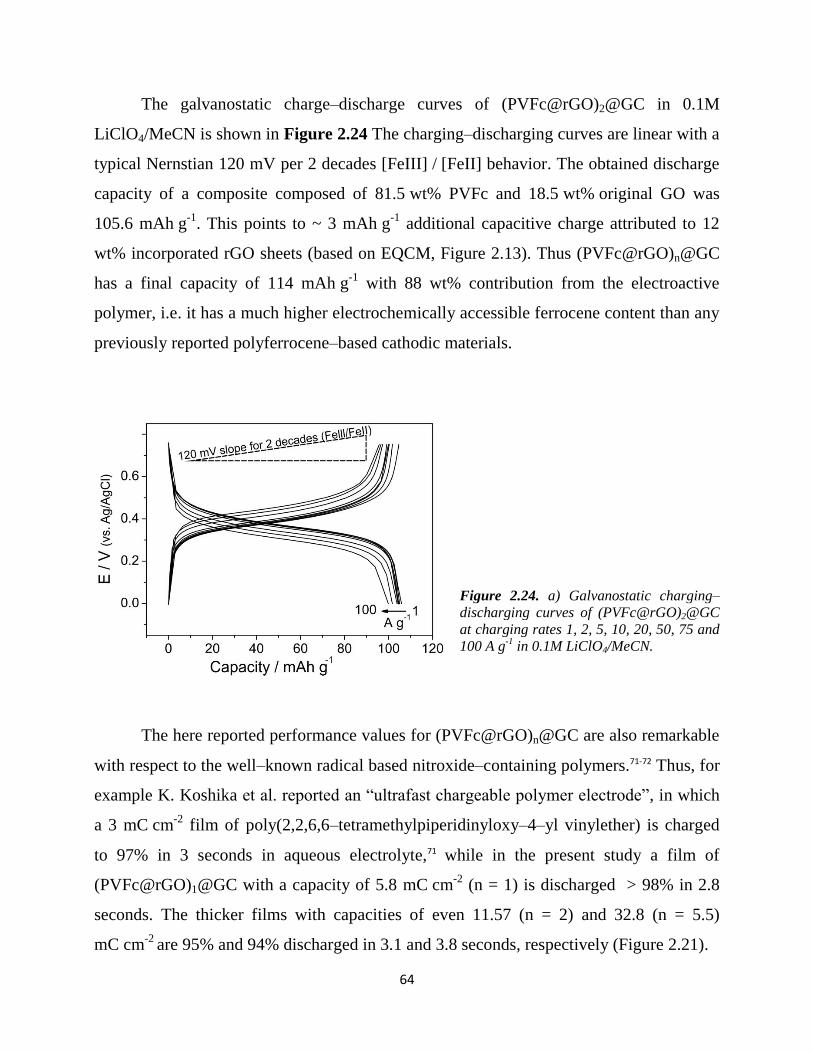
64
The galvanostatic charge–discharge curves of (PVFc@rGO)2@GC in 0.1M
LiClO4/MeCN is shown in Figure 2.24 The charging–discharging curves are linear with a
typical Nernstian 120 mV per 2 decades [FeIII] / [FeII] behavior. The obtained discharge
capacity of a composite composed of 81.5 wt% PVFc and 18.5 wt% original GO was
105.6 mAh g-1
. This points to ~ 3 mAh g-1
additional capacitive charge attributed to 12
wt% incorporated rGO sheets (based on EQCM, Figure 2.13). Thus (PVFc@rGO)n@GC
has a final capacity of 114 mAh g-1
with 88 wt% contribution from the electroactive
polymer, i.e. it has a much higher electrochemically accessible ferrocene content than any
previously reported polyferrocene–based cathodic materials.
Figure 2.24. a) Galvanostatic charging–
discharging curves of (PVFc@rGO)2@GC
at charging rates 1, 2, 5, 10, 20, 50, 75 and
100 A g-1
in 0.1M LiClO4/MeCN.
The here reported performance values for (PVFc@rGO)n@GC are also remarkable
with respect to the well–known radical based nitroxide–containing polymers.71-72 Thus, for
example K. Koshika et al. reported an “ultrafast chargeable polymer electrode”, in which
a 3 mC cm-2
film of poly(2,2,6,6–tetramethylpiperidinyloxy–4–yl vinylether) is charged
to 97% in 3 seconds in aqueous electrolyte,71 while in the present study a film of
(PVFc@rGO)1@GC with a capacity of 5.8 mC cm-2
(n = 1) is discharged > 98% in 2.8
seconds. The thicker films with capacities of even 11.57 (n = 2) and 32.8 (n = 5.5)
mC cm-2
are 95% and 94% discharged in 3.1 and 3.8 seconds, respectively (Figure 2.21).
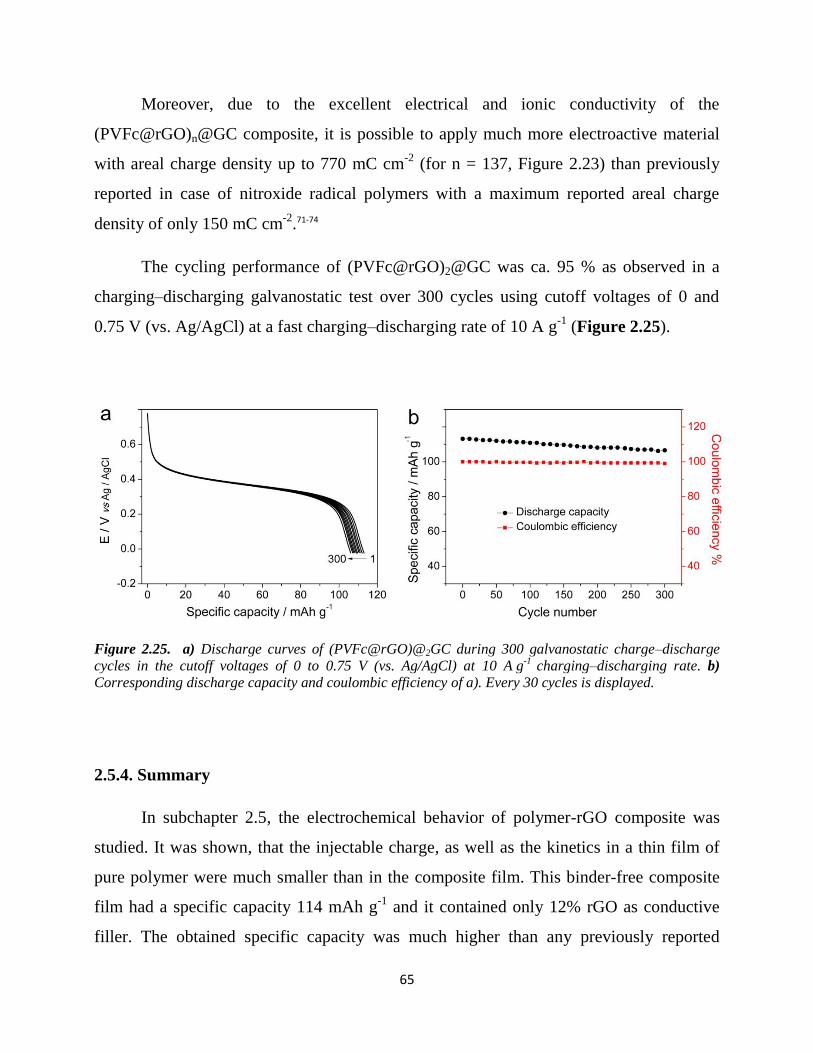
65
Moreover, due to the excellent electrical and ionic conductivity of the
(PVFc@rGO)n@GC composite, it is possible to apply much more electroactive material
with areal charge density up to 770 mC cm-2
(for n = 137, Figure 2.23) than previously
reported in case of nitroxide radical polymers with a maximum reported areal charge
density of only 150 mC cm-2
.71-74
The cycling performance of (PVFc@rGO)2@GC was ca. 95 % as observed in a
charging–discharging galvanostatic test over 300 cycles using cutoff voltages of 0 and
0.75 V (vs. Ag/AgCl) at a fast charging–discharging rate of 10 A g-1
(Figure 2.25).
Figure 2.25. a) Discharge curves of (PVFc@rGO)@2GC during 300 galvanostatic charge–discharge
cycles in the cutoff voltages of 0 to 0.75 V (vs. Ag/AgCl) at 10 A g-1
charging–discharging rate. b)
Corresponding discharge capacity and coulombic efficiency of a). Every 30 cycles is displayed.
2.5.4. Summary
In subchapter 2.5, the electrochemical behavior of polymer-rGO composite was
studied. It was shown, that the injectable charge, as well as the kinetics in a thin film of
pure polymer were much smaller than in the composite film. This binder-free composite
film had a specific capacity 114 mAh g-1
and it contained only 12% rGO as conductive
filler. The obtained specific capacity was much higher than any previously reported
66
polyferrocene–based cathodic materials.45-47,54,56-57
Besides, the composite was
demonstrated to be "thickness scalable" up to 770 mC cm-2
corresponding to 29 µm with
> 99% coulombic efficiency. However the scalability of the polymer alone was limited to
65 mC cm-2
. The charging rate of the composite was also remarkable, e. g., a film of
(PVFc@rGO)@GC with an observed capacity of 5.8 mC cm-2
was > 98% charged in 2.8
seconds. This rate performance is higher than those reported for well–known high rate
radical based nitroxide polymers.71-72
The improved electrochemical response of the
composite such as thickness scalability and rate performance compared to the polymer
alone, clearly indicated the role of rGO in providing an excellent ion / electron
percolation system throughout the composite film. In addition, the composite material
exhibited a perfect cycling stability by sustaining > 95% of the specific capacity over 300
charging–discharging galvanostatic cycles compared to its initial value.
67
Chapter 3
Summary and Outlook
3.1. Summary
In this thesis, the electrochemical energy storage capability of a nanocomposite
consisting of poly(vinylferrocene) and reduced graphene oxide was studied. The
appropriate redox potential (+0.3 V vs. Ag/AgCl), fast electrochemical kinetics and a
stable voltage plateau make PVFc an excellent candidate for cathodic material. However,
a big challenge facing organic-based materials for electrochemical energy storage is
introducing ionic and electronic conductivity into the film composition. Because of the
high surface area of organic polymers, addition of large amounts of conductive fillers (>
60 wt %) have been necessary so far. In this thesis, a new method was developed, which
allows the preparation of nanocomposite materials with very small wt % of conductive
filler. The resulting nanocomposite exhibited an excellent electrochemical response, with
respect to the current density rate and the thickness scalability. Notably, this method is not
only limited to the mentioned polymer, but can be expanded to a wide variety of cationic
redox polymers. The method of preparation was carried out as follows:
I. Synthesis of the positively charged redox polymer. As far as the as-synthesized
PVFc possesses no charge, a pre-oxidizing step was necessary (PVFc0→PVFc
+).
However, as shown in the subchapter 2.3, even partially oxidized PVFc (PVFc+
→ PVFc
x+) was sufficient for the self assembly step (discussed in III).
II. Preparation of well dispersed single GO sheets as a stable colloidal solution.
This was obtained by appropriate dilution and sonification of a commercial graphene
oxide solution.
III. The self-assembly was achieved based on the attractive electrostatic interaction
between the partially oxidized polymer (PVFcx+
) and the negatively charged GO in the
aqueous solution. This was attained by simply mixing the solutions of the two
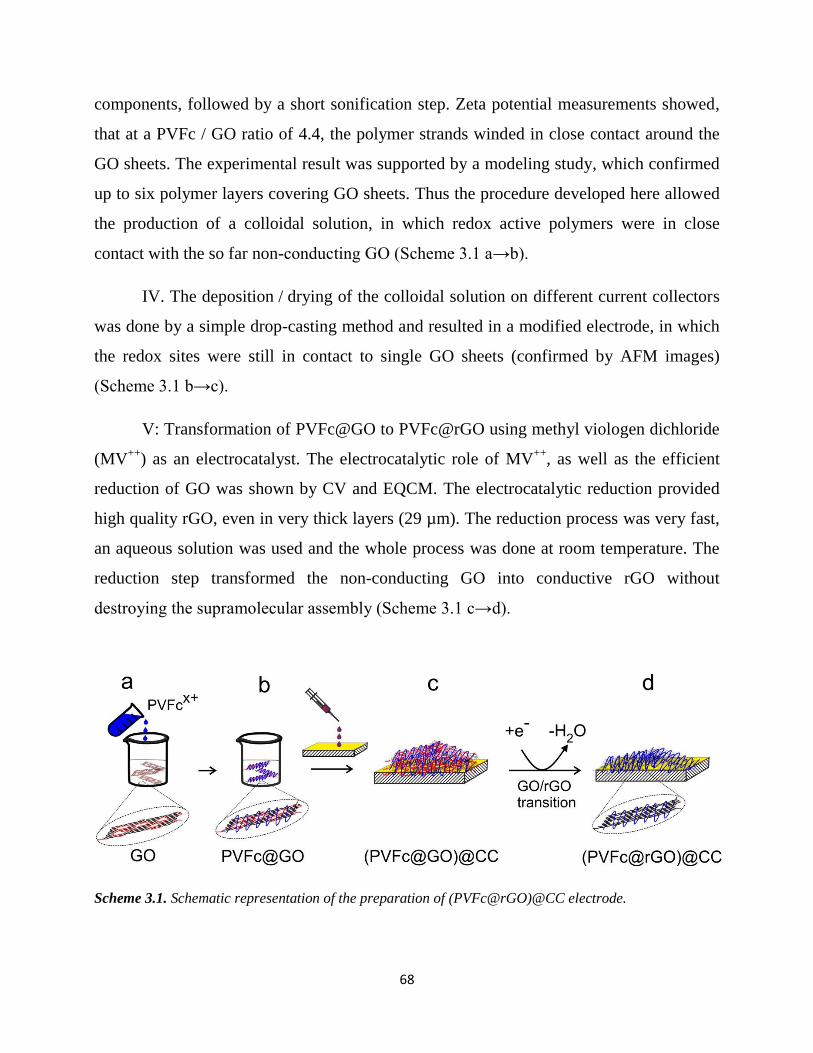
68
components, followed by a short sonification step. Zeta potential measurements showed,
that at a PVFc / GO ratio of 4.4, the polymer strands winded in close contact around the
GO sheets. The experimental result was supported by a modeling study, which confirmed
up to six polymer layers covering GO sheets. Thus the procedure developed here allowed
the production of a colloidal solution, in which redox active polymers were in close
contact with the so far non-conducting GO (Scheme 3.1 a→b).
IV. The deposition / drying of the colloidal solution on different current collectors
was done by a simple drop-casting method and resulted in a modified electrode, in which
the redox sites were still in contact to single GO sheets (confirmed by AFM images)
(Scheme 3.1 b→c).
V: Transformation of PVFc@GO to PVFc@rGO using methyl viologen dichloride
(MV++
) as an electrocatalyst. The electrocatalytic role of MV++
, as well as the efficient
reduction of GO was shown by CV and EQCM. The electrocatalytic reduction provided
high quality rGO, even in very thick layers (29 µm). The reduction process was very fast,
an aqueous solution was used and the whole process was done at room temperature. The
reduction step transformed the non-conducting GO into conductive rGO without
destroying the supramolecular assembly (Scheme 3.1 c→d).
Scheme 3.1. Schematic representation of the preparation of (PVFc@rGO)@CC electrode.
69
It is demonstrated for the first time, that molecularly tightly connected graphene
sheets - polymer strands can be produced efficiently by prior self-assembling of graphene
oxide and partially oxidized, positively charged PVFc followed by an electrocatalytic
reduction of GO to rGO. The use of supramolecular chemistry has opened a new avenue
for the preparation of electron- and ion-percolation systems. It was found, that PVFc
alone supports already the formation of mesoporous tunnels also by a kind of self-
assembling even without the help of graphene oxide. Thus the preparation of ion
percolation paths is naturally build-in. The partially stacked PVFc-separated graphene
oxide observable by AFM at a weight ratio PVFc / GO = 1:1 showed the active
percolation system for ions and electrons consisting of deep holes and closely spaced GO,
i.e. rGO after reduction. The direct contact between rGO flakes might be necessary, but a
ferrocenium / ferrocene electron shuttling mechanism between GO flakes could not be
excluded. Anyhow, as shown in Figure 2.23, the conductivity of pure PVFc without rGO
broke down after a few hundred nm film thickness.
The electrochemical performance of the nanocomposite was remarkable. The
binder-free composite film containing only 12% rGO as conductive filler was
demonstrated to be "thickness scalable" up to 0.21 mAh cm-2
corresponding to 29 µm
with > 99% coulombic efficiency. The PVFc@rGO film with an observed capacity of 5.8
mC cm−2
was > 98% charged in 2.8 s. This “rate performance” was considerably higher
than those reported for the well-known high rate radical based nitroxide polymers.71-72
This outstanding energy storage capability was explained by the fast faradaic reaction in
the organic solvent (i), the high rate electron transfer obtained by well dispersed rGO
sheets in the composite matrix (ii) and the benefits to anion conduction, because of the
increased surface area in the polymer-rGO nanacomposite (iii). The high areal-capacity
combined with fast charging-discharging and a high cyclability places this energy storing
material into the top range of the known organic battery materials. Notably, this
composite material showed excellent performance in both organic and aqueous solutions.
It was impressive how well the experimental mass changes of the composite from
EQCM fitted the theoretically expected mass changes for the GO / rGO transition. The
70
same was true for the ClO4- ion breathing, i.e. one anion accompanied by little or no water
molecules was clearly identified. Briefing was also followed by a new method i.e.
observation of the molecular height change during electrochemically triggered ion
breathing. Thus, 13% height change was observed for PVFc@rGO. However, no
systematic lateral contraction and expansion could be identified. The combination of
electrochemical height breathing from EC-AFM and electrochemical mass breathing from
EQCM must be considered a new technique and offers a more detailed insight into ion
breathing than so far found in literature.
The ongoing research in our lab has shown that the principal procedure of self-
assembling electroactive polymers on GO via stable colloidal solutions, leading to a
mesoporous composite structure with excellent ion percolating properties is also
applicable to other redox polymer / GO combinations.
3.2. Outlook
It would be interesting to extend the method of composite preparation also to other
electroactive, positively charged redox polymers with electrochemical charge storing
properties. Some polymers based on viologen, ferrocene and cobaltocenium have already
undergone preliminary tests and showed promising responses.
Another interesting extension of the work would be to check alternative carbon
materials with a negative surface charge, e.g., oxidized multi-walled carbon nanotube as
conductive filler. The material is conductive and has a negative surface charge.
Effectively, preliminary tests show redox polymer wrapping.
Alternative composite deposition techniques should be checked, e.g.,
electrodeposition, spraying, printing, spin coating etc). Such techniques may improve the
material’s performance and would be closer to the techniques applicable for mass
production.
71
References
1. J. B. Goodenough, K.-S. Park, J. Am. Chem. Soc. 135, 1167 (2013).
2. W. Li, J. R. Dahn, D. S. Wainwright, Science 264, 1115 (1994).
3. B. J. Landi, M. J. Ganter, C. D. Cress et al., Energy Environ. Sci. 2, 638 (2009).
4. S. Afyon, F. Krumeich, C. Mensing et al., Sci. Rep. 4, 7113 (2014).
5. Z. Song, H. Zhou, Energy Environ. Sci. 6, 2280 (2013).
6. S. M. Beladi-Mousavi, S. Sadaf, L. Walder et al., Adv. Energy Mater. 6, 1600108 (2016).
7. M. M. Thackeray, S.-H. Kang, C. S. Johnson et al., J. Mater. Chem. 17, 3112 (2007).
8. Y. Liang, Z. Tao, J. Chen, Adv. Energy Mater. 2, 742 (2012).
9. W. Choi, D. Harada, K. Oyaizu, H. Nishide, J. Am. Chem. Soc. 133, 19839 (2011).
10. N. Sano, W. Tomita, S. Hara et al., ACS Appl. Mater. Interfaces 5, 1355 (2013).
11. S. Sen, J. Saraidaridis, S. Y. Kim, G. T. R. Palmore, ACS Appl. Mater. Interfaces 5, 7825 (2013).
12. T. Suga, H. Ohshiro, S. Sugita et al., Adv. Mater. 21, 1627 (2009).
13. M. E. Spahr, in Lithium-Ion Batteries: Science and Technologies, M. Yoshio, R. J. Brodd, A.
Kozawa, Eds. (Springer New York, New York, NY, 2009), pp. 117-154.
14. A. Manthiram, Y. Fu, S.-H. Chung, C. Zu, Y.-S. Su, Chem. Rev. 114, 11751 (2014).
15. H.-g. Wang, S. Yuan, D.-l. Ma et al., Adv. Energy Mater. 4, 1301651 (2014).
16. X. Han, C. Chang, L. Yuan, T. Sun, J. Sun, Adv. Mater. 19, 1616 (2007).
17. K. Oyaizu, Y. Ando, H. Konishi, H. Nishide, J. Am. Chem. Soc. 130, 14459 (2008).
18. Z. Song, T. Xu, M. L. Gordin et al., Nano Lett. 12, 2205 (2012).
19. A. Usuki, N. Hasegawa, M. Kato, S. Kobayashi, in Inorganic Polymeric Nanocomposites and
Membranes. (Springer Berlin Heidelberg, 2005), vol. 179, pp. 135-195.
20. T. Ramanathan, S. Stankovich et al., J. Polym. Sci. Part B: Polym. Phys. 45, 2097 (2007).
21. T. Ramanathan, A. A. Abdala, S. Stankovich et al., Nat. Nanotechnol. 3, 327 (2008).
22. E. Hwang, S. Seo, S. Bak et al., Adv. Mater. 26, 5129 (2014).
23. L. Al-Mashat, K. Shin, K. Kalantar-zadeh et al., J. Phys. Chem. C 114, 16168 (2010).
24. P. You, Z. Liu, Q. Tai Adv. Mater. 27, 3632 (2015).
25. Z. Zhu, J. Ma, Z. Wang et al., J. Am. Chem. Soc. 136, 3760 (2014).
26. W. Guo, Y.-X. Yin, S. Xin et al., Energy Environ. Sci. 5, 5221 (2012).
27. R. Verdejo, M. M. Bernal, L. J. Romasanta, M. A. Lopez-Manchado, J. Mater. Chem. 21, 3301
(2011).
28. Y. Zhu, S. Murali, W. Cai et al., Adv. Mater. 22, 3906 (2010).
29. L. Feng, S. Zhang, Z. Liu, Nanoscale 3, 1252 (2011).
30. T. Kim, H. Lee, J. Kim, K. S. Suh, ACS Nano 4, 1612 (2010).
31. M. Zhang, B.-C. Yin, X.-F. Wang, B.-C. Ye, Chem. Commun. 47, 2399 (2011).
32. S. Li, A. N. Aphale, I. G. MacwanS et al., ACS Appl. Mater. Interfaces 4, 7069 (2012).
33. D. R. Dreyer, S. Park, C. W. Bielawski, R. S. Ruoff, Chem. Soc. Rev. 39, 228 (2010).
34. S. Park, J. An, J. R. Potts et al., Carbon 49, 3019 (2011).
35. N.-J. Song, C.-M. Chen, C. Lu et al., J. Mater. Chem. A 2, 16563 (2014).
36. M. Armand, J. M. Tarascon, Nature 451, 652 (2008).
37. F. Cheng, J. Liang, Z. Tao, J. Chen, Adv. Mater. 23, 1695 (2011).
38. V. Etacheri, R. Marom, R. Elazari et al., Energy Environ. Sci. 4, 3243 (2011).
39. J. B. Goodenough, Y. Kim, Chem. Mater. 22, 587 (2010).
40. P. Poizot, F. Dolhem, Energy Environ. Sci. 4, 2003 (2011).
41. X. Mao, F. Simeon, D. S. Achilleos et al., J. Mater. Chem. A 1, 13120 (2013).
42. X. Mao, G. C. Rutledge, T. A. Hatton, Langmuir 29, 9626 (2013).
43. L. Cao, S. Sadaf, S. M. Beladi-Mousavi, L. Walder, Eur. Polym. J. 49, 1923 (2013).
44. R. R. Gagne, C. A. Koval, G. C. Lisensky, Inorg. Chem. 19, 2854 (1980).
45. K. S. Park, S. B. Schougaard, J. B. Goodenough, Adv. Mater. 19, 848 (2007).
72
46. K. Tamura, N. Akutagawa, M. Satoh et al., Macromol. Rapid Commun. 29, 1944 (2008).
47. H. Zhong, G. Wang, Z. Song et al., Chem. Commun. 50, 6768 (2014).
48. Y. Ding, Y. Zhao, G. Yu, Nano Lett. 15, 4108 (2015).
49. T. Kawai, C. Iwakura, H. Yoneyama, Electrochim. Acta 34, 1357 (1989).
50. R. H. Staff, M. Gallei, M. Mazurowski et al., ACS Nano 6, 9042 (2012).
51. J. Elbert, J. Mersini, N. Vilbrandt et al., Macromolecules 46, 4255 (2013).
52. J. Elbert, M. Gallei, C. Rüttiger et al., Organometallics 32, 5873 (2013).
53. J. Elbert, F. Krohm, C. Rüttiger et al., Adv. Funct. Mater. 24, 1591 (2014).
54. C. Su, L Ji, L Xu et al., RSC Adv. 5, 14053 (2015).
55. J. Xiang, R. Burges, B. Häupler et al., Polymer 68, 328 (2015).
56. C. Su, L. Wang, L. Xu, C. Zhang, Electrochim. Acta 104, 302 (2013).
57. C. Su, Y. Ye, L. Xu, C. Zhang, J. Mater. Chem. 22, 22658 (2012).
58. W. Zheng, S.-C. Wong, Compos. Sci. Tech. 63, 225 (2003).
59. E. T. Thostenson, Z. Ren, T.-W. Chou, Compos. Sci. Tech. 61, 1899 (2001).
60. T. Ramanathan, H. Liu, L. C. Brinson, J. Polym. Sci. Part B: Polym. Phys. 43, 2269 (2005).
61. T. Desai, P. Keblinski, S. K. Kumar, J. Chem. Phys. 122, 134910 (2005).
62. F. W. Starr, T. B. Schrøder, S. C. Glotzer, Macromolecules 35, 4481 (2002).
63. H. He, J. Klinowski, M. Forster, A. Lerf, Chem. Phys. Lett. 287, 53 (1998).
64. A. Lerf, H. He, M. Forster, J. Klinowski, J. Phys. Chem. B 102, 4477 (1998).
65. S. Stankovich, R. D. Piner, X. Chen et al., J. Mater. Chem. 16, 155 (2006).
66. S. Stankovich, D. A. Dikin, G. H. B. Dommett et al., Nature 442, 282 (2006).
67. T. Kuila, A. K. Mishra, P. Khanra, N. H. Kim, J. H. Lee, Nanoscale 5, 52 (2013).
68. S. Krishnamurthy, I. V. Lightcap, P. V. Kamat, J. Photochem. Photobio. A: Chem. 221, 214
(2011).
69. B. Gadgil, P. Damlin, M. Heinonen, C. Kvarnström, Carbon 89, 53 (2015).
70. S. Eigler, A. Hirsch, Angew. Chem. Int. Ed. 53, 7720 (2014).
71. K. Koshika, N. Sano, K. Oyaizu, H. Nishide, Chem. Commun. 7, 836 (2009).
72. T. Suga, H. Konishi, H. Nishide, Chem. Commun. 17, 1730 (2007).
73. K. Koshika, N. Chikushi, N. Sano, K. Oyaizu, H. Nishide, Green Chem. 12, 1573 (2010).
74. K. Koshika, N. Sano, K. Oyaizu, H. Nishide, Macromol. Chem. Phys. 210, 1989 (2009).
75. H. Bai, C. Li, X. Wang, G. Shi, Chem. Commun. 46, 2376 (2010).
76. X. Fan, W. Peng, Y. Li et al., Adv. Mater. 20, 4490 (2008).
77. Y. Cao, J. Zhang, J. Feng, P. Wu, ACS Nano 5, 5920 (2011).
78. C. Chen, W. Cai, M. Long et al., ACS Nano 4, 6425 (2010).
79. C. Huang, H. Bai, C. Li, G. Shi, Chem. Commun. 47, 4962 (2011).
80. X. Chen, G. Wu, J. Chen et al., J. Am. Chem. Soc. 133, 3693 (2011).
81. H. Wang, Q. Zhang, X. Chu et al., Angew. Chem. Int. Ed. 50, 7065 (2011).
82. B. Konkena, S. Vasudevan, J. Phys. Chem. Lett. 3, 867 (2012).
83. C. Werner U. König et al., Colloids Surf. A: Physicochem. Eng. Asp. 159, 519 (1999).
84. H. J. Keh, J. L. Anderson, J. Fluid Mech. 153, 417 (2006).
85. A. R. Minerick, A. E. Ostafin, H.-C. Chang, Electrophoresis 23, 2165 (2002).
86. D. Erickson, D. Li, Langmuir 18, 1883 (2002).
87. A. Sze, D. Erickson, L. Ren, D. Li, J. Colloid Interface Sci. 261, 402 (2003).
88. M. Gallei, R. Klein, M. Rehahn, Macromolecules 43, 1844 (2010).
89. E. S. Yang, M.-S. Chan, A. C. Wahl, J. Phys. Chem. 79, 2049 (1975).
90. C. U. Pittman, J. C. Lai, D. P. Vanderpool, M. Good, R. Prado, Macromolecules 3, 746 (1970).
91. A.-R. Allouche, J. Comput. Chem. 32, 174 (2011).
92. A. Bansal, H. Yang, C. Li et al., Nat. Mater. 4, 693 (2005).
93. F. Yang, Y. Liu, L. Gao, J. Sun, J. Phys. Chem. C 114, 22085 (2010).
94. D. Li, M. B. Muller, S. Gilje, R. B. Kaner, G. G. Wallace, Nat. Nano 3, 101 (2008).
95. E. Dickinson, J. Chem. Tech. Biotech. 45, 328 (1989).
96. G. Xin, H. Wang, N. Kim et al., Nanoscale 4, 405 (2012).
73
97. X. Li, W. Cai, J. An et al., Science 324, 1312 (2009).
98. M. Keidar, A. Shashurin, O. Volotskova et al., Phys. Plasmas 17, 057101 (2010).
99. M. Alexander, V. Roumen, S. Koen et al., Nanotechnology 19, 305604 (2008).
100. T. Szabó, O. Berkesi, P. Forgó et al., Chem. Mater. 18, 2740 (2006).
101. S. Stankovich, D. A. Dikin, R. D. Piner et al., Carbon 45, 1558 (2007).
102. O.-K. Park, M. G. Hahm, S. Lee et al., Nano Lett. 12, 1789 (2012).
103. Z. Tiannan, C. Feng, L. Kai et al., Nanotechnology 22, 045704 (2011).
104. Z.-J. Fan, W. Kai, J. Yan et al., ACS Nano 5, 191 (2011).
105. X. Mei, J. Ouyang, Carbon 49, 5389 (2011).
106. Z. Fan, K. Wang, T. Wei et al., Carbon 48, 1686 (2010).
107. H.-L. Guo, X.-F. Wang, Q.-Y. Qian et al., ACS Nano 3, 2653 (2009/09/22, 2009).
108. Y. Shao, J. Wang, M. Engelhard et al., J. Mater. Chem. 20, 743 (2010).
109. N. F. Sheppard, R. C. Tucker, C. Wu, Anal. Chem. 65, 1199 (1993).
110. S. Eigler, M. Enzelberger-Heim, S. Grimm et al., Adv. Mater. 25, 3583 (2013).
111. C. E. Halbig, T. J. Nacken, J. Walter et al., Carbon 96, 897 (2016).
112. L. G. Cançado, A. Jorio A, E. H. M. Ferreira et al., Nano Lett. 11, 3190 (2011).
113. M. M. Lucchese, F. Stavale, E. H. M. Ferreira et al., Carbon 48, 1592 (2010).
114. S. Eigler, F. Hof, M. Enzelberger-Heim et al., J. Phys. Chem. C 118, 7698 (2014).
115. S. Pei, H.-M. Cheng, Carbon 50, 3210 (2012).
116. J. Yang, S. Gunasekaran, Carbon 51, 36 (2013).
117. I. Jureviciute, S. Bruckenstein, A. R. Hillman, J. Electroanal. Chem. 488, 73 (2000).
118. M. D. Levi, N. Levy, S. Sigalov et al., J. Am. Chem. Soc. 132, 13220 (2010).
119. W.-Y. Tsai, P.-L. Taberna, P. Simon, J. Am. Chem. Soc. 136, 8722 (2014).
120. H. C. De Long, D. A. Buttry, Langmuir 8, 2491 (1992).
121. D. C. Apodaca, R. B. Pernites, R. R. Ponnapati et al., ACS Appl. Mater. Interfaces 3, 191 (2011).
122. D. Johannsmann, Phys. Chem. Chem, Phys. 10, 4516 (2008).
123. A. R. Hillman, N. A. Hughes, S. Bruckenstein, J. Electrochem. Soc. 139, 74 (1992).
124. P. T. Varineau, D. A. Buttry, J. Phys. Chem. 91, 1292 (1987).
125. N. Shpigel, M. D. Levi, S. Sigalov et al., Nat. Mater 15, 570 (2016).
126. N. Nitta, G. Yushin, Part. Part. Syst. Charact. 31, 317 (2014).
127. J. Song, M. A. Hempenius, H. Jing Chung, G. Julius Vancso, Nanoscale 7, 9970 (2015).
128. A. Anne, E. Cambril, A. Chovin, C. Demaille, Analyt. Chem. 82, 6353 (2010).
129. S. Eigler, S. Grimm, M. Enzelberger-Heim et al., Chem. Commun. 49, 7391 (2013).
130. S. Eigler, Phys. Chem. Chem. Phys. 16, 19832 (2014).
131. C. Tonhauser, M. Mazurowski, M. Rehahn, M. Gallei, H. Frey, Macromolecules 45, 3409 (2012).
132. M. Mazurowski, M. Gallei, J. Li et al., Macromolecules 45, 8970 (2012).
133. H. Feng, R. Cheng, X. Zhao, X. Duan, J. Li, Nat. Commun. 4, 1539 (2013).
134. X. Li, G. Zhang, X. Bai et al., Nat. Nano. 3, 538 (2008).
135. G. Gritzner, J. Kuta, in Pure and Applied Chemistry. (1984), vol. 56, pp. 461.
136. C. Iwakura, T. Kawai, M. Nojima, H. Yoneyama, J. Electrochem. Soc. 134, 791 (1987).
74
Abbreviation
PVFc Poly(VinylFerrocene) cm centimeter
AFM Atomic Force Microscopy Ag/AgCl silver/silver chloride
EC Electrochemical Au gold
MHz MegaHertz e electron
G Graphene LiClO4 Lithium perchlorate
GO Graphene oxide s second
rGO reduced Graphene Oxide TGA thermogravimetric analysis
MV++
Methyl Viologen dichloride wt weight
I Current MeCN Acetonitrile
t time EC Ethylene Carbonate
V Voltage DMC Dimethyl Carbonate
Wh Watt hour mC milliCoulomb
kg kilogram CHCl3 Chloroform
mAh milliampere hour ET Electron Transfer
LIB Lithium Ion Battery M Molar
IoT Internet of Things mmol millimoles
Fc Ferrocene UV-Vis UltraViolet-Visible
J Joule ν Scan rate
HOMO Highest Occupied
Molecular Orbital
LUMO Lowest Unoccupied
Molecular Orbital
Mw Molecular weight ET Electron transfer
CV Cyclic Voltammetry LiCoO2 Lithium Cobalt Oxide
CC Current Collector LiMn2O4 Lithium Manganese Oxide
GC Glassy Carbon LiFePO4 Lithium Iron Phosphate
ITO Indium Tin Oxide S Sulfure
FTO Fluorine doped Tin Oxide V vanadium
CNT Carbon NanoTube PF6 Hexafluorophosphate
ζ Zeta Potential Vio Viologen
ε dielectric constant AgNO3 Silver Nitrate
η viscosity kDa kiloDalton
f(Ka) Henry’s function MWCO Molecular Weight Cut-Off
rpm revolutions per minute XRD X-Ray Diffraction
CVD Chemical Vapor Deposition f frequency
IME Interdigitated Microsensor
Electrode
EQCM Electrochemical Quartz
Crystal Microbalance
Ω Ohm µm micrometer
nm nanometer SCE Saturated calomel
electrode
75
Curriculum Vitae
Name: Seyyed Mohsen Beladi Mousavi
Date of Birth: 22 – 09 – 1984
Place of Birth: Ahvaz, Iran
Citizenship: Iranian
EDUCATION
University of Osnabrück, Germany
PhD, Organic chemistry and molecular electrochemistry 2012 - present
University of Sistan and Baluchestan, Zahedan, Iran
MSc, Organic chemistry 2008 – 2011
Imam Khomeini International University (IKIU), Qazvin, Iran
BSc, Chemistry 2003 - 2007
PUBLICATION
Poly(vinylferrocene)–Reduced Graphene Oxide as a High Power/High Capacity Cathodic
Battery Material. Adv. Energy Mater. (2016), S. M. Beladi-Mousavi, S. Sadaf, L. Walder, M.
Gallei, C.Rüttiger, S. Eigler and C. E. Halbig
Surface Oxidation of Stainless Steel: Oxygen Evolution Electrocatalysts with High Catalytic activity.
ACS Catalysis, (2015) H. Schäfer, S. M. Beladi-Mousavi, L. Walder, et. al.
Oxidized Mild Steel S235: An Efficient Anode for Electrocatalytically Initiated Water Splitting.
CHEMSUSCHEM, (2015), H. Schäfer, K. Küpper, J. Wollschläger, N. Kashaev, J. Hardege, L.
Walder, S.M. Beladi-Mousavi,et. al.
PolyTEMPO and polyviologen on carbon nanotubes: syntheses, structures and organic battery
applications. European Polymer Journal, (2013), L. Cao, S. Sadaf , S. M. Beladi-Mousavi , L. Walder.
PATENT
A patent application on organic battery materials. Submitted, (Oct. 2016), S. M. Beladi-Mousavi,
L.Walder.
76
Declaration
I hereby declare that this thesis is the summary of my Ph.D. work and has not been
submitted to any other university. All the sources and materials used in this thesis are duly
acknowledged and cited.
Osnabrück, November 2016
Seyyed Mohsen Beladi Mousavi