Embed Size (px)
Citation preview

CURRENT TRENDS IN FOOD SECURITY TO MEET
NATIONAL NUTRITIONAL CHALLENGES
16th
- 17th
November, 2012
Pre-Conference Workshop
On
Recommended Dietary Allowances and Diet Planning
15th
November, 2012
Programme & Proceedings Booklet
DEPARTMENT OF HOME SCIENCE
SRI VENKATESWARA UNIVERSITY
TIRUPATI
NUTRITION SOCIETY OF INDIA 44TH NATIONAL CONFERENCE

Organizing Committee
Chair Person : Dr. Anura v. Krupad
Vice Chair Person : Dr.Kantha K.Sharma
Organizing Secretary : K.V.Sucharitha
Co-Ordinators : Dr.D.L.Kusuma
Dr.A.Jyothi
Dr.K.Manjula
Other Faculty members : Ms.R.Bharathi
Ms.M.Sowjanya
Ms.S.Parveen begum
Ms.D.Madhavi

CONTENTS
Sl.
No.
Content Page No.
1. Scope of Work Shop 01
2. Programme 03
3. Key – Note Address:
Recommended Dietary Allowances (RDA) for the macro and
micro nutrient – General Principles
05
RDA of Iron for Indians- A case Study of
deriving RDA’s for micronutrients
13
Production, management and
use of nutrient composition databases
20
Nutrient Composition and Food Grouping Systems 23
Diet Planning Guides and Food Exchange
Lists – Menu Planning
28
Planning Therapeutic Diets for Individuals in
Health Care Institutions
36
4. ANNEXURES 39
Summary of RDA for Macro Nutrients In Indians (2010) 41
Summary of RDA for Micronutrients In Indians (2010) 42
Recommendations for dietary fat intake in Indians 43
Energy requirement of Indian men and women at different ages
and body weight
43
Essential Amino Acid Requirements: Adults 44
Food composition and nutrient content value of Balanced diet for
moderately active man
44
Key micro nutrients in vegetable and animal foods 45
Portion size of Foods (raw) and nutrients 45
Portion size of Foods (raw) and nutrients 46
Balanced diet for Infants, Children and Adolescents 46
Cereal exchange 47
Legume and pulse exchange 47
Flesh food exchange
Milk exchange 48
Fat exchange 48
Vegetable exchange-A 49
Vegetable exchange-B 49
Fruit exchange 50
Energy cost of physical activities 51
Energy expenditure on various physical activities 51
Grades of Body Mass Index 52
5. References 53

SCOPE OF THE WORKSHOP
Two Pre conference workshops are planned in the context of organization of 44th
national conference of the Nutrition Society of India. One workshop on Recommended
Dietary Allowances and Diet Planning for the student delegates and the second workshop on
Food Safety and Standards – Current regulations for the faculty from relevant disciplines.
Diets should be planned based on sound nutrition principles that primarily assure
nourishment to the body while preserving the qualities of being appealing, tasty and
satisfying. In this context one should understand the nutritional needs of the body to be able
to select right foods and plan diets that are physiologically adequate and psychologically
satisfying. In this context, a thorough knowledge and understanding of recommended dietary
allowances become imperative. Recommended Dietary Allowances (RDA) are generally
misunderstood as recommendations for individuals, while they are intended as guidelines to
aid in the evaluation and planning of diets for groups. Workshop - I is conceived in this
backdrop to concretize the knowledge and better understanding leading to appropriate
applications of RDAs. It indeed would be a valuable experience for the student community to
be exposed to the scientists of National Institute of Nutrition, ICMR, the authentic body that
formulates RDA for Indians. The presentations on the scientific basis for setting RDA for
macro and micro nutrients will create a platform for the participant students to appreciate the
value of the latter presentations and the practical experiences provided on food grouping and
menu planning by experienced academicians and dietitians. Further, it is impossible for a
country like India with a wide variety of foods grown regionally to have a comprehensive
data base on nutritive value of all raw foods and their cooked equivalents. Presentation
planned in this direction on data base is sure to promote student initiatives towards
maintaining their own databases that would go a long way in functioning as informed
nutritionists.

2
PRE CONFERENCE WORKSHOPS
ON
RECOMMENDED DIETARY ALLOWANCES AND DIET PLANNING - I
AND
FOOD SAFETY AND STANDARDS - CURRENT REGULATIONS - II
Thursday, 15th
November 2012
PROGRAMME
8.00 to 9.00 am Registration
9.00 to 10.00am Inauguration
Welcome Prof. R. Varalakshmi, Secretary,
NSI Tirupati Chapter
About the Workshops
Workshop- I
Prof. D. L. Kusuma, Convenor,
NSI Tirupati Chapter
Workshop-II Dr. K.V. Sucharitha,
Organizing Secretary,
NSI Tirupati Chapter
Inaugural Address Prof. M.A.K. Sukumar, Rector,
S.V. University, Tirupati
Vote of thanks Dr. K. Manjula,
Dept. of Home Science, SVU
10.00 to 10.30 am High Tea
Keynote Address:
10.30 to 11.15 am Workshop-I: Dr. B. Sivakumar,
Former Director,
NIN, Hyderabad
Venue: Srinivasa Auditorium
10.30 to 11.15 am Workshop-2: Dr. S.S. Ghonkrokta,
Director, FSSAI, New Delhi
Venue: Senate Hall

3
WORKSHOP – I
RECOMMENDED DIETARY ALLOWANCES AND DIET PLANNING
Venue: Srinivasa Auditorium, S.V. University, Tirupati
THEORY SESSION
Time Programme Faculty
10.30 to 11.15 am Key note address: The Historical
Perspective and general principles
involved in deriving RDA’s
Dr. B. Siva Kumar
11.15 to 12 noon RDA of Iron for Indians – A case
Study of deriving RDA’s for
micronutrients
Dr. K. P. Madhavan Nair
12 .00 to 12.30 pm Production, Management and use of
Nutrient Composition Databases
Dr. K. Bhaskarachary
12.30 to 1.00pm Nutrient Composition and Food
Grouping Systems
Prof. D.L. Kusuma
1.00 to 1.30 pm Diet Planning Guides and Food
Exchange Lists – Menu Planning
Prof. A. Jyothi
1.30 to 2.30 pm Lunch
2.30 to 3.00 pm Planning Therapeutic Diets for
Individuals in Health Care
Institutions
Dr. M. V. Mahendri
PARTICIPATORY PRACTICAL EXPERIENCES IN DIET PLANNING (to be conducted in branches)
Time
Programme Faculty
3.00 pm to 3.30 pm Calculation of Energy Expenditures
Dr. K. Manjula 3.30 pm to 4.00pm Calculation of BMI
4.00 pm to 4.30 pm Menu planning using Food
Exchanges
4:30 to 5:00 pm Tea
5.00 to 6.00pm Concluding session, Feedback, Clarifications from faculty,
Distribution of certifications

4
KEY – NOTE ADDRESS
RECOMMENDED DIETARY ALLOWANCES (RDA) FOR THE MACRO AND
MICRO NUTRIENT – GENERAL PRINCIPLES
B. Sivakum ,Former Director, , National Institute of Nutrition, Hyderabad.
K.Madhavan Nair, Scientist-E, National Institute of Nutrition, Hyderabad.
Nutrient Requirements
Every organism requires an adequate supply of both macro and micronutrients in
proper proportions in their diet for optimum growth and development. Nutrient requirement
refers to the least amount of the absorbed nutrient that is necessary for maintaining the
normal physiological functions of the body. Nutrient needs are highly variable and become
population specific due to variations in genetic environment and socio-demographic
characteristics of the population and within a population it varies among different
physiological groups.
Since the requirement of a nutrient in a given individual in a population cannot be
determined precisely, the RDA takes into account the variability that exists in the requirement
between individuals. The distribution of nutrient requirement in a population group is
considered normal and the RDA corresponds to a requirement, which covers almost all
individuals (97.5%) in a given population. This corresponds to Mean + 2 SD (Figure). This is
termed as a safe level of intake of a nutrient, that is, the chances of individuals having
requirements above the RDA is only 2.5%. This principle is used in case of all nutrients
except energy. This is referred to as the recommended dietary allowance (RDA) or safe
allowance of that nutrient. Daily or Dietary Reference Intakes (DRI) or Dietary Reference
Value (DRV) and Daily Values (DV) are other terms used by different agencies to mean the
same dietary requirements. In the case of only energy, the average value covering the needs
of half of the population is considered as the requirement level. This is because energy
intakes either in excess or below the actual requirement of energy are not safe. In respect of
other nutrients, the RDA is 25% (+2SD) higher than the mean requirement, 12.5% being
considered as the extent of individual variability in the requirements of all those nutrients.

5
One of the major limitations in determining the requirements of nutrients and
evaluating adequacy in the population is the paucity of reliable national data on intakes and
the composition of foods consumed by the people and lack of epidemiological and clinical
correlates of nutritional status.
Broadly the nutrients that are needed in large amounts (more than a gram per day) are
considered to be macronutrients (examples are carbohydrates, fats and protein and those
needed in small quantities (micro/ milligram quantities) are called micronutrients (examples
are minerals and vitamins).
RDA for Indians
Most countries have derived their own set of dietary guidelines for requirements,
which are periodically revised. Improved tools and methodology, developments in
understanding the role of nutrients and updated data base of population intake, health status
and food tables necessitate a revision. The guidelines for India were first drawn by the Expert
Committee of Indian Council of Medical Research (ICMR) in 1944 and the latest revision
was made in 2010. (Tables 1 and 2 ).
Variability of Nutrient Requirements
Human nutrient needs vary according to the growth and physiological and
environmental factors of an individual. An adult requires nutrients for maintenance (of
health) while infants and children need them for both maintenance and growth. When
expressed per kg body weight, the nutrient requirement of infants and children are 2-3 times
higher than the adult requirements. Nutrient requirements during childhood are proportional
to the body weight and the growth rate. Among adults, nutrient requirements are related to
the body weight and size. The body weights of adult women are generally lower than those of
men and their daily requirements of nutrients are therefore proportionately lower. During the
reproductive age, due to blood loss during menstrual period, requirement of certain nutrients
like iron are higher for adult women than those for adult men. Women require additional

6
quantities of nutrients during pregnancy to sustain foetal growth and during lactation for milk
secretion.
Bioavailability: While estimating the levels of dietary intakes of nutrients, their loss
in the food through processing and cooking and digestion and absorption under different
situations is taken into consideration. The physiological requirements of nutrients are
expressed in terms of the absorbed nutrients. The absorption or the bioavailability of nutrients
from diet can vary widely depending upon the nutrient, its chemical form and the quality of
the diet. The factor of bioavailability assumes significance in the case of certain nutrients like
protein, iron, calcium, zinc, β-carotene (provitamin A), folic acid and vitamin B12.
Approaches for assessing human nutrient requirements
A number of methods have been employed for determining the human nutrient
requirements. The minimum amounts of nutrients for maintaining nutrient balance or for
prevention of clinical or biochemical deficiencies are determined as a measure of
requirements. The intake of nutrients through breast milk for satisfactory growth has been
used to determine the nutrient requirements during early infancy. Caution is exercised in
fixing nutrient requirements since a relative excess of nutrients like energy and some
nutrients could have undesirable effects.
Reference Man and Woman: Expression of RDA for normal adult man and woman
facilitates simple translation of dietary adequacy in common people. For this purpose,
representative reference standards based on healthy anthropometry and body composition
have been used by the earlier ICMR committee. WHO has published growth standards for
under 5-years normal children drawn from several developing countries including India, who
are wholly breast-fed. These WHO growth standards for under -3 year age were used for the
current recommendations. For those above 5 years including adults, standards were worked
out from the data of National Nutrition Monitoring Bureau (NNMB) covering most of the
States in the country. Conceptually the Indian Reference man is aged between 18-29 years
weighs 60 kg and a height of 173 cm (BMI 20.3) and woman of same age category with a
weight of 55 kg and height of 161 cm (BMI 21.2). By definition they are fee from disease and
physically fit for active work. On each day he or she is engaged in 8 hours of occupation
which normally involves moderate activity; while not at work spends 8 hours in bed, 4-6
hours in sitting and moving about, 2 hours in walking and in active recreation or house hold
duties. The reference body weights of Indians considered for computing RDA is given
below:

7
Reference Body Weights of Indians Employed for Computing RDA, 2010
Group Age Reference Body Weight
(kg)
Adult man 18-29 y 60.0
Adult woman (NPNL) 18-29 y 55.0
Infants 0 - 6 m 5.4
6 – 12 m 8.4
Children
1 – 3 y 12.9
4 – 6 y 18.0
7 – 9 y 25.1
Boys
10 - 12 y 34.3
13 – 15 y 47.6
16 – 17 y 55.4
Girls
10 – 12 y 35.0
13 – 15 y 46.6
16 – 17 y 52.1
An account of the revision of requirements of some important macro and micro nutrients is
provided below and the RDAs are given in Tables 1 and 2.
MACRO NUTRIENTS
Energy requirements
Reliable estimates of energy expenditure based on stable isotope methodology were
available in Indians recently. The data indicate moderate lowering in physical activity levels
(PAL) of various occupational groups due to life style changes and this necessitated a down
ward revision of energy requirement to fix requirements at PAL of 1.53 vs 1.60, 1.8 Vs 1.9
and 2.3 Vs 2.5, respectively, for sedentary, moderate and heavy categories. This has resulted
in a reduction of 4-8 % of energy accounting for a reduction of 100kcal for sedentary, 145 for
moderate and 310 kcal for heavy work per day.

8
Protein Requirements
Protein intake to maintain nitrogen (N) equilibrium (protein is built up by amino acids
which form the major source of nitrogen in the body) in adults and a positive N balance in
children to account for growth are used as criteria for estimating protein requirements. Some
allowance is made for sweat and other incidental losses. The ICMR committee too made its
protein recommendations earlier based on N balance studies in Indians. Currently, most
agencies base estimates of protein requirement based on indispensable (essential) amino acid
requirement or reliable nitrogen balance carried over for long periods of time. The amino acid
scores of diets based on the most limiting amino acid form the primary data. Protein
requirements on habitual diets, therefore, would depend upon the quality of the dietary
protein, i.e., its essential amino acid content and its digestibility. Lower the quality, higher is
the requirement.
Recommended protein intakes for Indians based on the cereal-legume-based habitual
diets which have an NPU (Net protein Utilisation) of 65 the calculated PDCAAS (Protein
digestibility corrected amino acid score) is close to 0.8 and the safe intake of 0.98 g/kg.
Therefore the daily safe protein allowance for an adult of 1.0 g/kg/day was retained. In
pregnancy extra protein requirement of 0.5, 6.9 and 22.7 g/day during the first, second and
third trimesters respectively, for a gestational weight gain of 10 kg is recommended.
FAT
Fat requirement has to be viewed from the point of view of energy density,
composition and total energy content of the diet. Since excess dietary fat is harmful to health,
recommendations for fat intake include two values - optimum intake and safe intake.
The dietary essential fatty acids {linoleic (n-6 PUFA) and linolenic acids (n3 PUFA)} content
and proportions determine the quality of fat and its role in chronic disease. Dietary fat comes
from two sources: the invisible fats which are present as one of the fixed components in all
common foods and the other visible or the added fat or oil. In the earlier ICMR
recommendations, meeting the requirements of n6 PUFA was considered as the most
important health outcome. Now for prevention of chronic disease (obesity and hypertension
etc) optimum intake and proper proportion of both n6 and n3 PUFA is necessary. Since the
quality of invisible fat cannot be much changed, the intake of visible fat acquires added
significance. Based on the fatty acid composition of invisible fat in the community, the
recommended fat intake should be optimal to achieve the desirable ratios of all fatty acids in
the diet. As no single edible oil is able to meet the nutritional needs for Indians, a
combination of two or more oils is preferable to obtain a balanced fat from the diet. The RDA

9
of visible fat in Indian adults (men and women) of sedentary, moderate and heavy physical
activity ranges between 20-40 g/person/day.
MICRONUTRIENTS
Minerals: The macrominerals which are important in human nutrition are calcium,
phosphorus, magnesium and electrolytes, chloride, sodium and potassium. Besides the macro
minerals, body needs many trace elements, which are essential for several enzyme reactions
and other tissue functions.
Calcium and Phosphorus: The earlier ICMR recommendations were based on a few
chemical balance and label kinetic studies. Substantial additional data on these two aspects
are available in different age and physiological groups now. These data are also supported by
measurements of bone mineral content and bone density values for school-age and adolescent
children. The current recommendations are made considering this updated information. The
amount of dietary Ca allowance increased to 600 mg/d from 400 mg/d and so also that in
other groups. During pregnancy and lactation the requirement is further enhanced to 1200
mg. It has been well established that the dietary Ca: P is optimal at 1:1 except during infancy
where the ratio should be 1:1.5.
Trace Elements - Microminerals
At present 15 trace elements find place in the recommendations of the different agencies like
WHO and are believed to be essential for humans. While deficiencies of iron and iodine are
known for a long time, deficiencies of Cu, Zn, Cr and Se have been described in recent years
from some isolated geographical regions of the world, including India. Precise data on
requirement of these elements except iron Zn, Cu, Se and iodine in humans are lacking. Data
on population intakes and biochemical adequacy have been available in Indians for some of
them. Estimates of the requirement of Zn are given in Table 1
Iron : Daily loss of body iron in well-nourished adult men has been estimated to be 12-15
μg/kg with an average of 14 μg/ kg. Now, only the crucial correction for intestinal absorption
was required to compute iron requirements from the diet. Dietary iron absorption varies from
3-10% depending upon the quality of the diet. From diets containing generous quantities of
meat/fish and ascorbic acid, iron absorption is much higher (10%) than from cereal-based
diets (2-5%). Recent studies in Indians show uniformly more absorption (>7%) in Indian
subjects than what was earlier shown (2-5%). This has become the basis of suggesting only
two levels of dietary absorption in Indians, 5 and 8% instead of 3 levels (3, 5 and 8%)

10
considered by the earlier Committee. On account of this the RDA for iron has been reduced
significantly among all physiological groups.
Vitamins
Requirements of vitamins such as: vitamins A, D, ascorbic acid, some B-complex
vitamins, have been determined since their deficiencies are known to occur in populations.
On the other hand, deficiencies of vitamins like biotin, inositol, vitamin E and vitamin K are
not often encountered (since most diets seem to have enough of these vitamins to satisfy their
requirements) and hence, their requirements and dietary intakes have not been precisely
determined.
Vitamin A: In Indian children, dose- response relationships and pharmacokinetic evaluation
showed that 1 μg of oral β-carotene is converted into 0.25 μg of retinol. Unlike retinol,
carotenes are not absorbed completely. Balance studies in adults with carotene-rich foods
present in habitual Indian diets have shown that on an average 50% of dietary carotenes are
absorbed. On the basis of these data, the effective retinol equivalent of β-carotene for Indians
is estimated to be 1:8 as against a ratio of 1:4 used earlier.
B-complex Vitamins
The vitamins which are included under this group are thiamine (B1), riboflavin (B2),
niacin, pyridoxine (B6), folate and vitamin B12, since deficiencies of all of them are
encountered in human populations. The requirements of the first four vitamins have not been
changed. There is growing evidence that biochemical folate inadequacy is widespread in
different segments of Indian population. While intakes appear to be low, this alone may not
explain the magnitude of biochemical inadequacy. The information generated on
bioavailability of folic acid has been highly variable owing to the fact that folic acid in plant
foods are mainly in the form conjugates of folic acid depending on the method used and the
form in which folate is present in the food. There is an urgent need to generate more data on
true folate content of Indian foods. The bioavailability of folate from Indian foods is,
however, consistently estimated to be about 50%.
Some practical applications of RDA
The RDA of nutrients have applications in a) formulating balanced diets and provide
guidelines for healthy living b) assess the adequacy of intake limited to individuals or groups
(and can not be extrapolated to total population) and help to determine national Food and
health policy and d) guide users in fixing food rations and food regulations.

11
Suggested Reading
1. Nutrient Requirements and Recommended Dietary Allowances for Indians. A Report of
the Indian Council of Medical Research, ICMR, 2010.
2. Rao BSN and Sivakumar B. Nutrient Requirements and Recommended Dietary
Allowances. In MS Bamji et al edited (3 ed), Text Book of Human Nutrition, Chapter
11, Oxford and IBH, Publishing Co Pvt Ltd, New Delhi, 2009.
3. Dietary Guidelines for Indians- A Manual, 2nd
Edition, National Institute of Nutrition,
ICMR, Hyderabad, 2011.
4. Report of a Joint FAO/WHO Expert Consultation: Human Energy requirements, FAO,
Tech Report Ser No1, Rome, 2004.
5. Report of a Joint FAO/WHO Expert Consultation: Protein and Amino acid
requirements in Human Nutrition, FAO, Tech Report Ser No935, Rome, 2007.
6. Report of a Joint FAO/WHO Expert Consultation on Fats and Fatty acid requirements
in Human Nutrition, Interim Summary of Conclusions and Dietary Recommendations
on Total Fat and Fatty acids, FAO, Rome, 2008.
7. Report of a Joint FAO/WHO Expert Consultation: Human vitamin and Mineral
Requirement, FAO, Rome, 2001.
* * *

12
RDA OF IRON FOR INDIANS
Dr. K. Madhavan Nair, Ph.D, FAMS, Scientist-E, NIN, Hyderabad.
Provides a guideline for nutrient intake, adequacy, preventing deficiency of excess of
a population
BASIS OF RDA OF IRON
Age and gender
Physiological status
Reference body weight
Requirement base on factorial approach
Bioavailability
• The amount of nutrient
considered adequate to
meet the needs of
practically all healthy
people.
• The RDA are based on
scientific knowledge.
• Prepared by the National
Nutrition Advisory
Committee (ICMR).
• The committee revise the
RDA every 10 years.
• Current RDA of Indians was
set up in 2010.
13
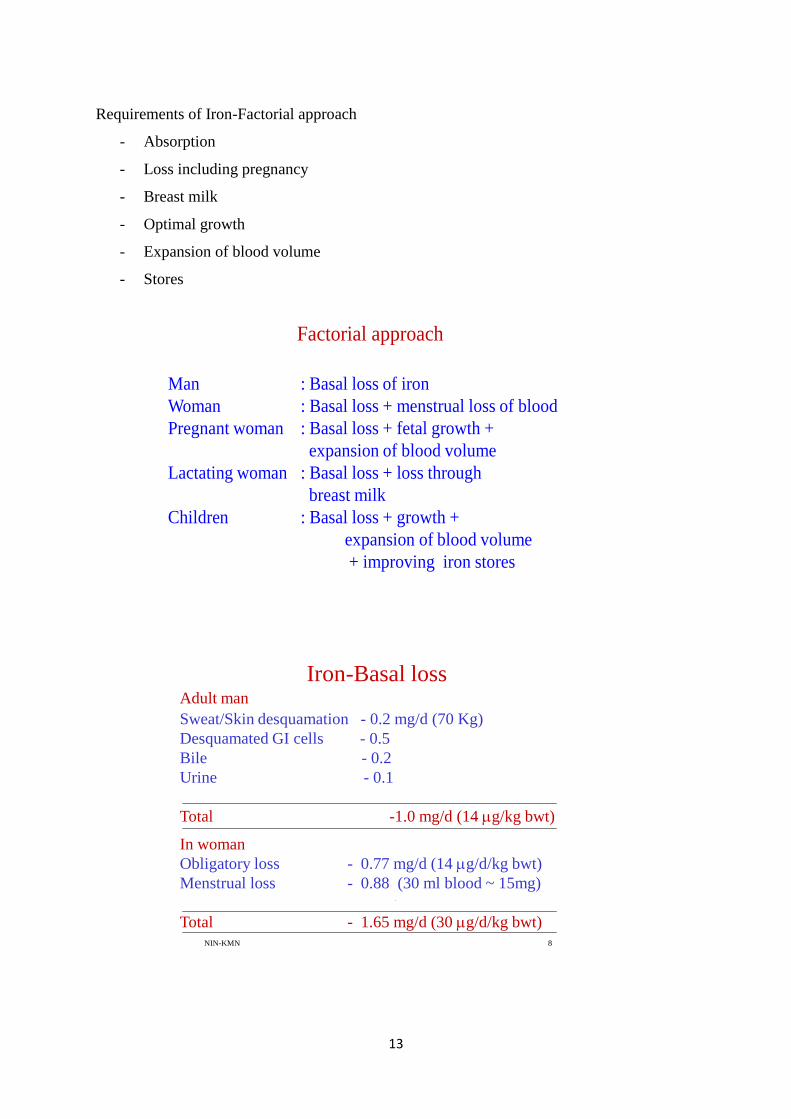
Requirements of Iron-Factorial approach
- Absorption
- Loss including pregnancy
- Breast milk
- Optimal growth
- Expansion of blood volume
- Stores
NIN-KMN 7
Man : Basal loss of iron
Woman : Basal loss + menstrual loss of blood
Pregnant woman : Basal loss + fetal growth +
expansion of blood volume
Lactating woman : Basal loss + loss through
breast milk
Children : Basal loss + growth +
expansion of blood volume
+ improving iron stores
Factorial approach
NIN-KMN 8
Adult man
Sweat/Skin desquamation - 0.2 mg/d (70 Kg)
Desquamated GI cells - 0.5
Bile - 0.2
Urine - 0.1
Total -1.0 mg/d (14 g/kg bwt)
In woman
Obligatory loss - 0.77 mg/d (14 g/d/kg bwt)
Menstrual loss - 0.88 (30 ml blood ~ 15mg)
Total - 1.65 mg/d (30 g/d/kg bwt)
Iron-Basal loss

14
NIN-KMN 9
Lactation
Lactation - 1 mg/d (16 g/Kg)
Basal loss - 14 g/Kg
Total - 30 g/Kg
INFANCY
Fetus accumulates iron
Infants - little change in storage iron and Hb
- 0.3 mg/d (provided by breast milk which
is 30% bioavailabile)
Infants
• Breast milk intake= 600 ml
• Iron content =0.78mg/L
• Intake =0.47mg/d
• Bioavailability=50%
• Requirement = 0.23mg/d
6-12 m: Iron requirements increase rapidly and iron rich
solid foods should complement breast milk.
NIN-KMN 11
Physiological demands
1. ~ 6 months to 4 yr
low iron content of milk, rapid growth rate and body reserves of iron
(insufficient beyond 6 months)
2. Early adolescence
rapid growth, the needs of an expanding red cell mass and to deposit
iron in myoglobin
3. Pregnancy
expanding blood volume of the mother , the demands of the fetus and
placenta , and blood losses during child birth

15
NIN-KMN 12
Growth
a. Blood volume expansion
• @ 66ml / kg weight gain for all age groups except for
boys(13-15 years) where it is 75 ml/kg weight gain
• WHO cut-off for Hb according to age and gender.
• Iron content of 3.47mg/ g of Hb.
b. Muscle mass:
• 50% of weight gain and
• Iron content of 0.026mg/g of muscle
Factors 6-12m 1-3y
Body weight (kg) 8.4 12.9
Basal loss (mg/d) 0.12 0.181
For growth (mg/d) 0.61 0.270
Total req (mg/d) 0.73 0.451
Factors considered for deriving RDA for iron
NIN-KMN 14
Stores
Adult man
@ 12mg/ kg body weight (12x 60= 720mg )
spread over period of 5 years (720/5 =144)
All other age groups upto18y
@ 5mg/kg body weight
13-18y boys
(144/365 = 0.4mg/d)

16
NIN-KMN
Adolescence13- 18 y
Gain in body weight - 20 -25 Kg in male and 12 Kg in
female
Male Female
Blood volume expansion 0.262 0.12 mg/d
Muscle mass increase 0.100 0. 06
Store 0. 25 0.15
Basal 0.74 0.68
Menstrual - 0.35
Total 1.35 1.4
NIN-KMN
16
Compartments 1988
(mg/d)
2010
(mg/d)
Foetus 240 190
Maternal red cell mass 400 300
Placenta and cord - 90
Obligatory loss 14µg/kg/d 14µg/kg/d
Total (ICMR) 810 810 ( 840 for
FAO/WHO 2002)
I trimester 0.7 1.5
II trimester 3.0 3.83
III trimester 5.0 3.66
IRON REQUIREMENT DURING PREGNANCY
Blood lost during parturition considered to be taken care of by the contraction of maternal
RBC mass and therefore not accounted for.
NIN-KMN 17
Derivation of iron requirement (2010)
Age Gender Body
wt
Basal
loss
Blood
volume
Muscle
mass
Store Blood
loss
Requir
ement
10-12 B
G
34.3
35.0
0.49
0.27
0.13
0.16
-
0.28
1.05
1.33
13-15 B
G
47.6
46.6
0.66
0.65
0.39
0.13
0.15
0.06
0.40
0.15
-
0.37
1.60
1.36
16-17 B
G
55.4
52.1
0.78
0.73
0.14
----
0.05
----
0.40
0.15
-----
0.42
1.37
1.30
Adult Man 60 0.86 - - - - 0.86
Woman 55 0.88 - - - 0.77 1.65
Pregnant 55 0. 88 1.92 mg 2.8
Lactating 55 Similar to adult woman 1.65

17
NIN-KMN 18
Iron Absorption From Whole Day's Diet
Diet Iron ( mg) % absorption
Rice based + 30 3.6±0.14
milk
Mixed cereal + 42 3.4±2.82
milk
Rice based + 33.5 2.6±0.29
wheat + meat
Rice-wheat + 28.8 2.7±0.13
fish
Ref: B.S. Narasinga Rao et al: IJMR 77, 648 (1983)
NIN-KMN 19
Iron Absorption From Typical Indian Diets
Meal type Subjects Iron content % absorption
mg
Rice normal men 14.6 5.5
normal women 17.6 12.3
anaemic men 10.0 12.6
Wheat normal men 6.1 2.1
Ragi " 8.3 1.6
Sorghum " 7.6 1.7
Whole day's diet " 29-42 2.7-3.6
• Recent studies: The mean fractional absorption in iron-deficient
subjects was 17.5% and in normal women 7.3%
• These values are greater than absorption values (5%) used earlier
for calculating iron RDA of iron for adult women.
• Considering the fact that iron absorption is inversely related to
body iron stores and that Indians have reduced iron stores
compared to their peers in developed countries, a realistic estimate
of iron absorption would be 5% for adult male and 8% for adult
female.
• These figures are in agreement with the recommendations of
WHO/FAO, lists three bio-availability levels of 5, 10, and 15%.

18
Additional guideline to meet RDA of
iron -Ascorbic acid
Enough vitamin C should be incorporated in a
vegetarian diet at a molar ratio of 1:2 (iron:
ascorbic acid) or 20-40 mg of ascorbic acid per
meal to ensure iron absorption of 5 and 8%.
Group Age 1988 2010
Requirement
µg/kg/
Absorption
%
Requirement
µg/kg/
Absorption
%
Adult Man
Woman
14
30
3
5
14
30
5
8
Pregnant woman 60 8 55 8
Lactating woman 30 5 23 8
Children 0-6 m
6-12m
1-3 y
4-6 y
7-9 y
29. 3
3
3
46g/kg
87g/kg
30
35
31
15
5
5
5
Adolescents
Boy
Girl
Boy
Girl
Boy
Girl
10-12 y
10-12 y
13-15 y
13-15 y
16-18 y
16-18 y
29
30
26
30
26
30
3
5
3
5
3
5
31
38
34
29
25
25
5
5
5
5
5
5
RDA 2010 and 1988 of iron for Indians
Group ICMR 1988
mg
ICMR 2010
mg
IOM
Age group y
IOM
mg
Adult Man
Woman
18-29 y 28
30
17
21
19-30/31-50/51-70/ >70
19-30
31-50
51-70
>70
08
18
18
08
08
Pregnant 37.5 38 Pregnancy
14-18/19-50y 27
Lactating 30 16 Lactation
14-18y
19-50y
10
09
Children 1-3 y
4-6 y
7-9 y
11.5
18.4
26.0
07
13
15
1-3
4-8
7
10
Adolescents
Males
Females
Males
Females
Males
Feamales
10-12 y
10-12 y
13-15 y
13-15 y
16-18 y
16-18 y
34.2
18.9
41.4
28.0
49.5
29.9
21
27
32
27
27
26
9-13
9-`13
14-18
14-18
8
8
11
15
Comparison between ICMR and IOM* RDA
*www.nap.edu

19
PRODUCTION, MANAGEMENT AND USE OF NUTRIENT
COMPOSITION DATABASES
Dr.K.Bhaskarachary, Scientist C, Food Chemistry Division, N I N, Hyderabad
Food is a basic necessity of human race and it is the most precious commodity on
earth. Life cannot be sustained without food; therefore not only food security but also
nutrition security is a priority. Nutrient requirement can be defined as the minimum amount
of the absorbed nutrient that is necessary for maintaining the normal physiological functions
of the body. It depends on a variety of factors like sex, age, physiological status etc. and
varies between individuals. Recommended Dietary Allowance (RDA) or Safe Allowance on
the other hand is the average daily dietary nutrient intake level sufficient to meet the nutrient
requirement of nearly all (97 to 98%) of healthy individuals in a particular life stage and
gender group (Indian Council of Medical Research, 2010). RDA takes into account inter
individual variability and applies to populations. It also takes into account bioavailability of
the given nutrient from the diet.Food has to be analyzed to get ingredient and nutrient
information. Knowledge of nutrient composition of foods is important for planning diets.
Nutritive value of foods depends upon many factors which include species, variety,
geographical location, season, diurnal variation and most importantly analytical method used.
New food analysis techniques are being developed and existing methods optimized. Plant
foods particularly vegetables are a complex non- homogeneous mixture of wide range of
Phytochemicals. Sampling is a major factor which influences the ultimate analysis and
nutrient values. Wide variations in reported values of nutrients in vegetables may at least
partly be due to errors in sampling design and inadequate quality control. Composite
sampling is absolutely necessary to get correct values of nutrients in foods. Validity of the
analytical method used also has to be ensured. Both internal and external quality control
using standard reference materials is necessary to ensure precision and accuracy of the
method used. It is important to learn various terms used in food composition database
includes new food components and also a nutritionist must learn where to find such
information. It is very important to learn how to use existing food composition database.
Most of the times nutritionists are in confusion how to evaluate nutrients intake in the
absence of food composition database for particular components. International network of
Food data systems compiled the information on Food composition data for composition
databases.

20
Following are some of the useful Food composition data bases which can be referred to.
1. Nutritive value of Indian Foods
C Gopalan, BV Rama Sastri, SC Balasubramanian National Institute of Nutrition, Indian
Council of Medical Research, Hyderabad 1971, Reprinted 2011, 161p (English)
2. The Nutritive Value of Burmese Foods
The Nutrition project Directorate of Health Services, 36, Theinbyu, St, Rangon 1967, 41
p (English)
3. China Table of Food Composition
Department of Nutrition The Chinese Academy of Medical Sciences, Beijing 1982, 264
p (Chinese)
4. Standard Tables of Food composition in Japan
Subdivision on Resources, The Council for Science and Technology, Ministry of
Education, Culture, Sports, Science, and Technology, Japan Fifth Revised and Enlarged
205, 508p (Japanese with English)
5. ASEAN Food Composition Tables 2000
P Puwastein, B Burlingame, M Raroengwichit, P Sungpuag Institute of Nutrition,
Mahidol University, Thailand. 2000, 157 p (English)
6. Analysis of Some Food Stuffs of Bangladesh
K Ahmad, MA Malek Pak J Biol Agr Sc, Vol 9, No 1, 196 196 (English)
7. Korea Food Composition Table
National Rural Living Science Institute Rural Development Administration, Suwon 2nd
ed 1981, 149 p (Korean with English)
8. Nutrient Contents in Nepalese Foods
HMG, Ministry of Agriculture, Agriculture Development Department, N Nutrition
Programme Section. Babarmahal, Kathmandu. 194 (Hindi and English)
9. Nutritive value of Foodstuffs and planning of Satisfactory Diets in Pakistan
Composition of Raw Foodstuffs MID Chughtai, AW Khan Institute of Chemistry,
punjab University, Lahore 1960 (English)
10. Thai Food Composition Tables
Institute of Nutrition, Mahidol Univerity 1999, 150 p (English and Thai)
11. Tables of Composition of Australian Foods
S Thomas, M Corden, Nutrition Section, Commonwealth Department of Health
Australian Government Publishing Service, Canberra 1970 (English)
12. Canadian Nutrient File
Department of National Health and Welfare, Otawa 1985 (English or French)

21
13. The COST Action 99 project maintains an Inventory on Food Composition
Databases and Tables for European member countries.
European Food composition Tables in Translation. L Arab, M Witler, G Schetler.
Veröffentlichungen aus der Geomedizinischen Forschungsstelle der Heidelberger
Akademie der Wissenschaftern. Prof. Dr. Dres. H.c. Gothard Schettler, Präsident der
Heidelberger Akademie der Wissenschaften, Karlstraβe 24, 690 Heidelberg. 1987, 15 p.
(English)
14. United Kingdom Cereals and Cereal products, The third supplement to McCance
& Widowson’s The composition of Foods (4th
Edition).
B Holland, ID Unwin, DH Buss. Royal Society of Chemistry, and Ministry of
Agriculture, Fisheries and Food. The Royal Society of Chemistry, Distribution Centre,
Letchworth, Herts SG6 1HN, UK. 1988 (English)
15. Brazil Tabelas de composião dos Alimentos
F Sizaret, C Jardin, Estudo Nacional da Despesa Familiar (ENDEF) Fundacão Instituto
Brasileiro de Geografia e Estatidstica, Av Augusto Severo, 8, Rio de Janeiro 197, 201 p
(Portuguese)
16. United States
USDA Nutrient Database for Standard Reference, Release 19 Web version. U.S.
Department of Agriculture (USDA), Agriculture Research Service. Nutrient Data
Laboratory Home Page. 206 (English)
* * *

22
NUTRITIVE VALUE OF FOODS AND FOOD GROUPING SYSTEMS
Prof. D.L.Kusuma, Department of Home science, S.V. University, Tirupati
Dr.K.Manjula, Department of Home science, S.V. University, Tirupati
Food is the nutritive material taken into the body for the maintenance of life and
growth and repair of tissues. Nutrient is a substance obtained from food and used in the body to
promote growth, maintenance and/or repair. Food that we eat is composed of dozens or even
hundreds of different kind of materials. A complete chemical analysis of a food shows that it is
composed mostly of organic compounds: carbohydrates, protein, fat and vitamins the remaining
residue will be minerals and depending on nature high or low amounts of water. These are
referred to as nutrients and other substances among which are the non-nutrient substances some
of which are fibers and phyto chemicals etc.
All foods contain a mixture of all nutrients only few are exceptions to this rule- the
common ones being sugar- a pure carbohydrate and oil which is almost pure fat. To focus on
nutritive value, foods are classified into different categories based on their basic characteristics
(grains, dhals) composition (carbohydrate, protein, fat water), their utilitarian value in the
common dietaries as-
I. Cereals and millets
II. Pulses
III. Nuts and oil seeds
IV. Sugar and jaggery
V. Fats and oils
VI. Fruits
VII. Vegetables-Greens, roots & tubers, other vegetables
VIII. Animal foods- Milk& Milk products/Eggs/Flesh foods/Meat/Poultry
IX. Condiments& spices
X. Salt and Miscellaneous items
The food group system has come into existence to translate the Recommended
Dietary Nutrient Allowances into Balanced Diets. It facilitates the conversion of nutrient data
into food related information that can be used by consumer and health professionals in diet
planning to achieve nutritional adequacy. The food group system has been refined aiming at
simplicity to promote its’ utilitarian value.
There was a seven food group system
1. Cereals and Millets
2. Pulses
3. Nuts and Oilseeds
4. Milk and Milk products
5. Meat, Fish and Eggs
6. Fruits and Vegetables
7. Sugar, Jaggery and Oils

23
A five food group system
1. Cereal grains and products
2. Pulses or legumes
3. Milk, egg and flesh foods
4. Fruits and vegetables
5. Fats and sugar
Then, the Basic four Food group system which is used extensively.
1. Cereals ,Millets, Pulses
2. Milk and Milk Products, Egg, Meat and Fish
3. Fruits and Vegetables
4. Oils & Fats and Nuts & Oilseeds
The projection or selection of food group system may vary depending on the context
of use. They are-
Focusing on the nutritive value of foods
Food group Main nutrients
1. Cereal grains and products:
Rice, Wheat, Ragi, Bajra, Maize, Jowar, Barley,
Rice flakes, wheat flour.
2. Pulses and Legumes:
Bengalgram, Blackgram, Greengram, Redgram,
Lentil (whole as well as dhals), Cowpea, Peas,
Rajmah, Soyabean, Beans.
3. Milk and Meat Products:
Milk, Curd, Skimmed Milk, Cheese.
Meat.: Chicken, Liver, Fish, Egg, Meat.
4. Fruits and Vegetables:
Fruits: Mango, Guava, Tomato, Papaya,
Orange, Sweet lime, Water melon.
Vegetables: (green leafy): Amaranth, Spinach,
Gogu, Drumstick leaves, Coriander leaves,
Fenugreek leaves.
Other Vegetables: Carrots, Brinjal, Ladies
finger, Beans Capsicum, Onion, Drumstick,
Cauliflower.
5. Fats and Sugar:
Fats: Butter, Ghee, Hydrogerated fat, Cooking
oils like groundnut, Mustard, Coconut.
Sugars: Sugar: Jaggery and sugar
Energy, Protein, Invisible fat, Vitamin-B1,
Vitamin-B2,Folic acid, Iron, Fibre.
Energy, Protein, Invisible fat, Vitamin-B1,
Vitamin-B2, Folic acid, Calcium, Iron, Fibre.
Protein, Fat, Vitamin-B2, Calcium
Protein, Fat, Vitamin-B2
.
Carotenoids, Vitamin-C, Fibre,
Invisible fat, Carotenoids , Vitamin-
B2, Folic acid, Calcium, Iron, Fibre
Carotenoids, Folic acid, Calcium, Fibre.
Energy, Fat, Essential fatty acids.
Energy
Source: Modified. Gopalan, C., B.V. Ramasastri and S.C. Balasubramanian (1991), Nutritive
Value of Indian Foods, National Institute of Nutrition, ICMR, Hyderabad, India.

24
Planning of Balanced diets
Focusing on the use of food exchanges in the preparation of Balanced diet
Promotion of healthy food consumption behaviors

25
Dissemination of nutrition information/Nutrition education
In the context of dissemination of nutrition information however, the objective is to make
the food grouping system more simple. This helps people to evaluate and plan diets which
are nutritionally adequate. The foods are grouped as
Energy Giving Foods
Body Building Foods
Protective Foods
Sometimes the concepts of nutrition can be effectively introduced even to the young
children. In this direction functional food groups are also introduced as Go, Grow and
Glow foods respectively, while educating children.
NUTRITIVE VALUE OF FOODS:
The nutritive value of food is dependent on several factors such as origin of food,
nature of food, and the way it is processed and utilized and the methods of analysis of foods.
Inclusion of each food group probably will take care of all the remaining essential nutrients
as well, because they occur in the same groups of foods. But, this always may not be a safe
assumption; the probable changes in the nutrient composition of foods due to various
factors need a focus.
It is general knowledge that almost all foods are subject to cooking exception being
fruits, vegetables and greens which are eaten raw as salads, pachadi or chutneys. The nutrient
composition tables provide information for raw foods. In the context of different practices
prevailing among the communities in different parts of the country, it is difficult to
standardize the nutrient composition of cooked food. Efforts are made by some researches at
regional levels to standardize foods and this work is essential and must continue in order to
be able to be near accurate in assessment of dietary intakes or planning diets.

26
The general methods employed for cooking are the wet methods of boiling, steaming
and pressure cooking and the dry methods of cooking at high temperatures – like frying,
roasting and boiling. The loss of nutrients depends on temperature, duration of cooking and
nature of nutrient.
Cooking is beneficial-
Improves appearance and palatability of food and introduces varied appetising
flavors
Destroys harmful food borne micro organisms.
Improves digestibility of several foods and specific nutrients in foods(carbohydrates
and proteins)
Destroys anti nutritional factors (avidin in egg, trypsin inhibitor in pulses).
Improves protein quality
But, improper cooking may destroy vitamins of B group and C, while the losses are generally
minimal for other nutrients. Hence adopting right cooking methods will go a long way in
preserving the nutritive value of foods.
Further, the perishable foods by the time they reach the plate are exposed to different
environments. They may lose their freshness which influences their nutrient composition.
The Flow of Foods from Producer to the Consumer
So while using the nutrient composition tables for calculation of nutrient intake such factors
also must be given due consideration so, that we are closer to the truth in assessing and
planning diets.
* * *
Harvest
Wholesale market
Storage
Retail market
Consumer
Stored
Storage
Cooking
Consumption
Flow of foods
Flow of Foods

27
DIET PLANNIG GUIDES AND EXCHANGE LISTS
Prof. A. Jyothi, Deptof Home Science,
Sri Padmavati Mahila Visvavidyalayam, Tirupati
Eating we’ve all done it, and sometimes we don't even realize when it's happening.
May be we eat when we’re bored, or reach our hand into the candy jar each time we pass by.
Perhaps when we're feeling sluggish in the afternoon……… All of these are opportunities to
eat for reasons other than hunger. No matter why food calls our name, one thing rings true:
We have all eaten something when we aren’t truly hungry. While that's OK from time to
time, too much eating without thinking can really hurt our weight management goals. And
depending on what we eat, hurt our health, too.
Take a look at these 10 situations that encourage us to eat when we're not hungry,
Emotions: Emotions are a common eating trigger. Happy? We might eat a treat to celebrate.
Sad? We might eat to soothe our self with comfort food. Angry? We might take it out with a
fork instead of the person who really caused it. Emotional eating is a known problem for
everybody.
Out of Boredom: Sometimes we're not emotional, we're just bored. For many people, eating
seems like a good solution when there's nothing better to do. Boredom triggers for our
emotional eating.
Because Other People Are Eating: When we're out enjoying a dinner with family or
friends, it can be easy to eat when we're past the point of fullness, especially if we're
enamored in conversation and not paying attention to our satiation level. Perhaps more
common, it's easy to indulge when others around we are eating, too. It makes we feel like we
fit in, and that it's OK since everyone else is doing it.
Because Food is there : Do we feel powerless to pass up food at a party, even if we've
already eaten? When food is in plain sight, it can be so easy to grab a handful simply because
it's there. It looks good. We like it. It's right in front of us. What's the harm? Any food that is
nearby, visible and easily accessible is hard for anyone to turn down.
Because It's a Special Occasion : If we work in a big office or have a big family, it can
seem like every day is someone's birthday, anniversary, or party. And if those celebrations
often involve cake or sweet it might seem that every party is a calorie-laden minefield. If we
don't want to have a piece of cake every day, don't automatically get in the cake line when it's
ouy bosses' birthday Because We're Tired

28
Because the Clock Says So : Do we pull out our lunchbox when the clock strikes noon, just
because it's time for lunch? Or head to the kitchen at 6 p.m. just because that's our typical
dinnertime? Don't just eat when the clock tells us to! When mealtime hits, use it as a cue to
check in with our current hunger level. Are we actually hungry? If so, whip up that healthy
meal. If not, wait until our body tells us to eat, and ignore the clock.
Because It's Free (Or Cheap): Everyone loves to get a good deal. But don't eat up just
because something is free (think free samples at the grocery store) or super cheap (buy-one-
get-one-free sodas or all-we-can-eat buffets). Always check in with our body's hunger level
before we automatically fill our plate with a freebie.
Because We Can't Say No to Food Pushers : If we're a people pleaser, it can be hard to say
no, especially when friends or family offer we scrumptious food. And sometimes people who
push food don't take no for an answer. Have excuses lined up in our bag of tricks—and be
honest. "I'm not hungry" works well, as does "I'm trying to lose weight." If we end up with a
piece of cake (or a whole cake to take home!) despite our protests, remember that we're in
control (it's rare that people will try to force feed we). We can always set the fork down or
share the cake with neighbors or co-workers, or simply eat just a small portion.
Because We Suffer from Clean Plate Syndrome : Most of us have grew up hearing, "There
are starving kids who would love to eat that" to get us to clean our plates as kids. And for
many of us, the well-meaning notion to prevent kids from wasting food and encourage them
to eat their broccoli has stayed with us into adulthood. Do we still feel obligated to clean our
plate, even when we're not hungry enough to comfortably finish it all—especially at a
restaurant where we're paying a premium for a meal? Fortunately, most of us live with
modern amenities like refrigerators and microwaves that make stowing away almost any meal
for another time easy. (See, no waste necessary!) To prevent overeating, take stock
throughout our meal to gauge how hungry we are; we might find that we don't need those last
few bites after all. If that doesn't work, use smaller plates at home to eat less! And lastly, get
over our fear of leftovers. I've met countless people who say they simply don't eat them. Why
not? Many foods taste better the next day or two, and most things can be refrigerated and
eaten without sacrificing flavor or texture.
If we eat for reasons other than being hungry, check in with our self. Knowing what
true hunger feels like can help we recognize when we're eating for other reasons. If we can't
avoid the specific triggers that cause we to eat when we're not hungry and there's no way to
avoid them all, knowing these strategies will help!
29
Plan meals based on healthy foods, medication, weight and other personal characteristics.
EXCHANGE LIST
What are the exchange lists?
There are three main groups of nutrients--the carbohydrate group, the meat and meat
substitute group and the fat group. Starches, fruits, vegetables, milk and other carbohydrate
sources are all considered part of the carbohydrate group. The meat and meat substitute group
is further divided into very lean, lean, medium-fat and high-fat foods. Foods in the fat group--
monounsaturated, polyunsaturated and saturated fats are consumed in the smallest serving
sizes.
The foods within an exchange group are linked together because they are very similar.
All starches have approximately the same amount of carbohydrates, protein, fat and calories
per serving size. This is why one starch can be "exchanged" for another one on the list. In
addition, foods on the starch, fruit and milk list are all similar in that they all contain between
12 to 15 grams of carbohydrate per serving.
History
The site FAQs.org reports that until 1950, no standardized method for determining the
appropriate food choices for diabetics existed. In an attempt to make control of diabetes
easier, three organizations such as the American Diabetes Association, the American Dietetic
Association and the United States Public Health Service worked together to compile food
exchange lists that could improve the health and nutrition of diabetics and to encourage
eating a wide variety of foods.
How it works
Based on a specific calorie level that is usually established by a dietitian or physician,
a meal plan is created using the exchange lists. A common nutrient balance is 50 to 60
percent carbohydrates, 20 percent protein and 20 to 30 percent fat. Since 1g carbohydrate = 4
calories, 1g protein = 4 calories and 1g fat = 9 calories, we can then calculate how many
grams of carbohydrates, protein and fats can be consumed within the calorie level assigned.
For example, if the calorie level was 1400, 700 to 840 calories (175 to 210g) would be from
carbohydrate sources, 280 calories (70g) from protein and 280 to 420 calories (31 to 47g)
from fat. A specific amount of exchanges from each group can then be determined to develop
a meal plan. Or, a 2000 calorie a day diet may include 11 exchanges from the bread group,
eight from meat, four from vegetables, three from fruits, four from fats and two from milk.
The number of exchanges we'll consume depends on our total caloric intake. The University

30
of Maryland Medical Center suggests that if we're following a 1,500 calorie diet, we eat two
milk, three fat, three fruit, three vegetable, five protein and eight starch exchanges. If we need
2,000 calories daily, eat two milk, four fat, three fruit, four vegetable, eight protein and 11
starch exchanges. It's important to put foods in their proper categories; cheese is actually a
protein exchange, not a milk exchange -- only milk and yogurt and milk exchanges. Some
foods require multiple exchanges, such as chips or crackers, which may be one starch plus
one fat exchange.
Nutrient content of the Exchanges
Starches, Fruits and Vegetables
One serving in the group of starches contains 80 calories, 15 grams (g) of
carbohydrates, 3 g of protein and 1 g of fat. Beans, peas and lentils are starches, but they
count as one starch plus one lean meat exchange. The serving sizes vary because of the
variety of foods.
Each serving in the fruit group has 60 calories, 15 g of carbohydrates and no protein
or fat. Vegetables provide 25 calories, 2 g of protein, 5 g of carbohydrates and no fat.
Vegetable serving sizes are 1/2 cup cooked and 1 cup of raw vegetables. Salad greens are
considered a free food that can be eaten any time. Sweets and desserts are allowed as long as
they are eaten with a meal so they don't cause blood sugar to spike.
Proteins and Fats
The milk category is subdivided according to the amount of fat (0 to 8 g) and calories
(100 to 160). Otherwise, one serving has 12 g of carbohydrate and 8 g of protein.
Each serving in the meat category is about 1 ounce and provides 7 g of protein, but this group
is also subdivided into lean (0 to 3 g of fat and 45 calories), medium-fat (4 to 7 g of fat and
75 calories) and high-fat (8 or more g of fat and 100 calories) proteins.
The exchanges in the fat category contain 45 calories and 5 g of fat.
Typical Daily Menu
A typical daily menu on the Food Exchange diet consists of breakfast, lunch, dinner
and an afternoon snack. Breakfast should typically contain a glass of juice, cereal with non-
fat milk, tea or coffee and toast with a small amount of fruit, while lunch on the diet might be
a whole grain cereals, pulses, vegetables, fruits and curd accompanied by a salad. A typical
Food Exchange diet dinner can feature a serving of cereals, pulses, vegetables, fruits and
curd. Snacks can consist of one of the following: cereal, pulses and fruit.

31
Easy to Use
One of the reasons the meal exchange diet is easy to use is that the exchanges are
simple to equate to real portion sizes. For example, a starch exchange contains 80 calories, 15
g of carbohydrates, 3 g of protein and no fat. We don't need to memorize this, however,
because we'll learn that a starch exchange is a slice of whole grain bread, 1/2 a hamburger
bun, 1/2 English muffin, or 1/2 cup of cooked pasta, rice or hot cereal. We may need to use
multiple exchanges from the same food category at a single meal.
Meal Exchange Diet Tips
Avoid hunger by eating smaller meals and snacks throughout the day. Waiting too
long between meals can lead to hunger and cause overeating. Consume a combination of
high-fiber carbohydrates, lean protein and healthy fats at every meal; this will help slow
digestion and the conversion of food into glucose, as well as keeping us feeling full longer. It
can be very helpful to keep a food journal, especially in the beginning, to keep track of the
number of exchanges we eat from each category.
It is better to avoid alcohol. Too much alcohol may cause low blood sugar by
potentiating the effect of insulin or drugs and blocking glucose production in the liver while
adding to calories. It can cause increase in cholesterol and triglycerides.
Vegetables mentioned under the List 8 Vegetable Exchange have negligible calories and may
be used whenever desirable.
- Avoid or restrict foodstuffs high in saturated fat and cholesterol
- Avoid sweet foods, jams, chocolates, cakes, sweet cream, which increase triglyceride
levels.
- Bake, roast, boil or steam instead of frying food.
- Do not replace oil and fat with calories in terms of sweets which when taken in excess
get converted to triglycerides.
MENU PLANING
Menu planning is the process of planning and scheduling intake of meals for a
general or specific individual requirements. Diet has a powerful yet causes effect on health.
Thus are wary ways to eat to the healthy. Thus best way to achieve balanced diet is to plan
meals in selection to other formal for the whole day. It is advisable to eat small regular meals
rather than one huge meal.

32
PRINCIPALS OF PLANNING DIETS:
Meets nutritional requirements: A good menu is one which will not only provide adequate
calories, fat and proteins but also minerals, vitamins which are essential for the physical
wellbeing of each member of family. In a balanced diet the rates of energy distribution from
carbohydrates, proteins and fat would be 7:1:2 the diet should contain basic five food groups.
Meal pattern must fulfill the family needs: A family meal should be catering to needs of
the needs of the different ……meal pattern varies with age, occupation and life style of the
family members. The family meals must offer children enough fat and flexibility in calorie
density so that their energy needs are meeting.
Meal planning should save the time and energy: The recipes should be single and
nutritious. Labour and time saving devices can be used. Using convince foods save time and
energy.
Economic considerations: Meals planned that are should be with in the budget, the cost of
meals calculates reduced by bulk purchase and using seasonal fruits and vegetables.
Meal plan should give Maximum Nutrients: Loss of nutrients during processing. Cooking
should be minimised. Sprouted grains, malted cereals, fermented foods enhance the nutritive
value. Good quality protein should be distributed in all meals. Pressure cooking can be used
to preserve the nutrients.
Consider for Individual Likes & Dislikes: The meal plan should not only meet RDA but
also individual preferences. If a person does not like particular food if can be tried in a
different for or substituted by some other equally nutritious food. Food habits and dietary
pattern should also be considered. Religious, traditional and cultural practices of individual
should be considered in planning the menu. Food fads or Wrong notions and beliefs
regarding consumption of food are prevalent in different communities many of which are
baseless and may deprive an important nutrient source. For example, fad like milk and fish
should not be included in the same meal. These food fads need to be discouraged.
Planned Meals should Provide Varieties: If the meals are nutritious it is consumed.
Varieties can be included in colour, texture and taste. By using different kinds of foods and
cooking methods. Variety also helps in meeting the nutritional requirements.

33
Meals should give satiety: Each meal should have some amount of fat, protein and fiber to
get satiety. Meals should be planted in such a way that interval of the meals is also
considered.
Availability of foods: Menus should include locally available foods. The wide variation in
dietary patterns throughout the world depends largely upon the variable food supply.
Health value of foods should be considered: An ideal diets should provide besides nutrients
those bioactive chemicals which can help to prevent and cure disease process.
Points to be considered in planning a diet:
For all the nutrients minimum RDA must be met. For energy, the total calories can be
RDA+ 50 Energy derived from calories should not be more than 75 percent. It is better to
include two cereals in one meal.
Whole grain cereals or parboiled grains or malted grains gives higher nutritive value.
Flour should not be served as it reduces fibers. To improve fiber cereal and pulses should be
taken every day. Germinated pulses are more nutritious.
One egg (40g) or one serving of poultry/fish can be included in Non-veg diets for
protein. 250 ml milk/curd can be included in a balanced diet. Curd provides probiotics.
In Every meal, one raw (medium size) should be included. Inclusion of salads, raita
helps satiety, meals attractive and colourful. Five servings of fruits & vegetables should be
included. Energy derived from fats or oils is 15-20 percent of total calories and 5 percent
from sugar and jaggery.
It is better to use more than one type of oil contamination of oils have proper balance
of S:P:M (1:1:1) and n-3 and n-6 fatty acids. Choose a diet low in trans fats and cholesterol.
One third of nutritional requirement at least calories and proteins should be taken in adequate
quantities. Use of processed foods, ready to eat foods, fried packed foods should not be used.
In case of children, patient’s densed foods should be used.
Steps involved in planning diet:
Step-I: Recommended dietary allowances
To calculate balanced diet as a first step there is a need to know RDA for different age
groups prescribed by \nutrition expert committee of ICMR (RDA for Indians) Table

34
Step-II: Food list
Food list can be prepared either by using ICMR Tables or exchange list. Table.
As a second step while planning the daily diets the food are chosen from all five food groups.
To make menu planning more convenient ICMR has suggested the portion size and balanced
diet for adults as for different age groups (Table , Table ).
The balanced diets for adults and different age groups are given as multiples of these
portion sizes. The portion sizes are given in terms of raw food.
Step-III: Making Menu
The foods that are listed in step II are used and distributed indifferent meals or meal
pattern i.e is breakfast, lunch, evening tea, and dinner.
* * *

35
PLANNING THERAPEUTIC DIETS FOR INDIVIDUALS
IN HEALTH CARE INSTITUTIONS
Dr .N.V.Mahandri, Chief Dietician & Head, Dept. Of Dietetics,
Christian Medical College, Vellore.
Appropriate Nutritional Care plays an important role in the successful disease
management of a hospitalized patient. An important first step in initiating Nutritional Care is
evaluating the nutrition status of the individual. Assessment generates the information needed
for a comprehensive approach to nutrition intervention.
Planning appropriate diets to deliver the nutrients for the patient/s is part of Nutrition
Intervention when implicated. Strategies and focus of care is based on status of health.
Planning appropriate diets to deliver the nutrients for the patient is part of Nutrition
Intervention to achieve the desirable health goals with patient focused expected personal and
clinical outcomes. Diets that are formulated to optimize the nutritional needs of the patients
in order to treat a multiplicity of diseases and disorders are known as therapeutic diets.
“Therapeutic Diet” is defined as a diet intervention ordered by a health care
practitioner as part of the treatment for a disease or clinical condition manifesting an altered
nutritional status, to eliminate, decrease, or increase certain substances in the diet (e.g.
sodium, potassium). (ADA, 2011)
Planning therapeutic diets is a dynamic process. It requires not only the knowledge of
the patient’s complex medical condition related to a disease and disease graphics that include
diagnosis, etiology, pathophysiology, clinical manifestations and therapeutic management as
well as the impact of ongoing therapeutic interventions on the patient’s nutritional status and
requirements. It also requires knowledge of nutrition and available evidence based dietary
guidelines/recommendation for each disease condition and meal planning skill.
Information required for planning diet, including nutrient composition and deciding
the choice of routes of delivery of nutrients, are patient’s GI functional status, body
temperature, hydration status, alteration in the nutrients and energy requirements, age,
gender, physiological condition (pregnancy and lactation) height and weight status, food
habits (vegetarian or non vegetarian), preferences, presence of food allergies /intolerance and
activity status-(ambulatory/bedridden), appetite level, chewing and swallowing abilities,
tolerance for food by mouth.

36
Principles that govern meal planning are to be taken into consideration while planning
therapeutic diets such as nutritional adequacy, caloric control, nutrient density, variety and
balance, individuality and flexibility. RDA for nutrients should be considered for planning
diets when no established guidelines are available to meet the nutritional needs of the patient.
Therapeutic diets are adaptations of the normal or regular diet, usually a modification
of a Regular diet. It is modified or tailored to fit the nutrition needs of a particular patient
Therapeutic diets are modified for (1) nutrients (2) texture (3) food allergies or food
intolerances (4) feed intervals.
The hospitals with food service department attached to dietetics department will
provide disease and condition specific therapeutic diets for oral and or enteral feeds that are
tailored to the needs of patients. As prescribed therapeutic diets are to be translated to meal
plans, menu formulated for planning meal should employ the recommended therapeutic diet.
Meal plans and menu required for therapeutic diets should be developed by dieticians. Many
hospitals will have self designed diet manual that has description of therapeutic diets and it is
used as resource /reference in planning therapeutic diets. The foodservice department uses the
diet manual to design modified menus for patients.

37
ANNEXURE-1
Summary of RDA For Macro Nutrients In Indians (2010)
Group Age and Activity
(as applicable)
Body
Wt.
Kg
Net energy
Kcal/d
Protein
g/d
Visible
Fat
g/d
Calciu
m
mg/d
Man Adult
Sedentary,
Moderate and
Heavy
60 2320, 2730,
3490
60.0 25, 30, 40 600
Woman Adult
Sedentary,
Moderate and
Heavy
55 1900, 2230,
2850
55.0 20, 25, 30 600
Pregnant woman +350, 82.2 30 1200
Lactation (0-6 m,
612m)
+600, +520 78, 70 30 1200
Infants 0 - 6 months 5.4 500 6.0 -- 500
6 – 12 months 8.4 570 14 19
Children 1-3 years 12.9 1060 16.7 27 600
4-6 years 18.0 1350 20.1 25
7-9 years 25.1 1690 29.5 30
Boys 10-12 years 34.3 2190 39.9 35 800
Girls 10-12 years 35.0 2010 40.4 35 800
Boys 13-15 years 47.6 2750 54.3 45 800
Girls 13-15 years 46.6 2330 51.9 40 800
Boys 16-17 years 55.4 3020 61.5 50 800
Girls 16-17 years 52.1 2440 55.5 35 800

38
ANNEXURE-2
Summary Of RDA For Micronutrients In Indians (2010)
Group Age and Activity (as applicable)
Body Wt. Kg
Iron mg/
d
Vit. A
g/d
Thia min
e mg/
d
Riboflavi
n
mg/d
Nicotin
ic acid mg/
d
Pyri-doxine
mg/d
vit C
mg/d
Folic Acid
g/d
Vit.B12
g/d
Magnesium mg/d
Zinc
mg/d
Reti
-nol
-
caro-
tene
Man
Adult
Sedentary,
Moderate and
Heavy
60 17 600 4800
1.2,
1.4,
1.7
1.4,
1.6,
2.1
16,
18,
21
2.0
40 200 1.0 340 12
Woman
Adult
Sedentary,
Moderate and
Heavy 55
21 600 4800
1.0,
1.1,
1.4
1.1,
1.3,
1.7
12,
14,
16
2.0
40 200 1.0
310
10
Pregnant woman 35 800 6400 +0.2 +0.3 +2 2.5 60 500 1.2
12 Lactation (0-6 m,
612m) 25 950 7600
+0.3,
+0.2
+0.4,
+0.3
+4,
+3
2.5
80 300 1.5
Infants 0 - 6 months 5.4 0.25
350
2800
0.2 0.3 4 0.1 25 25 0.2
30 ---
6 – 12 months 8.4 0.7 0.3 0.4 5.5 0.4 45 ---
Child-
ren
1-3 years 12.9 09 400 3200
0.5 0.6 8 0.9
40
80
0.2-1.0
50 5
4-6 years 18.0 13 0.7 0.8 11 0.9 100 70 7
7-9 years 25.1 16 600 4800 0.8 1.0 13 1.6 120 100 8
Boys 10-12 years 34.3 21
600 4800
1.1 1.3 15 1.6 40 140 0.2-1.0
120 9
Girls 10-12 years 35.0 27 1.0 1.2 13 1.6 160 9
Boys 13-15 years 47.6 32 1.4 1.6 16 2.0 40 150 0.2-1.0
165 11
Girls 13-15 years 46.6 27 1.2 1.4 14 2.0 210 11
Boys 16-17 years 55.4 28 1.5 1.8 17 2.0 40 200 0.2-1.0
195 12
Girls 16-17 years 52.1 26 1.0 1.2 14 2.0 235 12[

39
ANNEXURE-3
ANNEXURE-4

40
ANNEXURE-5
Essential Amino Acid Requirements: Adults
ANNEXURE-6

41
ANNEXURE-7
ANNEXURE-8

42
ANNEXURE-9
ANNEXURE-10
43
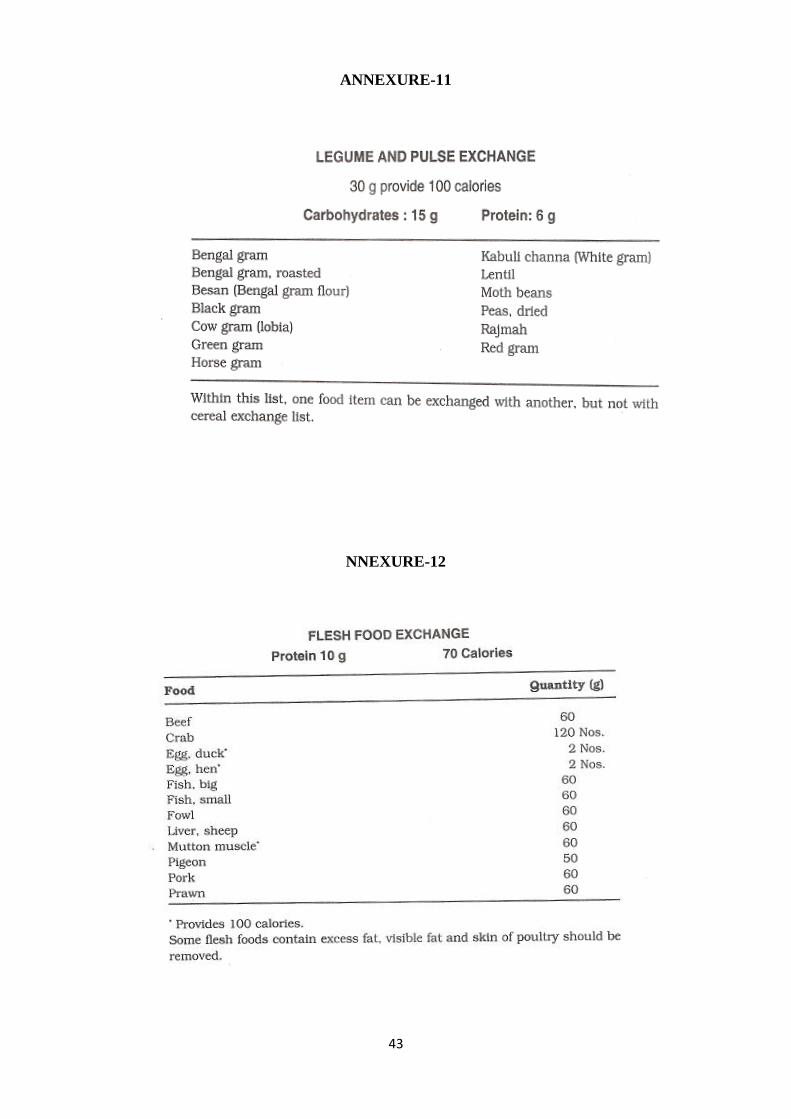
ANNEXURE-11
NNEXURE-12

44
ANNEXURE-13
ANNEXURE-14

45
ANNEXURE-15
ANNEXURE-16

46
ANNEXURE-17

47
ANNEXURE-18
ANNEXURE-19

48
ANNEXURE-20
Grades of Body Mass Index (BMI)

49
REFERENCES:
- Diet and Diabaties, NIN, ICMR, Hyderbad, 2007
- Dietary guidelines for Indians – A manual, NIN, ICMR, Hyderbad, 2011
- Nutrient requirements and Recommended Dietary Allowances for Indains, NIN,
ICMR, Hyderbad, 2010
- Nutritive vaule of Indian Foods, NIN, ICMR, Hyderbad, 2010