Embed Size (px)
Citation preview

1
Organized Crime In�ltration of Legitimate Businesses in Europe: A Pilot Project in Five European Countries
Final report of Project ARIEL
Co-funded by the Prevention of and Fight against Crime Programme of the European Union

2

3
Co-funded by the Prevention of and Fight against Crime Programme of the European Union
Final Report of Project ARIEL - Assessing the Risk of the Infiltration of Organized Crime in EU MSs Legitimate Economies: a Pilot Project in 5 EU Countries (HOME/2012/ISEC/FP/C1/4000003801)
Edited by Ernesto U. Savona and Giulia Berlusconi
Principal Investigators for the 5 EU MS:
Gerben Bruinsma, Netherlands Institute for the Study of Crime and Law Enforcement ([email protected])
Lars Korsell, Swedish National Council for Crime Prevention ([email protected])
Gorazd Meško, University of Maribor, Faculty of Criminal Justice and Security ([email protected])
Ernesto U. Savona, Università Cattolica del Sacro Cuore-Transcrime ([email protected])
David Wall, University of Durham (now University of Leeds, [email protected])
With the collaboration of (in alphabetical order): Sylvia Alberts; Branko Ažman; Stefano Bonino; Salvatore Cincimino; Jeltsje Cusveller; Adriaan Denkers; Lorena Di Bono; Fiammetta Di Stefano; Bojan Dobovšek; Katja Eman; Lorella Garofalo; Valentina Giampietri; Maurizio Lisciandra; Marina Marchiaro; Maja Modic; Michele Riccardi; Helena Rönnblom; Martina Rotondi; Federica Sarno; Giulia Schiavulli; Andrej Sotlar; Johanna Skinnari; Boštjan Slak; Cristina Soriani; Joanne van Hoek.
Suggested citation: Savona Ernesto U. & Berlusconi Giulia (Eds.). 2015. Organized Crime Infiltration of Legitimate Businesses in Europe: A Pilot Project in Five European Countries. Final Report of Project ARIEL – Assessing the Risk of the Infiltration of Organized Crime in EU MSs Legitimate Economies: a Pilot Project in 5 EU Countries (www.ariel-project.eu). Trento: Transcrime – Università degli Studi di Trento. © 2015
This project has been funded with support from the European Commission. This publication reflects the views only of the author, and the European Commission cannot be held responsible for any use which may be made of the information contained therein

4
Table of contents
List of tables
List of figures
List of acronyms
Acknowledgements
Executive summary
1. Introduction
1.1. Project ARIEL
1.2. An understudied phenomenon
1.3. Definition of organised crime infiltration
1.4. Structure of the report
PART I. Mapping organised crime infiltration in legitimate businesses
2. Organised crime infiltration in 5 EU countries
2.1. Infiltrated territories
2.2. Infiltrated business sectors
3. Italy
3.1. Introduction
3.2. Drivers
3.3. Infiltrated territories
3.4. Infiltrated business sectors
3.5. Actors and modi operandi
3.6. Conclusions
4. The Netherlands
4.1. Introduction
4.2. Drivers
4.3. Infiltrated territories
4.4. Infiltrated business sectors
4.5. Actors and modi operandi
4.6. Conclusions
5. Slovenia
5.1. Introduction
5.2. Drivers
5.3. Infiltrated territories
5.4. Infiltrated business sectors
5.5. Actors and modi operandi
5.6. Conclusions
6
8
10
12
13
18
18
18
19
20
22
24
24
30
37
37
38
39
40
42
44
45
45
47
48
48
49
49
50
50
51
52
53
55
56
5
6. Sweden
6.1. Introduction
6.2. Drivers
6.3. Infiltrated territories
6.4. Infiltrated business sectors
6.5. Actors and modi operandi
6.6. Conclusions
7. United Kingdom
7.1. Introduction
7.2. Drivers
7.3. Infiltrated territories
7.4. Infiltrated business sectors
7.5. Actors and modi operandi
7.6. Conclusions
PART II. Assessing the risk of infiltration in legitimate businesses
8. Drivers of infiltration
9. The step-by-step process of infiltration
10. Control strategies of infiltrated businesses
10.1. Legal form
10.2. Shareholders and directors
10.3. Other forms of control
11. Management strategies of infiltrated businesses
11.1. Financing sources
11.2. Use of assets
11.3. Profitability
12. Key inputs for a common risk assessment model
12.1. Risk assessment in organised crime research
12.2. Infiltration risk factors
12.3. Towards a common risk-assessment model
13. Conclusions
References
57
57
58
59
60
64
66
67
67
68
70
70
72
74
76
78
83
90
90
93
99
102
103
105
109
112
113
119
122
124
125

6
List of tables
Table 1. Top 3 regions (NUTS 2 and NUTS 3) for references to OCG infiltration in open sources by country
Table 2. Hypotheses on the characteristics of infiltrated territories
Table 3. Relationship between the references of OCG infiltration in open sources and the characteristics of infiltrated territories
Table 4. Top 3 and bottom 3 regions (NUTS 2) for shadow economy by country. Comparison with the national average
Table 5. Top 3 and bottom 3 regions (NUTS 2) for corruption by country. Comparison with the national average
Table 6. Relationship between the references to OCG infiltration in open sources and the characteristics of infiltrated territories. Comparison with the EU and national average
Table 7. Business sectors by number of references to OCG infiltration in open sources
Table 8. Business sectors by country and number of references to OCG infiltration in open sources
Table 9. Top 3 business sectors with references to OCG infiltration in open sources by country
Table 10. Hypotheses on the characteristics of infiltrated business sectors
Table 11. Relationship between the references to OCG infiltration in open sources and the characteristics of infiltrated business sectors
Table 12. Top 10 business sectors for number of references to OCG infiltration in open sources by sector’s characteristics. Comparison with the European average
Table 13. Top 5 business sectors for number of references to OCG infiltration in open sources by sector’s characteristics in Italy. Comparison with the national average
Table 14. Top 5 business sectors for number of references to OCG infiltration in open sources by sector’s characteristics in the Netherlands. Comparison with the national average
Table 15. Top 5 business sectors for number of references to OCG infiltration in open sources by sector’s characteristics in Slovenia. Comparison with the national average
Table 16. Top 5 business sectors for number of references to OCG infiltration in open sources by sector’s characteristics in Sweden. Comparison with the national average
Table 17. Top 5 business sectors for number of references to OCG infiltration in open sources by sector’s characteristics in the United Kingdom. Comparison with the national average
Table 18. Top 5 sectors and top 5 regions (NUTS 2) for number of references to OCG infiltration in open sources by OCG
Table 19. Top 5 sectors and top 5 regions (NUTS 1) for number of references to OCG infiltration in open sources
Table 20. Hypotheses on the legal forms of infiltrated businesses
Table 21. Hypotheses on shareholders and directors of infiltrated businesses
Table 22. Hypotheses on other forms of control of infiltrated businesses
Table 23. Financing sources of infiltrated businesses. Comparison with the peer group of non-infiltrated businesses
25
25
26
29
31
33
34
28
29
32
33
35
36
37
35
36
36
42
73
91
94
99
103

7
Table 24. Financing sources of infiltrated businesses by driver of OCG infiltration. Comparison with the peer group of non-infiltrated businesses
Table 25. Use of assets of infiltrated businesses. Comparison with the peer group of non-infiltrated businesses
Table 26. Use of assets of businesses infiltrated for fraud. Comparison with the peer group of non-infiltrated businesses
Table 27. Profitability of infiltrated businesses. Comparison with the peer group of non-infiltrated businesses
Table 28. Preliminary predictive model on organised crime infiltration into legitimate business
Table 29. Me.Tri.C. model. Indicators and variables included in the Territory and Economic sector models
Table 30. Mo.Vu.S. model. Indicators and variables included in the territory and economic sector risk factors
Table 31. Operationalisation of risk factors
105
106
107
109
114
116
117
122

8
List of figures
Figure 1. Percentage of references to OCG infiltration in open sources by type of source
Figure 2. Percentage of references to OCG infiltration in open sources by country
Figure 3. Percentage of references to OCG infiltration in open sources by type of OCG
Figure 4. Number of references to OCG infiltration in open sources by region (NUTS 2). Percentage of the country total
Figure 5. Number of references to OCG infiltration in open sources and shadow economy by region (NUTS 2). Comparison with the European average
Figure 6. Number of references to OCG infiltration in open sources and corruption by region (NUTS 2). Comparison with the European average
Figure 7. Number of references to OCG infiltration in open sources and income by region (NUTS 2). Comparison with European and national average
Figure 8. Number of references to OCG infiltration in open sources by country and business sector
Figure 9. Percentage of references to OCG infiltration in open sources by type of source
Figure 10. Number of references to OCG infiltration in open sources by region (NUTS 2)
Figure 11. Number of references to OCG infiltration in open sources by business sector
Figure 12. Regions (NUTS 2) with at least one reference to OCG infiltration in open sources in the top 3 infiltrated sectors
Figure 13. References to Italian mafias infiltration in open sources by location (NUTS 2)
Figure 14. Percentage of references to OCG infiltration in open sources by type of source
Figure 15. Number of references to OCG infiltration in open sources by region (NUTS 2)
Figure 16. Number or references to OCG infiltration in open sources by business sector
Figure 17. Criminal charges with references to organised crime groups, 2002-mid 2014
Figure 18. Percentage of references to OCG infiltration in open sources by type of source
Figure 19. Filed criminal charges for money laundering offences, 2002-mid 2014
Figure 20. Number of references to OCG infiltration in open sources by region (NUTS 3)
Figure 21. Number of references to OCG infiltration in open sources by business sector
Figure 22. Regions (NUTS 3) with at least one reference to OCG infiltration in open sources in the top 3 infiltrated sectors
Figure 23. Percentage of references to OCG infiltration in open sources by type of source
Figure 24. Number of references to OCG infiltration in open sources by region (NUTS 2)
Figure 25. Number of references to OCG infiltration in open sources by business sector
Figure 26. Percentage of references to OCG infiltration in open sources by type of source
Figure 27. Number of references to OCG infiltration in open sources by region (NUTS 2)
Figure 28. Number of references to OCG infiltration in open sources by business sector
Figure 29. Regions (NUTS 1) with at least one reference to OCG infiltration in open sources in the top 3 infiltrated sectors
22
23
23
24
27
28
30
31
38
39
41
41
43
50
53
45
51
53
48
52
55
58
70
60
71
61
72
68
49

9
76
76
77
77
79
82
84
85
89
91
92
93
93
94
96
98
100
101
101
102
103
123
Figure 30. Number of case studies by country
Figure 31. Number of infiltrated businesses by country
Figure 32. Case studies and infiltrated businesses
Figure 33. Distribution of infiltrated businesses in the case studies analysed
Figure 34. Drivers of OCG infiltration
Figure 35. Drivers of OCG infiltration by country
Figure 36. Type of infiltrated business by country
Figure 37. Crime script of OCG infiltration of legal businesses
Figure 38. Involvement of professionals in the infiltration process by country
Figure 39. Legal forms of infiltrated businesses by country
Figure 40. Infiltrated businesses with a legal form different from the one most common in the same country and economic sector
Figure 41. Legal forms of infiltrated businesses in Italy by type of OCG
Figure 42. Legal forms of infiltrated businesses by type of driver
Figure 43. Infiltrated businesses with OCG members involved as shareholders by country
Figure 44. Other categories of shareholders. Percentages by country
Figure 45. Infiltrated businesses with women among shareholders and with women as majority shareholders by country
Figure 46. Case studies with evidence of cross-shareholding among different businesses by country
Figure 47. Size of infiltrated businesses. Percentages by country and size category
Figure 48. Age of infiltrated businesses. Percentages by country and age category
Figure 49. Infiltrated businesses covered by the financial and accounting analysis by country
Figure 50. Number of businesses with evidence of accounting manipulation by driver of OCG infiltration
Figure 51. Risk model of OCG infiltration of legitimate businesses
10
List of acronyms
AJPES Agency of the Republic of Slovenia for Public Legal Records and Related Services (Agencija Republike Slovenije za javnopravne evidence in storitve)
ARIEL Assessing the Risk of the Infiltration of Organised Crime in Legitimate Economies
BIA Security Information Agency (Bezbednosno-informativna agencija)
Brå Swedish National Council for Crime Prevention (Brottsförebyggande rådet)
CENSIS Center for Social Investment Studies (Centro Studi Investimenti Sociali)
CEO Chief Executive Officer
CIFAS Fraud Prevention Service
CIT Cash-In-Transit
CNEL National Council for Economics and Labour (Consiglio Nazionale dell’Economia e del Lavoro)
COBISS Co-operative Online Bibliographic Systems and Services
CPA Anti-mafia Parliamentary Commission (Commissione Parlamentare Antimafia)
CPC Commission for the Prevention of Corruption
CPU Computer Processing Unit
CRO Companies Registration Office
CSD Center for the Study of Democracy
DEA Drug Enforcement Administration
DIA Anti-mafia Investigative Department (Direzione Investigativa Antimafia)
DLIO National Police (Nationale Politie)
EBM Economic Crime Authority (Ekobrottsmyndigheten)
EU European Union
FATF Financial Action Task Force
FCJS Faculty of Criminal Justice and Security
FIOD Fiscal Intelligence and Investigation Service (Fiscale Inlichtingen- en Opsporingsdienst)
FIU Financial Intelligence Unit
GDP Gross Domestic Product
GRETA Group of Experts on Action against Trafficking in Human Beings
HMRC Her Majesty’s Revenue and Customs
HP Hypothesis
IRAP Regional Tax on Production Activities (Imposta Regionale sulle Attività Produttive)
IRCP International Research on Criminal Policy
ISF Social Insurance Inspectorate (Inspektionen för socialförsäkringen & Brottsförebyggan-de rådet)
ISTAT National Institute of Statistics (Istituto Nazionale di Statistica)

11
KFM Enforcement Authority (Kronofogden)
LEA Law Enforcement Agency
MEK Butanone
MS Member State
MSB Money Service Business
MTIC Missing Trader Intra-Community
NA Not Available
NACE Statistical Classification of Economic Activities in the European Community
NCA National Crime Agency
NSCR Netherlands Institute for the Study of Crime and Law Enforcement
NUTS Nomenclature of Units for Territorial Statistics
OC Organised Crime
OCG Organised Crime Group
OCP Organised Crime Portfolio
PEP Politically Exposed Persons
POCA Proceeds of Crime Act 2002
PON National Operative Programme (Programma Operativo Nazionale)
RKP National Bureau of Investigation (Rikskriminalpolisen)
SAMEB Collaboration Against Economic Crime
SD Standard Deviation
SEK Swedish Krona
SKD Standard Classification of Activities (Standardna klasifikacija dejavnosti)
SOCA Serious Organised Crime Agency
SOU Government Official Reports (Statens Offentliga Utredningar)
THC Tetrahydrocannabinol
UAE United Arab Emirates
UDUR University of Durham
UK United Kingdom
UKTA United Kingdom Threat Assessment
USA United States of America
VAT Value-Added Tax
WODC Research and Documentation Centre (Wetenschappelijk Onderzoek- en Documen-tatiecentrum)
XTC Ecstasy

12
Acknowledgements
Project ARIEL has been carried out thanks to the contribution and support of a wide range of representatives of European institutions, LEAs, FIUs, AROs, academics and researchers. Special thanks go to Unit D2 Organised crime of the Directorate-General (DG) Home Affairs of the European Commission. The authors also thank (in alphabetical order):
Pasquale Aglieco (Ministero dell’Interno); Igor Angelini (Europol); Fernando Asaro (Procura di Caltanissetta); Stojan Belšak (Ministrstvo za notranje zadeve, Policija, Uprava kriminalistične policije, Sektor za organizirano kriminalitetno); H.W.J.G. Boer (Fiscale Inlichtingen- en Opsporingsdienst); Marco Bolognesi (Ministero dell’Interno); Maurizio Bonaccorso (Procura di Palermo); Iole Boscarino (Procura di Catania); Francesco Caleca (Procura di Bologna); Francesco Cardona Albini (Procura di Genova); Ignazio De Francisci (Procura di Palermo); Andrea De Gasperis (Procura di Latina); Marco Del Gaudio (Procura di Napoli); Vincenzo Delicato (Ministero dell’Interno); Maria Di Mauro (Procura di Napoli); Alfonso Di Vito (Direzione Investigativa Antimafia); Antonella Duchini (Procura di Perugia); Ekobrottsmyndigheten (Swedish Economic Crime Authority); Raffaello Falcone (Procura di Napoli); Marjan Fank (Ministrstvo za notranje zadeve, Policija); Giuseppe Fici (Procura di Agrigento); Zvonko Fišer (Ministrstvo za pravosodje, Vrhovno državno tožilstvo Republike Slovenije); Giuseppe Gatti (Procura di Bari); Andrea Ghinetti (Tribunale di Milano); Giuliano Giambartolomei (Procura di Firenze); Giuseppe Giura (Tribunale di Palermo); Stuart Hyde (Cumbria Police); Robert Lalič (Ministrstvo za notranje zadeve, Policija, Uprava kriminalistične policije, Nacionalni preiskovalni urad); Sergio Lari (Procura di Caltanissetta); Stefano Luciani (Procura di Caltanissetta); Malmö Police; Alfredo Musumeci (Direzione Investigativa Antimafia); Pierangelo Padova (Procura di Palermo); Paolo Pecori (Procura di Vicenza); Annamaria Picozzi (Procura di Palermo); Giuseppe Pignatone (Procura di Roma); Francesco Polino (Procura di Roma); Robert Pollard (Durham Police); Michele Prestipino (Procura di Roma);
Elisabetta Pugliese (Procura di Roma); Marcello Quercia (Procura di Bari); Maria Cristina Ribera (Procura di Napoli); Marzia Sabella (Procura di Palermo); Dijana Šprajc Turek (Agencija Republike Slovenije za javnopravne evidence in storitve); Swedish National Bureau of Investigation, Financial Intelligence Unit; Francesco Testa (Procura di Catania); Peter van der Laan (Netherlands Institute for the Study of Crime and Law Enforcement); Rob Wainwright (Europol).
Final thanks go to the staff of the Università Cattolica del Sacro Cuore and Transcrime who guaranteed support throughout the duration of the project, and in particular to Alessandra Amato, Maria Elena Cenci, Alessio Fontana, Ilaria Mastro, and Andrea Pesoli.
13
Executive summary
Project ARIEL – Assessing the Risk of the Infiltration of Organised Crime in EU MSs Legitimate Economies: a Pilot Project in 5 EU Countries (www.arielproject.eu) – was carried out with the financial support of the European Commission, DG Home Affairs, within the Prevention of and Fight against Crime (ISEC) Programme. It focused on five EU MS: Italy, the Netherlands, Slovenia, Sweden, and United Kingdom.
This research is an exploratory study on the infiltration of organised crime groups (OCGs) in legal businesses. Infiltration occurs in every case in which a natural person belonging to a criminal organisation or acting on its behalf, or an already infiltrated legal person, invests financial and/or human resources to participate in the decision-making process of a legitimate business.
The main output of the research is a list of risk factors of OCG infiltration in legal businesses, i.e. factors that facilitate or promote infiltration. Risk factors are derived from an unprecedented cross-national comparative analysis of the vulnerabilities of territories and business sectors, criminal groups’ modi operandi, and the characteristics of infiltrated businesses.
Infiltration risk factors provide inputs for the development of a risk assessment model of OCG infiltration. Its development will assist Law Enforcement Agencies (LEAs) in identifying the factors facilitating and/or promoting infiltration and enhancing the prevention and enforcement of criminal infiltration. This will help protect EU MS legitimate economies from the misuse of legal businesses for illicit purposes.
PART I. Mapping organised crime infiltration in legitimate businesses
This study analyses OCG infiltration in legitimate businesses through 2,380 references to OCG infiltration from a variety of open sources (i.e. academic studies, LEA operations and reports, newspaper articles). It examines the distribution of OCG infiltration and its correlation with socio-economic indicators to identify the main characteristics of the territories and business sectors targeted by OCGs.
Infiltrated territories
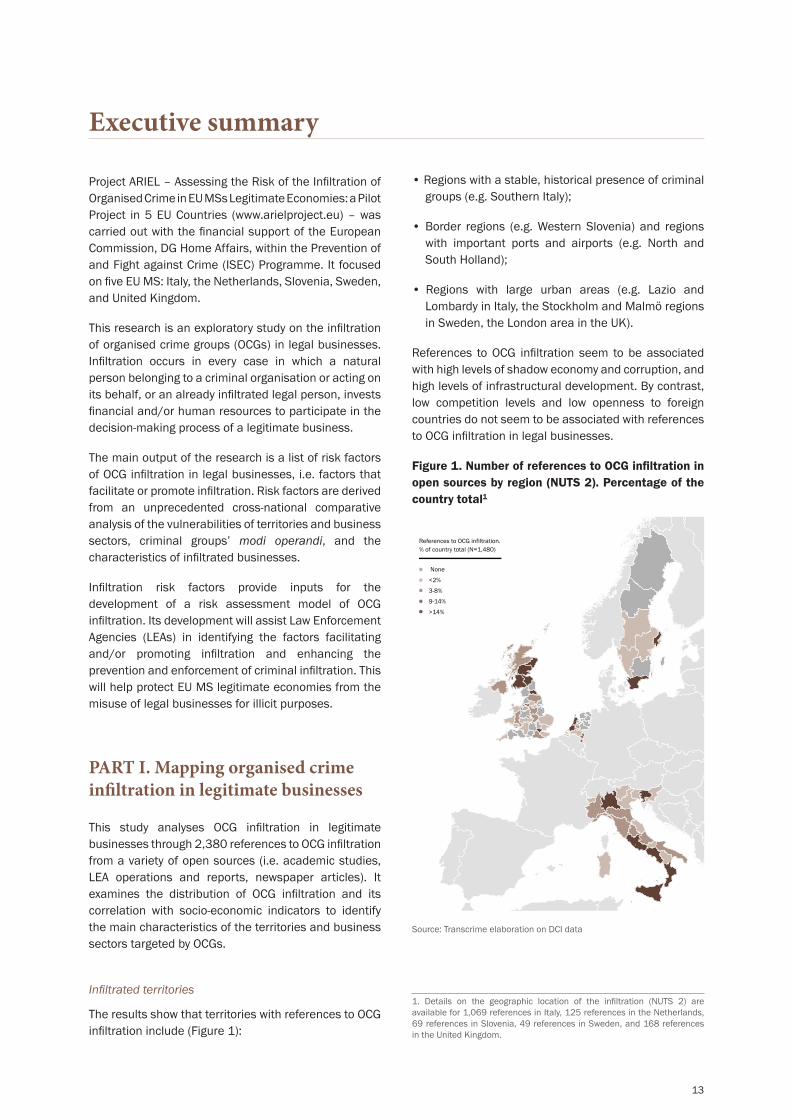
The results show that territories with references to OCG infiltration include (Figure 1):
• Regions with a stable, historical presence of criminal groups (e.g. Southern Italy);
• Border regions (e.g. Western Slovenia) and regions with important ports and airports (e.g. North and South Holland);
• Regions with large urban areas (e.g. Lazio and Lombardy in Italy, the Stockholm and Malmö regions in Sweden, the London area in the UK).
References to OCG infiltration seem to be associated with high levels of shadow economy and corruption, and high levels of infrastructural development. By contrast, low competition levels and low openness to foreign countries do not seem to be associated with references to OCG infiltration in legal businesses.
Figure 1. Number of references to OCG infiltration in open sources by region (NUTS 2). Percentage of the country total1
None
<2%
3-8%
9-14%
>14%
References to OCG infiltration. % of country total (N=1,480)
1. Details on the geographic location of the infiltration (NUTS 2) are available for 1,069 references in Italy, 125 references in the Netherlands, 69 references in Slovenia, 49 references in Sweden, and 168 references in the United Kingdom.
Source: Transcrime elaboration on DCI data

14
Infiltrated business sectors
The results show that business sectors with references to OCG infiltration include (Figure 2):
• Cash-intensive sectors (e.g. bars and restaurants);
• Sectors that are territorially specific (e.g. hotels);
• Labour-intensive sectors characterised by low technology (e.g. construction);
• Sectors functional to illicit activities (e.g. transportation; wholesale and retail trade; financial and insurance activities);
• Sectors characterised by weak or developing regulation (e.g. gambling activities; renewable energy), or inefficient control systems (e.g. construction).
Figure 2. Number of references to OCG infiltration in open sources by country and business sector2
References to OCG infiltration seem to be associated with low levels of openness to foreign investments; low levels of competition and technology; and small
average business entity size. The relationship between references to OCG infiltration and a sector’s profitability is weak and negative.
2. Details on the business sector of the infiltration (NACE 0-digit) are available for 1,286 references in Italy, 558 references in the Netherlands, 74 references in Slovenia, 114 references in Sweden, and 248 references in the United Kingdom.
Source: Transcrime elaboration on DCI data

15
PART II. Assessing the risk of infiltration in legitimate businesses
This study analyses 70 case studies of OCG infiltration and 299 infiltrated businesses. It identifies the main drivers of OCG infiltration of legal businesses, the step-by-step process of infiltration, and the characteristics of infiltrated businesses.
Drivers of OCG infiltration
OCGs infiltrate legitimate businesses to maximise economic and non-economic benefits. In particular, they aim to:
• Launder the profits from criminal activities;
• Obtain considerable earnings and benefit from their profitability;
• Perpetrate frauds (e.g. insurance fraud, VAT and tax fraud, benefit fraud);
• Conceal illicit activities such as drug trafficking and prostitution;
• Achieve other goals such as maximising social consensus and achieving control over a particular sector or territory.
OCGs active in the Netherlands, Sweden, and the United Kingdom mainly infiltrate businesses in order
to perpetrate frauds. Most Slovenian OCGs infiltrate legal businesses to conceal illegal activities, mainly prostitution. In Italy, some OCGs have invested in legal business entities to maximise their social consensus and to control a particular market of the local economy.
The step-by-step process of infiltration
Infiltrated legal businesses divide between two types: already-existing businesses and new ones. Dutch organised criminals are more prone to infiltrate the former; Slovenian organised criminals favour the start of new businesses. In Italy, Sweden, and the United Kingdom, there is a balance between the two types of infiltrated businesses.
The infiltration process is often straightforward. It involves one member of the criminal group regularly starting a new business or acquiring an already-existing one from a legal entrepreneur. This process can be facilitated by the scant requirements needed to set up a company or the lack of regulation on the process of acquiring a business.
In other cases, the infiltration process requires further steps, e.g. establishment of a partnership with the former shareholder and/or director of the targeted business (Figure 3). The infiltration process occasionally involves OCG members’ relatives, professionals, public officials, and politicians who help organised criminals to acquire and manage the legal business.
Figure 3. Crime script of OCG infiltration of legal businesses
Legal entrepreneur
starts business
Identify business
Start business
Use of premises for criminal
activity
Deposit money in offshore bank
accounts
Use of business for criminal
activity
Use of business for legitimate
activity
Register business
Legal entr. approaches
OCG member
OCG acquires business
OCG approaches legal entr.
OCG gets involved in business
Register straw man as
shareholder
Company registration agent starts business
Source: Transcrime elaboration
16
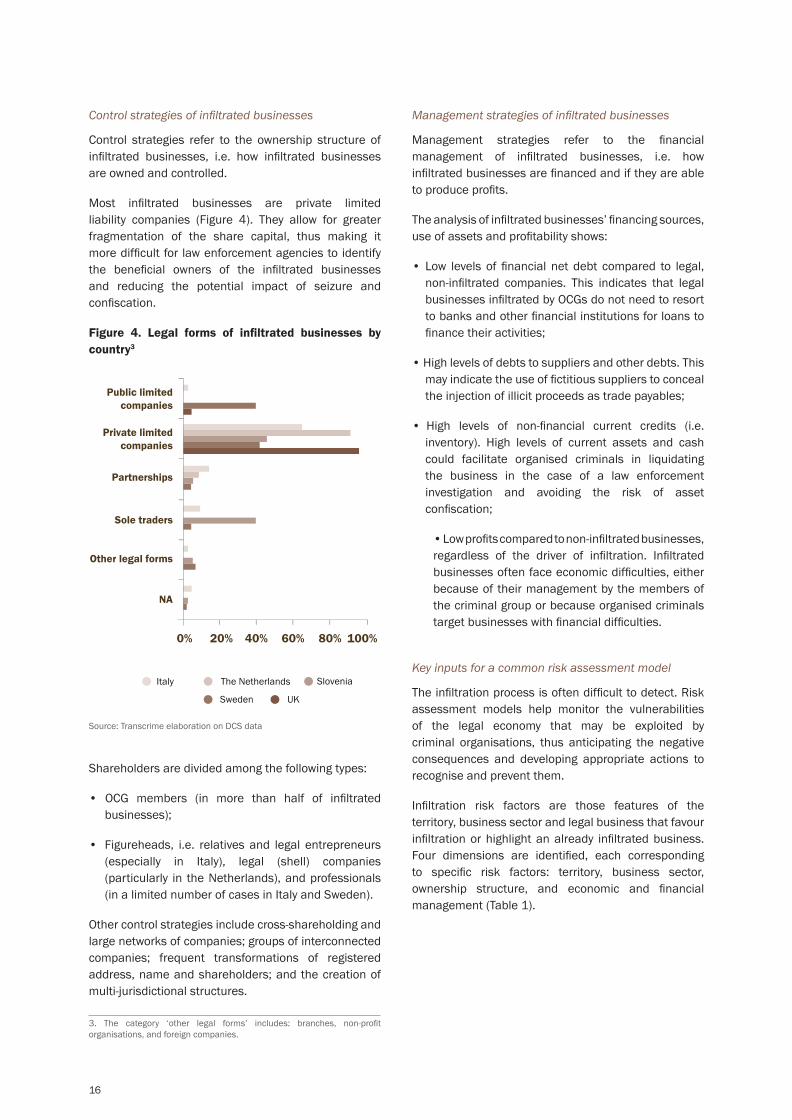
Control strategies of infiltrated businesses
Control strategies refer to the ownership structure of infiltrated businesses, i.e. how infiltrated businesses are owned and controlled.
Most infiltrated businesses are private limited liability companies (Figure 4). They allow for greater fragmentation of the share capital, thus making it more difficult for law enforcement agencies to identify the beneficial owners of the infiltrated businesses and reducing the potential impact of seizure and confiscation.
Figure 4. Legal forms of infiltrated businesses by country3
Shareholders are divided among the following types:
• OCG members (in more than half of infiltrated businesses);
• Figureheads, i.e. relatives and legal entrepreneurs (especially in Italy), legal (shell) companies (particularly in the Netherlands), and professionals (in a limited number of cases in Italy and Sweden).
Other control strategies include cross-shareholding and large networks of companies; groups of interconnected companies; frequent transformations of registered address, name and shareholders; and the creation of multi-jurisdictional structures.
figure 1
figure 2
figure 3
figure 10
figure 15
figure 18
figure 19
figure 20
Figure 24
figure 27
figure 31
figure 32
figure 34
figure 35
figure 36
figure 37
figure 39
figure 40
figure 41
figure 42
figure 43
figure 45
figure 46
figure 47
figure 48
figure 49
figure 50
figure 51
9.2%
49.8%
1.3%
17.1%
22.5%
54.8%25.4%
3.1%
5.9%
10.8%
27%
25%
1%
15%
32%
43%
33%
20%
3% 1%
20%
1%3%
5%
70%
100%90%80%70%60%50%40%30%20%10%
0%2002
4
1
3
2
3
1
1
4
15
1
62
2
47
1
139 89 40
2
5 3 39
2003 2004 2005 2006 2007 2008 2009 2010 2011 2012 2013 2014*
21%
15%
1%4%
59%
21
11
8
20
10
164
34
35
43
23
20
25
15
10
5
01 2 3 4 5 6 7 8 9 10 >10
21%
16%
22%
21%
19%
70%80%90%
100%
40%50%60%
20%30%
10%0%
70%80%90%
100%
40%50%60%
20%30%
10%0%
Italy (N=164)
Slovenia(N=35)
Sweden(N=43)
UK(N=23)
TheNetherlands
(N=34)
Italy (N=21)
Slovenia(N=8)
Sweden(N=20)
UK(N=10)
TheNetherlands
(N=11)
Italy Slovenia Sweden UKTheNetherlands
70% 14
5
62
40%
50%
60%
20%
30%
10%
0%
600
500
400
300
200
100
0
0.20%
0.30%
0.10%
0.50%
0.60%
0.70%
0.80%
0.40%
0.00%2002
0.72%
0.51%
0.26%
0.47%0.56%
0.33%
0.44% 0.47%0.39%
0.36%
0.58%0.52%
0.24%
2003 2004 2005 2006 2007 2008 2009 2010 2011 2012 2013 2014*
38
6
10
5
7
70%80%90%
100%
94
25
19
35
2
40%50%60%
20%30%
10%0%
Italy (N=164)
Slovenia(N=35)
Sweden(N=43)
UK(N=23)
TheNetherlands
(N=34)
Public limited companies
Private limited companies
Partnerships
Sole traders
Other legal forms
NA
20% 40% 60% 80% 100%0%
figure 44
70%80%90%
100%
40%50%60% 90
11
22 26
17
20%30%
10%0%
Italy (N=164)
Slovenia(N=35)
Sweden(N=43)
UK(N=23)
TheNetherlands
(N=34)
10
12
6
8
4
2
14
16
0Money
launderingFraud OtherFormally legal
activitiesConcealment
of illegal activities
4 43
5
15
Italy (N=164)
Slovenia(N=35)
Sweden(N=43)
UK(N=23)
TheNetherlands
(N=34)
70%80%90%
100%
40%50%60%
20%30%
10%0%
40%
50%
20%
30%
10%
0%Italy
(N=137)Slovenia(N=32)
Sweden(N=34)
UK(N=18)
70%80%90%
100%
40%50%60%
20%30%
10%0%
Italy (N=21)
Slovenia(N=8)
Sweden(N=20)
UK(N=10)
TheNetherlands
(N=11)
Italy(N=164)
Slovenia(N=35)
Sweden(N=43)
UK(N=23)
TheNetherlands
(N=34)
Italy(N=164)
Slovenia(N=35)
Sweden(N=43)
UK(N=23)
TheNetherlands
(N=34)
70%80%90%
100%
40%50%60%
20%30%
10%0%
70%80%90%
100%
40%50%60%
20%30%
10%0%
30%
24.9%0.8%
Academic study Judicial evidence
LEA report Media Other
N = 2,380
N = 2,380
N = 2,380
N = 1,305
N = 604
Institutional report
15%
29%
0.4%
Local OCGs Motorcycles gangsItalian mafias
Other OCGs NA
Italy SloveniaThe Netherlands
Sweden UK
Academic study
Judicial evidence LEA report Media
Institutional report
Academic study
LEA report Media
No. criminal charges with references to OCGs % OCGs in relation to all criminal charges
% O
CGs
in re
latio
n to
all
crim
inal
cha
rges
Other
Institutional report
No.
crim
inal
cha
rges
with
refe
renc
es to
OCG
s
Academic study
Judicial evidence LEA report Media
Institutional report
N = 74
23%
24%
20%
32%
1% N = 140
N = 257
N = 70
N = 299
Academic study
LEA report Media Other
Institutional report
No. filed criminal complaints for money laudering offences with references to OCGs
No. filed criminal complaints for money laudering offences without references to OCGs
Academic study
Judicial evidence LEA report Media
Institutional report
Italy SloveniaThe Netherlands
Sweden UK
Italy SloveniaThe Netherlands
Sweden UK
Money laundering FraudFormally legal activities
Concealment of illegal activities Other
Money laundering FraudFormally legal activities
New business NAAlready existing business
Concealment of illegal activities Other
90
53
19
24
9
14
4
30
15
29
21
20% 40% 60% 80% 100%0%
Public limitedcompanies
Private limitedcompanies
Partnerships
Sole traders
Other legal forms
NA
Italy SloveniaThe Netherlands
UKSweden
Public limitedcompanies
Private limitedcompanies
Partnerships
Sole traders
Otherlegal forms
NA
20% 40% 60% 80% 100%0%
Cosa Nostra (N=14) Camorra (N=74)‘Ndrangheta (N=47)
Other Italian (N=13)Chinese (N=16)
Money laundering Fiscal fraudFormally legal activities
Corporate fraud OtherConcealment of illegal activities
Relatives Legal entrepreneursProfessionals
Women among shareholders Women as majority shareholders
Legal companies
53
7
6
14
98
3
1
8
4
1
Small LargeMedium Very large NA
Italy SloveniaThe Netherlands
Sweden UK
0 4-101-3 11-20 >20 NA
Management strategies of infiltrated businesses
Management strategies refer to the financial management of infiltrated businesses, i.e. how infiltrated businesses are financed and if they are able to produce profits.
The analysis of infiltrated businesses’ financing sources, use of assets and profitability shows:
• Low levels of financial net debt compared to legal, non-infiltrated companies. This indicates that legal businesses infiltrated by OCGs do not need to resort to banks and other financial institutions for loans to finance their activities;
• High levels of debts to suppliers and other debts. This may indicate the use of fictitious suppliers to conceal the injection of illicit proceeds as trade payables;
• High levels of non-financial current credits (i.e. inventory). High levels of current assets and cash could facilitate organised criminals in liquidating the business in the case of a law enforcement investigation and avoiding the risk of asset confiscation;
• Low profits compared to non-infiltrated businesses, regardless of the driver of infiltration. Infiltrated businesses often face economic difficulties, either because of their management by the members of the criminal group or because organised criminals target businesses with financial difficulties.
Key inputs for a common risk assessment model
The infiltration process is often difficult to detect. Risk assessment models help monitor the vulnerabilities of the legal economy that may be exploited by criminal organisations, thus anticipating the negative consequences and developing appropriate actions to recognise and prevent them.
Infiltration risk factors are those features of the territory, business sector and legal business that favour infiltration or highlight an already infiltrated business. Four dimensions are identified, each corresponding to specific risk factors: territory, business sector, ownership structure, and economic and financial management (Table 1).
3. The category ‘other legal forms’ includes: branches, non-profit organisations, and foreign companies.
Source: Transcrime elaboration on DCS data

17
Table 1. Dimensions and risk factors of OCG infiltration
Dimension Risk factor
Territory
Past evidence of OCG infiltrationPresence of OCGsLarge urban areasHigh level of infrastructural equipmentHigh level of shadow economy
High level of corruption
Business sector
Past evidence of OCG infiltrationLow level of competitionLow level of openness to foreign investmentsLow level of technologySmall average company size
Low barriers to entry
Weak or developing regulation
Ownership structure of legal business
Limited companyCharacteristics of shareholders (young/old, female shareholders)Corporate shareholdersComplex corporate ownership schemes and cross-shareholdingFrequent change of company detailsSmall company size
Financial management of legal business
Low level of financial debtHigh level of current assetsLow revenues and profitability
The risk of infiltration can be identified as a function of the features of the territory, business sector, and ownership structure and financial management of legal businesses. The list of risk factors identified in Project ARIEL – that could be further integrated and updated – is the first step towards the development of a risk assessment model to detect the infiltration of OCGs in European legitimate economies.
Source: Transcrime elaboration

18
1. Introduction1.1 Project ARIEL
This report presents the final results of project ARIEL – Assessing the Risk of the Infiltration of Organised Crime in EU MSs Legitimate Economies: a Pilot Project in 5 EU Countries (www.arielproject.eu). Project ARIEL was carried out with the financial support of the European Commission, DG Home Affairs, within the Prevention of and Fight against Crime (ISEC) Programme.
Project ARIEL was carried out by a consortium of five partners from European universities and research centres:
• Università Cattolica del Sacro Cuore-Transcrime, Italy (project coordinator)
• Netherlands Institute for the Study of Crime and Law Enforcement, the Netherlands
• University of Maribor-Faculty of Criminal Justice and Security, Slovenia
• Swedish National Council for Crime Prevention, Sweden
• University of Durham, United Kingdom
Europol was involved in the project as end user, together with national law enforcement agencies for each of the five EU member states: Ministero dell’Interno (Italy), Fiscal Information and Investigation Service (the Netherlands), Ministrstvo za Notranje Zadeve (Slovenia), Polisen-National Bureau of Investigation (Sweden),4 and Cumbria Police (United Kingdom).
Project ARIEL has aimed to identify the vulnerabilities of legitimate businesses to infiltration by organised crime groups. In particular, the project has pursued two objectives:
• To identify the methods used by different OCGs to infiltrate, control, and manage legitimate businesses in five selected EU member states (Italy, the Netherlands, Slovenia, Sweden, United Kingdom). These five EU MS were chosen in order to maximise the coverage of the EU territory.
• To identify the risk factors of OCG infiltration for the development of a common risk assessment model to detect the infiltration of legitimate businesses by criminal groups. The risk assessment model could be further updated and tested in other EU MS and international countries.
1.2 An understudied phenomenon
The complex relationship between organised crime groups and the legal economy has been debated by several authors (Arlacchi, 1983, 2007; Catanzaro, 1986, 1988; Cressey, 1969; Ianni & Reuss-Ianni, 1972; Smith, 1975; van Duyne, von Lampe, van Dijck, & Newell, 2005). Some authors argue that criminal organisations need to engage in legal activities because investment opportunities in the illegal markets are insufficient to reinvest the money accumulated with illicit activities (Barresi, 1999; Ruggiero, 1996). The proceeds of illegal activities are thus laundered through investments in the legal economy (Catanzaro, 1988; Centorrino & Signorino, 1997).
Other authors suggest that infiltration of the legal economy is a constant feature of criminal organisations, which diversify their investments between legal and illegal markets (Fantò, 1999; Santino, 2006). Once the money has been invested in the legal economy, organised crime groups act like other entrepreneurs by responding to the normal market rules (Edelhertz & Overcast, 1994).
The boundaries between the legal and illegal economies are blurred. Economic activities are distributed along a continuum with criminal activities at one extreme and completely legal ones at the other (Ruggiero, 2008; Smith, 1975, 1980). Between these two extremes lie several other possible ways in which organised criminals engage in activities that are formally legal yet organised and managed illegally. The legal sectors in which criminal entrepreneurs operate, together with illegal activities, define the criminal economy as a whole (Becchi & Rey, 1994).
The organised crime and money laundering literature provides insights into the relationship between criminal organisations and the legal economy (e.g. Savona & Riccardi, 2015; van Duyne et al., 2005). However, there is little understanding of infiltration by organised crime groups in legal businesses, i.e. the drivers of infiltration, the locations and business sectors of the businesses targeted, the process of infiltration, and the strategies used to control and manage infiltrated businesses. Furthermore, scholars have mainly focused on specific sectors or countries, whereas cross-country comparative analyses are still lacking.
This study provides an unprecedented cross-national comparative analysis of organised crime infiltration of legitimate businesses in five EU MS. It focuses on the vulnerabilities of territories and business sectors, on criminal groups’ modi operandi, and on the characteristics of infiltrated businesses. It identifies the factors that facilitate or promote OCG infiltration of legal businesses and provides inputs for the development of a risk assessment model to detect infiltration.
4. The National Bureau of Investigation has recently changed its name into Nationell Operativ Avdelning (NOA).

19
1.3 Definition of organised crime infiltration
The study of infiltration by organised crime groups of legal businesses faces several methodological challenges. The criminal infiltration of legal businesses is not criminalised in European countries. Therefore, neither legal definitions of the phenomenon nor police or judicial data are available at European and country level.
For the purpose of Project ARIEL, ‘infiltration of an organised crime group into a legitimate business’ means:
any case in which a natural person belonging to a criminal organisation or acting on its behalf, or an already infiltrated legal person, invests financial and/or human resources to participate in the decision-making process of a legitimate business.
Building on Europol’s definition of serious and organised crime (Europol, 2013a), ‘organised crime group’ refers to any criminal actor – from large organisations to loose networks of collaborating criminals – that falls under the definition provided by the EU Framework Decision on the Fight against Organised Crime (2008/841/JHA)5 and/or is involved in serious crimes as identified by art. 83(1) of the Treaty on the Functioning of the European Union.6
Such broad definitions of organised crime have been criticised for their vagueness (Calderoni, 2008; Finckenauer, 2005; Hagan, 2006; Maltz, 1996). However, they make it possible to include a broad range of criminal organisations in the analysis, and to take account of the differences among European countries. Similarly, the broad definition of OCG infiltration of legal businesses makes it possible to include in the analysis a variety of legal businesses controlled and managed by organised criminals in the five countries covered by the project.
Operationalisation of organised crime infiltration
The definition of organised crime infiltration was operationalised to collect information and case studies. The following four elements need to be present to identify a reference or a case study of criminal infiltration:
• A criminal organisation;
• A natural person belonging to a criminal organisation or acting on its behalf, or an already infiltrated legal person;
• The investment of financial and/or human resources;
• The participation in the decision-making process of a legitimate business.
A criminal organisation. An ‘organised crime group’ refers to any criminal actor – from large organisations to loose networks of collaborating criminals – that falls under the definition provided by the EU Framework Decision on the Fight against Organised Crime (2008/841/JHA) and/or is involved in serious crimes as identified by art. 83(1) of the Treaty on the Functioning of the European Union.
A natural person belonging to a criminal organisation or acting on its behalf, or an already infiltrated legal person. The infiltration is carried out by a member of the criminal group or a person who is used as a cover by OCG members and acts as a straw man (e.g. relative, lawyer, notary). A legal person (e.g. cooperative, corporation, company) ultimately controlled by a criminal organisation through a member of the group or a straw man may also conduct the infiltration process.
The investment of financial and/or human resources. The investment of money is not an essential requirement for the criminal infiltration of a legitimate business. Human resources may also be adopted to acquire control over the management (e.g. an OCG member becomes director of a legal company).
The participation in the decision-making process of a legitimate business. The OCG, through a member, a straw man, or an infiltrated legal business, influences the decision-making processes of a legitimate operating business, i.e. it is able to influence decisions about business strategies and future investments, as well as hiring, promotions and salary increases, subcontracting and supply contracts, security and controls.
5. Art. 1 of the 2008 EU Framework Decision on the Fight against Organised Crime defines a criminal organisation as: ‘a structured association, established over a period of time, of more than two persons acting in concert with a view to committing offences which are punishable by deprivation of liberty or a detention order of a maximum of at least four years or a more serious penalty, to obtain, directly or indirectly, a financial or other material benefit’ (Council of the European Union, 2008).
6. Art. 83(1) of the Treaty on the Functioning of the European Union identify serious crimes as: ‘terrorism, trafficking in human beings and sexual exploitation of women and children, illicit drug trafficking, illicit arms trafficking, money laundering, corruption, counterfeiting of means of payment, computer crime and organised crime’ (European Union, 2012).

20
1.4 Structure of the report
This report is organised into two parts. Part I maps OCG infiltration in the five countries covered by the project. In particular, Chapter 2 describes the territories and business sectors with references to criminal infiltration in legal businesses and their main features. For each country, in Chapters 3 to 7 a targeted profile identifies the regions and business sectors affected by the phenomenon and the criminal actors involved. Part II focuses on the drivers of infiltration (Chapter 8), the step-by-step infiltration process (Chapter 9), and the control and management strategies of infiltrated businesses (Chapters 10 and 11, respectively). Finally, Chapter 12 summarises the vulnerabilities of legitimate businesses to OCG infiltration as they emerged from the analyses presented in previous chapters. It then identifies risk factors to be included in a common risk assessment model to detect criminal infiltration of legal businesses in EU member states.

21

22
PART I. Mapping organised crime infiltration in legitimate businessesPrevious studies on OCG investments in the legal economy have used data on confiscated assets as proxies for criminal investments (Kruisbergen, Kleemans, & Kouwenberg, 2015; Riccardi, 2014; Schneider, 2004; Transcrime, 2013b; van Duyne & Soudijn, 2009). Yet, the use of such data may lead to underestimation of certain types of assets because of the focus of law enforcement investigations on specific assets or the regulations on asset recovery (Savona & Riccardi, 2015). Furthermore, data on confiscated assets may provide an outdated analysis of criminal investments because of the time that elapses between the investment and the final confiscation (Transcrime, 2013b).
A recent study on organised crime investments in Europe has highlighted further issues in the case of cross-country analyses of criminal investments in the legal economy (Savona & Riccardi, 2015). First, regulations and practices on asset recovery vary across European countries. Second, only a few countries produce statistics on confiscated assets. Finally, data on confiscated assets tend to over represent movable assets (e.g. cash and bank accounts) and underestimate real estate properties and legal businesses (Savona & Riccardi, 2015).
The study of criminal infiltration of legal businesses cannot rely on data on confiscated assets. The first part of this report builds on previous studies on organised crime investments in Europe (Savona & Riccardi, 2015) and analyses references of OCG infiltration in legitimate businesses from a variety of open sources, i.e. academic studies, judicial files, LEA reports and police operation files, institutional reports, newspaper articles (Figure 1).
Figure 1. Percentage of references to OCG infiltration in open sources by type of source
figure 1
figure 2
figure 3
figure 10
figure 15
figure 18
figure 19
figure 20
Figure 24
figure 27
figure 31
figure 32
figure 34
figure 35
figure 36
figure 37
figure 39
figure 40
figure 41
figure 42
figure 43
figure 45
figure 46
figure 47
figure 48
figure 49
figure 50
figure 51
9.2%
49.8%
1.3%
17.1%
22.5%
54.8%25.4%
3.1%
5.9%
10.8%
27%
25%
1%
15%
32%
43%
33%
20%
3% 1%
20%
1%3%
5%
70%
100%90%80%70%60%50%40%30%20%10%
0%2002
4
1
3
2
3
1
1
4
15
1
62
2
47
1
139 89 40
2
5 3 39
2003 2004 2005 2006 2007 2008 2009 2010 2011 2012 2013 2014*
21%
15%
1%4%
59%
21
11
8
20
10
164
34
35
43
23
20
25
15
10
5
01 2 3 4 5 6 7 8 9 10 >10
21%
16%
22%
21%
19%
70%80%90%
100%
40%50%60%
20%30%
10%0%
70%80%90%
100%
40%50%60%
20%30%
10%0%
Italy (N=164)
Slovenia(N=35)
Sweden(N=43)
UK(N=23)
TheNetherlands
(N=34)
Italy (N=21)
Slovenia(N=8)
Sweden(N=20)
UK(N=10)
TheNetherlands
(N=11)
Italy Slovenia Sweden UKTheNetherlands
70% 14
5
62
40%
50%
60%
20%
30%
10%
0%
600
500
400
300
200
100
0
0.20%
0.30%
0.10%
0.50%
0.60%
0.70%
0.80%
0.40%
0.00%2002
0.72%
0.51%
0.26%
0.47%0.56%
0.33%
0.44% 0.47%0.39%
0.36%
0.58%0.52%
0.24%
2003 2004 2005 2006 2007 2008 2009 2010 2011 2012 2013 2014*
38
6
10
5
7
70%80%90%
100%
94
25
19
35
2
40%50%60%
20%30%
10%0%
Italy (N=164)
Slovenia(N=35)
Sweden(N=43)
UK(N=23)
TheNetherlands
(N=34)
Public limited companies
Private limited companies
Partnerships
Sole traders
Other legal forms
NA
20% 40% 60% 80% 100%0%
figure 44
70%80%90%
100%
40%50%60% 90
11
22 26
17
20%30%
10%0%
Italy (N=164)
Slovenia(N=35)
Sweden(N=43)
UK(N=23)
TheNetherlands
(N=34)
10
12
6
8
4
2
14
16
0Money
launderingFraud OtherFormally legal
activitiesConcealment
of illegal activities
4 43
5
15
Italy (N=164)
Slovenia(N=35)
Sweden(N=43)
UK(N=23)
TheNetherlands
(N=34)
70%80%90%
100%
40%50%60%
20%30%
10%0%
40%
50%
20%
30%
10%
0%Italy
(N=137)Slovenia(N=32)
Sweden(N=34)
UK(N=18)
70%80%90%
100%
40%50%60%
20%30%
10%0%
Italy (N=21)
Slovenia(N=8)
Sweden(N=20)
UK(N=10)
TheNetherlands
(N=11)
Italy(N=164)
Slovenia(N=35)
Sweden(N=43)
UK(N=23)
TheNetherlands
(N=34)
Italy(N=164)
Slovenia(N=35)
Sweden(N=43)
UK(N=23)
TheNetherlands
(N=34)
70%80%90%
100%
40%50%60%
20%30%
10%0%
70%80%90%
100%
40%50%60%
20%30%
10%0%
30%
24.9%0.8%
Academic study Judicial evidence
LEA report Media Other
N = 2,380
N = 2,380
N = 2,380
N = 1,305
N = 604
Institutional report
15%
29%
0.4%
Local OCGs Motorcycles gangsItalian mafias
Other OCGs NA
Italy SloveniaThe Netherlands
Sweden UK
Academic study
Judicial evidence LEA report Media
Institutional report
Academic study
LEA report Media
No. criminal charges with references to OCGs % OCGs in relation to all criminal charges
% O
CGs
in re
latio
n to
all
crim
inal
cha
rges
Other
Institutional report
No.
crim
inal
cha
rges
with
refe
renc
es to
OCG
s
Academic study
Judicial evidence LEA report Media
Institutional report
N = 74
23%
24%
20%
32%
1% N = 140
N = 257
N = 70
N = 299
Academic study
LEA report Media Other
Institutional report
No. filed criminal complaints for money laudering offences with references to OCGs
No. filed criminal complaints for money laudering offences without references to OCGs
Academic study
Judicial evidence LEA report Media
Institutional report
Italy SloveniaThe Netherlands
Sweden UK
Italy SloveniaThe Netherlands
Sweden UK
Money laundering FraudFormally legal activities
Concealment of illegal activities Other
Money laundering FraudFormally legal activities
New business NAAlready existing business
Concealment of illegal activities Other
90
53
19
24
9
14
4
30
15
29
21
20% 40% 60% 80% 100%0%
Public limitedcompanies
Private limitedcompanies
Partnerships
Sole traders
Other legal forms
NA
Italy SloveniaThe Netherlands
UKSweden
Public limitedcompanies
Private limitedcompanies
Partnerships
Sole traders
Otherlegal forms
NA
20% 40% 60% 80% 100%0%
Cosa Nostra (N=14) Camorra (N=74)‘Ndrangheta (N=47)
Other Italian (N=13)Chinese (N=16)
Money laundering Fiscal fraudFormally legal activities
Corporate fraud OtherConcealment of illegal activities
Relatives Legal entrepreneursProfessionals
Women among shareholders Women as majority shareholders
Legal companies
53
7
6
14
98
3
1
8
4
1
Small LargeMedium Very large NA
Italy SloveniaThe Netherlands
Sweden UK
0 4-101-3 11-20 >20 NA
Source: Transcrime elaboration on DCI data
A systematic review of the literature collected information on OCG infiltration of legal businesses in Italy, the Netherlands, Slovenia, Sweden and United Kingdom between 2005 and 2013. When the date of infiltration was unclear, the date of the source was taken as a proxy (Savona & Riccardi, 2015).
Database on OCG infiltration
The Database on Criminal Infiltration (DCI) contains references to OCG infiltration in legal businesses in the five countries covered by the project. It stores the information collected during the review of the literature on OCG infiltration in legal businesses. It records details on the geographic location of the infiltration (NUTS 3 detail), the business sector of the infiltrated business (NACE 2-digit detail), and the criminal organisation involved.
Building on previous studies (Savona & Riccardi, 2015), each source may generate more than one reference, e.g. when a document reports a case of infiltration in various business sectors by the same criminal organisation (Box 1). In several cases, the documents lack information on the number of legal businesses infiltrated by OCGs. Therefore, the references do not necessarily correspond to a single business entity.

23
figure 1
figure 2
figure 3
figure 10
figure 15
figure 18
figure 19
figure 20
Figure 24
figure 27
figure 31
figure 32
figure 34
figure 35
figure 36
figure 37
figure 39
figure 40
figure 41
figure 42
figure 43
figure 45
figure 46
figure 47
figure 48
figure 49
figure 50
figure 51
9.2%
49.8%
1.3%
17.1%
22.5%
54.8%25.4%
3.1%
5.9%
10.8%
27%
25%
1%
15%
32%
43%
33%
20%
3% 1%
20%
1%3%
5%
70%
100%90%80%70%60%50%40%30%20%10%
0%2002
4
1
3
2
3
1
1
4
15
1
62
2
47
1
139 89 40
2
5 3 39
2003 2004 2005 2006 2007 2008 2009 2010 2011 2012 2013 2014*
21%
15%
1%4%
59%
21
11
8
20
10
164
34
35
43
23
20
25
15
10
5
01 2 3 4 5 6 7 8 9 10 >10
21%
16%
22%
21%
19%
70%80%90%
100%
40%50%60%
20%30%
10%0%
70%80%90%
100%
40%50%60%
20%30%
10%0%
Italy (N=164)
Slovenia(N=35)
Sweden(N=43)
UK(N=23)
TheNetherlands
(N=34)
Italy (N=21)
Slovenia(N=8)
Sweden(N=20)
UK(N=10)
TheNetherlands
(N=11)
Italy Slovenia Sweden UKTheNetherlands
70% 14
5
62
40%
50%
60%
20%
30%
10%
0%
600
500
400
300
200
100
0
0.20%
0.30%
0.10%
0.50%
0.60%
0.70%
0.80%
0.40%
0.00%2002
0.72%
0.51%
0.26%
0.47%0.56%
0.33%
0.44% 0.47%0.39%
0.36%
0.58%0.52%
0.24%
2003 2004 2005 2006 2007 2008 2009 2010 2011 2012 2013 2014*
38
6
10
5
7
70%80%90%
100%
94
25
19
35
2
40%50%60%
20%30%
10%0%
Italy (N=164)
Slovenia(N=35)
Sweden(N=43)
UK(N=23)
TheNetherlands
(N=34)
Public limited companies
Private limited companies
Partnerships
Sole traders
Other legal forms
NA
20% 40% 60% 80% 100%0%
figure 44
70%80%90%
100%
40%50%60% 90
11
22 26
17
20%30%
10%0%
Italy (N=164)
Slovenia(N=35)
Sweden(N=43)
UK(N=23)
TheNetherlands
(N=34)
10
12
6
8
4
2
14
16
0Money
launderingFraud OtherFormally legal
activitiesConcealment
of illegal activities
4 43
5
15
Italy (N=164)
Slovenia(N=35)
Sweden(N=43)
UK(N=23)
TheNetherlands
(N=34)
70%80%90%
100%
40%50%60%
20%30%
10%0%
40%
50%
20%
30%
10%
0%Italy
(N=137)Slovenia(N=32)
Sweden(N=34)
UK(N=18)
70%80%90%
100%
40%50%60%
20%30%
10%0%
Italy (N=21)
Slovenia(N=8)
Sweden(N=20)
UK(N=10)
TheNetherlands
(N=11)
Italy(N=164)
Slovenia(N=35)
Sweden(N=43)
UK(N=23)
TheNetherlands
(N=34)
Italy(N=164)
Slovenia(N=35)
Sweden(N=43)
UK(N=23)
TheNetherlands
(N=34)
70%80%90%
100%
40%50%60%
20%30%
10%0%
70%80%90%
100%
40%50%60%
20%30%
10%0%
30%
24.9%0.8%
Academic study Judicial evidence
LEA report Media Other
N = 2,380
N = 2,380
N = 2,380
N = 1,305
N = 604
Institutional report
15%
29%
0.4%
Local OCGs Motorcycles gangsItalian mafias
Other OCGs NA
Italy SloveniaThe Netherlands
Sweden UK
Academic study
Judicial evidence LEA report Media
Institutional report
Academic study
LEA report Media
No. criminal charges with references to OCGs % OCGs in relation to all criminal charges
% O
CGs
in re
latio
n to
all
crim
inal
cha
rges
Other
Institutional report
No.
crim
inal
cha
rges
with
refe
renc
es to
OCG
s
Academic study
Judicial evidence LEA report Media
Institutional report
N = 74
23%
24%
20%
32%
1% N = 140
N = 257
N = 70
N = 299
Academic study
LEA report Media Other
Institutional report
No. filed criminal complaints for money laudering offences with references to OCGs
No. filed criminal complaints for money laudering offences without references to OCGs
Academic study
Judicial evidence LEA report Media
Institutional report
Italy SloveniaThe Netherlands
Sweden UK
Italy SloveniaThe Netherlands
Sweden UK
Money laundering FraudFormally legal activities
Concealment of illegal activities Other
Money laundering FraudFormally legal activities
New business NAAlready existing business
Concealment of illegal activities Other
90
53
19
24
9
14
4
30
15
29
21
20% 40% 60% 80% 100%0%
Public limitedcompanies
Private limitedcompanies
Partnerships
Sole traders
Other legal forms
NA
Italy SloveniaThe Netherlands
UKSweden
Public limitedcompanies
Private limitedcompanies
Partnerships
Sole traders
Otherlegal forms
NA
20% 40% 60% 80% 100%0%
Cosa Nostra (N=14) Camorra (N=74)‘Ndrangheta (N=47)
Other Italian (N=13)Chinese (N=16)
Money laundering Fiscal fraudFormally legal activities
Corporate fraud OtherConcealment of illegal activities
Relatives Legal entrepreneursProfessionals
Women among shareholders Women as majority shareholders
Legal companies
53
7
6
14
98
3
1
8
4
1
Small LargeMedium Very large NA
Italy SloveniaThe Netherlands
Sweden UK
0 4-101-3 11-20 >20 NA
Box 1. Example of the coding process
‘During Operation Athena law enforcement agencies dismantled a Camorra clan involved in drug trafficking and seized a transportation company and a business involved in the wholesale of meat products, both registered in Naples’ (DIA, 2012, p. 82).
The DIA report produces two references to OCG infiltration: i) a legal business in the transportation sector in Naples, infiltrated by the Camorra; ii) a legal business involved in wholesale trade in Naples, also infiltrated by the Camorra.
The DCI contains 2,380 references to OCG infiltration in legal businesses in Italy, the Netherlands, Slovenia, Sweden and United Kingdom. Figure 2 shows the distribution of references to OCG infiltration across the five EU MS. More than half of the references concern evidence of criminal infiltration in Italy. Sweden and Slovenia are the two countries with the lowest number of references (140 and 74, respectively).
Figure 2. Percentage of references to OCG infiltration in open sources by country
Source: Transcrime elaboration on DCI data
The number of references also varies across organised crime groups (Figure 3). Italian mafias are involved in about half of the mentions of OCG infiltration. Local OCGs refer to British, Dutch, Slovenian and Swedish criminals in their own country. They also include Italian
criminal groups other than mafia organisations. Other OCGs refer to foreign criminal groups active in the five EU MS.
Figure 3. Percentage of references to OCG infiltration in open sources by type of OCG
Source: Transcrime elaboration on DCI data
Given the wide definition of OCG infiltration, the variety of sources, and the diverse nature of the information collected, the results of the analysis of the DCI should be interpreted carefully. First, references to OCG infiltra-tion of legal businesses do not correspond to single in-filtrated businesses. Therefore, they cannot be counted and analysed from a strict statistical standpoint.
Four categories were created to analyse the referenc-es of OCG infiltration in legal businesses across regions and business sectors, i.e. ‘< Mean-0.5 SD’ (x ≤ mean - 0.5 ∙ standard deviation), ‘Mean-0.5 SD~Mean’ (mean - 0.5 ∙ standard deviation < x ≤ mean), ‘Mean~Mean+0.5 SD’ (mean < x ≤ mean + 0.5 ∙ standard deviation), and ‘> Mean+0.5 SD’ (x > mean + 0.5 ∙ standard deviation). The four categories are intended to provide a general understanding of the distribution of references across territories and business sectors, rather than identify those at low and high risk of criminal infiltration.
Second, the information recorded in the DCI may partly reflect differences in priorities and levels of awareness and interest by local and national institutions, LEAs, scholars, and the media. Therefore, in some cases a relatively high number of references may be indicative of greater attention to organised and economic crime by national agencies and the media.
The lack of centralised data on OCG investments in legal economies presents methodological limitations.

24
Nonetheless, the broad variety of open sources has provided a useful, albeit preliminary, understanding of OCG infiltration in legitimate businesses in the five EU MS. The references are used as proxies for OCG infiltration and provide a very preliminary mapping of the activities of different organised crime groups across different sectors and different territories. In particular, they provide insights into various aspects of criminal infiltration of legal businesses, both at aggregate (Chapter 2) and country level (Chapters 3 to 7):
• The territories with evidence of infiltration;
• The infiltrated business sectors;
• The actors involved in the infiltration.
2. Organised crime infiltration in 5 EU countries7
2.1. Infiltrated territories
The DCI collects 2,380 references to OCG infiltration of legal businesses in the five countries covered by the project. Since such references cannot be counted and analysed from a strict statistical standpoint, four categories were created to identify regional and sectoral differences in OCG infiltration in Italy, the Netherlands, Slovenia, Sweden, and the United Kingdom.
Figure 2 above shows the distribution of references across the five EU MS. Some differences emerge in terms of references to OCG infiltration recorded by the literature. Italy gathers most of the references collected (55% of the whole DCI). Sweden and Slovenia are the two countries where lower numbers of references were found (6% and 3% of the whole DCI, respectively). These results may reflect differences in the incidence of the phenomenon in the five countries. At the same time, they may be biased by variations in the amount of data and information available and in the attention devoted to the phenomenon by scholars, LEAs, and the media.
Figure 4 shows the references to OCG infiltration in legal businesses across regions. Each region is compared with its country’s total. Some territories emerge as characterised by several references to criminal infiltration:
• Southern Italian regions with a traditional mafia presence (i.e. Sicily, Calabria, and Campania), Lazio and Lombardy, two of the most populated and richest regions and those where police operations against OCGs have concentrated in recent years;
• North and South Holland, where the two largest cities of the country (i.e. Amsterdam and Rotterdam), as well as the main transport facilities (i.e. harbours and airports), are located;
• Western Slovenia, due to the high number of references to the Slovenian capital, Ljubljana;
• The Stockholm and Malmö regions in Sweden, which represent the first and third largest metropolitan areas respectively and the regions where the vast majority of economic activities are conducted;
• South-Western Scotland (particularly Glasgow) and the London area in the UK, i.e. thriving business areas.
Figure 4. Number of references to OCG infiltration in open sources by region (NUTS 2). Percentage of the country total8
None
<2%
3-8%
9-14%
>14%
References to OCG infiltration. % of country total (N=1,480)
Source: Transcrime elaboration on DCI data
7. With the collaboration of Lorella Garofalo and Giulia Berlusconi (Università Cattolica del Sacro Cuore-Transcrime, Italy)
8. The number of references to OCG infiltration with information on the regions (NUTS 2) does not correspond with the total number of references. Details on the geographic location of the infiltration (NUTS 2) are available for 1,069 references in Italy, 125 references in the Netherlands, 69 references in Slovenia, 49 references in Sweden, and 168 references in the United Kingdom.

25
Table 1. Top 3 regions (NUTS 2 and NUTS 3) for references to OCG infiltration in open sources by country
Country NUTS 2 NUTS 3Italy Lombardia; Sicilia; Calabria Milano; Roma; Reggio di CalabriaThe Netherlands Noord-Holland; Zuid-Holland; Limburg Groot-Amsterdam; Groot-Rijnmond; Utrecht
Slovenia Zahodna Slovenija; Vzhodna SlovenijaOsrednjeslovenska; Gorenjska; Goriška; Obal-no-kraška; Savinjska
Sweden Stockholm; Sydsverige; VästsverigeStockholms län; Skåne län; Västra Götalands län
United KingdomSouth Western Scotland; Inner London; North Eastern Scotland
Glasgow City; Aberdeen City and Aberdeen-shire; Durham CC; Inner London - West
Source: Transcrime elaboration on DCI data
Characteristics of infiltrated territories
Previous studies on OCGs investments in the legitimate economy have shown that businesses located in territories with specific characteristics present more
references to infiltration (Transcrime, 2013b; Savona & Riccardi, 2015). Table 2 summarises the main hypotheses on the characteristics of infiltrated territories.
Table 2. Hypotheses on the characteristics of infiltrated territories
OC drivers and/or needs
AssumptionsCharacteristics of territories
Relationship with infiltration
Social consensus; Territory control; Cultural/personal reasons
OCGs invest in businesses operating in the same territory where they are present and active
OC presence Positive
Profit maximis-ation; Territory control
OCGs invest in areas with ‘protected’ economies characterised by low competition levels and low openness to foreign investments
Openness to foreign countries
Negative
Profit maximisation; Social consensus
OCGs invest in areas characterised by traditional economic activities, low technological levels, and low R&D rates
Technology Negative
Territory control; Social consensus
OCGs infiltrate businesses located in areas characterised by low levels of wealth and low levels of infrastructure development
Income Negative
Infrastructural equipment
Negative
Profit maximisation; Concealment of criminal activities
OCGs infiltrate businesses that operate in contexts characterised by high levels of tax evasion, black economy, and economic-financial crimes
Shadow economy Positive
Corruption Positive
Source: Transcrime elaboration
The results confirm those of previous studies (Savona & Riccardi, 2015) highlighting the main characteristics of the regions with more references to OCG investments in the legal economy:
• Territories with a stable, historical presence of criminal groups (e.g. Southern Italy);
• Border regions (e.g. Western Slovenia) and regions with important ports and airports (e.g., North and South Holland);
• Regions with large urban areas (e.g. Milan, London, Amsterdam, Stockholm, Ljubljana).

26
The literature suggests that areas with a historical, well-rooted presence of organised crime groups are likely to present evidence of the involvement of such groups in both illegal and legal markets (Caneppele, Riccardi, & Standridge, 2013; Riccardi, 2014; The Dutch Parliament, 1996; Vander Beken, 2004; Varese, 2011).
OCGs may favour areas characterised by low competition – and thus low openness to international investments and high territorial specificity – in order to benefit from a monopolistic position (Daniele & Marani, 2008). Other characteristics of territories that may favour OCG infiltration in legal businesses include: high incidence of traditional economic activities, low technological levels and low research and development rates (Transcrime, 2013b); high levels of tax evasion and shadow economy; widespread corruption and money laundering activities (Albanese, 2008; Caneppele et al., 2013; Marine, 2010; Riccardi, 2014; Transcrime, 2013b).
OCGs may also exploit the fragility of the industrial, commercial, financial, and banking systems, act as last resort creditors to businesses with financial difficulties and eventually take them over (Bertoni & Rossi,
1997; Masciandro & Ruozi, 1999; Riccardi, 2014). Areas characterised by low income and infrastructural development (i.e. economic affluence) may also be vulnerable to infiltration, whereas wealthy areas may be more difficult to infiltrate (Transcrime, 2013b). Finally, areas with low levels of regulation may facilitate the infiltration by OCGs and the concealment of criminal activities (Albanese, 2008; Blum, Levi, Naylor, & Williams, 1999; FATF, 2004; Suendorf, 2001; Savona & Riccardi, 2015; Vander Beken, 2005).
For each region (NUTS 2) of the five EU MS, the references to OCG infiltration of legal businesses recorded in the DCI were compared with the characteristics of the infiltrated territories. The analysis was performed by comparing a region’s value with both the national average and the European average. Table 3 summarises the results. Dark brown cells indicate that OCG infiltration and a given characteristic are significantly correlated. Medium brown cells indicate the existence of a weak correlation. Light brown cells indicate the existence of an unclear correlation, i.e. the correlation is not significant and the direction of the relationship varies according to the type of basis for comparison (national or European average).
Table 3. Relationship between the references to OCG infiltration in open sources and the characteristics of infiltrated territories
Technology Income Infrastructural equipment Shadow economy Corruption
OCG infiltration +/- +/- + + +
Legend:
Correlation Weak correlation Unclear correlation
9. The references recorded in the DCI were used as proxies for OCG infiltration. The Methodological Annex describes the proxies used to measure the characteristics of the regions of the five EU MS. Correlation tests were carried out to assess the relationship between OCG infiltration
The number of references to OCG infiltration seems greater in those regions characterised by high levels of shadow economy and corruption. High levels of infrastructural development (i.e. the presence of motorways) also seem to be associated with references to OCG infiltration in legal businesses. By contrast, no clear relationship was found between references of criminal infiltration in legal businesses and technological levels and income. Low competition levels and low openness to foreign countries do not seem to be associated with regions that have a greater number of references to OCG infiltration. Among the top 10 regions in terms of number of references to criminal infiltration in the five EU MS, five were among the top 15 exporting regions in 2010 (PBL, 2013).
Figure 5 shows the relationship between references to OCG infiltration in legal businesses and the shadow economy in the regions of the five countries covered by the project. The regions with the highest number of references to OCG infiltration are those areas where the shadow economy is more widespread. Comparison with the European average shows that the areas characterised by the highest levels of shadow economy are Italian regions. Other relevant regions are Sydsverige (Sweden), and Western and Eastern Slovenia. Among the five EU MS, the country with the lowest level of shadow economy is the Netherlands. South Netherlands, Limburg and Flevoland are the regions with the lowest values.
and a given characteristic of the infiltrated territories. The analysis was performed by comparing a region’s value with both the national average and the European (EU 28) average.
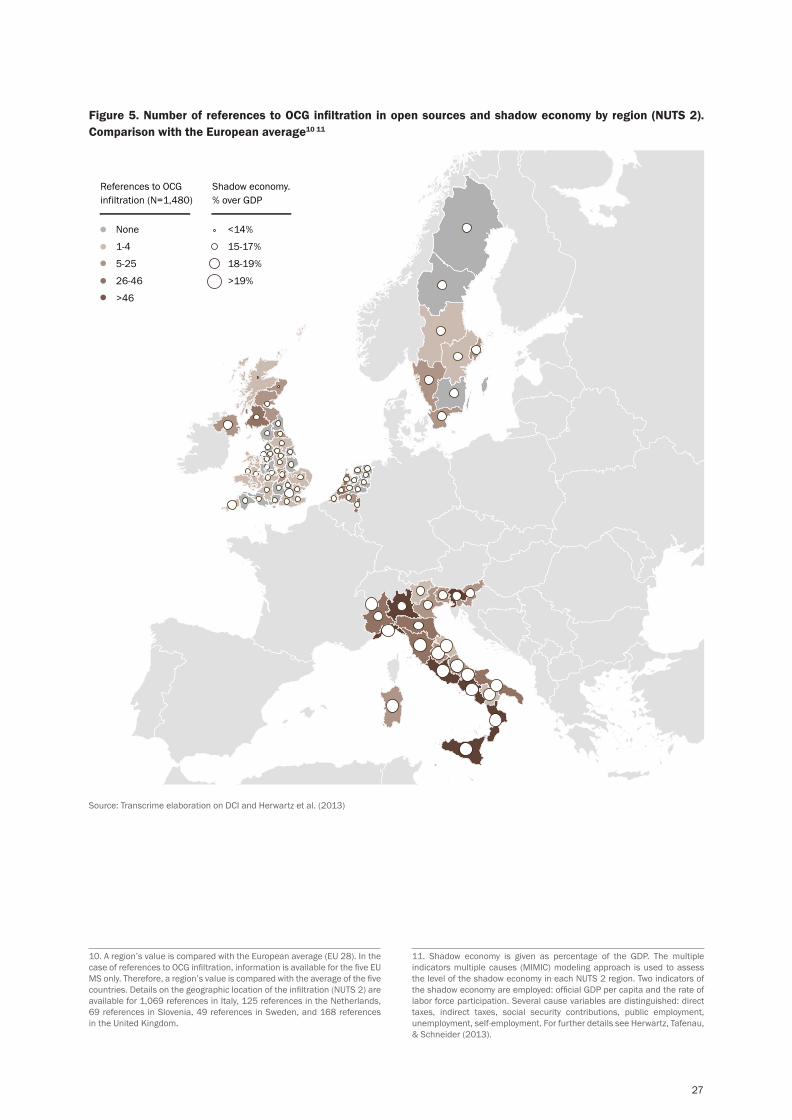
27
10. A region’s value is compared with the European average (EU 28). In the case of references to OCG infiltration, information is available for the five EU MS only. Therefore, a region’s value is compared with the average of the five countries. Details on the geographic location of the infiltration (NUTS 2) are available for 1,069 references in Italy, 125 references in the Netherlands, 69 references in Slovenia, 49 references in Sweden, and 168 references in the United Kingdom.
Figure 5. Number of references to OCG infiltration in open sources and shadow economy by region (NUTS 2). Comparison with the European average10 11
None
1-4
5-25
26-46
>46
References to OCG infiltration (N=1,480)
<14%
15-17%
18-19%
>19%
Shadow economy. % over GDP
11. Shadow economy is given as percentage of the GDP. The multiple indicators multiple causes (MIMIC) modeling approach is used to assess the level of the shadow economy in each NUTS 2 region. Two indicators of the shadow economy are employed: official GDP per capita and the rate of labor force participation. Several cause variables are distinguished: direct taxes, indirect taxes, social security contributions, public employment, unemployment, self-employment. For further details see Herwartz, Tafenau, & Schneider (2013).
Source: Transcrime elaboration on DCI and Herwartz et al. (2013)
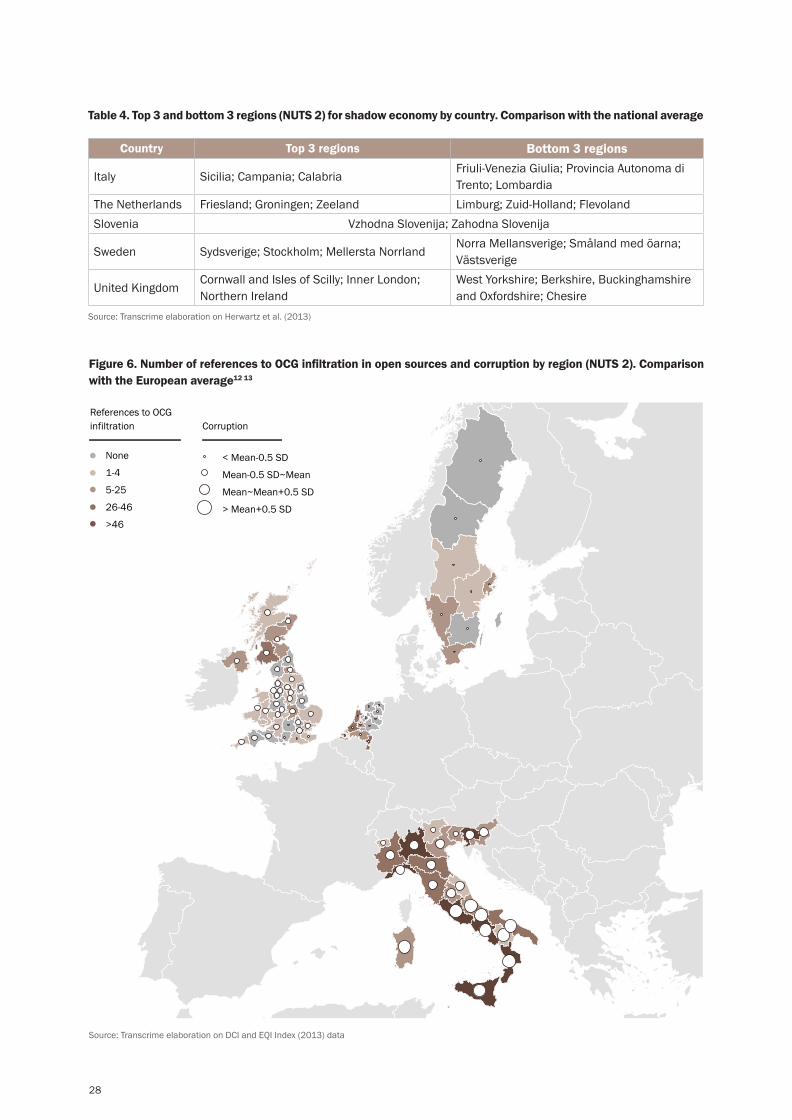
28
Figure 6. Number of references to OCG infiltration in open sources and corruption by region (NUTS 2). Comparison with the European average12 13
Source: Transcrime elaboration on DCI and EQI Index (2013) data
None
1-4
5-25
26-46
>46
References to OCG infiltration
< Mean-0.5 SD
Mean-0.5 SD~Mean
Mean~Mean+0.5 SD
> Mean+0.5 SD
Corruption
Table 4. Top 3 and bottom 3 regions (NUTS 2) for shadow economy by country. Comparison with the national average
Country Top 3 regions Bottom 3 regions
Italy Sicilia; Campania; CalabriaFriuli-Venezia Giulia; Provincia Autonoma di Trento; Lombardia
The Netherlands Friesland; Groningen; Zeeland Limburg; Zuid-Holland; FlevolandSlovenia Vzhodna Slovenija; Zahodna Slovenija
Sweden Sydsverige; Stockholm; Mellersta NorrlandNorra Mellansverige; Småland med öarna; Västsverige
United KingdomCornwall and Isles of Scilly; Inner London; Northern Ireland
West Yorkshire; Berkshire, Buckinghamshire and Oxfordshire; Chesire
Source: Transcrime elaboration on Herwartz et al. (2013)

29
Figure 6 shows the relationship between references to OCG infiltration in legal businesses and corruption in the regions of the five countries covered by the project. The regions with the highest number of references to OCG infiltration seem to be those areas where corruption is most widespread. Comparison with the European
average reveals that the regions characterised by the highest levels of corruption are Italian regions, followed by Western and Eastern Slovenia, and British regions. The Netherlands and Sweden – in particular, Stockholm, Östra Mellansverige and Overijssel regions – are the territories with the lowest levels of corruption.
Table 5. Top 3 and bottom 3 regions (NUTS 2) for corruption by country. Comparison with the national average
Country Top 3 regions Bottom 3 regionsItaly Campania; Calabria; Molise Valle d’Aosta; Provincia Autonoma di
Bolzano; Provincia Autonoma di TrentoThe Netherlands Noord-Holland; Drenthe; Noord-Brabant Utrecht; Friesland; OverijsselSlovenia Vzhodna Slovenija; Zahodna SlovenijaSweden Västsverige; Stockholm; Östra
MellansverigeMellersta Norrland; Övre Norrland; Norra Mellansverige
United Kingdom West Wales and The Valleys; East Wales; Cornwall and Isles of Scilly
Kent; Hampshire and Isle of Wight; Berkshire, Buckinghamshire and Oxfordshire
Source: Transcrime elaboration on EQI Index (2013) data
The analyses do not clarify the relationship between references to OCG infiltration and the regional levels of technology and income. When regional values are compared with the European average (EU 28), the references to OCG infiltration seem to concentrate in areas characterised by levels of technology and income
below the average of European regions. However, within each country, the number of references to OCG infiltration seems to be higher in the regions with high levels of technology and income, compared with the national average (Table 6).
Table 6. Relationship between the references to OCG infiltration in open sources and the characteristics of infiltrated territories. Comparison with the EU and national average
Technology Income
EU average - -National average + +
Source: Transcrime elaboration on DCI and Eurostat data
12. A region’s value is compared with the European average (EU 28). In the case of references to OCG infiltration, information is available for the five EU MS only. Therefore, a region’s value is compared with the average of the five countries. Details on the geographic location of the infiltration (NUTS 2) are available for 1,069 references in Italy, 125 references in the Netherlands, 69 references in Slovenia, 49 references in Sweden, and 168 references in the United Kingdom.
13. Corruption values range from -5 (high corruption) to + 5 (low corruption). It is one of the three dimensions included in the Quality of Government Index. For assessing corruption in a given region, authors carried out a survey over 85,000 respondents asking to which extent they perceive and experience corruption in such services as education, healthcare services, law enforcement and other public sector functions. For further details see Charron (2013).
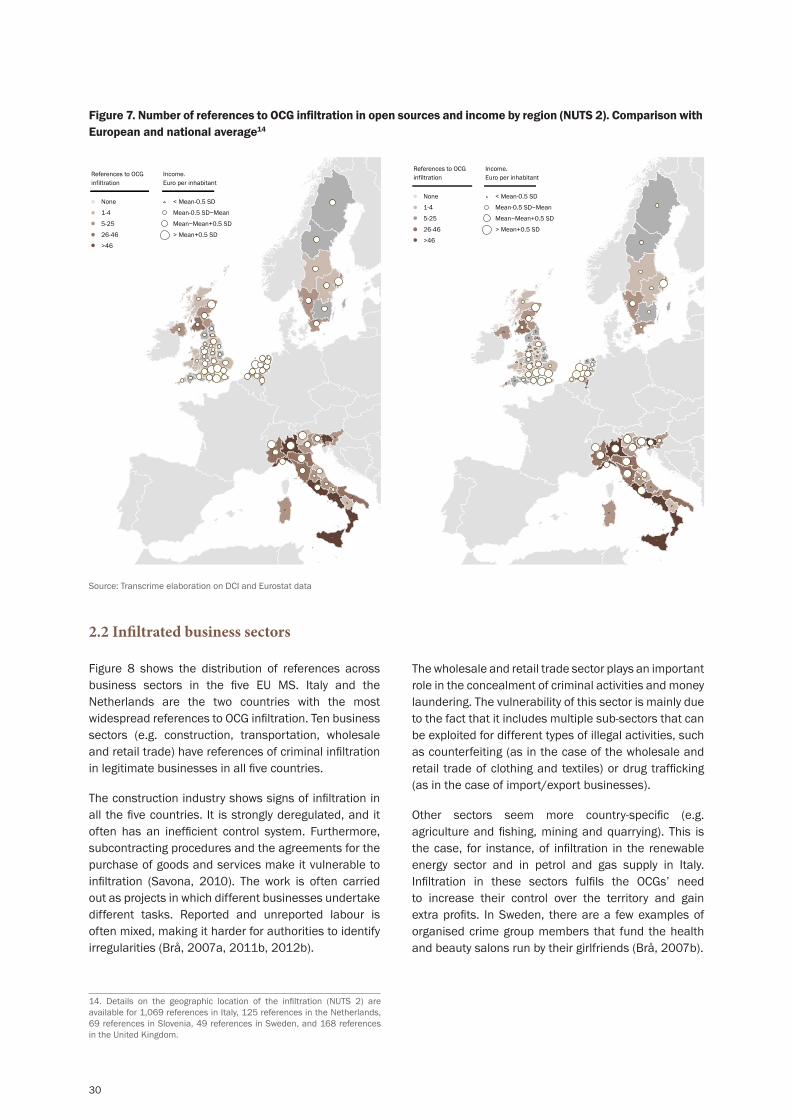
30
None
1-4
5-25
26-46
>46
References to OCG infiltration
< Mean-0.5 SD
Mean-0.5 SD~Mean
Mean~Mean+0.5 SD
> Mean+0.5 SD
Income. Euro per inhabitant
None
1-4
5-25
26-46
>46
References to OCG infiltration
< Mean-0.5 SD
Mean-0.5 SD~Mean
Mean~Mean+0.5 SD
> Mean+0.5 SD
Income. Euro per inhabitant
Figure 7. Number of references to OCG infiltration in open sources and income by region (NUTS 2). Comparison with European and national average14
Source: Transcrime elaboration on DCI and Eurostat data
2.2 Infiltrated business sectors
Figure 8 shows the distribution of references across business sectors in the five EU MS. Italy and the Netherlands are the two countries with the most widespread references to OCG infiltration. Ten business sectors (e.g. construction, transportation, wholesale and retail trade) have references of criminal infiltration in legitimate businesses in all five countries.
The construction industry shows signs of infiltration in all the five countries. It is strongly deregulated, and it often has an inefficient control system. Furthermore, subcontracting procedures and the agreements for the purchase of goods and services make it vulnerable to infiltration (Savona, 2010). The work is often carried out as projects in which different businesses undertake different tasks. Reported and unreported labour is often mixed, making it harder for authorities to identify irregularities (Brå, 2007a, 2011b, 2012b).
The wholesale and retail trade sector plays an important role in the concealment of criminal activities and money laundering. The vulnerability of this sector is mainly due to the fact that it includes multiple sub-sectors that can be exploited for different types of illegal activities, such as counterfeiting (as in the case of the wholesale and retail trade of clothing and textiles) or drug trafficking (as in the case of import/export businesses).
Other sectors seem more country-specific (e.g. agriculture and fishing, mining and quarrying). This is the case, for instance, of infiltration in the renewable energy sector and in petrol and gas supply in Italy. Infiltration in these sectors fulfils the OCGs’ need to increase their control over the territory and gain extra profits. In Sweden, there are a few examples of organised crime group members that fund the health and beauty salons run by their girlfriends (Brå, 2007b).
14. Details on the geographic location of the infiltration (NUTS 2) are available for 1,069 references in Italy, 125 references in the Netherlands, 69 references in Slovenia, 49 references in Sweden, and 168 references in the United Kingdom.

31
15. Details on the business sector (NACE 0-digit) are available for 1,286 references in Italy, 558 references in the Netherlands, 74 references in Slovenia, 114 references in Sweden, and 248 references in the United Kingdom.
Figure 8. Number of references to OCG infiltration in open sources by country and business sector15
Source: Transcrime elaboration on DCI data
Table 7 reports the references to OCG infiltration across business sectors in Italy, the Netherlands, Slovenia, Sweden, and United Kingdom. Sectors with
the highest number of references (i.e. wholesale and retail trade; hotels, bars and restaurants; construction) are those with evidence in all five countries.
Table 7. Business sectors by number of references of OCG infiltration in open sources
Number of references to OCG infiltration
Business sectors
> 184 Wholesale and retail trade; Hotels, bars and restaurants; Construction127-184 Clubs and gambling activities; Transportation; Real estate activities
70-126Financial and insurance activities; Support service activities; Waste and scrap management; Personal service activities
1-69Manufacturing; Agriculture and fishing; Hospitals and residential care; Energy supply; Mining and quarrying; IT services; Public administration
Source: Transcrime elaboration on DCI data

32
The results confirm those of previous studies (Savona & Riccardi, 2015) highlighting the main characteristics of the business sectors with the greater number of references of OCG infiltration:
• Cash-intensive sectors (e.g. bars and restaurants) (Ferentzy & Turner, 2009; Fijnaut & Paoli, 2004);
• Sectors that are territorially specific (e.g., construction, hotels, bars and restaurants, real estate activities) (Riccardi, 2014; Transcrime, 2013b; Unger & Ferwerda, 2011);
• Labour-intensive sectors characterised by low technology (e.g. bars and restaurants; construction) (Calderoni & Riccardi, 2011; Gambetta & Reuter, 1995; Riccardi, 2014);
• Sectors functional to illicit activities (e.g., wholesale and retail trade; clubs and gambling activities; transportation; financial and insurance activities) (Savona & Riccardi, 2015);
• Sectors characterised by weak or developing regulation (e.g. gambling activities; renewable energy; transportation) (Caneppele et al., 2013).
Table 8 reports the number of references to OCG infiltration for each country and business sector compared with the sector average. Most sectors show a higher number of references in Italy. However, some business sectors are more represented in countries other than Italy. For instance, the references to OCG infiltration in the public administration and in legal and professional activities concentrate in the Netherlands; references to OCG infiltration in financial and insurance activities (i.e. cash-in-transit activities) were found in Sweden.
Table 8. Business sectors by country and number of references of OCG infiltration in open sources16
ItalyThe
NetherlandsSlovenia Sweden UK
Agriculture and fishingMining and quarryingManufacturingEnergy supplyWaste and scrap managementConstructionWholesale and retail tradeTransportationHotels, bars and restaurantsIT servicesFinancial and insurance activitiesReal estate activitiesLegal and professional activitiesSupport service activitiesPublic administrationEducationHospitals and residential careClubs and gambling activitiesPersonal service activities
16. In each country, the number of references of OCG infiltration in a business sector is compared with the sector average for the 5 EU MS. Details on the business sector of the infiltration (NACE 1-digit) are available for 1,286 references in Italy, 558 references in the Netherlands, 74 references in Slovenia, 114 references in Sweden, and 248 references in the United Kingdom.
None < Mean-0.5 SD Mean-0.5 SD~Mean Mean~Mean+0.5 SD > Mean+0.5 SD
Legend:
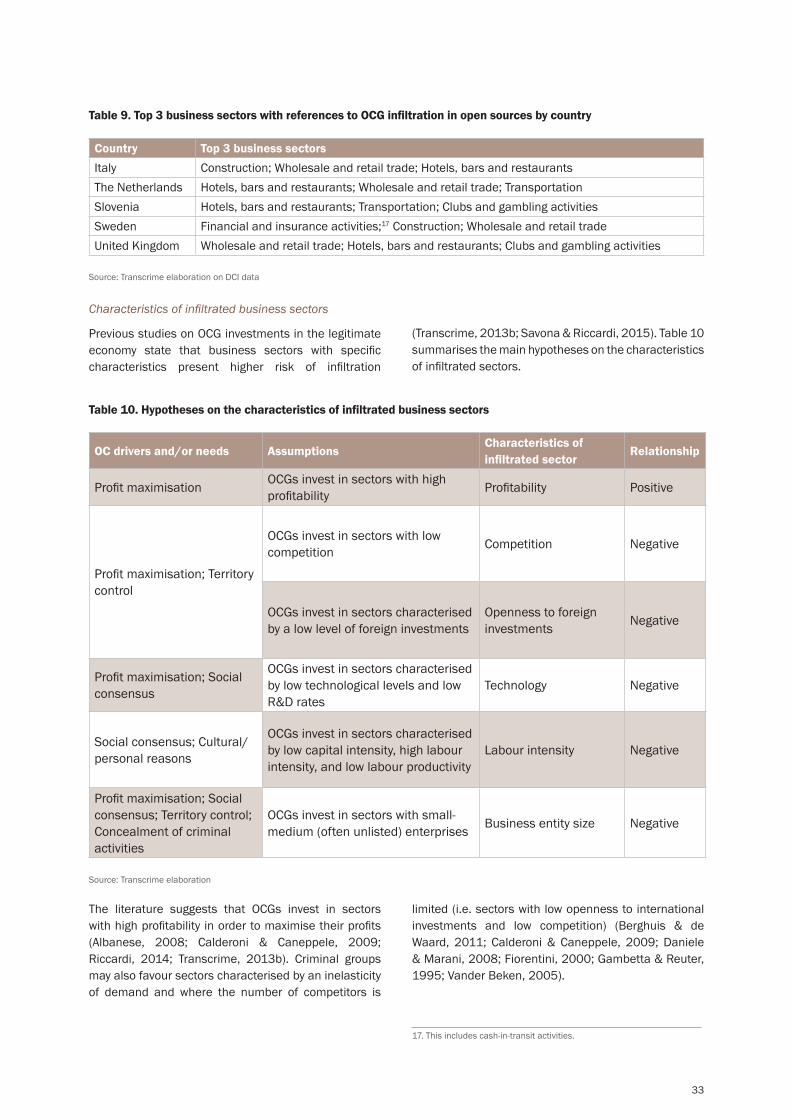
33
Table 9. Top 3 business sectors with references to OCG infiltration in open sources by country
Country Top 3 business sectorsItaly Construction; Wholesale and retail trade; Hotels, bars and restaurantsThe Netherlands Hotels, bars and restaurants; Wholesale and retail trade; TransportationSlovenia Hotels, bars and restaurants; Transportation; Clubs and gambling activitiesSweden Financial and insurance activities;17 Construction; Wholesale and retail tradeUnited Kingdom Wholesale and retail trade; Hotels, bars and restaurants; Clubs and gambling activities
Source: Transcrime elaboration on DCI data
Characteristics of infiltrated business sectors
Previous studies on OCG investments in the legitimate economy state that business sectors with specific characteristics present higher risk of infiltration
(Transcrime, 2013b; Savona & Riccardi, 2015). Table 10 summarises the main hypotheses on the characteristics of infiltrated sectors.
Table 10. Hypotheses on the characteristics of infiltrated business sectors
OC drivers and/or needs AssumptionsCharacteristics of infiltrated sector
Relationship
Profit maximisation OCGs invest in sectors with high profitability Profitability Positive
Profit maximisation; Territory control
OCGs invest in sectors with low competition Competition Negative
OCGs invest in sectors characterised by a low level of foreign investments
Openness to foreign investments Negative
Profit maximisation; Social consensus
OCGs invest in sectors characterised by low technological levels and low R&D rates
Technology Negative
Social consensus; Cultural/personal reasons
OCGs invest in sectors characterised by low capital intensity, high labour intensity, and low labour productivity
Labour intensity Negative
Profit maximisation; Social consensus; Territory control; Concealment of criminal activities
OCGs invest in sectors with small-medium (often unlisted) enterprises Business entity size Negative
Source: Transcrime elaboration
The literature suggests that OCGs invest in sectors with high profitability in order to maximise their profits (Albanese, 2008; Calderoni & Caneppele, 2009; Riccardi, 2014; Transcrime, 2013b). Criminal groups may also favour sectors characterised by an inelasticity of demand and where the number of competitors is
limited (i.e. sectors with low openness to international investments and low competition) (Berghuis & de Waard, 2011; Calderoni & Caneppele, 2009; Daniele & Marani, 2008; Fiorentini, 2000; Gambetta & Reuter, 1995; Vander Beken, 2005).
17. This includes cash-in-transit activities.
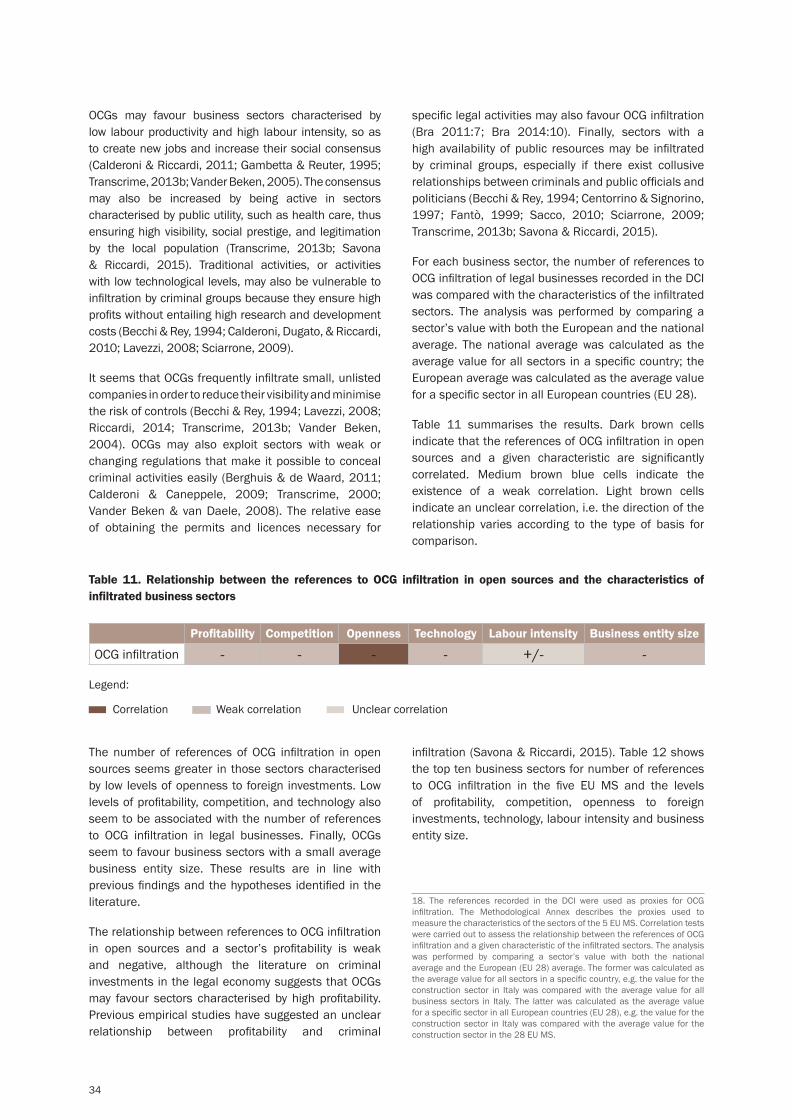
34
OCGs may favour business sectors characterised by low labour productivity and high labour intensity, so as to create new jobs and increase their social consensus (Calderoni & Riccardi, 2011; Gambetta & Reuter, 1995; Transcrime, 2013b; Vander Beken, 2005). The consensus may also be increased by being active in sectors characterised by public utility, such as health care, thus ensuring high visibility, social prestige, and legitimation by the local population (Transcrime, 2013b; Savona & Riccardi, 2015). Traditional activities, or activities with low technological levels, may also be vulnerable to infiltration by criminal groups because they ensure high profits without entailing high research and development costs (Becchi & Rey, 1994; Calderoni, Dugato, & Riccardi, 2010; Lavezzi, 2008; Sciarrone, 2009).
It seems that OCGs frequently infiltrate small, unlisted companies in order to reduce their visibility and minimise the risk of controls (Becchi & Rey, 1994; Lavezzi, 2008; Riccardi, 2014; Transcrime, 2013b; Vander Beken, 2004). OCGs may also exploit sectors with weak or changing regulations that make it possible to conceal criminal activities easily (Berghuis & de Waard, 2011; Calderoni & Caneppele, 2009; Transcrime, 2000; Vander Beken & van Daele, 2008). The relative ease of obtaining the permits and licences necessary for
Table 11. Relationship between the references to OCG infiltration in open sources and the characteristics of infiltrated business sectors
Profitability Competition Openness Technology Labour intensity Business entity size
OCG infiltration - - - - +/- -
Legend:
Correlation Weak correlation Unclear correlation
specific legal activities may also favour OCG infiltration (Bra 2011:7; Bra 2014:10). Finally, sectors with a high availability of public resources may be infiltrated by criminal groups, especially if there exist collusive relationships between criminals and public officials and politicians (Becchi & Rey, 1994; Centorrino & Signorino, 1997; Fantò, 1999; Sacco, 2010; Sciarrone, 2009; Transcrime, 2013b; Savona & Riccardi, 2015).
For each business sector, the number of references to OCG infiltration of legal businesses recorded in the DCI was compared with the characteristics of the infiltrated sectors. The analysis was performed by comparing a sector’s value with both the European and the national average. The national average was calculated as the average value for all sectors in a specific country; the European average was calculated as the average value for a specific sector in all European countries (EU 28).
Table 11 summarises the results. Dark brown cells indicate that the references of OCG infiltration in open sources and a given characteristic are significantly correlated. Medium brown blue cells indicate the existence of a weak correlation. Light brown cells indicate an unclear correlation, i.e. the direction of the relationship varies according to the type of basis for comparison.
The number of references of OCG infiltration in open sources seems greater in those sectors characterised by low levels of openness to foreign investments. Low levels of profitability, competition, and technology also seem to be associated with the number of references to OCG infiltration in legal businesses. Finally, OCGs seem to favour business sectors with a small average business entity size. These results are in line with previous findings and the hypotheses identified in the literature.
The relationship between references to OCG infiltration in open sources and a sector’s profitability is weak and negative, although the literature on criminal investments in the legal economy suggests that OCGs may favour sectors characterised by high profitability. Previous empirical studies have suggested an unclear relationship between profitability and criminal
infiltration (Savona & Riccardi, 2015). Table 12 shows the top ten business sectors for number of references to OCG infiltration in the five EU MS and the levels of profitability, competition, openness to foreign investments, technology, labour intensity and business entity size.
18. The references recorded in the DCI were used as proxies for OCG infiltration. The Methodological Annex describes the proxies used to measure the characteristics of the sectors of the 5 EU MS. Correlation tests were carried out to assess the relationship between the references of OCG infiltration and a given characteristic of the infiltrated sectors. The analysis was performed by comparing a sector’s value with both the national average and the European (EU 28) average. The former was calculated as the average value for all sectors in a specific country, e.g. the value for the construction sector in Italy was compared with the average value for all business sectors in Italy. The latter was calculated as the average value for a specific sector in all European countries (EU 28), e.g. the value for the construction sector in Italy was compared with the average value for the construction sector in the 28 EU MS.
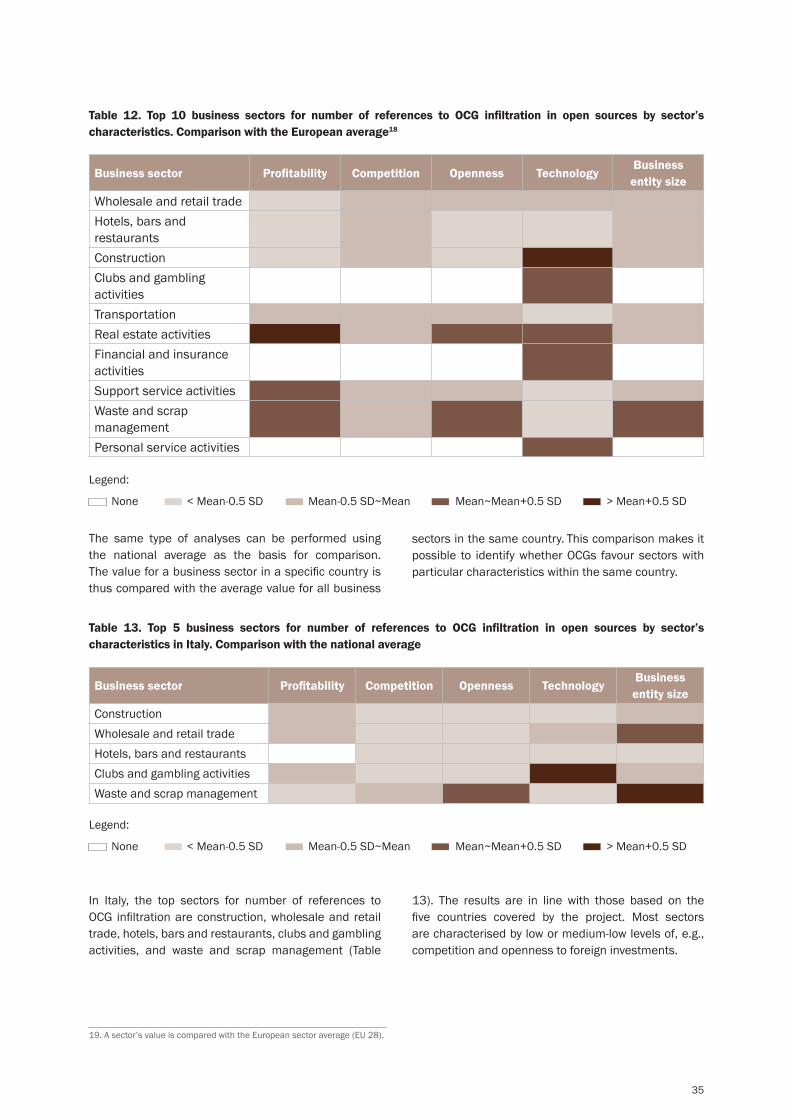
35
Table 12. Top 10 business sectors for number of references to OCG infiltration in open sources by sector’s characteristics. Comparison with the European average18
Business sector Profitability Competition Openness TechnologyBusiness entity size
Wholesale and retail tradeHotels, bars and restaurantsConstructionClubs and gambling activitiesTransportationReal estate activitiesFinancial and insurance activitiesSupport service activitiesWaste and scrap managementPersonal service activities
The same type of analyses can be performed using the national average as the basis for comparison. The value for a business sector in a specific country is thus compared with the average value for all business
sectors in the same country. This comparison makes it possible to identify whether OCGs favour sectors with particular characteristics within the same country.
Table 13. Top 5 business sectors for number of references to OCG infiltration in open sources by sector’s characteristics in Italy. Comparison with the national average
Business sector Profitability Competition Openness TechnologyBusiness entity size
ConstructionWholesale and retail tradeHotels, bars and restaurantsClubs and gambling activitiesWaste and scrap management
19. A sector’s value is compared with the European sector average (EU 28).
In Italy, the top sectors for number of references to OCG infiltration are construction, wholesale and retail trade, hotels, bars and restaurants, clubs and gambling activities, and waste and scrap management (Table
13). The results are in line with those based on the five countries covered by the project. Most sectors are characterised by low or medium-low levels of, e.g., competition and openness to foreign investments.
None < Mean-0.5 SD Mean-0.5 SD~Mean Mean~Mean+0.5 SD > Mean+0.5 SD
Legend:
None < Mean-0.5 SD Mean-0.5 SD~Mean Mean~Mean+0.5 SD > Mean+0.5 SD
Legend:
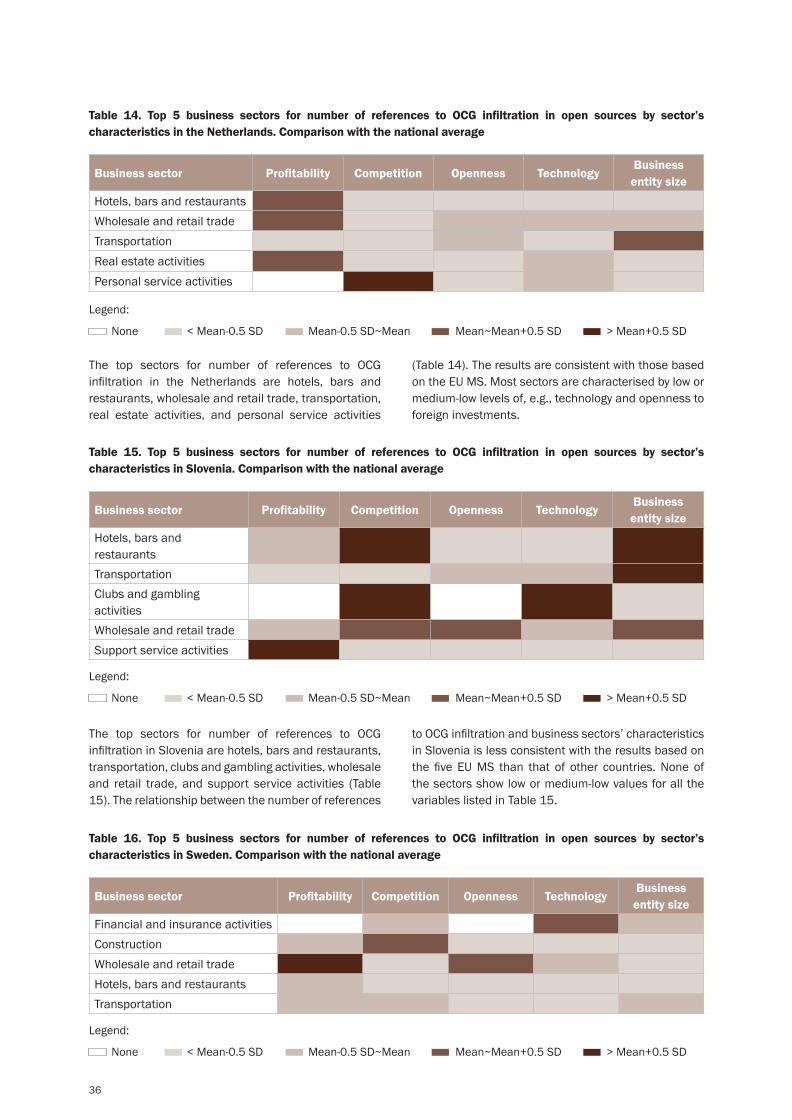
36
Table 14. Top 5 business sectors for number of references to OCG infiltration in open sources by sector’s characteristics in the Netherlands. Comparison with the national average
Business sector Profitability Competition Openness TechnologyBusiness entity size
Hotels, bars and restaurantsWholesale and retail tradeTransportationReal estate activitiesPersonal service activities
The top sectors for number of references to OCG infiltration in the Netherlands are hotels, bars and restaurants, wholesale and retail trade, transportation, real estate activities, and personal service activities
(Table 14). The results are consistent with those based on the EU MS. Most sectors are characterised by low or medium-low levels of, e.g., technology and openness to foreign investments.
Table 15. Top 5 business sectors for number of references to OCG infiltration in open sources by sector’s characteristics in Slovenia. Comparison with the national average
Business sector Profitability Competition Openness TechnologyBusiness entity size
Hotels, bars and restaurantsTransportationClubs and gambling activitiesWholesale and retail tradeSupport service activities
The top sectors for number of references to OCG infiltration in Slovenia are hotels, bars and restaurants, transportation, clubs and gambling activities, wholesale and retail trade, and support service activities (Table 15). The relationship between the number of references
to OCG infiltration and business sectors’ characteristics in Slovenia is less consistent with the results based on the five EU MS than that of other countries. None of the sectors show low or medium-low values for all the variables listed in Table 15.
Table 16. Top 5 business sectors for number of references to OCG infiltration in open sources by sector’s characteristics in Sweden. Comparison with the national average
Business sector Profitability Competition Openness TechnologyBusiness entity size
Financial and insurance activitiesConstructionWholesale and retail tradeHotels, bars and restaurantsTransportation
None < Mean-0.5 SD Mean-0.5 SD~Mean Mean~Mean+0.5 SD > Mean+0.5 SD
Legend:
None < Mean-0.5 SD Mean-0.5 SD~Mean Mean~Mean+0.5 SD > Mean+0.5 SD
Legend:
None < Mean-0.5 SD Mean-0.5 SD~Mean Mean~Mean+0.5 SD > Mean+0.5 SD
Legend:
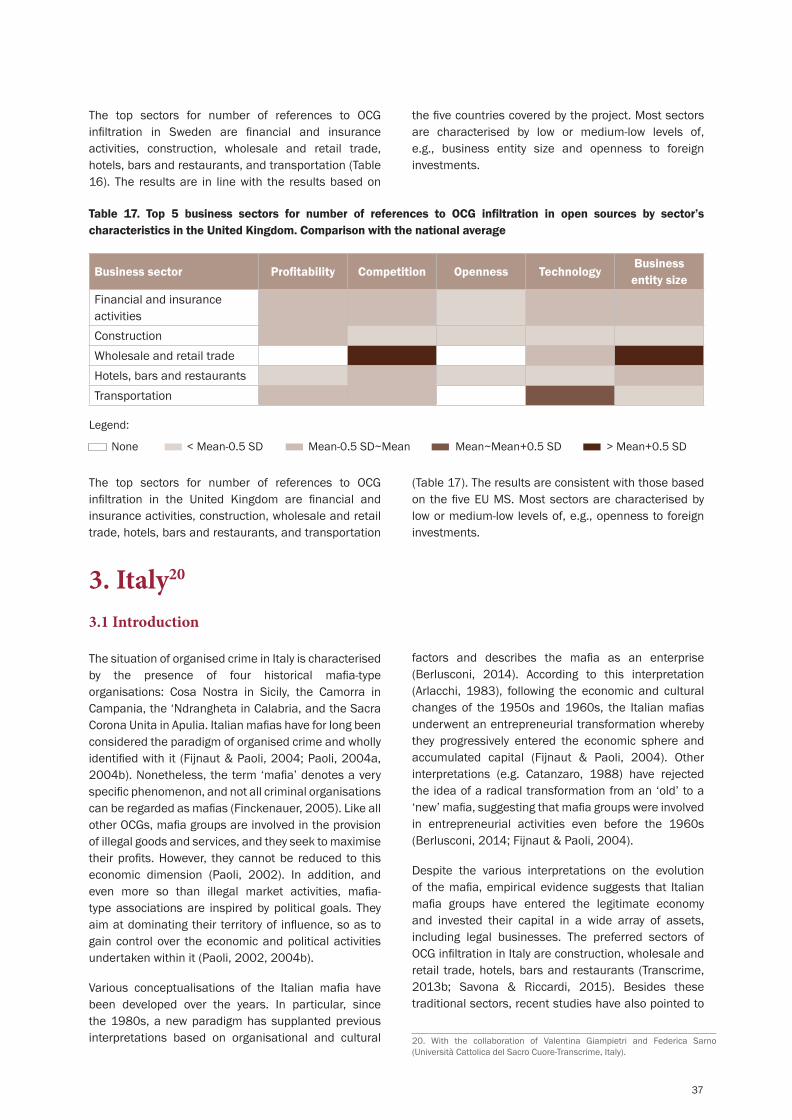
37
The top sectors for number of references to OCG infiltration in Sweden are financial and insurance activities, construction, wholesale and retail trade, hotels, bars and restaurants, and transportation (Table 16). The results are in line with the results based on
the five countries covered by the project. Most sectors are characterised by low or medium-low levels of, e.g., business entity size and openness to foreign investments.
Table 17. Top 5 business sectors for number of references to OCG infiltration in open sources by sector’s characteristics in the United Kingdom. Comparison with the national average
Business sector Profitability Competition Openness TechnologyBusiness entity size
Financial and insurance activitiesConstructionWholesale and retail tradeHotels, bars and restaurantsTransportation
The top sectors for number of references to OCG infiltration in the United Kingdom are financial and insurance activities, construction, wholesale and retail trade, hotels, bars and restaurants, and transportation
(Table 17). The results are consistent with those based on the five EU MS. Most sectors are characterised by low or medium-low levels of, e.g., openness to foreign investments.
3. Italy20
3.1 Introduction
The situation of organised crime in Italy is characterised by the presence of four historical mafia-type organisations: Cosa Nostra in Sicily, the Camorra in Campania, the ‘Ndrangheta in Calabria, and the Sacra Corona Unita in Apulia. Italian mafias have for long been considered the paradigm of organised crime and wholly identified with it (Fijnaut & Paoli, 2004; Paoli, 2004a, 2004b). Nonetheless, the term ‘mafia’ denotes a very specific phenomenon, and not all criminal organisations can be regarded as mafias (Finckenauer, 2005). Like all other OCGs, mafia groups are involved in the provision of illegal goods and services, and they seek to maximise their profits. However, they cannot be reduced to this economic dimension (Paoli, 2002). In addition, and even more so than illegal market activities, mafia-type associations are inspired by political goals. They aim at dominating their territory of influence, so as to gain control over the economic and political activities undertaken within it (Paoli, 2002, 2004b).
Various conceptualisations of the Italian mafia have been developed over the years. In particular, since the 1980s, a new paradigm has supplanted previous interpretations based on organisational and cultural
factors and describes the mafia as an enterprise (Berlusconi, 2014). According to this interpretation (Arlacchi, 1983), following the economic and cultural changes of the 1950s and 1960s, the Italian mafias underwent an entrepreneurial transformation whereby they progressively entered the economic sphere and accumulated capital (Fijnaut & Paoli, 2004). Other interpretations (e.g. Catanzaro, 1988) have rejected the idea of a radical transformation from an ‘old’ to a ‘new’ mafia, suggesting that mafia groups were involved in entrepreneurial activities even before the 1960s (Berlusconi, 2014; Fijnaut & Paoli, 2004).
Despite the various interpretations on the evolution of the mafia, empirical evidence suggests that Italian mafia groups have entered the legitimate economy and invested their capital in a wide array of assets, including legal businesses. The preferred sectors of OCG infiltration in Italy are construction, wholesale and retail trade, hotels, bars and restaurants (Transcrime, 2013b; Savona & Riccardi, 2015). Besides these traditional sectors, recent studies have also pointed to
20. With the collaboration of Valentina Giampietri and Federica Sarno (Università Cattolica del Sacro Cuore-Transcrime, Italy).
None < Mean-0.5 SD Mean-0.5 SD~Mean Mean~Mean+0.5 SD > Mean+0.5 SD
Legend:

38
some emerging sectors, such as renewable energy, and petrol and gas supply (Caneppele et al., 2013; Savona & Riccardi, 2015). Similarly, Italian mafia groups do not restrict their activities to their regions of origin; they are also expanding to other Italian regions, as well as to other European and non-European countries (Allum, 2014; Campana, 2013; Transcrime, 2013b; Savona & Riccardi, 2015).
Methodological remarks
Most of the research on the infiltration of OCGs into the Italian legitimate economy has focused on Italian mafia organisations; whereas only a few studies on foreign OCGs exist. Among them, a study by Iadeluca (2012) explored the organisational structure of foreign criminal organisations in Italy, their illegal activities, and their relationships with Italian mafia groups. A recent study by Savona and Riccardi (Savona & Riccardi, 2015) has instead focused on investments by foreign OCGs in the country.
The issue of infiltration by OCGs – and particularly by Italian mafias – into legitimate businesses has long been a priority for Italian institutions, law enforcement agencies and academic scholars. Over the past thirty years, a large number of legislative measures have been enacted in the country in order to improve the identification and confiscation of criminal assets (Savona & Riccardi, 2015). Despite these developments, the study of OCG infiltration into the Italian legitimate economy still has some limitations.
Most of the existing research consists of qualitative studies (Fantò, 1999; Santino & La Fiura, 1990). A recent study used data on confiscated assets as proxies for mafia investments in the legal economy, and analysed the regions and business sectors in which infiltrated legal businesses and other assets concentrate (Transcrime, 2013b). The analysis of mafia investments in the legal economy has been further expanded by considering other criminal groups active in the country and investments outside Italy (Savona & Riccardi, 2015). Nonetheless, only a few studies have focused on infiltration by OCGs into legitimate businesses, exploring the control and management strategies used by OCGs (Transcrime, 2013b; Savona & Riccardi, 2015).
Drawing on the methodology developed in previous studies (Savona & Riccardi, 2015), different types of documents were collected from various sources, ranging from the scientific literature to open sources. The information recorded was organised in the Database on Criminal Infiltration. The DCI collects 1,305 references to OCG infiltration in legal businesses in Italy from judicial evidence, academic studies, institutional reports, LEA reports and media sources (Figure 9).
Figure 9. Percentage of references to OCG infiltration in open sources by type of source
figure 1
figure 2
figure 3
figure 10
figure 15
figure 18
figure 19
figure 20
Figure 24
figure 27
figure 31
figure 32
figure 34
figure 35
figure 36
figure 37
figure 39
figure 40
figure 41
figure 42
figure 43
figure 45
figure 46
figure 47
figure 48
figure 49
figure 50
figure 51
9.2%
49.8%
1.3%
17.1%
22.5%
54.8%25.4%
3.1%
5.9%
10.8%
27%
25%
1%
15%
32%
43%
33%
20%
3% 1%
20%
1%3%
5%
70%
100%90%80%70%60%50%40%30%20%10%
0%2002
4
1
3
2
3
1
1
4
15
1
62
2
47
1
139 89 40
2
5 3 39
2003 2004 2005 2006 2007 2008 2009 2010 2011 2012 2013 2014*
21%
15%
1%4%
59%
21
11
8
20
10
164
34
35
43
23
20
25
15
10
5
01 2 3 4 5 6 7 8 9 10 >10
21%
16%
22%
21%
19%
70%80%90%
100%
40%50%60%
20%30%
10%0%
70%80%90%
100%
40%50%60%
20%30%
10%0%
Italy (N=164)
Slovenia(N=35)
Sweden(N=43)
UK(N=23)
TheNetherlands
(N=34)
Italy (N=21)
Slovenia(N=8)
Sweden(N=20)
UK(N=10)
TheNetherlands
(N=11)
Italy Slovenia Sweden UKTheNetherlands
70% 14
5
62
40%
50%
60%
20%
30%
10%
0%
600
500
400
300
200
100
0
0.20%
0.30%
0.10%
0.50%
0.60%
0.70%
0.80%
0.40%
0.00%2002
0.72%
0.51%
0.26%
0.47%0.56%
0.33%
0.44% 0.47%0.39%
0.36%
0.58%0.52%
0.24%
2003 2004 2005 2006 2007 2008 2009 2010 2011 2012 2013 2014*
38
6
10
5
7
70%80%90%
100%
94
25
19
35
2
40%50%60%
20%30%
10%0%
Italy (N=164)
Slovenia(N=35)
Sweden(N=43)
UK(N=23)
TheNetherlands
(N=34)
Public limited companies
Private limited companies
Partnerships
Sole traders
Other legal forms
NA
20% 40% 60% 80% 100%0%
figure 44
70%80%90%
100%
40%50%60% 90
11
22 26
17
20%30%
10%0%
Italy (N=164)
Slovenia(N=35)
Sweden(N=43)
UK(N=23)
TheNetherlands
(N=34)
10
12
6
8
4
2
14
16
0Money
launderingFraud OtherFormally legal
activitiesConcealment
of illegal activities
4 43
5
15
Italy (N=164)
Slovenia(N=35)
Sweden(N=43)
UK(N=23)
TheNetherlands
(N=34)
70%80%90%
100%
40%50%60%
20%30%
10%0%
40%
50%
20%
30%
10%
0%Italy
(N=137)Slovenia(N=32)
Sweden(N=34)
UK(N=18)
70%80%90%
100%
40%50%60%
20%30%
10%0%
Italy (N=21)
Slovenia(N=8)
Sweden(N=20)
UK(N=10)
TheNetherlands
(N=11)
Italy(N=164)
Slovenia(N=35)
Sweden(N=43)
UK(N=23)
TheNetherlands
(N=34)
Italy(N=164)
Slovenia(N=35)
Sweden(N=43)
UK(N=23)
TheNetherlands
(N=34)
70%80%90%
100%
40%50%60%
20%30%
10%0%
70%80%90%
100%
40%50%60%
20%30%
10%0%
30%
24.9%0.8%
Academic study Judicial evidence
LEA report Media Other
N = 2,380
N = 2,380
N = 2,380
N = 1,305
N = 604
Institutional report
15%
29%
0.4%
Local OCGs Motorcycles gangsItalian mafias
Other OCGs NA
Italy SloveniaThe Netherlands
Sweden UK
Academic study
Judicial evidence LEA report Media
Institutional report
Academic study
LEA report Media
No. criminal charges with references to OCGs % OCGs in relation to all criminal charges
% O
CGs
in re
latio
n to
all
crim
inal
cha
rges
Other
Institutional report
No.
crim
inal
cha
rges
with
refe
renc
es to
OCG
s
Academic study
Judicial evidence LEA report Media
Institutional report
N = 74
23%
24%
20%
32%
1% N = 140
N = 257
N = 70
N = 299
Academic study
LEA report Media Other
Institutional report
No. filed criminal complaints for money laudering offences with references to OCGs
No. filed criminal complaints for money laudering offences without references to OCGs
Academic study
Judicial evidence LEA report Media
Institutional report
Italy SloveniaThe Netherlands
Sweden UK
Italy SloveniaThe Netherlands
Sweden UK
Money laundering FraudFormally legal activities
Concealment of illegal activities Other
Money laundering FraudFormally legal activities
New business NAAlready existing business
Concealment of illegal activities Other
90
53
19
24
9
14
4
30
15
29
21
20% 40% 60% 80% 100%0%
Public limitedcompanies
Private limitedcompanies
Partnerships
Sole traders
Other legal forms
NA
Italy SloveniaThe Netherlands
UKSweden
Public limitedcompanies
Private limitedcompanies
Partnerships
Sole traders
Otherlegal forms
NA
20% 40% 60% 80% 100%0%
Cosa Nostra (N=14) Camorra (N=74)‘Ndrangheta (N=47)
Other Italian (N=13)Chinese (N=16)
Money laundering Fiscal fraudFormally legal activities
Corporate fraud OtherConcealment of illegal activities
Relatives Legal entrepreneursProfessionals
Women among shareholders Women as majority shareholders
Legal companies
53
7
6
14
98
3
1
8
4
1
Small LargeMedium Very large NA
Italy SloveniaThe Netherlands
Sweden UK
0 4-101-3 11-20 >20 NA
Source: Transcrime elaboration on DCI data
3.2 Drivers
The infiltration of legal businesses by OCGs has several drivers, although, depending on the specific situation, one may prevail over the others (Transcrime, 2013b). The literature points to five main drivers of OCG infiltration into legitimate businesses. These five drivers may influence OCGs in the selection of the business sectors and territories to infiltrate. Nonetheless, not all drivers are necessarily present at the same time (Riccardi, 2014).
Economic profit. OCGs may invest in legitimate businesses in order to maximise profits and obtain considerable earnings. In these cases, sectors with low levels of technological innovation and professional skills are preferred by OCGs because they make it possible to maximise profits while reducing the costs of research and development (Becchi & Rey, 1994). Similarly, sectors with a strong presence of public subsidies (e.g. renewable energy) and public contracts (e.g. waste disposal, public services and transports) may be favoured by OCGs (Fantò, 1999; Transcrime, 2013b). As regards territories, those characterised by a low openness to foreign investments, protected economies and low levels of competition are preferred.
Concealment of criminal activities. Instead of economic profit, OCGs may infiltrate legitimate businesses in order to conceal criminal activities or to hide the origin of illicit funds. When the purpose is money laundering, OCGs may decide to infiltrate sectors with a weak or changing regulation and territories with high levels of tax evasion
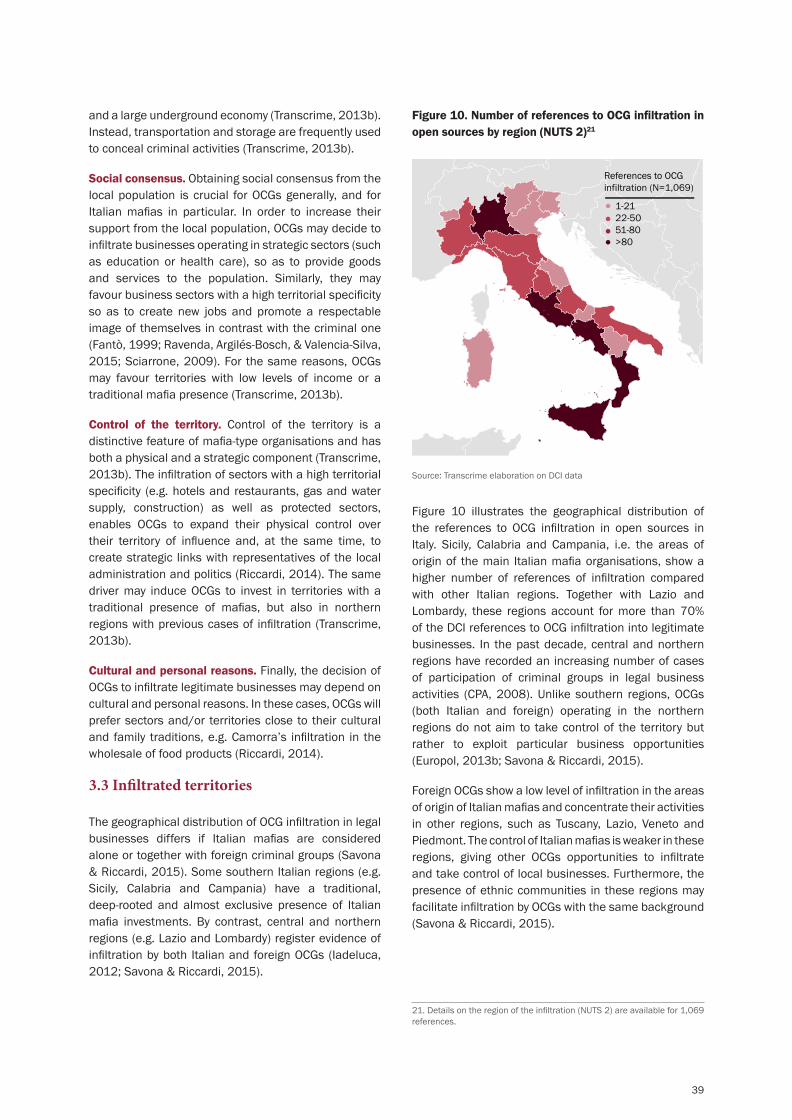
39
and a large underground economy (Transcrime, 2013b). Instead, transportation and storage are frequently used to conceal criminal activities (Transcrime, 2013b).
Social consensus. Obtaining social consensus from the local population is crucial for OCGs generally, and for Italian mafias in particular. In order to increase their support from the local population, OCGs may decide to infiltrate businesses operating in strategic sectors (such as education or health care), so as to provide goods and services to the population. Similarly, they may favour business sectors with a high territorial specificity so as to create new jobs and promote a respectable image of themselves in contrast with the criminal one (Fantò, 1999; Ravenda, Argilés-Bosch, & Valencia-Silva, 2015; Sciarrone, 2009). For the same reasons, OCGs may favour territories with low levels of income or a traditional mafia presence (Transcrime, 2013b).
Control of the territory. Control of the territory is a distinctive feature of mafia-type organisations and has both a physical and a strategic component (Transcrime, 2013b). The infiltration of sectors with a high territorial specificity (e.g. hotels and restaurants, gas and water supply, construction) as well as protected sectors, enables OCGs to expand their physical control over their territory of influence and, at the same time, to create strategic links with representatives of the local administration and politics (Riccardi, 2014). The same driver may induce OCGs to invest in territories with a traditional presence of mafias, but also in northern regions with previous cases of infiltration (Transcrime, 2013b).
Cultural and personal reasons. Finally, the decision of OCGs to infiltrate legitimate businesses may depend on cultural and personal reasons. In these cases, OCGs will prefer sectors and/or territories close to their cultural and family traditions, e.g. Camorra’s infiltration in the wholesale of food products (Riccardi, 2014).
3.3 Infiltrated territories
The geographical distribution of OCG infiltration in legal businesses differs if Italian mafias are considered alone or together with foreign criminal groups (Savona & Riccardi, 2015). Some southern Italian regions (e.g. Sicily, Calabria and Campania) have a traditional, deep-rooted and almost exclusive presence of Italian mafia investments. By contrast, central and northern regions (e.g. Lazio and Lombardy) register evidence of infiltration by both Italian and foreign OCGs (Iadeluca, 2012; Savona & Riccardi, 2015).
Figure 10. Number of references to OCG infiltration in open sources by region (NUTS 2)21
1-2122-5051-80>80
References to OCG infiltration (N=1,069)
Source: Transcrime elaboration on DCI data
Figure 10 illustrates the geographical distribution of the references to OCG infiltration in open sources in Italy. Sicily, Calabria and Campania, i.e. the areas of origin of the main Italian mafia organisations, show a higher number of references of infiltration compared with other Italian regions. Together with Lazio and Lombardy, these regions account for more than 70% of the DCI references to OCG infiltration into legitimate businesses. In the past decade, central and northern regions have recorded an increasing number of cases of participation of criminal groups in legal business activities (CPA, 2008). Unlike southern regions, OCGs (both Italian and foreign) operating in the northern regions do not aim to take control of the territory but rather to exploit particular business opportunities (Europol, 2013b; Savona & Riccardi, 2015).
Foreign OCGs show a low level of infiltration in the areas of origin of Italian mafias and concentrate their activities in other regions, such as Tuscany, Lazio, Veneto and Piedmont. The control of Italian mafias is weaker in these regions, giving other OCGs opportunities to infiltrate and take control of local businesses. Furthermore, the presence of ethnic communities in these regions may facilitate infiltration by OCGs with the same background (Savona & Riccardi, 2015).
21. Details on the region of the infiltration (NUTS 2) are available for 1,069 references.

40
3.4 Infiltrated business sectors
Italy records references to OCG infiltration in open sources in all business sectors, although with different prevalence among the various sectors. In line with previous findings, construction, wholesale and retail trade, and hotels, bars and restaurants are the ones most affected (Figure 11). Other sectors with substantial number of references to OCG infiltration are clubs and gambling activities, waste and scrap management, and support service activities.
Construction is a traditional sector of criminal infiltration in Italy. It has characteristics that are particularly attractive to OCGs, such as low levels of technology, high territorial specificity, and high labour intensity (Transcrime, 2013b; Savona & Riccardi, 2015). Moreover, it registers a large presence of public resources and is closely connected with the procurement process. Subcontracts and forced recruitment of labour are often used to infiltrate public procurement (Savona, 2010).
The wholesale and retail trade sector is targeted by both Italian and foreign OCGs (see also Savona & Riccardi, 2015). In particular, it serves the purposes of concealment of criminal activities and money laundering. The sector, in fact, is characterised by the presence of a wide range of subsectors that can be exploited for illegal activities of different kinds, such as counterfeiting (e.g. in the case of the wholesale and retail trade of clothing and textiles) or drugs trafficking (e.g. in the case of import/export companies) (Lo Bello, 2011; Savona & Riccardi, 2015). Similarly, the means of transport owned by the infiltrated companies can be used for criminal purposes (Transcrime, 2013b).
Like the construction sector, hotels, bars and restaurants have a low technological level and a high territorial specificity, and they are cash-intensive businesses. These characteristics make them vulnerable to OCG infiltration (Transcrime, 2013b; Savona & Riccardi, 2015). In particular, businesses operating in this sector are used for money laundering and as covers for criminal activities. Moreover, the infiltration of bars and restaurants may be instrumental to the establishment of strategic relations with important persons such as public officials and professionals (Riccardi, 2014; Savona & Riccardi, 2015).
Besides traditional sectors, recent studies have also pointed to the growing interest of OCGs in emerging sectors like renewable energy and petrol and gas supply (Europol, 2013b; Savona & Riccardi, 2015). Criminal infiltration in these sectors may serve different purposes, such as control of the territory or the obtainment of extra profits. For example, the presence of EU grants and tax subsidies in the renewable energy sector makes it particularly attractive to OCGs (Europol, 2013b). At the same time, the process of selecting the locations in which to develop renewable energy projects is vulnerable to criminal exploitation, especially in territories where OCGs have strong influence and the public institutions are weak (Caneppele et al., 2013).
Figure 12 describes the distribution of references to OCG infiltration in legitimate businesses across the Italian regions, with the focus on the three most infiltrated sectors. In line with the findings of previous studies (Savona & Riccardi, 2015), highly infiltrated sectors such as construction, wholesale and retail trade, and hotels, bars and restaurants, register references of criminal infiltration not only in traditional mafia areas but also in non-traditional ones. Among non-traditional regions, Lazio and Lombardy are attracting the interest of OCGs due to the presence of attractive business opportunities and economic activities (CPA, 2008).
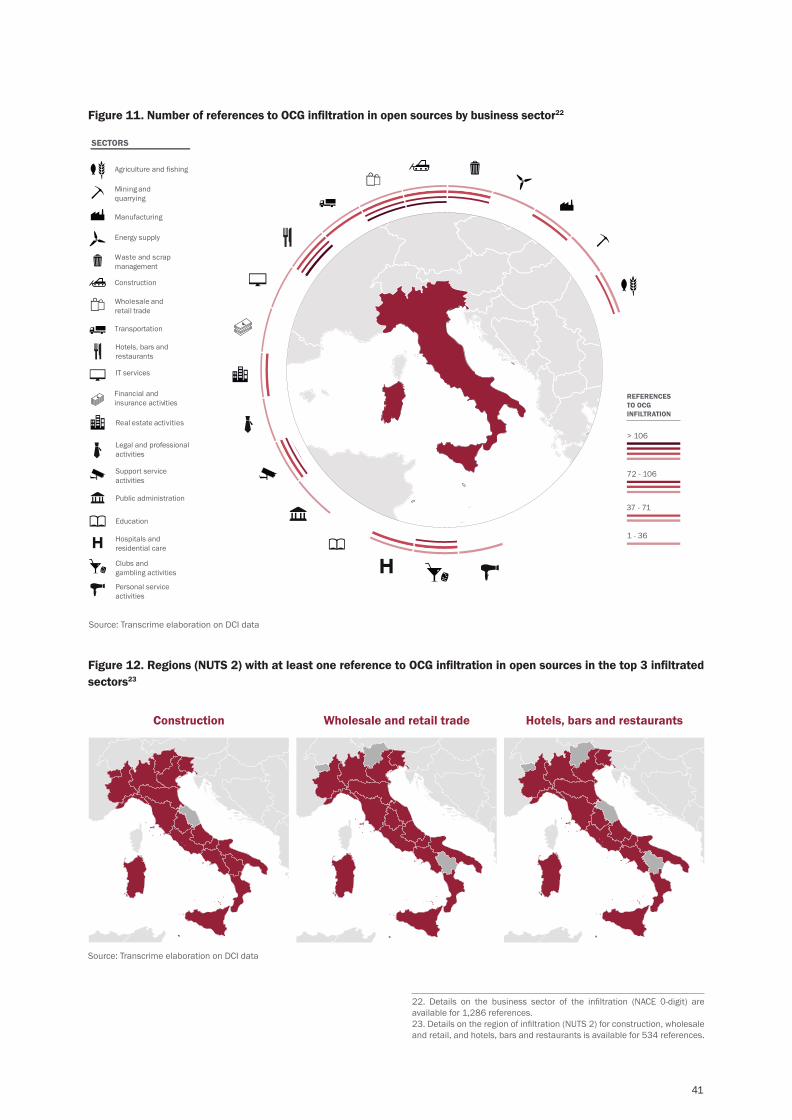
41
Figure 11. Number of references to OCG infiltration in open sources by business sector22
Source: Transcrime elaboration on DCI data
Figure 12. Regions (NUTS 2) with at least one reference to OCG infiltration in open sources in the top 3 infiltrated sectors23
Source: Transcrime elaboration on DCI data
Construction Wholesale and retail trade Hotels, bars and restaurants
22. Details on the business sector of the infiltration (NACE 0-digit) are available for 1,286 references.23. Details on the region of infiltration (NUTS 2) for construction, wholesale and retail, and hotels, bars and restaurants is available for 534 references.
SECTORS
Agriculture and fishing
Construction
IT services
Real estate activities
Public administration
Education
Hospitals and residential care
Legal and professionalactivities
Clubs and gambling activities
Personal serviceactivities
Support service activities
Mining and quarrying
Manufacturing
Energy supply
Waste and scrap management
Wholesale and retail trade
Transportation
Hotels, bars and restaurants
Financial and insurance activities
1 - 36
37 - 71
72 - 106
> 106
REFERENCES TO OCG INFILTRATION

42
3.5 Actors and modi operandi
Table 18 provides an indication of the types of OCGs involved in the infiltration of legitimate businesses in Italy. For each of these groups, the table lists the
business sectors and geographic regions with the highest number of references to infiltration in open sources.
Table 18. Top 5 sectors and top 5 regions (NUTS 2) for number of references to OCG infiltration in open sources by OCG24
OCG Top 5 business sectors Top 5 regions (NUTS 2)Italian mafias Construction; Wholesale and retail trade; Hotels, bars and
restaurants; Clubs and gambling activities; Waste and scrap management
Sicilia; Lombardia; Calabria; Campania; Lazio
Chinese Financial and insurance activities; Transportation; Real estate activities; Personal service activities; Manufacturing; Wholesale and retail trade; Hotels, bars and restaurants
Toscana; Lazio; Lombardia; Veneto; Campania; Sicilia
Russian/Georgian Transportation; Wholesale and retail trade; Agriculture Lazio; Puglia; ToscanaOther OCGs Wholesale and retail trade; Hotels, bars and restaurants; Real
estate activities; Support service activities; Manufacturing; Energy supply; Construction; Transportation; Financial and insurance activities; Personal service activities
Calabria; Piemonte; Liguria; Lombardia; Toscana
Source: Transcrime elaboration on DCI data
Italian mafias represent the most active group in the country. They include the ‘Ndrangheta, Cosa Nostra, the Camorra, Apulian OCGs, and other mafia groups.
The ‘Ndrangheta is the mafia with the largest number of references to OCG infiltration into legitimate businesses. In line with the findings of previous studies (Transcrime, 2013b; Savona & Riccardi, 2015), the information contained in the DCI show that ‘Ndrangheta OCGs have penetrated the legal economy not only in their region of origin (namely, Calabria) but also in other Italian regions such as Lombardy and Lazio (Figure 13). As regards economic sectors, construction, hotels, bars and restaurants, and wholesale and retail trade are those with the highest number of references.
Cosa Nostra concentrates its activities in Sicily, although there is evidence of infiltration also in other Italian regions (Figure 13). In its territory of origin, the Sicilian mafia is particularly active in the construction sector, which has a leading role in Sicily’s economy (Scaglione, 2011). However, there is evidence of Cosa Nostra infiltration in other economic sectors as well, such as wholesale and retail trade, manufacturing, energy supply, real estate activities, and bars and restaurants (DIA, 2014).
As already suggested by previous studies (Savona & Riccardi, 2015), the Camorra’s infiltration of legitimate businesses is particularly widespread in terms of territories and economic sectors. From a geographical standpoint, besides Campania there is evidence of Camorra infiltration in northern and central regions such as Lombardy, Lazio and Emilia Romagna (Figure 13). As regards business sectors, mining and construction, as well as wholesale and retail trade and hotels, bars and restaurants, are frequently infiltrated by Camorra OCGs. The mafia presence in these sectors may be instrumental to the commission of crimes such as drug trafficking and counterfeiting (Scaglione, 2011).
As regards foreign criminal groups, Chinese OCGs prevail over the other non-Italian groups in terms of references to OCG infiltration into legitimate businesses. The references of infiltration concentrate in northern and central regions such as Tuscany, Lazio, Lombardy and Veneto; whereas their presence in the regions of origin of traditional mafias is lower. Contrary to Italian mafia organisations, the business sectors most frequently infiltrated by Chinese OCGs are financial and insurance activities and transportation. As suggested by the CNEL (2011), this latter sector may be exploited by criminal groups for the purposes of human trafficking or the transportation of illicit goods (e.g. counterfeit clothes).
24. Details on the region (NUTS 2) and OCG are available for 999 references. Details on the business sector of the infiltration (NACE 1-digit) and OCG are available for 1,196 references.

43
Infiltration and control
OCGs use as their infiltration strategy the metodo mafioso, which consists of collusion, corruption, intimidation and extortion racketeering (Savona, 2010; Transcrime, 2013b). Moreover, the academic literature distinguishes three main types of entrepreneurs who may facilitate the infiltration of legitimate businesses:
• Entrepreneurs of the first type are actively part of the OCG, meaning that at a certain point in time a legal entrepreneur has decided to enter in contact with, and directly participates in, the criminal organisation (Santino & La Fiura, 1990)
• Entrepreneurs of the second type collude with OCGs although they are not members of the organisation (Lo Bello, 2011). This is the case of businesspersons who turn to an OCG in order to increase the distribution of their products. As a consequence, the product distributed by the colluding entrepreneur will obtain exclusivity on the market.
• Entrepreneurs of the third type are victims of the OCG because they have been persuaded to cooperate through intimidation and violence (Sciarrone, 2009). This category also includes victims of usury, although the first request for money is made by the businessperson (CENSIS, 2009).
The use of indirect ownership strategies is increasing among OCGs (Savona & Riccardi, 2015). This means that OCGs are no longer directly involved in control of the business but influence the decision-making process (Savona & Riccardi, 2015). The use of figureheads and straw men as company shareholders and/or owners seems to be the strategy most often used to control businesses indirectly because it reduces the risk of seizure or confiscation (Fantò, 1999; Graebner Anderson, 1979; Transcrime, 2013b; Savona & Riccardi, 2015).
Figure 13. References of Italian mafias infiltration in open sources by location (NUTS 2)25
Source: Transcrime elaboration on DCI data
Frequently, figureheads and straw men are selected from among relatives in order to maintain in-house control over the company. However, professionals (e.g. business and financial consultants) and legal entrepreneurs may also be selected as figureheads because of their privileged relations with the financial, administrative and political system (Transcrime, 2013b).
Moreover, there is evidence of the use of complex ownership schemes and cross-shareholdings that involve a large number of companies in order to complicate the identification of the final owner (Savona & Riccardi, 2015). The sale of business units, the merger of diverse companies, the acquisition of businesses, as well as modification of the business’s legal status or name are also used to conceal the beneficial owner (Transcrime, 2013b).
As regards the legal form, existing studies suggest that OCGs tend to infiltrate limited companies because they are easy to incorporate and manage (Savona & Riccardi, 2015). In particular, limited liability companies (i.e. S.r.l.) appear to be the preferred legal form because the initial share capital is lower than that of joint-stock companies (i.e. S.p.a.) (Transcrime, 2013b). Moreover, these companies make it possible to minimise the potential impact of seizure and confiscation, because the company share capital is divided among different shareholders. In the case of seizure or confiscation, only the shares of the person indicted are usually restricted (Fantò, 1999).
Other factors facilitating OCG infiltration include business size. As suggested by some authors, small and medium-sized businesses – with a maximum of fifty employees – may be more easily infiltrated and managed by OCGs (Riccardi, 2014; Santino & La Fiura, 1990).
Cosa Nostra ‘Ndrangheta Camorra
25. Details on the region of the infiltration (NUTS 2) for Cosa Nostra, ‘Ndrangheta, and Camorra are available for 732 references.

44
Management
As suggested by Arlacchi (2007), companies controlled by OCGs have certain competitive advantages compared with legal ones:
• The discouragement of competition by using the so-called mafia method (metodo mafioso). This may sometimes result in the creation of a criminal monopoly on certain economic sectors (Riccardi, 2014).
• Wage compression, which usually takes the form of tax evasion and non-payment of social security contributions, insurance and overtime work. This enables OCGs significantly to reduce the labour costs of controlled companies (Lo Bello, 2011).
• The high availability of financial resources originating from illegal activities carried out by OCGs.
Despite these advantages, the literature suggests that the productivity of OCG businesses is often lower than that of legal ones. It seems that these businesses are often not well managed (Sciarrone, 2009; Transcrime, 2013b) and therefore incur, voluntarily or otherwise, extra costs which reduce their profits (Becchi & Rey, 1994). This implies that mafia businesses may be primarily used as empty boxes for the purposes of money laundering and hiding illicit activities, but with no productive intent (Santino & La Fiura, 1990; Savona & Riccardi, 2015).
Moreover, OCGs companies are usually short-lived (Santino & La Fiura, 1990) because they are exposed to two risks in an efficient sector: a judicial risk (due to the pressure exerted by the judiciary and law enforcement agencies) and an entrepreneurial one (because the criminal businesses cannot withstand the competition and the rules imposed) (Lo Bello, 2011).
3.6 Conclusions
The infiltration of OCGs into the Italian legitimate economy involves a variety of groups, territories and business sectors.
From a territorial point of view, southern Italian regions such as Sicily, Campania and Calabria, concentrate almost all the evidence of infiltration by traditional mafia groups. Italian mafias exercise close control over their territories of origin, with strong penetration of the economic and political spheres. This may prevent infiltration by other OCGs (Savona & Riccardi, 2015).
By contrast, Italian regions in the central (e.g. Lazio and Tuscany) and northern part (e.g. Lombardy) of the country present a more diversified situation, with infiltration by both Italian and foreign OCGs. The control of Italian mafias is weaker in these regions, which gives other criminal groups opportunities to penetrate the local economy.
The business sectors infiltrated vary according to the type of OCG considered, especially when traditional Italian mafias are compared with foreign OCGs. Despite the differences, construction, wholesale and retail trade, hotels, bars and restaurants are the most infiltrated sectors in Italy, in line with the findings of previous studies (Transcrime, 2013b; Savona & Riccardi, 2015). Similarly, the infiltration of OCGs into legitimate businesses responds to a plurality of drivers, including economic profit, concealment of illegal activities and money laundering, control of the territory, and gaining social consensus. As suggested by previous analyses (e.g. Savona & Riccardi, 2015), Italian mafias may use the infiltrated businesses primarily as means to increase their control over the territory and obtain the consensus of the local population. Conversely, foreign OCGs may use legal companies as covers for illegal activities or for money laundering purposes.
Overall, the analysis suggests that the infiltration of OCGs into legitimate businesses is favoured by specific vulnerabilities, which include the characteristics of the territory (e.g. traditional presence of OCGs; attractive economic opportunities; favourable environment), the characteristics of the business sector (e.g. high presence of public funds; scant or unclear regulation), and the characteristics of the businesses infiltrated (e.g. small and medium-sized businesses). OCGs may also exploit the opportunities created by the current economic crisis. On the one hand, legitimate entrepreneurs may have difficulties in accessing credit and may therefore resort to OCGs for financial support. On the other hand, OCGs may use the infiltrated businesses to offer otherwise scarce jobs and increase their social visibility and prestige.

45
4. The Netherlands26
4.1 Introduction
Scientific studies on organised crime in the Netherlands were rare before the 1990s. Apart from occasional investigations by academics or the Ministry of (Security and) Justice, criminologists were not much interested in organised crime. In the late 1980s and early 1990s, the public and academic attention to organised crime increased, although there was much confusion about how to define organised crime in criminology and by the police.
In 1995, four professors of criminology were invited to study the size and nature of organised crime for a Parliamentary Inquiry Committee on Criminal Investigation Methods with a view to new legislation for the police and public prosecution to investigate organised crime. The group produced for the first time in the Netherlands a structured and empirically broad picture of organised crime (Fijnaut, Bovenkerk, Bruinsma, & van de Bunt, 1998). The researchers had access to all kinds of police and intelligence data and interviewed hundreds of detectives, public prosecutors and experts in business, labour unions, lawyers and civil servants.
After publication of the five reports by the criminologists, the Minister of (Security and) Justice decided that developments in the nature and frequency of organised crime in the Netherlands should be reported more frequently in the future. Therefore, since 1996, the Research and Documentation Centre (WODC) of what is now called the Ministry of Security and Justice has irregularly carried out follow-up studies by systematically researching organised crime data (Kleemans et al., 1998, 2002; van de Bunt & Kleemans, 2007; Kruisbergen, Kleemans, & van de Bunt, 2012). Later, crime analysts of the police and researchers at the Police Academy added reports on specific kinds of organised crime or on specific geographical areas to the body of knowledge. Furthermore, journalists also became more active in reporting on organised crime in books, newspapers and television programmes.
Methodological remarks
The Database on Criminal Infiltration (DCI) collects 604 references of OCG infiltration in legal businesses in the Netherlands. Figure 14 shows the variety of sources used to gather information on OCG infiltration in the country. These mainly include academic literature and institutional reports. Contrary to other countries covered by the project, information from the media constitutes only a small portion of the references included in the DCI.
Figure 14. Percentage of references to OCG infiltration in open sources by type of source
figure 1
figure 2
figure 3
figure 10
figure 15
figure 18
figure 19
figure 20
Figure 24
figure 27
figure 31
figure 32
figure 34
figure 35
figure 36
figure 37
figure 39
figure 40
figure 41
figure 42
figure 43
figure 45
figure 46
figure 47
figure 48
figure 49
figure 50
figure 51
9.2%
49.8%
1.3%
17.1%
22.5%
54.8%25.4%
3.1%
5.9%
10.8%
27%
25%
1%
15%
32%
43%
33%
20%
3% 1%
20%
1%3%
5%
70%
100%90%80%70%60%50%40%30%20%10%
0%2002
4
1
3
2
3
1
1
4
15
1
62
2
47
1
139 89 40
2
5 3 39
2003 2004 2005 2006 2007 2008 2009 2010 2011 2012 2013 2014*
21%
15%
1%4%
59%
21
11
8
20
10
164
34
35
43
23
20
25
15
10
5
01 2 3 4 5 6 7 8 9 10 >10
21%
16%
22%
21%
19%
70%80%90%
100%
40%50%60%
20%30%
10%0%
70%80%90%
100%
40%50%60%
20%30%
10%0%
Italy (N=164)
Slovenia(N=35)
Sweden(N=43)
UK(N=23)
TheNetherlands
(N=34)
Italy (N=21)
Slovenia(N=8)
Sweden(N=20)
UK(N=10)
TheNetherlands
(N=11)
Italy Slovenia Sweden UKTheNetherlands
70% 14
5
62
40%
50%
60%
20%
30%
10%
0%
600
500
400
300
200
100
0
0.20%
0.30%
0.10%
0.50%
0.60%
0.70%
0.80%
0.40%
0.00%2002
0.72%
0.51%
0.26%
0.47%0.56%
0.33%
0.44% 0.47%0.39%
0.36%
0.58%0.52%
0.24%
2003 2004 2005 2006 2007 2008 2009 2010 2011 2012 2013 2014*
38
6
10
5
7
70%80%90%
100%
94
25
19
35
2
40%50%60%
20%30%
10%0%
Italy (N=164)
Slovenia(N=35)
Sweden(N=43)
UK(N=23)
TheNetherlands
(N=34)
Public limited companies
Private limited companies
Partnerships
Sole traders
Other legal forms
NA
20% 40% 60% 80% 100%0%
figure 44
70%80%90%
100%
40%50%60% 90
11
22 26
17
20%30%
10%0%
Italy (N=164)
Slovenia(N=35)
Sweden(N=43)
UK(N=23)
TheNetherlands
(N=34)
10
12
6
8
4
2
14
16
0Money
launderingFraud OtherFormally legal
activitiesConcealment
of illegal activities
4 43
5
15
Italy (N=164)
Slovenia(N=35)
Sweden(N=43)
UK(N=23)
TheNetherlands
(N=34)
70%80%90%
100%
40%50%60%
20%30%
10%0%
40%
50%
20%
30%
10%
0%Italy
(N=137)Slovenia(N=32)
Sweden(N=34)
UK(N=18)
70%80%90%
100%
40%50%60%
20%30%
10%0%
Italy (N=21)
Slovenia(N=8)
Sweden(N=20)
UK(N=10)
TheNetherlands
(N=11)
Italy(N=164)
Slovenia(N=35)
Sweden(N=43)
UK(N=23)
TheNetherlands
(N=34)
Italy(N=164)
Slovenia(N=35)
Sweden(N=43)
UK(N=23)
TheNetherlands
(N=34)
70%80%90%
100%
40%50%60%
20%30%
10%0%
70%80%90%
100%
40%50%60%
20%30%
10%0%
30%
24.9%0.8%
Academic study Judicial evidence
LEA report Media Other
N = 2,380
N = 2,380
N = 2,380
N = 1,305
N = 604
Institutional report
15%
29%
0.4%
Local OCGs Motorcycles gangsItalian mafias
Other OCGs NA
Italy SloveniaThe Netherlands
Sweden UK
Academic study
Judicial evidence LEA report Media
Institutional report
Academic study
LEA report Media
No. criminal charges with references to OCGs % OCGs in relation to all criminal charges
% O
CGs
in re
latio
n to
all
crim
inal
cha
rges
Other
Institutional report
No.
crim
inal
cha
rges
with
refe
renc
es to
OCG
s
Academic study
Judicial evidence LEA report Media
Institutional report
N = 74
23%
24%
20%
32%
1% N = 140
N = 257
N = 70
N = 299
Academic study
LEA report Media Other
Institutional report
No. filed criminal complaints for money laudering offences with references to OCGs
No. filed criminal complaints for money laudering offences without references to OCGs
Academic study
Judicial evidence LEA report Media
Institutional report
Italy SloveniaThe Netherlands
Sweden UK
Italy SloveniaThe Netherlands
Sweden UK
Money laundering FraudFormally legal activities
Concealment of illegal activities Other
Money laundering FraudFormally legal activities
New business NAAlready existing business
Concealment of illegal activities Other
90
53
19
24
9
14
4
30
15
29
21
20% 40% 60% 80% 100%0%
Public limitedcompanies
Private limitedcompanies
Partnerships
Sole traders
Other legal forms
NA
Italy SloveniaThe Netherlands
UKSweden
Public limitedcompanies
Private limitedcompanies
Partnerships
Sole traders
Otherlegal forms
NA
20% 40% 60% 80% 100%0%
Cosa Nostra (N=14) Camorra (N=74)‘Ndrangheta (N=47)
Other Italian (N=13)Chinese (N=16)
Money laundering Fiscal fraudFormally legal activities
Corporate fraud OtherConcealment of illegal activities
Relatives Legal entrepreneursProfessionals
Women among shareholders Women as majority shareholders
Legal companies
53
7
6
14
98
3
1
8
4
1
Small LargeMedium Very large NA
Italy SloveniaThe Netherlands
Sweden UK
0 4-101-3 11-20 >20 NA
Source: NSCR elaboration on DCI data
Research on organised crime in the Netherlands is heavily based on police data. For about 25 years, criminologists and crime analysts have in collaboration with, or from within, the Dutch police and with the use of police data engaged in systematic study of organised crime. Scientists have used for their academic research official police files on closed and current investigations, or police crime analysts’ written analyses of criminal groups and intelligence information. The police files on OCGs sometimes cover thousands of pages each, including confiscated (shadow) financial accounts, interrogation reports and wire taps. The data used contain information about criminal groups or networks, about members of such groups or networks, and about individual offenders. Besides these data, police officers and public prosecutors have been interviewed about investigations and about the files studied. For additional data and to avoid possible police selectivity, Dutch academics have also interviewed key figures of law firms, labour union leaders, catering industry, banks, industries, car rentals, real estate agencies, stores, and so on (depending on the research question). Research on organised crime in the Netherlands has a strong empirical emphasis (Tonry & Bijleveld, 2007) and is less dependent on incidental news media reports.
26. With the collaboration of Gerben Bruinsma, Adriaan Denkers and Sylvia Alberts (Netherlands Institute for the Study of Crime and Law Enforcement, the Netherlands).

46
Based on data from closed police files, wire taps, police observations and structured interviews with policemen and public prosecutors, in 2012 the WODC published its fourth report on organised crime in the Netherlands (Kruisbergen et al., 2012).27 This national study28 again revealed that the major criminal activities of organised crime in the Netherlands are the international smuggling of illegal goods and services: drug trade (most important), smuggling of illegal immigrants, human trafficking for sexual exploitation, and the trafficking of arms or stolen vehicles. Besides these activities - as a consequence of their profitable crimes - criminals are also involved in transnational illegal activities like money laundering and tax evasion. Because of this involvement in illegal trade, the Netherlands can be labelled a destination country, as well as a transit country and, with regard to Dutch cannabis (with high THC level) and synthetic drugs, a production country. Organised crime groups use the legal infrastructure to organise and conceal their crimes.
Organised crime groups in the Netherlands are not solely family-based or pyramid-shaped structures with a strict hierarchy, a clear division of tasks, and an internal sanction system. The concept of flexible criminal networks (Bruinsma & Bernasco, 2004; Fijnaut et al., 1998) fits the Dutch situation better. The shape of a network reflects its kind of criminal activity (Bruinsma & Bernasco, 2004). For instance, car theft, heroin trade or illegal prostitution are generally run by criminal networks with very distinct shapes. Networks that are characterised by high density and a large proportion of affective relationships (in short: cohesive networks) are pre-eminently suited to criminal collaborations where a great deal of mutual trust is needed (heroin trade). The shape of criminal networks suited for the smuggling and trafficking of prostitutes can be typified as a ‘chain’ with some smaller clusters at each end: at one end, offenders recruit the women; at the other, offenders exploit and sell them to brothels. The social networks of organised crime active in car theft can be described as a few clusters linked to each other via ‘thin’ lines.
The flexible nature of criminal project organisation makes it problematic for researchers and police investigators to assess the actual number of men and women belonging to a network or group. Friends, family members and acquaintances may work together in certain temporary or long-lasting criminal activities and move on to other criminal activities with other people, introduced by their friends, families or acquaintances. Generally, they are introduced to these others by friends,
family members or acquaintances. Criminal networks avoid unknown outsiders. To be known and trusted is very important in a risky world with high chances of being cheated or betrayed.
Compared to twenty years ago, criminal networks more often consist of offenders of mixed ethnic origins. The average age of the members of criminal networks is about 27 years old. Adolescents and other young offenders are almost absent in these networks (Pennings, Bruinsma, & Weerman, 2006). The Dutch police have no information on the criminal records of about 30% of the criminals. This may be due to the fact that these criminals are mainly foreigners and the Dutch police have no (easy) access to police files of other countries. Those who have been arrested as members of an organised crime group often have earlier criminal records, although their criminal careers seem to start relatively late (van Koppen, de Poot, Kleemans, & Nieuwbeerta, 2010).
Key players in criminal networks can be identified by the fact that other offenders are dependent on them. They hold a position of status within the network and exercise power because they have financial resources, know-how about the organisation of criminal activities, and essential contacts in the conventional world (notaries, law firms, brokers, facilitators in the transport sector, airports and harbours). Despite their power, these key players are still very locally embedded. This local alignment combined with a generally low level of education limit them in their international scope: they lack the requisite skills and specialist knowledge to be attractive to partners outside the Netherlands or even outside their own locality. If necessary to maintain ‘order’ within their network, or for fear of losing respect, they resort to the use of violence, but in a restricted manner: only against accomplices, illegal business partners, or unwilling partners in the legal world (Kruisbergen et al., 2012). Dutch organised criminals seem to be more interested in protecting their everyday criminal activities than in achieving a long-standing dominant position in the (inter)national ‘underworld’ (Kleemans, 2007; Kruisbergen et al., 2012, 2015).
Recently, motorcycle gangs (like chapters of Hells Angels, Bandidos, Satudarah or No Surrender) have attracted the attention of the media and politicians because of their emphatic public presence in cities and the publicly displayed and increasingly violent gang warfare (DLIO, 2014; Hagen, 1998). These gangs have for many years been suspected of involvement in the trafficking and exploitation of humans for illegal prostitution, in
27. The definition of organised crime in Dutch criminology is broader than the legal definition of criminal organisation in Criminal Law (see also: Fijnaut, et al., 1998).
28. The description of the organised crime characteristics in this introduction relies heavily on the latest report of the WODC.

47
the arms and drugs trade, and in all kinds of dubious ‘protection’ activities in pubs, restaurants or dance halls (Fijnaut, Bovenkerk, Bruinsma, & van de Bunt, 1996). A recent report on motorcycle gangs did not reveal any major economic or financial infiltration other than gangs ‘hanging out’ in so-called ‘club houses’ and cafes or bars in order to shelter from police investigations or inquiries by municipalities (DLIO, 2014).
4.2 Drivers
The nature and size of Dutch organised crime do not compare to those of countries like Italy, Russia, Japan, Colombia, or the US. Mafia dynasties like Cosa Nostra, Camorra or Yakuza are absent in the Netherlands (unless they are visiting the country for leisure or illegal business). Dutch organised crime consists mainly of internationally trading networks with no tradition of, or apparent interest in, ‘racketeering practices’. They do not aim at systematic infiltration of legal branches or in geographical areas. There is no empirical evidence of the regular extortion of local shop owners and small businesses, and there is no empirical evidence of regular corrupt ties with politicians, businessmen or labour union leaders in combination with (the threat of) excessive violence. Dutch society scores high on Transparency International, indicating a very low level of corruption. When we describe infiltration by organised crime of legal sectors in the Netherlands, this must be seen more as occasional collaborative activities for the purpose of illegal trading than gaining control over those legal sectors. Van de Bunt, Siegel and Zaitch write concerning the social embeddedness of organised crime: ‘Between organised crime and the legitimate societal context, there are usually all sorts of ‘interfaces,’ and the relationships between legality and illegality are by no means necessarily antagonistic or aimed at avoiding one another. Instead of operating in a social vacuum, organised crime has a habit of interacting with its social environment’ (van de Bunt, Siegel, & Zaitch, 2014, p. 321).
In the past twenty years no report on the organised crime situation in the Netherlands has observed serious financial or economic infiltration (Fijnaut et al., 1998; Kleemans et al., 1998; Kleemans, 2007; Kruisbergen et al., 2012; van de Bunt & Kleemans, 2007; van de Bunt et al., 2014). However, some economic sectors, like the transport sector, harbours and airports, are by their very nature important for the logistics of e.g. drug trafficking. In such sectors, some signs of collaboration can be found. There is, however, no empirical evidence that criminal groups play a permanent role of any significance in the transport sector. Second, in hotels, restaurants, nightclubs and bars, organised crime
seems sometimes to play a role that goes beyond using the facilities for illegal activities. Criminal groups have been found to provide ‘protection’ services. However, the empirical data offer no support for the suggestion that criminal groups control any significant proportion of legal business.
Recent research has focused specifically on the profits of organised crime groups, and how they spend and invest their profits earned from drug trafficking, human trafficking and smuggling, illegal arms trade, fraud or the production of XTC (Kruisbergen et al., 2015). Using data on 150 criminal groups and 1,196 individual members, the researchers revealed that many of the offenders spent their illegal revenues on exuberant consumption. The illegal profits, however, were higher than they were able to spend on expensive cars, boats, jewellery, holidays, and girlfriends. Some of the criminals turned to investments in real estate and legal firms. The authors presented six reasons why criminal groups invest in real estate and legal business:
• It is a safe investment that will pay off in the long run;
• Real estate purchases absorb a great deal of illegal money;
• The real estate market is characterised by a lack of price transparency;
• Ownership of real estate property can be concealed (e.g. by using legal entities);
• No (effective) control and supervisory institutions govern the real estate market;
• Criminals, too, need somewhere to live.
The researchers indicated an increase in the purchase of real estate property, but it was predominantly for the purpose of obtaining a personal or family residence or laundering money, and less as a means to gain control over a neighbourhood: ‘Almost 45 % of the 243 individual real estate objects that were found in those cases, concerns property for residential use. It includes houses and flats used by the offenders themselves or their relatives, but also houses and flats rented out to others. The property varies from very modest dwellings to very roomy and luxurious villas’. The researchers found, as in all research on organised crime in the Netherlands, no confirmation for the ‘infiltration hypothesis’ (Kleemans, 2014). In general, organised crime in the Netherlands tends to avoid contacts with and the attention of the police and governments, instead of engaging in (open) conflicts for power in society, municipalities, neighbourhoods or legal sectors.

48
4.3 Infiltrated territories
Similar remarks can be made about the geographical areas. According to the information recorded in the Database on Criminal Infiltration (DCI) only six of the twelve Dutch provinces have references to OCG infiltration. Limburg (in the south-east of the Netherlands), North Holland and South Holland run the highest risks of infiltration because of their transport facilities (harbours and airports). The production of XTC and cannabis requires space and air, and this is the only reason why criminal groups actively rent or buy barns and storage buildings in rural areas to produce synthetic drugs (Huisman, 2005). XTC production barns are more commonly found in the south of the Netherlands (provinces of Brabant and Limburg) as well in the eastern part (Gelderland and Overijssel, mentioned in police reports and Dutch research on organised crime).
Figure 15. Number of references to OCG infiltration in open sources by region (NUTS 2)29
Source: NSCR elaboration on DCI data
None1-34-1011-17>17
References to OCG infiltration (N=604)
4.4 Infiltrated business sectors
On considering the Dutch literature, it should be borne in mind that the results presented in Figure 16 are to be seen in the context of Dutch organised crime. The DCI contains information on OCGs ‘making use of the legal sector’ rather than infiltrating an entire economic sector. Furthermore, it should be noted that the level of evidence of each business sector is calculated in comparison with the other sectors in the same country.
Therefore, sectors such as hotels, bars and restaurants or transportation present several references to OCG infiltration but only if compared with other business sectors in the Netherlands, where fewer cases of infiltration were found in the literature.
Some legal sectors are more vulnerable to criminal infiltration than others. The research group of the Parliamentary Inquiry Committee suggested that the following characteristics are important for infiltration (Bruinsma & Bovenkerk, 1996):
• In most cases, criminal groups are technically and financially familiar with these sectors (like the catering industry, car rentals and garages, transport);
• Sectors with low barriers to entry (high qualifications and education are not necessary);
• Sectors characterised by a small number of very big companies and many small, short-lived companies that are very competitive with each other;
• Economic sectors that are complicated for outsiders with few general rules and are under-regulated (like the toxic waste industry);
• Sectors with levels of undetected crime and victimisation higher than those of other sectors, seducing regular business people also to commit crimes.
The research group found another kind of infiltration in the files: a small number of businessmen with well-established positions in the legal economy had set up criminal activities after observing criminals making a great deal of money.
At present, the government (local or national) has no specific policy against OCG infiltration of legal society. Besides the obvious law enforcement practice by which OCG are handled, governments give priority to the administrative prevention of OCGs through the continuous inspection of rules, regulations and the administrations of businesses, bars, restaurants, real estate agencies, notaries, and so on. The aim of the government is to make it as difficult as possible for criminals to settle more or less permanently in legal society. Coffee shops and prostitution are also subject to inspections by local governments to check that rules and regulations are being followed. The police are little involved in such inspections.
29. Details on the region of the infiltration (NUTS 2) are available for 604 references.

49
Figure 16. Number or references to OCG infiltration in open sources by business sector30
4.5 Actors and modi operandi
Distinctions among different OCGs in terms of targeted business sectors and regions are difficult to draw, given the method used to create the DCI and the scant availability of information on the types of criminal groups involved in infiltration cases. Dutch OCGs seem more active in the wholesale and retail trade and in the management of hotels, bars and restaurants. Evidence of Italian mafias infiltrating legal businesses in the country was also found.
The current literature on OCG infiltration in the legal economy provides scant information on the methods used by criminal groups to infiltrate and manage legal businesses. Analysis of the case studies provided some insights. In general, the infiltration process seems very straightforward, with OCG members directly owning a legal business after having regularly purchased it from a legal entrepreneur.
Source: NSCR elaboration on DCI data
In a few cases, an OCG member approached a legal entrepreneur who had already acquired or set up a business in order to start a partnership. The legal business was then used to commit frauds. In these cases, the legal entrepreneur could be either an accomplice or unaware of the illicit activities of his new business partner. Another option is the acquisition of a legal business by a straw man who acts on behalf of the members of the criminal group. The straw man can be either a relative of the OCG member or a person without a criminal record who is promised money in exchange for his/her service.
4.6 Conclusions
The Dutch literature on organised crime is quite clear on infiltration and racketeering. In the last Dutch Organised Crime Monitor the researchers concluded as follows: ‘Considering the available evidence of two decades of research into organised crime in the Netherlands,
30. Details on the business sector of the infiltration (NACE 0-digit) are available for 558 references.
SECTORS
Agriculture and fishing
Construction
IT services
Real estate activities
Public administration
Education
Hospitals and residential care
Legal and professionalactivities
Clubs and gambling activities
Personal serviceactivities
Support service activities
Mining and quarrying
Manufacturing
Energy supply
Waste and scrap management
Wholesale and retail trade
Transportation
Hotels, bars and restaurants
Financial and insurance activities
1 - 15
16 - 30
31 - 46
> 46
REFERENCES TO OCG INFILTRATION

50
one may conclude that … criminal groups are primarily involved in international illegal trade, using the same opportunity structure that facilitates legal economic activities. The Netherlands could be either a destination country, a transit country, or, especially in the case of synthetic drugs, a production country. Rather than controlling certain regions or certain sectors of the economy, criminal groups use the legal infrastructure and legal commodity and money flows. As the Netherlands is an important logistical node in Europe (Amsterdam- Schiphol Airport, the port of Rotterdam), this also creates an excellent opportunity structure for organised crime. Economic sectors are used to commit or to conceal crimes or to spend criminal proceeds’ (Kruisbergen et al., 2012, pp. 288–289). Because of this absence of infiltration or racketeering by OCGs, the legal and economic sectors are not harmed or affected in general (except in rare cases).
Source: Slovenian Police
figure 1
figure 2
figure 3
figure 10
figure 15
figure 18
figure 19
figure 20
Figure 24
figure 27
figure 31
figure 32
figure 34
figure 35
figure 36
figure 37
figure 39
figure 40
figure 41
figure 42
figure 43
figure 45
figure 46
figure 47
figure 48
figure 49
figure 50
figure 51
9.2%
49.8%
1.3%
17.1%
22.5%
54.8%25.4%
3.1%
5.9%
10.8%
27%
25%
1%
15%
32%
43%
33%
20%
3% 1%
20%
1%3%
5%
70%
100%90%80%70%60%50%40%30%20%10%
0%2002
4
1
3
2
3
1
1
4
15
1
62
2
47
1
139 89 40
2
5 3 39
2003 2004 2005 2006 2007 2008 2009 2010 2011 2012 2013 2014*
21%
15%
1%4%
59%
21
11
8
20
10
164
34
35
43
23
20
25
15
10
5
01 2 3 4 5 6 7 8 9 10 >10
21%
16%
22%
21%
19%
70%80%90%
100%
40%50%60%
20%30%
10%0%
70%80%90%
100%
40%50%60%
20%30%
10%0%
Italy (N=164)
Slovenia(N=35)
Sweden(N=43)
UK(N=23)
TheNetherlands
(N=34)
Italy (N=21)
Slovenia(N=8)
Sweden(N=20)
UK(N=10)
TheNetherlands
(N=11)
Italy Slovenia Sweden UKTheNetherlands
70% 14
5
62
40%
50%
60%
20%
30%
10%
0%
600
500
400
300
200
100
0
0.20%
0.30%
0.10%
0.50%
0.60%
0.70%
0.80%
0.40%
0.00%2002
0.72%
0.51%
0.26%
0.47%0.56%
0.33%
0.44% 0.47%0.39%
0.36%
0.58%0.52%
0.24%
2003 2004 2005 2006 2007 2008 2009 2010 2011 2012 2013 2014*
38
6
10
5
7
70%80%90%
100%
94
25
19
35
2
40%50%60%
20%30%
10%0%
Italy (N=164)
Slovenia(N=35)
Sweden(N=43)
UK(N=23)
TheNetherlands
(N=34)
Public limited companies
Private limited companies
Partnerships
Sole traders
Other legal forms
NA
20% 40% 60% 80% 100%0%
figure 44
70%80%90%
100%
40%50%60% 90
11
22 26
17
20%30%
10%0%
Italy (N=164)
Slovenia(N=35)
Sweden(N=43)
UK(N=23)
TheNetherlands
(N=34)
10
12
6
8
4
2
14
16
0Money
launderingFraud OtherFormally legal
activitiesConcealment
of illegal activities
4 43
5
15
Italy (N=164)
Slovenia(N=35)
Sweden(N=43)
UK(N=23)
TheNetherlands
(N=34)
70%80%90%
100%
40%50%60%
20%30%
10%0%
40%
50%
20%
30%
10%
0%Italy
(N=137)Slovenia(N=32)
Sweden(N=34)
UK(N=18)
70%80%90%
100%
40%50%60%
20%30%
10%0%
Italy (N=21)
Slovenia(N=8)
Sweden(N=20)
UK(N=10)
TheNetherlands
(N=11)
Italy(N=164)
Slovenia(N=35)
Sweden(N=43)
UK(N=23)
TheNetherlands
(N=34)
Italy(N=164)
Slovenia(N=35)
Sweden(N=43)
UK(N=23)
TheNetherlands
(N=34)
70%80%90%
100%
40%50%60%
20%30%
10%0%
70%80%90%
100%
40%50%60%
20%30%
10%0%
30%
24.9%0.8%
Academic study Judicial evidence
LEA report Media Other
N = 2,380
N = 2,380
N = 2,380
N = 1,305
N = 604
Institutional report
15%
29%
0.4%
Local OCGs Motorcycles gangsItalian mafias
Other OCGs NA
Italy SloveniaThe Netherlands
Sweden UK
Academic study
Judicial evidence LEA report Media
Institutional report
Academic study
LEA report Media
No. criminal charges with references to OCGs % OCGs in relation to all criminal charges%
OCG
s in
rela
tion
to a
ll cr
imin
al c
harg
es
Other
Institutional report
No.
crim
inal
cha
rges
with
refe
renc
es to
OCG
s
Academic study
Judicial evidence LEA report Media
Institutional report
N = 74
23%
24%
20%
32%
1% N = 140
N = 257
N = 70
N = 299
Academic study
LEA report Media Other
Institutional report
No. filed criminal complaints for money laudering offences with references to OCGs
No. filed criminal complaints for money laudering offences without references to OCGs
Academic study
Judicial evidence LEA report Media
Institutional report
Italy SloveniaThe Netherlands
Sweden UK
Italy SloveniaThe Netherlands
Sweden UK
Money laundering FraudFormally legal activities
Concealment of illegal activities Other
Money laundering FraudFormally legal activities
New business NAAlready existing business
Concealment of illegal activities Other
90
53
19
24
9
14
4
30
15
29
21
20% 40% 60% 80% 100%0%
Public limitedcompanies
Private limitedcompanies
Partnerships
Sole traders
Other legal forms
NA
Italy SloveniaThe Netherlands
UKSweden
Public limitedcompanies
Private limitedcompanies
Partnerships
Sole traders
Otherlegal forms
NA
20% 40% 60% 80% 100%0%
Cosa Nostra (N=14) Camorra (N=74)‘Ndrangheta (N=47)
Other Italian (N=13)Chinese (N=16)
Money laundering Fiscal fraudFormally legal activities
Corporate fraud OtherConcealment of illegal activities
Relatives Legal entrepreneursProfessionals
Women among shareholders Women as majority shareholders
Legal companies
53
7
6
14
98
3
1
8
4
1
Small LargeMedium Very large NA
Italy SloveniaThe Netherlands
Sweden UK
0 4-101-3 11-20 >20 NA
5. Slovenia31
5.1 Introduction
Experts and institutions whose work concerns organised crime agree that Slovenia’s geostrategic position is the main factor that influences the development and form of organised crime in Slovenia. Despite being a country traversed by the Balkan route and the one which is currently the southern entry point into the EU zone, the figures in the official police statistical records for organised crime occurrences in Slovenia are relatively low. Figure 17 presents the official statistics regarding organised crime in Slovenia for the period between 2002 and the first half of 2014.
Figure 17. Criminal charges with references to organised crime groups, 2002-mid 201432
The statistics show that organised crime groups are particularly involved in drug-related crimes, followed by illegal trespassing of the state border and various types of grand larceny (though both are on the decrease). Since 2002 there have been 305 cases labelled as simultaneously organised and economic crimes, with forgery of documents predominating.
Slovenian OCGs can be generally divided into two categories. The first includes groups that engage in classic activities (e.g. drug trafficking, human smuggling); the second includes organised white-collar crime groups. In this latter case, economically-themed crimes are committed by the top echelons of Slovenian society.
31. With the collaboration of Gorazd Meško, Andrej Sotlar, Bojan Dobovšek, Katja Eman, Maja Modic, Branko Ažman and Boštjan Slak (University of Maribor-Faculty of Criminal Justice and Security, Slovenia).
32. Slovenian police use EUROPOL's method to characterise organised crime (Policija, 2003). Since the method is perception and knowledge based, the numbers sometimes differ from those released in annually published police reports, since additional clarifications of circumstances reveal that criminal offences were not, in fact, related to organised crime. The calculations of the percentages of OCG occurrences in relation to total criminal charges per year were performed by the FCJS research team using the data provided; however, the results were not confirmed by the Slovenian police.
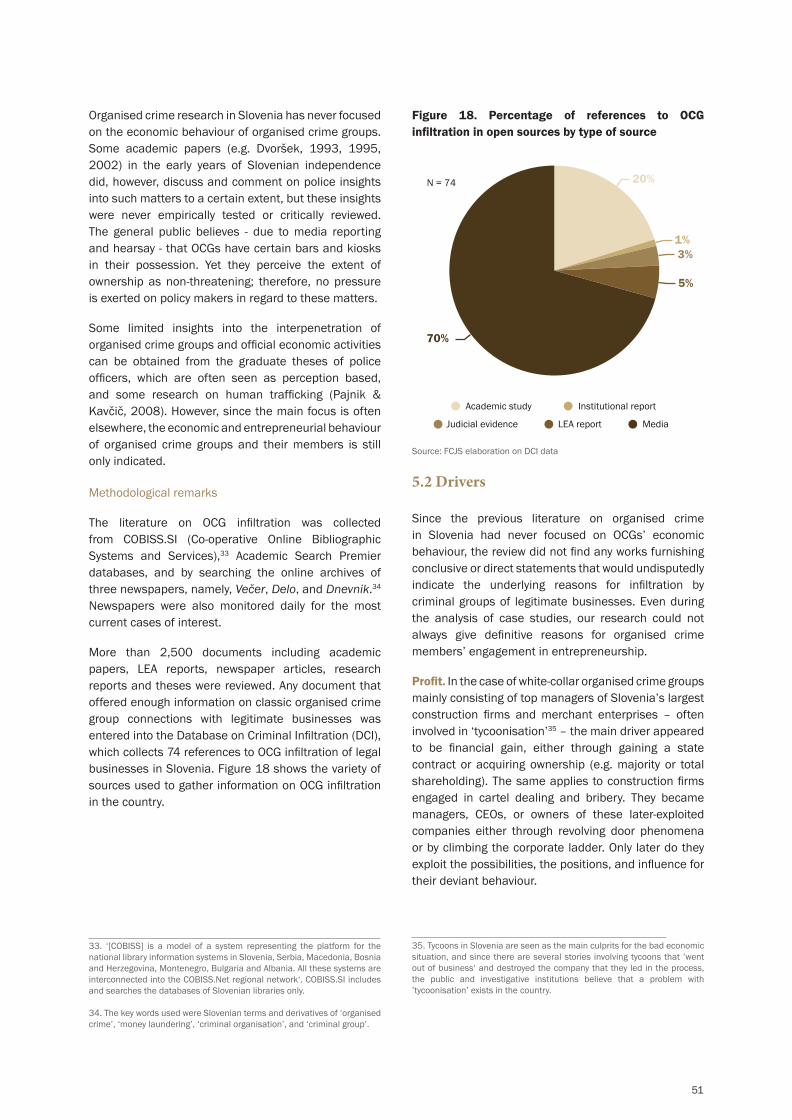
51
33. ‘[COBISS] is a model of a system representing the platform for the national library information systems in Slovenia, Serbia, Macedonia, Bosnia and Herzegovina, Montenegro, Bulgaria and Albania. All these systems are interconnected into the COBISS.Net regional network‘. COBISS.SI includes and searches the databases of Slovenian libraries only.
34. The key words used were Slovenian terms and derivatives of ‘organised crime’, ‘money laundering’, ‘criminal organisation’, and ‘criminal group’.
figure 1
figure 2
figure 3
figure 10
figure 15
figure 18
figure 19
figure 20
Figure 24
figure 27
figure 31
figure 32
figure 34
figure 35
figure 36
figure 37
figure 39
figure 40
figure 41
figure 42
figure 43
figure 45
figure 46
figure 47
figure 48
figure 49
figure 50
figure 51
9.2%
49.8%
1.3%
17.1%
22.5%
54.8%25.4%
3.1%
5.9%
10.8%
27%
25%
1%
15%
32%
43%
33%
20%
3% 1%
20%
1%3%
5%
70%
100%90%80%70%60%50%40%30%20%10%
0%2002
4
1
3
2
3
1
1
4
15
1
62
2
47
1
139 89 40
2
5 3 39
2003 2004 2005 2006 2007 2008 2009 2010 2011 2012 2013 2014*
21%
15%
1%4%
59%
21
11
8
20
10
164
34
35
43
23
20
25
15
10
5
01 2 3 4 5 6 7 8 9 10 >10
21%
16%
22%
21%
19%
70%80%90%
100%
40%50%60%
20%30%
10%0%
70%80%90%
100%
40%50%60%
20%30%
10%0%
Italy (N=164)
Slovenia(N=35)
Sweden(N=43)
UK(N=23)
TheNetherlands
(N=34)
Italy (N=21)
Slovenia(N=8)
Sweden(N=20)
UK(N=10)
TheNetherlands
(N=11)
Italy Slovenia Sweden UKTheNetherlands
70% 14
5
62
40%
50%
60%
20%
30%
10%
0%
600
500
400
300
200
100
0
0.20%
0.30%
0.10%
0.50%
0.60%
0.70%
0.80%
0.40%
0.00%2002
0.72%
0.51%
0.26%
0.47%0.56%
0.33%
0.44% 0.47%0.39%
0.36%
0.58%0.52%
0.24%
2003 2004 2005 2006 2007 2008 2009 2010 2011 2012 2013 2014*
38
6
10
5
7
70%80%90%
100%
94
25
19
35
2
40%50%60%
20%30%
10%0%
Italy (N=164)
Slovenia(N=35)
Sweden(N=43)
UK(N=23)
TheNetherlands
(N=34)
Public limited companies
Private limited companies
Partnerships
Sole traders
Other legal forms
NA
20% 40% 60% 80% 100%0%
figure 44
70%80%90%
100%
40%50%60% 90
11
22 26
17
20%30%
10%0%
Italy (N=164)
Slovenia(N=35)
Sweden(N=43)
UK(N=23)
TheNetherlands
(N=34)
10
12
6
8
4
2
14
16
0Money
launderingFraud OtherFormally legal
activitiesConcealment
of illegal activities
4 43
5
15
Italy (N=164)
Slovenia(N=35)
Sweden(N=43)
UK(N=23)
TheNetherlands
(N=34)
70%80%90%
100%
40%50%60%
20%30%
10%0%
40%
50%
20%
30%
10%
0%Italy
(N=137)Slovenia(N=32)
Sweden(N=34)
UK(N=18)
70%80%90%
100%
40%50%60%
20%30%
10%0%
Italy (N=21)
Slovenia(N=8)
Sweden(N=20)
UK(N=10)
TheNetherlands
(N=11)
Italy(N=164)
Slovenia(N=35)
Sweden(N=43)
UK(N=23)
TheNetherlands
(N=34)
Italy(N=164)
Slovenia(N=35)
Sweden(N=43)
UK(N=23)
TheNetherlands
(N=34)
70%80%90%
100%
40%50%60%
20%30%
10%0%
70%80%90%
100%
40%50%60%
20%30%
10%0%
30%
24.9%0.8%
Academic study Judicial evidence
LEA report Media Other
N = 2,380
N = 2,380
N = 2,380
N = 1,305
N = 604
Institutional report
15%
29%
0.4%
Local OCGs Motorcycles gangsItalian mafias
Other OCGs NA
Italy SloveniaThe Netherlands
Sweden UK
Academic study
Judicial evidence LEA report Media
Institutional report
Academic study
LEA report Media
No. criminal charges with references to OCGs % OCGs in relation to all criminal charges
% O
CGs
in re
latio
n to
all
crim
inal
cha
rges
Other
Institutional report
No.
crim
inal
cha
rges
with
refe
renc
es to
OCG
s
Academic study
Judicial evidence LEA report Media
Institutional report
N = 74
23%
24%
20%
32%
1% N = 140
N = 257
N = 70
N = 299
Academic study
LEA report Media Other
Institutional report
No. filed criminal complaints for money laudering offences with references to OCGs
No. filed criminal complaints for money laudering offences without references to OCGs
Academic study
Judicial evidence LEA report Media
Institutional report
Italy SloveniaThe Netherlands
Sweden UK
Italy SloveniaThe Netherlands
Sweden UK
Money laundering FraudFormally legal activities
Concealment of illegal activities Other
Money laundering FraudFormally legal activities
New business NAAlready existing business
Concealment of illegal activities Other
90
53
19
24
9
14
4
30
15
29
21
20% 40% 60% 80% 100%0%
Public limitedcompanies
Private limitedcompanies
Partnerships
Sole traders
Other legal forms
NA
Italy SloveniaThe Netherlands
UKSweden
Public limitedcompanies
Private limitedcompanies
Partnerships
Sole traders
Otherlegal forms
NA
20% 40% 60% 80% 100%0%
Cosa Nostra (N=14) Camorra (N=74)‘Ndrangheta (N=47)
Other Italian (N=13)Chinese (N=16)
Money laundering Fiscal fraudFormally legal activities
Corporate fraud OtherConcealment of illegal activities
Relatives Legal entrepreneursProfessionals
Women among shareholders Women as majority shareholders
Legal companies
53
7
6
14
98
3
1
8
4
1
Small LargeMedium Very large NA
Italy SloveniaThe Netherlands
Sweden UK
0 4-101-3 11-20 >20 NA
Organised crime research in Slovenia has never focused on the economic behaviour of organised crime groups. Some academic papers (e.g. Dvoršek, 1993, 1995, 2002) in the early years of Slovenian independence did, however, discuss and comment on police insights into such matters to a certain extent, but these insights were never empirically tested or critically reviewed. The general public believes - due to media reporting and hearsay - that OCGs have certain bars and kiosks in their possession. Yet they perceive the extent of ownership as non-threatening; therefore, no pressure is exerted on policy makers in regard to these matters.
Some limited insights into the interpenetration of organised crime groups and official economic activities can be obtained from the graduate theses of police officers, which are often seen as perception based, and some research on human trafficking (Pajnik & Kavčič, 2008). However, since the main focus is often elsewhere, the economic and entrepreneurial behaviour of organised crime groups and their members is still only indicated.
Methodological remarks
The literature on OCG infiltration was collected from COBISS.SI (Co-operative Online Bibliographic Systems and Services),33 Academic Search Premier databases, and by searching the online archives of three newspapers, namely, Večer, Delo, and Dnevnik.34
Newspapers were also monitored daily for the most current cases of interest.
More than 2,500 documents including academic papers, LEA reports, newspaper articles, research reports and theses were reviewed. Any document that offered enough information on classic organised crime group connections with legitimate businesses was entered into the Database on Criminal Infiltration (DCI), which collects 74 references to OCG infiltration of legal businesses in Slovenia. Figure 18 shows the variety of sources used to gather information on OCG infiltration in the country.
35. Tycoons in Slovenia are seen as the main culprits for the bad economic situation, and since there are several stories involving tycoons that ’went out of business‘ and destroyed the company that they led in the process, the public and investigative institutions believe that a problem with ’tycoonisation’ exists in the country.
Figure 18. Percentage of references to OCG infiltration in open sources by type of source
Source: FCJS elaboration on DCI data
5.2 Drivers
Since the previous literature on organised crime in Slovenia had never focused on OCGs’ economic behaviour, the review did not find any works furnishing conclusive or direct statements that would undisputedly indicate the underlying reasons for infiltration by criminal groups of legitimate businesses. Even during the analysis of case studies, our research could not always give definitive reasons for organised crime members’ engagement in entrepreneurship.
Profit. In the case of white-collar organised crime groups mainly consisting of top managers of Slovenia’s largest construction firms and merchant enterprises – often involved in ‘tycoonisation’35 – the main driver appeared to be financial gain, either through gaining a state contract or acquiring ownership (e.g. majority or total shareholding). The same applies to construction firms engaged in cartel dealing and bribery. They became managers, CEOs, or owners of these later-exploited companies either through revolving door phenomena or by climbing the corporate ladder. Only later do they exploit the possibilities, the positions, and influence for their deviant behaviour.
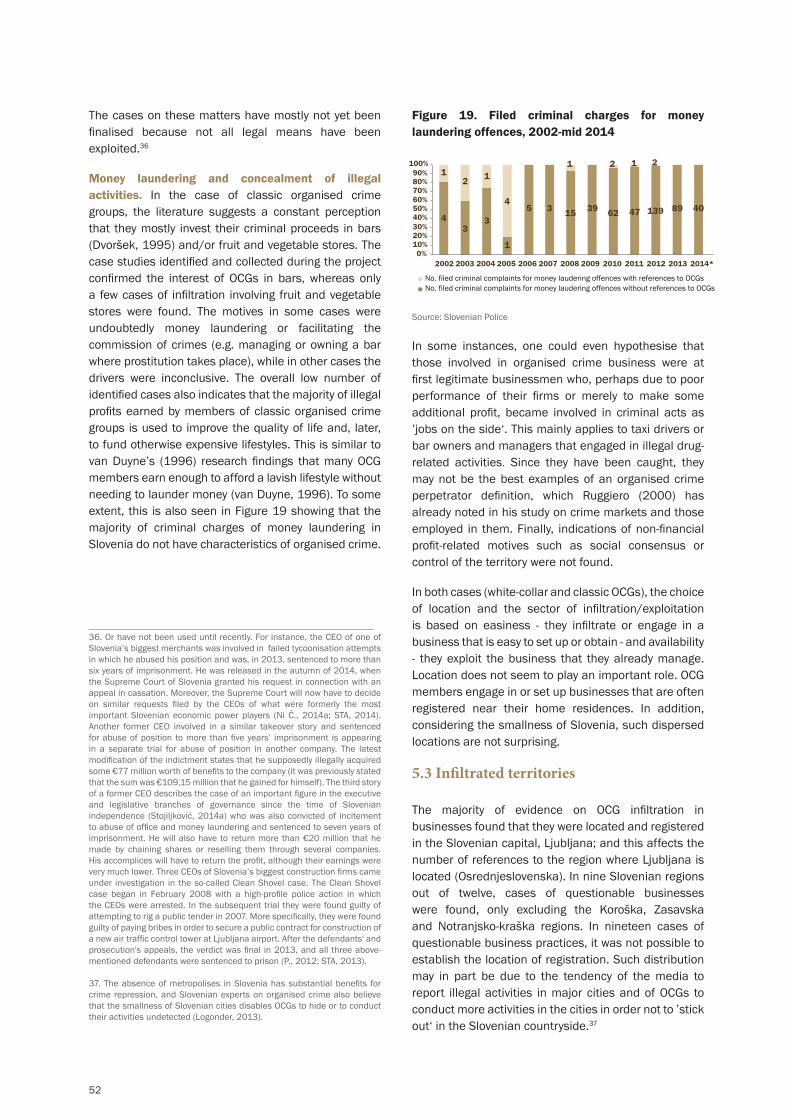
52
The cases on these matters have mostly not yet been finalised because not all legal means have been exploited.36
Money laundering and concealment of illegal activities. In the case of classic organised crime groups, the literature suggests a constant perception that they mostly invest their criminal proceeds in bars (Dvoršek, 1995) and/or fruit and vegetable stores. The case studies identified and collected during the project confirmed the interest of OCGs in bars, whereas only a few cases of infiltration involving fruit and vegetable stores were found. The motives in some cases were undoubtedly money laundering or facilitating the commission of crimes (e.g. managing or owning a bar where prostitution takes place), while in other cases the drivers were inconclusive. The overall low number of identified cases also indicates that the majority of illegal profits earned by members of classic organised crime groups is used to improve the quality of life and, later, to fund otherwise expensive lifestyles. This is similar to van Duyne’s (1996) research findings that many OCG members earn enough to afford a lavish lifestyle without needing to launder money (van Duyne, 1996). To some extent, this is also seen in Figure 19 showing that the majority of criminal charges of money laundering in Slovenia do not have characteristics of organised crime.
Figure 19. Filed criminal charges for money laundering offences, 2002-mid 2014
100%90%80%70%60%50%40%30%20%10%0%
2002
4
1
3
2
3
1
1
415
1
62
2
47
1
139 89 40
2
5 3 39
2003 2004 2005 2006 2007 2008 2009 2010 2011 2012 2013 2014*
No. filed criminal complaints for money laudering offences with references to OCGs No. filed criminal complaints for money laudering offences without references to OCGs
Source: Slovenian Police
In some instances, one could even hypothesise that those involved in organised crime business were at first legitimate businessmen who, perhaps due to poor performance of their firms or merely to make some additional profit, became involved in criminal acts as ’jobs on the side‘. This mainly applies to taxi drivers or bar owners and managers that engaged in illegal drug-related activities. Since they have been caught, they may not be the best examples of an organised crime perpetrator definition, which Ruggiero (2000) has already noted in his study on crime markets and those employed in them. Finally, indications of non-financial profit-related motives such as social consensus or control of the territory were not found.
In both cases (white-collar and classic OCGs), the choice of location and the sector of infiltration/exploitation is based on easiness - they infiltrate or engage in a business that is easy to set up or obtain - and availability - they exploit the business that they already manage. Location does not seem to play an important role. OCG members engage in or set up businesses that are often registered near their home residences. In addition, considering the smallness of Slovenia, such dispersed locations are not surprising.
5.3 Infiltrated territories
The majority of evidence on OCG infiltration in businesses found that they were located and registered in the Slovenian capital, Ljubljana; and this affects the number of references to the region where Ljubljana is located (Osrednjeslovenska). In nine Slovenian regions out of twelve, cases of questionable businesses were found, only excluding the Koroška, Zasavska and Notranjsko-kraška regions. In nineteen cases of questionable business practices, it was not possible to establish the location of registration. Such distribution may in part be due to the tendency of the media to report illegal activities in major cities and of OCGs to conduct more activities in the cities in order not to ’stick out‘ in the Slovenian countryside.37
36. Or have not been used until recently. For instance, the CEO of one of Slovenia’s biggest merchants was involved in failed tycoonisation attempts in which he abused his position and was, in 2013, sentenced to more than six years of imprisonment. He was released in the autumn of 2014, when the Supreme Court of Slovenia granted his request in connection with an appeal in cassation. Moreover, the Supreme Court will now have to decide on similar requests filed by the CEOs of what were formerly the most important Slovenian economic power players (Ni Č., 2014a; STA, 2014). Another former CEO involved in a similar takeover story and sentenced for abuse of position to more than five years’ imprisonment is appearing in a separate trial for abuse of position in another company. The latest modification of the indictment states that he supposedly illegally acquired some €77 million worth of benefits to the company (it was previously stated that the sum was €109,15 million that he gained for himself). The third story of a former CEO describes the case of an important figure in the executive and legislative branches of governance since the time of Slovenian independence (Stojiljković, 2014a) who was also convicted of incitement to abuse of office and money laundering and sentenced to seven years of imprisonment. He will also have to return more than €20 million that he made by chaining shares or reselling them through several companies. His accomplices will have to return the profit, although their earnings were very much lower. Three CEOs of Slovenia’s biggest construction firms came under investigation in the so-called Clean Shovel case. The Clean Shovel case began in February 2008 with a high-profile police action in which the CEOs were arrested. In the subsequent trial they were found guilty of attempting to rig a public tender in 2007. More specifically, they were found guilty of paying bribes in order to secure a public contract for construction of a new air traffic control tower at Ljubljana airport. After the defendants' and prosecution's appeals, the verdict was final in 2013, and all three above-mentioned defendants were sentenced to prison (P., 2012; STA, 2013).
37. The absence of metropolises in Slovenia has substantial benefits for crime repression, and Slovenian experts on organised crime also believe that the smallness of Slovenian cities disables OCGs to hide or to conduct their activities undetected (Logonder, 2013).

53
None1-23-67-9>9
References to OCG infiltration (N=55)
Figure 20. Number of references to OCG infiltration in open sources by region (NUTS 3)38
Source: FCJS elaboration on DCI data
Real estate activities - sometimes used for money laundering and sometimes for other purposes - are often conducted in ex-Yugoslav countries such as Croatia (Modic & Vuković, 2014), Serbia, Bosnia and
Herzegovina, and Kosovo (Predanič, 2008). From the interview with Janko Goršek, a Slovenian police officer attaché in Sarajevo, it can be deduced that there is an increase in economic crime activities by Slovenian businessmen in Bosnia and Herzegovina (Stojiljković, 2014b).
5.4 Infiltrated business sectors
In the Database on Criminal Infiltration only a handful of business sectors appear to be infiltrated by OCGs. However, it should be emphasised that identification of the business sectors for infiltrated businesses reported in the literature proved to be somewhat problematic.39 Legal companies, when registered in the early days of Slovenian independence, listed countless and unconnected activities, sometimes even more than some hundreds. Yet the volume of their business often proved to be very small. This practice was discarded after the improvements made to the company registration procedure, when use of the NACE classification became more regulated. Figure 21 shows the economic sectors where references to OCG infiltration were found.
Figure 21. Number of references to OCG infiltration in open sources by business sector40
Source: FCJS elaboration on DCI data
38. Details on the region of the infiltration (NUTS 3) are available for 55 references.
39. In Slovenia the NACE classification replaced the Standardna klasifikacija dejavnosti (SKD), which can be translated as Standard Classification of Activities (SCA).40. Details on the business sector of the infiltration (NACE 0-digit) are available for 74 references.
SECTORS
Agriculture and fishing
Construction
IT services
Real estate activities
Public administration
Education
Hospitals and residential care
Legal and professionalactivities
Clubs and gambling activities
Personal serviceactivities
Support service activities
Mining and quarrying
Manufacturing
Energy supply
Waste and scrap management
Wholesale and retail trade
Transportation
Hotels, bars and restaurants
Financial and insurance activities
1 - 2
3 - 6
7 - 10
> 10
REFERENCES TO OCG INFILTRATION
54
Bars and night clubs. Among the sectors identified as infiltrated by OCGs, beverage serving activity strongly dominates. Two different socially perceived forms of legal subjects can be found in this category. Though not officially recognised as a category or actual legal classification, the term ‘night club’ (nočni lokal) is used by both the visitors and owners of such clubs to indicate the ‘form’ of the bar. These bars are usually open through the night, and the majority of bars that provide erotic artistic performances also include the term ‘night club’ in their registration name in AJPES. Bars, on the other hand, are usual business subjects that serve beverages until about 10 pm and do not usually provide other services or amusements.
Night bars (or ‘strip bars’) were often found to be connected with forced prostitution. A bar is ostensibly a legitimate business where girls perform various dance routines; but there is often hidden (forced) prostitution in the background (e.g. Furlan-Rus, 2009; Lovšin, 2013; Žist, 2006). Also frequent are signs of human trafficking. In most cases, such businesses are small-scale: bars managed by a couple of perpetrators with connections to a human trafficking network. In relatively few cases, bar owners themselves manage the recruitment and transportation of the women. ‘Classic’ bars, on the other hand, were found to be often managed by an OCG member engaged in drug trafficking (e.g. Lovrenc, 2010). In some relatively few cases, indications were found that bars were used also for the actual exchange of drugs; however, in the majority of cases the deal was discussed in the bar but the actual exchange was made at another location.
Owning or renting a bar is popular partly because of Slovenian culture and partly because the entire process of establishing an entity is not particularly difficult, since the majority of the businesses in question only serve beverages without food (thus decreasing the number of required standards).
Box 2. Slovenia’s largest prosecuted organised crime case: infiltration in bars and restaurants
This frequent connection of bars and their owners’ or managers’ involvement in drug activities is well illustrated by Slovenia’s largest prosecuted organised crime case. The OCG came under scrutiny when several investigative and security agencies, including the Slovenian police, the Serbian Security Information Agency (BIA), and The United States Drug Enforcement Administration (DEA), had concluded the Balkan Warrior operation (balkanski bojevnik)
and presented the results (Bilefsky, 2014). These agencies found that there was an OCG in Slovenia closely connected with a Montenegrin/Serbian crime boss engaged in drug-type (cocaine) criminal activities and with connections throughout the Balkans and even in some EU countries.
The leader of Slovenian ‘branch’ was listed as the owner of several bars and restaurants: if the ownership was not listed in the registers under his name, it was listed indirectly through a company which he and his wife own(ed). The business activities included management of bars and restaurants. After the arrest, the ownerships of businesses and real-estates were changed immediately: they were transferred to his closer relatives or friends. Similar transfers of ownership were performed by other people involved, i.e. by the owners of a construction company, a catering company, and an energy provider company. All of them were registered as micro companies (M. Č., 2011; Ropac, 2014).
Another frequent NACE classification among infiltrated businesses in Slovenia is Amusement and recreation activities, which is used by businesses that engage in ‘providing artistic (erotic) services’ to bars. This usually means that they provide documents for foreign women employed in such bars.
Taxi services and trucking. The variable ‘transportation and renting of motor vehicles’ was used to group the activities of taxi services and trucking. The Slovenians’ fascination with cars (Plevnik, Rejec Brancelj, & Zupan, 2008; Zupančič, 2011) and Slovenia’s location (i.e. on the Balkan route, access to the sea), knowledge of ex-Yugoslavian languages and locations, relative ease of obtaining the permits and licences necessary for such activities41 enable taxi and truck drivers or companies to engage in such businesses. The amount of cargo transferred by Slovenian trucks has been on the increase since 1994 and especially so since Slovenia’s accession to the EU (Plevnik et al., 2008). However, a warning is in order: there are shortcomings in the measuring methodology, because the data include only the cargo transferred in Slovenia by Slovenian trucks, thus excluding data on Slovenian trucks transferring cargo abroad and the data on foreign trucks transferring cargo in Slovenia (Plevnik et al., 2008). The data also
41. In the case of taxi services, for the requirement that applied in the period of our analyses with regard to the selected cases (see Uradni list Republike Slovenije, 1996a, 1996b).

55
show that the Slovenian cargo transportation sector in 2008 and 2011 accounted for up to 7% of GDP (Ključevšek, Fiehn, Hiršl, Knafelc, & Peterca, 2012). The number of taxi companies has also increased since 2004, although even previously it was not a small sector (see Žužek, 2014).
Taxi companies have been used for human smuggling (e.g. Furlan-Rus, 2004). Due to their high mobility, familiarity with roads, traffic, the terrain, and generally well-informed taxi drivers, the design of Slovenian taxi services is suitable for various activities. The media and police also often report the common belief that
taxi drivers also drive clients to and from prostitutes or supply clients to various night bars (throughout Slovenia) in which (forced) prostitution takes place (Žist, 2006). Cargo transportation businesses have often been used for drug smuggling (Ni Č., 2014b; Possnig, 2012). However, it should be emphasised that in these cases the business is not always set up as a front. The owners, though more often drivers (especially if private entrepreneurs), only exploit the opportunity for some additional profit. In some cases, owners are totally unaware of the criminal activities of their drivers. It is possible that, in some cases, the drivers are not aware of the drugs hidden in their vehicles.
Figure 22. Regions (NUTS 3) with at least one reference to OCG infiltration in open sources in the top 3 infiltrated sectors42
Source: FCJS elaboration on DCI data
5.5. Actors and modi operandi
References to infiltration indicate that business entities in Slovenia are established by only two types of OCG groups. The first category includes OCGs mainly constituted by members of Slovenian origin; the second category includes OCGs connected to the groups or perpetrators located in the Balkans, mainly coming from ex-Yugoslav countries. However, there are no major differences in selection of the type of legitimate business that they have infiltrated. The only slight differences are due to the form of illegal activity in which they engage. Since OCGs with members of Slovenian origin are more often engaged in forced prostitution and human smuggling,43 the infiltrated activities are those more suitable for their modi operandi, that is, taxi
Transportation Hotels, bars and restaurants Clubs and gambling activities
services and night bars. On the other hand, the OCGs with ex-Yugoslav origins/connections are more often engaged in drug trafficking activities, which is why bars suit their needs better.
The literature and the case studies on criminal infiltration indicate that the methods used for the acquisition of ownership of a business are quite straightforward and simple. Usually, OCG members merely set up a new business (register it) in accordance with bureaucratic requirements or simply buy an existing business and re-register it in their name. No indication was found that previous owners were threatened or forced into sale. If OCG members are more ‘careful’, the assets are registered in the names of their spouses or relatives.
42. Details on the region of the infiltration (NUTS 3) for transportation, hotels, bars, and restaurants, and clubs and gambling activities are available for 46 references.
43. Human smuggling requires more familiarity with the terrain near Slovenia’s borders. However, the Slovenian police states that the organisation of the groups engaged in people smuggling has reached a level where local ‘help’ is less and less needed (SOJ SGDP GPU, 2014).

56
Strong evidence was found that members of classic OCGs tend to own and/or manage small-scale businesses directly. The majority of firms for which data were found in AJPES declared themselves as micro firms.44 The reviewed cases on white-collar OCGs also indicate a direct involvement of the CEOs of the firms in the majority of criminal cases. Straw men mainly appeared in missing trader cases and in real-estate manipulations.
A mixture of success rates was noted. Some set-up businesses were and still are operational and seem profitable, while some have already been deleted from the Slovenian business registers. No general rule can be applied here.
5.6 Conclusions
There are some obvious and self-evident conclusions to be drawn from the literature. The first is that in Slovenia the literature on the criminal infiltration of legal businesses is scarce.
On using the newly-developed online application named SUPERVIZOR (Komisija za preprečevanje korupcije, 2014), it was found that some of the companies and businesses managed or owned by the subjects arrested for their involvement in classic activities of organised crime had provided services to the Slovenian public sector for a long period of time. Although the earnings were relatively low, it is the accumulative aspect that is worrisome, as the number of the companies was not particularly small. Secondly, in the case of white-collar organised crimes (construction and merchant affairs) the damage was extensive, not to mention that the Slovenian infrastructure and everything connected to it have been damaged and will be handicapped for decades.45
The main facilitating factors of OCG infiltration are the lack of administrative screening and the belated involvement of state economic institutions (e.g. Ministry of Economy, Tax Administration) in investigation and the development of preventive measures, as well as better developed and properly used regulatory powers. Some good practices are described in Levi & Maguire (2004). Public administration workers are not obliged to conduct basic searches on credit ratings, previous criminal
involvement, and the possibility of a mailbox address scheme, before issuing a certain permit or licence. Moreover, the opening of numerous firms registered at the address where numerous other firms have already been registered without sounding the alarm46 is becoming a frequent problem in exploitation of workers as well (Bučar-Ručman & Frangež, 2014; Modic & Kralj, 2014). Such straw companies are established in order to acquire the papers necessary for foreign workers to enter Slovenia. Once in Slovenia, they can move freely inside the EU and become victimised by exploiters from other countries (Bučar-Ručman & Frangež, 2014).
Other facilitating factors can be attributed to the inspection services, which are often criticised for being lazy and toothless. The finding that many women in forced prostitution have been paid with cash-in-hand, have worked overtime, and have lived at a location not listed on their entrance permits, shows that the Slovenian inspection services are ineffective. The GRETA (Group of Experts on Action against Trafficking in Human Beings), in its latest country report, also urges the Slovenian authorities to develop and implement periodic training programmes that would enable the development of identification skills and deepen the knowledge on human trafficking of all relevant professionals (e.g. the staff of administrative units responsible for issuing residence permits, labour inspectors, judges, lawyers) (GRETA, 2014). Thus, in their research on human trafficking and exploitation of men for what could almost be regarded as slavery, Bučar-Ručman & Frangež (2014) have found a similar modus operandi of exploiters, who used economic violence, had their workers registered at one address while they really lived at another, and in various ways misled state agencies.
Finally, the information collected during the project has provided support for claims on organised crime groups involvement in bars and restaurants (Dvoršek, 2002).The slow paced improvement of Slovenian legislation on asset recovery and of investigative and preventive measures may favour corruption activities, which also involve the Slovenian economic elites (Klemenčič, Praprotnik, & Selinšek, 2013). Such measures may – in the long run – limit the commission of sophisticated forms of crime.
44. The classification is based on the provisions given in the Uradni list Republike Slovenije (2006). According to article 55 of the act: a ‘micro company shall be a company meeting two of the following criteria:
- average number of employees in a financial year does not exceed 10,- net sales income does not exceed 2,000,000 euros, and- value of assets does not exceed 2,000,000 euros.’
45. Slovenia’s healthcare system is under heavy accusations regarding corruption. Due to the fact that water, energy, and road management are all controlled by the State or/and the local public sector, the state and local politicians extend their influence and improperly control
public procurements and funding, hence exploiting the companies and/or the Slovenian budget. The recent cases include the notorious TEŠ6 project (the construction of a new lignite block at the existing thermal power plant) and various healthcare corruption schemes. The directors of the Slovenian Commission for Prevention of Corruption (CPC) resigned in protest on November 29, 2013, claiming that Slovenian political elites blocked any attempts to remedy the situation described. As the CPC often emphasises, Slovenia is in thrall to political and economic elites (Klemenčič, Praprotnik, & Selinšek, 2013).
46. No alarm is sounded also if the same person frequently opens and closes businesses. The person declares bankruptcy on one firm but opens another with a ‘clean slate’.

57
6. Sweden47
6.1 Introduction
The organised crime situation in Sweden is more focused on networks than on stable organisations, hierarchies or environments. For this reason, the border between organised crime and economic crime (committed by perpetrators in networks) is sometimes rather blurred. This is also a problem for this chapter because it can be difficult to distinguish between organised and network-related economic crime. To complicate matters further, law enforcement agencies report that notorious white-collar criminals are teaming up with organised crime in joint criminal projects (EBM, 2013a; RKP, 2012b).
During the past ten years, asset recovery has been a major topic in criminal policy. Several law enforcement and regulatory agencies, such as the tax authority and the enforcement authority, have developed routines for asset recovery and hired economists to carry out financial investigations in the intelligence phase as well as during pre-trial investigations. Since July 2014, a new anti-money laundering law has introduced the ability to freeze funds in accounts and ‘self-laundering’.
However, the seized assets have more to do with cash, cars, motorcycles, boats, jewellery and watches than investments in businesses, real estate or bonds. This is of course a result of the rather low level of organised crime investments in the Swedish economy. But there are some well-known cases where Swedish organised crime offenders have made investments in the legal economy. Research on the financial management of drug crime and organised tax fraud suggests that profit from crime is indeed invested in legitimate businesses (Brå, 2007b, 2011b). Some investments take place in Sweden, some abroad – usually in places where the offender has family, friends or other ties. It seems very rare that foreign organised crime groups invest in Swedish businesses.
While infiltration in the legal economy is an unfamiliar concept in the Swedish context, experts who participated in seminars organised during the project had experienced how people in - and affiliated with - organised crime are becoming increasingly involved in legitimate businesses (see RKP, 2012b). By tradition it is relatively easy to start a business in Sweden; something that organised crime take advantage of (EBM, 2012; Larsson, 2008).
Research on the ways in which organised crime groups take over and use legitimate businesses is scarce. There is also an absence of a penal code that targets the act of infiltration. Instead, relevant ‘infiltration crimes’ in the Swedish context are likely to include various types of forgery, fraud, tax evasion, accounting offences, and extortion.
Furthermore, Swedish constitutional law has a relatively permissive approach to freedom of association, according to which organisations cannot be criminalised. Hence, membership of outlaw motorcycle gangs and other organisations viewed as ‘criminal’ by both the police and the general public is not illegal in Sweden. Consequently, members of those organisations are free to own, set up, and acquire businesses. Another aspect is that Swedish law does not penalise legal persons such as businesses and associations. Rather, the law targets individuals and their actions, which was a challenge in identifying suitable cases for the study.
Methodological remarks
This chapter is based on what little research was available – largely conducted at Brå. Added to that research are strategic reports from law enforcement agencies and newspaper articles. The oldest reports and articles were from 2006, the most recent ones from 2013. The literature and the newspaper articles were organised and coded in the Database on Criminal Infiltration (DCI). With the help of some newspaper articles, a good number of case studies was also found and analysed in-depth during the project. Out of the 140 references, 45 originated from newspaper articles. Only 23% references originated from around 10 academic publications. The remaining sources can be classified as analysis and situation reports by authorities and in some cases member organisations for companies (Figure 23).
47. With the collaboration of Helena Rönnblom, Johanna Skinnari and Lars Korsell (Swedish National Council for Crime Prevention - Brå, Sweden).

58
Figure 23. Percentage of references to OCG infiltration in open sources by type of source
figure 1
figure 2
figure 3
figure 10
figure 15
figure 18
figure 19
figure 20
Figure 24
figure 27
figure 31
figure 32
figure 34
figure 35
figure 36
figure 37
figure 39
figure 40
figure 41
figure 42
figure 43
figure 45
figure 46
figure 47
figure 48
figure 49
figure 50
figure 51
9.2%
49.8%
1.3%
17.1%
22.5%
54.8%25.4%
3.1%
5.9%
10.8%
27%
25%
1%
15%
32%
43%
33%
20%
3% 1%
20%
1%3%
5%
70%
100%90%80%70%60%50%40%30%20%10%
0%2002
4
1
3
2
3
1
1
4
15
1
62
2
47
1
139 89 40
2
5 3 39
2003 2004 2005 2006 2007 2008 2009 2010 2011 2012 2013 2014*
21%
15%
1%4%
59%
21
11
8
20
10
164
34
35
43
23
20
25
15
10
5
01 2 3 4 5 6 7 8 9 10 >10
21%
16%
22%
21%
19%
70%80%90%
100%
40%50%60%
20%30%
10%0%
70%80%90%
100%
40%50%60%
20%30%
10%0%
Italy (N=164)
Slovenia(N=35)
Sweden(N=43)
UK(N=23)
TheNetherlands
(N=34)
Italy (N=21)
Slovenia(N=8)
Sweden(N=20)
UK(N=10)
TheNetherlands
(N=11)
Italy Slovenia Sweden UKTheNetherlands
70% 14
5
62
40%
50%
60%
20%
30%
10%
0%
600
500
400
300
200
100
0
0.20%
0.30%
0.10%
0.50%
0.60%
0.70%
0.80%
0.40%
0.00%2002
0.72%
0.51%
0.26%
0.47%0.56%
0.33%
0.44% 0.47%0.39%
0.36%
0.58%0.52%
0.24%
2003 2004 2005 2006 2007 2008 2009 2010 2011 2012 2013 2014*
38
6
10
5
7
70%80%90%
100%
94
25
19
35
2
40%50%60%
20%30%
10%0%
Italy (N=164)
Slovenia(N=35)
Sweden(N=43)
UK(N=23)
TheNetherlands
(N=34)
Public limited companies
Private limited companies
Partnerships
Sole traders
Other legal forms
NA
20% 40% 60% 80% 100%0%
figure 44
70%80%90%
100%
40%50%60% 90
11
22 26
17
20%30%
10%0%
Italy (N=164)
Slovenia(N=35)
Sweden(N=43)
UK(N=23)
TheNetherlands
(N=34)
10
12
6
8
4
2
14
16
0Money
launderingFraud OtherFormally legal
activitiesConcealment
of illegal activities
4 43
5
15
Italy (N=164)
Slovenia(N=35)
Sweden(N=43)
UK(N=23)
TheNetherlands
(N=34)
70%80%90%
100%
40%50%60%
20%30%
10%0%
40%
50%
20%
30%
10%
0%Italy
(N=137)Slovenia(N=32)
Sweden(N=34)
UK(N=18)
70%80%90%
100%
40%50%60%
20%30%
10%0%
Italy (N=21)
Slovenia(N=8)
Sweden(N=20)
UK(N=10)
TheNetherlands
(N=11)
Italy(N=164)
Slovenia(N=35)
Sweden(N=43)
UK(N=23)
TheNetherlands
(N=34)
Italy(N=164)
Slovenia(N=35)
Sweden(N=43)
UK(N=23)
TheNetherlands
(N=34)
70%80%90%
100%
40%50%60%
20%30%
10%0%
70%80%90%
100%
40%50%60%
20%30%
10%0%
30%
24.9%0.8%
Academic study Judicial evidence
LEA report Media Other
N = 2,380
N = 2,380
N = 2,380
N = 1,305
N = 604
Institutional report
15%
29%
0.4%
Local OCGs Motorcycles gangsItalian mafias
Other OCGs NA
Italy SloveniaThe Netherlands
Sweden UK
Academic study
Judicial evidence LEA report Media
Institutional report
Academic study
LEA report Media
No. criminal charges with references to OCGs % OCGs in relation to all criminal charges
% O
CGs
in re
latio
n to
all
crim
inal
cha
rges
Other
Institutional report
No.
crim
inal
cha
rges
with
refe
renc
es to
OCG
s
Academic study
Judicial evidence LEA report Media
Institutional report
N = 74
23%
24%
20%
32%
1% N = 140
N = 257
N = 70
N = 299
Academic study
LEA report Media Other
Institutional report
No. filed criminal complaints for money laudering offences with references to OCGs
No. filed criminal complaints for money laudering offences without references to OCGs
Academic study
Judicial evidence LEA report Media
Institutional report
Italy SloveniaThe Netherlands
Sweden UK
Italy SloveniaThe Netherlands
Sweden UK
Money laundering FraudFormally legal activities
Concealment of illegal activities Other
Money laundering FraudFormally legal activities
New business NAAlready existing business
Concealment of illegal activities Other
90
53
19
24
9
14
4
30
15
29
21
20% 40% 60% 80% 100%0%
Public limitedcompanies
Private limitedcompanies
Partnerships
Sole traders
Other legal forms
NA
Italy SloveniaThe Netherlands
UKSweden
Public limitedcompanies
Private limitedcompanies
Partnerships
Sole traders
Otherlegal forms
NA
20% 40% 60% 80% 100%0%
Cosa Nostra (N=14) Camorra (N=74)‘Ndrangheta (N=47)
Other Italian (N=13)Chinese (N=16)
Money laundering Fiscal fraudFormally legal activities
Corporate fraud OtherConcealment of illegal activities
Relatives Legal entrepreneursProfessionals
Women among shareholders Women as majority shareholders
Legal companies
53
7
6
14
98
3
1
8
4
1
Small LargeMedium Very large NA
Italy SloveniaThe Netherlands
Sweden UK
0 4-101-3 11-20 >20 NA
Source: Brå elaboration on DCI data
To gain a better picture of the concept of infiltration, we invited two reference groups to follow the project, one consisting of experts from law enforcement agencies and one with experts from the private security sector. A seminar was held with each group at the beginning of the project, and another halfway through the project. The reference groups also provided us with case studies to be analysed during the project.
6.2 Drivers
Profit. Unsurprisingly, financial gain is a frequent motive for infiltration. In a sense, all the drivers listed below concern profit from either legal or illicit business activities. While some arrangements require a lot of time and preparation, others are made rapidly and target easy money. As we shall see, business set-ups may also vary in complexity.
The infiltrated business may be targeted for the sake of its assets or for the purpose of making money by running the business. Companies may also be targeted because they are business competitors of other infiltrated businesses. In these cases, the purpose of disturbing a business competitor is to increase the profit of one’s own company. Although there are many prosperous companies, research suggests that perpetrators often have unrealistic ideas of their profitability and underestimate the costs of running the business. Instead of reading the annual reports, their impression of profitability is based on simple observations of the number of customers or clients in a business, and turnover rather than actual profit (Brå, 2012b).
In some cases, organised crime seeks to take over certain segments of the business and run these as separate operations. A typical example is provided by cloakrooms at restaurants and night clubs (Brå, 2012b). Another is security outside restaurants: by controlling this, organised crime also controls who enters the restaurant to do business.
Money laundering. Another reason for taking over or starting up a new business is to launder money. Money laundering may be carried out in different ways. According to the FIU, organised crime may have direct or indirect connections to businesses which they use for money laundering (RKP, 2012a). One arrangement is to start a business in order to mask criminal money as legal turnover and profit.
Whilst not all money laundering involves infiltrated businesses, the money laundering act stipulates that businesses that handle transactions of large sums in cash are obliged to report suspicious transactions to the FIU at the NBI. These actors include banks and other financial institutions, exchange offices and other money transfer companies, real estate agencies, insurance agencies, accountants, tax advisors, and traders with goods whose value exceed €15,000. About 15,000 businesses in Sweden are affected by this regulation; however, less than one per cent of them report transactions to the FIU. In other words, in addition to the 10,000 transactions that are reported annually, there are large numbers of unreported cases (Brå, 2011a; RKP, 2012a, 2013).
Banks and other financial institutions have become more likely to report suspicious transactions and deny transactions (Brå, 2011a). Therefore organised crime shows an increased interest in infiltrating currency exchange offices (Brå, 2008b, 2011a, 2011b; EBM, 2013a; RKP, 2013). There are examples of organised crime placing or recruiting insiders at currency exchange offices in order to reduce the risk of being reported (Brå, 2007b, 2011b, 2012b; RKP, 2012b). Another method is to start one’s own exchange office
where both one’s own criminal returns and those of others may be laundered (Brå, 2008b; Noroozi & Lind, 2013).
Obtain information. Research suggests that organised crime members with little experience of economic crime may need expert help when entering this crime field (Brå, 2014a). The motive for infiltrating small accounting firms is to obtain knowledge about accounting and taxation, and other financial competences. This information is used to create new crime plans and to find opportunities to conduct business in the grey area. Self-employed accountants and financial advisors, as well as small firms, thus become targets for infiltration.
59
Gain access to social benefits. The Swedish social welfare system is relatively comprehensive by international standards. Being employed, or at least having a taxed income, provides many types of benefits such as parental insurance, sickness benefit, pension, and unemployment benefit. Employers receive the largest payments; in this case organised crime members can, as business owners, get subsidies to hire staff. There are even certain subsidies for those who hire people with a criminal record. In the event of bankruptcy, a guaranteed wage is paid by the County Administrative Board to employees to cover the first three months of unemployment, which may create an incentive for organised crime to start businesses, pretend to create job opportunities, and then lead the company to bankruptcy.
For organised crime running a business, the social welfare system also offers opportunities for employers to keep the illicit wages low. This is because the employees can survive on low wages and at the same time claim unemployment and sickness benefits (Brå, 2011b; ISF, 2011; RKP, 2012b). They do not demand more from the employer, especially not one helping them into the welfare system by providing the necessary fake documentation. There are indications that doctors may sometimes be part of the arrangement, producing fake medical certificates for those not sick enough to qualify for benefits (Brå, 2011b). In these cases, the doctor is acting in the interest of organised crime.
Create employment for friends and relatives. A study on unlawful influence on business owners has identified cases where criminals take over companies simply to become employers (Brå, 2012b). In these few cases, job offers to friends or family members are real in the sense that the employees carry out actual work and are paid. Being an employer may also be part of an identity as a businessperson, and offering job opportunities a way to obtain services and favours from others. This driver may be connected to the motive to exploit the social welfare system because several benefits are income related. Thus a high salary (on paper) leads to a high benefit.
Gain status within the criminal or legal sphere. Running a business and being an employer may also strengthen one’s influence in the community, be it a town, guild or ethnic group. It may also legitimise and mask one’s illegal activities and facilitate establishing oneself in society as a business owner, rather than as a criminal (Brå, 2007b, 2012b).
Restaurants and bars are examples of sectors in which this may be particularly relevant, and previous research indicates that owning a restaurant is highly regarded in criminal circles (Brå, 2007b, 2011a; Korsell, Skinnari,
& Vesterhav, 2009). Running a business also creates an interface with other actors, both criminal and legal, which may be useful in future criminal enterprises.
Gain access to markets for stolen or illicit goods. Finally, organised crime is interested in infiltrating legitimate businesses because this facilitates the use of markets for stolen or otherwise illicit goods and services such as drugs, smuggled or untaxed alcohol, and sex (Brå, 2006; Korsell et al., 2009). Organised crime groups are often involved in the above-mentioned illegal activities, and controlling a legitimate business, such as a restaurant, creates an opportunity to sell for example smuggled or untaxed alcohol and cigarettes.
Night clubs may be used for prostitution. Mixing stolen goods with legal products in a legitimate business also reduces suspicions of both authorities and customers (Brå, 2006; Korsell et al., 2009).
6.3 Infiltrated territories
Knowledge about organised crime investment in legal businesses (stocks, shares or other kinds of ownership) is rather scarce. According to both research and seminar participants, offenders seem to invest in ‘familiar’ and low key technological sectors like restaurants, bars, transport and construction businesses. There are also investments in real estate. The volume of investments is hard to assess, but compared to consumption levels investments are rare (Brå, 2007b, 2011b, 2014a). There are also investments abroad, in former domestic countries or in countries popular for tourists or retired persons such as Spain and Thailand.
Both the literature and the expert seminars suggest that organised crime infiltration in Sweden mainly takes place in the three metropolitan regions: the county of Stockholm, Skåne (with Malmö) and Västra Götaland (with Gothenburg). This has of course to do with the fact that Sweden is highly urbanised and that most economic activities are conducted in these regions. However, organised criminals operate throughout the country, and according to seminar participants, infiltration takes place where these perpetrators find opportunities. Especially middle-sized cities and surrounding, rural areas are targeted.
The high concentration in the three city regions is replicated by reports of suspicious transactions (signs of money laundering): these cities account for 84% of the reports (61% are reported in Stockholm County) (Brå, 2011a). It should be mentioned that another concept related to infiltration – extortion of businesses – is also overrepresented in Stockholm; more than 50% of the reported extortion cases concern businesses in Stockholm, while only 24% of all job opportunities are located in that city (Brå, 2012c).
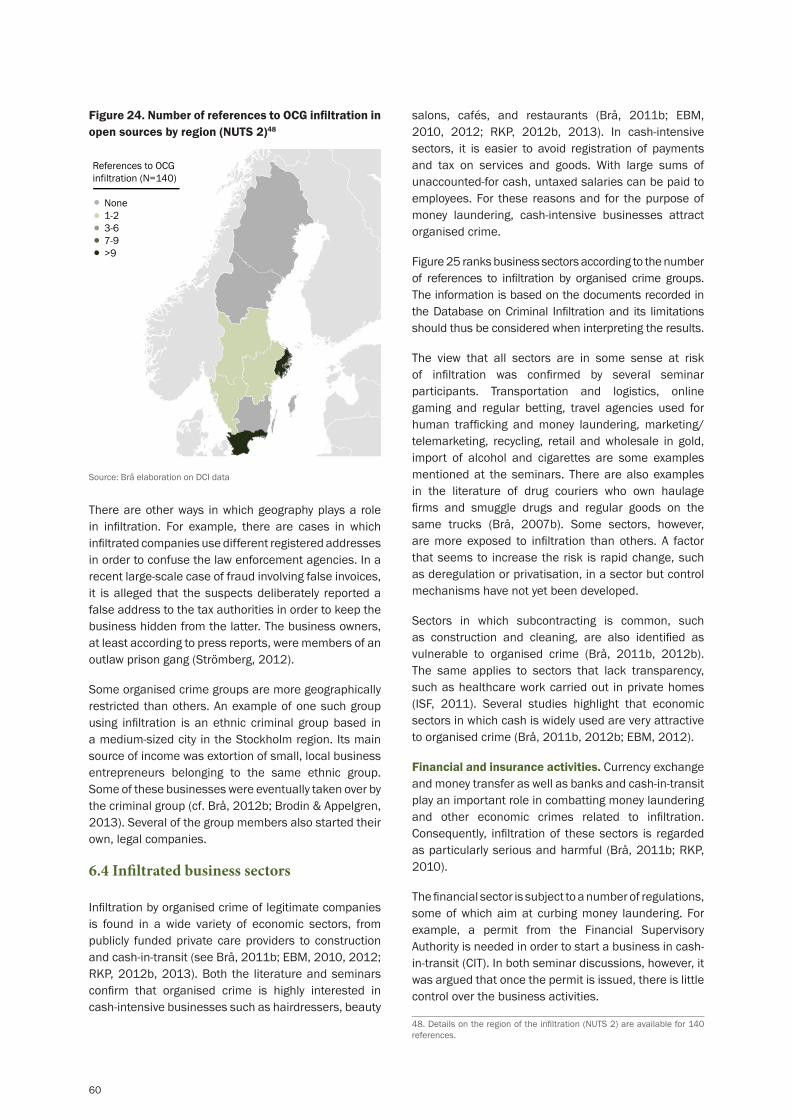
60
Figure 24. Number of references to OCG infiltration in open sources by region (NUTS 2)48
None1-23-67-9>9
References to OCG infiltration (N=140)
Source: Brå elaboration on DCI data
There are other ways in which geography plays a role in infiltration. For example, there are cases in which infiltrated companies use different registered addresses in order to confuse the law enforcement agencies. In a recent large-scale case of fraud involving false invoices, it is alleged that the suspects deliberately reported a false address to the tax authorities in order to keep the business hidden from the latter. The business owners, at least according to press reports, were members of an outlaw prison gang (Strömberg, 2012).
Some organised crime groups are more geographically restricted than others. An example of one such group using infiltration is an ethnic criminal group based in a medium-sized city in the Stockholm region. Its main source of income was extortion of small, local business entrepreneurs belonging to the same ethnic group. Some of these businesses were eventually taken over by the criminal group (cf. Brå, 2012b; Brodin & Appelgren, 2013). Several of the group members also started their own, legal companies.
6.4 Infiltrated business sectors
Infiltration by organised crime of legitimate companies is found in a wide variety of economic sectors, from publicly funded private care providers to construction and cash-in-transit (see Brå, 2011b; EBM, 2010, 2012; RKP, 2012b, 2013). Both the literature and seminars confirm that organised crime is highly interested in cash-intensive businesses such as hairdressers, beauty
salons, cafés, and restaurants (Brå, 2011b; EBM, 2010, 2012; RKP, 2012b, 2013). In cash-intensive sectors, it is easier to avoid registration of payments and tax on services and goods. With large sums of unaccounted-for cash, untaxed salaries can be paid to employees. For these reasons and for the purpose of money laundering, cash-intensive businesses attract organised crime.
Figure 25 ranks business sectors according to the number of references to infiltration by organised crime groups. The information is based on the documents recorded in the Database on Criminal Infiltration and its limitations should thus be considered when interpreting the results.
The view that all sectors are in some sense at risk of infiltration was confirmed by several seminar participants. Transportation and logistics, online gaming and regular betting, travel agencies used for human trafficking and money laundering, marketing/telemarketing, recycling, retail and wholesale in gold, import of alcohol and cigarettes are some examples mentioned at the seminars. There are also examples in the literature of drug couriers who own haulage firms and smuggle drugs and regular goods on the same trucks (Brå, 2007b). Some sectors, however, are more exposed to infiltration than others. A factor that seems to increase the risk is rapid change, such as deregulation or privatisation, in a sector but control mechanisms have not yet been developed.
Sectors in which subcontracting is common, such as construction and cleaning, are also identified as vulnerable to organised crime (Brå, 2011b, 2012b). The same applies to sectors that lack transparency, such as healthcare work carried out in private homes (ISF, 2011). Several studies highlight that economic sectors in which cash is widely used are very attractive to organised crime (Brå, 2011b, 2012b; EBM, 2012).
Financial and insurance activities. Currency exchange and money transfer as well as banks and cash-in-transit play an important role in combatting money laundering and other economic crimes related to infiltration. Consequently, infiltration of these sectors is regarded as particularly serious and harmful (Brå, 2011b; RKP, 2010).
The financial sector is subject to a number of regulations, some of which aim at curbing money laundering. For example, a permit from the Financial Supervisory Authority is needed in order to start a business in cash-in-transit (CIT). In both seminar discussions, however, it was argued that once the permit is issued, there is little control over the business activities.
48. Details on the region of the infiltration (NUTS 2) are available for 140 references.
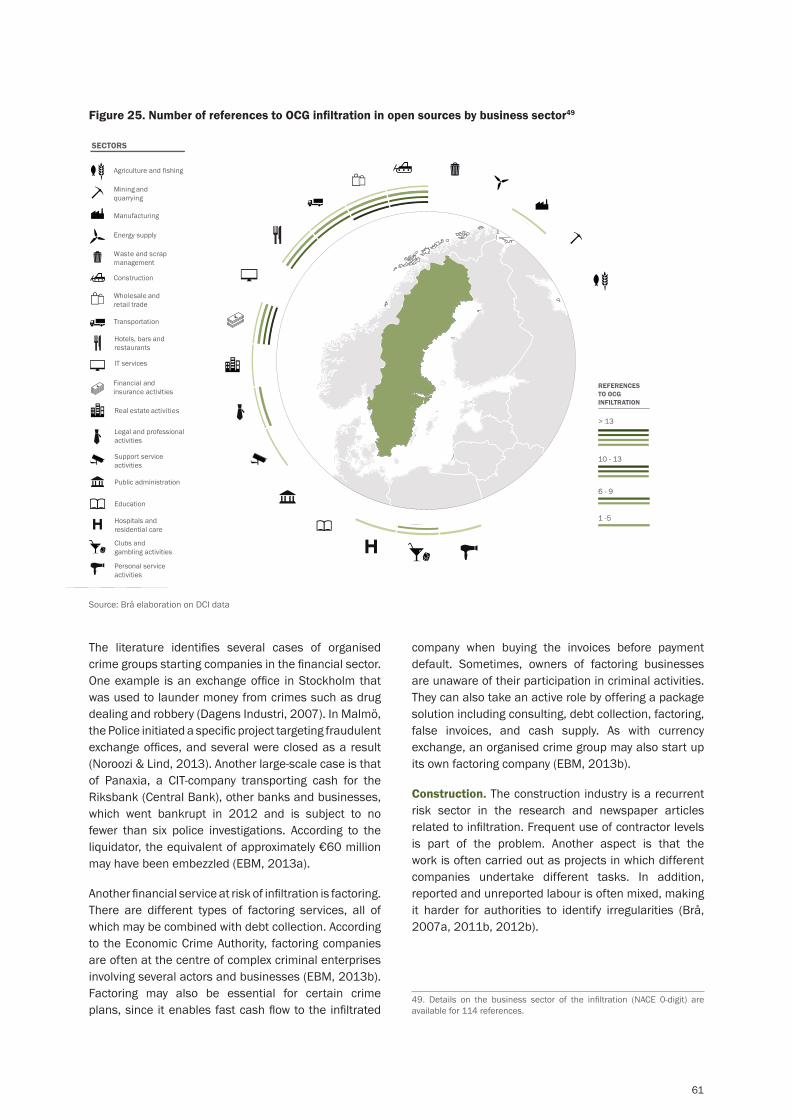
61
Figure 25. Number of references to OCG infiltration in open sources by business sector49
The literature identifies several cases of organised crime groups starting companies in the financial sector. One example is an exchange office in Stockholm that was used to launder money from crimes such as drug dealing and robbery (Dagens Industri, 2007). In Malmö, the Police initiated a specific project targeting fraudulent exchange offices, and several were closed as a result (Noroozi & Lind, 2013). Another large-scale case is that of Panaxia, a CIT-company transporting cash for the Riksbank (Central Bank), other banks and businesses, which went bankrupt in 2012 and is subject to no fewer than six police investigations. According to the liquidator, the equivalent of approximately €60 million may have been embezzled (EBM, 2013a).
Another financial service at risk of infiltration is factoring. There are different types of factoring services, all of which may be combined with debt collection. According to the Economic Crime Authority, factoring companies are often at the centre of complex criminal enterprises involving several actors and businesses (EBM, 2013b). Factoring may also be essential for certain crime plans, since it enables fast cash flow to the infiltrated
Source: Brå elaboration on DCI data
company when buying the invoices before payment default. Sometimes, owners of factoring businesses are unaware of their participation in criminal activities. They can also take an active role by offering a package solution including consulting, debt collection, factoring, false invoices, and cash supply. As with currency exchange, an organised crime group may also start up its own factoring company (EBM, 2013b).
Construction. The construction industry is a recurrent risk sector in the research and newspaper articles related to infiltration. Frequent use of contractor levels is part of the problem. Another aspect is that the work is often carried out as projects in which different companies undertake different tasks. In addition, reported and unreported labour is often mixed, making it harder for authorities to identify irregularities (Brå, 2007a, 2011b, 2012b).
49. Details on the business sector of the infiltration (NACE 0-digit) are available for 114 references.
SECTORS
Agriculture and fishing
Construction
IT services
Real estate activities
Public administration
Education
Hospitals and residential care
Legal and professionalactivities
Clubs and gambling activities
Personal serviceactivities
Support service activities
Mining and quarrying
Manufacturing
Energy supply
Waste and scrap management
Wholesale and retail trade
Transportation
Hotels, bars and restaurants
Financial and insurance activities
REFERENCES TO OCG INFILTRATION
1 -5
6 - 9
10 - 13
> 13

62
Both the literature and seminars confirm that the construction industry attracts people from e.g. outlaw motorcycle gangs (Brå, 2009, 2011b). It is not unlikely that many of these individuals were construction workers before they became members of organised crime groups. As organised crime groups in Sweden are not criminal in a legal sense, a respected construction company which discovers that staff members are affiliated with organised crime has limited opportunity to act on this information. Doing so, for example by terminating a contract, may lead to a lawsuit or conflict with the labour union. The same applies to cases where members of an organised crime group start a construction company. A few cases have been highlighted in the media, but since this is not criminalised, the police have little room for manoeuvre (Brink, 2003).
In the construction sector, widespread tax evasion is said to have affected market pricing. This means not only that criminal individuals and organisations make profits, but also, some argue, that their actions may force other, honest entrepreneurs to do the same (Brå, 2011b). The result is said to be that even some honest entrepreneurs are considering the use of illicit labour in order to compete with criminal entrepreneurs in this market. The honest entrepreneurs thereby become vulnerable to infiltration because they become involved with organisers and facilitators in the illicit part of the construction sector.
Restaurants, bars, and related business. The fact that restaurants and bars attract criminal individuals is well-established in organised crime research (Brå, 2007b, 2011a, 2012b; EBM, 2010; Korsell et al., 2009; RKP, 2012b). The reasons are many: first, frequent visits to restaurants and bars are part of the criminal identity. Hence, when investing criminal assets, it is logical to invest in a business that one understands and is familiar with. Second, research suggests that the planning of future crimes, such as drug smuggling, sometimes takes place in restaurants or bars between people that know each other from this environment (Brå, 2007b). Restaurant owners are also overrepresented as victims of extortion (Brå, 2012b). Finally, the frequent use of cash in restaurants and bars means that they are useful for laundering money, paying for illicit labour, and selling untaxed, illicit or stolen goods (Brå, 2007b, 2011b; EBM, 2010).
Infiltrated businesses are sometimes used to provide restaurants and small shops with smuggled or untaxed alcohol and cigarettes. The fact that alcohol and tobacco are subject to excise tax enables large-scale
tax fraud when importing the goods legally but failing to pay tax when reselling them to other actors such as restaurants, bars, and kiosks. Having control over or running a business with a licence to import alcohol or tobacco thus presents an opportunity to carry out excise tax fraud. This type of crime requires expertise, international connections, as well as buyers of the imported goods (the restaurants and shops mentioned above) (EBM, 2010).
Hairdressers and beauty salons. The trade organisation for Swedish hairdressers argues that the sector is so exposed to tax fraud that pricing has been affected. Honest businesses are being outcompeted by cheaters and some even argue that it is virtually impossible for honest businesses to match market prices. Thus, owners are forced to shut down or ‘forced’ into tax evasion (Eriksen, 2012). As a consequence, more than individual businesses infiltrated by organised crime groups, the entire hairdressing sector might be considered as infiltrated. There are also a few examples in the literature of organised crime group members that fund health and beauty salons run by their girlfriends (Brå, 2007b).
In one of the cases identified in the literature, a hairdressing salon only reported half of the purchases. The estimated tax evasion amounted to at least 3.3 million SEK over two years. The manager of the salon was affiliated with an ethnic organised crime group in the Stockholm region and was also involved in an investigation regarding fraud in a residential care business (Granström, 2013). This example illustrates how people in organised crime are often involved in different types of crime and are not limited to a specific business sector.
Residential care. Some seminar participants argued that deregulation of the residential care sector is part of the reason for organised crime’s interest in this sector. The deregulation has resulted in several private, profit-driven actors (SOU, 2012, 2014). Residential care for disabled and elderly persons is publicly financed but may be carried out by private enterprises. A lump sum for each hour of care delivered to the beneficiary is given to the company, and the company is responsible for ensuring that the care is furnished. In 2014 the sum per hour was 280 SEK. By providing less care than reported to the authorities, or keeping costs very low, the company can make a great deal of money illegally (benefit fraud). Seminar participants underlined the difficulty of identifying organised criminals in the larger pool of active profit-driven actors who want to increase the granted hours for their clients. In addition,
63
this sector is characterised by scant transparency because care is delivered in private homes. Therefore, regulators such as the Social Insurance Agency or social administrations have little ability to verify that rules are complied with and reported work is actually carried out.
Until January 1, 2011, personal care assistance was characterised by a greater lack of control mechanisms; no permits were needed in order to start a business in this sector (SOU, 2012, 2014). At present, a permit from the National Board of Health and Welfare is needed. Some argue that prior to the reform there were little incentives for organised crime to infiltrate existing companies, since starting new ones was relatively easy. Seminar participants were concerned that after the reform it may become more appealing to infiltrate a business with a licence to deliver personal care assistance.
Residential care for the disabled provided by so-called ‘personal care assistants’ is sometimes highlighted as especially vulnerable to irregularities (ISF, 2011; SOU, 2012). While some approaches only require one person to fabricate or exaggerate his or her disability and a couple of care assistants to take part in the fraud, large-scale and organised arrangements require a legitimate company. The latter approach requires higher levels of organisation, involving a company and multiple employees. Other fraud designs involve a disabled person who exaggerates the need for care. Others involve people who in fact have no disability at all. In both cases, the care assistants do not carry out the work, but the company still reports the work to the Social Insurance Agency and is paid by the latter (ISF, 2011; SOU, 2012).
There are also examples of beneficiaries that are unaware of the fraud. In these cases, they are also often unaware of their right to care. If so, relatives, friends or others are orchestrating the fraud. In other circumstances, the company organising the care is the instigator, often taking advantage of the fact that the disabled person and his or her relatives are unaware of the legal framework and the right to care assistance. Sometimes, relatives of the disabled person carry out the work with very little pay, unaware of the amount of the lump sum for each hour of care delivered. The lower the wages, the larger the profit, regardless of whether or not the company is infiltrated. In some of these cases there are also suspicions that, instead of using human smuggling, some foreigners have been ‘imported’ (using work permits issued for employment as assistants) to play a part in these organised benefit fraud set-ups (ISF, 2011).
Cleaning and maintenance. The cleaning and maintenance industry has for decades been known as a sector at risk of economic and organised crime. The sector shares a risk factor with construction: namely sub-contracting (Brå, 2011b; Skatteverket, 2009b). In an analysis on known tax evasion set-ups in this sector, the National Tax Authority has identified the following process (Skatteverket, 2009b):
• A cleaning company provides cleaning services to a client.
• The cleaning company hires illicit labour, paying only a small fraction in salary compared to what it charges the client.
• The cleaning company appoints a factoring company that sells fraudulent invoices from an imaginary sub-contractor, making it seem that it has legitimate expenses for the cleaning work, when in fact it does not.
There are some factors that make the cleaning and maintenance industry attractive to organised crime. First, the work is unskilled. One does not need to understand the language and there is no need for training. Therefore, illicit workers and illegal immigrants – with low salaries – can be hired. Second, the work is mostly carried out during the evening, at night and in the early morning, when control is low.
Sport clubs. While not identified as a risk sector in the literature, the relationship between sport club supporter groups and organised crime has been established in investigative journalism (Johansson, 2013; Laul, 2013). An evaluation of sport-related criminality establishes that so-called ‘risk supporters’ are sometimes also involved in organised crime, although the author of the report draws a clear distinction between sport-related criminality (hooliganism) and organised crime (Nordh, 2013).
Some sport clubs are run as joint-stock companies, i.e. legitimate businesses. As such, sport clubs handle large amounts of cash from, for example, sales of souvenir t-shirts, caps, and other merchandise at games. In addition, sport clubs offer money laundering opportunities through sponsorship. One such case was identified in the literature review, and other suspicions have been mentioned in seminars (Kayhan, 2013).

64
But sport clubs also attract organised crime for a completely different reason. Violent supporter groups, or ‘firms’, attract passionate youths and thus provide an opportunity for members of organised crime groups to establish an intimidation capital which in turn enables them to advance up the criminal hierarchy (Brå, 2008a, 2009, 2012b; Skinnari & Stenström, 2012). It should also be mentioned that several investigations into match fixing are currently being conducted by the national criminal police; however, it is not yet possible to determine whether this can be seen as infiltration (Bratell, 2013; Henning, 2013).
Real estate activities. Although investment in real estate per se is excluded from the definition of infiltration in this study, the real estate sector comprises legitimate businesses that may be infiltrated. Several reports and seminar participants also indicate that the real estate (and property) sector is an emerging risk sector for infiltration (EBM, 2012; RKP, 2012b, 2013). Infiltrated real estate agents overvalue property. Bankers assist members of organised crime groups by approving loans despite insufficient creditworthiness and even help them to leverage the same property several times at different banks. One case has been identified in which multiple bank loans were in turn invested in a restaurant run by the same criminal group.
Organised crime infiltration of property management, i.e. businesses with commercial real estate, is unclear. One hypothesis is that infiltration in high-value businesses of that kind is possible for very few actors. Besides temporary speculations in real estate, property management in the form of a company is by its nature a long-term commitment.
6.5 Actors and modi operandi
Given the method used to create the DCI and the scant availability of information on the type of criminal groups involved in the cases of infiltration, we do not have sufficient information to draw distinctions among different OCGs. There are certainly many cases of infiltration that are never reported in the media. Seminars and literature suggest that most organised crime infiltration is ad hoc and takes place in the businesses closest at hand for the criminals. Most organised crime groups have members who are at least suspected of infiltrating businesses. In other words, there are no systematic differences. The groups range among outlaw motorcycle gangs, smuggling networks, territorial groups, groups with ties to former Yugoslavia, and networks that commit organised and economic crime and sometimes use infiltration.
There are known cases of outlaw motorcycle gangs being active in the construction sector (Brå, 2011b). Outlaw motorcycle gangs, ethnic organised crime groups, and local groups have shown an interest in targeting restaurants for infiltration (Brå, 2012b). A hypothesis is that the territorial groups tend to target mainly visible companies within their own territories. In a previous study, an offender explained that visible businesses, where one could just walk in and make one’s demands, were seen as more suitable targets than industries, office buildings, etc., where one would never gain access to the manager, who holds the money (Brå, 2012b). In small businesses like restaurants, shops and hairdressers the offender often found the manager/owner working alongside the other employees.
Infiltration and control
Infiltrators encounter various levels of cooperation when approaching companies with the intention to acquire influence. Infiltration may be characterised by different levels of voluntariness, ranging from mutual benefits to coercion, threats, and extortion. Depending on the methods used, companies may be more or less aware that infiltration is taking place.
One general strategy is to use straw men, especially in formal and visible positions. Sometimes the straw man is the former business owner; at other times it is someone recruited for the position. Their key role is to be responsible for taxes and other claims against the legal entity. In some regulated sectors, the straw man needs a clean record and good economy if the business is to receive the necessary permits.
Start-up of new businesses. While the concept of infiltration suggests that an actor step by step takes control over an organisation from the outside, research claims that it is not uncommon for persons engaged in organised crime to start up their own businesses in Sweden. This observation was confirmed by several seminar participants. Indeed, starting a new business in Sweden is relatively easy, although some sectors, such as CIT, currency exchange, restaurants and bars are regulated by permits and licences (Brå, 2011b).
The benefits of newly-started companies, however, are disputed. Research shows that some criminals avoid start-ups because they attract the attention of both authorities and possible business partners. However, acquiring established companies with good creditworthiness may require time and financial resources, so that this is likely to be limited to actors with high capacity (Brå, 2011b).

65
Legal acquisition of already-existing businesses. Whilst infiltration involves irregularities at best and illegal actions at worst, methods to take over and assume control of companies may be perfectly legal, although the intention of the infiltrator may be insincere. In the case of so-called ‘long firm fraud’, a company with good creditworthiness is purchased and the irregularities begin only afterwards. Sometimes, the former owners, knowingly or unknowingly, are used as frontmen.
As previously mentioned, in sectors that require permits, it may be more attractive to take over existing businesses with the associated permits or licenses. Even in these cases, the infiltrators may have different time horizons; some intend to do business for a long time, while others only use available credits and push the company into bankruptcy.
Another positive aspect of acquiring an existing business rather than starting up a new one is that it is possible to take advantage of the company’s good reputation in future business and criminal set-ups. Depending on the sector, this factor may be more or less crucial. Research on large-scale tax fraud and the seminar discussions indicate that companies with good creditworthiness and spotless records are highly sought after in criminal circles. People engaged in organised crime also seem willing to pay accordingly, since these companies attract better clients and postpone suspicion from the authorities (Brå, 2011b). Retiring company owners (and their consultants) sometimes have an interest in selling their company quickly to avoid tax claims. Therefore, there is a market in which organised crime can buy this kind of trustworthy company with a long history.
Threats and extortion. People in organised crime have different levels of intimidation capital that they use to enforce their demands; however, studies on the extortion of entrepreneurs indicate that the actual use of violence is rare (Brå, 2012b). One strategy used by organised crime groups is to offer insurance or protection to business owners. This is not real insurance but rather a regular payment made to the group in order to keep its members from vandalising the business or setting it on fire (racketeering) (Brå, 2012b; Skinnari & Stenström, 2012). Several interviewees in the study painted a similar picture: the insurance premium is constantly increased to the point that the business owner assumes the role of a straw man for his or her own company. Interviews with practitioners of extortion suggest that extortion sometimes leads to demands for ownership of the company (Brå, 2012b). It should also be mentioned that threats and extortion are not always explicit. If the group has high intimidation capital, direct threats are not necessary.
Bribery and mutual benefits. Not all infiltration happens through coercion. By offering financial compensation, perhaps a percentage of the profit from the crime – a service at a currency exchange office for instance – organised crime groups persuade business owners to cooperate. These can be seen as a win-win arrangement. There are also examples of financial advisors and consultants whose business idea is to design crime plans for organised crime, and that these collaborations are voluntary (Brå, 2008b, 2011b).
Instead of a lengthy infiltration process, organised crime probably prefers simply to buy services, i.e. by bribing officials or business owners. As long as the cooperation runs smoothly, both parties gain, and organised crime has no reason to start infiltration proper. Should the business owner hesitate or stop the cooperation, organised crime can use more forceful methods. Research and seminar participants mention such cases (Brå, 2012b, 2014b). Besides being easy, one advantage for organised crime is the flexibility of cooperation with many businesses instead of focusing on infiltrating a few.
Hijacking. Temporarily taking control of a business for a short period of time – so-called ‘hijacking’ – seems to be an up and coming method for organised crime to make money illegally but within the frame of a legal business. In these cases, control over decision-making processes may be limited and short-term, but still enough to complete the fraud (Åkergren, 2013).
One strategy to hijack a business is to create false documents and submit these to the Companies’ Registration Office and change the board of directors. If the registration office has no reason to suspect irregularities, the change goes through with no questions asked (Carlsson, 2013). Another, more rapid, way is to hack into a company’s customer database and send out false invoices – identical copies except that the bank number for payment has been changed.
Management
Management strategies to infiltrate companies constitute perhaps the least studied aspect of organised crime infiltration. That said, a factor that is likely to affect the choice of the management strategy is the amount of time that the perpetrator plans to spend on the infiltrated business, i.e. different strategies require different time horizons. As previously discussed, bankruptcy alone may be sufficiently profitable, although profit increases further if the company is also emptied of all its resources. As we shall see, the management strategies chosen often mirror the methods of infiltration discussed above.

66
Short-term business strategies. Both research and LEA reports suggest that when organised crime groups infiltrate legitimate businesses, their involvement is often short-lived (Brå, 2012a). As described in a research report, a typical fraud set-up involves acquiring a company, taking credits and loans, followed by the emptying of all assets and eventually bankruptcy (Brå, 2011b, 2012a; RKP, 2012b). In these cases, ‘the faster the better’ is probably an adequate description of the business strategy. In one case, the process and cash flow was accelerated through use of a factoring company before the business was closed and the principals disappeared with the crime proceeds. In cases where a company is hijacked, time is even more crucial because the fraud needs to be completed before the real owners suspect that they have been victimised.
Long-term business strategies. Members of organised crime groups are sometimes instead interested in running the infiltrated business in the long term. This is particularly crucial in crime set-ups where the illicit profit cannot be retrieved all in one, but is spread across a longer time period. Typical examples include restaurants, hairdressers, and other small businesses that generate profit over time by using illicit labour and failing to register cash payments. Another example is provided by social insurance frauds based on monthly payments which pile up over time. In an identified case currently before a district court, the fraud has been going on since 2007. The prosecutor in the case argues that more than 30 million SEK have been wrongly paid to the company by the Social Insurance Agency.
‘Family business’. In some sectors, research indicates that the infiltrated business is kept within the family. This is perhaps not surprising since this reduces the risks of leaks, disloyalty and cheating (Korsell et al., 2009). A study concludes that in several cases of personal care assistance fraud, the beneficiary has been related to the care takers. In some cases, the care takers have been family members (ISF, 2011; SOU, 2012).
Bankruptcy as a management strategy. As mentioned above, in the event of bankruptcy, the Salary Guarantee Act compensates the employee for the loss of wages during redundancy. In 2014, the maximum sum per employee amounted to 177,600 SEK. The strategy behind the fraud is to incorrectly indicate that one has been employed in a bankrupted company and is entitled to this benefit (Brå, 2011b; SAMEB, 2011). The benefit is often paid to several employees, who share the profit with the principal.
The literature and seminars identify different strategies and fraud set-ups related to bankruptcies, ranging
from ‘all-fake set-ups’ in which all documentation is false (including court decisions and certificates from liquidators) to strategies involving real, legitimate companies acquired solely for the purpose of salary guarantee fraud (KFM, 2010). In one case, people had unknowingly been ‘employed’ in an infiltrated company and paid salary guarantees which were ‘collected’ by members of organised crime groups (KFM, 2010).
6.6 Conclusions
Although the term ‘infiltration’ is not used in the Swedish context, the phenomenon of organised crime starting up or taking over legal businesses is a reality in Sweden and, according to law enforcement agencies, a problem on the rise. The use of businesses for the purpose of tax fraud has a long history in the construction and cleaning sector. What is new is the use of companies for large-scale frauds and to abuse the welfare system. To some extent, organised crime has become more intertwined with economic crime.
In Sweden, several sectors are influenced by quite extensive tax fraud that seems to have affected competition (see Skatteverket, 2009a). Moreover, organised crime is not involved in those sectors. In some high-profile and rare cases, this has led to shootings and arson attacks, which make the illicit sector more visible to the general public. The tax system can handle a few more cheaters without being threatened, but when methods from organised crime enter legal sectors, these sectors may feel worse off than is actually the case.
The most well-researched aspect of infiltration in Sweden is risk sectors. Here, the challenge is rather to determine which sectors are most at risk. While some sectors are recurrent, such as restaurants and other cash-intensive businesses, financial services, and construction, some reports highlight new trends, such as consultants and real estate. Many risk sectors have characteristics or functions that are attractive to organised crime: access to cash, transportation, and markets for stolen goods or illegal substances. Some risk sectors are linked to the welfare system. As regards risk sectors, several seminar participants argued that there is a danger in letting law enforcement agencies define risk sectors, since these analyses often mirror what the agency is already targeting in its work. Thus, both LEAs and researchers run the risk of neglecting sectors at risk that are not known or prioritised by the authorities. An example of such a sector is waste disposal and recycling, where seminar participants, especially from the private sector, had seen cases of infiltration.

67
As for methods of infiltration, the literature suggests that the choice of starting a new business or infiltrating an existing company may depend on the crime plan and business sector infiltrated. Licences, permits, the importance of creditworthiness and an existing customer base are some factors that make taking over an existing business preferable to starting a new one. Quick credit or telemarketing frauds, on the other hand, may be more suitable for new businesses. Both the literature and seminars underline that starting up a new business in Sweden is relatively easy. Some even argue that constantly starting up new businesses has become a strategy for organised crime groups.
Management strategies to infiltrate businesses are perhaps the least researched aspect of infiltration. This may have to do with the fact that some infiltrated companies are used to conduct credit fraud, and when this is done, they simply go bankrupt. Moreover, management strategies may be of limited importance in the legal process. Research suggests, however, that the longer the time frame of the criminal group, the more careful it is to keep the company in general, and the records in particular, in order (see Brå, 2011b). Keeping the accounting by the book is less important in shorter crime plans.
7. United Kingdom50
7.1 Introduction
The Home Office (2013) estimated that around 5,500 organised crime groups are currently operating in the United Kingdom and involve approximately 37,000 individuals, mostly generalist career criminals (Francis, Humphreys, Kirby, & Soothill, 2013). The socioeconomic cost of organised crime is estimated at approximately £24 billion every year. The groups involved in serious and organised crime in the UK are heterogeneous in terms of personal characteristics and offending histories and trajectories (Francis et al., 2013), and have different ethnic and national origins. Cross-ethnic partnerships have also been documented (Ruggiero & Khan, 2006). While more traditional, hierarchically structured groups do exist, research shows that many British criminal groups have a loose structural organisation, more typical of a network than a family (Hornsby & Hobbs, 2007; Levi & Maguire, 2004). In other words, they tend to be individuals who decide to join forces for the duration of their criminal activities and dissolve afterwards.
The UK is exposed to organised crime group investments in, and infiltration of, legal businesses, which tend to be used to cover, support and/or facilitate criminal activities. While most business sectors have been targeted at some point in time, the financial sector and cash-rich overt businesses are particularly vulnerable and have been exploited, typically to launder money and invest illicit profits (Home Office, 2013). Whilst most organised crime groups investing in British legal economies are either based or have ‘headquarters’ in the UK, the literature highlights a number of cases of investments from organised crime groups based outside of (or branching out to) the UK (e.g. Campana, 2011;
Home Office, 2013; Macaulay, 2011; D. Silverstone, 2011). Furthermore, British-based organised crime groups have invested abroad (e.g. in Spain and the Netherlands) and, in particular, have laundered illicit proceeds elsewhere - both in Europe and outside Europe (e.g. Hobbs, 1998; Siddle, 2013; Thompson, 2002).
The general extent which organised crime poses a serious threat to British national security is debatable (Campbell, 2014). The context in which ‘the extent to which both the criminal actors and the impact of their crimes in their totality (sic) represents a threat to national security … remains contested […although] countermeasures are needed to monitor and inhibit their growth’ (Levi, 2014, p. 12). In this sense, the establishment of the Serious Organised Crime Agency (SOCA) in 2006 and its replacement in 2013 with the National Crime Agency (NCA) are indicative of a strong institutional push towards fighting organised crime in all its forms. This push is supported by the introduction of direct and indirect legislation dealing with financial crimes committed by organised crime groups and including, for example, powers to confiscate criminal assets under the Proceeds of Crime Act (POCA) 2002, the criminalisation of frauds under the Fraud Act 2006, and stronger anti-money laundering measures under both the Money Laundering Regulations 2007 and the Counter-Terrorism Act 2008.
50. With the collaboration of David Wall and Stefano Bonino (University of Durham, United Kingdom).

68
Methodological remarks
Information on organised crime groups’ investments in British legal economy is limited. Although, subject to Home Office direction and funding, the UK Police forces tend to operate independently from one another and researchers need to access them separately. The British policing system therefore lacks a structured centralised repository of accessible data on organised crime. Furthermore, inter-agency and public-private partnerships tend to be inhibited by ‘differences in formal performance objectives, culture and even personalities’ (Levi, 2014, p. 12), which further complicates research on organised crime in general and on investments in the legitimate economy in particular.
Figure 26. Percentage of references to OCG infiltration in open sources by type of source
figure 1
figure 2
figure 3
figure 10
figure 15
figure 18
figure 19
figure 20
Figure 24
figure 27
figure 31
figure 32
figure 34
figure 35
figure 36
figure 37
figure 39
figure 40
figure 41
figure 42
figure 43
figure 45
figure 46
figure 47
figure 48
figure 49
figure 50
figure 51
9.2%
49.8%
1.3%
17.1%
22.5%
54.8%25.4%
3.1%
5.9%
10.8%
27%
25%
1%
15%
32%
43%
33%
20%
3% 1%
20%
1%3%
5%
70%
100%90%80%70%60%50%40%30%20%10%
0%2002
4
1
3
2
3
1
1
4
15
1
62
2
47
1
139 89 40
2
5 3 39
2003 2004 2005 2006 2007 2008 2009 2010 2011 2012 2013 2014*
21%
15%
1%4%
59%
21
11
8
20
10
164
34
35
43
23
20
25
15
10
5
01 2 3 4 5 6 7 8 9 10 >10
21%
16%
22%
21%
19%
70%80%90%
100%
40%50%60%
20%30%
10%0%
70%80%90%
100%
40%50%60%
20%30%
10%0%
Italy (N=164)
Slovenia(N=35)
Sweden(N=43)
UK(N=23)
TheNetherlands
(N=34)
Italy (N=21)
Slovenia(N=8)
Sweden(N=20)
UK(N=10)
TheNetherlands
(N=11)
Italy Slovenia Sweden UKTheNetherlands
70% 14
5
62
40%
50%
60%
20%
30%
10%
0%
600
500
400
300
200
100
0
0.20%
0.30%
0.10%
0.50%
0.60%
0.70%
0.80%
0.40%
0.00%2002
0.72%
0.51%
0.26%
0.47%0.56%
0.33%
0.44% 0.47%0.39%
0.36%
0.58%0.52%
0.24%
2003 2004 2005 2006 2007 2008 2009 2010 2011 2012 2013 2014*
38
6
10
5
7
70%80%90%
100%
94
25
19
35
2
40%50%60%
20%30%
10%0%
Italy (N=164)
Slovenia(N=35)
Sweden(N=43)
UK(N=23)
TheNetherlands
(N=34)
Public limited companies
Private limited companies
Partnerships
Sole traders
Other legal forms
NA
20% 40% 60% 80% 100%0%
figure 44
70%80%90%
100%
40%50%60% 90
11
22 26
17
20%30%
10%0%
Italy (N=164)
Slovenia(N=35)
Sweden(N=43)
UK(N=23)
TheNetherlands
(N=34)
10
12
6
8
4
2
14
16
0Money
launderingFraud OtherFormally legal
activitiesConcealment
of illegal activities
4 43
5
15
Italy (N=164)
Slovenia(N=35)
Sweden(N=43)
UK(N=23)
TheNetherlands
(N=34)
70%80%90%
100%
40%50%60%
20%30%
10%0%
40%
50%
20%
30%
10%
0%Italy
(N=137)Slovenia(N=32)
Sweden(N=34)
UK(N=18)
70%80%90%
100%
40%50%60%
20%30%
10%0%
Italy (N=21)
Slovenia(N=8)
Sweden(N=20)
UK(N=10)
TheNetherlands
(N=11)
Italy(N=164)
Slovenia(N=35)
Sweden(N=43)
UK(N=23)
TheNetherlands
(N=34)
Italy(N=164)
Slovenia(N=35)
Sweden(N=43)
UK(N=23)
TheNetherlands
(N=34)
70%80%90%
100%
40%50%60%
20%30%
10%0%
70%80%90%
100%
40%50%60%
20%30%
10%0%
30%
24.9%0.8%
Academic study Judicial evidence
LEA report Media Other
N = 2,380
N = 2,380
N = 2,380
N = 1,305
N = 604
Institutional report
15%
29%
0.4%
Local OCGs Motorcycles gangsItalian mafias
Other OCGs NA
Italy SloveniaThe Netherlands
Sweden UK
Academic study
Judicial evidence LEA report Media
Institutional report
Academic study
LEA report Media
No. criminal charges with references to OCGs % OCGs in relation to all criminal charges
% O
CGs
in re
latio
n to
all
crim
inal
cha
rges
Other
Institutional report
No.
crim
inal
cha
rges
with
refe
renc
es to
OCG
s
Academic study
Judicial evidence LEA report Media
Institutional report
N = 74
23%
24%
20%
32%
1% N = 140
N = 257
N = 70
N = 299
Academic study
LEA report Media Other
Institutional report
No. filed criminal complaints for money laudering offences with references to OCGs
No. filed criminal complaints for money laudering offences without references to OCGs
Academic study
Judicial evidence LEA report Media
Institutional report
Italy SloveniaThe Netherlands
Sweden UK
Italy SloveniaThe Netherlands
Sweden UK
Money laundering FraudFormally legal activities
Concealment of illegal activities Other
Money laundering FraudFormally legal activities
New business NAAlready existing business
Concealment of illegal activities Other
90
53
19
24
9
14
4
30
15
29
21
20% 40% 60% 80% 100%0%
Public limitedcompanies
Private limitedcompanies
Partnerships
Sole traders
Other legal forms
NA
Italy SloveniaThe Netherlands
UKSweden
Public limitedcompanies
Private limitedcompanies
Partnerships
Sole traders
Otherlegal forms
NA
20% 40% 60% 80% 100%0%
Cosa Nostra (N=14) Camorra (N=74)‘Ndrangheta (N=47)
Other Italian (N=13)Chinese (N=16)
Money laundering Fiscal fraudFormally legal activities
Corporate fraud OtherConcealment of illegal activities
Relatives Legal entrepreneursProfessionals
Women among shareholders Women as majority shareholders
Legal companies
53
7
6
14
98
3
1
8
4
1
Small LargeMedium Very large NA
Italy SloveniaThe Netherlands
Sweden UK
0 4-101-3 11-20 >20 NA
Source: UDUR elaboration on DCI data
The Database on Criminal Infiltration (DCI), compiled for this research, collected 257 references to OCG infiltration in legal businesses in the United Kingdom. Figure 26 shows the variety of sources used to gather information on OCG infiltration in the UK.51 These include: academic literature, government strategies, policy reports, police investigations, judicial evidence, institutional reports (e.g. UK Border Agency, HMRC, Organised Crime Taskforce, Financial Action Taskforce), press releases and online newspapers. While the quality of data offered by online newspapers varies, and a lack of centralised
data on organised crime groups’ investments in legal economies presents methodological limitations, the broad variety of sources has provided a useful, albeit preliminary, understanding of organised crime groups’ infiltration in British legitimate economies. The DCI is a starting point for assembling a nation-wide overview of infiltration.
7.2 Drivers
The economic downturn and post-2008 austerity measures, combined with the growth of modern technologies provide new opportunities, incentives and avenues to engage in criminal activities that respond and adapt to the changing environment, thus making organised crime an evolving and dynamic threat (Home Office, 2009). According to the Serious Organised Crime Taskforce (2010), profit and power are the over-riding priorities of organised crime groups, whose criminal activities happen to be means to achieve such ends. The current literature on criminal infiltration in the UK demonstrates that profiting from illegal activities, laundering money (this being an indirect form of profit) and concealing illicit activities are the main reasons why organised crime groups infiltrate legitimate businesses in the UK. The literature also highlights that organised crime groups infiltrate economic sectors and businesses that are most conducive to supporting, facilitating and hiding their criminal activities of choice. While small, local organised crime groups tend to operate within their own territories, larger groups operate nationally, often in areas populated with business activities or historically linked to organised crime, and sometimes internationally, taking advantage of the possibility to connect with foreign criminals, to launder money and to commit crimes, such as frauds, that are difficult to detect.
The United Kingdom Threat Assessment (UKTA) identifies the main threats originating from organised crime groups as: ‘[1] trafficking of controlled drugs; [2] organised immigration crime (people smuggling and human trafficking); [3] financial crime (fraud); and [4] organised acquisitive crime (e.g. armed robbery, road freight crime and organised vehicle theft)’ (Home Office, 2011, p. 9). According to the same report, drug trafficking and distribution is carried out by around half of organised crime groups. Money laundering is also connected with many organised crime groups’ activities. The observations are in line with the information recorded in the Database on Criminal Infiltration and the references collected show a disproportionate amount of criminal activities clustering around money laundering,
51. References were identified through key words such as: 1) organised crime OR criminal organisation OR criminal group AND infiltrat* (infiltration, infiltrated); 2) organised crime OR criminal organisation OR criminal group AND compan* (company, companies); 3) organised crime OR criminal organisation OR criminal group AND business; 4) organised crime OR criminal organisation OR criminal group AND money laundering.

69
drug trafficking and fraud. Other criminal activities include human trafficking, arms sale, prostitution, counterfeiting, cigarette smuggling, handling of stolen goods, illegal waste disposal.
This is not to say that a traditional goal of organised crime groups - control of the territory - has been completely abandoned. Yet, as research conducted by Hobbs (2001, 2013) demonstrates, the boundaries between the local and the global have intersected and blurred, and as a consequence, the activities of OCGs have diversified and extended beyond clearly demarcated territories. In fact:
[…] unlike previous eras, contemporary organised crime with its emphasis upon drugs, fraud and counterfeiting, simultaneously occupies both the local and global. Further, these criminal activities offer the possibility of moving from one sphere to another (Hobbs, 1998, p. 419).
Certainly, British organised crime groups might seek to control an illicit market, for example the drug distribution in Liverpool and in London (Lavorgna, Lombardo, & Sergi, 2013), or particular communities, such as Chinese criminals intimidating communities of fellow countrymen to expand their interests in the UK (Adamoli, Di Nicola, Savona, & Zoffi, 1998). They may also seek to control a business sector, for example the Bikers’ partial control of the real estate sector (Adamoli et al., 1998). However, there is no indication that UK OCGs primarily intend to control a territory or to monopolise a business sector when infiltrating legitimate economies. This may well be a consequence of their criminal activities, which often occur without investments in legal businesses.
It is true that organised crime groups, such as ‘Tuckers Firm’, used security companies and resorted to violence to control the London and Essex territories by extorting licensed businesses and discouraging competitors’ encroachment (Windle, 2013). It is also true that criminal networks appear to have infiltrated the food industry (Elliott, 2013). Nevertheless, many organised crime groups simply trade in the market instead of intending to govern it. This observation relates to the idea of ‘functional diversification’ of mafia activities that Campana (2011) uses to describe the different purposes of the Italian La Torre Clan’s various activities, that is, governing territories and sectors in Italy while simply trading in markets in Scotland and the Netherlands.
Money laundering. The DCI showed a high number of cases in which organised crime groups have laundered money through a broad range of legitimate businesses. Whether it be a local gang, a wider national, more sustained criminal group or a network of criminals operating internationally, money laundering remains a prime motivation for investing in legal businesses, especially money service businesses and other cash-intensive businesses (Organised Crime Task Force, 2013), as they can be used as front companies to legitimise cash obtained from illegal activities. Money has been laundered through businesses within sectors such as bars and restaurants, construction, wholesale and retail trade, transportation and renting of motor vehicles, hotels and other tourist accommodation.
Profit and concealment of illicit activities. The DCI suggests that profit is a key reason behind the infiltration of legitimate businesses and is predominantly made through fraud, drug trafficking and a range of other crimes. These criminal activities often intersect with money laundering insofar as the former might require the latter to legitimise illicit profits. The literature also demonstrates that organised crime groups invest in businesses which make it easy to conduct fraudulent activities ranging from local, smaller frauds (e.g. insurance frauds) to global, multimillion frauds (e.g. VAT frauds).
Box 3. A fraud conducted through a car hire company in the South East
Between 2008 and 2009 a small group of criminals with different roles (director, leaseholder of the office premises, and odd-man) worked in a legal car hire business in the South East and started using the company to conduct frauds. By exploiting the transportation and renting of motor vehicles sector and by using the legal ownership of, and involvement in the car hire company, they rented £500,000 worth of cars from reputable vehicle hire companies using false details and false credit cards. Then, they sold on these cars to other companies in the UK and abroad. All but two vehicles were recovered by the police. The four members of the group were given prison sentences of between 14 months and 4.5 years.
Profit can also be made through other criminal activities for which legitimate businesses can offer support, facilitation and cover. These activities include the sale of counterfeit tobacco in pubs (von Lampe, 2006), human

70
trafficking in the catering sector (D. Silverstone, 2011), the aiding and abetting of prostitution within escort agencies, illegal waste dumping and avoiding landfill tax and other costs as part of the infiltration of the waste industry (Mills, 2013). Furthermore, criminals have also used sham companies to legitimise corporations that are involved in arms trafficking outside the UK; they have counterfeited currency at printing businesses and vehicle garages; and they have sold both counterfeit pharmaceuticals online and other counterfeit products in retail stores.
Drug trafficking is the main source of profit of many organised crime groups, however, the main reason for infiltrating a legal business is often to conceal the illicit activity of drug trafficking and other crimes. Examples of such are the use of sham cafés, both to plan and deliver drugs, or as centres for illegal gambling; luxury goods companies to hide heroin dealing or to launder dirty money (or both); clothing companies to cover drug trading activities or to sell counterfeit goods; hairdressing salons to deal cocaine and grocery shops to import and distribute drugs (Hales & Hobbs, 2010).
7.3 Infiltrated territories
According to the Home Office, ‘organised criminal activity is concentrated in London and the South East, the North West and the West Midlands, but all areas of the country suffer the effects of this criminality’ (Home Office, 2011, p. 9). The Home Office further observes that organised crime groups operate across territories policed by different police forces, therefore making it hard to identify the precise location of their activities. Also, far from it being only a nationally and locally situated phenomenon, the infiltration by organised groups also operates transnationally. This is the case when UK-based criminals infiltrate companies abroad to conduct illegal activities abroad and/or in the UK. It is also the case where foreign criminals infiltrate business sectors in the UK and then conduct illegal activities in the UK and/or abroad.
The DCI indicates geographical differences in the infiltration of legitimate businesses. Although we must be wary of the potential bias caused by such low levels of data, the DCI does provide some evidence of a geographical distribution of OCG infiltration in legal businesses, with thriving business areas and territories historically connected with organised crime being particularly represented (Figure 27). Parts of Scotland, for example, appear prone to be targeted (though these findings must be treated with some caution because of low levels of data and possible reporting biases).
Figure 27. Number of references to OCG infiltration in open sources by region (NUTS 2)52
None1-45-67-8>8
References to OCG infiltration
Source: UDUR elaboration on DCI data (N.B. low levels of data)
7.4 Infiltrated business sectors
British organised crime groups infiltrate business sectors that are more easily exploitable in order to support, facilitate and hide their criminal activities of choice. The financial sector is especially vulnerable to money laundering and ‘in excess of £1 billion a year is laundered through money service businesses (MSBs) and informal value transfer systems alone’ (Home Office, 2013, p. 19). Both aggregate level data and specific cases recorded in the DCI confirm that organised crime groups in the UK have heavily infiltrated the financial sector and have made use of money service businesses to launder money (Levi & Maguire, 2004). As identified in the case studies selected for the analysis, weaknesses include structural fragmentations, lack of communication between companies, the exploitability of regulations on intra-European transactions, and problems in the early detection of the criminal activities of small businesses.
Furthermore, ‘illicit profits are often laundered through cash-rich overt businesses, which very often operate on the high street and typically include nail bars, food and licensed premises, companies offering security services, taxi firms and car washes’ (Home Office, 2013, p. 19). The literature, summarised in the DCI, confirms the Home Office’s findings and records a disproportionate number of cases in which organised crime groups have used cash intensive businesses to
52. Details on the region of the infiltration (NUTS 2) are available for 168 references.

71
launder money, conduct or conceal drug trafficking activities and undertake other illegal activities, such as prostitution, sale of counterfeit or smuggled goods, handling of stolen goods, human trafficking, and illegal waste disposal. Cash-rich overt businesses present opportunities for crime: they can be set up quickly and cheaply, with a few criteria to be satisfied by the director, and can help legitimise crime proceeds.
Cases of infiltration to facilitate, support and/or hide drug trafficking, money laundering, fraud and other crimes have been recorded within various sectors, such as: personal service activities; hotels, bars and
restaurants (Annison, 2013; Boff, 2013; Hales & Hobbs, 2010; Hobbs, 1998; D. Silverstone & Savage, 2010; Webb & Burrows, 2009); clubs and gambling activities (FATF, 2009a, 2009b; Gambling Commission, 2013); transportation (Home Office, 2013; Organised Crime Task Force, 2013); support service activities (e.g. private security) (Windle, 2013); wholesale and retail trade (Hales & Hobbs, 2010); construction (Campana, 2011; L’Hoiry, 2013); financial and insurance activities (CIFAS, 2013); waste and scrap management (Mills, 2013); and manufacturing (Elliott, 2013). Figure 28 ranks business sectors according to their level of evidence of infiltration by organised crime groups.
Figure 28. Number of references of OCG infiltration in open sources by business sector53
Source: UDUR elaboration on DCI data
Some sectors tend to be targeted in specific locations, although it is hard to make a strong connection between sectors and territories, especially in a country where organised crime groups are not as deeply embedded in social and political structures as is the case in other European countries (e.g. Mafia groups in Italy). Therefore, the most targeted sectors have been infiltrated across very different locations, including thriving business areas, both well-off and deprived areas, and areas
where British organised crime groups have historically had a foothold (e.g. Liverpool, Glasgow, London).
Figure 29 identifies the regions with at least one reference of OCG infiltration in the top 3 sectors for number of references found in open sources: wholesale and retail trade; hotels, bars and restaurants; and clubs and gambling activities..
53. Details on the business sector of the infiltration (NACE 0-digit) are available for 248 references.
SECTORS
Agriculture and fishing
Construction
IT services
Real estate activities
Public administration
Education
Hospitals and residential care
Legal and professionalactivities
Clubs and gambling activities
Personal serviceactivities
Support service activities
Mining and quarrying
Manufacturing
Energy supply
Waste and scrap management
Wholesale and retail trade
Transportation
Hotels, bars and restaurants
Financial and insurance activities
1 - 6
7 - 16
17 - 26
> 26
REFERENCES TO OCG INFILTRATION

72
Figure 29. Regions (NUTS 1) with at least one reference to OCG infiltration in open sources in the top 3 infiltrated sectors54
Transportation Hotels, bars and restaurants Clubs and gambling activities
Source: UDUR elaboration on DCI data (N.B. low levels of data)
7.5. Actors and modi operandi
Using ethno-national labels to categorise organised crime groups is very problematic in multicultural countries such as the UK. Ethno-national categories are not homogeneous per se, and their members may not be nationals of the countries whose label is attached to them or may not affiliate with such a label. Privileging ethnicity, race and nationality over other social categories does not provide a strongly reliable explanation for organised crime activities in the UK (Murji, 2007). Despite the difficulties in inferring organising principles through ethno-national labels, an attempt is made to provide a very preliminary mapping of the activities of different organised crime groups across different sectors and different territories.
The most active group are British career criminals who are responsible for the infiltration of all the major sectors within all the major territories where references of criminal infiltration were found. ‘British’ may include a good number of people born abroad and who acquired British citizenship years after migrating and living in the UK (around 6% of the total British population in the Census 2011). All other groups tend to infiltrate London, but also Scotland (Italians), North West and the West Midlands (Chinese), and the South East (Turkish). Most of these groups infiltrate business sectors with a relatively high number of references of infiltration, and possibly those in which they would normally engage in legal activities. For example, the Italian La Torre clan infiltrated Scottish, as well as Dutch and Italian, territories, setting up food and alcohol import-export businesses, restaurants, pubs, health and fitness centres and construction companies in Scotland to be
used to launder money that they had obtained from illegal activities in Southern Italy (Campana, 2011; Forgione, 2009). Similarly, the London-based Baybasin family invested in British cafés and seaside resorts and foreign exchange businesses to launder money and cover drug-related offences. Table 19 summarises the top five sectors and locations for number of references of criminal infiltration by different types of OCGs.
Given that investigations mostly focus on criminal activities, it is not always possible to ascertain the exact methods of infiltration, control and management of infiltrated companies because each stage may take place legally before the criminal activity begins. There are, however, some trends that are observable in the British context and regular (legitimate) acquisition appears to be the main method of infiltration. Criminals tend to purchase companies legally, or employ existing legitimate businesses already owned by a member of the group to subsequently support, facilitate and hide criminal activities. While it is difficult to identify at what exact point a business turns from legal activities to illegal activities and the extent to which organised crime groups target legitimate businesses in which they do not already have any existing participation, the analysis of the case studies has not identified cases in which organised crime groups placed one of their members in an existing legitimate businesses without some sort of pre-existing connection.
54. Details on the region of the infiltration (NUTS 1) for wholesale and retail trade, hotels, bars and restaurants, and clubs and gambling activities are available for 110 references.
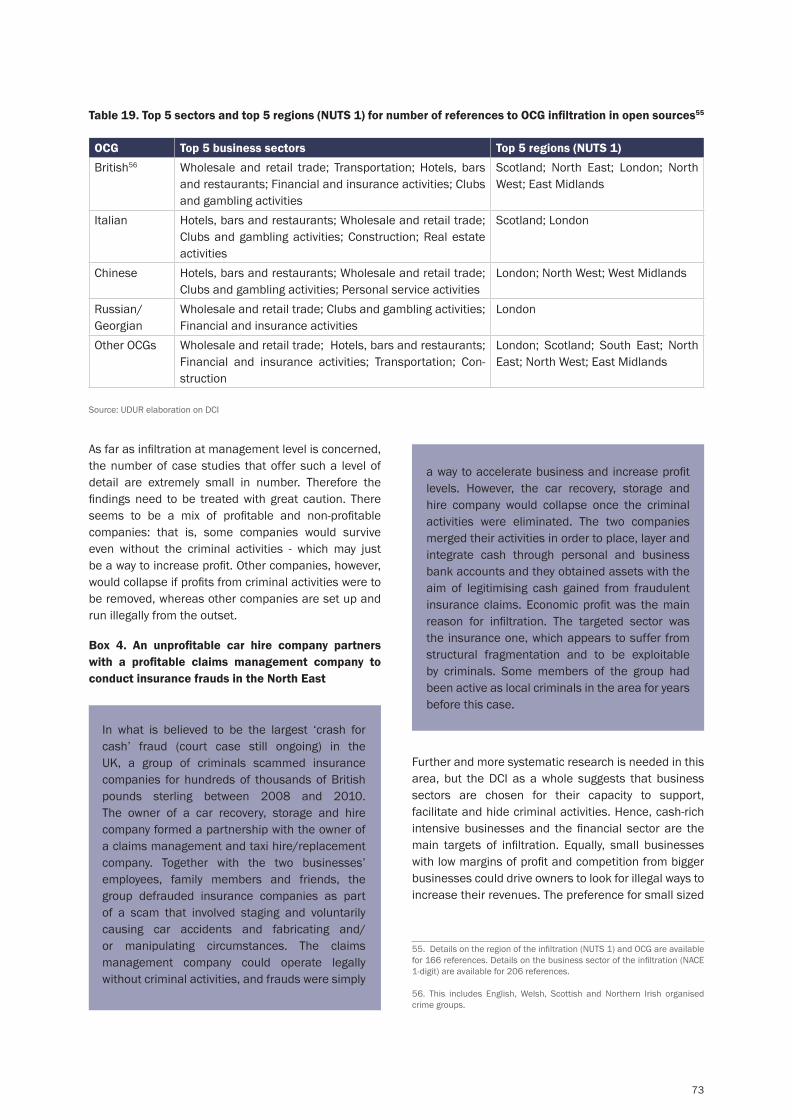
73
Table 19. Top 5 sectors and top 5 regions (NUTS 1) for number of references to OCG infiltration in open sources55
OCG Top 5 business sectors Top 5 regions (NUTS 1)British56 Wholesale and retail trade; Transportation; Hotels, bars
and restaurants; Financial and insurance activities; Clubs and gambling activities
Scotland; North East; London; North West; East Midlands
Italian Hotels, bars and restaurants; Wholesale and retail trade; Clubs and gambling activities; Construction; Real estate activities
Scotland; London
Chinese Hotels, bars and restaurants; Wholesale and retail trade; Clubs and gambling activities; Personal service activities
London; North West; West Midlands
Russian/Georgian
Wholesale and retail trade; Clubs and gambling activities; Financial and insurance activities
London
Other OCGs Wholesale and retail trade; Hotels, bars and restaurants; Financial and insurance activities; Transportation; Con-struction
London; Scotland; South East; North East; North West; East Midlands
Source: UDUR elaboration on DCI
As far as infiltration at management level is concerned, the number of case studies that offer such a level of detail are extremely small in number. Therefore the findings need to be treated with great caution. There seems to be a mix of profitable and non-profitable companies: that is, some companies would survive even without the criminal activities - which may just be a way to increase profit. Other companies, however, would collapse if profits from criminal activities were to be removed, whereas other companies are set up and run illegally from the outset.
Box 4. An unprofitable car hire company partners with a profitable claims management company to conduct insurance frauds in the North East
In what is believed to be the largest ‘crash for cash’ fraud (court case still ongoing) in the UK, a group of criminals scammed insurance companies for hundreds of thousands of British pounds sterling between 2008 and 2010. The owner of a car recovery, storage and hire company formed a partnership with the owner of a claims management and taxi hire/replacement company. Together with the two businesses’ employees, family members and friends, the group defrauded insurance companies as part of a scam that involved staging and voluntarily causing car accidents and fabricating and/or manipulating circumstances. The claims management company could operate legally without criminal activities, and frauds were simply
a way to accelerate business and increase profit levels. However, the car recovery, storage and hire company would collapse once the criminal activities were eliminated. The two companies merged their activities in order to place, layer and integrate cash through personal and business bank accounts and they obtained assets with the aim of legitimising cash gained from fraudulent insurance claims. Economic profit was the main reason for infiltration. The targeted sector was the insurance one, which appears to suffer from structural fragmentation and to be exploitable by criminals. Some members of the group had been active as local criminals in the area for years before this case.
55. Details on the region of the infiltration (NUTS 1) and OCG are available for 166 references. Details on the business sector of the infiltration (NACE 1-digit) are available for 206 references.
56. This includes English, Welsh, Scottish and Northern Irish organised crime groups.
Further and more systematic research is needed in this area, but the DCI as a whole suggests that business sectors are chosen for their capacity to support, facilitate and hide criminal activities. Hence, cash-rich intensive businesses and the financial sector are the main targets of infiltration. Equally, small businesses with low margins of profit and competition from bigger businesses could drive owners to look for illegal ways to increase their revenues. The preference for small sized

74
companies by many organised crime groups may also be a ploy to avoid early detection. Similarly, the growing number of missing trader intra-community frauds, the vulnerable nature of VAT-free import/export trades to/from Europe may actively encourage infiltration. The use of off-shore bank accounts also helps hide money and assets outside the UK, ensuring that criminals have financial supply to continue their activities and making it hard for law enforcement agencies to follow the money. Finally, criminals often use interconnected companies under the ownership of different members of the criminal groups both to increase the effectiveness of their business and criminal activities and to avoid raising suspicions whilst giving the impression of legitimacy about their activities.
7.6 Conclusions
British organised crime groups operate at various intersecting levels which include local, national, transnational and global territories. These groups are diverse and their members can be, for example, English, Welsh, Scottish, Turkish, Chinese, Vietnamese, Colombian, Russian, or Italian in origin, although these characteristics may not necessarily be relevant to the formation or structure of organised crime groups in a strongly multicultural country. Within the UK, organised crime groups appear to operate predominantly in the London area, the North West and in parts of Scotland. Here, it should be noted that the use of aggregate data and a potential bias in the sources (including news reporting biases) may have coloured these findings.
The criminal activities of choice mostly involve money laundering, drug trafficking and fraud. Some organised crime groups also engage in crimes, such as human trafficking, illegal immigration, arms sale, prostitution, corruption, counterfeiting, cigarette smuggling, and handling stolen goods. They infiltrate business sectors that can be more easily used to support, facilitate and cover such activities. The main reason behind the infiltration of legitimate businesses is profit and/or to conceal illegal activities and to launder money. There is little evidence to suggest that the infiltration is to achieve the higher and longer term goal of controlling territories or core business sectors.
Organised crime in the UK has had a greater impact on the financial sector, private security, transportation and renting motor vehicles, bars and restaurants and the wholesale and retail trade sector. As highlighted by Home Office reports, cash-intensive businesses are extremely vulnerable to infiltration, especially money laundering, while money service businesses are allegedly contributing to the laundering of £1 billion every year. The Money Laundering Regulations 2007
have introduced stricter regulations and responsibilities for MSBs and banking companies, although its success in deterring organised crime groups is to be seen.
Organised crime groups participate in businesses through ownership and management: for example, setting up a business using dirty money or to launder money, or by using an existing business where one or more OCG members is already in place to conduct and cover criminal activities. The drivers for infiltration are many and opportunity plays a major role, especially during a bleak economic climate in which some sectors, for example, cash-intensive businesses such as bars and restaurants experienced a reduction in profits and margins. A number of organised crime groups turn their legal activities into illegal businesses in order to boost their profits. The use of small companies, the exploitable intra-European trade regulations, off-shore bank accounts, etc., all drive and sustain infiltration.

75

76
PART II. Assessing the risk of infiltration in legitimate businesses
The second part of this report focuses on case studies on organised crime investments in Italy, the Netherlands, Slovenia, Sweden, and the United Kingdom. It combines analyses of different types (e.g. script analysis, financial and accounting analysis) and provides a detailed description of the process of infiltration in legal businesses and the methods adopted by OCGs to control and manage infiltrated businesses.
Several case studies were identified in each of the five countries covered by the project. The identification of case studies was conducted through a review of the scientific literature, reports by national authorities and institutions, and newspaper articles referring to criminal infiltration in legal businesses. Relevant institutions (e.g. LEAs and national authorities involved in the fight against organised and economic crime) were contacted to gain access to court and judicial archives.
According to data availability, 8 to 21 case studies were selected in each country for further analyses (Figure 30). The selection of case studies was based on the following criteria.
Representativeness of case studies: the case studies encompassed different types of infiltration (e.g. acquisition of the ownership of an already existing business, start-up of a new legitimate business).
Completeness of information: case studies with information available on the entire process of infiltration were favoured, as well as those with information on the names or VAT identification numbers of infiltrated businesses (or the name of owners/shareholders) to retrieve the financial statements and conduct the financial and accounting analysis.
Temporal proximity of the events: more recent case studies were favoured.
Diversification in terms of characteristics, areas and sectors: case studies encompassed different types and methods of infiltration in different territories and economic sectors.
Figure 30. Number of case studies by country
Source: Transcrime elaboration on DCS data
Database on case studies on OCG infiltration
The Database on Case Studies (DCS) contains information on 70 case studies of OCG infiltration in legal businesses and 299 infiltrated businesses in the five EU MS (Figure 31).
Figure 31. Number of infiltrated businesses by country
figure 1
figure 2
figure 3
figure 10
figure 15
figure 18
figure 19
figure 20
Figure 24
figure 27
figure 31
figure 32
figure 34
figure 35
figure 36
figure 37
figure 39
figure 40
figure 41
figure 42
figure 43
figure 45
figure 46
figure 47
figure 48
figure 49
figure 50
figure 51
9.2%
49.8%
1.3%
17.1%
22.5%
54.8%25.4%
3.1%
5.9%
10.8%
27%
25%
1%
15%
32%
43%
33%
20%
3% 1%
20%
1%3%
5%
70%
100%90%80%70%60%50%40%30%20%10%
0%2002
4
1
3
2
3
1
1
4
15
1
62
2
47
1
139 89 40
2
5 3 39
2003 2004 2005 2006 2007 2008 2009 2010 2011 2012 2013 2014*
21%
15%
1%4%
59%
21
11
8
20
10
164
34
35
43
23
20
25
15
10
5
01 2 3 4 5 6 7 8 9 10 >10
21%
16%
22%
21%
19%
70%80%90%
100%
40%50%60%
20%30%
10%0%
70%80%90%
100%
40%50%60%
20%30%
10%0%
Italy (N=164)
Slovenia(N=35)
Sweden(N=43)
UK(N=23)
TheNetherlands
(N=34)
Italy (N=21)
Slovenia(N=8)
Sweden(N=20)
UK(N=10)
TheNetherlands
(N=11)
Italy Slovenia Sweden UKTheNetherlands
70% 14
5
62
40%
50%
60%
20%
30%
10%
0%
600
500
400
300
200
100
0
0.20%
0.30%
0.10%
0.50%
0.60%
0.70%
0.80%
0.40%
0.00%2002
0.72%
0.51%
0.26%
0.47%0.56%
0.33%
0.44% 0.47%0.39%
0.36%
0.58%0.52%
0.24%
2003 2004 2005 2006 2007 2008 2009 2010 2011 2012 2013 2014*
38
6
10
5
7
70%80%90%
100%
94
25
19
35
2
40%50%60%
20%30%
10%0%
Italy (N=164)
Slovenia(N=35)
Sweden(N=43)
UK(N=23)
TheNetherlands
(N=34)
Public limited companies
Private limited companies
Partnerships
Sole traders
Other legal forms
NA
20% 40% 60% 80% 100%0%
figure 44
70%80%90%
100%
40%50%60% 90
11
22 26
17
20%30%
10%0%
Italy (N=164)
Slovenia(N=35)
Sweden(N=43)
UK(N=23)
TheNetherlands
(N=34)
10
12
6
8
4
2
14
16
0Money
launderingFraud OtherFormally legal
activitiesConcealment
of illegal activities
4 43
5
15
Italy (N=164)
Slovenia(N=35)
Sweden(N=43)
UK(N=23)
TheNetherlands
(N=34)
70%80%90%
100%
40%50%60%
20%30%
10%0%
40%
50%
20%
30%
10%
0%Italy
(N=137)Slovenia(N=32)
Sweden(N=34)
UK(N=18)
70%80%90%
100%
40%50%60%
20%30%
10%0%
Italy (N=21)
Slovenia(N=8)
Sweden(N=20)
UK(N=10)
TheNetherlands
(N=11)
Italy(N=164)
Slovenia(N=35)
Sweden(N=43)
UK(N=23)
TheNetherlands
(N=34)
Italy(N=164)
Slovenia(N=35)
Sweden(N=43)
UK(N=23)
TheNetherlands
(N=34)
70%80%90%
100%
40%50%60%
20%30%
10%0%
70%80%90%
100%
40%50%60%
20%30%
10%0%
30%
24.9%0.8%
Academic study Judicial evidence
LEA report Media Other
N = 2,380
N = 2,380
N = 2,380
N = 1,305
N = 604
Institutional report
15%
29%
0.4%
Local OCGs Motorcycles gangsItalian mafias
Other OCGs NA
Italy SloveniaThe Netherlands
Sweden UK
Academic study
Judicial evidence LEA report Media
Institutional report
Academic study
LEA report Media
No. criminal charges with references to OCGs % OCGs in relation to all criminal charges
% O
CGs
in re
latio
n to
all
crim
inal
cha
rges
Other
Institutional report
No.
crim
inal
cha
rges
with
refe
renc
es to
OCG
s
Academic study
Judicial evidence LEA report Media
Institutional report
N = 74
23%
24%
20%
32%
1% N = 140
N = 257
N = 70
N = 299
Academic study
LEA report Media Other
Institutional report
No. filed criminal complaints for money laudering offences with references to OCGs
No. filed criminal complaints for money laudering offences without references to OCGs
Academic study
Judicial evidence LEA report Media
Institutional report
Italy SloveniaThe Netherlands
Sweden UK
Italy SloveniaThe Netherlands
Sweden UK
Money laundering FraudFormally legal activities
Concealment of illegal activities Other
Money laundering FraudFormally legal activities
New business NAAlready existing business
Concealment of illegal activities Other
90
53
19
24
9
14
4
30
15
29
21
20% 40% 60% 80% 100%0%
Public limitedcompanies
Private limitedcompanies
Partnerships
Sole traders
Other legal forms
NA
Italy SloveniaThe Netherlands
UKSweden
Public limitedcompanies
Private limitedcompanies
Partnerships
Sole traders
Otherlegal forms
NA
20% 40% 60% 80% 100%0%
Cosa Nostra (N=14) Camorra (N=74)‘Ndrangheta (N=47)
Other Italian (N=13)Chinese (N=16)
Money laundering Fiscal fraudFormally legal activities
Corporate fraud OtherConcealment of illegal activities
Relatives Legal entrepreneursProfessionals
Women among shareholders Women as majority shareholders
Legal companies
53
7
6
14
98
3
1
8
4
1
Small LargeMedium Very large NA
Italy SloveniaThe Netherlands
Sweden UK
0 4-101-3 11-20 >20 NA
Source: Transcrime elaboration on DCS data

77
figure 1
figure 2
figure 3
figure 10
figure 15
figure 18
figure 19
figure 20
Figure 24
figure 27
figure 31
figure 32
figure 34
figure 35
figure 36
figure 37
figure 39
figure 40
figure 41
figure 42
figure 43
figure 45
figure 46
figure 47
figure 48
figure 49
figure 50
figure 51
9.2%
49.8%
1.3%
17.1%
22.5%
54.8%25.4%
3.1%
5.9%
10.8%
27%
25%
1%
15%
32%
43%
33%
20%
3% 1%
20%
1%3%
5%
70%
100%90%80%70%60%50%40%30%20%10%
0%2002
4
1
3
2
3
1
1
4
15
1
62
2
47
1
139 89 40
2
5 3 39
2003 2004 2005 2006 2007 2008 2009 2010 2011 2012 2013 2014*
21%
15%
1%4%
59%
21
11
8
20
10
164
34
35
43
23
20
25
15
10
5
01 2 3 4 5 6 7 8 9 10 >10
21%
16%
22%
21%
19%
70%80%90%
100%
40%50%60%
20%30%
10%0%
70%80%90%
100%
40%50%60%
20%30%
10%0%
Italy (N=164)
Slovenia(N=35)
Sweden(N=43)
UK(N=23)
TheNetherlands
(N=34)
Italy (N=21)
Slovenia(N=8)
Sweden(N=20)
UK(N=10)
TheNetherlands
(N=11)
Italy Slovenia Sweden UKTheNetherlands
70% 14
5
62
40%
50%
60%
20%
30%
10%
0%
600
500
400
300
200
100
0
0.20%
0.30%
0.10%
0.50%
0.60%
0.70%
0.80%
0.40%
0.00%2002
0.72%
0.51%
0.26%
0.47%0.56%
0.33%
0.44% 0.47%0.39%
0.36%
0.58%0.52%
0.24%
2003 2004 2005 2006 2007 2008 2009 2010 2011 2012 2013 2014*
38
6
10
5
7
70%80%90%
100%
94
25
19
35
2
40%50%60%
20%30%
10%0%
Italy (N=164)
Slovenia(N=35)
Sweden(N=43)
UK(N=23)
TheNetherlands
(N=34)
Public limited companies
Private limited companies
Partnerships
Sole traders
Other legal forms
NA
20% 40% 60% 80% 100%0%
figure 44
70%80%90%
100%
40%50%60% 90
11
22 26
17
20%30%
10%0%
Italy (N=164)
Slovenia(N=35)
Sweden(N=43)
UK(N=23)
TheNetherlands
(N=34)
10
12
6
8
4
2
14
16
0Money
launderingFraud OtherFormally legal
activitiesConcealment
of illegal activities
4 43
5
15
Italy (N=164)
Slovenia(N=35)
Sweden(N=43)
UK(N=23)
TheNetherlands
(N=34)
70%80%90%
100%
40%50%60%
20%30%
10%0%
40%
50%
20%
30%
10%
0%Italy
(N=137)Slovenia(N=32)
Sweden(N=34)
UK(N=18)
70%80%90%
100%
40%50%60%
20%30%
10%0%
Italy (N=21)
Slovenia(N=8)
Sweden(N=20)
UK(N=10)
TheNetherlands
(N=11)
Italy(N=164)
Slovenia(N=35)
Sweden(N=43)
UK(N=23)
TheNetherlands
(N=34)
Italy(N=164)
Slovenia(N=35)
Sweden(N=43)
UK(N=23)
TheNetherlands
(N=34)
70%80%90%
100%
40%50%60%
20%30%
10%0%
70%80%90%
100%
40%50%60%
20%30%
10%0%
30%
24.9%0.8%
Academic study Judicial evidence
LEA report Media Other
N = 2,380
N = 2,380
N = 2,380
N = 1,305
N = 604
Institutional report
15%
29%
0.4%
Local OCGs Motorcycles gangsItalian mafias
Other OCGs NA
Italy SloveniaThe Netherlands
Sweden UK
Academic study
Judicial evidence LEA report Media
Institutional report
Academic study
LEA report Media
No. criminal charges with references to OCGs % OCGs in relation to all criminal charges
% O
CGs
in re
latio
n to
all
crim
inal
cha
rges
Other
Institutional report
No.
crim
inal
cha
rges
with
refe
renc
es to
OCG
s
Academic study
Judicial evidence LEA report Media
Institutional report
N = 74
23%
24%
20%
32%
1% N = 140
N = 257
N = 70
N = 299
Academic study
LEA report Media Other
Institutional report
No. filed criminal complaints for money laudering offences with references to OCGs
No. filed criminal complaints for money laudering offences without references to OCGs
Academic study
Judicial evidence LEA report Media
Institutional report
Italy SloveniaThe Netherlands
Sweden UK
Italy SloveniaThe Netherlands
Sweden UK
Money laundering FraudFormally legal activities
Concealment of illegal activities Other
Money laundering FraudFormally legal activities
New business NAAlready existing business
Concealment of illegal activities Other
90
53
19
24
9
14
4
30
15
29
21
20% 40% 60% 80% 100%0%
Public limitedcompanies
Private limitedcompanies
Partnerships
Sole traders
Other legal forms
NA
Italy SloveniaThe Netherlands
UKSweden
Public limitedcompanies
Private limitedcompanies
Partnerships
Sole traders
Otherlegal forms
NA
20% 40% 60% 80% 100%0%
Cosa Nostra (N=14) Camorra (N=74)‘Ndrangheta (N=47)
Other Italian (N=13)Chinese (N=16)
Money laundering Fiscal fraudFormally legal activities
Corporate fraud OtherConcealment of illegal activities
Relatives Legal entrepreneursProfessionals
Women among shareholders Women as majority shareholders
Legal companies
53
7
6
14
98
3
1
8
4
1
Small LargeMedium Very large NA
Italy SloveniaThe Netherlands
Sweden UK
0 4-101-3 11-20 >20 NA
Operation Athena
An OCG acquires the ownership of two already existing businesses (Alpha s.r.l. and Beta s.a.s.) and sets up a new legitimate one (Gamma s.p.a.). Several members of the criminal group are targeted by LEA during operation Athena and sentenced.
Alpha s.r.l.
Acquisition of the ownership of Alpha s.r.l.
Beta s.a.s.
Acquisition of the ownership of Beta s.a.s.
Gamma s.p.a.
Set up of Gamma s.p.a.
Case
stu
dyIn
filtr
ated
bu
sine
ss
A case study on OCG infiltration refers to the event of an organised crime group infiltrating the legitimate economy to participate in the decision-making process of one or more legal businesses. Each case study on OCG infiltration may include more than one infiltrated business when a criminal group infiltrates several legal companies (Figure 32).
The DCS stores information on each infiltrated business related to the 70 case studies. It records details on the registered address, the criminal organisation involved, the process of infiltration, the owners and shareholders, and the availability of financial and accounting documents. Judicial documents (e.g. arrest warrants, judgements, documents, and seizure and confiscation measures) constitute the primary source of information. Information from judicial documents was integrated with secondary sources of information, such as interviews with state prosecutors and police officials, reports by national authorities, newspaper articles, and financial and accounting documents retrieved from business registers.
Figure 33. Distribution of infiltrated businesses in the case studies analysed
Box 5. One case and five individual unconnected businesses
In one case study, the members of an organised crime group ran businesses as individuals and not as part of the overall organisation. A case study on an OCG engaged in people smuggling illustrates how four crucial members of this organised crime group at some time had businesses registered in their names. All the businesses were declared as micro enterprises. The ownership, funding and management of these businesses were entirely individual. No evidence was found that in the case of poor business performance would a business loan, managerial advice or other help be officially provided by the other criminal group members. Friendly gestures were not excluded, since family ties are the bases of frequent connections among various businesses. Family members were also found to be business partners, or just employees in the business.
All the businesses registered to specific organised crime group members were acquired in accordance with legislative and administrative requirements, and they were also managed and deleted in such manner. Although the business of the leader raised suspicions of money laundering, and although GAMMA was registered at a household address where numerous other construction businesses were also registered, thus indicating possible malice, no measures were taken.
Figure 32. Case studies and infiltrated businesses
Source: Transcrime elaboration on DCS data
Source: Transcrime elaboration on DCS data
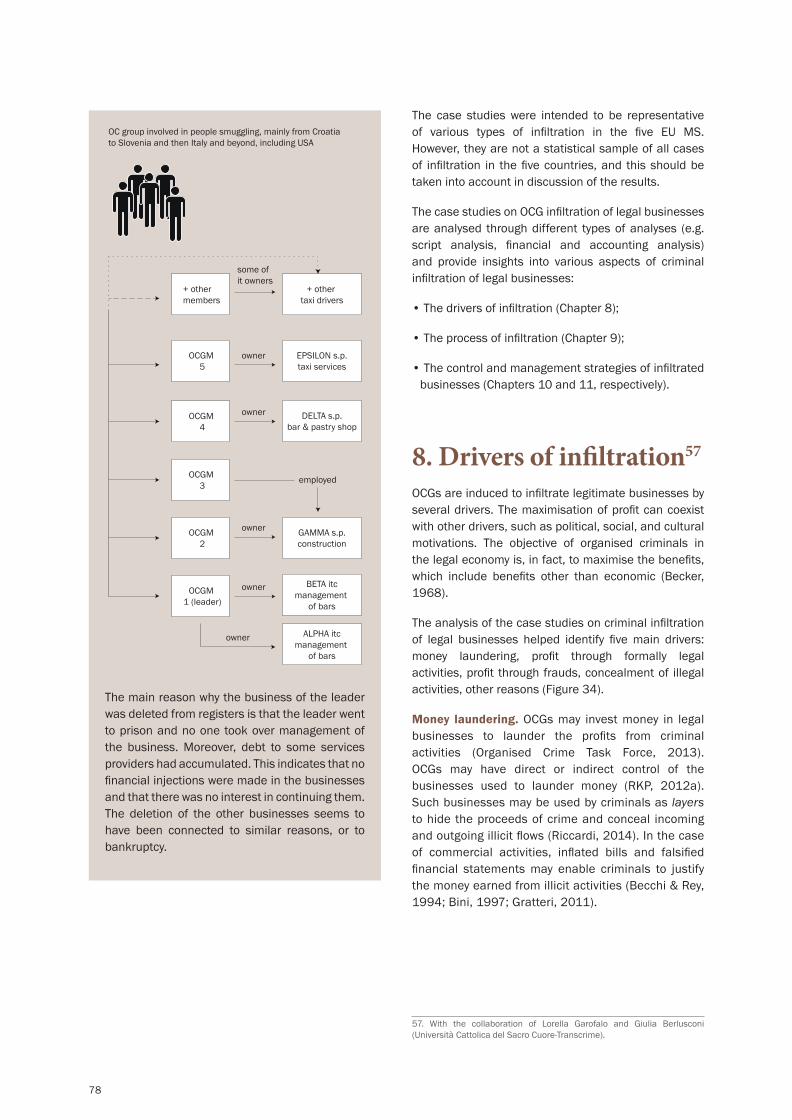
78
The main reason why the business of the leader was deleted from registers is that the leader went to prison and no one took over management of the business. Moreover, debt to some services providers had accumulated. This indicates that no financial injections were made in the businesses and that there was no interest in continuing them. The deletion of the other businesses seems to have been connected to similar reasons, or to bankruptcy.
OC group involved in people smuggling, mainly from Croatia to Slovenia and then Italy and beyond, including USA
+ other members
+ other taxi drivers
EPSILON s.p.taxi services
DELTA s.p.bar & pastry shop
OCGM 5
OCGM 4
OCGM 3
OCGM 2
OCGM 1 (leader)
some of it owners
owner
owner
owner
owner
owner
GAMMA s.p.construction
BETA itcmanagement
of bars
ALPHA itcmanagement
of bars
employed
The case studies were intended to be representative of various types of infiltration in the five EU MS. However, they are not a statistical sample of all cases of infiltration in the five countries, and this should be taken into account in discussion of the results.
The case studies on OCG infiltration of legal businesses are analysed through different types of analyses (e.g. script analysis, financial and accounting analysis) and provide insights into various aspects of criminal infiltration of legal businesses:
• The drivers of infiltration (Chapter 8);
• The process of infiltration (Chapter 9);
• The control and management strategies of infiltrated businesses (Chapters 10 and 11, respectively).
8. Drivers of infiltration57
OCGs are induced to infiltrate legitimate businesses by several drivers. The maximisation of profit can coexist with other drivers, such as political, social, and cultural motivations. The objective of organised criminals in the legal economy is, in fact, to maximise the benefits, which include benefits other than economic (Becker, 1968).
The analysis of the case studies on criminal infiltration of legal businesses helped identify five main drivers: money laundering, profit through formally legal activities, profit through frauds, concealment of illegal activities, other reasons (Figure 34).
Money laundering. OCGs may invest money in legal businesses to launder the profits from criminal activities (Organised Crime Task Force, 2013). OCGs may have direct or indirect control of the businesses used to launder money (RKP, 2012a). Such businesses may be used by criminals as layers to hide the proceeds of crime and conceal incoming and outgoing illicit flows (Riccardi, 2014). In the case of commercial activities, inflated bills and falsified financial statements may enable criminals to justify the money earned from illicit activities (Becchi & Rey, 1994; Bini, 1997; Gratteri, 2011).
57. With the collaboration of Lorella Garofalo and Giulia Berlusconi (Università Cattolica del Sacro Cuore-Transcrime).

79
figure 1
figure 2
figure 3
figure 10
figure 15
figure 18
figure 19
figure 20
Figure 24
figure 27
figure 31
figure 32
figure 34
figure 35
figure 36
figure 37
figure 39
figure 40
figure 41
figure 42
figure 43
figure 45
figure 46
figure 47
figure 48
figure 49
figure 50
figure 51
9.2%
49.8%
1.3%
17.1%
22.5%
54.8%25.4%
3.1%
5.9%
10.8%
27%
25%
1%
15%
32%
43%
33%
20%
3% 1%
20%
1%3%
5%
70%
100%90%80%70%60%50%40%30%20%10%
0%2002
4
1
3
2
3
1
1
4
15
1
62
2
47
1
139 89 40
2
5 3 39
2003 2004 2005 2006 2007 2008 2009 2010 2011 2012 2013 2014*
21%
15%
1%4%
59%
21
11
8
20
10
164
34
35
43
23
20
25
15
10
5
01 2 3 4 5 6 7 8 9 10 >10
21%
16%
22%
21%
19%
70%80%90%
100%
40%50%60%
20%30%
10%0%
70%80%90%
100%
40%50%60%
20%30%
10%0%
Italy (N=164)
Slovenia(N=35)
Sweden(N=43)
UK(N=23)
TheNetherlands
(N=34)
Italy (N=21)
Slovenia(N=8)
Sweden(N=20)
UK(N=10)
TheNetherlands
(N=11)
Italy Slovenia Sweden UKTheNetherlands
70% 14
5
62
40%
50%
60%
20%
30%
10%
0%
600
500
400
300
200
100
0
0.20%
0.30%
0.10%
0.50%
0.60%
0.70%
0.80%
0.40%
0.00%2002
0.72%
0.51%
0.26%
0.47%0.56%
0.33%
0.44% 0.47%0.39%
0.36%
0.58%0.52%
0.24%
2003 2004 2005 2006 2007 2008 2009 2010 2011 2012 2013 2014*
38
6
10
5
7
70%80%90%
100%
94
25
19
35
2
40%50%60%
20%30%
10%0%
Italy (N=164)
Slovenia(N=35)
Sweden(N=43)
UK(N=23)
TheNetherlands
(N=34)
Public limited companies
Private limited companies
Partnerships
Sole traders
Other legal forms
NA
20% 40% 60% 80% 100%0%
figure 44
70%80%90%
100%
40%50%60% 90
11
22 26
17
20%30%
10%0%
Italy (N=164)
Slovenia(N=35)
Sweden(N=43)
UK(N=23)
TheNetherlands
(N=34)
10
12
6
8
4
2
14
16
0Money
launderingFraud OtherFormally legal
activitiesConcealment
of illegal activities
4 43
5
15
Italy (N=164)
Slovenia(N=35)
Sweden(N=43)
UK(N=23)
TheNetherlands
(N=34)
70%80%90%
100%
40%50%60%
20%30%
10%0%
40%
50%
20%
30%
10%
0%Italy
(N=137)Slovenia(N=32)
Sweden(N=34)
UK(N=18)
70%80%90%
100%
40%50%60%
20%30%
10%0%
Italy (N=21)
Slovenia(N=8)
Sweden(N=20)
UK(N=10)
TheNetherlands
(N=11)
Italy(N=164)
Slovenia(N=35)
Sweden(N=43)
UK(N=23)
TheNetherlands
(N=34)
Italy(N=164)
Slovenia(N=35)
Sweden(N=43)
UK(N=23)
TheNetherlands
(N=34)
70%80%90%
100%
40%50%60%
20%30%
10%0%
70%80%90%
100%
40%50%60%
20%30%
10%0%
30%
24.9%0.8%
Academic study Judicial evidence
LEA report Media Other
N = 2,380
N = 2,380
N = 2,380
N = 1,305
N = 604
Institutional report
15%
29%
0.4%
Local OCGs Motorcycles gangsItalian mafias
Other OCGs NA
Italy SloveniaThe Netherlands
Sweden UK
Academic study
Judicial evidence LEA report Media
Institutional report
Academic study
LEA report Media
No. criminal charges with references to OCGs % OCGs in relation to all criminal charges
% O
CGs
in re
latio
n to
all
crim
inal
cha
rges
Other
Institutional report
No.
crim
inal
cha
rges
with
refe
renc
es to
OCG
s
Academic study
Judicial evidence LEA report Media
Institutional report
N = 74
23%
24%
20%
32%
1% N = 140
N = 257
N = 70
N = 299
Academic study
LEA report Media Other
Institutional report
No. filed criminal complaints for money laudering offences with references to OCGs
No. filed criminal complaints for money laudering offences without references to OCGs
Academic study
Judicial evidence LEA report Media
Institutional report
Italy SloveniaThe Netherlands
Sweden UK
Italy SloveniaThe Netherlands
Sweden UK
Money laundering FraudFormally legal activities
Concealment of illegal activities Other
Money laundering FraudFormally legal activities
New business NAAlready existing business
Concealment of illegal activities Other
90
53
19
24
9
14
4
30
15
29
21
20% 40% 60% 80% 100%0%
Public limitedcompanies
Private limitedcompanies
Partnerships
Sole traders
Other legal forms
NA
Italy SloveniaThe Netherlands
UKSweden
Public limitedcompanies
Private limitedcompanies
Partnerships
Sole traders
Otherlegal forms
NA
20% 40% 60% 80% 100%0%
Cosa Nostra (N=14) Camorra (N=74)‘Ndrangheta (N=47)
Other Italian (N=13)Chinese (N=16)
Money laundering Fiscal fraudFormally legal activities
Corporate fraud OtherConcealment of illegal activities
Relatives Legal entrepreneursProfessionals
Women among shareholders Women as majority shareholders
Legal companies
53
7
6
14
98
3
1
8
4
1
Small LargeMedium Very large NA
Italy SloveniaThe Netherlands
Sweden UK
0 4-101-3 11-20 >20 NA
Figure 34. Drivers of OCG infiltration
Source: Transcrime elaboration on DCS data
Box 6. Money laundering in South Western Scotland
A bar in South Western Scotland originally owned by Ms. A, the widow of a Scottish gangster, was purchased by an accomplice (Mr. B) through a loan secured on a personal asset. The loan was secured over the bar by falsely pretending to a bank that the bar had been transferred to Mr. B for value. Mr. B finally acquired the bar through a combination of payments directly to Ms. A and the settlement of an outstanding tax liability; the payment period of three years was reduced to less than one year. Mr. C, a Scottish gangster who had worked with the family of the late husband of Ms. A, was behind the business and influenced its criminal activities. He refurbished the bar. He had a bank account under his own name trading for the bar, and on which Mr. B was a signato-ry. The bank account had been originally opened when Ms. A first purchased the bar to help her with the loan. The bar was used to launder money made by Mr. C through drug trafficking and extor-tion; therefore, Mr. B’s bar technically operated as a front for Mr. C’s criminal activities.
The trading account of the bar was also used to fund the purchase of a filling station in Scot-land (about £90,000 of the £151,000 total price), while most of the remaining funds came from money extorted from a local taxi company.
The links between Mr. C and Scottish gangsters (the family of Ms. A’s late husband) are also ev-idenced by the purchase of additional ground adjacent to the filling station, partly with money from the purchase and sale of a flat above the bar. The flat was originally bought at auction, by paying a £2,500 cash deposit and then a balance of £21,000 and about £227,000 of interest in re-spect of late settlement. It was then sold on to a member of the criminal gang. Most of the money used to purchase the flat came from drugs and extortion, while the whole transaction of buying and selling the flat was a device used to launder money.
Profit from (formally) legal activities. OCGs may invest in businesses to obtain considerable earnings and benefit from their profitability. Contrary to shell companies used as covers for illicit activities, these businesses engage in production activities and are profit oriented, although organised criminals often have unrealistic ideas about a company’s profitability and underestimate the costs (Becchi & Rey, 1994; Bini, 1997; Brå, 2007b, 2012b; Catanzaro, 1988; Costantino, 1986). Legal activities are only formally legal when their profitability is linked to illicit activities such as the discouragement of competition or irregularities in the labour market, e.g. when a company is targeted because it is a business competitor of other infiltrated businesses (Brå, 2012b).
Profit from frauds. OCGs may control legal businesses and exploit them to perpetrate frauds. Legal businesses may be used for various types of corporate fraud (e.g. insurance fraud, insolvency and bankruptcy-related fraud) and fiscal fraud (e.g. VAT and tax fraud, benefit fraud).
Box 7. A ‘carousel’ fraud in the trade of computer processing units
A MTIC VAT fraud was conducted in 2002 with the help of both genuine companies and infiltrated ones. DELTA, a company based in London and trading in CPUs, acted as second buffer trader in a line of five companies during 32 fraudulent transactions. At least one (GAMMA, the first buf-fer trader) was a genuine company not directly involved in the fraud.

80
The companies allegedly exported large quantities of VAT-free CPUs to BETA, a missing trader registered in the UK. The missing trader was either a registered company which had gone missing or a genuine company whose identity was hijacked by the fraudsters. BETA then sold the goods to GAMMA, the first line buffer company. The VAT invoice issued by BETA to GAMMA enabled the latter to deduct the amount shown as VAT as input tax from the amount due by BETA to customs in respect of output tax on the onward sale to DELTA, the second line buffer company (owned by the members of the criminal group). DELTA then sold the goods to the broker EPSILON for an amount that included VAT. Finally, EPSILON resold them to the original seller in Ireland (ALPHA) and claimed VAT for the purchase. In many cases the whole chain of transactions took place on the same day. No VAT was payable on the export. Yet the broker then reclaimed the VAT which it had paid to DELTA. The fraud amounted to at least £13 million.
EPSILON Broker
DELTA 2nd Buffer Trader
GAMMA 1st Buffer Trader
BETADefaulting Trader
ALPHAIrish Supplier
Ireland United Kingdom
Box 8. Benefit fraud in the health care sector
Between 2006 and 2012 a legitimate company operating in the health care sector was used to conduct a large-scale organised benefit fraud. In Sweden it is possible for private companies to furnish publicly-funded health care. In the case of care assistance for disabled persons, a company is paid 275 SEK (approximately €30) per hour of care provided, and then pays the
salaries to the employees. Benefit fraud is based on the company submitting a report to the Social Insurance Agency stating that employees have provided care when in fact they have not. Salaries are paid to employees, and then parts of them are returned to the owners of the infiltrated company.
Social InsuranceAgency
Payment for
care
Salary
Employee
Beneficiary
Part of salary repaid to Alpha
No work is carried out
False documentation
of care being
carried out
ALPHA
Thirty-one personal care assistants were charged with either fraud or abetting it by signing timesheets claiming to have carried out work, and being paid when no work had been carried out. In several cases, the salary constituted grounds for other benefits (e.g. parental and sickness benefits).
Concealment of illegal activities. OCGs may use legal businesses to conceal illicit activities such as drug trafficking or prostitution. For instance, the members of a criminal organisation may use the vehicles and storehouses of their transport company to conceal and smuggle illegal goods. Similarly, restaurants may facilitate the sale of untaxed alcohol, and night clubs may conceal prostitution (Dvoršek, 1995). Other examples include the use of bars to deliver drugs and as centres for illegal gambling; luxury companies to cover heroin dealing; clothing companies to cover drug trading activities or hairdressing salons to deal cocaine (Hales & Hobbs, 2010). Infiltrated businesses may also be exploited to perform transactions which would otherwise be considered suspect and conceal them as production costs (Fiorentini, 1999; Graebner Anderson, 1978).

81
Box 9. Concealment of prostitution through bars in Slovenia
By the same principle of complying with the administrative and bureaucratic requirements, members of an organised crime group established several small (ZETA) and micro (ETA) businesses, which were used to provide the documents and licences that foreign women need to enter Slovenia legally. In Slovenia, they were accommodated in various bars across the country, where they were supposed to perform erotic artistic shows or striptease. However, they were often forced to prostitute themselves. The women often knew that prostitution would be demanded even though it is not legalised in Slovenia; however, the earnings were anticipated to be higher and the conditions better.
The businesses (ZETA and ETA) used to acquire the papers were registered to the two main OCG members, Mr. A and Mr. B. Family members of Mr. A were employed in ZETA, and when he was absent, the business was run and managed by his family members. Even though only one night bar owner was prosecuted in this particular case, other bar owners or managers were often investigated and/or prosecuted independently. In this case they were more ‘business partners’. These bars across Slovenia have a resilient capacity for survival. Their staff and managers change (even exchange), but the locations and bar names are more or less constant. These bars are often rented or owned by a person who later also manages them; and in some cases, family members or women (formerly) employed in such bars help them.
OC group involved in human trafficking and forced prostitution
OCGM1
OCGM 3
BP 1
BP 2
......
BP n
NIGHT BAR 1
NIGHT BAR 2
NIGHT BAR 3
...
NIGHT BAR n
ZETA 1 s.p.(night bar)
ZETA s.p.(amusement and
recreation activities)
ETA s.p.(provision ofworkforce)
OCGM2
owner & manager
used for provison of
women for the night bars
owner & manager
Official owner(s) or manager(s) Family members or life partners are occasional managers
Box 10. The manufacture of precursors for ecstasy
Chemicals are essential for the production of ecstasy. The trade in these chemicals is regulated by law and can only take place under strict conditions. This case is an example of how a criminal organisation made use of a legal company to commit fraud without any coercion or intimidation.
One of the main suspects, Mr. A, had worked in the past as head of an environmental depart-ment of a Dutch university, and had slowly but steady become involved in the production of ille-gal drugs. Prior to the current criminal case, Mr. A had already been sentenced for violating the Law Preventing Abuse of Chemicals and the Opium Act. In recent years, Mr. A had officially worked as a consultant in the field of environmental certifi-cation and as the director of a chemical distillery. The second main suspect, Mr. B, had previously been active in oil trading (inland shipping). During that period he had been sentenced several times for forgery, tax fraud, and for committing econom-ic offences. At the time of the current case, Mr. B was officially unemployed. Mr. B, however, effec-tively managed a company that on paper was run by his son and daughter-in-law. Mr. B probably did not officially head his company in order to avoid attracting regulatory attention due to his criminal history.

82
The two main suspects, together with their relatives (wives, sons and daughter-in-law), used their legal companies to conceal illegal trade in hazardous waste, the production of illegal fuel, the manufacture of excise goods outside an excise warehouse, trade in registered chemicals without notification of suspicious transactions, and preparatory actions for the manufacture of illegal drugs (XTC).
To commit their crimes, the suspects, with the aid of their companies, traded with legal businesses. For instance, a contaminated batch of ethanol was purchased through official channels by Mr. B’s company. Under the supervision of customs officers, the batch was denatured with methanol and MEK. The contaminated ethanol was then transferred to Mr. A’s chemical distillery. The ethanol was distilled, and the purified ethanol was intended to be sold to Mr. B’s company. The purified ethanol would later be partly sold for the purpose of human consumption, partly as a processing aid in the production of synthetic drugs, and partly for blending into fuels.
Thanks to the input of information originating from a related XTC police investigation, the FIOD had already started their investigation of a related criminal organisation by the time the batch was distilled. Before the batch of ethanol was sold, the FIOD arrested the group and confiscated the batch.
The infiltration process in this case, as in many others, was simple: members of the criminal group used a legal company that they themselves ran, or they used a straw man (in this case a relative) to commit fraud.
Other reasons. Cultural or personal reasons may drive OCGs to infiltrate legal businesses and influence the choice of the business sector (Savona & Riccardi, 2011). Criminals may invest in certain businesses because they are close to their culture, education background, family tradition. This may explain, for instance, the infiltration of vehicle repair garages, sex shops, and tattoo parlours by some Nordic motorcycle OCGs (Police College of Finland, 2013) or the acquisition of companies engaged in the wholesale of typical local food products by Camorra groups (Riccardi, 2014). OCGs may infiltrate legal companies to create new jobs and to assign subcontracts to other enterprises, thus maximising their social consensus (Arlacchi, 2007; Becchi & Rey, 1994; Bini, 1997; Fantò, 1999). Finally,
OCGs may aim to achieve control over a particular sector of the local economy through participation in legal market activities, e.g. by infiltrating the public construction industry and manipulating subcontracts (Fantò, 1999; Savona, 2010).
This distinction - useful for analytical purposes - does not imply that OCGs infiltrate legal businesses to fulfil one driver at a time. For instance, the same infiltrated business may be used to launder the profits from illicit activities and gain revenues from legal activities (Fantò, 1999; Fiorentini, 1999; Graebner Anderson, 1978). Furthermore, these five drivers constitute the reasons why OCGs may infiltrate legal businesses. The choice of a particular territory and business sector, as well as the business to be targeted, are influenced by both their characteristics and the drivers of OC infiltration.
Figure 35. Drivers of OCG infiltration by country
figure 1
figure 2
figure 3
figure 10
figure 15
figure 18
figure 19
figure 20
Figure 24
figure 27
figure 31
figure 32
figure 34
figure 35
figure 36
figure 37
figure 39
figure 40
figure 41
figure 42
figure 43
figure 45
figure 46
figure 47
figure 48
figure 49
figure 50
figure 51
9.2%
49.8%
1.3%
17.1%
22.5%
54.8%25.4%
3.1%
5.9%
10.8%
27%
25%
1%
15%
32%
43%
33%
20%
3% 1%
20%
1%3%
5%
70%
100%90%80%70%60%50%40%30%20%10%
0%2002
4
1
3
2
3
1
1
4
15
1
62
2
47
1
139 89 40
2
5 3 39
2003 2004 2005 2006 2007 2008 2009 2010 2011 2012 2013 2014*
21%
15%
1%4%
59%
21
11
8
20
10
164
34
35
43
23
20
25
15
10
5
01 2 3 4 5 6 7 8 9 10 >10
21%
16%
22%
21%
19%
70%80%90%
100%
40%50%60%
20%30%
10%0%
70%80%90%
100%
40%50%60%
20%30%
10%0%
Italy (N=164)
Slovenia(N=35)
Sweden(N=43)
UK(N=23)
TheNetherlands
(N=34)
Italy (N=21)
Slovenia(N=8)
Sweden(N=20)
UK(N=10)
TheNetherlands
(N=11)
Italy Slovenia Sweden UKTheNetherlands
70% 14
5
62
40%
50%
60%
20%
30%
10%
0%
600
500
400
300
200
100
0
0.20%
0.30%
0.10%
0.50%
0.60%
0.70%
0.80%
0.40%
0.00%2002
0.72%
0.51%
0.26%
0.47%0.56%
0.33%
0.44% 0.47%0.39%
0.36%
0.58%0.52%
0.24%
2003 2004 2005 2006 2007 2008 2009 2010 2011 2012 2013 2014*
38
6
10
5
7
70%80%90%
100%
94
25
19
35
2
40%50%60%
20%30%
10%0%
Italy (N=164)
Slovenia(N=35)
Sweden(N=43)
UK(N=23)
TheNetherlands
(N=34)
Public limited companies
Private limited companies
Partnerships
Sole traders
Other legal forms
NA
20% 40% 60% 80% 100%0%
figure 44
70%80%90%
100%
40%50%60% 90
11
22 26
17
20%30%
10%0%
Italy (N=164)
Slovenia(N=35)
Sweden(N=43)
UK(N=23)
TheNetherlands
(N=34)
10
12
6
8
4
2
14
16
0Money
launderingFraud OtherFormally legal
activitiesConcealment
of illegal activities
4 43
5
15
Italy (N=164)
Slovenia(N=35)
Sweden(N=43)
UK(N=23)
TheNetherlands
(N=34)
70%80%90%
100%
40%50%60%
20%30%
10%0%
40%
50%
20%
30%
10%
0%Italy
(N=137)Slovenia(N=32)
Sweden(N=34)
UK(N=18)
70%80%90%
100%
40%50%60%
20%30%
10%0%
Italy (N=21)
Slovenia(N=8)
Sweden(N=20)
UK(N=10)
TheNetherlands
(N=11)
Italy(N=164)
Slovenia(N=35)
Sweden(N=43)
UK(N=23)
TheNetherlands
(N=34)
Italy(N=164)
Slovenia(N=35)
Sweden(N=43)
UK(N=23)
TheNetherlands
(N=34)
70%80%90%
100%
40%50%60%
20%30%
10%0%
70%80%90%
100%
40%50%60%
20%30%
10%0%
30%
24.9%0.8%
Academic study Judicial evidence
LEA report Media Other
N = 2,380
N = 2,380
N = 2,380
N = 1,305
N = 604
Institutional report
15%
29%
0.4%
Local OCGs Motorcycles gangsItalian mafias
Other OCGs NA
Italy SloveniaThe Netherlands
Sweden UK
Academic study
Judicial evidence LEA report Media
Institutional report
Academic study
LEA report Media
No. criminal charges with references to OCGs % OCGs in relation to all criminal charges
% O
CGs
in re
latio
n to
all
crim
inal
cha
rges
Other
Institutional report
No.
crim
inal
cha
rges
with
refe
renc
es to
OCG
s
Academic study
Judicial evidence LEA report Media
Institutional report
N = 74
23%
24%
20%
32%
1% N = 140
N = 257
N = 70
N = 299
Academic study
LEA report Media Other
Institutional report
No. filed criminal complaints for money laudering offences with references to OCGs
No. filed criminal complaints for money laudering offences without references to OCGs
Academic study
Judicial evidence LEA report Media
Institutional report
Italy SloveniaThe Netherlands
Sweden UK
Italy SloveniaThe Netherlands
Sweden UK
Money laundering FraudFormally legal activities
Concealment of illegal activities Other
Money laundering FraudFormally legal activities
New business NAAlready existing business
Concealment of illegal activities Other
90
53
19
24
9
14
4
30
15
29
21
20% 40% 60% 80% 100%0%
Public limitedcompanies
Private limitedcompanies
Partnerships
Sole traders
Other legal forms
NA
Italy SloveniaThe Netherlands
UKSweden
Public limitedcompanies
Private limitedcompanies
Partnerships
Sole traders
Otherlegal forms
NA
20% 40% 60% 80% 100%0%
Cosa Nostra (N=14) Camorra (N=74)‘Ndrangheta (N=47)
Other Italian (N=13)Chinese (N=16)
Money laundering Fiscal fraudFormally legal activities
Corporate fraud OtherConcealment of illegal activities
Relatives Legal entrepreneursProfessionals
Women among shareholders Women as majority shareholders
Legal companies
53
7
6
14
98
3
1
8
4
1
Small LargeMedium Very large NA
Italy SloveniaThe Netherlands
Sweden UK
0 4-101-3 11-20 >20 NA
Source: Transcrime elaboration on DCS data
Not all drivers of OCG infiltration were found in the five countries covered by the project. OCGs active in the Netherlands, in Sweden, and in the United Kingdom mainly infiltrate businesses to perpetrate frauds. For instance, Swedish OCGs use businesses to provide restaurants and small shops with untaxed alcohol and cigarettes. The fact that alcohol and tobacco are subject to excise tax enables large-scale tax fraud when the goods are imported legally and then resold to restaurants and kiosks without paying taxes. Having control over or running a business with a licence to import alcohol or tobacco is thus an opportunity to carry out excise tax fraud (CSD, 2015).
Box 11. MTIC VAT fraud in the wholesale mobile phone trade sector
A ‘business celebrity’ in London orchestrated a MTIC fraud involving 200 companies importing/exporting mobile phones in the UK, Spain and

83
the Netherlands between 2001 and 2008. He used his own firm (ALPHA) as an umbrella for firms under similar names, but he also infiltrated other companies. One of these companies was an import-export business (BETA) which had an estimated turnover in excess of £100,000 and did not expect to receive regular VAT repayments. In mid-2005 BETA was lured by an advertisement placed by ALPHA stating that it was looking for partners to act as brokers in the export of mobile telephones to overseas customers. BETA was assured that there would be no risk of MTIC fraud as ALPHA would be importing the goods itself (although it did not) or sourcing them directly from manufacturers. The reputation of both ALPHA and its famous owner lulled BETA into a sense of false security that the deals were legitimate. ALPHA expected its brokers (e.g. BETA) to purchase the goods on credit and transfer them ‘ship on hold’ pending payment from the customer.
BETA started trading with ALPHA and, shortly afterwards, requested that HMRC allow it to change from quarterly to monthly VAT returns as it was a repayment trader. HMRC refused this request because they were concerned about MTIC frauds in the wholesale mobile phone trade sector. To overcome this obstacle, one of the two shareholders of BETA acquired a company exporting mobile phones (GAMMA), which already submitted monthly VAT returns and would enable repayments to be received quickly.
GAMMA started acting as a broker by purchasing goods from ALPHA which provided them with a European customer and dictated the profit margin for the sale. Between April and May 2006 GAMMA purchased over 36,000 mobile phones from ALPHA (which itself was supplied by a chain of buffer companies) and resold them to a company based in Spain (DELTA). In some of these deals, despite the customer being based in Spain, the goods were transported to an address in the Netherlands (a fictitious company which was a house with no storage facilities in a residential part of the city) albeit on a ‘ship on hold’ basis until payment was received by GAMMA. Payments for these deals were processed through a secretive offshore bank in Curacao which offered anonymous and fast transfers, so that fraudsters could create immediate false paper trails of trades and reclaim VAT on transactions which did not exist.
Most of the Slovenian case studies concerned legal businesses infiltrated to conceal illegal activities, mainly prostitution. These cases confirmed the OCGs’ interest in bars and night clubs with the purpose to perpetrate forced prostitution. The bars give the outward impression of legitimate businesses providing dance routines for their customers; meanwhile, forced prostitution occurs in the background (e.g. Furlan-Rus, 2009; Lovšin, 2013; Žist, 2006). Evidence of human trafficking was also found in connection with the provision of women to be employed in such bars.
In Italy, some case studies concerned OCGs investing in legal business entities to maximise their social consensus and to control a particular market of the local economy. OCGs may decide to infiltrate businesses operating in sectors that provide goods and services to the population (e.g. education, healthcare) and create new jobs to promote a respectable image of themselves in contrast with that of mere criminals (Fantò, 1999; Ravenda et al., 2015; Sciarrone, 2009). Italian mafias also infiltrate sectors with high territorial specificity (e.g. hotels and restaurants, gas and water supply, construction) to control an area physically and to create strategic collusive relationships with politicians and local entrepreneurs.
9. The step-by-step process of infiltration58
Chapter 9 presents the results of the script analysis of the case studies on infiltrated business entities in Italy, the Netherlands, Slovenia, Sweden, and United Kingdom. The aim is to analyse the modi operandi adopted by criminal groups during the infiltration process and identify the vulnerabilities of the territories, business sectors, legitimate businesses, and legislation exploited by criminals.
Crime scripts are ‘step-by-step accounts of procedures used by offenders through the entire crime process’ (Chiu, Leclerc, & Townsley, 2011). Scripts can be divided into scenes involving smaller units of action. Each scene is characterised by particular actions, as well as by actors, roles, props, and locations. Scripts can also be distinguished into specific tracks which describe the crime-commission process in different circumstances (Cornish & Clarke, 2002).
58. With the collaboration of Giulia Berlusconi (Università Cattolica del Sacro Cuore-Transcrime-Italy).

84
Two tracks can be identified in the script of OCG infiltration of legal businesses. The first involves the acquisition of an already-existing legal business by the members of the criminal group; the second occurs when organised criminals start a new business.
Figure 36. Type of infiltrated business by country
Source: Transcrime elaboration on DCS data
Figure 36 shows the number of new and already existing businesses infiltrated by criminal groups in the five countries covered by the project. There is a balance between the two types of infiltrated businesses in Italy, Sweden, and the United Kingdom. Dutch organised criminals are more prone to infiltrate already-existing businesses. This may be due to the need for company creditworthiness to perpetrate fiscal frauds. The ease of starting a new business in Slovenia may instead be among the reasons why criminal groups in that country tend to start new businesses rather than acquire existing ones.
Box 12. Setting up new businesses to conduct fake invoice fraud in Sweden
figure 1
figure 2
figure 3
figure 10
figure 15
figure 18
figure 19
figure 20
Figure 24
figure 27
figure 31
figure 32
figure 34
figure 35
figure 36
figure 37
figure 39
figure 40
figure 41
figure 42
figure 43
figure 45
figure 46
figure 47
figure 48
figure 49
figure 50
figure 51
9.2%
49.8%
1.3%
17.1%
22.5%
54.8%25.4%
3.1%
5.9%
10.8%
27%
25%
1%
15%
32%
43%
33%
20%
3% 1%
20%
1%3%
5%
70%
100%90%80%70%60%50%40%30%20%10%
0%2002
4
1
3
2
3
1
1
4
15
1
62
2
47
1
139 89 40
2
5 3 39
2003 2004 2005 2006 2007 2008 2009 2010 2011 2012 2013 2014*
21%
15%
1%4%
59%
21
11
8
20
10
164
34
35
43
23
20
25
15
10
5
01 2 3 4 5 6 7 8 9 10 >10
21%
16%
22%
21%
19%
70%80%90%
100%
40%50%60%
20%30%
10%0%
70%80%90%
100%
40%50%60%
20%30%
10%0%
Italy (N=164)
Slovenia(N=35)
Sweden(N=43)
UK(N=23)
TheNetherlands
(N=34)
Italy (N=21)
Slovenia(N=8)
Sweden(N=20)
UK(N=10)
TheNetherlands
(N=11)
Italy Slovenia Sweden UKTheNetherlands
70% 14
5
62
40%
50%
60%
20%
30%
10%
0%
600
500
400
300
200
100
0
0.20%
0.30%
0.10%
0.50%
0.60%
0.70%
0.80%
0.40%
0.00%2002
0.72%
0.51%
0.26%
0.47%0.56%
0.33%
0.44% 0.47%0.39%
0.36%
0.58%0.52%
0.24%
2003 2004 2005 2006 2007 2008 2009 2010 2011 2012 2013 2014*
38
6
10
5
7
70%80%90%
100%
94
25
19
35
2
40%50%60%
20%30%
10%0%
Italy (N=164)
Slovenia(N=35)
Sweden(N=43)
UK(N=23)
TheNetherlands
(N=34)
Public limited companies
Private limited companies
Partnerships
Sole traders
Other legal forms
NA
20% 40% 60% 80% 100%0%
figure 44
70%80%90%
100%
40%50%60% 90
11
22 26
17
20%30%
10%0%
Italy (N=164)
Slovenia(N=35)
Sweden(N=43)
UK(N=23)
TheNetherlands
(N=34)
10
12
6
8
4
2
14
16
0Money
launderingFraud OtherFormally legal
activitiesConcealment
of illegal activities
4 43
5
15
Italy (N=164)
Slovenia(N=35)
Sweden(N=43)
UK(N=23)
TheNetherlands
(N=34)
70%80%90%
100%
40%50%60%
20%30%
10%0%
40%
50%
20%
30%
10%
0%Italy
(N=137)Slovenia(N=32)
Sweden(N=34)
UK(N=18)
70%80%90%
100%
40%50%60%
20%30%
10%0%
Italy (N=21)
Slovenia(N=8)
Sweden(N=20)
UK(N=10)
TheNetherlands
(N=11)
Italy(N=164)
Slovenia(N=35)
Sweden(N=43)
UK(N=23)
TheNetherlands
(N=34)
Italy(N=164)
Slovenia(N=35)
Sweden(N=43)
UK(N=23)
TheNetherlands
(N=34)
70%80%90%
100%
40%50%60%
20%30%
10%0%
70%80%90%
100%
40%50%60%
20%30%
10%0%
30%
24.9%0.8%
Academic study Judicial evidence
LEA report Media Other
N = 2,380
N = 2,380
N = 2,380
N = 1,305
N = 604
Institutional report
15%
29%
0.4%
Local OCGs Motorcycles gangsItalian mafias
Other OCGs NA
Italy SloveniaThe Netherlands
Sweden UK
Academic study
Judicial evidence LEA report Media
Institutional report
Academic study
LEA report Media
No. criminal charges with references to OCGs % OCGs in relation to all criminal charges
% O
CGs
in re
latio
n to
all
crim
inal
cha
rges
Other
Institutional report
No.
crim
inal
cha
rges
with
refe
renc
es to
OCG
s
Academic study
Judicial evidence LEA report Media
Institutional report
N = 74
23%
24%
20%
32%
1% N = 140
N = 257
N = 70
N = 299
Academic study
LEA report Media Other
Institutional report
No. filed criminal complaints for money laudering offences with references to OCGs
No. filed criminal complaints for money laudering offences without references to OCGs
Academic study
Judicial evidence LEA report Media
Institutional report
Italy SloveniaThe Netherlands
Sweden UK
Italy SloveniaThe Netherlands
Sweden UK
Money laundering FraudFormally legal activities
Concealment of illegal activities Other
Money laundering FraudFormally legal activities
New business NAAlready existing business
Concealment of illegal activities Other
90
53
19
24
9
14
4
30
15
29
21
20% 40% 60% 80% 100%0%
Public limitedcompanies
Private limitedcompanies
Partnerships
Sole traders
Other legal forms
NA
Italy SloveniaThe Netherlands
UKSweden
Public limitedcompanies
Private limitedcompanies
Partnerships
Sole traders
Otherlegal forms
NA
20% 40% 60% 80% 100%0%
Cosa Nostra (N=14) Camorra (N=74)‘Ndrangheta (N=47)
Other Italian (N=13)Chinese (N=16)
Money laundering Fiscal fraudFormally legal activities
Corporate fraud OtherConcealment of illegal activities
Relatives Legal entrepreneursProfessionals
Women among shareholders Women as majority shareholders
Legal companies
53
7
6
14
98
3
1
8
4
1
Small LargeMedium Very large NA
Italy SloveniaThe Netherlands
Sweden UK
0 4-101-3 11-20 >20 NA
This case study concerns a telemarketing company selling advertisement space that issued false invoices to hundreds of primarily self-employed elderly people, threatening to contact the enforcement agency if they did not pay. Even an application to the enforcement agency would be registered for self-employed/business owners, and they could experience problems in obtaining credits and loans from banks, renting apartments, or getting new contracts. For these reasons some people just paid although they knew that the invoice was false. The organisers of this fraud extorted more than 4 million SEK from the victims.
The company ALPHA was registered as a new company, with a name suggesting that it was an empty company created in order to be re-sold. Only a few days later the company was bought for 50,000 SEK by two of the three organisers, who changed its name to ALPHA. A few months later they were replaced by frontmen on the company board. One interviewed policeman suspected that they had been given the idea of this fraudulent set-up by someone else, or alternatively they were acting on behalf of someone.
A second company, BETA, was established approximately one year after ALPHA, and seemingly took over ALPHA’s business activities. By this time, a frontman (a drug addict) had been installed as CEO at ALPHA. BETA was a UK subsidiary and was registered for both F-tax and VAT. BETA was registered at the same address as ALPHA, and the three instigators were jointly prosecuted for actions in both ALPHA and BETA, suggesting that there was no clear division between the companies.
Considering that ALPHA was used as a tool in the fraud, it did make much sense to acquire an existing business with good creditworthiness. This would probably have been more expensive and would not have paid off. Hence a new business was probably established simply because it was relatively easy, and a serious ‘track record’ was not necessary in this crime set-up.
The choice of sector was probably a strategic one. Telemarketing may be very profitable because it has little or no need for skilled labour, low costs, and potentially high profits, especially if questionable methods are used.
In many case studies, the infiltration process was quite straightforward and involved one member of the criminal group regularly starting a new business or acquiring an already-existing one from a legal entrepreneur. This process was facilitated by the scant requirements needed to set up a company or the lack of regulation on the process of acquiring a business (e.g. in Sweden a notary is not required in the process).
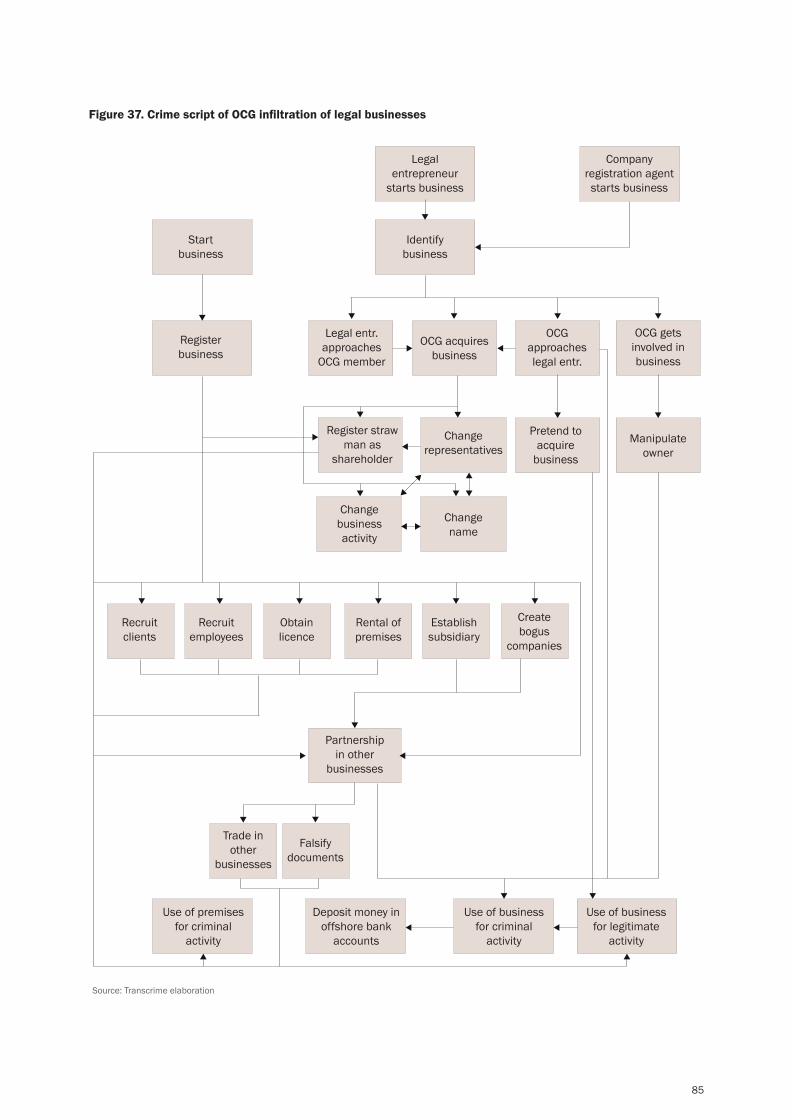
85
Figure 37. Crime script of OCG infiltration of legal businesses
Source: Transcrime elaboration
Legal entrepreneur
starts business
Identify business
Start business
Recruit clients
Recruit employees
Obtain licence
Rental of premises
Partnership in other
businesses
Falsify documents
Trade in other
businesses
Use of premises for criminal
activity
Deposit money in offshore bank
accounts
Use of business for criminal
activity
Use of business for legitimate
activity
Establish subsidiary
Create bogus
companies
Register business
Legal entr. approaches
OCG member
OCG acquires business
OCG approaches legal entr.
OCG gets involved in business
Pretend to acquire
business
Manipulate owner
Change name
Change business activity
Change representatives
Register straw man as
shareholder
Company registration agent starts business

86
When the infiltration process involved an already-existing business, the choice of the targeted business depended on the drivers that the OCG wanted to fulfil with the infiltration. In some cases, companies with good credit histories that had been operating for some years were needed to conduct tax credits fraud (Box 13). Certain types of benefit fraud instead required the infiltration of insolvent companies (Box 14).
Box 13. The acquisition of already-existing companies with good credit histories
The Swedish authorities discovered a large-scale organised fraud against the Tax Authority based on a specific tax reduction for the renovation of existing properties. When the work is completed, the customer ordering the renovation can apply for a tax refund whereby the Tax Authority repays the tax on the work carried out. The method of the fraud is that the construction company reports work that has not been done, and the Tax Authority re-pays tax to the company. Hence, the crime set-up requires a legitimate construction company and a customer who agrees to feign renovations, or – as in this case – people that are used unknowingly.
The criminal group acquired already-existing businesses that were later converted to criminal activities. Before infiltration, the companies had real businesses, and some of them had been registered for many years. On the wiretaps included in the police files, the suspects discussed what type of companies were needed for the crime, i.e. companies with good credit histories that had been operating for some years.
Box 14. The acquisition of insolvent companies to conduct benefit fraud
The case study involves six infiltrated companies and 54 persons belonging to different criminal groups who were prosecuted. The crime plan involved the purchase of legitimate, although insolvent, companies, reporting relatives and friends as employees, placing straw men on the board of directors, filing for bankruptcy, and having the ‘employees’ apply for salary guarantees which were later partly repaid to the organisers of the fraud. The members of the criminal group
targeted companies in difficulties whose owners wanted to get rid of them. There is no evidence of threats or extortion in the acquisition of the businesses. The criminals simply bought the companies from their former owners. After the purchase, several employees were registered, although no signs of actual business activities were found. When the company went bankrupt, the employees had access to salary guarantees. Income benefits amounting to several million SEK were embezzled from the County Administrative Board.
In some cases, targeting businesses with economic difficulties facilitated the infiltration process, since the owners of the companies were eager to sell their shares before leading their business to bankruptcy (Box 15). In these cases, the OCG members simply acquired the shares of the targeted business, and the acquisition process did not involve any illegal activity (e.g. threats, violence, corruption).
Box 15. Infiltration of businesses in economic difficulties to misappropriate their assets and bring them to bankruptcy
The members of a Camorra clan acquired shares in a series of legal businesses operating in the retail food sector in the Veneto region. They misappropriated the assets by defrauding the creditors, and brought the companies to bankruptcy. Before infiltration, all the targeted businesses had been in financial difficulties. The members of the criminal group approached the owners of the companies, who were often willing to sell their shares to a person acting on behalf of the criminal organisation. The organised criminals used the companies to buy goods on credit, and then cheated the suppliers and brought the businesses to bankruptcy. The goods and some of the illicit profits were transferred abroad. Another part of the revenues was reinvested in the acquisition of other businesses with the same characteristics in order to continue the fraud.
In a few Italian case studies, usury was the means used to infiltrate legal businesses (Box 16). Business entities penalised by the legal financial system are vulnerable to OCG infiltration. The lack of regulation of the financial system that provides an early warning

87
system, low capitalisation of family-run companies, and the segmentation of the credit market are factors that make businesses with certain characteristics more vulnerable to financial crises and, therefore, vulnerable to organised crime. These companies were mainly small traders and service companies, craftsmen and small family firms (Bertoni & Rossi, 1997). When these businesses are unable to obtain bank loans and are therefore in financial difficulties, criminal organisations may take the place of banks and offer their usurious loans. These loans enable the OCGs to infiltrate the companies in difficulties until they can take them over (Ciconte, 2008).
Box 16. Infiltration through usury
Sixteen suspects were accused of criminal conspiracy with the aim of controlling food and beverage service activities on the Ostia coast, near Rome. The members of the criminal group knew persons working in banks and financial societies. These persons gave them the names of entrepreneurs in economic difficulties and unable to obtain credit from banks. The OCG approached the legal entrepreneurs and offered to lend them money at usurious rates. When the legal entrepreneur was no longer able to pay, he was forced to hand the company over to the OCG, which managed it through straw men.
Different methods of infiltration can also be identified on the basis of the relationship between the legal entrepreneurs (i.e. the owners of the targeted businesses before infiltration) and the organised criminals. On the one hand, OCG members directly owned and managed a legal business; on the other hand, they created a partnership with the legal entrepreneur who was the formal shareholder and director of the infiltrated business and became involved in the illicit activities (Fantò, 1999). In some Swedish case studies, the organised criminals pretended to acquire an already-existing business by signing the documents to change the board members but never submitted them to the Companies Registration Office. The legal entrepreneur, unaware that the property had not been transferred, thus became a straw man for the OCG in his former business entity (Box 17).
Box 17. ‘Fake’ acquisition of a legal business in Sweden
In this case study, a taxi company was acquired as a front to buy cars, report them stolen, and obtain both insurance for the stolen cars and payment for the cars when sold abroad. The taxi company ALPHA was started by a legal entrepreneur in 2008. In 2010 the owner Mr. A decided to sell the company and placed an advertisement on a buy-and-sell website. Mr. B, a member of the criminal group, contacted Mr. A to buy the company. He convinced Mr. A to accept payment on credit and claimed that he had signed and submitted the papers to the CRO, although he had not. Therefore, Mr. A remained the frontman of his old company. Mr. A also signed the documents to buy the cars. Only when he received notification from the CRO that Mr. B had cancelled the registration as owner of ALPHA did Mr. A discover that the cars were stolen and filed a crime report.
Besides a passive cooperation motivated by the fear of retaliation, a form of active cooperation between the legal entrepreneur and the OCG members was found in some case studies, as a result of an agreement that benefited both parties. Different types of entrepreneurs can thus be identified on the basis of Sciarrone’s (2009) typology: subordinate entrepreneurs, who have a passive relationship with the OCG based on intimidation and fear of retaliation; collusive entrepreneurs, who cooperate with organised criminals to obtain economic benefits; and criminal entrepreneurs who belong to the criminal organisation.
Subordinate entrepreneurs were found in some case studies where OCGs infiltrated legal businesses by means of threats, intimidation, and extortion (Box 18). Case studies with evidence of the use of violence and threat, as well as corruption, are scarce and generally involve Italian mafia groups. In most case studies in which legal entrepreneurs were involved, the evidence suggested that they were either collusive or unaware of the illicit activities conducted by the OCG members.
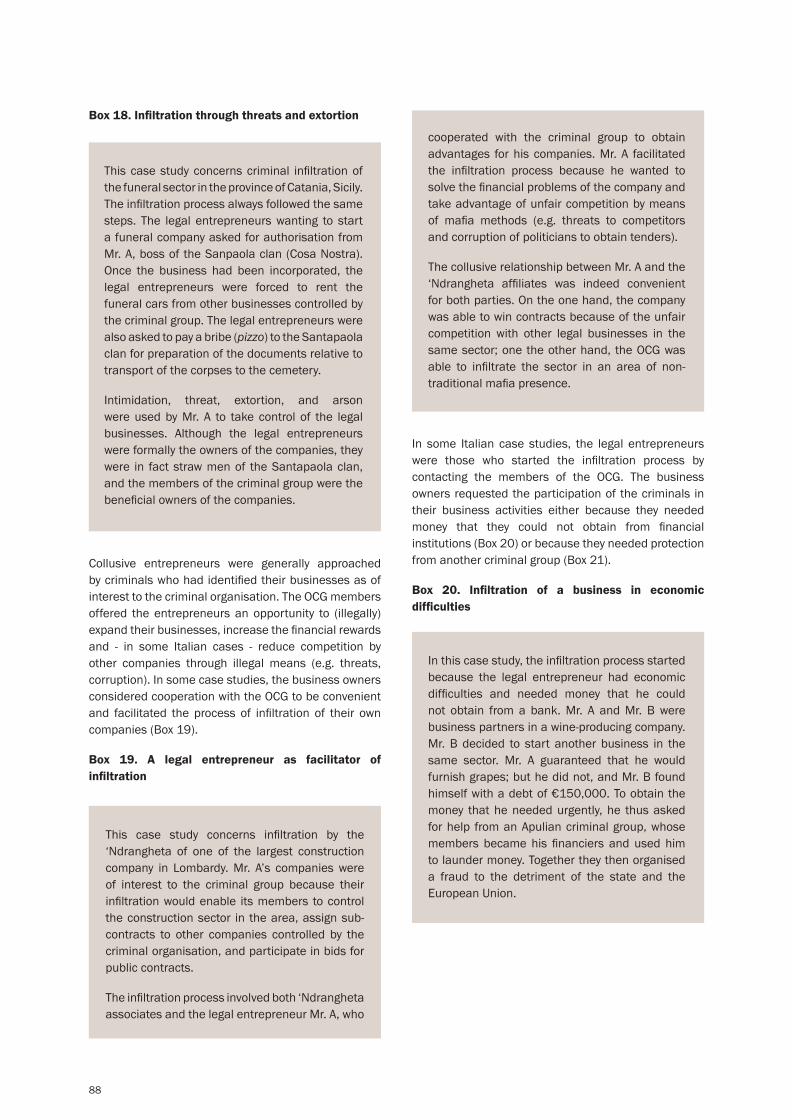
88
Box 18. Infiltration through threats and extortion
This case study concerns criminal infiltration of the funeral sector in the province of Catania, Sicily. The infiltration process always followed the same steps. The legal entrepreneurs wanting to start a funeral company asked for authorisation from Mr. A, boss of the Sanpaola clan (Cosa Nostra). Once the business had been incorporated, the legal entrepreneurs were forced to rent the funeral cars from other businesses controlled by the criminal group. The legal entrepreneurs were also asked to pay a bribe (pizzo) to the Santapaola clan for preparation of the documents relative to transport of the corpses to the cemetery.
Intimidation, threat, extortion, and arson were used by Mr. A to take control of the legal businesses. Although the legal entrepreneurs were formally the owners of the companies, they were in fact straw men of the Santapaola clan, and the members of the criminal group were the beneficial owners of the companies.
Collusive entrepreneurs were generally approached by criminals who had identified their businesses as of interest to the criminal organisation. The OCG members offered the entrepreneurs an opportunity to (illegally) expand their businesses, increase the financial rewards and - in some Italian cases - reduce competition by other companies through illegal means (e.g. threats, corruption). In some case studies, the business owners considered cooperation with the OCG to be convenient and facilitated the process of infiltration of their own companies (Box 19).
Box 19. A legal entrepreneur as facilitator of infiltration
This case study concerns infiltration by the ‘Ndrangheta of one of the largest construction company in Lombardy. Mr. A’s companies were of interest to the criminal group because their infiltration would enable its members to control the construction sector in the area, assign sub-contracts to other companies controlled by the criminal organisation, and participate in bids for public contracts.
The infiltration process involved both ‘Ndrangheta associates and the legal entrepreneur Mr. A, who
cooperated with the criminal group to obtain advantages for his companies. Mr. A facilitated the infiltration process because he wanted to solve the financial problems of the company and take advantage of unfair competition by means of mafia methods (e.g. threats to competitors and corruption of politicians to obtain tenders).
The collusive relationship between Mr. A and the ‘Ndrangheta affiliates was indeed convenient for both parties. On the one hand, the company was able to win contracts because of the unfair competition with other legal businesses in the same sector; one the other hand, the OCG was able to infiltrate the sector in an area of non-traditional mafia presence.
In some Italian case studies, the legal entrepreneurs were those who started the infiltration process by contacting the members of the OCG. The business owners requested the participation of the criminals in their business activities either because they needed money that they could not obtain from financial institutions (Box 20) or because they needed protection from another criminal group (Box 21).
Box 20. Infiltration of a business in economic difficulties
In this case study, the infiltration process started because the legal entrepreneur had economic difficulties and needed money that he could not obtain from a bank. Mr. A and Mr. B were business partners in a wine-producing company. Mr. B decided to start another business in the same sector. Mr. A guaranteed that he would furnish grapes; but he did not, and Mr. B found himself with a debt of €150,000. To obtain the money that he needed urgently, he thus asked for help from an Apulian criminal group, whose members became his financiers and used him to launder money. Together they then organised a fraud to the detriment of the state and the European Union.

89
Box 21. A request for protection by legal entrepreneurs as the starting point of the infiltration process
In 2010 a criminal investigation uncovered a case of infiltration by a ‘Ndrangheta group of a company involved in telemarketing, teleselling, and call centre activities in the North of Italy. The infiltration began with a request for protection made by the owners of the business, Mr. A and Mr. B, to the boss of the Bellocco clan after the two legal entrepreneurs had been threatened by another ‘Ndrangheta clan.
The boss of the Bellocco clan assessed the value of the company and considered it suited to the criminal group’s interests, given that it had substantial cash assets. He therefore decided to provide the protection services in exchange for donation of some of the company’s shares to straw men acting on behalf of the criminal organisation. When Mr. A and Mr. B transferred 40% of the shares to the straw men of the Bellocco clan, the infiltration process was completed.
The infiltration process also involved OCG members’ relatives, professionals, public officials and politicians who helped the organised criminals to acquire and manage the legal businesses. Relatives were often involved in the infiltration process (Box 22), as well as shareholders of the infiltrated businesses (see Chapter 10).
Box 22. Involvement of relatives in a fraud through a metal trading company based in London
A gang of criminals used a metal trading firm (ALPHA) based in London to defraud banks and creditors all over the world between 1996 and 2002. The owner of the company with the help of accomplices and three of his brothers living in the USA, the UAE and Singapore coordinated over 300 bogus customers and companies based in the USA, Singapore, India, Dubai, Hong Kong, Italy and France to create false trades that could give credibility to ALPHA and allow it to ask for advance money from banks and creditors which believed they were giving money to an important metal trading firm. The company was so lucrative that its owner ended up in the Sunday Times Rich List. It also managed to dupe
a number of politicians to act as advisers and give the company further credibility.
The fake customers and companies were accomplices with addresses in different countries; they used false documents to present themselves as independent traders and win the confidence of auditors and banks. The fraud consisted in persuading lending institutions to advance large sums of money for metal trading transactions to ALPHA and its sister company in the USA (BETA), which was controlled by the owner of ALPHA with the involvement of his brother. The lending institutions were deceived into believing that the transactions involved genuine purchases and sales of metal with customers independent of ALPHA and BETA.
Whilst there was some honest trading, most of it was fraudulent and related to the purported purchases or sales of metal which never took place, or the falsification of documents so as to make it appear that the amount of the purchase price was far greater than the true amount, typically by the documentary substitution of a more valuable metal for a less valuable one. The money advanced by the banks was of benefit to the group either by way of the sale of receivables or by way of funding the purchase of metal.
Professionals (e.g., lawyers, notaries, accountants) participate in the infiltration process to provide assistance to OCG members on specific matters, especially in Italy and in the Netherlands, where frauds were the main driver of infiltration (Figure 38). Box 23 highlights the role of the web as a facilitator of the infiltration process.
Figure 38. Involvement of professionals in the infiltration process by country
figure 1
figure 2
figure 3
figure 10
figure 15
figure 18
figure 19
figure 20
Figure 24
figure 27
figure 31
figure 32
figure 34
figure 35
figure 36
figure 37
figure 39
figure 40
figure 41
figure 42
figure 43
figure 45
figure 46
figure 47
figure 48
figure 49
figure 50
figure 51
9.2%
49.8%
1.3%
17.1%
22.5%
54.8%25.4%
3.1%
5.9%
10.8%
27%
25%
1%
15%
32%
43%
33%
20%
3% 1%
20%
1%3%
5%
70%
100%90%80%70%60%50%40%30%20%10%
0%2002
4
1
3
2
3
1
1
4
15
1
62
2
47
1
139 89 40
2
5 3 39
2003 2004 2005 2006 2007 2008 2009 2010 2011 2012 2013 2014*
21%
15%
1%4%
59%
21
11
8
20
10
164
34
35
43
23
20
25
15
10
5
01 2 3 4 5 6 7 8 9 10 >10
21%
16%
22%
21%
19%
70%80%90%
100%
40%50%60%
20%30%
10%0%
70%80%90%
100%
40%50%60%
20%30%
10%0%
Italy (N=164)
Slovenia(N=35)
Sweden(N=43)
UK(N=23)
TheNetherlands
(N=34)
Italy (N=21)
Slovenia(N=8)
Sweden(N=20)
UK(N=10)
TheNetherlands
(N=11)
Italy Slovenia Sweden UKTheNetherlands
70% 14
5
62
40%
50%
60%
20%
30%
10%
0%
600
500
400
300
200
100
0
0.20%
0.30%
0.10%
0.50%
0.60%
0.70%
0.80%
0.40%
0.00%2002
0.72%
0.51%
0.26%
0.47%0.56%
0.33%
0.44% 0.47%0.39%
0.36%
0.58%0.52%
0.24%
2003 2004 2005 2006 2007 2008 2009 2010 2011 2012 2013 2014*
38
6
10
5
7
70%80%90%
100%
94
25
19
35
2
40%50%60%
20%30%
10%0%
Italy (N=164)
Slovenia(N=35)
Sweden(N=43)
UK(N=23)
TheNetherlands
(N=34)
Public limited companies
Private limited companies
Partnerships
Sole traders
Other legal forms
NA
20% 40% 60% 80% 100%0%
figure 44
70%80%90%
100%
40%50%60% 90
11
22 26
17
20%30%
10%0%
Italy (N=164)
Slovenia(N=35)
Sweden(N=43)
UK(N=23)
TheNetherlands
(N=34)
10
12
6
8
4
2
14
16
0Money
launderingFraud OtherFormally legal
activitiesConcealment
of illegal activities
4 43
5
15
Italy (N=164)
Slovenia(N=35)
Sweden(N=43)
UK(N=23)
TheNetherlands
(N=34)
70%80%90%
100%
40%50%60%
20%30%
10%0%
40%
50%
20%
30%
10%
0%Italy
(N=137)Slovenia(N=32)
Sweden(N=34)
UK(N=18)
70%80%90%
100%
40%50%60%
20%30%
10%0%
Italy (N=21)
Slovenia(N=8)
Sweden(N=20)
UK(N=10)
TheNetherlands
(N=11)
Italy(N=164)
Slovenia(N=35)
Sweden(N=43)
UK(N=23)
TheNetherlands
(N=34)
Italy(N=164)
Slovenia(N=35)
Sweden(N=43)
UK(N=23)
TheNetherlands
(N=34)
70%80%90%
100%
40%50%60%
20%30%
10%0%
70%80%90%
100%
40%50%60%
20%30%
10%0%
30%
24.9%0.8%
Academic study Judicial evidence
LEA report Media Other
N = 2,380
N = 2,380
N = 2,380
N = 1,305
N = 604
Institutional report
15%
29%
0.4%
Local OCGs Motorcycles gangsItalian mafias
Other OCGs NA
Italy SloveniaThe Netherlands
Sweden UK
Academic study
Judicial evidence LEA report Media
Institutional report
Academic study
LEA report Media
No. criminal charges with references to OCGs % OCGs in relation to all criminal charges
% O
CGs
in re
latio
n to
all
crim
inal
cha
rges
Other
Institutional report
No.
crim
inal
cha
rges
with
refe
renc
es to
OCG
s
Academic study
Judicial evidence LEA report Media
Institutional report
N = 74
23%
24%
20%
32%
1% N = 140
N = 257
N = 70
N = 299
Academic study
LEA report Media Other
Institutional report
No. filed criminal complaints for money laudering offences with references to OCGs
No. filed criminal complaints for money laudering offences without references to OCGs
Academic study
Judicial evidence LEA report Media
Institutional report
Italy SloveniaThe Netherlands
Sweden UK
Italy SloveniaThe Netherlands
Sweden UK
Money laundering FraudFormally legal activities
Concealment of illegal activities Other
Money laundering FraudFormally legal activities
New business NAAlready existing business
Concealment of illegal activities Other
90
53
19
24
9
14
4
30
15
29
21
20% 40% 60% 80% 100%0%
Public limitedcompanies
Private limitedcompanies
Partnerships
Sole traders
Other legal forms
NA
Italy SloveniaThe Netherlands
UKSweden
Public limitedcompanies
Private limitedcompanies
Partnerships
Sole traders
Otherlegal forms
NA
20% 40% 60% 80% 100%0%
Cosa Nostra (N=14) Camorra (N=74)‘Ndrangheta (N=47)
Other Italian (N=13)Chinese (N=16)
Money laundering Fiscal fraudFormally legal activities
Corporate fraud OtherConcealment of illegal activities
Relatives Legal entrepreneursProfessionals
Women among shareholders Women as majority shareholders
Legal companies
53
7
6
14
98
3
1
8
4
1
Small LargeMedium Very large NA
Italy SloveniaThe Netherlands
Sweden UK
0 4-101-3 11-20 >20 NA
Source: Transcrime elaboration on DCS data

90
Box 23. The web as a facilitator of infiltration
This case involved ten suspects and six companies. All the companies were originally set up as legal businesses and then became involved in illegal activities. Hence, none of the six companies was set up with the intention to commit fraud/crime. The suspects slowly became involved in criminal activities while doing business.
One of the main suspects, Mr. A, was a pharmacist who originally had a pharmacy in a city. Mr. A, together with a business partner Mr. B, decided to take his business onto the Internet and started a web shop. The internet pharmacy was in fact an empty office, mainly run by Mr. C, who attended to the orders. The already-existing pharmacy was still needed because it is prohibited in the Netherlands to sell pharmaceutical products to consumers without a licensed pharmacy. The online pharmacy had contacts with several doctors. Patients or customers ordered products on the pharmacy’s website. These patients or customers lived in the Netherlands, in other EU countries, or in the USA. Together with the order, the patients/customers had to fill out a questionnaire on their physical condition. By law, this form must be checked by a doctor. Initially, only officially registered medicines were provided, but later also non-registered ones were sold. The patients/customers were led to believe that a doctor had checked their order and assessed the risks of the prescriptions. In practice, no one checked the orders. Seven doctors were involved. Payments by customers were made with the PayPal system.
The first criminal investigation was conducted by Dutch Customs because illegal drugs in shipments had been returned by the US Customs. About half a year after this investigation, a second criminal investigation started on the same suspects in regard to the trade in illegal drugs (e.g. Viagra).
In order to run the criminal business, customers were recruited at attractive internet sites. The costs of running the office were low. Moreover, prescriptions were often sold at prices higher than the lawfully prescribed rates. At least one of the collaborating doctors expressed concerns about the sale of illegal medications and drugs. His concerns were effectively dealt with by Mr. A, who stated that the internet pharmacy was in the process of opening an office in Curacao as cover up to legalise all transactions.
10. Control strategies of infiltrated businesses59
The expression ’control strategies’ refers to the ownership structure of infiltrated businesses, i.e. how infiltrated businesses are owned and controlled. Given the lack of previous research, the analysis of the ownership structure has included:
• The legal form of infiltrated businesses;
• The nature of shareholders and directors;
• The use of other forms of control (e.g. complex corporate ownership schemes).
10.1 Legal form
Depending on the specific goals that they intend to pursue, OCGs may prefer some legal forms rather than others. Table 20 summarises the hypotheses on the legal forms of infiltrated businesses.
On the one hand, OCGs may need to conceal their criminal activities and identity. In these cases, they will prefer legal forms, such as private limited companies, which allow for greater fragmentation of the share capital, thus making it more difficult for law enforcement agencies to identify the beneficial owners of the infiltrated businesses and reducing the potential impact of seizure and confiscation. Indeed, in the case of seizure or confiscation, only the shares of the person indicted are usually restricted (FATF, 2006; Gup & Beekarry, 2009; Steinko, 2012; Transcrime, 2013b). For the same reasons, OCGs may also choose legal forms with low transparency requirements, such as trusts or foundations, especially those registered in countries with low transparency regimes (FATF, 2006; Transcrime, 2013b; van der Does de Willebois, Halter, Harrison, Park, & Sharman, 2011).
On the other hand, individual companies (e.g., sole traders/proprietorships) or unlimited companies (e.g., partnerships) may be favoured by criminal groups which, by tradition or for cultural reasons, want to exert direct control over their assets. The same consideration also applies to OCG members who want to achieve visibility and social prestige by being publicly recognised as ‘successful entrepreneurs’ (Gup & Beekarry, 2009; Transcrime, 2013b).
59. With the collaboration of Federica Sarno (Università Cattolica del Sacro Cuore-Transcrime, Italy).

91
Table 20. Hypotheses on the legal forms of infiltrated businesses
OC drivers and/or needs
Assumptions OC strategy
Concealment of illicit activities and beneficial ownership
Fragmentation of company’s issued share capital to conceal the bene-ficial owner and reduce the risk of seizure of the whole company
Limited companies
Use of non-transparent legal entities
Use of individual companies as holding compa-niesUse of trusts, fiduciary companies, associations, foundationsUse of shell companies
Direct control and exposure
Direct control over the company without the need to involve professionals or external managers
Unlimited companies
Individual companies
Legal forms easy to establish and manage, and not requiring accounting of financial transactions
Individual companies Unlimited companiesLimited companies
Source: Transcrime elaboration
Figure 39 presents the distribution of the legal forms of infiltrated businesses in the five countries covered by the project. Private limited liability companies are the preferred legal form in all the countries. In particular, they account for more than 90% of infiltrated businesses in the United Kingdom and in the Netherlands. In Italy, Sweden and Slovenia, they have a lower prevalence (64.6%, 41.9% and 45.7% respectively).
Figure 39. Legal forms of infiltrated businesses by country60
figure 1
figure 2
figure 3
figure 10
figure 15
figure 18
figure 19
figure 20
Figure 24
figure 27
figure 31
figure 32
figure 34
figure 35
figure 36
figure 37
figure 39
figure 40
figure 41
figure 42
figure 43
figure 45
figure 46
figure 47
figure 48
figure 49
figure 50
figure 51
9.2%
49.8%
1.3%
17.1%
22.5%
54.8%25.4%
3.1%
5.9%
10.8%
27%
25%
1%
15%
32%
43%
33%
20%
3% 1%
20%
1%3%
5%
70%
100%90%80%70%60%50%40%30%20%10%
0%2002
4
1
3
2
3
1
1
4
15
1
62
2
47
1
139 89 40
2
5 3 39
2003 2004 2005 2006 2007 2008 2009 2010 2011 2012 2013 2014*
21%
15%
1%4%
59%
21
11
8
20
10
164
34
35
43
23
20
25
15
10
5
01 2 3 4 5 6 7 8 9 10 >10
21%
16%
22%
21%
19%
70%80%90%
100%
40%50%60%
20%30%
10%0%
70%80%90%
100%
40%50%60%
20%30%
10%0%
Italy (N=164)
Slovenia(N=35)
Sweden(N=43)
UK(N=23)
TheNetherlands
(N=34)
Italy (N=21)
Slovenia(N=8)
Sweden(N=20)
UK(N=10)
TheNetherlands
(N=11)
Italy Slovenia Sweden UKTheNetherlands
70% 14
5
62
40%
50%
60%
20%
30%
10%
0%
600
500
400
300
200
100
0
0.20%
0.30%
0.10%
0.50%
0.60%
0.70%
0.80%
0.40%
0.00%2002
0.72%
0.51%
0.26%
0.47%0.56%
0.33%
0.44% 0.47%0.39%
0.36%
0.58%0.52%
0.24%
2003 2004 2005 2006 2007 2008 2009 2010 2011 2012 2013 2014*
38
6
10
5
7
70%80%90%
100%
94
25
19
35
2
40%50%60%
20%30%
10%0%
Italy (N=164)
Slovenia(N=35)
Sweden(N=43)
UK(N=23)
TheNetherlands
(N=34)
Public limited companies
Private limited companies
Partnerships
Sole traders
Other legal forms
NA
20% 40% 60% 80% 100%0%
figure 44
70%80%90%
100%
40%50%60% 90
11
22 26
17
20%30%
10%0%
Italy (N=164)
Slovenia(N=35)
Sweden(N=43)
UK(N=23)
TheNetherlands
(N=34)
10
12
6
8
4
2
14
16
0Money
launderingFraud OtherFormally legal
activitiesConcealment
of illegal activities
4 43
5
15
Italy (N=164)
Slovenia(N=35)
Sweden(N=43)
UK(N=23)
TheNetherlands
(N=34)
70%80%90%
100%
40%50%60%
20%30%
10%0%
40%
50%
20%
30%
10%
0%Italy
(N=137)Slovenia(N=32)
Sweden(N=34)
UK(N=18)
70%80%90%
100%
40%50%60%
20%30%
10%0%
Italy (N=21)
Slovenia(N=8)
Sweden(N=20)
UK(N=10)
TheNetherlands
(N=11)
Italy(N=164)
Slovenia(N=35)
Sweden(N=43)
UK(N=23)
TheNetherlands
(N=34)
Italy(N=164)
Slovenia(N=35)
Sweden(N=43)
UK(N=23)
TheNetherlands
(N=34)
70%80%90%
100%
40%50%60%
20%30%
10%0%
70%80%90%
100%
40%50%60%
20%30%
10%0%
30%
24.9%0.8%
Academic study Judicial evidence
LEA report Media Other
N = 2,380
N = 2,380
N = 2,380
N = 1,305
N = 604
Institutional report
15%
29%
0.4%
Local OCGs Motorcycles gangsItalian mafias
Other OCGs NA
Italy SloveniaThe Netherlands
Sweden UK
Academic study
Judicial evidence LEA report Media
Institutional report
Academic study
LEA report Media
No. criminal charges with references to OCGs % OCGs in relation to all criminal charges
% O
CGs
in re
latio
n to
all
crim
inal
cha
rges
Other
Institutional report
No.
crim
inal
cha
rges
with
refe
renc
es to
OCG
s
Academic study
Judicial evidence LEA report Media
Institutional report
N = 74
23%
24%
20%
32%
1% N = 140
N = 257
N = 70
N = 299
Academic study
LEA report Media Other
Institutional report
No. filed criminal complaints for money laudering offences with references to OCGs
No. filed criminal complaints for money laudering offences without references to OCGs
Academic study
Judicial evidence LEA report Media
Institutional report
Italy SloveniaThe Netherlands
Sweden UK
Italy SloveniaThe Netherlands
Sweden UK
Money laundering FraudFormally legal activities
Concealment of illegal activities Other
Money laundering FraudFormally legal activities
New business NAAlready existing business
Concealment of illegal activities Other
90
53
19
24
9
14
4
30
15
29
21
20% 40% 60% 80% 100%0%
Public limitedcompanies
Private limitedcompanies
Partnerships
Sole traders
Other legal forms
NA
Italy SloveniaThe Netherlands
UKSweden
Public limitedcompanies
Private limitedcompanies
Partnerships
Sole traders
Otherlegal forms
NA
20% 40% 60% 80% 100%0%
Cosa Nostra (N=14) Camorra (N=74)‘Ndrangheta (N=47)
Other Italian (N=13)Chinese (N=16)
Money laundering Fiscal fraudFormally legal activities
Corporate fraud OtherConcealment of illegal activities
Relatives Legal entrepreneursProfessionals
Women among shareholders Women as majority shareholders
Legal companies
53
7
6
14
98
3
1
8
4
1
Small LargeMedium Very large NA
Italy SloveniaThe Netherlands
Sweden UK
0 4-101-3 11-20 >20 NA
Source: Transcrime elaboration on DCS data
Other types of legal forms are more country-specific. For example, sole traders are frequent among infiltrated businesses in Slovenia, while public limited companies are common among Swedish companies controlled by criminal groups. This may partly be due to the characteristics of the case studies collected in the different countries. For instance, many Slovenian case studies involve bars and night clubs with no or a few employees. This may explain the prevalence of sole traders among infiltrated businesses in Slovenia.
The decision of OCGs to infiltrate legitimate businesses with a certain legal form may depend on two different factors. On the one hand, the choice of a certain legal form may reflect the characteristics of the local economy in a given country. In this case, it is likely that the legal form of the infiltrated business coincides with the legal form most commonly used in the same country and business sector. On the other hand, OCGs may infiltrate businesses with the most attractive characteristics and not necessarily those with the most common legal form. In this latter case, it is likely that the legal form of the infiltrated business differs from the most common one.
60. The category ‘other legal forms’ includes: branches, non-profit organisa-tions, and foreign companies.

92
The legal form of infiltrated businesses is thus compared with the most common legal form in the same country and business sector. Figure 40 shows the number of infiltrated businesses which do not have the same legal form as the most common one in the same country and business sector.61 62 In cases of discrepancy, private limited companies are the type of business most frequently used by OCGs. This further supports the hypothesis that private limited liability companies are the preferred legal form for infiltrated businesses, regardless of whether they are the most common legal form in the same country and business sector.
Figure 40. Infiltrated businesses with a legal form different from the one most common in the same country and economic sector
Source: Transcrime elaboration on DCS data
Overall, the above results suggest that OCGs decide to infiltrate legitimate businesses with attractive characteristics. In particular, they seem to prefer forms of businesses which favour the concealment of criminal identity and reduce the impact of law enforcement intervention. At the same time, the results of this study should be interpreted with caution. In fact, by comparing the DCS sample of infiltrated businesses with the number of active companies registered in Bureau van Dijk’s Orbis, some discrepancies have emerged.63
In the case of Italy, it was possible to further detail the analysis by type of OCG.64 Previous studies on Italian mafia infiltration in legitimate businesses have pointed out that different mafias may prefer different legal forms (Transcrime, 2013b). Figure 42 describes the legal forms of infiltrated businesses in Italy, distinguishing by type of OCG. Private limited liability companies (i.e. società a responsabilità limitata) are the form of business favoured by all criminal groups. As suggested by Transcrime (2013b), they represent the best compromise between the need of OCGs to conceal criminal activities and identity and the ease of establishment and management.
Private limited companies account for nearly 80% of the businesses infiltrated by Cosa Nostra and the ‘Ndrangheta. In the case of the Camorra, private limited companies still represent the majority of infiltrated businesses, but with a lower percentage (59.5%). Conversely, sole traders and partnerships assume a greater relevance, in line with previous findings (Transcrime, 2013b). Partnerships are also favoured by other Italian groups.65 Contrary to previous findings, no sole traders were instead found among the companies infiltrated by the ‘Ndrangheta. This discrepancy is probably due to the different types of data used in this study, if compared with the previous ones.
With regard to foreign groups operating in Italy, all the evidence recorded by this study relates to Chinese OCGs. Similarly to Italian organisations, Chinese criminal groups seem to favour private limited companies (Figure 41). Nonetheless, these results should be considered as preliminary findings and warrant further exploration. Indeed, in 43.8% of the episodes regarding Chinese OCGs it was not possible to identify the legal form of infiltrated businesses.
figure 1
figure 2
figure 3
figure 10
figure 15
figure 18
figure 19
figure 20
Figure 24
figure 27
figure 31
figure 32
figure 34
figure 35
figure 36
figure 37
figure 39
figure 40
figure 41
figure 42
figure 43
figure 45
figure 46
figure 47
figure 48
figure 49
figure 50
figure 51
9.2%
49.8%
1.3%
17.1%
22.5%
54.8%25.4%
3.1%
5.9%
10.8%
27%
25%
1%
15%
32%
43%
33%
20%
3% 1%
20%
1%3%
5%
70%
100%90%80%70%60%50%40%30%20%10%
0%2002
4
1
3
2
3
1
1
4
15
1
62
2
47
1
139 89 40
2
5 3 39
2003 2004 2005 2006 2007 2008 2009 2010 2011 2012 2013 2014*
21%
15%
1%4%
59%
21
11
8
20
10
164
34
35
43
23
20
25
15
10
5
01 2 3 4 5 6 7 8 9 10 >10
21%
16%
22%
21%
19%
70%80%90%
100%
40%50%60%
20%30%
10%0%
70%80%90%
100%
40%50%60%
20%30%
10%0%
Italy (N=164)
Slovenia(N=35)
Sweden(N=43)
UK(N=23)
TheNetherlands
(N=34)
Italy (N=21)
Slovenia(N=8)
Sweden(N=20)
UK(N=10)
TheNetherlands
(N=11)
Italy Slovenia Sweden UKTheNetherlands
70% 14
5
62
40%
50%
60%
20%
30%
10%
0%
600
500
400
300
200
100
0
0.20%
0.30%
0.10%
0.50%
0.60%
0.70%
0.80%
0.40%
0.00%2002
0.72%
0.51%
0.26%
0.47%0.56%
0.33%
0.44% 0.47%0.39%
0.36%
0.58%0.52%
0.24%
2003 2004 2005 2006 2007 2008 2009 2010 2011 2012 2013 2014*
38
6
10
5
7
70%80%90%
100%
94
25
19
35
2
40%50%60%
20%30%
10%0%
Italy (N=164)
Slovenia(N=35)
Sweden(N=43)
UK(N=23)
TheNetherlands
(N=34)
Public limited companies
Private limited companies
Partnerships
Sole traders
Other legal forms
NA
20% 40% 60% 80% 100%0%
figure 44
70%80%90%
100%
40%50%60% 90
11
22 26
17
20%30%
10%0%
Italy (N=164)
Slovenia(N=35)
Sweden(N=43)
UK(N=23)
TheNetherlands
(N=34)
10
12
6
8
4
2
14
16
0Money
launderingFraud OtherFormally legal
activitiesConcealment
of illegal activities
4 43
5
15
Italy (N=164)
Slovenia(N=35)
Sweden(N=43)
UK(N=23)
TheNetherlands
(N=34)
70%80%90%
100%
40%50%60%
20%30%
10%0%
40%
50%
20%
30%
10%
0%Italy
(N=137)Slovenia(N=32)
Sweden(N=34)
UK(N=18)
70%80%90%
100%
40%50%60%
20%30%
10%0%
Italy (N=21)
Slovenia(N=8)
Sweden(N=20)
UK(N=10)
TheNetherlands
(N=11)
Italy(N=164)
Slovenia(N=35)
Sweden(N=43)
UK(N=23)
TheNetherlands
(N=34)
Italy(N=164)
Slovenia(N=35)
Sweden(N=43)
UK(N=23)
TheNetherlands
(N=34)
70%80%90%
100%
40%50%60%
20%30%
10%0%
70%80%90%
100%
40%50%60%
20%30%
10%0%
30%
24.9%0.8%
Academic study Judicial evidence
LEA report Media Other
N = 2,380
N = 2,380
N = 2,380
N = 1,305
N = 604
Institutional report
15%
29%
0.4%
Local OCGs Motorcycles gangsItalian mafias
Other OCGs NA
Italy SloveniaThe Netherlands
Sweden UK
Academic study
Judicial evidence LEA report Media
Institutional report
Academic study
LEA report Media
No. criminal charges with references to OCGs % OCGs in relation to all criminal charges
% O
CGs
in re
latio
n to
all
crim
inal
cha
rges
Other
Institutional report
No.
crim
inal
cha
rges
with
refe
renc
es to
OCG
s
Academic study
Judicial evidence LEA report Media
Institutional report
N = 74
23%
24%
20%
32%
1% N = 140
N = 257
N = 70
N = 299
Academic study
LEA report Media Other
Institutional report
No. filed criminal complaints for money laudering offences with references to OCGs
No. filed criminal complaints for money laudering offences without references to OCGs
Academic study
Judicial evidence LEA report Media
Institutional report
Italy SloveniaThe Netherlands
Sweden UK
Italy SloveniaThe Netherlands
Sweden UK
Money laundering FraudFormally legal activities
Concealment of illegal activities Other
Money laundering FraudFormally legal activities
New business NAAlready existing business
Concealment of illegal activities Other
90
53
19
24
9
14
4
30
15
29
21
20% 40% 60% 80% 100%0%
Public limitedcompanies
Private limitedcompanies
Partnerships
Sole traders
Other legal forms
NA
Italy SloveniaThe Netherlands
UKSweden
Public limitedcompanies
Private limitedcompanies
Partnerships
Sole traders
Otherlegal forms
NA
20% 40% 60% 80% 100%0%
Cosa Nostra (N=14) Camorra (N=74)‘Ndrangheta (N=47)
Other Italian (N=13)Chinese (N=16)
Money laundering Fiscal fraudFormally legal activities
Corporate fraud OtherConcealment of illegal activities
Relatives Legal entrepreneursProfessionals
Women among shareholders Women as majority shareholders
Legal companies
53
7
6
14
98
3
1
8
4
1
Small LargeMedium Very large NA
Italy SloveniaThe Netherlands
Sweden UK
0 4-101-3 11-20 >20 NA
61. In order to identify which was the most common legal form in a given country and business sector (NACE 0-digit), use was made of the data on active companies registered in Bureau van Dijk’s Orbis. In the case in which more than one legal form was largely prevalent over the others, both the first and the second most common legal form were used for comparison, provided that the difference between the values of these two categories (calculated as % of the total) was less than or equal to 5%. 62. The low percentage of infiltrated businesses with an uncommon legal form recorded in the UK may depend on the type of data used for compar-ison. Data on the legal form of active businesses in the five EU MS were retrieved from Bureau van Dijk’s Orbis. The number of active sole traders registered in Orbis is lower in the United Kingdom if compared with the oth-er four countries. Despite these limitations, the Orbis database represents the best available source at the present time. For instance, the statistics of the British national business register (i.e. Companies House) do not include information on sole traders, partnerships and charities (Companies House, 2014)
63. In particular, private and public limited companies tend to be overrepre-sented in the DCS sample in all the countries. For example, private limited companies account for 91.2% of infiltrated businesses in the Netherlands, while they represent only 31.9% of the Dutch active companies registered in Orbis. The same consideration also applies to infiltrated partnerships, with the exception of Sweden, where this form of business is poorly repre-sented if compared with the percentage of active partnerships registered in Orbis. Similarly, sole traders are underrepresented in the DCS sample in Italy and Sweden, while they are overrepresented in Slovenia. No episodes of infiltrated partnerships and sole traders have been found in the United Kingdom.
64. It was not possible to conduct the same analysis for the other ARIEL countries because the OCGs involved in the infiltration process were in all cases local groups. In the case of Sweden, prison gangs and outlaw mo-torcycle gangs were also present, but they accounted for a low number of episodes if compared with the Swedish OCGs. In particular, prison gangs recorded 2 episodes out of 43, corresponding to 1 foreign company and 1 private limited company; motorcycle gangs accounted for 4 episodes, cor-responding to 3 public limited companies and 1 private limited company.
65. The category “other Italian” includes the Società Foggiana and other non-specified Italian OCGs.

93
Figure 41. Legal forms of infiltrated businesses in Italy by type of OCG
Source: Transcrime elaboration on DCS data
There are several reasons why OCGs decide to infiltrate legitimate businesses. Nonetheless, regardless of the type of driver considered, private limited liability companies represent the legal form most frequently infiltrated by OCGs in the five countries covered by the project (Figure 42). Interestingly, no sole traders were found among the businesses used to commit frauds. Probably, individual companies are a form of business too small to permit the perpetration of complex fraudulent schemes as fiscal and corporate frauds usually are. Moreover, they do not provide the owners of the infiltrated companies with any form of protection from personal liability. Indeed, fraud schemes often exploit the possibility to incorporate businesses and make them disappear with limited impact on personal assets (i.e. missing trader frauds). For this reason, OCGs may prefer other and more secure types of businesses, which allow for fragmentation of the share capital and, therefore, reduced liability (H. Silverstone & Sheetz, 2007).
figure 1
figure 2
figure 3
figure 10
figure 15
figure 18
figure 19
figure 20
Figure 24
figure 27
figure 31
figure 32
figure 34
figure 35
figure 36
figure 37
figure 39
figure 40
figure 41
figure 42
figure 43
figure 45
figure 46
figure 47
figure 48
figure 49
figure 50
figure 51
9.2%
49.8%
1.3%
17.1%
22.5%
54.8%25.4%
3.1%
5.9%
10.8%
27%
25%
1%
15%
32%
43%
33%
20%
3% 1%
20%
1%3%
5%
70%
100%90%80%70%60%50%40%30%20%10%
0%2002
4
1
3
2
3
1
1
4
15
1
62
2
47
1
139 89 40
2
5 3 39
2003 2004 2005 2006 2007 2008 2009 2010 2011 2012 2013 2014*
21%
15%
1%4%
59%
21
11
8
20
10
164
34
35
43
23
20
25
15
10
5
01 2 3 4 5 6 7 8 9 10 >10
21%
16%
22%
21%
19%
70%80%90%
100%
40%50%60%
20%30%
10%0%
70%80%90%
100%
40%50%60%
20%30%
10%0%
Italy (N=164)
Slovenia(N=35)
Sweden(N=43)
UK(N=23)
TheNetherlands
(N=34)
Italy (N=21)
Slovenia(N=8)
Sweden(N=20)
UK(N=10)
TheNetherlands
(N=11)
Italy Slovenia Sweden UKTheNetherlands
70% 14
5
62
40%
50%
60%
20%
30%
10%
0%
600
500
400
300
200
100
0
0.20%
0.30%
0.10%
0.50%
0.60%
0.70%
0.80%
0.40%
0.00%2002
0.72%
0.51%
0.26%
0.47%0.56%
0.33%
0.44% 0.47%0.39%
0.36%
0.58%0.52%
0.24%
2003 2004 2005 2006 2007 2008 2009 2010 2011 2012 2013 2014*
38
6
10
5
7
70%80%90%
100%
94
25
19
35
2
40%50%60%
20%30%
10%0%
Italy (N=164)
Slovenia(N=35)
Sweden(N=43)
UK(N=23)
TheNetherlands
(N=34)
Public limited companies
Private limited companies
Partnerships
Sole traders
Other legal forms
NA
20% 40% 60% 80% 100%0%
figure 44
70%80%90%
100%
40%50%60% 90
11
22 26
17
20%30%
10%0%
Italy (N=164)
Slovenia(N=35)
Sweden(N=43)
UK(N=23)
TheNetherlands
(N=34)
10
12
6
8
4
2
14
16
0Money
launderingFraud OtherFormally legal
activitiesConcealment
of illegal activities
4 43
5
15
Italy (N=164)
Slovenia(N=35)
Sweden(N=43)
UK(N=23)
TheNetherlands
(N=34)
70%80%90%
100%
40%50%60%
20%30%
10%0%
40%
50%
20%
30%
10%
0%Italy
(N=137)Slovenia(N=32)
Sweden(N=34)
UK(N=18)
70%80%90%
100%
40%50%60%
20%30%
10%0%
Italy (N=21)
Slovenia(N=8)
Sweden(N=20)
UK(N=10)
TheNetherlands
(N=11)
Italy(N=164)
Slovenia(N=35)
Sweden(N=43)
UK(N=23)
TheNetherlands
(N=34)
Italy(N=164)
Slovenia(N=35)
Sweden(N=43)
UK(N=23)
TheNetherlands
(N=34)
70%80%90%
100%
40%50%60%
20%30%
10%0%
70%80%90%
100%
40%50%60%
20%30%
10%0%
30%
24.9%0.8%
Academic study Judicial evidence
LEA report Media Other
N = 2,380
N = 2,380
N = 2,380
N = 1,305
N = 604
Institutional report
15%
29%
0.4%
Local OCGs Motorcycles gangsItalian mafias
Other OCGs NA
Italy SloveniaThe Netherlands
Sweden UK
Academic study
Judicial evidence LEA report Media
Institutional report
Academic study
LEA report Media
No. criminal charges with references to OCGs % OCGs in relation to all criminal charges
% O
CGs
in re
latio
n to
all
crim
inal
cha
rges
Other
Institutional report
No.
crim
inal
cha
rges
with
refe
renc
es to
OCG
s
Academic study
Judicial evidence LEA report Media
Institutional report
N = 74
23%
24%
20%
32%
1% N = 140
N = 257
N = 70
N = 299
Academic study
LEA report Media Other
Institutional report
No. filed criminal complaints for money laudering offences with references to OCGs
No. filed criminal complaints for money laudering offences without references to OCGs
Academic study
Judicial evidence LEA report Media
Institutional report
Italy SloveniaThe Netherlands
Sweden UK
Italy SloveniaThe Netherlands
Sweden UK
Money laundering FraudFormally legal activities
Concealment of illegal activities Other
Money laundering FraudFormally legal activities
New business NAAlready existing business
Concealment of illegal activities Other
90
53
19
24
9
14
4
30
15
29
21
20% 40% 60% 80% 100%0%
Public limitedcompanies
Private limitedcompanies
Partnerships
Sole traders
Other legal forms
NA
Italy SloveniaThe Netherlands
UKSweden
Public limitedcompanies
Private limitedcompanies
Partnerships
Sole traders
Otherlegal forms
NA
20% 40% 60% 80% 100%0%
Cosa Nostra (N=14) Camorra (N=74)‘Ndrangheta (N=47)
Other Italian (N=13)Chinese (N=16)
Money laundering Fiscal fraudFormally legal activities
Corporate fraud OtherConcealment of illegal activities
Relatives Legal entrepreneursProfessionals
Women among shareholders Women as majority shareholders
Legal companies
53
7
6
14
98
3
1
8
4
1
Small LargeMedium Very large NA
Italy SloveniaThe Netherlands
Sweden UK
0 4-101-3 11-20 >20 NA
Figure 42. Legal forms of infiltrated businesses by type of driver
Source: Transcrime elaboration on DCS data
10.2 Shareholders and directors
The need to conceal criminal activities and identity and to exert direct control over infiltrated businesses may also influence the control strategies adopted by OCGs in terms of shareholders and directors of infiltrated companies.
Table 21 summarises the hypotheses drawn from the literature on the subject. The use of figureheads as company shareholders is a strategy commonly used by OCGs to conceal their criminal activities and hide the identity of the ultimate beneficial owners (which, in fact, are the members of the organisation itself) (Brå, 2011b; FATF, 2006; Schneider, 2004; Transcrime, 2008b, 2013b; van der Does de Willebois et al., 2011). Persons frequently used as figureheads include relatives of OCG members, legal entrepreneurs, and professionals. The use of figureheads is particularly frequent if the members of the OCG have criminal records which prevent them from directly participating in the ownership and management structure of the infiltrated business (Transcrime, 2013b). Legal companies as corporate shareholders may also be used to conceal the beneficial ownership of infiltrated businesses. Legal companies as corporate shareholders may also be used to conceal the beneficial ownership of infiltrated businesses.

94
Table 21. Hypotheses from the literature on shareholders and directors of infiltrated businesses
OC drivers and/or needs Assumptions OC strategy
Concealment of illicit activities and beneficial ownership
Natural persons as figureheads
Relatives among the shareholders
Professionals among the shareholdersLegal entrepreneurs among the shareholdersYoung people among the shareholders/directorsOld/retired people among the shareholders/directorsWomen among the shareholders/directorsPresence of people with low levels of education among the shareholders/directors
Legal persons as shareholders Use of corporate shareholders
Direct control and exposureDirect control on mafia companies; use of ‘family companies’
OC affiliates included as shareholders OC affiliates included as employeesFamily members among the shareholders and/or directors
Source: Transcrime elaboration
Nonetheless, the inclusion of relatives among the company shareholders can be used not only as a means to conceal the criminal activities and identity of OCGs, but also as a strategy to maintain control as direct as possible on the infiltrated business when OCG members cannot do this personally (Transcrime, 2013b). Alternatively, OCGs will include some of their affiliates among the shareholders and the employees of the infiltrated businesses, in order to exert direct control or to achieve visibility and social prestige (Calderoni & Caneppele, 2009; Transcrime, 2008b, 2013b)
OCG members are directly involved as shareholders in 55.5% of all infiltrated businesses analysed in the study, suggesting a certain propensity of OCGs to maintain direct control over infiltrated companies.66 Figure 43 shows the number of infiltrated businesses with OCG members as shareholders in the five countries covered by the project. In almost all the countries, more than half of infiltrated businesses include at least one OCG
figure 1
figure 2
figure 3
figure 10
figure 15
figure 18
figure 19
figure 20
Figure 24
figure 27
figure 31
figure 32
figure 34
figure 35
figure 36
figure 37
figure 39
figure 40
figure 41
figure 42
figure 43
figure 45
figure 46
figure 47
figure 48
figure 49
figure 50
figure 51
9.2%
49.8%
1.3%
17.1%
22.5%
54.8%25.4%
3.1%
5.9%
10.8%
27%
25%
1%
15%
32%
43%
33%
20%
3% 1%
20%
1%3%
5%
70%
100%90%80%70%60%50%40%30%20%10%
0%2002
4
1
3
2
3
1
1
4
15
1
62
2
47
1
139 89 40
2
5 3 39
2003 2004 2005 2006 2007 2008 2009 2010 2011 2012 2013 2014*
21%
15%
1%4%
59%
21
11
8
20
10
164
34
35
43
23
20
25
15
10
5
01 2 3 4 5 6 7 8 9 10 >10
21%
16%
22%
21%
19%
70%80%90%
100%
40%50%60%
20%30%
10%0%
70%80%90%
100%
40%50%60%
20%30%
10%0%
Italy (N=164)
Slovenia(N=35)
Sweden(N=43)
UK(N=23)
TheNetherlands
(N=34)
Italy (N=21)
Slovenia(N=8)
Sweden(N=20)
UK(N=10)
TheNetherlands
(N=11)
Italy Slovenia Sweden UKTheNetherlands
70% 14
5
62
40%
50%
60%
20%
30%
10%
0%
600
500
400
300
200
100
0
0.20%
0.30%
0.10%
0.50%
0.60%
0.70%
0.80%
0.40%
0.00%2002
0.72%
0.51%
0.26%
0.47%0.56%
0.33%
0.44% 0.47%0.39%
0.36%
0.58%0.52%
0.24%
2003 2004 2005 2006 2007 2008 2009 2010 2011 2012 2013 2014*
38
6
10
5
7
70%80%90%
100%
94
25
19
35
2
40%50%60%
20%30%
10%0%
Italy (N=164)
Slovenia(N=35)
Sweden(N=43)
UK(N=23)
TheNetherlands
(N=34)
Public limited companies
Private limited companies
Partnerships
Sole traders
Other legal forms
NA
20% 40% 60% 80% 100%0%
figure 44
70%80%90%
100%
40%50%60% 90
11
22 26
17
20%30%
10%0%
Italy (N=164)
Slovenia(N=35)
Sweden(N=43)
UK(N=23)
TheNetherlands
(N=34)
10
12
6
8
4
2
14
16
0Money
launderingFraud OtherFormally legal
activitiesConcealment
of illegal activities
4 43
5
15
Italy (N=164)
Slovenia(N=35)
Sweden(N=43)
UK(N=23)
TheNetherlands
(N=34)
70%80%90%
100%
40%50%60%
20%30%
10%0%
40%
50%
20%
30%
10%
0%Italy
(N=137)Slovenia(N=32)
Sweden(N=34)
UK(N=18)
70%80%90%
100%
40%50%60%
20%30%
10%0%
Italy (N=21)
Slovenia(N=8)
Sweden(N=20)
UK(N=10)
TheNetherlands
(N=11)
Italy(N=164)
Slovenia(N=35)
Sweden(N=43)
UK(N=23)
TheNetherlands
(N=34)
Italy(N=164)
Slovenia(N=35)
Sweden(N=43)
UK(N=23)
TheNetherlands
(N=34)
70%80%90%
100%
40%50%60%
20%30%
10%0%
70%80%90%
100%
40%50%60%
20%30%
10%0%
30%
24.9%0.8%
Academic study Judicial evidence
LEA report Media Other
N = 2,380
N = 2,380
N = 2,380
N = 1,305
N = 604
Institutional report
15%
29%
0.4%
Local OCGs Motorcycles gangsItalian mafias
Other OCGs NA
Italy SloveniaThe Netherlands
Sweden UK
Academic study
Judicial evidence LEA report Media
Institutional report
Academic study
LEA report Media
No. criminal charges with references to OCGs % OCGs in relation to all criminal charges
% O
CGs
in re
latio
n to
all
crim
inal
cha
rges
Other
Institutional report
No.
crim
inal
cha
rges
with
refe
renc
es to
OCG
s
Academic study
Judicial evidence LEA report Media
Institutional report
N = 74
23%
24%
20%
32%
1% N = 140
N = 257
N = 70
N = 299
Academic study
LEA report Media Other
Institutional report
No. filed criminal complaints for money laudering offences with references to OCGs
No. filed criminal complaints for money laudering offences without references to OCGs
Academic study
Judicial evidence LEA report Media
Institutional report
Italy SloveniaThe Netherlands
Sweden UK
Italy SloveniaThe Netherlands
Sweden UK
Money laundering FraudFormally legal activities
Concealment of illegal activities Other
Money laundering FraudFormally legal activities
New business NAAlready existing business
Concealment of illegal activities Other
90
53
19
24
9
14
4
30
15
29
21
20% 40% 60% 80% 100%0%
Public limitedcompanies
Private limitedcompanies
Partnerships
Sole traders
Other legal forms
NA
Italy SloveniaThe Netherlands
UKSweden
Public limitedcompanies
Private limitedcompanies
Partnerships
Sole traders
Otherlegal forms
NA
20% 40% 60% 80% 100%0%
Cosa Nostra (N=14) Camorra (N=74)‘Ndrangheta (N=47)
Other Italian (N=13)Chinese (N=16)
Money laundering Fiscal fraudFormally legal activities
Corporate fraud OtherConcealment of illegal activities
Relatives Legal entrepreneursProfessionals
Women among shareholders Women as majority shareholders
Legal companies
53
7
6
14
98
3
1
8
4
1
Small LargeMedium Very large NA
Italy SloveniaThe Netherlands
Sweden UK
0 4-101-3 11-20 >20 NA
member among its shareholders. This is particularly the case in the UK, where the percentage of infiltrated businesses with OC members as shareholders reaches a peak of 73.9%. The only exception is represented by the Netherlands, where it seems that OCGs prefer more complex control schemes.
Figure 43. Infiltrated businesses with OCG members involved as shareholders by country
66. OCG members are persons who were directly involved in the illicit activities carried out by the criminal group.
Source: Transcrime elaboration on DCS data
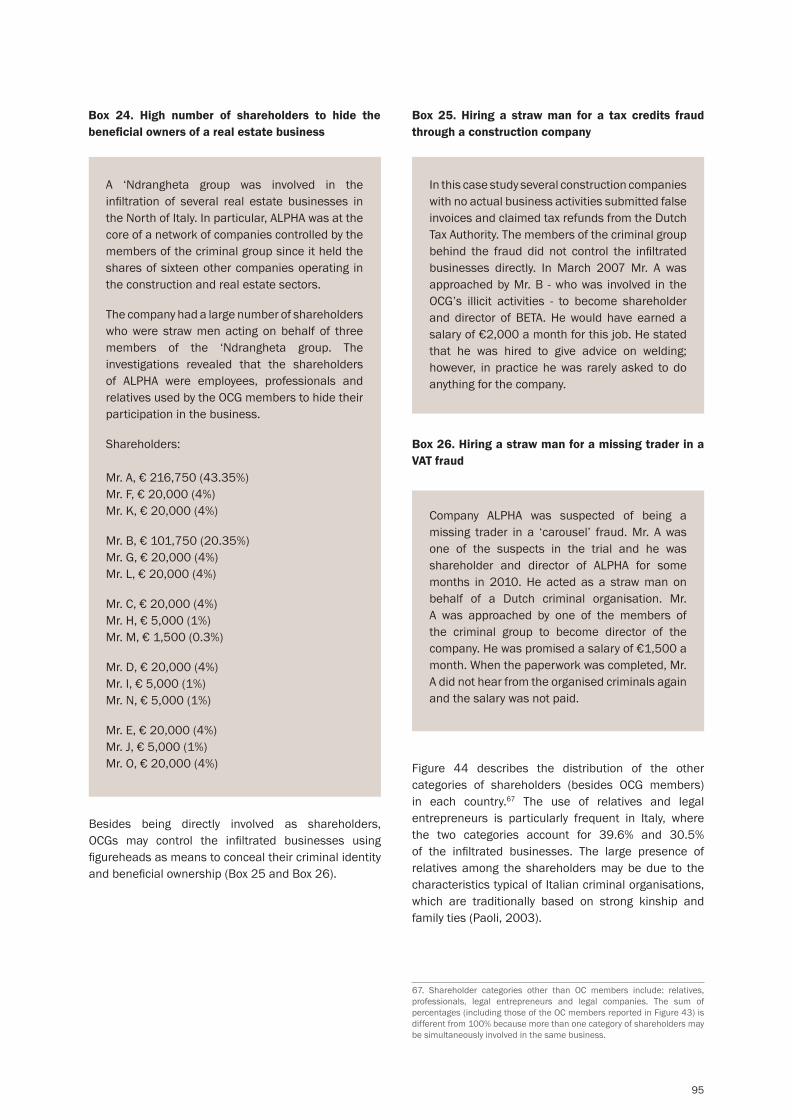
95
Box 24. High number of shareholders to hide the beneficial owners of a real estate business
67. Shareholder categories other than OC members include: relatives, professionals, legal entrepreneurs and legal companies. The sum of percentages (including those of the OC members reported in Figure 43) is different from 100% because more than one category of shareholders may be simultaneously involved in the same business.
A ‘Ndrangheta group was involved in the infiltration of several real estate businesses in the North of Italy. In particular, ALPHA was at the core of a network of companies controlled by the members of the criminal group since it held the shares of sixteen other companies operating in the construction and real estate sectors.
The company had a large number of shareholders who were straw men acting on behalf of three members of the ‘Ndrangheta group. The investigations revealed that the shareholders of ALPHA were employees, professionals and relatives used by the OCG members to hide their participation in the business.
Shareholders:
Mr. A, € 216,750 (43.35%) Mr. F, € 20,000 (4%) Mr. K, € 20,000 (4%)
Mr. B, € 101,750 (20.35%) Mr. G, € 20,000 (4%) Mr. L, € 20,000 (4%)
Mr. C, € 20,000 (4%) Mr. H, € 5,000 (1%) Mr. M, € 1,500 (0.3%)
Mr. D, € 20,000 (4%) Mr. I, € 5,000 (1%) Mr. N, € 5,000 (1%)
Mr. E, € 20,000 (4%) Mr. J, € 5,000 (1%) Mr. O, € 20,000 (4%)
Besides being directly involved as shareholders, OCGs may control the infiltrated businesses using figureheads as means to conceal their criminal identity and beneficial ownership (Box 25 and Box 26).
Box 25. Hiring a straw man for a tax credits fraud through a construction company
In this case study several construction companies with no actual business activities submitted false invoices and claimed tax refunds from the Dutch Tax Authority. The members of the criminal group behind the fraud did not control the infiltrated businesses directly. In March 2007 Mr. A was approached by Mr. B - who was involved in the OCG’s illicit activities - to become shareholder and director of BETA. He would have earned a salary of €2,000 a month for this job. He stated that he was hired to give advice on welding; however, in practice he was rarely asked to do anything for the company.
Box 26. Hiring a straw man for a missing trader in a VAT fraud
Company ALPHA was suspected of being a missing trader in a ‘carousel’ fraud. Mr. A was one of the suspects in the trial and he was shareholder and director of ALPHA for some months in 2010. He acted as a straw man on behalf of a Dutch criminal organisation. Mr. A was approached by one of the members of the criminal group to become director of the company. He was promised a salary of €1,500 a month. When the paperwork was completed, Mr. A did not hear from the organised criminals again and the salary was not paid.
Figure 44 describes the distribution of the other categories of shareholders (besides OCG members) in each country.67 The use of relatives and legal entrepreneurs is particularly frequent in Italy, where the two categories account for 39.6% and 30.5% of the infiltrated businesses. The large presence of relatives among the shareholders may be due to the characteristics typical of Italian criminal organisations, which are traditionally based on strong kinship and family ties (Paoli, 2003).
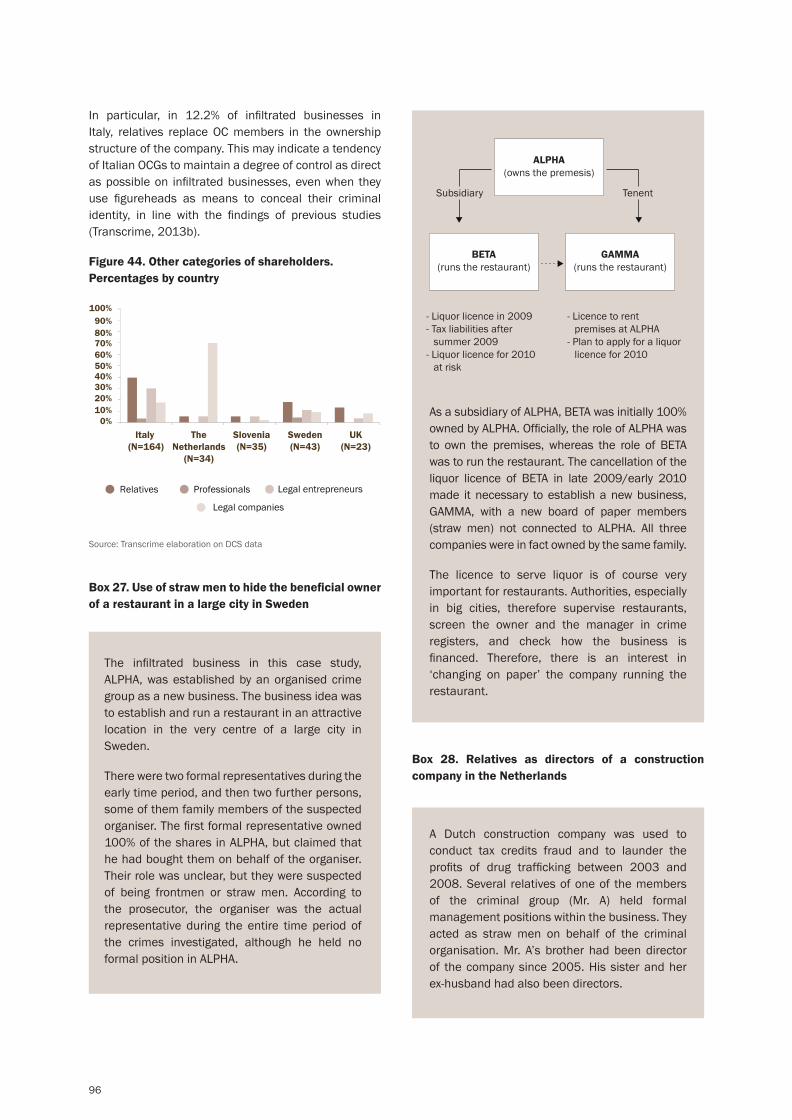
96
In particular, in 12.2% of infiltrated businesses in Italy, relatives replace OC members in the ownership structure of the company. This may indicate a tendency of Italian OCGs to maintain a degree of control as direct as possible on infiltrated businesses, even when they use figureheads as means to conceal their criminal identity, in line with the findings of previous studies (Transcrime, 2013b).
Figure 44. Other categories of shareholders. Percentages by country
Source: Transcrime elaboration on DCS data
figure 1
figure 2
figure 3
figure 10
figure 15
figure 18
figure 19
figure 20
Figure 24
figure 27
figure 31
figure 32
figure 34
figure 35
figure 36
figure 37
figure 39
figure 40
figure 41
figure 42
figure 43
figure 45
figure 46
figure 47
figure 48
figure 49
figure 50
figure 51
9.2%
49.8%
1.3%
17.1%
22.5%
54.8%25.4%
3.1%
5.9%
10.8%
27%
25%
1%
15%
32%
43%
33%
20%
3% 1%
20%
1%3%
5%
70%
100%90%80%70%60%50%40%30%20%10%
0%2002
4
1
3
2
3
1
1
4
15
1
62
2
47
1
139 89 40
2
5 3 39
2003 2004 2005 2006 2007 2008 2009 2010 2011 2012 2013 2014*
21%
15%
1%4%
59%
21
11
8
20
10
164
34
35
43
23
20
25
15
10
5
01 2 3 4 5 6 7 8 9 10 >10
21%
16%
22%
21%
19%
70%80%90%
100%
40%50%60%
20%30%
10%0%
70%80%90%
100%
40%50%60%
20%30%
10%0%
Italy (N=164)
Slovenia(N=35)
Sweden(N=43)
UK(N=23)
TheNetherlands
(N=34)
Italy (N=21)
Slovenia(N=8)
Sweden(N=20)
UK(N=10)
TheNetherlands
(N=11)
Italy Slovenia Sweden UKTheNetherlands
70% 14
5
62
40%
50%
60%
20%
30%
10%
0%
600
500
400
300
200
100
0
0.20%
0.30%
0.10%
0.50%
0.60%
0.70%
0.80%
0.40%
0.00%2002
0.72%
0.51%
0.26%
0.47%0.56%
0.33%
0.44% 0.47%0.39%
0.36%
0.58%0.52%
0.24%
2003 2004 2005 2006 2007 2008 2009 2010 2011 2012 2013 2014*
38
6
10
5
7
70%80%90%
100%
94
25
19
35
2
40%50%60%
20%30%
10%0%
Italy (N=164)
Slovenia(N=35)
Sweden(N=43)
UK(N=23)
TheNetherlands
(N=34)
Public limited companies
Private limited companies
Partnerships
Sole traders
Other legal forms
NA
20% 40% 60% 80% 100%0%
figure 44
70%80%90%
100%
40%50%60% 90
11
22 26
17
20%30%
10%0%
Italy (N=164)
Slovenia(N=35)
Sweden(N=43)
UK(N=23)
TheNetherlands
(N=34)
10
12
6
8
4
2
14
16
0Money
launderingFraud OtherFormally legal
activitiesConcealment
of illegal activities
4 43
5
15
Italy (N=164)
Slovenia(N=35)
Sweden(N=43)
UK(N=23)
TheNetherlands
(N=34)
70%80%90%
100%
40%50%60%
20%30%
10%0%
40%
50%
20%
30%
10%
0%Italy
(N=137)Slovenia(N=32)
Sweden(N=34)
UK(N=18)
70%80%90%
100%
40%50%60%
20%30%
10%0%
Italy (N=21)
Slovenia(N=8)
Sweden(N=20)
UK(N=10)
TheNetherlands
(N=11)
Italy(N=164)
Slovenia(N=35)
Sweden(N=43)
UK(N=23)
TheNetherlands
(N=34)
Italy(N=164)
Slovenia(N=35)
Sweden(N=43)
UK(N=23)
TheNetherlands
(N=34)
70%80%90%
100%
40%50%60%
20%30%
10%0%
70%80%90%
100%
40%50%60%
20%30%
10%0%
30%
24.9%0.8%
Academic study Judicial evidence
LEA report Media Other
N = 2,380
N = 2,380
N = 2,380
N = 1,305
N = 604
Institutional report
15%
29%
0.4%
Local OCGs Motorcycles gangsItalian mafias
Other OCGs NA
Italy SloveniaThe Netherlands
Sweden UK
Academic study
Judicial evidence LEA report Media
Institutional report
Academic study
LEA report Media
No. criminal charges with references to OCGs % OCGs in relation to all criminal charges
% O
CGs
in re
latio
n to
all
crim
inal
cha
rges
Other
Institutional report
No.
crim
inal
cha
rges
with
refe
renc
es to
OCG
s
Academic study
Judicial evidence LEA report Media
Institutional report
N = 74
23%
24%
20%
32%
1% N = 140
N = 257
N = 70
N = 299
Academic study
LEA report Media Other
Institutional report
No. filed criminal complaints for money laudering offences with references to OCGs
No. filed criminal complaints for money laudering offences without references to OCGs
Academic study
Judicial evidence LEA report Media
Institutional report
Italy SloveniaThe Netherlands
Sweden UK
Italy SloveniaThe Netherlands
Sweden UK
Money laundering FraudFormally legal activities
Concealment of illegal activities Other
Money laundering FraudFormally legal activities
New business NAAlready existing business
Concealment of illegal activities Other
90
53
19
24
9
14
4
30
15
29
21
20% 40% 60% 80% 100%0%
Public limitedcompanies
Private limitedcompanies
Partnerships
Sole traders
Other legal forms
NA
Italy SloveniaThe Netherlands
UKSweden
Public limitedcompanies
Private limitedcompanies
Partnerships
Sole traders
Otherlegal forms
NA
20% 40% 60% 80% 100%0%
Cosa Nostra (N=14) Camorra (N=74)‘Ndrangheta (N=47)
Other Italian (N=13)Chinese (N=16)
Money laundering Fiscal fraudFormally legal activities
Corporate fraud OtherConcealment of illegal activities
Relatives Legal entrepreneursProfessionals
Women among shareholders Women as majority shareholders
Legal companies
53
7
6
14
98
3
1
8
4
1
Small LargeMedium Very large NA
Italy SloveniaThe Netherlands
Sweden UK
0 4-101-3 11-20 >20 NA
Box 27. Use of straw men to hide the beneficial owner of a restaurant in a large city in Sweden
The infiltrated business in this case study, ALPHA, was established by an organised crime group as a new business. The business idea was to establish and run a restaurant in an attractive location in the very centre of a large city in Sweden.
There were two formal representatives during the early time period, and then two further persons, some of them family members of the suspected organiser. The first formal representative owned 100% of the shares in ALPHA, but claimed that he had bought them on behalf of the organiser. Their role was unclear, but they were suspected of being frontmen or straw men. According to the prosecutor, the organiser was the actual representative during the entire time period of the crimes investigated, although he held no formal position in ALPHA.
As a subsidiary of ALPHA, BETA was initially 100% owned by ALPHA. Officially, the role of ALPHA was to own the premises, whereas the role of BETA was to run the restaurant. The cancellation of the liquor licence of BETA in late 2009/early 2010 made it necessary to establish a new business, GAMMA, with a new board of paper members (straw men) not connected to ALPHA. All three companies were in fact owned by the same family.
The licence to serve liquor is of course very important for restaurants. Authorities, especially in big cities, therefore supervise restaurants, screen the owner and the manager in crime registers, and check how the business is financed. Therefore, there is an interest in ‘changing on paper’ the company running the restaurant.
ALPHA(owns the premesis)
BETA(runs the restaurant)
- Liquor licence in 2009- Tax liabilities after
summer 2009- Liquor licence for 2010
at risk
- Licence to rent premises at ALPHA
- Plan to apply for a liquor licence for 2010
GAMMA(runs the restaurant)
TenentSubsidiary
Box 28. Relatives as directors of a construction company in the Netherlands
A Dutch construction company was used to conduct tax credits fraud and to launder the profits of drug trafficking between 2003 and 2008. Several relatives of one of the members of the criminal group (Mr. A) held formal management positions within the business. They acted as straw men on behalf of the criminal organisation. Mr. A’s brother had been director of the company since 2005. His sister and her ex-husband had also been directors.

97
Box 29. A legal entrepreneur involved a shareholder in a fraudulent business
ALPHA, a business whose activities involved the trade of cars and trucks, was suspected of not having paid sales taxes for over two years and having thus been involved in VAT fraud. Besides the members of a Dutch criminal group, Mr. A, the legal entrepreneur who owned the company, was involved in the illicit activities. Mr. A was approached by a member of the OCG who asked to use the company’s VAT number. Mr. A agreed, and his signature was falsified to conclude sale agreements to buy cars and trucks. The legal entrepreneur in turn received money from the OCG member.
Box 30. Suspected cooperation between legal entrepreneurs and criminals in a VAT fraud
This case study involves several companies active in the wholesale of information and communication equipment, in particular mobile phones. The legal businesses were part of a ‘carousel’ fraud in which Belgian and Swiss companies acted as missing traders and the Dutch infiltrated businesses never paid turnover taxes to the Tax Authority. ALPHA was founded in 2000 by Mr. A, a legal entrepreneur, who was also shareholder and director of the company.
Mr. A declared that an OCG member came to him with the idea of setting up a trade in mobile phones. The OCG member also told him that he had contacts with mobile phone dealers and clients, and that he needed an investor. The entrepreneur agreed to become involved in the business because of the economic profit that he could earn. The OCG member became informally involved in the company, and the company was used for a carousel fraud.
Mr. A claimed that he was unaware that his company was being used for a fraud. However, various activities were notified to him by the members of the criminal group. The Dutch law enforcement agencies thus suspected that he actively participated and was willing to contribute to the illicit activities.
Legal (shell) companies as shareholders are widely used in the Netherlands, where they account for 70.6% of the country episodes (Figure 44). This result is in line with the main driver behind the infiltration of legitimate businesses in that country. Indeed, the creation of large networks of companies interconnected with each other may be instrumental to the commission of complex fraudulent schemes, such as VAT and tax frauds, which indeed represent a significant portion of the results of OCG infiltration in the Netherlands. In regard to professionals, their involvement as shareholders is rare and records a limited number of episodes only in Italy – where the involvement of politicians was also found – and Sweden, in line with previous findings (see Transcrime, 2013b). Due to the lack of information, it was not possible to investigate the presence of politically exposed persons (PEP) as shareholders, whose involvement has been documented in cases of money laundering (Brun, Gray, Scott, & Stephenson, 2011; van der Does de Willebois et al., 2011).
Box 31. Involvement of politicians
A ‘Ndrangheta group was involved in the infiltration of ALPHA, a company that controlled several supermarkets in the region of Reggio Calabria. The mafia group already controlled other businesses active in the production of food products. Through infiltration of ALPHA, the members of the criminal organisation were able to impose their companies as suppliers of food products to the supermarkets owned by ALPHA.
The infiltration was facilitated by Mr. A, who was a member of the city council of Reggio Calabria and the beneficial owner of ALPHA. He entered into contracts with a number of mafia companies for the supply of goods to the supermarkets owned by ALPHA. In return, he received support for his candidacy in the local elections.
A certain literature (Caneppele, Calderoni, & Martocchia, 2009; Transcrime, 2008a, 2008b, 2008c) has suggested that a possible signal of the use of figureheads is the presence of very young (age ≤ 25 years old) or very old people (age ≥ 65 years old) among the shareholders and/or directors of infiltrated businesses (see Table 21).

98
For three out of the five countries analysed by this project it was not possible to test this hypothesis due to the paucity of information on the ages of the owners and directors of infiltrated businesses.68 Italy and the United Kingdom were the only two countries for which a significant amount of information was available.
In Italy, 101 out of 164 infiltrated businesses had information on the age of at least one of the shareholders. Of these 101 businesses, 16 (or 16%) had young people among their shareholders; but in only 1 case did the young shareholder also have the majority of shares. In 7 businesses out of 101 (or 7%), old people were included among the shareholders; but in none of these cases was the old shareholder also the majority one. In regard to the age of directors, information was available for 53 out of 164 businesses.Of these 53 businesses, 3 (or 6%) had young people among their directors; while only 1 business had very old directors.
In the United Kingdom, 18 out of 23 infiltrated businesses had information on the age of at least one of the shareholders. Of these 18 businesses, 5 (or 28%) had young people among their shareholders; and in all cases the young shareholders were also the majority ones. Instead, only 1 business with an old person among its shareholders was found; but the old shareholder did not have the majority of shares. In regard to the age of directors, information was available for all the 23 infiltrated businesses. In 8 of these 23 businesses (or 34.8%), young people were included among the directors; while no businesses with old directors were found. In this case, the presence of young shareholders may also be due to the larger involvement of young people in the British economy than in other European countries.
The age of the owners and directors of a certain company should be evaluated in conjunction with other risk factors, and it cannot be considered a single marker of OC infiltration into legitimate businesses. A similar consideration also applies to the gender of shareholders and directors. In some countries or regions, where female unemployment is high and women rarely occupy top management positions within companies, the presence of female shareholders or directors may represent a red flag of infiltration. Nonetheless, it cannot be considered a single marker of infiltration by OCGs into legitimate businesses (Caneppele et al., 2009).
Figure 45 shows the number of infiltrated businesses with women among shareholders and with women as majority shareholders.69 In the case of the Netherlands it was possible to determine the gender of company shareholders for 11 out of the 34 infiltrated businesses; but in none of these 11 cases was there a woman among the shareholders. For this reason, it was excluded from the analysis. In Sweden, 8 out of 34 businesses had women included in the ownership structure.70 Nonetheless, the information on the amount of shares hold by each member was scarce (Figure 45). For the remaining three countries (i.e. Italy, Slovenia and United Kingdom) some more information was available and is discussed below.
Figure 45. Infiltrated businesses with women among shareholders and with women as majority shareholders by country
68. In particular, in the case of Sweden and Slovenia, there was no information available on the age of shareholders and directors. In regard to the Netherlands, information on the dates of birth of shareholders was available for 1 business out of 34, while 3 episodes had information on the dates of birth of directors.
69. Episodes with no information on the gender of the shareholders were excluded from the total and, therefore, from the calculation of the percentages.
70. 34 is the total number of Swedish businesses for which it was possible to establish the gender of the shareholders.
71. As in the case of shareholders, the percentage of infiltrated businesses with women among the directors was calculated on the total number of episodes for which information on the gender of directors was available. In the case of Slovenia, this number corresponds to 22 out of 35 infiltrated businesses.
figure 1
figure 2
figure 3
figure 10
figure 15
figure 18
figure 19
figure 20
Figure 24
figure 27
figure 31
figure 32
figure 34
figure 35
figure 36
figure 37
figure 39
figure 40
figure 41
figure 42
figure 43
figure 45
figure 46
figure 47
figure 48
figure 49
figure 50
figure 51
9.2%
49.8%
1.3%
17.1%
22.5%
54.8%25.4%
3.1%
5.9%
10.8%
27%
25%
1%
15%
32%
43%
33%
20%
3% 1%
20%
1%3%
5%
70%
100%90%80%70%60%50%40%30%20%10%
0%2002
4
1
3
2
3
1
1
4
15
1
62
2
47
1
139 89 40
2
5 3 39
2003 2004 2005 2006 2007 2008 2009 2010 2011 2012 2013 2014*
21%
15%
1%4%
59%
21
11
8
20
10
164
34
35
43
23
20
25
15
10
5
01 2 3 4 5 6 7 8 9 10 >10
21%
16%
22%
21%
19%
70%80%90%
100%
40%50%60%
20%30%
10%0%
70%80%90%
100%
40%50%60%
20%30%
10%0%
Italy (N=164)
Slovenia(N=35)
Sweden(N=43)
UK(N=23)
TheNetherlands
(N=34)
Italy (N=21)
Slovenia(N=8)
Sweden(N=20)
UK(N=10)
TheNetherlands
(N=11)
Italy Slovenia Sweden UKTheNetherlands
70% 14
5
62
40%
50%
60%
20%
30%
10%
0%
600
500
400
300
200
100
0
0.20%
0.30%
0.10%
0.50%
0.60%
0.70%
0.80%
0.40%
0.00%2002
0.72%
0.51%
0.26%
0.47%0.56%
0.33%
0.44% 0.47%0.39%
0.36%
0.58%0.52%
0.24%
2003 2004 2005 2006 2007 2008 2009 2010 2011 2012 2013 2014*
38
6
10
5
7
70%80%90%
100%
94
25
19
35
2
40%50%60%
20%30%
10%0%
Italy (N=164)
Slovenia(N=35)
Sweden(N=43)
UK(N=23)
TheNetherlands
(N=34)
Public limited companies
Private limited companies
Partnerships
Sole traders
Other legal forms
NA
20% 40% 60% 80% 100%0%
figure 44
70%80%90%
100%
40%50%60% 90
11
22 26
17
20%30%
10%0%
Italy (N=164)
Slovenia(N=35)
Sweden(N=43)
UK(N=23)
TheNetherlands
(N=34)
10
12
6
8
4
2
14
16
0Money
launderingFraud OtherFormally legal
activitiesConcealment
of illegal activities
4 43
5
15
Italy (N=164)
Slovenia(N=35)
Sweden(N=43)
UK(N=23)
TheNetherlands
(N=34)
70%80%90%
100%
40%50%60%
20%30%
10%0%
40%
50%
20%
30%
10%
0%Italy
(N=137)Slovenia(N=32)
Sweden(N=34)
UK(N=18)
70%80%90%
100%
40%50%60%
20%30%
10%0%
Italy (N=21)
Slovenia(N=8)
Sweden(N=20)
UK(N=10)
TheNetherlands
(N=11)
Italy(N=164)
Slovenia(N=35)
Sweden(N=43)
UK(N=23)
TheNetherlands
(N=34)
Italy(N=164)
Slovenia(N=35)
Sweden(N=43)
UK(N=23)
TheNetherlands
(N=34)
70%80%90%
100%
40%50%60%
20%30%
10%0%
70%80%90%
100%
40%50%60%
20%30%
10%0%
30%
24.9%0.8%
Academic study Judicial evidence
LEA report Media Other
N = 2,380
N = 2,380
N = 2,380
N = 1,305
N = 604
Institutional report
15%
29%
0.4%
Local OCGs Motorcycles gangsItalian mafias
Other OCGs NA
Italy SloveniaThe Netherlands
Sweden UK
Academic study
Judicial evidence LEA report Media
Institutional report
Academic study
LEA report Media
No. criminal charges with references to OCGs % OCGs in relation to all criminal charges
% O
CGs
in re
latio
n to
all
crim
inal
cha
rges
Other
Institutional report
No.
crim
inal
cha
rges
with
refe
renc
es to
OCG
s
Academic study
Judicial evidence LEA report Media
Institutional report
N = 74
23%
24%
20%
32%
1% N = 140
N = 257
N = 70
N = 299
Academic study
LEA report Media Other
Institutional report
No. filed criminal complaints for money laudering offences with references to OCGs
No. filed criminal complaints for money laudering offences without references to OCGs
Academic study
Judicial evidence LEA report Media
Institutional report
Italy SloveniaThe Netherlands
Sweden UK
Italy SloveniaThe Netherlands
Sweden UK
Money laundering FraudFormally legal activities
Concealment of illegal activities Other
Money laundering FraudFormally legal activities
New business NAAlready existing business
Concealment of illegal activities Other
90
53
19
24
9
14
4
30
15
29
21
20% 40% 60% 80% 100%0%
Public limitedcompanies
Private limitedcompanies
Partnerships
Sole traders
Other legal forms
NA
Italy SloveniaThe Netherlands
UKSweden
Public limitedcompanies
Private limitedcompanies
Partnerships
Sole traders
Otherlegal forms
NA
20% 40% 60% 80% 100%0%
Cosa Nostra (N=14) Camorra (N=74)‘Ndrangheta (N=47)
Other Italian (N=13)Chinese (N=16)
Money laundering Fiscal fraudFormally legal activities
Corporate fraud OtherConcealment of illegal activities
Relatives Legal entrepreneursProfessionals
Women among shareholders Women as majority shareholders
Legal companies
53
7
6
14
98
3
1
8
4
1
Small LargeMedium Very large NA
Italy SloveniaThe Netherlands
Sweden UK
0 4-101-3 11-20 >20 NA
Source: Transcrime elaboration on DCS data
Women are frequently included among the shareholders of infiltrated businesses in Italy (38.7%) and Slovenia (28.1%); but only in the latter country do they have the majority of shares within the companies. In the case of Slovenia, a large percentage of infiltrated businesses (i.e. 50%) also have women among their directors.71 These results are in line with the characteristics typical of that country in terms of infiltrated sectors and associated criminal activities. Bars and night clubs are among the economic sectors most widely infiltrated in Slovenia, and they are frequently used as covers for illegal activities such as forced prostitution and human trafficking. It is possible that the same women who participate in the illegal activities are also included in the ownership and management structure of infiltrated businesses, so as to make it more difficult for law enforcement agencies to identify the boundaries between the two activities (legal and illegal). Some Slovenian case studies are in line with this hypothesis.

99
Box 32. Organised crime group’s members as employees
Since 1998 freight transport had been developed in Italy by ALPHA. The company managed the pick-up of packages through limited companies and cooperatives. A criminal group infiltrated three cooperatives operating in the province of Milan. The infiltrated companies were owned by straw men acting on behalf of the criminal organisation. The members of the criminal group were instead employed as drivers by the freight transport companies. This enabled them to have a formal role in the businesses and to control everyday activities without arousing the suspicions of the authorities.
Box 33. Organised crime group’s members as low- and high-level employees
A ‘Ndrangheta group infiltrated a company involved in telemarketing, teleselling, and call centre activities in the North of Italy. Once the infiltration process had been completed, the criminal group drained money from the company using various strategies. One of them entailed the imposition of mafia members as employees. Such collaborators were placed in both low and high positions. For instance, Mr. A, who had no criminal record, was employed as managing director and managed the business according to the instructions of the mafia boss. Other members of the ‘Ndrangheta were instead hired as unskilled workers for low-level positions.
Table 22. Hypotheses from the literature on other forms of control of infiltrated businesses
OC drivers and/or needs Assumptions OC strategy
Concealment of illicit activities and beneficial ownership
Use of complex corporate ownership schemes
Pyramidal structures
Frequent transformations (e.g. registered address, name, business sector), transfers of business lines or business branches, dissolution of a company and transfer of its business activities to a newly incorporated company
Foreign countries with low transparency requirements
Tax havensUse of multi-jurisdictional structures
Direct control and exposure
Direct control on mafia companies Small or medium-sized companies
Source: Transcrime elaboration
10.3. Other forms of control
Besides the choice of certain types of legal forms and the use of particular categories of shareholders, OCGs may resort to other strategies of control over infiltrated businesses in order to make it more difficult for law enforcement agencies to identify their criminal identity and beneficial ownership. The main hypotheses elaborated by the literature are summarised in Table 22 and are discussed below. One strategy commonly used by OCGs is the creation of complex corporate ownership schemes (FATF, 2006; Schneider, 2004;
Suendorf, 2001; Transcrime, 2008a, 2008b, 2013b). In particular, the literature distinguishes between static and dynamic schemes. The former involve the creation of large networks of companies interconnected by cross-shareholdings (so-called ‘Chinese boxes’). The latter are more dynamic strategies which include: frequent transformations of company details (e.g., registered address, name), transfers of business lines or business branches, dissolution of a company and transfer of its activities to a newly incorporated one (Transcrime, 2013b).

100
Figure 46 sets out, for each of the five EU MS, the number of case studies with evidence of cross-shareholding. Large networks of companies are frequently used in the Netherlands, where 7 out of the 11 selected case studies (or 64%) register episodes of cross-shareholding among multiple businesses. One of these case studies is presented in detail in Box 34. Groups of interconnected companies are also used in Italy (6 out of 21 case studies, or 28.6%) and the United Kingdom (4 out of 10 case studies, or 40.0%).
Figure 46. Case studies with evidence of cross-shareholding among different businesses by country
figure 1
figure 2
figure 3
figure 10
figure 15
figure 18
figure 19
figure 20
Figure 24
figure 27
figure 31
figure 32
figure 34
figure 35
figure 36
figure 37
figure 39
figure 40
figure 41
figure 42
figure 43
figure 45
figure 46
figure 47
figure 48
figure 49
figure 50
figure 51
9.2%
49.8%
1.3%
17.1%
22.5%
54.8%25.4%
3.1%
5.9%
10.8%
27%
25%
1%
15%
32%
43%
33%
20%
3% 1%
20%
1%3%
5%
70%
100%90%80%70%60%50%40%30%20%10%
0%2002
4
1
3
2
3
1
1
4
15
1
62
2
47
1
139 89 40
2
5 3 39
2003 2004 2005 2006 2007 2008 2009 2010 2011 2012 2013 2014*
21%
15%
1%4%
59%
21
11
8
20
10
164
34
35
43
23
20
25
15
10
5
01 2 3 4 5 6 7 8 9 10 >10
21%
16%
22%
21%
19%
70%80%90%
100%
40%50%60%
20%30%
10%0%
70%80%90%
100%
40%50%60%
20%30%
10%0%
Italy (N=164)
Slovenia(N=35)
Sweden(N=43)
UK(N=23)
TheNetherlands
(N=34)
Italy (N=21)
Slovenia(N=8)
Sweden(N=20)
UK(N=10)
TheNetherlands
(N=11)
Italy Slovenia Sweden UKTheNetherlands
70% 14
5
62
40%
50%
60%
20%
30%
10%
0%
600
500
400
300
200
100
0
0.20%
0.30%
0.10%
0.50%
0.60%
0.70%
0.80%
0.40%
0.00%2002
0.72%
0.51%
0.26%
0.47%0.56%
0.33%
0.44% 0.47%0.39%
0.36%
0.58%0.52%
0.24%
2003 2004 2005 2006 2007 2008 2009 2010 2011 2012 2013 2014*
38
6
10
5
7
70%80%90%
100%
94
25
19
35
2
40%50%60%
20%30%
10%0%
Italy (N=164)
Slovenia(N=35)
Sweden(N=43)
UK(N=23)
TheNetherlands
(N=34)
Public limited companies
Private limited companies
Partnerships
Sole traders
Other legal forms
NA
20% 40% 60% 80% 100%0%
figure 44
70%80%90%
100%
40%50%60% 90
11
22 26
17
20%30%
10%0%
Italy (N=164)
Slovenia(N=35)
Sweden(N=43)
UK(N=23)
TheNetherlands
(N=34)
10
12
6
8
4
2
14
16
0Money
launderingFraud OtherFormally legal
activitiesConcealment
of illegal activities
4 43
5
15
Italy (N=164)
Slovenia(N=35)
Sweden(N=43)
UK(N=23)
TheNetherlands
(N=34)
70%80%90%
100%
40%50%60%
20%30%
10%0%
40%
50%
20%
30%
10%
0%Italy
(N=137)Slovenia(N=32)
Sweden(N=34)
UK(N=18)
70%80%90%
100%
40%50%60%
20%30%
10%0%
Italy (N=21)
Slovenia(N=8)
Sweden(N=20)
UK(N=10)
TheNetherlands
(N=11)
Italy(N=164)
Slovenia(N=35)
Sweden(N=43)
UK(N=23)
TheNetherlands
(N=34)
Italy(N=164)
Slovenia(N=35)
Sweden(N=43)
UK(N=23)
TheNetherlands
(N=34)
70%80%90%
100%
40%50%60%
20%30%
10%0%
70%80%90%
100%
40%50%60%
20%30%
10%0%
30%
24.9%0.8%
Academic study Judicial evidence
LEA report Media Other
N = 2,380
N = 2,380
N = 2,380
N = 1,305
N = 604
Institutional report
15%
29%
0.4%
Local OCGs Motorcycles gangsItalian mafias
Other OCGs NA
Italy SloveniaThe Netherlands
Sweden UK
Academic study
Judicial evidence LEA report Media
Institutional report
Academic study
LEA report Media
No. criminal charges with references to OCGs % OCGs in relation to all criminal charges
% O
CGs
in re
latio
n to
all
crim
inal
cha
rges
Other
Institutional report
No.
crim
inal
cha
rges
with
refe
renc
es to
OCG
s
Academic study
Judicial evidence LEA report Media
Institutional report
N = 74
23%
24%
20%
32%
1% N = 140
N = 257
N = 70
N = 299
Academic study
LEA report Media Other
Institutional report
No. filed criminal complaints for money laudering offences with references to OCGs
No. filed criminal complaints for money laudering offences without references to OCGs
Academic study
Judicial evidence LEA report Media
Institutional report
Italy SloveniaThe Netherlands
Sweden UK
Italy SloveniaThe Netherlands
Sweden UK
Money laundering FraudFormally legal activities
Concealment of illegal activities Other
Money laundering FraudFormally legal activities
New business NAAlready existing business
Concealment of illegal activities Other
90
53
19
24
9
14
4
30
15
29
21
20% 40% 60% 80% 100%0%
Public limitedcompanies
Private limitedcompanies
Partnerships
Sole traders
Other legal forms
NA
Italy SloveniaThe Netherlands
UKSweden
Public limitedcompanies
Private limitedcompanies
Partnerships
Sole traders
Otherlegal forms
NA
20% 40% 60% 80% 100%0%
Cosa Nostra (N=14) Camorra (N=74)‘Ndrangheta (N=47)
Other Italian (N=13)Chinese (N=16)
Money laundering Fiscal fraudFormally legal activities
Corporate fraud OtherConcealment of illegal activities
Relatives Legal entrepreneursProfessionals
Women among shareholders Women as majority shareholders
Legal companies
53
7
6
14
98
3
1
8
4
1
Small LargeMedium Very large NA
Italy SloveniaThe Netherlands
Sweden UK
0 4-101-3 11-20 >20 NA
Source: Transcrime elaboration on DCS data
Box 34. Use of complex corporate ownership schemes and frequent change of shareholders
An intricate web of holdings and companies was used in the Netherlands to commit tax credits fraud. To hide the beneficial owner of the businesses, the criminal group used a complex network of shell companies with frequent changes of shareholders and directors, also for a short time. For instance, ALPHA was registered as shareholder of GAMMA for a month between 2006 and 2007. Similarly, BETA was registered as director between 2006 and 2007.
ALPHA BETA
DELTA EPSILON ZETA ETA
IOTA EPSILON ZETA MU NU
THETA
GAMMA
Some case studies were characterised by businesses involved in frequent transformations of registered address, name and shareholders, as well as transfers of business lines or business branches. Box 35 describes a case of dissolution of a company and transfer of its activities to a newly incorporated one in order to avoid bankruptcy.
Box 35. Creation of new companies to avoid bankruptcy
A ‘Ndrangheta group infiltrated a company involved in telemarketing, teleselling, and call centre activities in the North of Italy (ALPHA) and extracted money from it by imposing mafia collaborators as workers and contracts for services with other businesses controlled by the criminal organisation. As a consequence, the company was short of cash and was no longer able to pay its suppliers and employees. In 2011, ALPHA was split into two new companies to avoid bankruptcy. Despite the creation of the new companies, the ‘Ndrangheta group did not change its behaviour and replicated the same control and management strategies in the new businesses.
Another common control strategy consists in the creation of multi-jurisdictional structures with companies based in foreign countries, and particularly in countries with low transparency requirements and off-shore jurisdictions (FATF, 2006; Schneider, 2004; Transcrime, 2013b; van der Does de Willebois et al., 2011). An example of these structures is described in Box 36. Similarly to Chinese-boxes, the use of multi-jurisdictional structures allows OCGs to disguise their criminal activities and makes it more difficult for law enforcement agencies to trace the identity of the ultimate beneficial owners. Moreover, the apparently legitimate flows between these companies can be used to launder criminal money or to perpetrate complex fraudulent schemes (FATF, 2006). These indications are confirmed by the results of the analysis of the case studies. Indeed, in the episodes for which evidence of the use of off-shore and/or anonymous bank accounts was found, legitimate businesses are mainly infiltrated for the purpose of committing frauds (80.3%), laundering criminal money (12.1%) and concealing illegal activities (12.1%). The other drivers of OC infiltration (i.e. formally legal activities and other reasons) were found in only one case.72
72. The total number of episodes with evidence of the use of off-shore and/or anonymous bank accounts is equal to 66. The sum of the percentages is different from 100% because more than one driver could be involved in the same episode.

101
The prevalence of frauds over the other types of drivers is probably due to the fact that half of the episodes with evidence of the use of off-shore and/or anonymous bank accounts pertain to the Netherlands, where the perpetration of complex fraudulent schemes is the main driver behind the infiltration of OCGs into legitimate businesses.
Box 36. Use of companies based in multiple jurisdictions to hide the beneficial ownership
A criminal investigation conducted by the Italian police uncovered the activities of a criminal organisation involved in money laundering operations at international level. With the complicity of relatives, professionals and other accomplices, Mr. A established a series of companies used to carry out fictitious transactions for the purchase and sale of real estate properties. The real estate properties subject to the transactions were ultimately owned by Mr. A. The aim of the transactions was twofold: to conceal the true ownership of the properties, and to launder the profits of illicit activities.
Mr. A used various companies to conceal the beneficial ownership of real estate properties acquired with dirty money. Some of these companies were based in foreign countries (e.g., Spain, Brazil) to conceal the illegal origin and true ownership of those assets. The offshore registration of the infiltration companies was, in fact, one of the strategies used by Mr. A to make it more difficult for law enforcement authorities to determine that he was the real beneficial owner of all the companies and assets involved in the fictitious transactions.
A final control strategy used by OCGs involves characteristics of the company profile, such as size or age. The literature on OC infiltration into legitimate businesses has frequently suggested that companies of small or medium size (in terms, for example, of personnel or equipment) are at greater risk of being infiltrated by OCGs because they are easier to control and manage (Albanese, 1987; Blum et al., 1999; Suendorf, 2001; Transcrime, 2013b). Similarly, OCGs may sometimes decide to set up new companies instead of infiltrating already-existing ones in order to avoid law enforcement controls. This is, for example, the case of infiltration in public procurement, where new companies can be used to obtain public contracts because they are
usually supposed to be “clean” (Caneppele et al., 2009, p. 164). Of course, these characteristics, if considered on their own, cannot be regarded as certain markers of criminal infiltration. Nonetheless, if combined with other risk factors, they can be useful in order to identify suspicious and vulnerable companies.
Figure 47. Size of infiltrated businesses. Percentages by country and size category
Source: Transcrime elaboration on DCS data
The analysis of the case studies selected for this project largely confirms the hypotheses formulated by the literature. As Figure 47 shows, the vast majority of infiltrated businesses in all the five countries are small and medium-sized companies. Instead, only a small number of large or very large businesses is recorded. Similarly, in almost all the countries, the majority of infiltrated businesses are of newly-incorporated companies or young companies (from 1 to 3 years). The sole exception is represented by the Netherlands, where the majority of infiltrated businesses are more than 3 years old, and in a substantial number of cases (20.6%) even more than 10 years old (Figure 48).
Figure 48. Age of infiltrated businesses. Percentages by country and age category
figure 1
figure 2
figure 3
figure 10
figure 15
figure 18
figure 19
figure 20
Figure 24
figure 27
figure 31
figure 32
figure 34
figure 35
figure 36
figure 37
figure 39
figure 40
figure 41
figure 42
figure 43
figure 45
figure 46
figure 47
figure 48
figure 49
figure 50
figure 51
9.2%
49.8%
1.3%
17.1%
22.5%
54.8%25.4%
3.1%
5.9%
10.8%
27%
25%
1%
15%
32%
43%
33%
20%
3% 1%
20%
1%3%
5%
70%
100%90%80%70%60%50%40%30%20%10%
0%2002
4
1
3
2
3
1
1
4
15
1
62
2
47
1
139 89 40
2
5 3 39
2003 2004 2005 2006 2007 2008 2009 2010 2011 2012 2013 2014*
21%
15%
1%4%
59%
21
11
8
20
10
164
34
35
43
23
20
25
15
10
5
01 2 3 4 5 6 7 8 9 10 >10
21%
16%
22%
21%
19%
70%80%90%
100%
40%50%60%
20%30%
10%0%
70%80%90%
100%
40%50%60%
20%30%
10%0%
Italy (N=164)
Slovenia(N=35)
Sweden(N=43)
UK(N=23)
TheNetherlands
(N=34)
Italy (N=21)
Slovenia(N=8)
Sweden(N=20)
UK(N=10)
TheNetherlands
(N=11)
Italy Slovenia Sweden UKTheNetherlands
70% 14
5
62
40%
50%
60%
20%
30%
10%
0%
600
500
400
300
200
100
0
0.20%
0.30%
0.10%
0.50%
0.60%
0.70%
0.80%
0.40%
0.00%2002
0.72%
0.51%
0.26%
0.47%0.56%
0.33%
0.44% 0.47%0.39%
0.36%
0.58%0.52%
0.24%
2003 2004 2005 2006 2007 2008 2009 2010 2011 2012 2013 2014*
38
6
10
5
7
70%80%90%
100%
94
25
19
35
2
40%50%60%
20%30%
10%0%
Italy (N=164)
Slovenia(N=35)
Sweden(N=43)
UK(N=23)
TheNetherlands
(N=34)
Public limited companies
Private limited companies
Partnerships
Sole traders
Other legal forms
NA
20% 40% 60% 80% 100%0%
figure 44
70%80%90%
100%
40%50%60% 90
11
22 26
17
20%30%
10%0%
Italy (N=164)
Slovenia(N=35)
Sweden(N=43)
UK(N=23)
TheNetherlands
(N=34)
10
12
6
8
4
2
14
16
0Money
launderingFraud OtherFormally legal
activitiesConcealment
of illegal activities
4 43
5
15
Italy (N=164)
Slovenia(N=35)
Sweden(N=43)
UK(N=23)
TheNetherlands
(N=34)
70%80%90%
100%
40%50%60%
20%30%
10%0%
40%
50%
20%
30%
10%
0%Italy
(N=137)Slovenia(N=32)
Sweden(N=34)
UK(N=18)
70%80%90%
100%
40%50%60%
20%30%
10%0%
Italy (N=21)
Slovenia(N=8)
Sweden(N=20)
UK(N=10)
TheNetherlands
(N=11)
Italy(N=164)
Slovenia(N=35)
Sweden(N=43)
UK(N=23)
TheNetherlands
(N=34)
Italy(N=164)
Slovenia(N=35)
Sweden(N=43)
UK(N=23)
TheNetherlands
(N=34)
70%80%90%
100%
40%50%60%
20%30%
10%0%
70%80%90%
100%
40%50%60%
20%30%
10%0%
30%
24.9%0.8%
Academic study Judicial evidence
LEA report Media Other
N = 2,380
N = 2,380
N = 2,380
N = 1,305
N = 604
Institutional report
15%
29%
0.4%
Local OCGs Motorcycles gangsItalian mafias
Other OCGs NA
Italy SloveniaThe Netherlands
Sweden UK
Academic study
Judicial evidence LEA report Media
Institutional report
Academic study
LEA report Media
No. criminal charges with references to OCGs % OCGs in relation to all criminal charges
% O
CGs
in re
latio
n to
all
crim
inal
cha
rges
Other
Institutional report
No.
crim
inal
cha
rges
with
refe
renc
es to
OCG
s
Academic study
Judicial evidence LEA report Media
Institutional report
N = 74
23%
24%
20%
32%
1% N = 140
N = 257
N = 70
N = 299
Academic study
LEA report Media Other
Institutional report
No. filed criminal complaints for money laudering offences with references to OCGs
No. filed criminal complaints for money laudering offences without references to OCGs
Academic study
Judicial evidence LEA report Media
Institutional report
Italy SloveniaThe Netherlands
Sweden UK
Italy SloveniaThe Netherlands
Sweden UK
Money laundering FraudFormally legal activities
Concealment of illegal activities Other
Money laundering FraudFormally legal activities
New business NAAlready existing business
Concealment of illegal activities Other
90
53
19
24
9
14
4
30
15
29
21
20% 40% 60% 80% 100%0%
Public limitedcompanies
Private limitedcompanies
Partnerships
Sole traders
Other legal forms
NA
Italy SloveniaThe Netherlands
UKSweden
Public limitedcompanies
Private limitedcompanies
Partnerships
Sole traders
Otherlegal forms
NA
20% 40% 60% 80% 100%0%
Cosa Nostra (N=14) Camorra (N=74)‘Ndrangheta (N=47)
Other Italian (N=13)Chinese (N=16)
Money laundering Fiscal fraudFormally legal activities
Corporate fraud OtherConcealment of illegal activities
Relatives Legal entrepreneursProfessionals
Women among shareholders Women as majority shareholders
Legal companies
53
7
6
14
98
3
1
8
4
1
Small LargeMedium Very large NA
Italy SloveniaThe Netherlands
Sweden UK
0 4-101-3 11-20 >20 NA
Source: Transcrime elaboration on DCS data
figure 1
figure 2
figure 3
figure 10
figure 15
figure 18
figure 19
figure 20
Figure 24
figure 27
figure 31
figure 32
figure 34
figure 35
figure 36
figure 37
figure 39
figure 40
figure 41
figure 42
figure 43
figure 45
figure 46
figure 47
figure 48
figure 49
figure 50
figure 51
9.2%
49.8%
1.3%
17.1%
22.5%
54.8%25.4%
3.1%
5.9%
10.8%
27%
25%
1%
15%
32%
43%
33%
20%
3% 1%
20%
1%3%
5%
70%
100%90%80%70%60%50%40%30%20%10%
0%2002
4
1
3
2
3
1
1
4
15
1
62
2
47
1
139 89 40
2
5 3 39
2003 2004 2005 2006 2007 2008 2009 2010 2011 2012 2013 2014*
21%
15%
1%4%
59%
21
11
8
20
10
164
34
35
43
23
20
25
15
10
5
01 2 3 4 5 6 7 8 9 10 >10
21%
16%
22%
21%
19%
70%80%90%
100%
40%50%60%
20%30%
10%0%
70%80%90%
100%
40%50%60%
20%30%
10%0%
Italy (N=164)
Slovenia(N=35)
Sweden(N=43)
UK(N=23)
TheNetherlands
(N=34)
Italy (N=21)
Slovenia(N=8)
Sweden(N=20)
UK(N=10)
TheNetherlands
(N=11)
Italy Slovenia Sweden UKTheNetherlands
70% 14
5
62
40%
50%
60%
20%
30%
10%
0%
600
500
400
300
200
100
0
0.20%
0.30%
0.10%
0.50%
0.60%
0.70%
0.80%
0.40%
0.00%2002
0.72%
0.51%
0.26%
0.47%0.56%
0.33%
0.44% 0.47%0.39%
0.36%
0.58%0.52%
0.24%
2003 2004 2005 2006 2007 2008 2009 2010 2011 2012 2013 2014*
38
6
10
5
7
70%80%90%
100%
94
25
19
35
2
40%50%60%
20%30%
10%0%
Italy (N=164)
Slovenia(N=35)
Sweden(N=43)
UK(N=23)
TheNetherlands
(N=34)
Public limited companies
Private limited companies
Partnerships
Sole traders
Other legal forms
NA
20% 40% 60% 80% 100%0%
figure 44
70%80%90%
100%
40%50%60% 90
11
22 26
17
20%30%
10%0%
Italy (N=164)
Slovenia(N=35)
Sweden(N=43)
UK(N=23)
TheNetherlands
(N=34)
10
12
6
8
4
2
14
16
0Money
launderingFraud OtherFormally legal
activitiesConcealment
of illegal activities
4 43
5
15
Italy (N=164)
Slovenia(N=35)
Sweden(N=43)
UK(N=23)
TheNetherlands
(N=34)
70%80%90%
100%
40%50%60%
20%30%
10%0%
40%
50%
20%
30%
10%
0%Italy
(N=137)Slovenia(N=32)
Sweden(N=34)
UK(N=18)
70%80%90%
100%
40%50%60%
20%30%
10%0%
Italy (N=21)
Slovenia(N=8)
Sweden(N=20)
UK(N=10)
TheNetherlands
(N=11)
Italy(N=164)
Slovenia(N=35)
Sweden(N=43)
UK(N=23)
TheNetherlands
(N=34)
Italy(N=164)
Slovenia(N=35)
Sweden(N=43)
UK(N=23)
TheNetherlands
(N=34)
70%80%90%
100%
40%50%60%
20%30%
10%0%
70%80%90%
100%
40%50%60%
20%30%
10%0%
30%
24.9%0.8%
Academic study Judicial evidence
LEA report Media Other
N = 2,380
N = 2,380
N = 2,380
N = 1,305
N = 604
Institutional report
15%
29%
0.4%
Local OCGs Motorcycles gangsItalian mafias
Other OCGs NA
Italy SloveniaThe Netherlands
Sweden UK
Academic study
Judicial evidence LEA report Media
Institutional report
Academic study
LEA report Media
No. criminal charges with references to OCGs % OCGs in relation to all criminal charges
% O
CGs
in re
latio
n to
all
crim
inal
cha
rges
Other
Institutional report
No.
crim
inal
cha
rges
with
refe
renc
es to
OCG
s
Academic study
Judicial evidence LEA report Media
Institutional report
N = 74
23%
24%
20%
32%
1% N = 140
N = 257
N = 70
N = 299
Academic study
LEA report Media Other
Institutional report
No. filed criminal complaints for money laudering offences with references to OCGs
No. filed criminal complaints for money laudering offences without references to OCGs
Academic study
Judicial evidence LEA report Media
Institutional report
Italy SloveniaThe Netherlands
Sweden UK
Italy SloveniaThe Netherlands
Sweden UK
Money laundering FraudFormally legal activities
Concealment of illegal activities Other
Money laundering FraudFormally legal activities
New business NAAlready existing business
Concealment of illegal activities Other
90
53
19
24
9
14
4
30
15
29
21
20% 40% 60% 80% 100%0%
Public limitedcompanies
Private limitedcompanies
Partnerships
Sole traders
Other legal forms
NA
Italy SloveniaThe Netherlands
UKSweden
Public limitedcompanies
Private limitedcompanies
Partnerships
Sole traders
Otherlegal forms
NA
20% 40% 60% 80% 100%0%
Cosa Nostra (N=14) Camorra (N=74)‘Ndrangheta (N=47)
Other Italian (N=13)Chinese (N=16)
Money laundering Fiscal fraudFormally legal activities
Corporate fraud OtherConcealment of illegal activities
Relatives Legal entrepreneursProfessionals
Women among shareholders Women as majority shareholders
Legal companies
53
7
6
14
98
3
1
8
4
1
Small LargeMedium Very large NA
Italy SloveniaThe Netherlands
Sweden UK
0 4-101-3 11-20 >20 NA

102
11. Management strategies of infiltrated businesses73
This chapter analyses how businesses infiltrated by OCGs are managed, and it identifies differences between infiltrated and legal businesses in order to identify accounting and non-accounting ‘red flags’ that can be used in a risk assessment model of criminal infiltration.
For the purpose of Project ARIEL, ‘management strategies’ refer to the financial management of infiltrated businesses, i.e. how infiltrated businesses are financed and if they are able to produce profits. Given the lack of previous research on infiltrated businesses’ management strategies, the analysis focuses on:
• The financing sources;
• The use of assets;
• The profitability of infiltrated businesses.
For 54 businesses listed in the Database on Case Studies (DCS) financial and accounting documents were available for the year when the infiltration process started and for at least three years afterwards. For another 12 businesses, accounting information was available for the year of infiltration, at least three years after, and at least three years before the infiltration started. The financial and accounting analysis thus focused on 66 infiltrated businesses in the five countries covered by the project (Figure 49).
figure 1
figure 2
figure 3
figure 10
figure 15
figure 18
figure 19
figure 20
Figure 24
figure 27
figure 31
figure 32
figure 34
figure 35
figure 36
figure 37
figure 39
figure 40
figure 41
figure 42
figure 43
figure 45
figure 46
figure 47
figure 48
figure 49
figure 50
figure 51
9.2%
49.8%
1.3%
17.1%
22.5%
54.8%25.4%
3.1%
5.9%
10.8%
27%
25%
1%
15%
32%
43%
33%
20%
3% 1%
20%
1%3%
5%
70%
100%90%80%70%60%50%40%30%20%10%
0%2002
4
1
3
2
3
1
1
4
15
1
62
2
47
1
139 89 40
2
5 3 39
2003 2004 2005 2006 2007 2008 2009 2010 2011 2012 2013 2014*
21%
15%
1%4%
59%
21
11
8
20
10
164
34
35
43
23
20
25
15
10
5
01 2 3 4 5 6 7 8 9 10 >10
21%
16%
22%
21%
19%
70%80%90%
100%
40%50%60%
20%30%
10%0%
70%80%90%
100%
40%50%60%
20%30%
10%0%
Italy (N=164)
Slovenia(N=35)
Sweden(N=43)
UK(N=23)
TheNetherlands
(N=34)
Italy (N=21)
Slovenia(N=8)
Sweden(N=20)
UK(N=10)
TheNetherlands
(N=11)
Italy Slovenia Sweden UKTheNetherlands
70% 14
5
62
40%
50%
60%
20%
30%
10%
0%
600
500
400
300
200
100
0
0.20%
0.30%
0.10%
0.50%
0.60%
0.70%
0.80%
0.40%
0.00%2002
0.72%
0.51%
0.26%
0.47%0.56%
0.33%
0.44% 0.47%0.39%
0.36%
0.58%0.52%
0.24%
2003 2004 2005 2006 2007 2008 2009 2010 2011 2012 2013 2014*
38
6
10
5
7
70%80%90%
100%
94
25
19
35
2
40%50%60%
20%30%
10%0%
Italy (N=164)
Slovenia(N=35)
Sweden(N=43)
UK(N=23)
TheNetherlands
(N=34)
Public limited companies
Private limited companies
Partnerships
Sole traders
Other legal forms
NA
20% 40% 60% 80% 100%0%
figure 44
70%80%90%
100%
40%50%60% 90
11
22 26
17
20%30%
10%0%
Italy (N=164)
Slovenia(N=35)
Sweden(N=43)
UK(N=23)
TheNetherlands
(N=34)
10
12
6
8
4
2
14
16
0Money
launderingFraud OtherFormally legal
activitiesConcealment
of illegal activities
4 43
5
15
Italy (N=164)
Slovenia(N=35)
Sweden(N=43)
UK(N=23)
TheNetherlands
(N=34)
70%80%90%
100%
40%50%60%
20%30%
10%0%
40%
50%
20%
30%
10%
0%Italy
(N=137)Slovenia(N=32)
Sweden(N=34)
UK(N=18)
70%80%90%
100%
40%50%60%
20%30%
10%0%
Italy (N=21)
Slovenia(N=8)
Sweden(N=20)
UK(N=10)
TheNetherlands
(N=11)
Italy(N=164)
Slovenia(N=35)
Sweden(N=43)
UK(N=23)
TheNetherlands
(N=34)
Italy(N=164)
Slovenia(N=35)
Sweden(N=43)
UK(N=23)
TheNetherlands
(N=34)
70%80%90%
100%
40%50%60%
20%30%
10%0%
70%80%90%
100%
40%50%60%
20%30%
10%0%
30%
24.9%0.8%
Academic study Judicial evidence
LEA report Media Other
N = 2,380
N = 2,380
N = 2,380
N = 1,305
N = 604
Institutional report
15%
29%
0.4%
Local OCGs Motorcycles gangsItalian mafias
Other OCGs NA
Italy SloveniaThe Netherlands
Sweden UK
Academic study
Judicial evidence LEA report Media
Institutional report
Academic study
LEA report Media
No. criminal charges with references to OCGs % OCGs in relation to all criminal charges
% O
CGs
in re
latio
n to
all
crim
inal
cha
rges
Other
Institutional report
No.
crim
inal
cha
rges
with
refe
renc
es to
OCG
s
Academic study
Judicial evidence LEA report Media
Institutional report
N = 74
23%
24%
20%
32%
1% N = 140
N = 257
N = 70
N = 299
Academic study
LEA report Media Other
Institutional report
No. filed criminal complaints for money laudering offences with references to OCGs
No. filed criminal complaints for money laudering offences without references to OCGs
Academic study
Judicial evidence LEA report Media
Institutional report
Italy SloveniaThe Netherlands
Sweden UK
Italy SloveniaThe Netherlands
Sweden UK
Money laundering FraudFormally legal activities
Concealment of illegal activities Other
Money laundering FraudFormally legal activities
New business NAAlready existing business
Concealment of illegal activities Other
90
53
19
24
9
14
4
30
15
29
21
20% 40% 60% 80% 100%0%
Public limitedcompanies
Private limitedcompanies
Partnerships
Sole traders
Other legal forms
NA
Italy SloveniaThe Netherlands
UKSweden
Public limitedcompanies
Private limitedcompanies
Partnerships
Sole traders
Otherlegal forms
NA
20% 40% 60% 80% 100%0%
Cosa Nostra (N=14) Camorra (N=74)‘Ndrangheta (N=47)
Other Italian (N=13)Chinese (N=16)
Money laundering Fiscal fraudFormally legal activities
Corporate fraud OtherConcealment of illegal activities
Relatives Legal entrepreneursProfessionals
Women among shareholders Women as majority shareholders
Legal companies
53
7
6
14
98
3
1
8
4
1
Small LargeMedium Very large NA
Italy SloveniaThe Netherlands
Sweden UK
0 4-101-3 11-20 >20 NA
Figure 49. Infiltrated businesses covered by the financial and accounting analysis by country
Source: Transcrime elaboration on DCS data
For each infiltrated business, a legal company (i.e. a non-infiltrated business) with similar characteristics was identified based on the combination of four criteria (Donato, Saporito, & Scognamiglio, 2013) (see Methodological Annex for details):
Spatial proximity: the legal business was registered in the same country region (NUTS 2) as the infiltrated business – in the case of high levels of market concentration – or country.
Business sector: the legal business operated in the same business sector (NACE 2-digit) as the infiltrated company.
Availability of information: the legal business had annual reports available for the period from three years before the beginning of the infiltration process to three years after its start, or for the year of infiltration and the three years after in the case of new businesses.
Total assets: the legal business with a value of total assets closest to that of the infiltrated business was selected.
The results presented in this chapter are based on the analysis of financial items and ratios retrieved from financial and accounting documents of a sample of 132 businesses: 66 belonging to the group of infiltrated businesses and 66 belonging to the peer group of legal companies.
73. With the collaboration of Lorena Di Bono, Salvatore Cincimino, Michele Riccardi and Giulia Berlusconi (Università Cattolica del Sacro Cuore-Transcrime, Italy).

103
It is important to note that the analysis may be biased by the fact that some financial accounts are not reliable, consistent and verifiable. Figure 50 reports the number of infiltrated businesses for which evidence of accounting manipulation was found in the judicial documents. In about one third of the case studies (32%) financial documents were manipulated. As a consequence, the information reported in such documents may not correspond to the actual financial situation of the infiltrated businesses, therefore making the comparison with legitimate businesses difficult and questionable.
Figure 50. Number of businesses with evidence of accounting manipulation by driver of OCG infiltration
figure 1
figure 2
figure 3
figure 10
figure 15
figure 18
figure 19
figure 20
Figure 24
figure 27
figure 31
figure 32
figure 34
figure 35
figure 36
figure 37
figure 39
figure 40
figure 41
figure 42
figure 43
figure 45
figure 46
figure 47
figure 48
figure 49
figure 50
figure 51
9.2%
49.8%
1.3%
17.1%
22.5%
54.8%25.4%
3.1%
5.9%
10.8%
27%
25%
1%
15%
32%
43%
33%
20%
3% 1%
20%
1%3%
5%
70%
100%90%80%70%60%50%40%30%20%10%
0%2002
4
1
3
2
3
1
1
4
15
1
62
2
47
1
139 89 40
2
5 3 39
2003 2004 2005 2006 2007 2008 2009 2010 2011 2012 2013 2014*
21%
15%
1%4%
59%
21
11
8
20
10
164
34
35
43
23
20
25
15
10
5
01 2 3 4 5 6 7 8 9 10 >10
21%
16%
22%
21%
19%
70%80%90%
100%
40%50%60%
20%30%
10%0%
70%80%90%
100%
40%50%60%
20%30%
10%0%
Italy (N=164)
Slovenia(N=35)
Sweden(N=43)
UK(N=23)
TheNetherlands
(N=34)
Italy (N=21)
Slovenia(N=8)
Sweden(N=20)
UK(N=10)
TheNetherlands
(N=11)
Italy Slovenia Sweden UKTheNetherlands
70% 14
5
62
40%
50%
60%
20%
30%
10%
0%
600
500
400
300
200
100
0
0.20%
0.30%
0.10%
0.50%
0.60%
0.70%
0.80%
0.40%
0.00%2002
0.72%
0.51%
0.26%
0.47%0.56%
0.33%
0.44% 0.47%0.39%
0.36%
0.58%0.52%
0.24%
2003 2004 2005 2006 2007 2008 2009 2010 2011 2012 2013 2014*
38
6
10
5
7
70%80%90%
100%
94
25
19
35
2
40%50%60%
20%30%
10%0%
Italy (N=164)
Slovenia(N=35)
Sweden(N=43)
UK(N=23)
TheNetherlands
(N=34)
Public limited companies
Private limited companies
Partnerships
Sole traders
Other legal forms
NA
20% 40% 60% 80% 100%0%
figure 44
70%80%90%
100%
40%50%60% 90
11
22 26
17
20%30%
10%0%
Italy (N=164)
Slovenia(N=35)
Sweden(N=43)
UK(N=23)
TheNetherlands
(N=34)
10
12
6
8
4
2
14
16
0Money
launderingFraud OtherFormally legal
activitiesConcealment
of illegal activities
4 43
5
15
Italy (N=164)
Slovenia(N=35)
Sweden(N=43)
UK(N=23)
TheNetherlands
(N=34)
70%80%90%
100%
40%50%60%
20%30%
10%0%
40%
50%
20%
30%
10%
0%Italy
(N=137)Slovenia(N=32)
Sweden(N=34)
UK(N=18)
70%80%90%
100%
40%50%60%
20%30%
10%0%
Italy (N=21)
Slovenia(N=8)
Sweden(N=20)
UK(N=10)
TheNetherlands
(N=11)
Italy(N=164)
Slovenia(N=35)
Sweden(N=43)
UK(N=23)
TheNetherlands
(N=34)
Italy(N=164)
Slovenia(N=35)
Sweden(N=43)
UK(N=23)
TheNetherlands
(N=34)
70%80%90%
100%
40%50%60%
20%30%
10%0%
70%80%90%
100%
40%50%60%
20%30%
10%0%
30%
24.9%0.8%
Academic study Judicial evidence
LEA report Media Other
N = 2,380
N = 2,380
N = 2,380
N = 1,305
N = 604
Institutional report
15%
29%
0.4%
Local OCGs Motorcycles gangsItalian mafias
Other OCGs NA
Italy SloveniaThe Netherlands
Sweden UK
Academic study
Judicial evidence LEA report Media
Institutional report
Academic study
LEA report Media
No. criminal charges with references to OCGs % OCGs in relation to all criminal charges
% O
CGs
in re
latio
n to
all
crim
inal
cha
rges
Other
Institutional report
No.
crim
inal
cha
rges
with
refe
renc
es to
OCG
s
Academic study
Judicial evidence LEA report Media
Institutional report
N = 74
23%
24%
20%
32%
1% N = 140
N = 257
N = 70
N = 299
Academic study
LEA report Media Other
Institutional report
No. filed criminal complaints for money laudering offences with references to OCGs
No. filed criminal complaints for money laudering offences without references to OCGs
Academic study
Judicial evidence LEA report Media
Institutional report
Italy SloveniaThe Netherlands
Sweden UK
Italy SloveniaThe Netherlands
Sweden UK
Money laundering FraudFormally legal activities
Concealment of illegal activities Other
Money laundering FraudFormally legal activities
New business NAAlready existing business
Concealment of illegal activities Other
90
53
19
24
9
14
4
30
15
29
21
20% 40% 60% 80% 100%0%
Public limitedcompanies
Private limitedcompanies
Partnerships
Sole traders
Other legal forms
NA
Italy SloveniaThe Netherlands
UKSweden
Public limitedcompanies
Private limitedcompanies
Partnerships
Sole traders
Otherlegal forms
NA
20% 40% 60% 80% 100%0%
Cosa Nostra (N=14) Camorra (N=74)‘Ndrangheta (N=47)
Other Italian (N=13)Chinese (N=16)
Money laundering Fiscal fraudFormally legal activities
Corporate fraud OtherConcealment of illegal activities
Relatives Legal entrepreneursProfessionals
Women among shareholders Women as majority shareholders
Legal companies
53
7
6
14
98
3
1
8
4
1
Small LargeMedium Very large NA
Italy SloveniaThe Netherlands
Sweden UK
0 4-101-3 11-20 >20 NA
Source: Transcrime elaboration on DCS data
Despite evidence of accounting manipulation, the whole sample of 66 infiltrated businesses was analysed. Firstly, accounting manipulation may occur in infiltrated, as well as in non-infiltrated businesses. Secondly, the judicial documents did not specify the type and extent of such manipulations (e.g. the financial items and the years). Finally, accounting manipulations
are more visible in the income statement rather than in the balance sheet. The analysis, however, focuses on the latter.
11.1. Financing sources
Among the drivers of OCG infiltration of legal businesses, money laundering and the concealment of illegal activities may influence the financial statement items (i.e. investments and liabilities) of infiltrated businesses. Criminal groups may have a large amount of illicit proceeds to be invested and laundered through legal businesses. As a consequence, infiltrated businesses may not need to resort to bank credit, and they may have low levels of financial indebtedness (Transcrime, 2013b).
At the same time, criminal groups need to conceal the origin of the money used to finance the infiltrated businesses. Possible options include the creation of complex corporate schemes to account loans as debts towards companies of the same group, or towards subsidiaries, shareholders and parent companies. OCGs may also incorporate (fictitious) supplier companies and disguise the injection of money as debts to suppliers (i.e. trade payables) (Transcrime, 2013b).
Table 23 summarises the hypotheses on the financing sources of infiltrated businesses and the corresponding signals in the balance sheet. It also presents the main results, i.e. whether the level of the financial ratios of infiltrated businesses is higher or lower than the one of non-infiltrated businesses, and therefore whether the analysis confirmed the hypotheses (see the Methodological Annex for the list of financial ratios used in the analysis and details on the results).
Table 23. Financing sources of infiltrated businesses. Comparison with the peer group of non-infiltrated businesses74
OC drivers and/or needs
AssumptionsAccounting level signals
Comparison with peer group
Significance level
Large availability of illicit resources for laundering and for financing the firm
Low levels of financial debt
Low level of financial debts on total assets
Lower (HP confirmed) **
Low levels of debts Low level of debts Lower (HP confirmed) n.s.
Need to conceal illicit resources
Little use of shareholders’ funds
Low level of equity on total assets
Lower (HP confirmed) n.s.
Use of covert forms of funding
High level of other debts
Higher (HP confirmed) n.s.
High level of trade payables
Higher (HP confirmed) n.s.
Intimidation of suppliers
High exposure to suppliers
High level of trade payables
Higher (HP confirmed) n.s.
Source: Transcrime elaboration on DCS data 74. *, ** and *** denote significance levels at 10%, 5% and 1%, respectively.
104
The results seem to confirm the hypotheses, although only the level of financial net debt of infiltrated businesses – measured as the difference between current financial liabilities plus medium/long term financial liabilities minus cash and cash equivalents on net equity – is significantly lower than the average level of legal, non-infiltrated companies belonging to the peer group.
Low levels of financial debt indicate that legal businesses infiltrated by OCGs do not need to resort to banks and other financial institutions for loans to finance their activities. At the same time, the level of shareholders’ equity is lower in comparison to non-infiltrated businesses. This could be explained by the fact that OCGs tend to avoid direct involvement as shareholders in companies in order to make it more difficult for law enforcement agencies to trace their origin.
High levels of debts to suppliers and other debts may indicate an attempt to conceal the injection of illicit proceeds into legitimate businesses controlled by OCGs. Criminal groups may, in fact, use fictitious suppliers to disguise the injection of money as trade payables. At the same time, the high levels of trade payables in infiltrated businesses may reflect actual debts of such companies towards their suppliers, due to the fact that criminal groups are often able to intimidate suppliers and delay the payments (Box 37).
Box 37. Intimidation of suppliers
This case study concerns Cosa Nostra infiltration of a company that managed a beach resort in Sicily. The company was founded by two straw men, Mr. A and Mr. B on behalf of the criminal organisation. The company was in financial difficulties. It had no money to pay the suppliers, and Mr. A usually drew post-dated and overdraft cheques. When someone tried to cash the cheques, the bank called Mr. A, who phoned the OCG member. The latter then often intimidated the creditors to withdraw the cheques.
Some financial ratios could not be calculated due to the lack of financial information available from national business registers and other private business information providers, although some case studies presented the characteristics described in Table 23. Box 38 describes a Dutch case study in which evidence of variability in terms of financing sources was found.
Box 38. Variability in financial sources of a company involved in the wholesale of mobile phones
Mr. A (OC member) acquired ALPHA, a company active in the wholesale of information and communication equipment, and changed its name and NACE code. During the first three months, the company had little wholesale trade and therefore low revenues. Afterwards, the revenues suddenly grew dramatically. In this period, the company sold goods to companies in other EU countries for over €5,000,000. None of this trades had been declared to the Tax Administration, thus committing tax fraud. The sales over the products that ALPHA had bought should have rendered around €1,000,000 in VAT for the Tax Administration.
The same analyses were replicated by distinguishing the infiltrated businesses on the basis of the driver of infiltration. Although the results are not significant in most cases, they highlight differences among businesses used for different purposes in terms of sources of financing (Table 24). For instance, high levels of financial debts were found in infiltrated companies involved in frauds, whereas the same businesses showed levels of other debts lower than those of their peer group.

105
Table 24. Financing sources of infiltrated businesses by driver of OCG infiltration. Comparison with the peer group of non-infiltrated businesses75
Accounting level signals Money launderingFormally legal activities
FraudConcealment of illegal activities
Low level of financial debts on total assets
Lower*** Lower Higher Lower***
Low level of debts Higher Lower Lower Lower
Low level of equity on total assets
Lower Higher Lower Higher
High other debts Higher Lower Lower Lower
High trade payables Higher Higher Higher Lower
Source: Transcrime elaboration on DCS data
11.2. Use of assets
An infiltrated business’s use of assets may be influenced by the type of company, i.e. whether the business is a productive or a shell business entity. Productive businesses aim to maximise their profits through (formally) legal activities. Therefore, like any other legal business, they are likely to invest the capital in buildings, machinery and other means of production. By contrast, legal businesses infiltrated with the aim of laundering money or committing frauds are likely to keep their assets in liquidity (e.g. cash, bank deposits) or other current assets (Catanzaro, 1988; Transcrime, 2013b).
Businesses infiltrated by criminal groups to conceal criminal activities may also show levels of receivables and a number of debtors higher than the sector’s average if they use them to disguise outflows to OCG members or other companies controlled by the criminal group (Schneider, 2004; Transcrime, 2013b).
Table 25 summarises the hypotheses on the use of assets of infiltrated businesses and the main results of the comparison between infiltrated and non-infiltrated businesses.
Some of the hypotheses concerning the use of assets are confirmed by the analysis of the infiltrated businesses. For instance, businesses managed by organised criminals show levels of non-financial current credits (i.e. inventory) significantly higher than the peer group composed of legal, non-infiltrated businesses.
Organised criminals may prefer high levels of current assets and cash because they would facilitate them in liquidating the business in the case of a law enforcement investigation and avoiding the risk of asset confiscation. Should the criminals be aware of a financial investigation (e.g. thanks to tipping-off or other disclosure), they may try to sell the company assets before these are seized by the judicial authority, and move the resulting liquidity in safer places (e.g. offshore bank accounts).
Some financial ratios instead show a trend which is in contrast with the one expected from the review of the literature. This may be due to the fact that the hypotheses presented in Table 25 refer to shell and paper companies, i.e. companies with no production activities. However, many infiltrated businesses analysed in the study were productive businesses and were thus likely to be similar to legal companies in their use of assets.
75. *, ** and *** denote significance levels at 10%, 5% and 1%, respectively.

106
Table 25. Use of assets of infiltrated businesses. Comparison with the peer group of non-infiltrated businesses76
OC drivers and/or needs
Assumptions Accounting level signalsComparison with peer group
Significance level
Shell companies: no production and investments, use of the companies only for money laundering
Low levels of fixed assetsLow levels of fixed assets and non-current assets out of total assets
Higher (HP not confirmed)
n.s.
High levels of current assets
High level of current assets out of total assets
Lower (HP not confirmed)
n.s.
High level of cash and cash equivalents out of total assets
Higher (HP confirmed)
n.s.
High level of trade receivables out of total assets
Higher (HP confirmed)
n.s.
High level of non-financial current credits out of total assets
Higher (HP confirmed)
***
Shell companies: need to conceal outflow to OCG members and/or colluding companies
Use of receivables and debtors to screen outflows to members
High levels of trade receivables
Higher (HP confirmed)
n.s.
High levels of other debtors
Lower (HP not confirmed)
***
High levels of receivables and debtors
Lower (HP not confirmed)
***
False invoicing Use of false invoices 68% of case studies
Structuring and smurfing
Large financial transaction parcelled into a series of smaller transactions
16% of case studies
Deposits to foreign countries with low transparency requirements
Deposits to foreign bank accounts
24% of case studies
Source: Transcrime elaboration on DCS data
Table 26 presents the results for businesses infiltrated to commit frauds (N=37). Such businesses are often used to create complex ownership schemes rather than production activities, and their accounting documents present many of the characteristics expected from the literature. Low levels of fixed assets indicate that businesses infiltrated for frauds are unlikely to invest the capital in buildings, machinery and other means of production. High levels of trade receivables may instead conceal outflows to OCG members or other companies controlled by the criminal group (Box 39).
Box 39. Methods to drain money from an infiltrated business
A ‘Ndrangheta group was able to infiltrate a legal business involved in telemarketing, teleselling, and call centre activities in the North of Italy. The organised criminals used several methods to drain money from the company. First they imposed mafia collaborators as employees. Mr. A was employed as managing director, whereas other members of the criminal group were hired as unskilled workers. Second, they signed contracts to buy unspecified services with other companies controlled by the criminal group, in order to transfer the financial resources to the latter.
76. *, ** and *** denote significance levels at 10%, 5% and 1%, respectively.
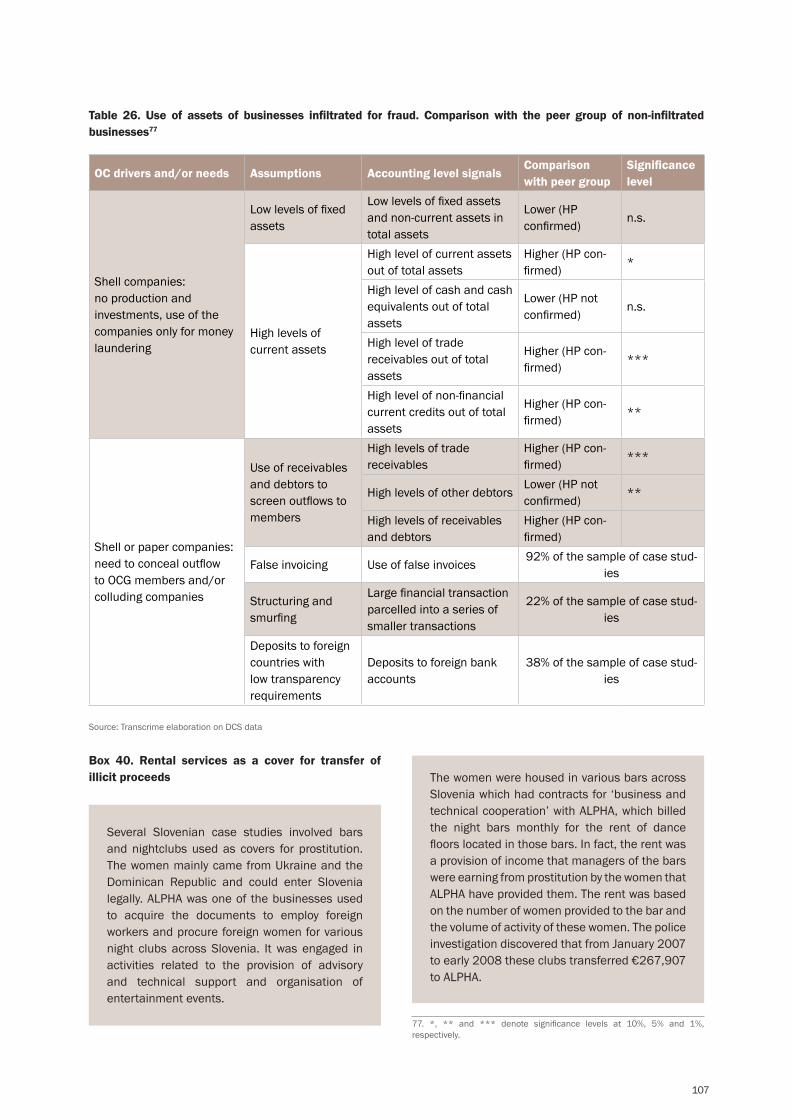
107
Table 26. Use of assets of businesses infiltrated for fraud. Comparison with the peer group of non-infiltrated businesses77
OC drivers and/or needs Assumptions Accounting level signalsComparison with peer group
Significance level
Shell companies: no production and investments, use of the companies only for money laundering
Low levels of fixed assets
Low levels of fixed assets and non-current assets in total assets
Lower (HP confirmed)
n.s.
High levels of current assets
High level of current assets out of total assets
Higher (HP con-firmed)
*
High level of cash and cash equivalents out of total assets
Lower (HP not confirmed)
n.s.
High level of trade receivables out of total assets
Higher (HP con-firmed)
***
High level of non-financial current credits out of total assets
Higher (HP con-firmed)
**
Shell or paper companies: need to conceal outflow to OCG members and/or colluding companies
Use of receivables and debtors to screen outflows to members
High levels of trade receivables
Higher (HP con-firmed)
***
High levels of other debtorsLower (HP not confirmed)
**
High levels of receivables and debtors
Higher (HP con-firmed)
False invoicing Use of false invoices92% of the sample of case stud-
ies
Structuring and smurfing
Large financial transaction parcelled into a series of smaller transactions
22% of the sample of case stud-ies
Deposits to foreign countries with low transparency requirements
Deposits to foreign bank accounts
38% of the sample of case stud-ies
Source: Transcrime elaboration on DCS data
Box 40. Rental services as a cover for transfer of illicit proceeds
Several Slovenian case studies involved bars and nightclubs used as covers for prostitution. The women mainly came from Ukraine and the Dominican Republic and could enter Slovenia legally. ALPHA was one of the businesses used to acquire the documents to employ foreign workers and procure foreign women for various night clubs across Slovenia. It was engaged in activities related to the provision of advisory and technical support and organisation of entertainment events.
The women were housed in various bars across Slovenia which had contracts for ‘business and technical cooperation’ with ALPHA, which billed the night bars monthly for the rent of dance floors located in those bars. In fact, the rent was a provision of income that managers of the bars were earning from prostitution by the women that ALPHA have provided them. The rent was based on the number of women provided to the bar and the volume of activity of these women. The police investigation discovered that from January 2007 to early 2008 these clubs transferred €267,907 to ALPHA.
77. *, ** and *** denote significance levels at 10%, 5% and 1%, respectively.

108
The analysis of the case studies also shows that the use of false invoices is frequent in infiltrated businesses, with more than 90% of frauds with evidence of false invoicing. Box 41 describes a Dutch case study where false invoices were used to cover VAT frauds. Evidence of the use of offshore bank accounts was also found (Box 42).
Box 41. False invoices to cover VAT frauds in the Netherlands
In January 2009 nine people were brought to court because they were suspected of fiscal fraud. The criminal investigation revealed a case of MTIC VAT fraud that involved several companies active in the trade of cars and trucks. The buffer traders were the actual buyers of the vehicles from abroad. The criminal group was able to falsify the documents and give the impression that the vehicles were imported by BETA, who then sold them to GAMMA and DELTA and created the possibility to claim a 19% tax return. By means of a false invoice, BETA did not pay the due VAT and caused a loss to the state.
During the VAT fraud, in order to render a correct balance sheet, in many cases the payment for the purchased trucks abroad went partly ‘under the table’. The invoice from the foreign supplier directed to the defaulting trader included the ‘white’ lower purchase price, while the bill of the missing trader addressed to the recipients indicated the total amount paid (white and black). This allowed the buyer to record the total purchase costs in the administration.
EPSILON Broker
DELTA 2nd Buffer Trader
GAMMA 1st Buffer Trader
BETADefaulting Trader
ALPHASupplier
EU member states
The Netherlands
Box 42. Use of offshore bank accounts to disguise the proceeds of a ‘carousel’ fraud
Two chains of bogus companies based in London were used to defraud HMRC of VAT on carbon credit trades through a series of ‘carousel’ frauds. Carbon credits were imported free of VAT into the UK by two missing traders, and resold to four buffer companies, which then sold them to a broker. The broker finally sold the carbon credits to legitimate companies to make the transactions look legal. All the companies were owned by the members of the same criminal group.
The fraud earned the group £38 million. The trades were make quickly via computers, while the proceeds of crime were moved offshore into banking platforms, particularly commercial banks in Hong Kong, Australia and New Zealand. All the money went into one bank account, but there were internal ledgers used to allocate it between the sub-accounts of the traders. Therefore, the true nature of the transfers was effectively disguised and difficult to detect. Credits went through complex transaction chains on the books of various banks.
Box 43. Shared assets between two infiltrated companies
Between 2008 and 2010 two companies – a car recovery, storage and hire company (ALPHA) and a claims management and taxi hire company (BETA) – created an informal partnership to organise a ‘crash for cash’ scam that involved staging and voluntary causing car accidents and fabricating or manipulating circumstances.
According to police investigations, the two companies merged their activities and essentially worked as a single entity in order to place, layer and integrate cash obtained through fraud through personal and business bank accounts and obtain assets with the aim of legitimising cash gained from fraudulent insurance claims.
The two businesses crossed over and merged in many ways, not only with regard to their criminal activities. ALPHA paperwork was found on BETA

109
computers. ALPHA paid Christmas bonuses to the staff of BETA. The two owners signed off each other’s documents. The bank accounts were connected. The assets of the businesses were connected and mostly derived from fraud.
The land on which both businesses were located was jointly owned by the owners of the two com-panies and was paid through a joint mortgage. The two companies shared the same premises until the claim management company moved its registered office and trading address to another city.
11.3. Profitability
The study of profitability may be made difficult due to the presence of accounting manipulations, as income statements are more easily and more often falsified than balance sheets to minimise the taxable income. Keeping this in mind, it is possible to formulate some hypotheses on the profitability of infiltrated businesses. Table 27 summarises the hypotheses on the profitabili-ty of infiltrated businesses and the main results.
An infiltrated business’ profitability is influenced by the type of company, i.e. whether the business is a produc-tive or a shell company. Productive companies are likely to be similar to legal businesses in terms of revenues and costs. However, businesses infiltrated by criminal groups can exploit competitive advantages guaran-teed by the coexistence of formally legal activities and criminal methods (e.g. threats, corruption). Therefore, infiltrated businesses may be able to minimise their labour and production costs (Arlacchi, 2007; Fantò, 1999; Transcrime, 2013b). The former can be reduced by not paying social security contributions, insurance, and overtime work; the latter can be minimised by using poor-quality materials.
Infiltrated companies may instead be used to conceal outgoing flows to the members of the criminal group who are hired as employees. In this case the salaries – and thus labour costs – are likely to be higher than the sector’s average (Schneider, 2004; Steinko, 2012; Transcrime, 2013b).
Finally, shell and paper companies are characterised by no or minimum productive activities (Catanzaro, 1988). At accounting level, this may result in low revenues or in revenues characterised by high variance across time (Transcrime, 2008c, 2013b).
Table 27. Profitability of infiltrated businesses. Comparison with the peer group of non-infiltrated businesses78
OC drivers and/or needs AssumptionsAccounting level signals
Comparison with peer group
Significance level
Productive companies: profit maximization and costs minimization through criminal methods
Costs minimization in the purchase of raw materials and services
Use of poor-quality materials
Higher (HP not confirmed)
n.s.
Minimization of production costs
Low production costsHigher (HP not confirmed)
n.s.
Advantages from illegality and discouragement of competition
Profitability higher than the sector’s average
Higher (HP confirmed)
n.s.
Shell and paper companies: concealing and laundering of criminal resources
No productive activityLow revenues and profitability
Lower (HP confirmed)
*
Concealment of cash outflows to OC members in the form of wages or as purchases of services
High levels of services costs or ones above the sector’s average
Higher (HP confirmed)
n.s.
Source: Transcrime elaboration on DCS data
78. *, ** and *** denote significance levels at 10%, 5% and 1%, respectively.

110
Only one financial ratio used to assess the profitability of infiltrated companies provides statistically significant results. In general, companies controlled and managed by criminal groups are characterised by profits lower than those of their peer group of non-infiltrated businesses, regardless of the driver of infiltration. This may be partly due to the fact that infiltrated businesses often face economic difficulties, either because of the management by the members of the criminal group or because organised criminals target businesses with financial difficulties.
The accounting documents of infiltrated businesses do not allow analysis of personnel costs. Some case studies reported members of the criminal organisation, as well as relatives and friends, among the employees (Box 44). This may increase the weight of personnel costs in the profit and loss account of such companies. A few cases were also found of attempts to minimise production costs through the use of poor-quality materials (Box 45).
However, these results may be biased by the presence of accounting manipulations which, in the case of income statements, are easier and more frequent than in balance sheets. Further research should try to better address this issue, e.g. by analysing infiltrated businesses’ financial statements jointly with other financial and non-financial documents (e.g. judicial administrators’ reports) that can provide further details about the actual management of the company and its ‘true’ financial figures.
Box 44. Salaries increase before bankruptcy to maximise salary guarantees
In 2011 a crime report was filed by the Social Insurance Agency in regard to several people connected to a company in the care assistance sector, ALPHA. 17 persons – both formal representatives and employees – were indicted for serious social benefit fraud, accounting fraud, and tax evasion.
ALPHA provided care assistance for people with physical and psychological disabilities, and was established in 2008 with the intent to commit fraud against the Social Insurance Agency. ALPHA was doing well financially and had a large number of employees. Whilst not a family business per se, many of the persons in leading positions were related.
It is believed that salaries were boosted prior to bankruptcy in order to maximise the salary guarantees paid when ALPHA became bankrupt. For instance, a 14-year-old care assistance earned 29,000 SEK per month. Four other under-aged assistants were employed by the company and 4.5 million SEK were paid in salary guarantees to employees.
Box 45. Minimisation of costs through the use of poor-quality materials
A Cosa Nostra clan was able to infiltrate the construction of a wind farm in the province of Messina. The clan exerted external influence over the decisions and the activities of ALPHA, the general contractor in charge of construction of the wind farm. In particular, the members of the criminal group could count on two collusive entrepreneurs as co-offenders. The construction companies involved in the works committed serious irregularities in the execution to save on the costs of the materials and increase their profit. For instance, the concrete used to construct the turbine foundations was of poor quality. Inadequate materials were also used to build the gabions and the reinforced earth structures that are normally used in civil engineering for the purpose of building fortification.
No significant differences were found on considering the drivers of OCG infiltration separately. Infiltrated businesses do not seem to have low personnel and production costs, although revenues are slightly higher than those of the peer group of legal, non-infiltrated companies. However, the profitability is lower than that of the peer group, indicating that infiltrated companies are often characterised by little or no production activity.
Box 46. Long-term management strategies and profitability of a company involved in assistance care
This case study regards assistance compensation fraud. The company ALPHA delivered care to disabled persons (clients). However, the hours spent on performing the care and the quality of the care were in some cases exaggerated. Unlike

111
many of the other Swedish cases, this company was used for a long time – three and a half years. Profitability was increased by the absence of minimum wages for care assistants and flat rates for each hour of approved assistance. Because this company was targeting immigrant families (both as clients and employees) with little knowledge of the benefit, salaries could be set low. In some cases the employees did not speak Swedish well, which reduced their chances of finding work elsewhere.
The care was provided in the client’s home, which means that transparency was low. It was not unusual for family members to be both the legal guardians and care assistants of disabled relatives (often children), decreasing transparency further. Because employees at ALPHA also acted as translators for the clients in their dealings with the authorities, it was possible to control the information given both to the clients and the authorities.
It is believed that salaries were boosted prior to bankruptcy in order to maximise the salary guarantees paid when ALPHA became bankrupt. One example is a 14-year old care assistant who on paper earned 29,000 SEK per month. 4.5 million SEK were paid in salary guarantees to employees, but it should be noted that not all of the 300 employees participated in the fraud. The employees who only worked on paper also wrongfully qualified for unemployment benefits and received higher benefits when on parental leave or for sickness.
According to the investigation, some care assistants also worked as sellers, meaning that they recruited new clients. According to anonymous tip-offs to the Tax Authority, ALPHA offered 10,000 SEK as a ‘bonus’ or bribe to new clients, and 8,000 each month to the company hired to furnish the care assistance.
There was also a second company, BETA, which was established with the purpose of lending money to the clients of ALPHA. Thus profit could be made from the lending activities; but it also tied the clients closer to ALPHA, created a feeling of gratitude and loyalty, and made it difficult to change to another company and report irregularities to the Social Insurance Agency.
Box 47. Evolution of a small taxi business
The performances of the businesses in the Slovenian case studies are diverse. Some did not even manage to become fully operational before they were deleted from registers, while others continued to function. In the case of company IOTA the latter holds true.
IOTA started as a simple sole proprietorship taxi business that has also (at one time) been registered as amusement provider service. Around the time of the official opening of the business, the owner was prosecuted as an accomplice in an organised crime group engaged in smuggling people across the state border, and he had also provided some foreign women to a bar in Slovenia. These women were forced into prostitution and the owner of IOTA drove them to/from clients. Because IOTA was a taxi business, it was also used as a cover (although the business was probably not directly set up with this intention) for transporting smuggled people across Slovenia. Despite the conviction and imprisonment of the owner, the business continued to prosper. With some occasional minor alternations to its name and expansion to providing airport shuttle services as well, the business grew from one employee to more than 10 officially employed79 – which by Slovenian standards is a sign of good management. The company developed to such an extent that it had all necessary requisites for use by public institutions as well: in fact, the profit earned from providing services to the public sector was substantial.
Box 48. Profitability of two infiltrated businesses in the car recovery and claims management sector
This case study concerns the partnership between two British companies - a car recovery, storage and hire company (ALPHA) and a claims management and taxi hire company (BETA) – with the aim of conducting a ‘crash for cash’ scam.
79. It should be pointed out, however, that this number could not be verified on Zavod za pokojninsko in invalidsko zavarovanje [Office for Pension and Disability Insurance], which holds data on actual employment. However, on the other hand, student workers and sub-contractors (who frequently work in such businesses) would be excluded from the registers, even though they receive wages from a business entity.

112
ALPHA recovered and stored the damaged cars and provided replacement cars, while BETA arranged insurance claims through two legal firms. The extent to which ALPHA also ran some sort of legitimate business is unclear, but the police maintain that it would not have been profitable without criminal activities. In fact, no turnover figures were supplied after the partnership between the two companies ended (when ALPHA was put under a restraint order in 2010). This is an indication that the business could not be profitable without criminal activities and without the connection with BETA.
By contrast, BETA started as a legitimate company whose owner was self-educated in insurance claims and the hire and replacement of taxis. The turnover of the company in its first six months of activity are estimated at around £140,000. Fraudulent claims started on a smaller scale and increased after the recruitment of employees with specific skills and expertise in insurance claims. The criminal association with ALPHA was an opportunity to accelerate business further by making fraudulent claims related to accidents involving private cars.
While the main aim of ALPHA was to exploit a particular business sector and use a sham company to profit from fraud, BETA did not necessarily need to resort to criminal activities for its economic survival. In fact, BETA was crucial for the survival of ALPHA, but not vice versa. Once the connection between the two companies was severed and the joint criminal activities limited, ALPHA collapsed while BETA continued to trade (allegedly) legally.
The analysis of financial accounts has provided some useful information on the accounting red-flags that could allow to identify infiltrated businesses from non-infiltrated ones. However, further research is needed in this field. Improvements could be possible by widening the sample and enriching the set of information to be analysed; in particular it is suggested to integrate the analysis of financial statements with other documents (e.g. reports by judicial administrators) which can provide more details about the actual financial management of the company.
Moreover, attention should be devoted to the fact that infiltrated companies may change management strategy over time, and this behaviour could be reflected also in accounting terms. In particular, as mentioned, it is possible that criminals could disinvest from the company as soon as they have the suspect of being under investigation: as a result, for example, they could start liquidating the company’s assets (with impact both in terms of income statement and balance sheet) or closing down business operations (resulting in a decrease of revenues and investments). Future research should necessarily add a time-series component to the analysis
12. Key inputs for a common risk assessment model80
Previous chapters have mapped OCG infiltration in Italy, the Netherlands, Slovenia, Sweden, and the United Kingdom, and they have analysed selected case studies to identify the infiltration process, and the control and management strategies of infiltrated businesses. The last step of Project ARIEL is to identify, on the basis of these results, risk factors (i.e. ‘red flags’ or ‘markers’) of organised crime infiltration that can be used in a risk assessment model of criminal infiltration.
The purpose of developing a common risk assessment model is twofold:
• To protect EU MS legitimate economies from OCG infiltration and from the misuse of legal businesses for illicit purposes;
• To improve prevention and enforcement by identifying the factors facilitating and/or promoting OCG infiltration and help LEAs in enhancing the prevention of and the fight against organised crime.
Chapter 12 reviews past studies on the economy’s and market’s vulnerabilities to organised crime, identifies risk factors of OCG infiltration of legal businesses, and provides key inputs for the development of a common risk assessment model.
80. With the collaboration of Lorella Garofalo, Maurizio Lisciandra and Gi-ulia Berlusconi (Università Cattolica del Sacro Cuore-Transcrime, Italy).

113
12.1 Risk assessment in organised crime research
Criminal organisations operate in different sectors of the legal economy that allow them to invest in, and launder profits from, illegal activities together with the provision of additional opportunities for extra gain. The infiltration process is often difficult to detect. The constant monitoring of changes in the legal economy, and its vulnerabilities that may be exploited by criminal organisations, could help anticipate the negative consequences and develop appropriate actions to recognise and prevent them.
Risk-assessment models are useful for assessing the extent to which a certain business sector, territory, or business is exposed to criminal infiltration. The existing risk-assessment models on organised crime can be grouped into three different categories: those evaluating the presence of organised crime groups in a given area; those concerned with the infiltration of such groups into the legitimate economy; and models focusing on a specific sector, i.e. OCG infiltration of public procurement.
Analysis of organised crime groups presence
A first group of risk assessment models comprises those that analyse the presence of organised crime groups in a given area or country. The ‘Composite Organised Crime Index’ developed by van Dijk (2007, 2008) combines data on the perceived prevalence of organised crime in a country, instrumental violence, grand corruption, money laundering and black economy. These variables are statistical ‘markers’ (2007, p. 40) of the organised crime presence in a country.
The perceived prevalence of organised crime is measured by the ‘Organised Crime Perception Index’, built with data on OCG activities, such as extortion, drugs, people and arms trafficking, as perceived by potential victims and independent experts. These data are gathered from the World Economic Forum victimisation surveys among the CEOs of larger companies and from the Merchant International Group assessment of organised crime risk.
Organised crime groups usually resort to violence as a means to resolve conflicts. Instrumental violence is measured through the rates of unsolved homicides by calculating the number of police-recorded homicides divided by the number of convictions for homicides. These data are drawn from the UN ‘Crime and Criminal Justice survey’.
‘Grand corruption’ refers to the corruption of high-ranking public officers, judges and politicians. Bribes
and benefits are given to a public official who can enable organised crime activities to be carried out or reduce the risk for criminals of being caught. A solid indicator of this marker is developed from data of the World Bank Institute. Data on money laundering and black economy are drawn from the World Economic Forum surveys among business executives. The assumption is that organised crime usually reinvests excess profits in the legitimate economy by means of financial operations in order to conceal the illicit source of the money. Moreover, organised crime groups also invest in shadow economies.
Data included in the Composite Organised Crime Index have been recalculated by dividing them by the highest score in the data series and multiplying by 100. All data are thus presented on a 100% scale.
The Composite Organised Crime Index is calculated at country level. The ‘Mafia Index’ (MI) instead assesses the presence of mafias across the Italian provinces (Calderoni, 2011). The methodology used for the creation of the index is based on three steps. The first defines the concept of ‘mafia’ and provides the operational definition comprising multiple dimensions. The second step is the selection of the indicators and variables most appropriate for each dimension according to specific criteria. The third step is creation of the Mafia Index by combining the variables selected.
The concept of ‘mafia’ has been divided into four main dimensions: presence of criminal groups providing illicit goods and services; use of violence, threat or intimidation; infiltration of the political system; infiltration of the economic system. On the basis of a systematic review of the literature on existing attempts to measure the presence of mafia in Italy, the author selected a number of possible indicators and related variables with which to measure the above dimensions. The selected and available variables were analysed according to three criteria: availability of data for a sufficiently long period of time;81 content validity; 82 and criterion validity.83
81. Because a mafia is an established and long-lasting system, measuring its presence in a given territory requires account to be taken of its persistent and continuous nature. Therefore, long time series are preferred for the analysis.
82. ‘Content validity’ refers to how ‘the measure covers the full range of the concept’s meaning’ (Bachman & Schutt, 2010, p. 95). Therefore, each variable was checked for its content validity, in order to assess how it reflected one or more dimensions of the operational definition.
83. ‘Criterion validity’ refers to how ‘the scores obtained on one measure can be compared to those obtained with more direct or already validated measure of the phenomenon (the criterion)’ (Bachman & Schutt, 2010, p. 95). Therefore, each variable was analysed in order to verify its statistical correlation with the other variables.

114
Only four variables fulfilled the three selection criteria and were included in the MI: mafia-type associations; mafia murders; city councils dissolved for mafia infiltration; assets confiscated from organised crime. Each of them covered a different dimension of the operational concept of ‘mafia’. In order to create the MI, the average of the annual rates (per 100,000 inhabitants for mafia-type associations, murders and confiscated assets; per 100 city councils in the province for city councils dissolved for mafia infiltration) for each variable and for each province were calculated. The rates were then normalised, attributing the score of 100 to the province with the highest average rate. The average of the scores for each indicator provided the final score for each province.
Analysis of infiltration of organised crime into the legitimate economy
The theory that the economic activities, both legal and illegal, move along a continuum (Smith, 1980) and that, therefore, their vulnerabilities to crime are determined by the specific characteristics of the economic sector was first developed by Albanese (1987). Albanese created a model to predict the level of risk of a company being infiltrated by organised crime. He identified six predictors which defined the vulnerability based on the previous literature, experience, and investigations carried out on businesses exposed to organised crime (Table 28). Albanese considered two different ways in which criminal infiltration of the legal economy can be assessed: the use of legal businesses as covers for illegal activities, and corruption.
Table 28. Preliminary predictive model on organised crime infiltration into legitimate business
Predictors Low risk High riskSupply Few available small, financially weak
businessesReadily available small, financially weak businesses
Customers Elastic demand for product Inelastic demand for productRegulators Difficult to enter the market Easy to enter the marketCompetitors Monopoly/oligopoly controlled market Open market with many small firmsPatronage Entrepreneurs are professional managers Entrepreneurs are non-professionals ill-equipped
to deal with business problemsPrior record No prior record of organised crime
involvement in the marketPrior history of organised crime infiltration in the industry
Source: Albanese (1987)
This model has not been applied or further developed by other authors, and it has limitations. In particular, it does not consider the illegal use of legal instruments by organised crime groups, and it uses the same set of predictors for all the economic sectors, as if there were no significant differences among them. Therefore, the indicators identified by Albanese should be considered more as starting points for the creation of a model, rather than constituting a model in itself.
Rozekranz and Emde (1996) developed a conceptual model of analysis based on the preventive screening of economic sectors. The model focused on business processes rather than on businesses themselves. Their study proposed a division of crime activities among primary (basic illegal criminal activities), secondary (activities to generate profits, such as money laundering) and tertiary (investments). On the basis of this subdivision, the model is termed ‘PST’ (from primary, secondary and tertiary). These different forms of crime are linked to the specific characteristics and vulnerabilities of each business process.
The use of indicators (different according to the diverse forms of crime that may affect the sector) helps measure these elements. The indicators are chosen on the basis of the literature, interviews with representatives of government and the economy, empirical studies, case study analysis, laws and regulations. The model identifies indicators either facilitating or discouraging criminal activities. Each indicator should be weighted carefully when the model is applied to a specific economic sector.
The PST model is built starting from identification of the key phases of the business process, and the indicators assess the vulnerabilities to crime of each phase in the process (PST risk profile). However, Rozekranz and Emde did not provide specific guidelines for identification of indicators, and their model has not found any practical application.
The MAVUS model (Method for Assessment of the Vulnerability of Sectors), developed in 2005 by the Institute for International Research on Criminal Policy

115
(IRCP) of the University of Ghent and Transcrime – Joint research Centre on Transnational Crime is a method of analysis which aims at assessing the degree of vulnerability of the legitimate economic sectors to organised crime. It is based on a multidisciplinary approach comprising economic, sociological and criminological methodologies. In Europe, the model has been applied to diverse economic sectors such as the diamond industry, transport, music, pharmaceuticals, fashion, and waste management (Vander Beken, 2005, 2007).
The MAVUS model is based on three different levels of analysis: macro, meso and micro. At the macro level it analyses the environment surrounding the economic sector; the meso level analyses the sector itself; while the micro level analyses the individual economic entity and its business processes. The application of MAVUS moves through two main steps, each of them divided into further steps:
• Descriptive phase
◦ Analysis of the sector (sector analysis);
◦ Analysis of the environment and the cluster around the sector (environmental scan and cluster analysis);
◦ Analysis of the economic entity and its business processes (reference model analysis).
• Analytical phase
◦ Width scan;
◦ Depth scan.
In the descriptive phase, the first two steps involve the collection of information on the cluster around the sector (macro-level), the sector itself (meso-level), and the activities within the sector (micro-level). The data collected lead to the development of indicators and the construction of a reference model for the economic sector under investigation that describes how the business is organised. The third step (reference model analysis) deals with definition of the business’s structure: it analyses its business processes by collecting data on the operating rules that guide the choices and information derived directly from the sector.
The information gathered in the descriptive phase is used in the analytical phase to develop the vulnerability profile of the sector. In particular, the indicators identified from the information gathered at the macro and meso level are analysed to define a width profile of vulnerability of the entire sector (width scan). Analysis of the indicators identified at the micro level leads to
the creation of an in-depth vulnerability profile of the business (depth scan).
The MAVUS model allows consideration to be made of the peculiarities of each sector with very detailed analysis. However, the high numbers of variables and phases/steps involved make the model complex to apply.
The model developed by Albanese (2008) also considered illicit markets as the units of analysis. The purpose of this model was to assess the presence of organised crime groups in ‘areas that may or may not have a history of organised crime involvement’ (2008, p. 263).
Albanese aimed at assessing comparative risk levels of criminal activities and illicit markets. He considered that, if illegal activities are properly assessed and ranked, targeting these activities will make it possible to tackle the high-risk organised crime groups involved. Through this approach, Albanese wanted to identify higher-risk products and markets in order to identify where criminals could be caught.
Albanese identified three main categories of organised crime activities: provision of illicit services; provision of illicit goods; and infiltration of legitimate businesses. Each of these activities was further divided into more specific offences. The provision of illicit services encompasses:
• Commercialised sex (prostitution or pornography);
• Illegal gambling;
• Human trafficking;
• Subcontracting to others (to provide services such as illicit dumping of waste, trafficking in human organs or protected animal species, or murder for hire).
The provision of illicit goods involves:
• Drug trafficking;
• Property theft (vehicles, art);
• Counterfeiting (identity documents, software, DVDs, weapons).
The infiltration of business includes:
• Extortion of business owners;
• Racketeering;
• Money laundering;
• Fraud.

116
According to prior studies on illicit markets and organised crime (Albanese, 2001; Edwards & Gill, 2002; Vander Beken, 2004; Wilkins & Casswell, 2003), supply, demand, regulators and competition are the fundamental dimensions for assessment of which markets are at higher risk. Each of these dimensions is further divided into specific indicators. Albanese’s model is made up of 10 risk factors (indicators) with which to assess organised crime risk. The model includes:
• Supply indicators: objective availability of the product or service; easily transported/sold;
• Regulation indicators: ease of entry into the market due to market regulations, skills needed, law enforcement capability and competence, and level of local government corruption;
• Competition indicators: history of organised crime in the market; profitability; harm;
• Demand indicators: current customer demand for the product; nature of the demand.
By analysing these indicators and using this model, it is possible to create a risk index of infiltration by organised crime of the economic sector under investigation. In the concrete application of the model, such indicators can
be combined into a specific index for each sector. The information necessary for construction of the index can be found through analysis of case studies or through information obtained from the population, businesses, law enforcement agencies, and the analysis of national and local legislation. This last is carried out in order to verify the extent to which the regulation involuntarily facilitates the expansion of illegal markets for some products or services.
In 2011 Transcrime carried out the Me.Tri.C. project (Monitoring the Trentino Economy against the Risk of Crime), a first exploratory project with the purpose of analysing the vulnerabilities of the economic sector in the Italian province of Trento which might facilitate infiltration of the legal economy by criminal organisations. Two different risk models were created starting from identification of the risk factors: the first focused on the territory; whereas the second model focused on the economic sector. The risk factors were identified through the literature review on the topic, the analysis of case studies, and consultations with stakeholders. The risk factors were operationalised into indicators and proxy variables so that they could be directly measured.
Table 29 summarises the indicators and variables included in each model.
Table 29. Me.Tri.C. model. Indicators and variables included in the Territory and Economic sector models
Indicator Variable
Territory
Small businessNo. of small businesses (0-1 employee) over the total number of active businesses in the territory
BankruptcyNo. of bankruptcies over the total number of active businesses in the territory
Business turnoverNo. of new businesses over the total number of registered businesses in the territory
Economic crime index
No. of tax evaders over the resident population in the territory No. of taxation crimes (Law 74/2000) over the resident population in the territoryNo. of money laundering crimes over the resident population in the territory
Organised crime indexNo. of extortions over the resident population in the territoryNo. of criminal associations over the resident population in the territoryNo. of drug crimes over the resident population in the territory
Wealth index
Cost of houses per square metre over the resident population in the territory Amount of taxable income over the total number of taxpayers in the territory
Business structureNo. of business employees over the number of family employees in the territory

117
Indicator Variable
Economic sector
Business structure static index
No. of small businesses (0-1 employee) over the total number of active businesses in a given economic sector No. of business employees over the number of family employees in a given economic sector
Business structure dynamic index
No. of bankruptcies over the total number of active businesses in a given economic sectorNo. of new businesses over the total number of registered businesses in a given sector
Economic crime index of the sector
No. of tax evasions over the number of active businesses in a given economic sector No. of taxation crimes (Law 74/2000) over the number of active businesses in a given economic sector
Source: Transcrime (2013a)
The variables described above were combined in order to create the relative indicators. The score of each variable was normalized by assigning 100 to the highest value, considered as the reference score, whereas the other values were expressed as a function of it. The average value of all the variables’ scores referred to a given indicator provided the value of the indicator itself. The two final risk of infiltration indexes (Territory and Economic sector) were given by the average values of the indicators referred to each model.
Starting from the experience of the Me.Tri.C. project, Transcrime has developed a second model to assess
the vulnerabilities of the legal economy to infiltration by organised crime (Transcrime, 2013b). Its name is Mo.Vu.S., and it aims at identifying the risk of infiltration by organised crime for twelve economic sectors at provincial level. The model consists of the combination of two different risk factors: the Territory (Rt), which is related to the characteristics of the territory that can facilitate infiltration by criminal organisations, and the Economic sector (Rs), determined by the characteristics of each sector at provincial level. Each risk factor was operationalised into different indicators and variables, which were chosen on the basis of the literature review, analysis of case studies, consultations with institutions and stakeholders.
Table 30. Mo.Vu.S. model. Indicators and variables included in the Territory and Economic sector risk factors
Indicator Variable
Territory
OC presence
No. of confiscated assets over the resident population in the provinceNo. of mafia murders over the resident population in the provinceNo. of charges for art. 416bis over the resident population in the provinceNo. of city councils and institutions dissolved for mafia infiltration in the province
Wealth
Amount of GDP per capita in the provinceNo. of cars with more than 2000 cc over the total number of cars in the provinceAmount of taxable income over the total number of taxpayers in the province
Shadow economy
Amount of tax evasion over the amount of IRAP84 added value in the provinceRatio of the amount of tax collected over the amount of tax supposed to be collected (Tax Gap) in the provinceNo. of notifications of unusual transactions over the resident population in the province
Market structureExpenditure on R&D in the provinceStructural equipment index in the provinceAmount of import + export over the amount of added value in the province
84. IRAP is the acronym for the regional tax on productive activities. It is a tax on the net value of production generated by businesses. In particular, it is the income generated before costs for staff and for expenses and financial proceeds.

118
Indicator Variable
Economic sector
Business sizeNo. of local units with up to 5 employees over the total number of local units in a given economic sector and province
CrisisNo. of bankruptcies over the total number of active businesses in a given economic sector and province
Competitiveness
No. of active businesses in a given economic sector and province over the resident population in the province Amount of added value in a given economic sector and province over the number of active businesses in the economic sector and province
Previous infiltrationNo. of confiscated businesses in a given economic sector and province over the number of active businesses in the economic sector and province
Source: Transcrime (2013b)
The variables were normalised by assigning the score 100 to the province with the highest value among all provinces analysed and scores proportionally smaller to the other provinces, up to 0 for the province with the lowest value. Each indicator was obtained by calculating the arithmetic mean of the normalised variables. Subsequently, this score was normalised following the same procedure as the one applied to transform the variables. The final Territory and Economic sector risk of infiltration indexes (Rt and Rs) were given by the aggregation of their respective normalised indicators, which were combined using the method of the generalised mean. Subsequently, the values thus obtained for each sector and for each of the 107 provinces were normalised, attributing 100 to the highest value and scores proportionally lower for the provinces with the lowest value.
Analysis of the infiltration of organised crime in the public procurement
Buscaglia and Van Dijk (2003) tested the link between organised crime and corruption growth in the public sector in a large number of countries. The authors created an index combining objective factors linked to complex crimes in order to measure the prevalence of organised crime. The presence of organised crime in a country was assessed by means of indicators deriving from elements contained in investigations conducted by law enforcement agencies, as well as in the UN Organised Crime Convention and its protocols. Since the data from official police records do not provide reliable information on the extent of organised crime activities in a given country, the authors used the World Economic Forum business survey to measure the costs imposed by organised crime on firms in order to assess the extent of business victimisation. They ranked the countries according to this indicator and then correlated it with indices for corruption and violence (homicide). Thereafter, they added further national data available
on the main activities of organised criminal groups, such as credit card fraud and trafficking in drugs, persons, firearms, stolen cars and cigarettes. Therefore, the authors developed a composite index including indicators of five main activities (human trafficking, firearms, stolen cars and cigarettes, and fraud) and four secondary factors (costs of business, extent of the informal economy as a proportion of gross domestic product, violence and money laundering).
Transcrime (2008c) has developed a model to analyse infiltration by organised crime of public procurement called Ris.I.C.O. (Risk of Infiltration by Organised Crime). This is an analytic and early warning tool with the purpose of preventing infiltration by organised crime of public procurement. The model assesses, on the basis of scientific evaluations and assumptions, whether a given public procurement is likely to be infiltrated. In order to create the model, several markers for the risk of infiltration by organised crime in public procurement were identified, according to interviews with national authorities, prefectures, review of the existing legislation and the analysis of several case studies. The markers were operationalised in indicators, which were grouped into five risk profiles: territory; contract; business, business staff; and other risk indicators.
The Ris.I.C.O. model consists of two levels of risk evaluation:
• Quantitative, which is subdivided in rapid evaluation and detailed evaluation;
• Qualitative.
The quantitative evaluation is carried out by combining the indicators relative to the territory, contract, business and business staff. They are grouped into two main risk factors: the territory, and the business (which includes indicators on contract, business and business staff). The scores for the territorial risk and business risk are

119
both expressed in percentage values. The final risk of infiltration index is defined as follows:
risk of infiltration index = α · territory risk + (1 - α) · business risk
The qualitative evaluation further analyses the risk of infiltration by organised crime scored by the first quantitative evaluation. It is performed by counting how many of the ‘other risk indicators’ are present in the analysis. The score is a number expressed as a fraction (e.g. 2/10), which indicates the number of indicators found to be relevant to the risk of infiltration by organised crime.
12.2 Infiltration risk factors
Infiltration risk factors are those features of the territory, business sector and legal business that favour infiltration or highlight an already-infiltrated business.
The case studies selected for the analysis are not representative of the totality of infiltrated businesses, but are only examples of the infiltration dynamics. Furthermore, they are based on the analysis of criminal infiltration in five EU MS. Therefore, the risk factors listed below highlight factors that may influence the risk of infiltration, but they do not represent a full list of risk factors.
Four types of risk factors can be identified: those referring to the territory where infiltration takes place; those related to the business sector; and risk factors linked to the main characteristics of a legal business, i.e. its ownership structure and its economic and financial management.
Territory
Risk factors can be linked with characteristics of the territory. Territories with past evidence of OCG infiltration, or characterised by the presence of criminal groups, high levels of shadow economy and corruption, and low levels of regulation are more vulnerable to OCG infiltration of legal businesses.
Past evidence of OCG infiltration
Territories with high levels of evidence of past infiltration may be more vulnerable to OCG infiltration in the future. Criminal groups may favour territories with which they are familiar because of past cases of criminal infiltration into legal businesses. In the five countries covered by the project, these territories include Southern Italian regions, Lombardy and Lazio (Italy); North and South Holland, and Limburg (the Netherlands); Western Slovenia, and particularly Osrednjeslovenska; the
regions of Stockholm; Sydsverige; Västsverige in Sweden; Scotland and the London area in the UK.
High presence of OCGs
Territories with a historical, well-rooted presence of organised crime groups are likely to present evidence of the involvement of such groups in legal markets. Territories with a stable presence of criminal groups are thus vulnerable to the criminal infiltration of legitimate businesses. This includes both territories historically connected with organised crime (e.g., Southern Italy, South-Western Scotland) and regions where police operations have concentrated in the past years (e.g. Lombardy).
Regions with large urban areas
Evidence of OCG infiltration concentrates in regions with large cities, where the largest cities of the country and the main transport facilities (e.g., harbours and airports) are located, and where the vast majority of economic activities are conducted. Regions with large urban areas thus seem to be more vulnerable to OCG infiltration of legal businesses. In the five countries covered by the project, these regions include: Lombardy and Lazio (Italy); North and South Holland (the Netherlands), Western Slovenia; the Stockholm and Malmö regions in Sweden; the London area in the UK.
High level of infrastructural equipment
High levels of infrastructural development (i.e. the presence of motorways) seem to be associated with the presence of OCG infiltration into legal businesses. Like legal entrepreneurs, organised criminals exploit the industrial, commercial, financial, and banking systems to conduct their business activities, and thus benefit from the presence of developed infrastructures.
High level of shadow economy and corruption
The evidence of OCG infiltration seems greater in those regions characterised by high levels of shadow economy and corruption. The presence of widespread corruption and market illegalities can be exploited by criminal groups because it facilitates illicit activities and reduces the risks of being reported to law enforcement agencies.
Business sector
Risk factors can be linked with characteristics of the business sector. Sectors with past evidence of OCG infiltration, or characterised by low levels of competition and openness to foreign investments and low levels of technology, may favour the criminal infiltration of legal

120
businesses. Other risk factors include a small average company size, low barriers to entry, and a weak or developing regulation.
Past evidence of OCG infiltration
Business sectors with high levels of evidence of past infiltration may be more vulnerable to OCG infiltration in the future. Ten business sectors show evidence of criminal infiltration in legitimate businesses in the five EU MS. These include the construction industry, which is strongly deregulated and often has an inefficient control system. Furthermore, the subcontracting procedures and agreements on the purchase of goods and services make it vulnerable to infiltration.
The wholesale and retail trade sector is important for the concealment of criminal activities and for money laundering. The vulnerability of this sector is mainly due to the fact that it includes multiple sub-sectors that can be exploited for different types of illegal activities, such as counterfeiting (as in the case of the wholesale and retail trade of clothing and textiles) or drug trafficking (as in the case of import/export companies).
Other business sectors with evidence of criminal infiltration in the five EU MS are: transportation; hotels, bars and restaurants, real estate activities; financial and insurance activities, and clubs and gambling activities.
Low level of competition and openness to foreign investments
Sectors characterised by inelasticity of demand and where the number of competitors is limited (i.e. sectors with low openness to international investments and low competition) are more vulnerable to OCG infiltration. Criminal groups, in fact, favour business sectors where the competition with other legal businesses is low.
Low level of technology
Sectors characterised by low technology seem to be vulnerable to OCG infiltration, which is associated with business sectors such as bars and restaurants, construction, transportation, retail trade. Traditional activities, or activities with low technological levels, may be vulnerable to infiltration by criminal groups because they ensure high profits without entailing high research and development costs, or requiring specific knowledge.
Company size
OCGs seem to favour business sectors with a small average company size. This is also reflected in the decision to infiltrate a specific business. Indeed, OCGs
frequently infiltrate small, unlisted companies to reduce the visibility and minimise the risk of controls.
Low barriers to entry
Business sectors with low barriers to entry are favoured by criminal groups. These include: few requirements to set up a company (e.g., registration with the national business registry and absence of disqualifications from being a company director); no need for a licence (e.g. in the wholesale and retail trade, no need for an import licence except for particular goods); low initial costs (e.g. low costs of equipment).
Weak or developing regulation
OCGs may also exploit sectors with weak or changing regulations that allow easy concealment of criminal activities. Sectors characterised by weak or developing regulation (e.g. gambling activities; renewable energy; transportation) are thus vulnerable to criminal infiltration. For instance, the European Union’s VAT system is vulnerable to organised fraud schemes, as several case studies showed. In some countries, tax reductions for specific works may also create incentives to OCG infiltration (e.g. tax reduction for the renovation of properties in Sweden).
Ownership structure of legal business
A third category of risk factors includes characteristics of a business’s ownership structure. Limited companies show higher levels of OCG infiltration compared with other legal forms. The characteristics of the shareholders and the directors may instead help highlight an ongoing infiltration. OCGs often use straw men chosen from among their relatives and may include very young or old people. The use of corporate shareholders and complex ownership schemes may also indicate a case of infiltration, although in some business sectors it may be a common strategy.
Limited companies
Limited companies seem to be the legal form preferred by organised criminals in all the countries covered by the project. First, the requirement of share capital for limited liability companies is often minimal. Second, this legal form favours the concealment of criminal activities and reduces the impact of law enforcement intervention. Indeed, it allows for great fragmentation of the share capital, thus reducing the potential impact of seizure and confiscation and making it more difficult for law enforcement agencies to identify the members of the organisation.

121
Characteristics of shareholders
The use of straw men as company shareholders is a strategy commonly used by OCGs to conceal their criminal activities and hide the identity of the ultimate beneficial owners (which, in fact, are the members of the organisation itself). The use of figureheads is particularly frequent if the members of the OCGs have criminal records which prevent them from participating directly in the ownership and management structure of the infiltrated business.
Persons frequently used as nominee shareholders include the relatives of OCG members, and in particular very young or very old people. The age of the owners and directors of a certain company cannot be considered as a single risk of OCG infiltration into legitimate businesses. Instead, it should be evaluated in conjunction with other risk factors.
A similar consideration applies to the gender of shareholders and directors. In some countries or regions, where female unemployment is high and women rarely occupy top management positions within companies, the presence of female shareholders or directors may represent a red flag of infiltration. Women, in fact, were frequently included among the shareholders of infiltrated businesses in two of the countries analysed.
Corporate shareholders, complex corporate ownership schemes and cross-shareholding
The presence of corporate shareholders may be a risk factor of OCG infiltration into legal businesses. The creation of large networks of interconnected companies may be instrumental to the commission of complex fraudulent schemes, as well as other illicit activities.
Risk factors also include the creation of complex corporate ownership schemes and the frequent change of company details. The former involve the creation of large networks of interconnected companies among each other with cross-shareholding; the latter includes: frequent transformations of company details (e.g. registered address, name), transfers of business lines or business branches, dissolution of a company and transfer of its activities to a newly-incorporated one. Frequent changes of registered address, name and shareholders, and transfers of business branches was found in several case studies analysed during the project.
Size and age
A final risk factor related to the ownership structure of businesses includes characteristics of the company profile such as size or age. Small- and medium-sized businesses are more frequently infiltrated by organized
criminals because they are easier to control and manage. Similarly, OCGs may sometimes decide to set up new companies instead of infiltrating already existing ones in order to avoid law enforcement controls. These characteristics, if considered on their own, cannot be regarded as certain risk factors of criminal infiltration. Nonetheless, if combined with other risk factors, they can be useful in identifying suspicious and vulnerable companies.
Financial management of legal business
Finally, risk factors linked with the financial management of legal business can be identified, although it is difficult to find management strategies that are reflected unambiguously in the financial statements. To further complicate matters, it should be pointed out that, in about one third of the case studies (32%), evidence of accounting manipulation was found in the judicial documents. As a consequence, the information reported in such documents may not correspond to the actual financial situation of the infiltrated businesses.
Low level of financial debt
Low levels of financial indebtedness of infiltrated businesses – measured as current financial liabilities, medium/long term financial liabilities, and cash and cash equivalents on net equity – may indicate that the legal businesses do not need to resort to loans from banks and other financial institutions to finance their activities and may be infiltrated by OCGs.
High level of current assets
The analysis of infiltrated businesses confirmed that businesses managed by organised criminals show levels of non-financial current credits (i.e. inventory) significantly higher than those of the peer group composed of legal, non-infiltrated businesses. Legal businesses infiltrated with the aim of laundering money or committing frauds do not undertake production activities and keep their surplus mainly in current assets (e.g., cash, bank deposits). High levels of current assets may thus help identify legal companies controlled and managed by criminal groups.
Low revenues and profitability
Only one financial ratio used to assess the profitability of infiltrated companies provides statistically significant results. In general, companies controlled and managed by criminal groups are characterised by profits lower than those of their peer group of non-infiltrated businesses, regardless of the driver of infiltration. Therefore, low revenues and profitability can be included in the risk factors with which to identify OCG infiltration of legal businesses.

122
12.3. Towards a common risk-assessment model
The mapping of OCG infiltration in Italy, the Netherlands, Slovenia, Sweden, and United Kingdom, and the analysis of selected case studies, helped identify criminal infiltration risk factors, i.e. those features of the territory, business sector, and legal business that favour infiltration or highlight an already-infiltrated business, and that can be used in a risk assessment model of criminal infiltration.
Risk factors need to be operationalised and transformed into risk indicators to be measurable and to be included in a risk assessment model. Data on crime trends, the
legal economy and legal businesses, and other socio-economic data at European and national level, have been reviewed to identify a measurement for each risk factor.
Table 31 presents the list of risk factors, a proposal for their operationalisation, and information on the availability of data at European and national level. As regards risk factors, they can be grouped into four categories: territory, business sector, ownership structure, financial management. Data collected by the Eurostat or other international institutions provide useful information with which to create risk indicators. On the contrary, national data may be more detailed but they often present problems of comparability across countries.
Table 31. Operationalisation of risk factors
Dimension Risk factor Proxies Source
Territory
Past evidence of OCG infiltration No. references of OCG infiltration DCI
Presence of OCGs
No. active OCGs Data not available for all the five EU MS and/or not comparable among each other85
OCG-related crimes
Large urban areasLevel of urbanisation
EUROSTATNo. inhabitants per square km
High level of infrastructural equipment
Motorways and rails EUROSTAT
High level of shadow economyShadow economy on the GDP (%)
Herwartz et al. (2013)
High level of corruption Extent of corruptionEuropean Quality of Iife Index (2013)
Business sector
Past evidence of OCG infiltration No. references of OCG infiltration DCI
Low level of competitionHerfindahl-Hirschman index ORBISGross added value/No. enterprises
EUROSTAT
Low level of openness to foreign investments
Foreign control of enterprises/No. enterprises
EUROSTAT
Low level of technology
Employment in technology and knowledge-intensive sectors (%)
EUROSTATBusiness enterprise R&D expenditure (euro per inhabitant)
Small average company sizeNo. employees/No. enterprises EUROSTATNo. enterprises with max. 1 employee/No. enterprises
ORBIS
Low barriers to entry - -
Weak or developing regulation - -

123
Dimension Risk factor Proxies Source
Ownership structure of legal business
Limited company Legal formNational Business Register86 and/or ORBIS
Characteristics of shareholders (young/old, female shareholders)
Family ties of the shareholders -Age of the shareholders National Business
Register and/or ORBISGender of the shareholders
Corporate shareholders Legal person as shareholderNational Business Register and/or ORBIS
Complex corporate ownership schemes and cross-shareholding
Large networks of interconnected companies
ORBISFrequent change of company details
Frequent change of registered address or name Transfer of business lines or branchesDissolution of a companyTransfer of company’s activities to a newly-incorporated company
Small company size Business sizeNational Business Register and/or ORBIS
Financial management of legal business
Low level of financial debt
Current financial liabilities National Business Register and/or ORBIS
Medium/long term financial liabilitiesCash and cash equivalents on net equity
High level of current assets Non-financial current creditsNational Business Register and/or ORBIS
Low revenues and profitabilityRevenues National Business
Register and/or ORBISProfitability
Source: Transcrime elaboration
86. Italy: Infocamere/registro delle imprese. The Netherlands: Kamer van Koophandel. Slovenia: Ajpes. Sweden: Bolagsverket. United Kingdom: Com-panies House.
85. Italy (NUTS 2, 3): mafia presence index; OC and mafia type crimes rate; confiscated assets. The Netherlands (NUTS 2): real estate properties seized from OCGs. Slovenia (NUTS 2 and 3): criminal charges for organised crime. Sweden: no available data. United Kingdom (NUTS 2): no available data.
Finally, the risk of infiltration can be identified as a function of the features of the territory (Rter), business sector (Rsec), the business’s ownership structure (Rown), and financial management of legal businesses (Rman), as shown in Figure 51.
Figure 51. Risk model of OCG infiltration of legiti-mate businesses
Source: Transcrime elaboration
Rsec Rown
Rter RmanRtot

124
13. ConclusionsProject ARIEL – Assessing the Risk of the Infiltration of Organised Crime in EU MSs Legitimate Economies: a Pilot Project in 5 EU Countries analysed the methods used by different OCGs to infiltrate, control, and manage legitimate businesses in five selected EU member states (Italy, the Netherlands, Slovenia, Sweden, United Kingdom), and to identify the risk factors of OCG infiltration for the development of a common risk assessment model to detect the infiltration of legitimate businesses by criminal groups.
Despite limitations due to availability of information on the infiltration process and infiltrated companies, and to the focus on five EU MS, the project provided an unprecedented cross-national comparative analysis of criminal infiltration of legitimate businesses in five countries. It provided insights into the infiltration of legitimate businesses by organised crime groups. In particular, it identified the vulnerabilities of legal businesses to OCG infiltration by analysing the modi operandi, and the control and management strategies of organised criminals. The final result is a list of risk factors to be included in a common risk assessment model to detect OCG infiltration of legal businesses.
However, both data and the analyses could be improved. First, the scope of the analysis could be widened, and data and case studies from other European countries could be included. This would yield a wider variety of case studies to be analysed. A larger number of case studies could also enable analyses on a smaller sample of all case studies and infiltrated businesses, e.g. businesses infiltrated to fulfil a specific driver. This would allow better identification of the differences among infiltrated businesses in terms of drivers of infiltration, as well as other variables.
Finally, the risk factors could be verified and translated into risk indicators to be used to develop the common risk assessment model. The model should then be tested on a sample of infiltrated and legal, non-infiltrated businesses, and applied. Indeed, Project ARIEL is only the first step towards the development of a common risk assessment model of OCG infiltration. The model would make it possible to move from contrast to risk assessment, and to prevent organised crime infiltration of legal businesses.
125
ReferencesAdamoli, S., Di Nicola, A., Savona, E. U., & Zoffi, P.
(1998). Organized crime around the world. Helsinki: European Institute for Crime Preven-tion and Control.
Åkergren, K. (2013, June 5). Största bedrägeriet med fakturor någonsin. SVT Nyheter. Stockholm. Retrieved from http://www.svt.se/nyheter/sverige/storsta-bedrageriet-med-fakturor-na-gonsin
Albanese, J. S. (1987). Predicting the incidence of or-ganized crime: A preliminary model. In T. S. Bynum (Ed.), Organized crime in America: Concepts and controversies. New York, NY: Criminal Justice Press.
Albanese, J. S. (2001). The prediction and control of or-ganized crime: A risk assessment instrument for targeting law enforcement efforts. Trends in Organized Crime, 6(3), 4–29.
Albanese, J. S. (2008). Risk assessment in organized crime: Developing a market and product-based model to determine threat levels. Journal of Contemporary Criminal Justice, 24(3), 263 –273.
Allum, F. (2014). Understanding criminal mobility: The case of the Neapolitan Camorra. Journal of Modern Italian Studies, 19(5), 583–602.
Annison, R. (2013). In the dock: Examining the UK’s criminal justice response to trafficking. Lon-don: Anti-Slavery International.
Arlacchi, P. (1983). La mafia imprenditrice. L’etica ma-fiosa e lo spirito del capitalismo. Bologna: Il Mulino.
Arlacchi, P. (2007). La mafia imprenditrice. Dalla Cala-bria al centro dell’inferno. Milano: Il Saggiato-re.
Bachman, R., & Schutt, R. K. (2010). The practice of research in criminology and criminal justice. Thousands Oaks, CA: SAGE.
Barresi, F. (1999). Mafia ed economia criminale. Analisi socio-criminologica e giuridica di un’economia sommersa e dei danni arrecati all’economia legale. Roma: EdUP.
Becchi, A., & Rey, G. M. (1994). L’economia criminale. Roma: Laterza.
Becker, G. S. (1968). Crime and punishment: An eco-nomic approach. Journal of Political Economy, 76(2), 169–217.
Berghuis, A. C., & de Waard, J. (2011). Geen kansen bieden aan de georganiseerde misdaad. Jus-titiële Verkenningen, 2.
Berlusconi, G. (2014). Italian Mafia. In G. Bruinsma & D. Weisburd (Eds.), Encyclopedia of Criminology and Criminal Justice (pp. 2699–2706).
Bertoni, A., & Rossi, E. (1997). I rapporti tra impresa cri-minale e l’economia legale di riferimento. La gestione del patrimonio cumulato con attività criminose. In A. Bertoni (Ed.), La criminalità come impresa. Milano: EGEA.
Bilefsky, D. (2014, March 18). Major Balkan drug traf-ficker arrested in Serbia, Authorities say. The New York Times. Retrieved from http://www.nytimes.com/2014/03/19/world/europe/balkan-drug-trafficker-arrested-in-serbia.html
Bini, M. (1997). Il polimorfismo dell’impresa criminale. In A. Bertoni (Ed.), La criminalità come impre-sa. Milano: EGEA.
Blum, J. A., Levi, M., Naylor, T. R., & Williams, P. (1999). Financial havens, banking secrecy and mon-ey-laundering. Criminal Justice Matters, 36(1), 22–23.
Boff, A. (2013). Shadow city: Exposing human traffick-ing in everyday London. London: GLA Conser-vatives.
Brå. (2006). Häleri. Den organiserade brottslighetens möte med den legala marknaden (No. 2006:6). Stockholm: Brottsförebyggande rå-det.
Brå. (2007a). Organiserat svartarbete i byggbranschen (No. 2007:27). Stockholm: Brottsförebyggan-de rådet.
Brå. (2007b). Vart tog alla pengarna vägen? En studie av narkotikabrottslighetens ekonomihantering (No. 2007:4). Stockholm: Brottsförebyggande rådet.
Brå. (2008a). Otillåten påverkan mot brottsoffer och vittnen. Om ungdomsbrott, relationsvåld och organiserad brottslighet (No. 2008:8). Stock-holm: Brottsförebyggande rådet.
126
Brå. (2008b). Slutrapport: RPE Servicefunktioner, ett kontroll och kartläggningsprojekt (No. 2008:2). Stockholm: Brottsförebyggande rå-det.
Brå. (2009). Polisens möte med organiserad brottslighet. En undersökning om otillåten påverkan (No. 2009:7). Stockholm: Brottsföre-byggande rådet.
Brå. (2011a). Penningtvätt. Rapportering och hanter-ing av misstänkta transaktioner (No. 2011:4). Stockholm: Brottsförebyggande rådet.
Brå. (2011b). Storskaliga skattebrott. En kartläggning av skattebrottslingens kostnader (No. 2011:7). Stockholm: Brottsförebyggande rådet.
Brå. (2012a). Brottslighet och trygghet i Malmö, Stock-holm och Göteborg. En kartläggning. Stock-holm: Brottsförebyggande rådet.
Brå. (2012b). Otillåten påverkan mot företag. En un-dersökning om utpressning (No. 2012:12). Stockholm: Brottsförebyggande rådet.
Brå. (2012c). Utpressning i Sverige. Tvistelösning, be-straffning och affärsidé (No. 2012:6). Stock-holm: Brottsförebyggande rådet.
Brå. (2014a). Gå på pengarna! Antologi om tillgång-sinriktad brottsbekämpning (No. 2014:10). Stockholm: Brottsförebyggande rådet.
Brå. (2014b). Korruption i Myndighetssverige. Otillåten påverkan mot insider (No. 2014:4). Stock-holm: Brottsförebyggande rådet.
Bratell, S. (2013, October 28). Spelskandalen I Landskrona växer. Aftonbladet Sport. Stock-holm. Retrieved from http://www.aftonbladet.se/sportbladet/fotboll/sverige/superettan/landskrona/article17736808.ab
Brink, B. (2003, November 23). Hells Angels fick byg-ga om polishus. SvD Nyheter. Stockholm. Retrieved from http://www.svd.se/nyheter/inrikes/hells-angels-f ick-bygga-om-poli -shus_122352.svd
Brodin, P., & Appelgren, G. (2013). Facing a new crimi-nal setting. Frankfurt: Bundeskriminalamt.
Bruinsma, G., & Bernasco, W. (2004). Criminal groups and transnational illegal markets. A more de-tailed examination on the basis of Social Net-work Theory. Crime, Law and Social Change, 41(1), 79–94.
Bruinsma, G., & Bovenkerk, F. (1996). De georgani-seerde criminaliteit in Nederland: De branch-es. The Hague: Sdu Uitgevers.
Brun, J.-P., Gray, L., Scott, C., & Stephenson, K. M. (2011). Asset recovery handbook. A guide for practitioners. Washington, DC: The World Bank - United Nations Office on Drugs and Crime.
Bučar-Ručman, A., & Frangež, D. (2014). Analiza trgov-ine z ljudmi z namenom izkoriščanja delovne sile, trgovine z otroki, prisilnega beračenja in izvrševanja kaznivih dejanj: Raziskovalno po-ročilo. Ljubljana: Fakulteta za varnostne vede za Urad vlade Republike Slovenije za komuni-ciranje.
Buscaglia, E., & Van Dijk, J. (2003). Controlling orga-nized crime and corruption in the public sec-tor. Forum on Crime and Society, 3(1-2), 3–34.
Bynum, T. (Eds). (1987). Organized crime in America: Concepts and controversies. New York: Crimi-nal Justice Press.
Calderoni, F. (2008). A definition that could not work: The EU Framework Decision on the fight against organised crime. European Journal of Crime, Criminal Law and Criminal Justice, 16(3), 265–282.
Calderoni, F. (2011). Where is the mafia in Italy? Mea-suring the presence of the mafia across Italian provinces. Global Crime, 12(1), 41–69.
Calderoni, F., & Caneppele, S. (Eds.). (2009). La geogra-fia criminale degli appalti. Le infiltrazioni della criminalità organizzata negli appalti pubblici nel Sud Italia. Milano: Franco Angeli.
Calderoni, F., Dugato, M., & Riccardi, M. (2010). Mafia Inc.: Analysis of the investments of the Italian mafia. Presented at the 10th European Soci-ety of Criminology, Liege.
Calderoni, F., & Riccardi, M. (2011). The investments of organized crime in Italy: An exploratory analy-sis. Presented at the 63rd American Society of Criminology, Washington, DC.
Campana, P. (2011). Eavesdropping on the Mob: The functional diversification of mafia activities across territories. European Journal of Crimi-nology, 8(3), 213–228.
Campana, P. (2013). Understanding then responding to Italian organized crime operations across ter-ritories. Policing, 7(3), 316–325.

127
Campbell, L. (2014). Organized crime and national se-curity: A dubious connection? New Criminal Law Review: An International and Interdisci-plinary Journal, 17(2), 220–251.
Caneppele, S., Calderoni, F., & Martocchia, S. (2009). Not only banks: Criminological models on the infiltration of public contracts by Italian orga-nized crime. Journal of Money Laundering Control, 12(2), 151–172.
Caneppele, S., Riccardi, M., & Standridge, P. (2013). Green energy and black economy: Mafia in-vestments in the wind power sector in Italy. Crime Law and Social Change, 59(3), 319–339.
Carlsson, M. (2013, August 14). Myndighet utnyttjas för bedrägeri. DN.EKONOMY. Stockholm. Re-trieved from http://www.dn.se/ekonomi/myn-dighet-utnyttjas-for-bedragerier/
Catanzaro, R. (1986). Impresa mafiosa, economia e si-stemi di regolazione sociale: Appunti sul caso si-ciliano. In G. Fiandaca & S. Costantino (Eds.), La legge antimafia tre anni dopo. Bilancio di un’e-sperienza applicativa. Milano: Franco Angeli.
Catanzaro, R. (1988). Il delitto come impresa. Storia so-ciale della mafia. Padova: Liviana.
CENSIS. (2009). Il condizionamento delle mafie sull’e-conomia, sulla società e sulle istituzioni del mezzogiorno. Roma: Centro Studi Investimenti Sociali.
Centorrino, M., & Signorino, G. (Eds.). (1997). Macro-economia della mafia. Roma: La Nuova Italia Scientifica.
Charron, N. (2013). From Åland to Ankara: European Quality of Government Index. University of Go-thenburg: The Quality of Government Institute.
Chiu, Y., Leclerc, B., & Townsley, M. (2011). Crime script analysis of drug manufacturing in clandestine laboratories: Implications for prevention. Brit-ish Journal of Criminology, 51(2), 355–374.
Ciconte, E. (2008). ’Ndrangheta. Soveria Mannelli: Rubbettino.
CIFAS. (2013). Staff fraudscape. Depicting the UK’s staff fraud landscape. London: The UK’s Fraud Prevention Service. Retrieved from https://www.cifas.org.uk/secure/contentPORT/up-loads/documents/Cifas%20Reports/Exter-nal-Staff_Fraudscape_Cifas_webversion.pdf
CNEL. (2011). La criminalità cinese in Italia. Caratteri-stiche e linee evolutive. Roma: Consiglio Na-zionale dell’Economia e del Lavoro.
Companies House. (2014). Statistical release. Compa-nies register activities 2013 - 2014. Cardiff: Companies House. Retrieved from https://www.gov.uk/government/uploads/system/uploads/attachment_data/file/380779/Com-paniesRegisterActivities2013-2014.pdf
Cornish, D. B., & Clarke, R. V. (2002). Analyzing orga-nized crimes. In A. R. Piquero & S. G. Tibbetts (Eds.), Rational choice and criminal behavior. Recent research and future challenges (pp. 41–63). New York, NY: Routledge.
Costantino, S., & Fiandaca, G. (Eds.). (1986). La legge antimafia tre anni dopo. Bilancio di un’espe-rienza applicativa. Milano: Franco Angeli.
Council of the European Union. Council Framework De-cision on the fight against organised crime, Pub. L. No. 2008/841/JHA (2008).
CPA. (2008). Relazione annuale sulla ’Ndrangheta. Roma: Commissione Parlamentare d’inchie-sta sul fenomeno della mafia e sulle altre as-sociazioni criminali similari.
Cressey, D. R. (1969). Theft of the nation: The structure and operations of organized crime in America. New York, NY: Harper and Row.
CSD. (2015). Financing of organised crime. Sofia: Cen-ter for the Study of Democracy. Retrieved from http://www.csd.bg/artShow.php?id=17368
Dagens Industri. (2007, May 12). Växlingskontor tros vara penningtvätt. DI.se. Stockholm. Retrieved from http://www.di.se/#!/artiklar/2007/5/12/vaxlingskontor-tros-vara-pengatvatt/
Daniele, V., & Marani, U. (2008). Organized crime and foreign direct investments: The Italian case. Munich: CESifo Group Munich.
De Sanctis, F.M. (2014). Football, gambling, and money laundering: A global criminal justice perspec-tive. New York: Springer.
DIA. (2012). Relazione del Ministro dell’Interno al Par-lamento sull’attività svolta e sui risultati con-seguiti dalla Direzione Investigativa Antimafia: Secondo semestre 2012. Roma: Ministero dell’Interno - Direzione Investigativa Antimafia. Retrieved from http://www.interno.it/dip_ps/dia/semestrali/sem/2011/1sem2011.pdf

128
DIA. (2014). Relazione del Ministero dell’interno sull’at-tività svolta e sui risultati conseguiti dalla Dire-zione Investigativa Antimafia: Primo semestre 2014. Roma: Ministero dell’Interno - Direzione Investigativa Antimafia. Retrieved from http://www1.interno.gov.it/mininterno/export/sites/default/it/assets/files/2/200623113012.pdf
DLIO. (2014). Outlawbikers in Nederland. Woerden: Na-tionale Politie.
Donato, L., Saporito, A., & Scognamiglio, A. (2013). Aziende sequestrate alla criminalità organiz-zata: Le relazioni con il sistema bancario (Oc-casional Papers No. 202). Roma: Banca d’Ita-lia. Retrieved from http://www.bancaditalia.it/pubblicazioni/qef/2013-0202/QEF_202.pdf
Dvoršek, A. (1993). Organizirani kriminal - Problem po-licije na prehodu v 21. stoletje (pp. 107–115). Ljubljana: Ministrstvo za notranje zadeve Re-publike Slovenije.
Dvoršek, A. (1995). Organizirani kriminal v Sloveniji. Zbornik Strokovno Znanstvenih Razprav, XVIII, 146–152.
Dvoršek, A. (2002). Strategija omejevanja organizirane-ga kriminala v Republiki Sloveniji. Bled: Visoka policijsko-varnostna šola.
EBM. (2010). Rapport om den ekonomiska brottsligheten. Stockholm: Ekobrottsmyn-digheten.
EBM. (2012). Underrättelsebild 2012. Stockholm: Eko-brottsmyndigheten.
EBM. (2013a). Ekobrottsmyndighetens lägesbild 2013. Stockholm: Ekobrottsmyndigheten.
EBM. (2013b). Factoring – Rapport om en servicefunk-tion – öppen version (No. 2). Stockholm: Eko-brottsmyndigheten.
Edelhertz, H., & Overcast, T. D. (1994). The business of organized crime: An assessment of orga-nized crime business-type activities and their implications for law enforcement. Loomis, CA: Palmer Press.
Edwards, A., & Gill, P. (2002). Crime as enterprise? The case of “transnational organised crime.” Crime Law and Social Change, 37(3), 203–223.
Elliott, C. (2013). Food supply networks: Integrity and assurance of food supply networks: interim re-port. London: HM Government. Retrieved from https://www.gov.uk/government/publica-tions/elliott-review-into-the-integrity-and-assur-ance-of-food-supply-networks-interim-report
Eriksen, J. (2012, January 31). Kriminella frisörer tv-ingar andra till fusk. Corren.se. Linköping. Re-trieved from http://www.corren.se/ostergot-land/artikel.aspx?articleid=5919970
European Union. Treaty on European Union and the Treaty on the Functioning of the European Union, Pub. L. No. 2012/C 326/01 (2012).
Europol. (2013a). SOCTA 2013. EU serious and organ-ised crime threat assessment. The Hague: Eu-ropean Police Office.
Europol. (2013b). Threat assessment: Italian organized crime. The Hague: European Police Office.
Fantò, E. (1999). L’impresa a partecipazione mafiosa. Economia legale ed economia criminale. Bari: Edizioni Dedalo.
FATF. (2004). Report on money laundering typologies. 2003-2004. Paris: The Financial Action Task Force.
FATF. (2006). The misuse of corporate vehicles, includ-ing trust and company service providers. Par-is: The Financial Action Task Force. Retrieved from http://www.fatf-gafi.org/media/fatf/documents/reports/Misuse%20of%20Corpo-rate%20Vehicles%20including%20Trusts%20and%20Company%20Services%20Providers.pdf
FATF. (2009a). Money laundering through the football sector. Paris: The Financial Action Task Force. Retrieved from http://www.fatf-gafi.org/top-ics/methodsandtrends/documents/money-launderingthroughthefootballsector.html
FATF. (2009b). Vulnerabilities of casinos and gaming sector. Paris: The Financial Action Task Force. Retrieved from http://www.fatf-gafi.org/top-ics/methodsandtrends/documents/vulnera-bilitiesofcasinosandgamingsector.html
Ferentzy, P., & Turner, N. (2009). Gambling and orga-nized crime: A review of the literature. Journal of Gambling Issues, (23), 111–155.

129
Fijnaut, C., Bovenkerk, F., Bruinsma, G., & van de Bunt, H. G. (1996). De georganiseerde criminalite-it in Nederland: Het eindrapport. The Hague: Sdu Uitgevers.
Fijnaut, C., Bovenkerk, F., Bruinsma, G., & van de Bunt, H. G. (1998). Organized crime in the Nether-lands. The Hague: Kluwer Law International.
Fijnaut, C., & Paoli, L. (Eds.). (2004). Organised crime in Europe: Concepts, patterns and control pol-icies in the European Union and beyond. Dor-drecht: Springer.
Finckenauer, J. O. (2005). Problems of definition: What is organized crime? Trends in Organized Crime, 8(3), 63–83.
Fiorentini, G. (2000). Organized crime and illegal mar-kets. In B. Bouckaert & G. De Geest (Eds.), En-cyclopedia of Law & Economics (Vol. 5). Chel-tenham: Edward Elgar.
Florio, P., Bosco, M., & D'Amore, L. (2014). Amministra-tore giudiziario. Sequestro, confisca, gestione dei beni, coadiutore dell'ANBSC. Roma: IPSOA.
Forgione, F. (2009). Mafia export: Come ’Ndrangheta, Cosa nostra e Camorra hanno colonizzato il mondo. Milano: Baldini Castoldi Dalai.
Francis, B., Humphreys, L., Kirby, S., & Soothill, K. (2013). Understanding criminal careers in organised crime. London: Home Office. Re-trieved from https://www.gov.uk/government/publications/understanding-criminal-ca-reers-in-organised-crime
Furlan-Rus, M. (2004, June 3). Plačilo ilegalcev prijavil davkariji. Dnevnik. Ljubljana. Retrieved from http://www.dnevnik.si/kronika/85070
Furlan-Rus, M. (2009, March 5). Prostitutke, a menda samo v prostem času: 100 evrov za uro med rjuhami, 60 evrov za pol ure. Dnevnik. Ljublja-na. Retrieved from http://www.dnevnik.si/kro-nika/1042249441
Gambetta, D., & Reuter, P. (1995). Conspiracy among the many: The mafia in legitimate industries. In G. Fiorentini & S. Peltzman (Eds.), The Eco-nomics of Organised Crime. Cambridge: Uni-versity Press.
Gambling Commission. (2013). Protecting betting in-tegrity. Birmingham: Gambling Commission.
Graebner Anderson, A. (1979). The business of orga-nized crime: A Cosa Nostra family. Standford: Hoover Institution Publication.
Granström, T. (2013, April 2). Frisör inför rätta i miljonåtal. Länstidningen Södertälje. Södertälje. Retrieved from http://lt.se/ny-heter/1.2027678-frisor-infor-ratta-i-miljonatal
Gratteri, N. (2011). Scuola ’ndrangheta. In S. Danna (Ed.), Prodotto interno mafia. Cosi la criminali-tà organizzata è diventata il sistema Italia (pp. 43–71). Torino: Einaudi.
GRETA. (2014). Report concerning the implementation of the Council of Europe Convention on action against trafficking in human beings by Slove-nia: First evaluation round. Strasbourg: The Group of Experts on Action against Trafficking in Human Beings. Retrieved from http://www.coe.int/t/dghl/monitoring/trafficking/Docs/Reports/GRETA_2013_20_FGR_SVN_pub-lic_en.pdf
Gup, B. E., & Beekarry, N. (2009). Limited liability com-panies (LLCs) and financial crimes. Journal of Money Laundering Control, 12(1), 7–18.
Hagan, F. (2006). “Organized crime” and “organized crime”: Indeterminate problems of definition. Trends in Organized Crime, 9(4), 127–137.
Hagen, H. J. (1998). Motor cycle gangs. Driebergen-Rij-senburg: Centrale Recherche Informatie.
Hales, G., & Hobbs, R. (2010). Drug markets in the com-munity: A London borough case study. Trends in Organized Crime, 13(1), 13–30.
Henning, G. (2013, November 28). Fyra spelare avstängda för läggmatch. Aftonbladet Sport. Stockholm. Retrieved from http://www.afton-bladet.se/sportbladet/fotboll/sverige/arti-cle17927995.ab
Herwartz, H., Tafenau, E., & Schneider, F. (2013). One share fits all? Regional variations in the extent of the shadow economy in Europe. Regional Studies, 49(9), 1575–1587.
Hobbs, D. (1998). Going down the glocal: The local con-text of organised crime. The Howard Journal of Criminal Justice, 37(4), 407–422.
Hobbs, D. (2001). The firm: Organizational logic and criminal culture on a shifting terrain. British Journal of Criminology, 41(4), 549–560.

130
Hobbs, D. (2013). Lush life: Constructing organized crime in the UK. Oxford: University Press.
Home Office. (2009). Extending our reach: A compre-hensive approach to tackling serious organised crime. London: Home Office. Retrieved from https://www.gov.uk/government/publications/extending-our-reach-a-comprehensive-ap-proach-to-tackling-serious-organised-crime
Home Office. (2011). Local to global: Reducing the risk from organised crime. London: Home Office. Retrieved from https://www.gov.uk/govern-ment/publications/organised-crime-strategy
Home Office. (2013). Serious and organised crime strategy. London: Home Office. Retrieved from https://www.gov.uk/government/publica-tions/serious-organised-crime-strategy
Hornsby, R., & Hobbs, D. (2007). A zone of ambiguity: The political economy of cigarette bootlegging. British Journal of Criminology, 47(4), 551–571.
Huisman, S. (2005). Criminaliteitsbeeldanalyse: Syn-thetische drugs 2002-2004. Driebergen: KLPD - Dienst Nationale Recherche.
Iadeluca, F. (2012). La criminalità mafiosa straniera in Italia. Le mafie straniere nel nostro Paese: Struttura criminale, attività illecite, alleanze. Roma: Armando Curcio Editore.
Ianni, F. A. J., & Reuss-Ianni, E. (1972). A family busi-ness: Kinship and social control in organized crime. New York, NY: Russell Sage Foundation.
ISF. (2011). Bidragsbrott och skattebrott: Välfärdens dubbla kriminalitet (No. 12). Stockholm: Ins-pektionen för socialförsäkringen & Brottsföre-byggande rådet.
Johansson, M. (2013, April 9). Slåss för firman – och Hells Angels. SVT Nyheter. Stockholm. Re-trieved from http://www.svt.se/ug/hells-an-gels-med-nar-aik-spelare-skulle-overtygas
Kayhan, B. (2013, July 8). AIK fick 12 miljoner från misstänkta bedrägerier. P3 Nyheter. Stock-holm. Retrieved from http://sverigesradio.se/sida/artikel.aspx?programid=1646&ar-tikel=5586652
Kelly, R. J. (1999). The upperworld and the underworld: Case studies of racketeering and business infiltration in the United States. New York: Springer.
KFM. (2010). Missbruk av statlig lönegaranti (Del-rapport). Stockholm: Tillsynsmyndigheten i konkurser.
Kleemans, E. R. (2007). Organized crime, transit crime, and racketeering. In M. Tonry & C. Bijleveld (Eds.), Crime and justice in the Netherlands: A review of research (pp. 163–215). Chicago: The University of Chicago Press.
Kleemans, E. R. (2014). Theoretical perspectives on organized crime. In L. Paoli (Ed.), The Oxford handbook on organized crime (pp. 163–215). Oxford: Oxford University Press.
Kleemans, E. R., Brienen, M. E. I., van de Bunt, H. G., Kouwenberg, R. F., Paulides, G., & Barensen, J. (2002). Georganiseerde criminaliteit in Ned-erland: Tweede rapportage op basis van de WODC-monitor. Den Haag: Wetenschappelijk Onderzoek- en Documentatiecentrum.
Kleemans, E. R., van de Bunt, H. G., van den Berg, E. A. I. M., Brewers, M., Kouwenberg, R. F., & Pau-lides, G. (1998). Georganiseerde criminaliteit in Nederland: Rapportage op basis van de WODC-monitor. Den Haag: Wetenschappelijk Onderzoek- en Documentatiecentrum.
Klemenčič, G., Praprotnik, R., & Selinšek, L. (2013). Ja-vno pismo senata Komisije za preprečevanje korupcije. Ljubljana: Komisija za preprečev-anje korupcije. Retrieved from https://www.kpk-rs.si/upload/t_datoteke/Javno_pismo_KPK_3.12.2013.pdf
Ključevšek, M. C., Fiehn, A., Hiršl, A., Knafelc, M., & Peterca, N. (2012). Prestrukturiranje in indu-strijski odnosi v transportnem sektorju - kako zaposlovati v c\vasu krize. Ljubljana: Zdruz\venje delodajalcev Slovenije.
Komisija za preprečevanje korupcije. (2014). SUPERVI-ZOR. Retrieved from http://supervizor.kpk-rs.si/
Korsell, L., Skinnari, J., & Vesterhav, D. (2009). Organ-iserad brottslighet i Sverige. Stockholm: Liber.
Kruisbergen, E. W., Kleemans, E. R., & Kouwenberg, R. F. (2015). Profitability, power, or proximity? Or-ganized crime offenders investing their money in legal economy. European Journal of Crimi-nal Policy and Research, 21(2), 237–256.

131
Kruisbergen, E. W., Kleemans, E. R., & van de Bunt, H. G. (2012). Georganiseerde criminaliteit in Nederland: Vierde rapportage op basis van de Monitor Georganiseerde Criminaliteit. Den Haag: WODC and Ministerie van Veiligheid en Justitie.
Larsson, P. (2008). Organisert kriminalitet. Oslo: Pax Forlag.
Laul, R. (2013, April 9). ”Firman” kopplad till Hells Angels. Aftonbladet. Stockholm. Retrieved from http://www.aftonbladet.se/sportbla-det/fotboll/sverige/allsvenskan/aik/arti-cle16565283.ab
Lavezzi, A. M. (2008). Economic structure and vulnera-bility to organised crime: Evidence from Sicily. Global Crime, 9(3), 198–220.
Lavorgna, A., Lombardo, R., & Sergi, A. (2013). Orga-nized crime in three regions: Comparing the Veneto, Liverpool, and Chicago. Trends in Or-ganized Crime, 16(3), 265–285.
Levi, M. (2014). Thinking about organised crime. The RUSI Journal, 159(1), 6–14.
Levi, M., & Maguire, M. (2004). Reducing and prevent-ing organised crime: An evidence-based cri-tique. Crime, Law and Social Change, 41(5), 397–469.
L’Hoiry, X. D. (2013). “Shifting the stuff wasn’t any both-er”: Illicit enterprise, tobacco bootlegging and deconstructing the British government’s ciga-rette smuggling discourse. Trends in Organi-zed Crime, 16(4), 413–434.
Lo Bello, I. (2011). Mafia e mercato. In S. Danna (Ed.), Prodotto interno mafia. Così la criminalità or-ganizzata è diventata il sistema Italia. Torino: Einaudi.
Logonder, A. (2013). Kriminološka analiza notranjih in zunanjih odnosov članov organiziranih krimi-nalnih skupin iz Srbije : (doktorska disertaci-ja). Univerza v Ljubljani, Pravna fakulteta. Re-trieved from http://cobiss6.izum.si/scripts/cobiss?command=DISPLAY&base=99999&ri-d=1728078&fmt=11&lani=si
Lovrenc, V. (2010, September 4). Mamilarska veriga Buli. Večer. Maribor.
Lovšin, P. (2013, October 28). Tožilstvo terja od zvod-niškega para za poldrugi milijon premoženja. Dnevnik. Ljubljana. Retrieved from http://www.dnevnik.si/kronika/tozilstvo-terja-od-zvodnis-kega-para-za-poldrugi-milijon-premozenja#
Macaulay, M. (2011). Corruption in the UK: Part two-as-sessment of key sectors. Transparency In-ternational UK. Retrieved from http://www.transparency.org.uk/publications/15-publica-tions/92-corruption-in-the-uk-part-two-assess-ment-of-key-sectors
Maltz, M. D. (1996). Criminality in space and time: Life course analysis and the micro-ecology of crime. In J. Eck & D. Weisburd (Eds.), Crime and place. Monsey, NY: Criminal Justice Press.
Marine, F. J. (2010). The effects of organized crime on legitimate businesses. Journal of Financial Cri-me, 13(2), 214–234.
Masciandro, D., & Ruozi, R. (1999). Mercati e illegalità: Economia e rischio criminalità in Italia. Mila-no: Egea.
M. Č. (2011, June 21). Balkanski bojevnik: Na sojenju so omenjali tudi pranje denarja. DELO. Lju-bljana. Retrieved from http://www.delo.si/novice/kronika/balkanski-bojevnik-na-sojen-ju-so-omenjali-tudi-pranje-denarja.html
Mills, C. (2013). Waste system open to organised crime - Report into Derry dumping. Belfast: Northern Ireland Environment Agency.
Modic, T., & Kralj, M. (2014, December 1). Z macolo nad slamnate goljufe, ti še naprej podjetniki. Dnevnik. Ljubljana. Retrieved from http://www.dnevnik .s i/posel/novice/z-maco -lo-nad-slamnate-goljufe-ti-se-naprej-podjetniki
Modic, T., & Vuković, V. (2014, February 27). Kako je Marko Jaklič opral pol milijona evrov Vza-jemne. Dnevnik. Ljubljana. Retrieved from http://www.dnevnik.si/posel/novice/kako-je-marko-jaklic-opral-pol-milijona-evrov-vzajemne
Murji, K. (2007). Hierarchies, markets and networks: Ethnicity/race and drug distribution. Journal of Drug Issues, 37(4), 781–804.
Ni Č. (2014a, September 16). Igor Bavčar vložil zahtevek za varstvo zakonitosti. DELO. Ljublja-na. Retrieved from http://www.delo.si/novice/kronika/igor-bavcar-vlozil-zahtevek-za-varst-vo-zakonitosti.html

132
Ni Č. (2014b, December 13). Srbski cariniki odkrili her-oin v slovenskem tovornjaku-hladilniku. Tovo-rnjak s slaščičarskimi izdelki je bil na poti iz Turčije v BiH. DELO. Ljubljana.
Nordh, M. (2013). Utvärdering av Polisens arbete mot idrottsrelaterad brottslighet (No. 5). Stock-holm: Rikspolisstyrelsens utvärderingsfunk-tion.
Noroozi, E., & Lind, K. (2013, January 9). Organise-rad brottslighet på växlingskontoren. SR P4 Nyheter. Retrieved from http://sverigesra-dio.se/sida/artikel.aspx?programid=96&ar-tikel=5403002
Organised Crime Task Force. (2013). Annual report & threat assessment: Organised crime in North-ern Ireland. Belfast: Department of Justice.
Pajnik, M., & Kavčič, U. (2008). Sodne prakse, pov-ezane s trgovanjem z ljudmi in prostitucijo v Sloveniji. Revija Za Kriminalistiko in Krimi-nologijo, 59(2), 141–154.
Paoli, L. (2002). The paradoxes of organized crime. Crime, Law and Social Change, 37(1), 51–97.
Paoli, L. (2003). Mafia brotherhoods: Organized crime, Italian style. Oxford: Oxford University Press.
Paoli, L. (2004a). Italian organised crime: Mafia associ-ations and criminal enterprises. Global Crime, 6(1), 19–31.
Paoli, L. (2004b). Organised crime in Italy: Mafia and illegal markets–exception and normality. In C. Fijnaut & L. Paoli (Eds.), Organised crime in Europe: Concepts, patterns and control poli-cies in the European Union and beyond (pp. 263–302).
P., B. (2012, March 28). Čista lopata: sodba v petek. DELO. Ljubljana. Retrieved from http://www.delo.si/novice/kronika/cista-lopata-sod-ba-v-petek.html
PBL. (2013). Integration and convergence in regional Europe: European regional trade flows from 2000 to 2010. The Hague: PBL Netherlands Environmental Assessment Agency. Retrieved from http://www.pbl.nl/sites/default/files/cms/publicaties/PBL_2013_European%20Regional%20Trade%20Flows%20from%202000-2010_1036.pdf
PCF. (2013). Research report for internal use for the Project OCP (Unpublished). Helsinki: Police College of Finland.
Pennings, L., Bruinsma, G. J. N., & Weerman, F. M. (2006). Jeugd en georganiseerde misdaad. Een verkenning van de betrokkenheid van jon-geren bij illegale handel. Tijdschrift Voor Crim-inologie, 48(1), 51–66.
Plevnik, A., Rejec Brancelj, I., & Zupan, N. (2008). Okol-je in promet: Slovenija. Ljubljana: Ministrstvo za okolje in prostor, Agencija Republike Slo-venije za okolje.
Policija. (2003). Police annual report 2002. Ljubljana: Ministrstvo za notranje zadeve. Retrieved from http://www.policija.si/images/stories/Statis-tika/LetnaPorocila/PDF/lp2002.pdf
Possnig, G. (2012, April 24). Zasegli 85 kilogram-ov konoplje. Večer. Maribor. Retrieved from http://ris.vecer.com/arhivi/clanek.aspx?id=302137712271352257505A767837&tip=A&-Tabela=2012
Predanič, J. (2008, September 3). Heroin, “podjet-ništvo” in socialna pomoč. Večer. Mari-bor. Retrieved from http://ris.vecer.com/arhivi/clanek.aspx?id=3021336F406F -385F57505A767837&tip=A&Tabela=2008
Ravenda, D., Argilés-Bosch, J. M., & Valencia-Silva, M. M. (2015). Detection model of legally regis-tered mafia firms in Italy. European Manage-ment Review, 12(1), 23–29.
Riccardi, M. (2014). When criminals invest in business-es: Are we looking in the right direction? An ex-ploratory analysis of companies controlled by mafias. In F. Calderoni & S. Caneppele (Eds.), Organized crime, corruption and crime pre-vention. Essays in honor of Ernesto U. Savona. New York: Springer.
RKP. (2010). Penningtvätt inom den grova organise-rade brottsligheten (No. 2). Stockholm: Rik-skriminalpolisen.
RKP. (2012a). Finanspolisens årsrapport 2011 (No. 1). Stockholm: Rikskriminalpolisen.
RKP. (2012b). Polisens lägesbild av organiserad brottslighet 2012 (No. 2). Stockholm: Rik-skriminalpolisen.
133
RKP. (2013). Finanspolisens årsrapport 2012. Stock-holm: Rikskriminalpolisen.
Ropac, I. (2014, May 16). Balkanskemu bojevniku grozi odvzem premoženja. DELO. Ljublja-na. Retrieved from http://www.delo.si/nov-ice/kronika/balkanskemu-bojevniku-gro-zi-odvzem-premozenja.html
Rozekrans, R., & Emde, E. J. (1996). Organized crime: Towards the preventive screening of indus-tries: A conceptual model. Security Journal, 7(3), 169–176.
Ruggiero, V. (1996). Economie sporche: L’impresa cri-minale in Europa. Torino: Bollati Boringhieri.
Ruggiero, V. (2000). Crime and markets: Essays in an-ti-criminology. New York, NY: Oxford University Press.
Ruggiero, V. (2008). “E’ l’economia, stupido!” Una clas-sificazione dei crimini di potere. Questione Gi-ustizia, 3, 188–208.
Ruggiero, V., & Khan, K. (2006). British South Asian communities and drug supply networks in the UK: A qualitative study. International Journal of Drug Policy, 17(6), 473–483.
Sacco, S. (2010). La mafia in cantiere. L’incidenza del-la criminalità organizzata nell’economia: Una verifica empirica nel settore delle costruzioni. Palermo: Centro di studi ed iniziative culturali Pio La Torre.
SAMEB. (2011). Missbruk av statlig lönegaranti (Slu-trapport). Stockholm: SAMEB (Collaboration against economic crime).
Santino, U. (2006). Dalla mafia alle mafie - Scienze so-ciali e crimine organizzato. Soveria Mannelli: Rubbettino.
Santino, U., & La Fiura, G. (1990). L’impresa mafiosa. Dall’Italia agli Stati Uniti. Milano: Franco Ange-li.
Savona, E. U. (2010). Infiltration of the public construc-tion industry by Italian organised crime. In K. Bullock, R. V. Clarke, & N. Tilley (Eds.), Situ-ational prevention of organized crimes (pp. 130–150). Cullompton: Willan Publishing.
Savona, E. U., & Riccardi, M. (2011). Come proteggere l’economia legale e gli imprenditori: gli stru-menti di intervento. Presented at the Legalità e cultura d’impresa: risorse per il territorio, MIlano.
Savona, E. U., & Riccardi, M. (Eds.). (2015). From illegal markets to legitimate businesses: The portfo-lio of organised crime in Europe. Trento: Tran-scrime – Università degli Studi di Trento.
Scaglione, A. (2011). Reti mafiose. Cosa Nostra e Ca-morra: Organizzazioni criminali a confronto. Milano: Franco Angeli.
Schneider, S. (2004). The incorporation and operation of criminally controlled companies in Canada. Journal of Money Laundering Control, 7(2), 126–138.
Sciarrone, R. (2009). Mafie vecchie, mafie nuove: Radi-camento ed espansione. Roma: Donzelli.
Siddle, J. (2013, October). Anatomy of Cocky’s crime empire: Curtis Warren and his “£200m world-wide web.” Liverpool Echo. Retrieved from http://www.liverpoolecho.co.uk/news/liver-pool-news/anatomy-cockys-crime-empire-cur-tis-6225546
Silverstone, D. (2011). From Triads to snakeheads: Or-ganised crime and illegal migration within Brit-ain’s Chinese community. Global Crime, 12(2), 93–111.
Silverstone, D., & Savage, S. (2010). Farmers, factories and funds: Organised crime and illicit drugs cultivation within the British Vietnamese com-munity. Global Crime, 11(1), 16–33.
Silverstone, H., & Sheetz, M. (2007). Forensic account-ing and fraud investigation for non-experts. Hoboken, NJ: Wiley.
Skatteverket. (2009a). Uthyrning av arbetskraft “Svart-jobbsgranskningen” 2006-2008 (Slutrapport No. 2). Solna: Skatteverket.
Skatteverket. (2009b). Utvärdering av städutredningar (No. 1). Solna: Skatteverket.
Skinnari, J., & Stenström, A. (2012, December). Extor-tion from organised crime in Sweden. Present-ed at the Conference on Extortion Racket Sys-tems, Vienna.
Smith, D. C. (1975). The Mafia mystique. New York, NY: Basic Books.
Smith, D. C. (1980). Paragons, pariahs, and pirates: A spectrum-based theory of enterprise. Crime & Delinquency, 26(3), 358–386.

134
SOJ SGDP GPU. (2014). Turn Back Crime - začetek Inter-polove svetovne kampanje o nevarnostih orga-niziranega kriminala. Revija Varnost, LXII(2), 44–46.
Soriani, C. (2013). Le aziende mafiose: Forme giuridi-che e modalità di controllo. Università Cattoli-ca Del Sacro Cuore, Milano.
SOU. (2012). Åtgärder mot fusk och felaktigheter med assistansersättning (No. 2012:6). Stockholm: Statens Offentliga Utredningar.
SOU. (2014). Förändrad assistansersättning – en över-syn av ersättningssystemet (No. 2014:9). Stockholm: Statens Offentliga Utredningar.
STA. (2013, March 21). Slovenian Judicial System Show-ing More Effectiveness. The Slovenia Times. Ljubljana. Retrieved from http://www.sloveni-atimes.com/slovenian-judicial-system-show-ing-more-effectiveness.
STA. (2014, October 8). Sojenje v zadevi Čista lopata po mnenju vrhovnih sodnikov zakonito. Dnevnik. Ljubljana. Retrieved from http://www.dnevnik.si/kronika/sojenje-v -zadevi-cista- lopa -ta-po-mnenju-vrhovnih-sodnikov-zakonito
Steinko, A. F. (2012). Financial channels of money laun-dering in Spain. British Journal of Criminology, 52(5), 908–931.
Stojiljković, G. (2014a, July 11). Vzpon in padec Igor-ja Bavčarja. Planet Siol. Ljubljana. Retrieved from http://www.siol.net/novice/crna_kroni-ka/2014/07/bavcar.aspx
Stojiljković, G. (2014b, November 19). Policijski ataše v BiH Janko Goršek: Islamski terorizem ni več dva tisoč kilometrov daleč. Planet Siol. Ljublja-na. Retrieved from http://www.siol.net/nov-ice/slovenija/2014/11/gorsek_intervju.aspx
Strömberg, M. (2012, April 3). Fakturaskojare göder Malmös maffia. Fokus. Stockholm. Retrieved from http://www.fokus.se/2012/04/faktu-raskojarna-goder-malmos-maffia/
Suendorf, U. (2001). Geldwäsche: Eine kriminologische Untersuchung. Neuwied: Hermann Luchter-hand Verlag.
The Dutch Parliament. (1996). Inzake opsporing: En-quêtecommissie opsporings-methoden. The Hague: Tweede Kamer der Staten-Generaal.
The Serious Organised Crime Task Force. (2010). Let-ting our communities flourish - One year on: A strategy for tackling serious organised crime in Scotland. Edinburgh: Scottish Government. Retrieved from http://www.scotland.gov.uk/Publications/2010/06/01111748/0
Thompson, T. (2002, November). Heroin “emperor” brings terror to UK streets. The Observer. Re-trieved from http://www.theguardian.com/uk/2002/nov/17/drugsandalcohol.ukcrime1
Tonry, M., & Bijleveld, C. (2007). Crime and Justice in the Netherlands. Chicago and London: The University of Chicago Press.
Transcrime. (2000). Euroshore: Protecting the EU finan-cial system from the exploitation of financial centres and off-shore facilities by organised crime: Final report. Trento: Università di Tren-to.
Transcrime. (2008a). Implementazione analisi crimina-le. Macroattività 3 – Sottoattività 3.A. Rappor-to RisI.C.O. – Le interviste. Unpublished.
Transcrime. (2008b). Implementazione analisi crimina-le. Macroattività 3 – Sottoattività 3.B. Rappor-to RisI.C.O. – I casi di studio. Unpublished.
Transcrime. (2008c). Implementazione analisi crimina-le - Ris.I.C.O. Roma: Ministero dell’Interno.
Transcrime. (2013a). METRiC. Monitoraggio dell’Eco-nomia Trentina contro il Rischio Criminalità. Trento: Provincia Autonoma di Trento.
Transcrime. (2013b). Progetto PON Sicurezza 2007-2013: Gli investimenti delle mafie. Rapporto linea 1. Milano: Ministero dell’Interno.
Unger, B., & Ferwerda, J. (2011). Money laundering in the real estate sector. Suspicious properties. Cheltenham: Edward Elgar.
Uradni list Republike Slovenije. Pravilnik o pogojih za pridobitev licenc za prevoze v cestnem pro-metu, načinu in postopku njihove pridobitve ter o načinu vodenja evidence o izdanih li-cencah, Pub. L. No. 33/1996 (1996). Re-trieved from http://www.uradni-list.si/1/con-tent?id=11020
135
Uradni list Republike Slovenije. Pravilnik o programu preizkusa strokovne usposobljenosti ter o postopku in načinu opravljanja preizkusa za pridobitev licence za prevoze v cestnem pro-metu, Pub. L. No. 33/1996 (1996). Retrieved from http://www.uradni-list.si/1/objava.jsp?urlurid=19962124
Uradni list Republike Slovenije. Zakon o gospodarskih družbah ZGD-1, Pub. L. No. 42/2006 (2006). Retrieved from http://www.uradni-list.si/1/ob-java.jsp?urlurid=20061799
van de Bunt, H. G., & Kleemans, E. R. (2007). Geor-ganiseerde criminaliteit in Nederland: Derde rapportage op basis van de Monitor Georgan-iseerde Criminaliteit. Den Haag: Wetenschap-pelijk Onderzoek- en Documentatiecentrum.
van de Bunt, H. G., Siegel, D., & Zaitch, D. (2014). The social embeddedness of organized crime. In L. Paoli (Ed.), The Oxford handbook on organized crime (pp. 321–339). Oxford: Oxford Universi-ty Press.
Vander Beken, T. (2004). Risky business: A risk-based methodology to measure organized crime. Crime, Law and Social Change, 41(5), 471–516.
Vander Beken, T. (Ed.). (2005). Organised crime and vulnerability of economic sectors. The Europe-an transport and music sector. Antwerp-Apel-doorn: Maklu Publishers.
Vander Beken, T. (2007). The European waste industry and crime vulnerabilities. Antwerp-Apeldoorn: Maklu Publishers.
Vander Beken, T., & van Daele, S. (2008). Legitimate businesses and crime vulnerabilities. Interna-tional Journal of Social Economics, 35(10), 739–750.
van der Does de Willebois, E., Halter, E. M., Harrison, R. A., Park, J. W., & Sharman, J. C. (2011). The puppet masters: How the corrupt use legal structures to hide stolen assets and what to do about it. Washington, DC: The World Bank.
van Dijk, J. (2007). Mafia markers: Assessing organized crime and its impact upon societies. Trends in Organized Crime, 10(4), 39–56.
van Dijk, J. (2008). The world of crime. Breaking the si-lence on problems of security, justice and de-velopment across the world. Thousand Oaks - London: SAGE.
van Duyne, P. C. (1996). Organized crime in Europe. Commack, NY: Nova Science Publishers.
van Duyne, P. C., & Soudijn, M. R. J. (2009). Hot money, hot stones and hot air: Crime-money threat, real estate and real concern. Journal of Money Laundering Control, 12(2), 173–188.
van Duyne, P. C., von Lampe, K., van Dijck, M., & New-ell, J. L. (Eds.). (2005). The organised crime economy: Managing crime markets in Europe. Nijmegen: Wolf Legal Publishers.
van Koppen, M. V., de Poot, C. J., Kleemans, E. R., & Nieuwbeerta, P. (2010). Trajectories in orga-nized crime. British Journal of Criminology, 50(1), 102–123.
Varese, F. (2011). Mafias on the move: How organized crime conquers new territories. Princenton, NJ: Princeton University Press.
von Lampe, K. (2006). The cigarette black market in Germany and in the United Kingdom. Journal of Financial Crime, 13(2), 235–254.
Webb, S., & Burrows, J. (2009). Organised immigration crime: A post-conviction study. London: Home Office.
Wilkins, C. D., & Casswell, S. (2003). Organized crime in cannabis cultivation in New Zealand: An eco-nomic analysis. Contemporary Drug Problems, 30(4), 757–777.
Windle, J. (2013). Tuckers firm: A case study of British organised crime. Trends in Organized Crime, 16(4), 382–396.
Žist, D. (2006). Namesto plesa vdajanje prostituciji. Večer. Maribor.
Zupančič, A. (2011, September 16). Slovenci so preveč navezani na avtomobile. Dnevnik. Ljubljana. Retrieved from http://www.dnevnik.si/magaz-in/svet-vozil/1042473247
Žužek, A. (2014). Novi taksiji rastejo kot gobe po dežju. Retrieved from http://www.siol.net/novice/gospodarstvo/lestvice_bizi_si/2014/05/tak-sisti_prevec.aspx

![Introduction - TU Chemnitzsevc/IrrHodgeHyper.pdfsequence proved in [ESY17], one obtains a ltration on the twisted de Rham cohomology, called irregular Hodge ltration of the regular](https://img.pdfslide.us/doc/110x75/5fdd72812cb1123a817ca9de/introduction-tu-chemnitz-sevcirrhodgehyperpdf-sequence-proved-in-esy17-one.jpg)