Embed Size (px)
Citation preview

Draw Guide
Chapter 9 Organization Charts, Flow Diagrams, and More
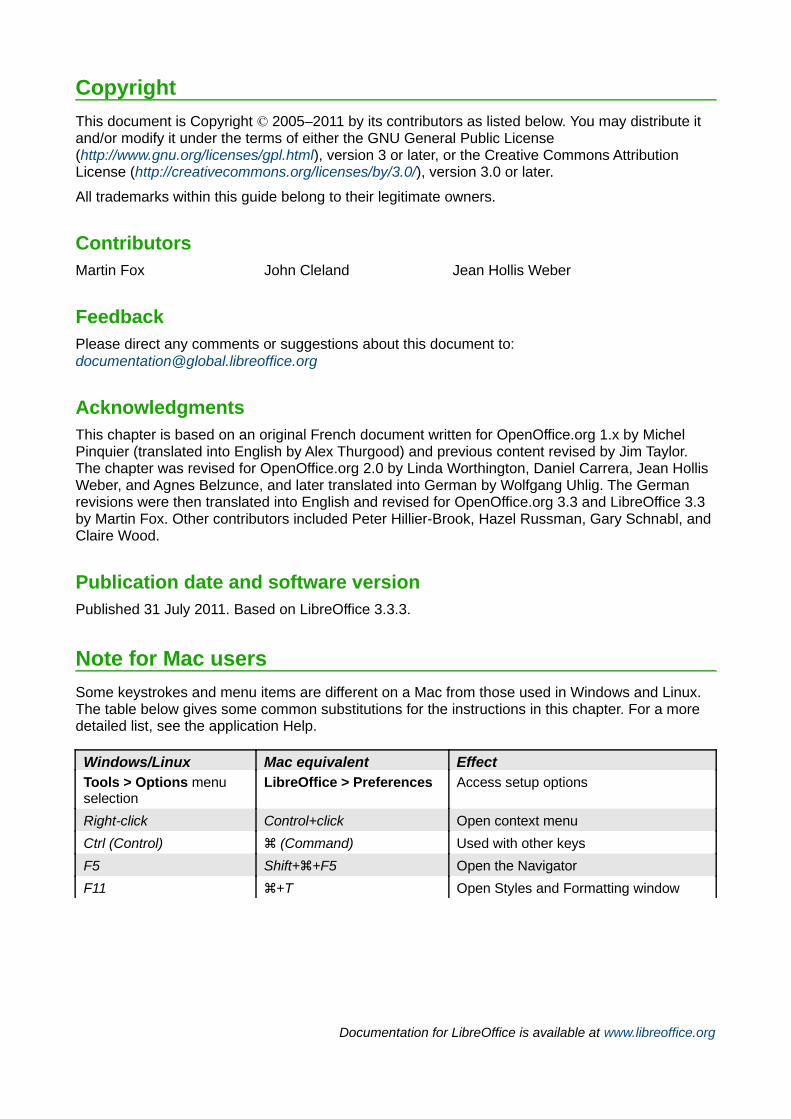
Copyright
This document is Copyright © 2005–2011 by its contributors as listed below. You may distribute it and/or modify it under the terms of either the GNU General Public License (http://www.gnu.org/licenses/gpl.html), version 3 or later, or the Creative Commons Attribution License (http://creativecommons.org/licenses/by/3.0/), version 3.0 or later.
All trademarks within this guide belong to their legitimate owners.
ContributorsMartin Fox John Cleland Jean Hollis Weber
FeedbackPlease direct any comments or suggestions about this document to: [email protected]
AcknowledgmentsThis chapter is based on an original French document written for OpenOffice.org 1.x by Michel Pinquier (translated into English by Alex Thurgood) and previous content revised by Jim Taylor. The chapter was revised for OpenOffice.org 2.0 by Linda Worthington, Daniel Carrera, Jean Hollis Weber, and Agnes Belzunce, and later translated into German by Wolfgang Uhlig. The German revisions were then translated into English and revised for OpenOffice.org 3.3 and LibreOffice 3.3 by Martin Fox. Other contributors included Peter Hillier-Brook, Hazel Russman, Gary Schnabl, and Claire Wood.
Publication date and software versionPublished 31 July 2011. Based on LibreOffice 3.3.3.
Note for Mac users
Some keystrokes and menu items are different on a Mac from those used in Windows and Linux. The table below gives some common substitutions for the instructions in this chapter. For a more detailed list, see the application Help.
Windows/Linux Mac equivalent EffectTools > Options menu selection
LibreOffice > Preferences Access setup options
Right-click Control+click Open context menu
Ctrl (Control) z (Command) Used with other keys
F5 Shift+z+F5 Open the Navigator
F11 z+T Open Styles and Formatting window
Documentation for LibreOffice is available at www.libreoffice.org

Contents
Copyright......................................................................................................................................... 2
Note for Mac users...........................................................................................................................2
Drawing an organization chart..........................................................................................................4
Drawing a flow diagram....................................................................................................................6
Glue points and connectors.............................................................................................................8
The Connector toolbar.................................................................................................................8
Drawing connectors—basics.......................................................................................................9
Editing glue points.....................................................................................................................10
Adding text to connectors...............................................................................................................11
Adjusting text to suit the connecting line....................................................................................13
Organization Charts, Flow Diagrams, and More 3
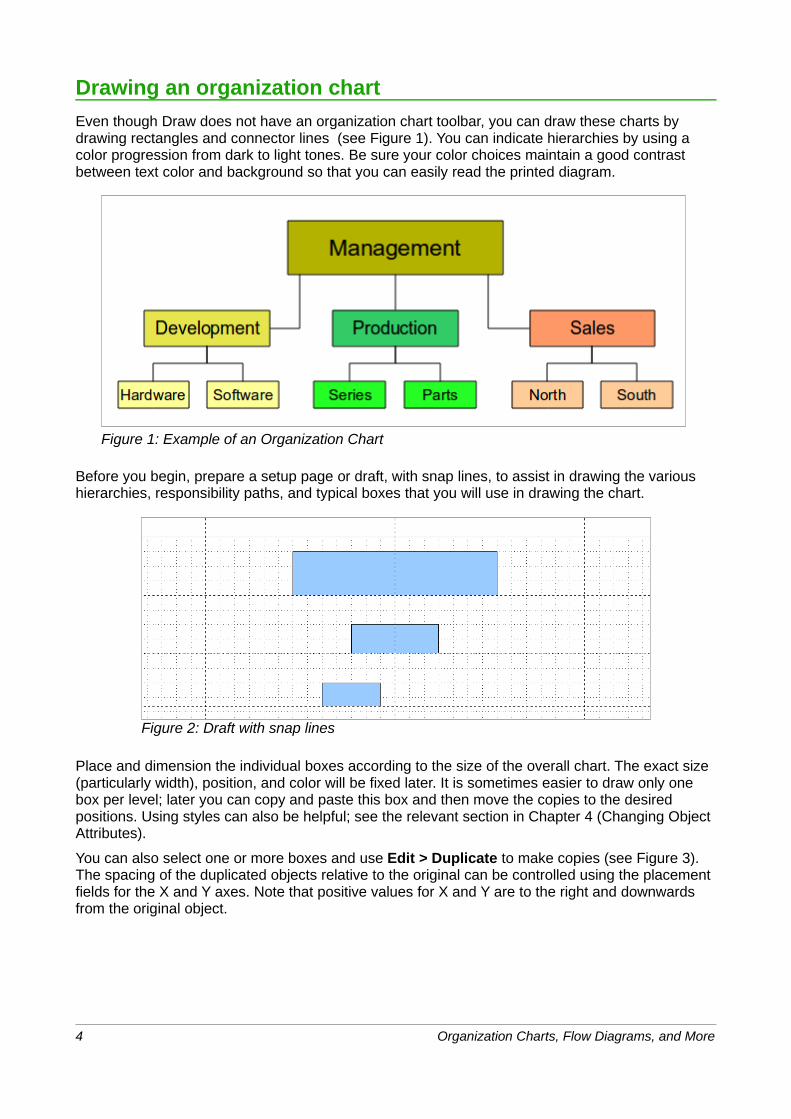
Drawing an organization chart
Even though Draw does not have an organization chart toolbar, you can draw these charts by drawing rectangles and connector lines (see Figure 1). You can indicate hierarchies by using a color progression from dark to light tones. Be sure your color choices maintain a good contrast between text color and background so that you can easily read the printed diagram.
Figure 1: Example of an Organization Chart
Before you begin, prepare a setup page or draft, with snap lines, to assist in drawing the various hierarchies, responsibility paths, and typical boxes that you will use in drawing the chart.
Figure 2: Draft with snap lines
Place and dimension the individual boxes according to the size of the overall chart. The exact size (particularly width), position, and color will be fixed later. It is sometimes easier to draw only one box per level; later you can copy and paste this box and then move the copies to the desired positions. Using styles can also be helpful; see the relevant section in Chapter 4 (Changing Object Attributes).
You can also select one or more boxes and use Edit > Duplicate to make copies (see Figure 3). The spacing of the duplicated objects relative to the original can be controlled using the placement fields for the X and Y axes. Note that positive values for X and Y are to the right and downwards from the original object.
4 Organization Charts, Flow Diagrams, and More
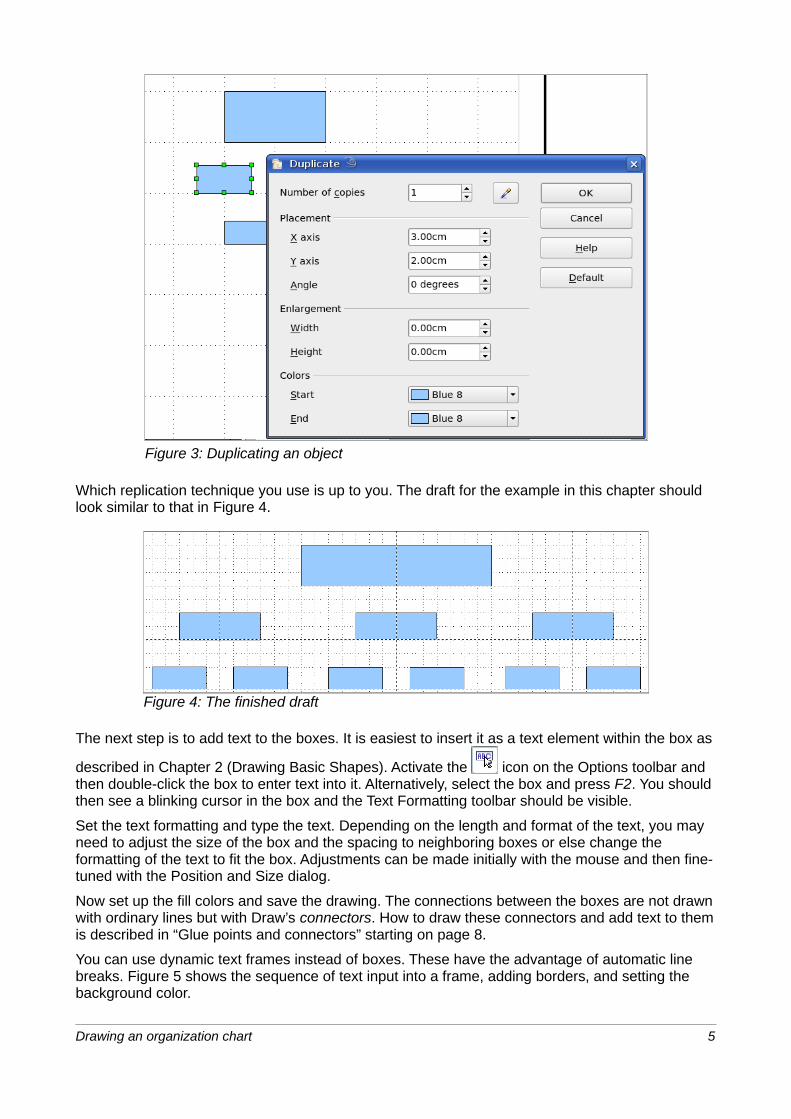
Figure 3: Duplicating an object
Which replication technique you use is up to you. The draft for the example in this chapter should look similar to that in Figure 4.
Figure 4: The finished draft
The next step is to add text to the boxes. It is easiest to insert it as a text element within the box as
described in Chapter 2 (Drawing Basic Shapes). Activate the icon on the Options toolbar and then double-click the box to enter text into it. Alternatively, select the box and press F2. You should then see a blinking cursor in the box and the Text Formatting toolbar should be visible.
Set the text formatting and type the text. Depending on the length and format of the text, you may need to adjust the size of the box and the spacing to neighboring boxes or else change the formatting of the text to fit the box. Adjustments can be made initially with the mouse and then fine-tuned with the Position and Size dialog.
Now set up the fill colors and save the drawing. The connections between the boxes are not drawn with ordinary lines but with Draw’s connectors. How to draw these connectors and add text to them is described in “Glue points and connectors” starting on page 8.
You can use dynamic text frames instead of boxes. These have the advantage of automatic line breaks. Figure 5 shows the sequence of text input into a frame, adding borders, and setting the background color.
Drawing an organization chart 5
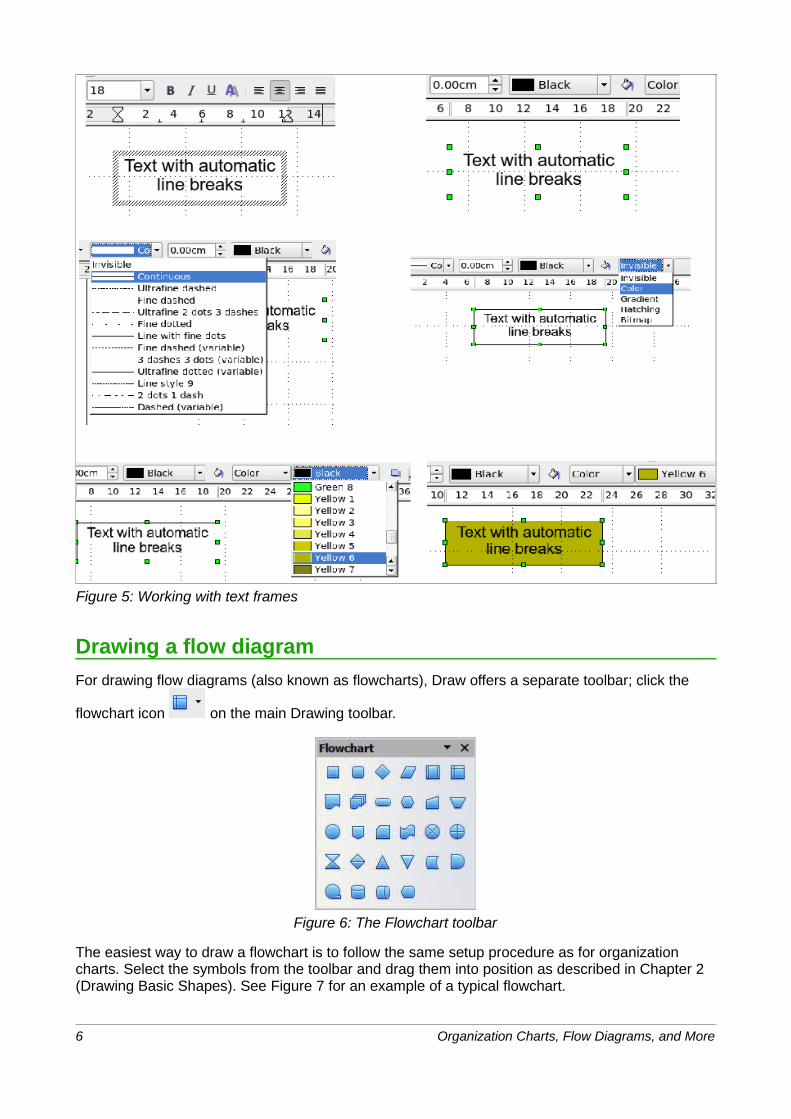
Figure 5: Working with text frames
Drawing a flow diagram
For drawing flow diagrams (also known as flowcharts), Draw offers a separate toolbar; click the
flowchart icon on the main Drawing toolbar.
Figure 6: The Flowchart toolbar
The easiest way to draw a flowchart is to follow the same setup procedure as for organization charts. Select the symbols from the toolbar and drag them into position as described in Chapter 2 (Drawing Basic Shapes). See Figure 7 for an example of a typical flowchart.
6 Organization Charts, Flow Diagrams, and More
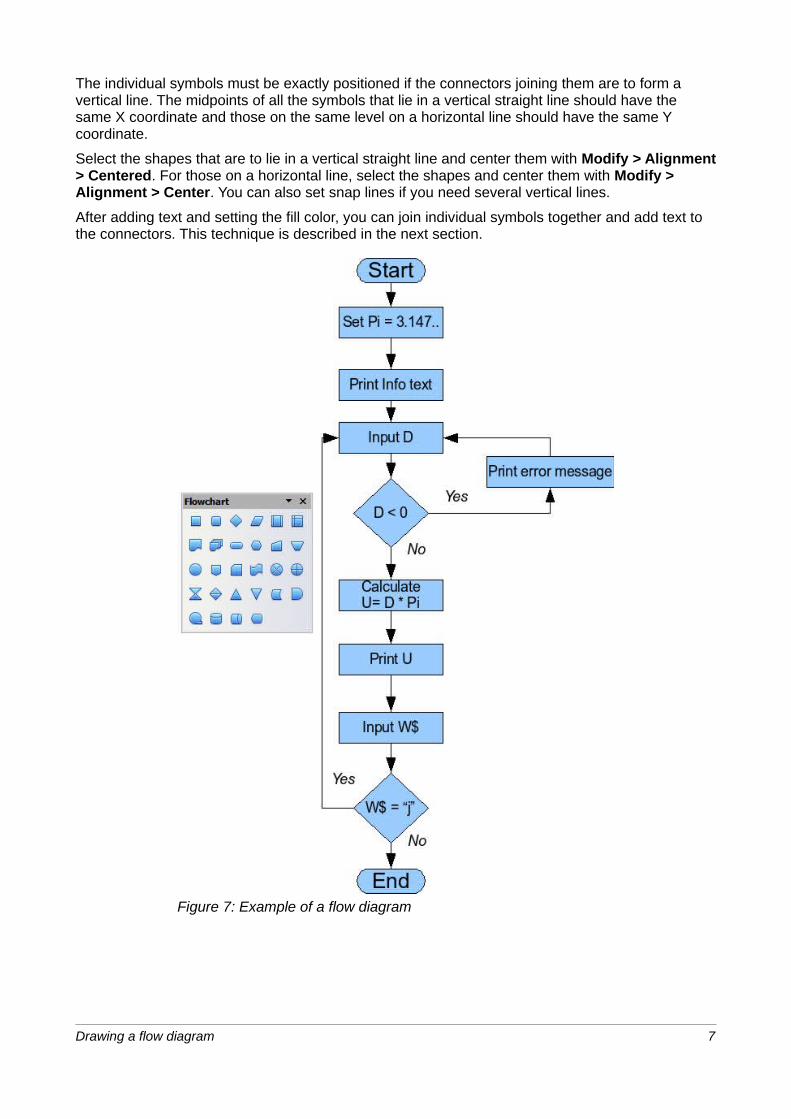
The individual symbols must be exactly positioned if the connectors joining them are to form a vertical line. The midpoints of all the symbols that lie in a vertical straight line should have the same X coordinate and those on the same level on a horizontal line should have the same Y coordinate.
Select the shapes that are to lie in a vertical straight line and center them with Modify > Alignment > Centered. For those on a horizontal line, select the shapes and center them with Modify > Alignment > Center. You can also set snap lines if you need several vertical lines.
After adding text and setting the fill color, you can join individual symbols together and add text to the connectors. This technique is described in the next section.
Figure 7: Example of a flow diagram
Drawing a flow diagram 7
Glue points and connectors
These elements were briefly introduced in Chapter 2 (Drawing Basic Shapes). This section describes how to use them.
Connectors are lines or arrows whose ends automatically dock to a connection or glue point on an object. Connectors are particularly useful when drawing organization charts, flow diagrams, and mindmaps. The connecting lines between the symbols remain intact even when the latter are moved or rearranged.
The Connector toolbar
Click on the arrow of the button on the Draw toolbar to open the Connectors toolbar.
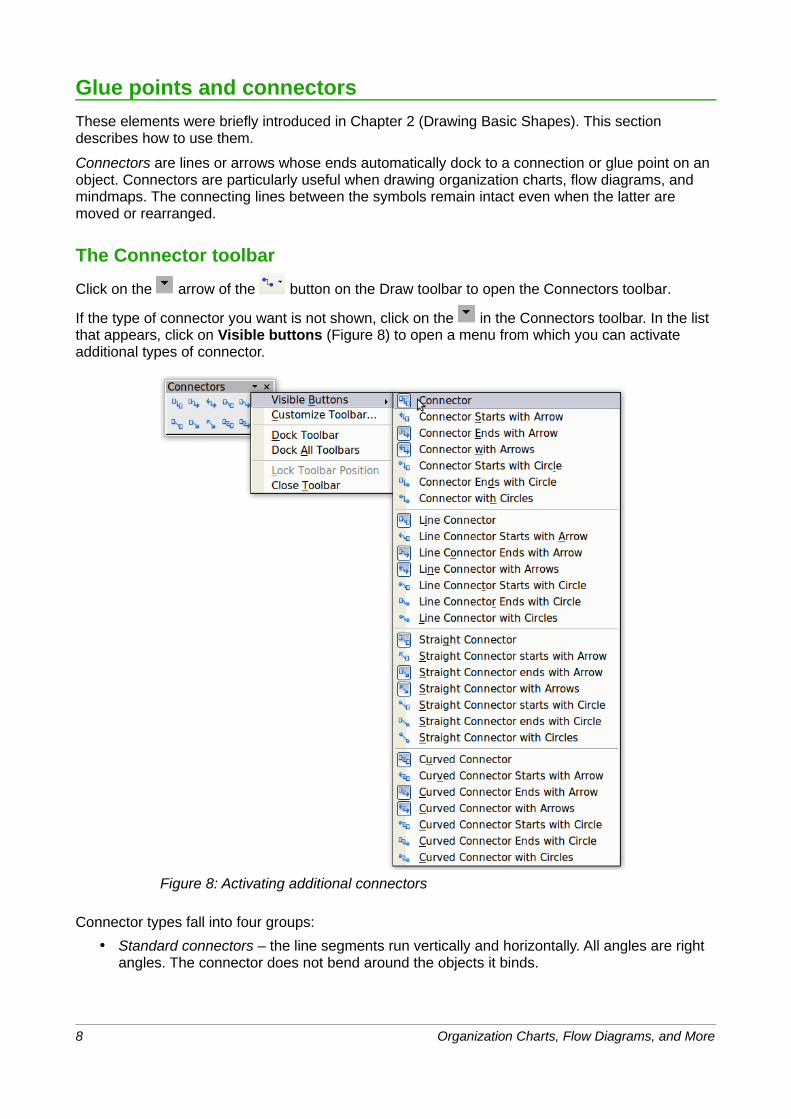
If the type of connector you want is not shown, click on the in the Connectors toolbar. In the list that appears, click on Visible buttons (Figure 8) to open a menu from which you can activate additional types of connector.
Figure 8: Activating additional connectors
Connector types fall into four groups:
• Standard connectors – the line segments run vertically and horizontally. All angles are right angles. The connector does not bend around the objects it binds.
8 Organization Charts, Flow Diagrams, and More
• Line connectors – consist of a line segment and two smaller horizontal or vertical segments at the ends.
• Straight connectors – consist of a single line.
• Curved connectors – are based on Bézier curves, as described in Chapter 10 (Advanced Draw Techniques).
You can modify all the connector types from the context menu. Select Connector to change from one connector type to another (as well as some other properties). With the Line dialog you can change the appearance of the line (color, arrow style, and line style) but not the connector type.
Drawing connectors—basics
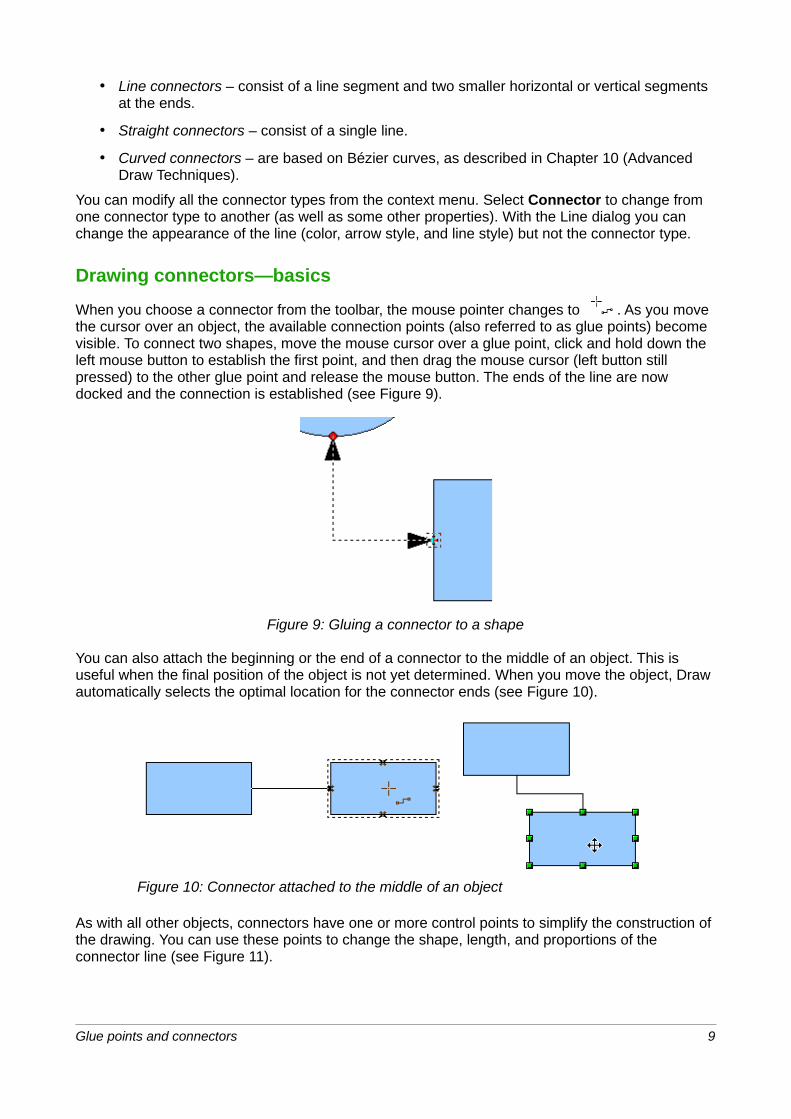
When you choose a connector from the toolbar, the mouse pointer changes to . As you move the cursor over an object, the available connection points (also referred to as glue points) become visible. To connect two shapes, move the mouse cursor over a glue point, click and hold down the left mouse button to establish the first point, and then drag the mouse cursor (left button still pressed) to the other glue point and release the mouse button. The ends of the line are now docked and the connection is established (see Figure 9).
Figure 9: Gluing a connector to a shape
You can also attach the beginning or the end of a connector to the middle of an object. This is useful when the final position of the object is not yet determined. When you move the object, Draw automatically selects the optimal location for the connector ends (see Figure 10).
Figure 10: Connector attached to the middle of an object
As with all other objects, connectors have one or more control points to simplify the construction of the drawing. You can use these points to change the shape, length, and proportions of the connector line (see Figure 11).
Glue points and connectors 9
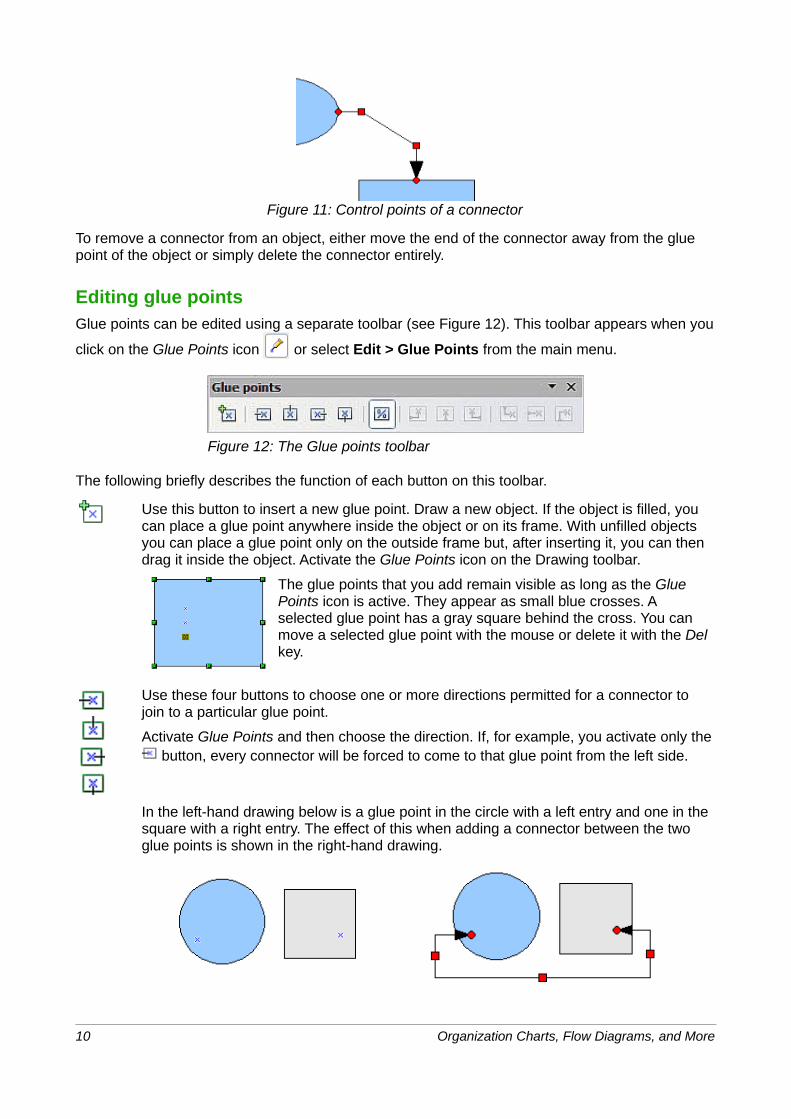
Figure 11: Control points of a connector
To remove a connector from an object, either move the end of the connector away from the glue point of the object or simply delete the connector entirely.
Editing glue pointsGlue points can be edited using a separate toolbar (see Figure 12). This toolbar appears when you
click on the Glue Points icon or select Edit > Glue Points from the main menu.
Figure 12: The Glue points toolbar
The following briefly describes the function of each button on this toolbar.
Use this button to insert a new glue point. Draw a new object. If the object is filled, you can place a glue point anywhere inside the object or on its frame. With unfilled objects you can place a glue point only on the outside frame but, after inserting it, you can then drag it inside the object. Activate the Glue Points icon on the Drawing toolbar.
The glue points that you add remain visible as long as the Glue Points icon is active. They appear as small blue crosses. A selected glue point has a gray square behind the cross. You can move a selected glue point with the mouse or delete it with the Del key.
Use these four buttons to choose one or more directions permitted for a connector to join to a particular glue point.
Activate Glue Points and then choose the direction. If, for example, you activate only the button, every connector will be forced to come to that glue point from the left side.
In the left-hand drawing below is a glue point in the circle with a left entry and one in the square with a right entry. The effect of this when adding a connector between the two glue points is shown in the right-hand drawing.
10 Organization Charts, Flow Diagrams, and More
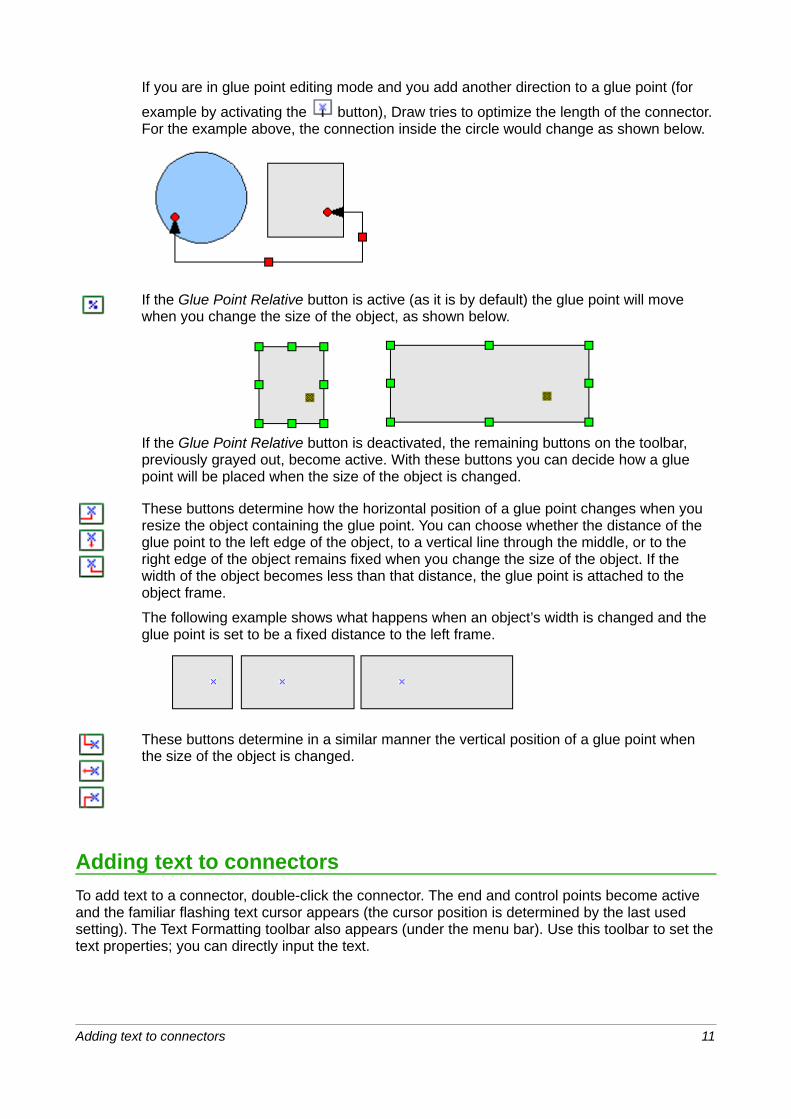
If you are in glue point editing mode and you add another direction to a glue point (for
example by activating the button), Draw tries to optimize the length of the connector. For the example above, the connection inside the circle would change as shown below.
If the Glue Point Relative button is active (as it is by default) the glue point will move when you change the size of the object, as shown below.
If the Glue Point Relative button is deactivated, the remaining buttons on the toolbar, previously grayed out, become active. With these buttons you can decide how a glue point will be placed when the size of the object is changed.
These buttons determine how the horizontal position of a glue point changes when you resize the object containing the glue point. You can choose whether the distance of the glue point to the left edge of the object, to a vertical line through the middle, or to the right edge of the object remains fixed when you change the size of the object. If the width of the object becomes less than that distance, the glue point is attached to the object frame.
The following example shows what happens when an object’s width is changed and the glue point is set to be a fixed distance to the left frame.
These buttons determine in a similar manner the vertical position of a glue point when the size of the object is changed.
Adding text to connectors
To add text to a connector, double-click the connector. The end and control points become active and the familiar flashing text cursor appears (the cursor position is determined by the last used setting). The Text Formatting toolbar also appears (under the menu bar). Use this toolbar to set the text properties; you can directly input the text.
Adding text to connectors 11
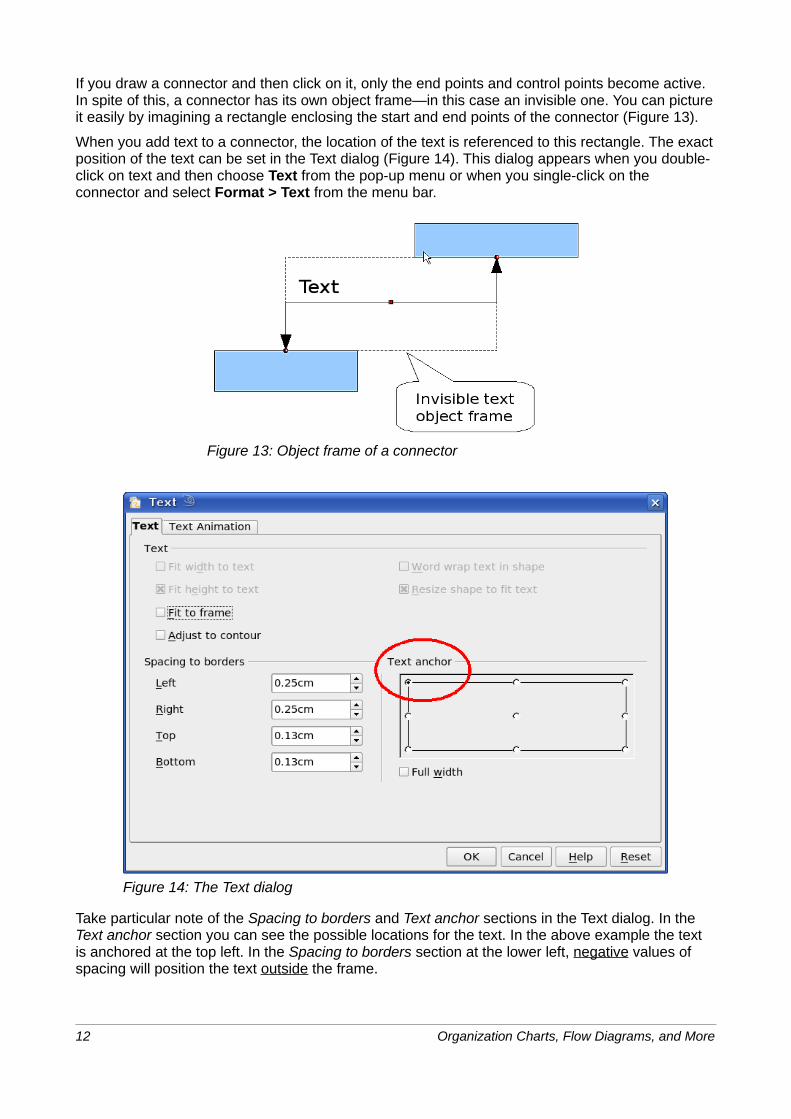
If you draw a connector and then click on it, only the end points and control points become active. In spite of this, a connector has its own object frame—in this case an invisible one. You can picture it easily by imagining a rectangle enclosing the start and end points of the connector (Figure 13).
When you add text to a connector, the location of the text is referenced to this rectangle. The exact position of the text can be set in the Text dialog (Figure 14). This dialog appears when you double-click on text and then choose Text from the pop-up menu or when you single-click on the connector and select Format > Text from the menu bar.
Figure 13: Object frame of a connector
Figure 14: The Text dialog
Take particular note of the Spacing to borders and Text anchor sections in the Text dialog. In the Text anchor section you can see the possible locations for the text. In the above example the text is anchored at the top left. In the Spacing to borders section at the lower left, negative values of spacing will position the text outside the frame.
12 Organization Charts, Flow Diagrams, and More
Adjusting text to suit the connecting lineIf you want the text to follow the slope or curve of a line, you need to activate and use the Fontwork tool.
1) To add it to the Draw toolbar, choose Tools > Customize from the menu bar.
2) On the Toolbars tab, in the Toolbars pull-down list select Drawing. In the Toolbar content section, click Add.
3) On the Add Commands dialog, select Format from the left-hand list and the command Fontwork. Click Add, then Close to return to the Customize dialog.
4) In the list of commands under Toolbar Content, move the Fontwork icon to the location you want by using the up/down arrows, and then click OK.
To write slanting text, follow these steps:
1) Add the text to the connector as described earlier. The anchor location of the text is not important at this stage.
Figure 15: Adding text to an inclined line, Step 1
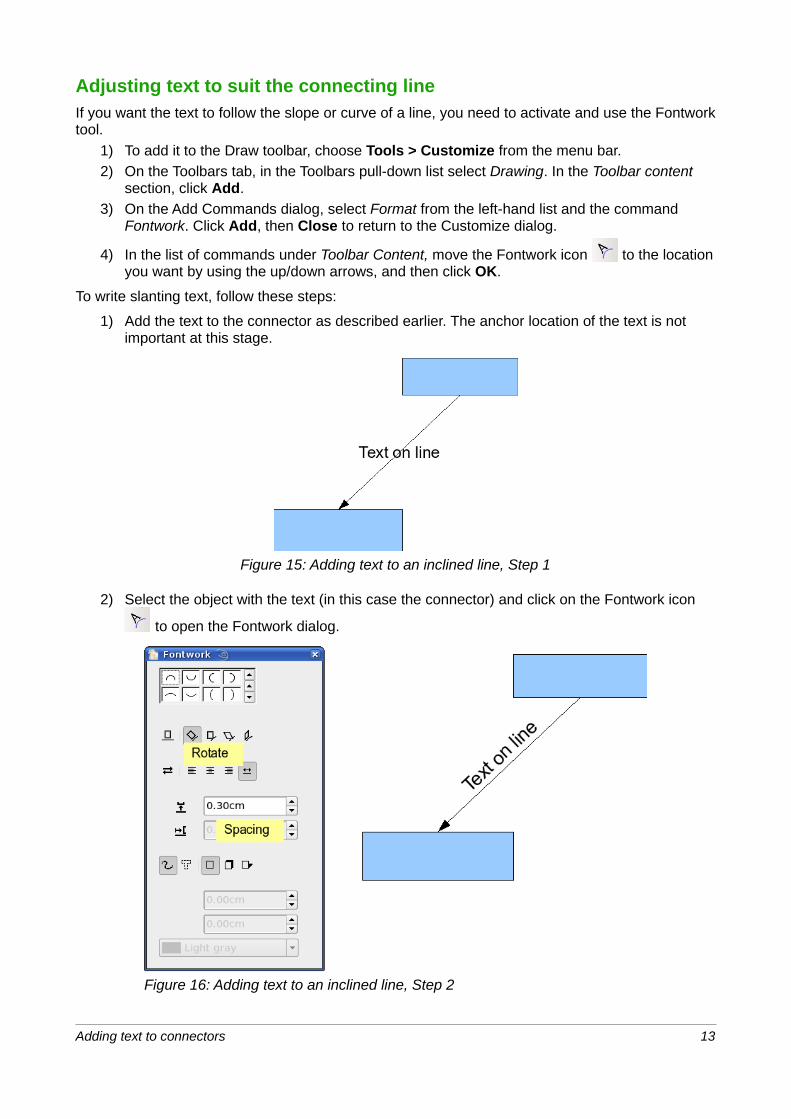
2) Select the object with the text (in this case the connector) and click on the Fontwork icon
to open the Fontwork dialog.
Figure 16: Adding text to an inclined line, Step 2
Adding text to connectors 13

3) To make the text lie along the inclined line, click the Rotate icon and set the distance to the line you wish.
The Fontwork dialog provides many other possibilities to manipulate the text. You can, for example,
turn the text around 180 degrees with the Orientation icon (which was done in the example
above) or place the text under the line by assigning a negative value to the spacing between text and line.
In addition, you can use the Fontwork dialog to generate curved text that follows the shape of a curved line. Experiment a little to investigate some of the possibilities.
14 Organization Charts, Flow Diagrams, and More