Embed Size (px)
DESCRIPTION
Organisation for Economic Co-Operation and Development 2004 Edition of Education at a Glance. London, 13 September 2004 Washington, 13 September 2004 Berlin, 14 September 2004 Rome, 15 September 2004. Andreas Schleicher Head, Indicators and Analysis Division. Under embargo until. - PowerPoint PPT Presentation
Citation preview

11Ed
uca
tion
at
a G
lan
ce 2
00
4 –
An
dre
as
Sch
leic
her
Organisation for Economic Co-Operation and Development
2004 Edition of Education at a Glance
London, 13 September 2004Washington, 13 September 2004
Berlin, 14 September 2004Rome, 15 September 2004
Andreas SchleicherHead, Indicators and Analysis Division

22Ed
uca
tion
at
a G
lan
ce 2
00
4 –
An
dre
as
Sch
leic
her
Under embargo until
14 September 2004, 11:00 MEZ

33Ed
uca
tion
at
a G
lan
ce 2
00
4 –
An
dre
as
Sch
leic
her
Education at a Glance 2004
1.1. Tertiäre Bildungsbeteiligung… und deren Erträge
– im Vergleich zur dualen Berufsausbildung Internationalisierung Beteiligung von Männern und Frauen
2.2. Bildungsfinanzierung
3.3. Verteilung von Entscheidungskompetenzen im Bildungsbereich
4.4. (Lernumfeld und Organisation von Schulen)
5.5. (Arbeitsbedingungen der Lehrer)

44Ed
uca
tion
at
a G
lan
ce 2
00
3 –
An
dre
as
Sch
leic
her
More people are completing tertiary education than ever
before…
…in some countries, growth has been spectacular…
…but others have fallen behind.

55Ed
uca
tion
at
a G
lan
ce 2
00
4 –
An
dre
as
Sch
leic
her
0
10
20
30
40
Uni
ted
Sta
tes
Nor
way
Den
mar
k
Net
herl
ands
Can
ada
Swed
en
Swit
zerl
and
Uni
ted
Kin
gdom
Aus
tral
ia
Hun
gary
Fin
land
Jap
an
Ger
man
y
Cze
ch R
epub
lic
Pola
nd
Irel
and
New
Zea
land
Fra
nce
Spa
in
Kor
ea
Gre
ece
Ital
y
Tur
key
Aus
tria
Port
ugal
Mex
ico
1960's 1970's 1980's 1990's
Growth in university-level qualificationsApproximated by the percentage of persons with ISCED 5A/6 qualfication in
the age groups 55-64, 45-55, 45-44 und 25-34 years (2002)
4
22
14
23
A3.2

66Ed
uca
tion
at
a G
lan
ce 2
00
4 –
An
dre
as
Sch
leic
her
-5
0
5
10
15
20
25
30
35
40
45
Pola
nd
Den
mar
k
Aus
tral
ia
Fin
land
Nor
way
Icel
and
Uni
ted
Kin
gdom
Jap
an
Sw
eden
Irel
and
Fra
nce
Sw
itze
rlan
d
Slo
vak
Rep
ublic
Ital
y
Ger
man
y
Aus
tria
Cze
ch R
epub
lic
OECD
%
3 to less than 5 years 5 years 6 years or more Other
Abschlussquoten im Tertiärbereich AAnzahl der Absolventen im Verhältnis zur Population
im typischen Abschlussalter *100 (2002)

77Ed
uca
tion
at
a G
lan
ce 2
00
4 –
An
dre
as
Sch
leic
her
0
10
20
30
40
50
60
70
80
Aus
tral
ia
Sw
eden
Icel
and
Fin
land
Pola
nd
New
Zea
land
Uni
ted
Sta
tes
Hun
gary
Net
herl
ands
Spa
in
Den
mar
k
Kor
ea
Uni
ted
Kin
gdom
Slo
vak
Rep
ublic
Jap
an
Irel
and
Fra
nce
Ger
man
y
Sw
itze
rlan
d
Mex
ico
Bel
gium
Aus
tria
Cze
ch R
epub
lic
Tertiary- type A education Tertiary- type B education
Current entry rates suggestthat the growth will continue
Sum of net entry rates for single year of age in tertiary-type A and tertiary-type B education
Der Ausbau der tertiären Bildungssysteme gewinnt in den OECD-Staaten weiter an Dynamik
Die Zahl der Studierenden/Auszubildenden im Tertiärbereich hat sich zwischen 1995 und 2001 um durchschnittlich 40% erhöht, in 6 Staaten um mehr als 50%
– Österreich, Deutschland und Frankreich waren die einzigen Staaten ohne Zuwächse
– Zwar ist in Deutschland die Beteiligungsrate um 14% gewachsen, dies konnte jedoch den demographischen Schwund nur noch gerade ausgleichen
– Allein um den jetzigen (niedrigen) Bestand zu sichern, müsste die tertiäre Bildungsbeteiligung in weit stärkerem Maße wachsen
– Deutliche Steigerungen setzen eine flexiblere Regelung des Studienzugangs voraus. Gegenwärtig nur 43% einer Alterskohorte mit Hochschulzugangsberechtigung
Die hohen Anfängerquoten deuten in einigen Staaten auf einen Paradigmenwechsel hin
– Von der Orientierung am “Qualifikationsbedarf” zur Investition in Humankapital, Innovation und Transformation
– Auch für Deutschland deutliche Steigerung der Anfängerquote (von 28% in 1998 auf 35% in 2002) sowie Voraussetzungen für weitere Verbesserungen durch
– Strukturierteres und differenzierteres Angebot an Abschlüssen– Finanzielle Ausbildungsförderung
A3.1
99Ed
uca
tion
at
a G
lan
ce 2
00
4 –
An
dre
as
Sch
leic
her
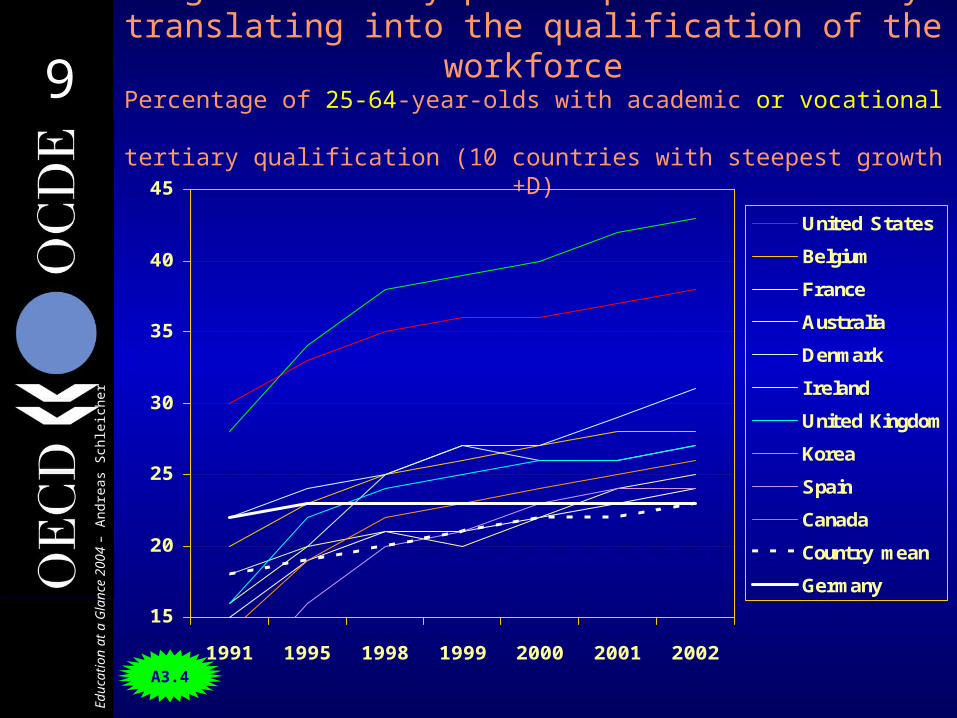
Higher tertiary participation is slowly translating into the qualification of the workforce
Percentage of 25-64-year-olds with academic or vocational tertiary qualification (10 countries with steepest growth +D)
15
20
25
30
35
40
45
1991 1995 1998 1999 2000 2001 2002
United States
Belgium
France
Australia
Denmark
Ireland
United Kingdom
Korea
Spain
Canada
Country mean
Germany
A3.4
1010Ed
uca
tion
at
a G
lan
ce 2
00
4 –
An
dre
as
Sch
leic
her
0
2
4
6
8
10
12
14
16
18
Aus
tral
ia
Sw
itze
rlan
d
Aus
tria
Bel
gium
Uni
ted
Kin
gdom
Ger
man
y
Fra
nce
New
Zea
land
Den
mar
k
Sw
eden
Irel
and
Nor
way
Icel
and
Uni
ted
Sta
tes
Net
herl
ands
Cze
ch R
epub
lic
Hun
gary
Spa
in
Fin
land
Jap
an
Gre
ece
Ital
y
Slo
vak
Rep
ublic
Tur
key
Pola
nd
Kor
ea
2002 1998
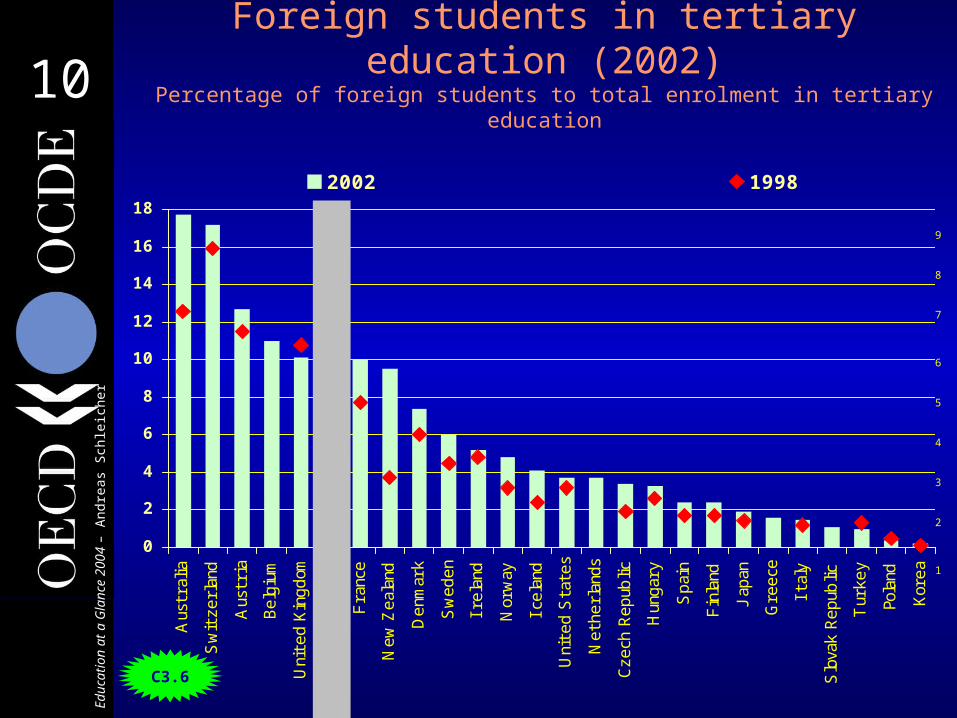
Foreign students in tertiary education (2002)
Percentage of foreign students to total enrolment in tertiary education
2
3
4
6
7
9
1
5
8
C3.6
1111Ed
uca
tion
at
a G
lan
ce 2
00
4 –
An
dre
as
Sch
leic
her
United States
30%
France
9%
Switzerland
2%
I taly
2%
Austria
2%
Germany
12%
United Kingdom
12%
OECD partner
countries
5%
Netherlands
1%
Other OECD
6%
Sweden
1%
Belgium
2%
Spain
2%
Australia
10%
J apan
4%
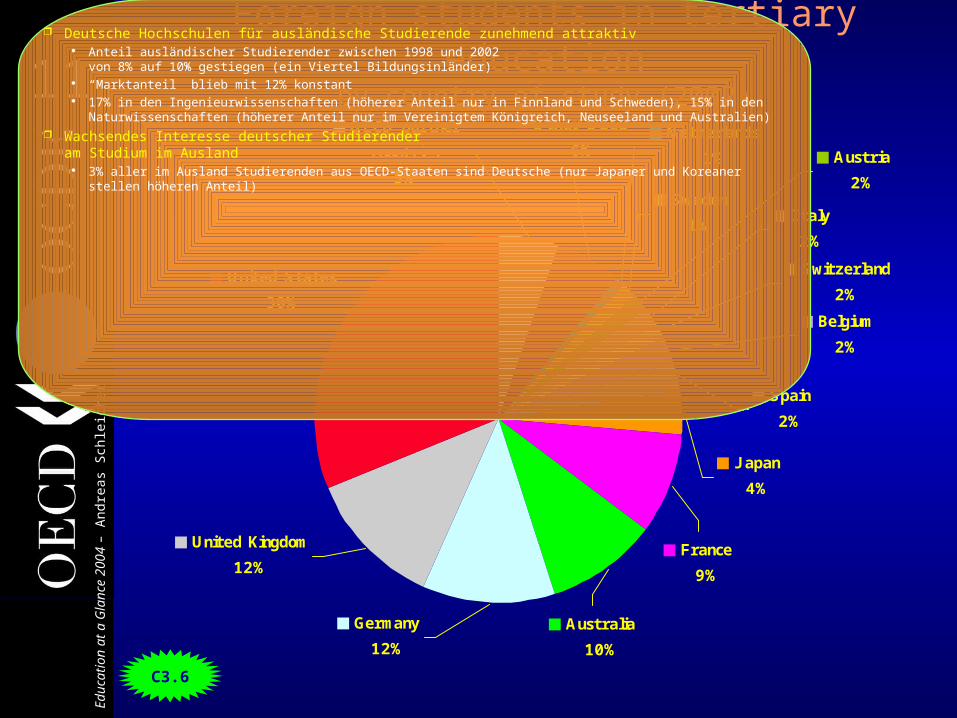
Foreign students in tertiary educationby country of study (2002)
Deutsche Hochschulen für ausländische Studierende zunehmend attraktiv Anteil ausländischer Studierender zwischen 1998 und 2002
von 8% auf 10% gestiegen (ein Viertel Bildungsinländer) “Marktanteil” blieb mit 12% konstant 17% in den Ingenieurwissenschaften (höherer Anteil nur in Finnland und Schweden), 15% in den
Naturwissenschaften (höherer Anteil nur im Vereinigtem Königreich, Neuseeland und Australien) Wachsendes Interesse deutscher Studierender
am Studium im Ausland 3% aller im Ausland Studierenden aus OECD-Staaten sind Deutsche (nur Japaner und Koreaner stellen
höheren Anteil)
C3.6

1313Ed
uca
tion
at
a G
lan
ce 2
00
4 –
An
dre
as
Sch
leic
her
0
10
20
30
40
50
60
70
80
90
100
All fields of study
Health and welfare
Life sciences, physical scienceand agriculture
Mathematics and computerscience
Humanities, arts and education
Social sciences, business, lawand services
Engineering, manufacturing andconstruction
The 1990’s was the decade when women moved ahead of men in terms of educational attainment
Percentage of Tertiary Type-A qualification awarded to women
Higher proportion of
men
Higher proportion of
women These gender inequities show much early on Gender differences in fields of study at university level are
already mirrored in the educational aspirations of 15-year-olds– Career expectations of boys were far more often associated with
physics, mathematics or engineering (on average 18% of boys versus 5% of girls)
– While girls more frequently expected occupations related to life sciences and health (20% of girls compared to only 7% of boys)
OECD average GermanyA4.2

1515Ed
uca
tion
at
a G
lan
ce 2
00
4 –
An
dre
as
Sch
leic
her

1616Ed
uca
tion
at
a G
lan
ce 2
00
3 –
An
dre
as
Sch
leic
her
Growing educational success pays off…
…and for the UK more so than for most other countries.

1717Ed
uca
tion
at
a G
lan
ce 2
00
4 –
An
dre
as
Sch
leic
her
The earnings advantage of tertiary education
Relative earnings of 25-64-year-old tertiary graduates with income from employment (upper secondary education=100)
40 %
60 %
80 %
100 %
120 %
140 %
160 %
180 %
200 %
OECD/men
D/men
OECD/women
D/women
A11.1

1919Ed
uca
tion
at
a G
lan
ce 2
00
4 –
An
dre
as
Sch
leic
her
The unemployment advantage of education
Number of 25-64-year-olds who are unemployed as a percentage of all 25-64-year-olds
%
2 %
4 %
6 %
8 %
10 %
12 %
OECD/men
D/men
OECD/women
D/women
A10

2020Ed
uca
tion
at
a G
lan
ce 2
00
4 –
An
dre
as
Sch
leic
her
Trends in unemployment ratiosNumber of 25-64-year-olds who are unemployed as a
percentage of all 25-64-year-olds
- 1
1
3
5
7
9
11
13
15
1991 1995 1998 1999 2000 2001 2002
Germany: Below uppersecondary
Germany: Uppersecondary and dualsystem
Germany: Tertiaryeducation
OECD: Below uppersecondary
OECD: Upper secondary
OECD: Tertiaryeducation
A10.2b

2121Ed
uca
tion
at
a G
lan
ce 2
00
4 –
An
dre
as
Sch
leic
her
Trends in unemployment ratiosNumber of 25-64-year-olds who are unemployed as a
percentage of all 25-64-year-olds (Germany)
2
4
6
8
10
12
14
25-29
J ahre
30-34
J ahre
35-39
J ahre
40-44
J ahre
45-49
J ahre
50-54
J ahre
55-59
J ahre
60-64
J ahre
Ohne Sek- I I Abschluss
Duales System/Abitur
Tertiär-B
Universität/Fachhochschule
A10
**
*

2222Ed
uca
tion
at
a G
lan
ce 2
00
4 –
An
dre
as
Sch
leic
her
Trends in the earnings advantageTrends in relative earnings of 25-64-year-old tertiary graduates (upper secondary=100, countries with 5% or more attainment
growth)
100
110
120
130
140
150
160
170
180
190
200
1997 1998 1999 2000 2001 2002
Australia
Belgium
Canada
OECD mean
Denmark
Finland
France
Germany
Hungary
I reland
Korea
New Zealand
Norway
Spain
Sweden
Switzerland
United Kingdom
United States
(Noch) keine Anzeichen, dass der dynamische Ausbau des tertiären Bildungssystems zur “Inflation” der Qualifikationen führt
Unter den Staaten in denen der Anteil der 25-64-Jährigen mit tertiärem Abschluss seit 1995 um mehr als 5 Prozentpunkte gestiegen ist haben die meisten sinkende Arbeitslosenquoten sowie steigende Einkommensvorteile unter den Tertiärabsolventen festgestellt
– In Australien, Deutschland, Irland, Kanada, Ungarn und dem Vereinigten Königreich stieg der Einkommensvorteil zwischen 6 und 14 Prozentpunkten zwischen 1997 und 2001
– Unter den 15 Staaten mit vergleichbaren Daten sank der Einkommensvorteil nur in Neuseeland, Norwegen und Spanien
A11.2

2323Ed
uca
tion
at
a G
lan
ce 2
00
4 –
An
dre
as
Sch
leic
her
Internal rate of return to tertiary education
-5 0 5 10 15 20
Hungary
Finland
United Kingdom
United States
Switzerland
Spain
Sweden
Denmark
AustraliaMale
Female
Male
Female
Male
Female
Male
Female
Male
Female
Male
Female
Male
Female
Male
Female
Male
Female
immediately to higher education
at age 40, no fees, no income
at age 40, fees, no income
A11.5

2626Ed
uca
tion
at
a G
lan
ce 2
00
4 –
An
dre
as
Sch
leic
her

2727Ed
uca
tion
at
a G
lan
ce 2
00
3 –
An
dre
as
Sch
leic
her
In many countries, the expansion was accompanied by massive financial
investments
Im OECD-Raum verzeichneten die öffentlichen und privaten Ausgaben für Bildungseinrichtungen zwischen 1995 und
2001 eine Nettosteigerung von…
…21% unterhalb des Tertiärbereiches (D: 6%)…30% im Tertiärbereich (D: 7%)

2828Ed
uca
tion
at
a G
lan
ce 2
00
4 –
An
dre
as
Sch
leic
her
Expenditure on educational institutions as a percentage of GDP
All levels of education
0
1
2
3
4
5
6
7
8
9
EU
Denmar
k
Swed
en
Portug
al
Finla
nd
Fran
ce
Austria
Mex
ico
United
Sta
tes
Cana
daI t
aly
Kore
a
United
King
dom
Hunga
ry
Australi
a
Nethe
rland
sSp
ain
Germ
any
I relan
d
Slov
ak R
epub
lic
J apa
n
Turk
ey
Privat
Öff entlich
B2

2929Ed
uca
tion
at
a G
lan
ce 2
00
4 –
An
dre
as
Sch
leic
her
Expenditure on educational institutions as a percentage of GDP
Tertiary education (2001)
0
0.5
1
1.5
2
2.5
3
EU
Denmar
k
Finla
nd
Cana
da
Swed
en
Norwa
y
Belgi
um
Austria
I relan
d
Nethe
rland
sSp
ain
Germ
any
Fran
ce
United
Sta
tes
Hunga
ry
Australi
a
United
King
domI t
aly
Mex
ico
J apa
n
Kore
a
Private
Public
B2
3131Ed
uca
tion
at
a G
lan
ce 2
00
4 –
An
dre
as
Sch
leic
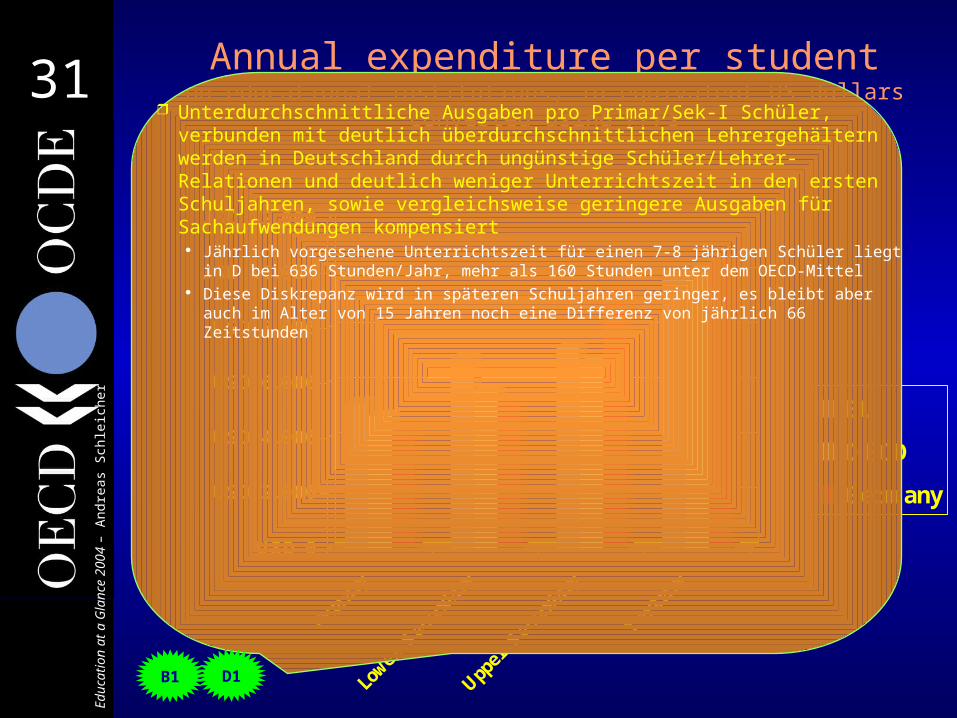
her
Annual expenditure per studenton educational institutions, in equivalent US dollars converted using
PPPs
USD 0
USD 2.000
USD 4.000
USD 6.000
USD 8.000
USD 10.000
USD 12.000
Prim
ary
Lowe
r Se
cond
ary
Uppe
r Se
cond
ary
Tertiary
EU
OECD
Germany
B1
Unterdurchschnittliche Ausgaben pro Primar/Sek-I Schüler, verbunden mit deutlich überdurchschnittlichen Lehrergehältern werden in Deutschland durch ungünstige Schüler/Lehrer- Relationen und deutlich weniger Unterrichtszeit in den ersten Schuljahren, sowie vergleichsweise geringere Ausgaben für Sachaufwendungen kompensiert
Jährlich vorgesehene Unterrichtszeit für einen 7-8 jährigen Schüler liegt in D bei 636 Stunden/Jahr, mehr als 160 Stunden unter dem OECD-Mittel
Diese Diskrepanz wird in späteren Schuljahren geringer, es bleibt aber auch im Alter von 15 Jahren noch eine Differenz von jährlich 66 Zeitstunden
D1

3737Ed
uca
tion
at
a G
lan
ce 2
00
4 –
An
dre
as
Sch
leic
her
Verteilung der öffentlichen und privaten Ausgaben für Bildungseinrichtungen
(2001)
0%
10%
20%
30%
40%
50%
60%
70%
80%
90%
100%
Germ
any EU
OECD
Germ
any EU
OECD
Gesamte privateAufwendungen/Residual
Andere privateAufwendungen
Private Haushalte
Öff entlich
Elementarbereich Tertiärbereich

3838Ed
uca
tion
at
a G
lan
ce 2
00
4 –
An
dre
as
Sch
leic
her
3939Ed
uca
tion
at
a G
lan
ce 2
00
3 –
An
dre
as
Sch
leic
her
The distribution of decision-making responsibilities has changed…
…but in different ways across countries.
4040Ed
uca
tion
at
a G
lan
ce 2
00
4 –
An
dre
as
Sch
leic
her
0
20
40
60
80
100N
ether
land
s
Eng
land
New
Zea
land
Hun
gary
Cze
ch R
epub
lic
Slo
vak
Rep
ublic
Kor
ea
Sw
eden
Ital
y
Den
mar
k
Bel
gium
(Fr.
)
Port
ugal
Nor
way
Luxem
bou
rg
Ger
man
y
Fra
nce
Aus
tria
Spa
in
Fin
land
Icel
and
Aus
tral
ia
Tur
key
1
Jap
an
Mex
ico
Gre
ece
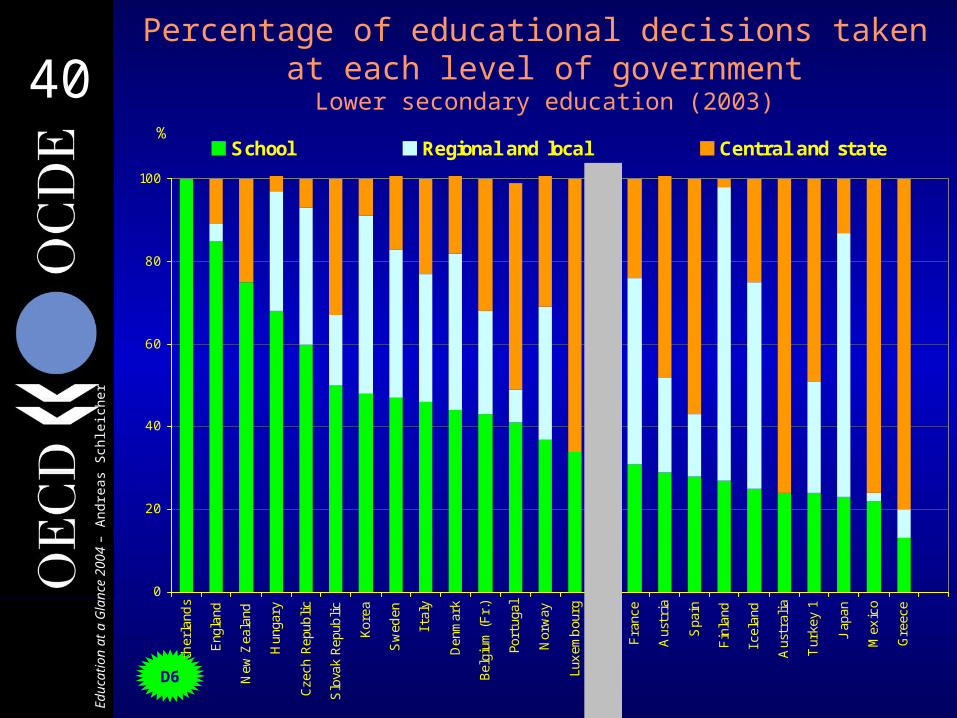
School Regional and local Central and state
Percentage of educational decisions taken at each level of government
Lower secondary education (2003)%
D6

4141Ed
uca
tion
at
a G
lan
ce 2
00
4 –
An
dre
as
Sch
leic
her
Percentage of decisions relating by schoolsLower secondary education, by mode of decision making (2003)
0
20
40
60
80
100N
ethe
rlan
dsN
ew Z
eala
ndEng
land
Hun
gary
Ital
yS
pain
Fin
land
Sw
eden
Aus
tral
iaD
enm
ark
Net
herl
ands
Eng
land
New
Zea
land
Hun
gary
Czec
h Rep
ublic
Slo
vak
Kor
eaS
wed
enIt
aly
Den
mar
kBel
gium
(Fr.
)Po
rtug
alN
orw
ayLu
xem
bour
gG
erm
any
Fra
nce
Aus
tria
Spa
inFin
land
Icel
and
Aus
tral
iaT
urke
y 1
Jap
anM
exic
oG
reec
e
In full autonomy In consultation with others Within a framework Other
0
20
40
60
80
100
Net
herl
ands
Eng
land
New
Zea
land
Hun
gary
Cze
ch R
epub
lic
Slo
vak
Rep
ublic
Kor
ea
Sw
eden
Ital
y
Den
mar
k
Bel
gium
(F
r.)
Port
ugal
Nor
way
Luxem
bou
rg
Ger
man
y
Fra
nce
Aus
tria
Spa
in
Fin
land
Icel
and
Aus
tral
ia
Tur
key1
Jap
an
Mex
ico
Gre
ece
In full autonomy In consultation with othersWithin a framework Column 4
0
20
40
60
80
100
Net
herl
ands
Eng
land
New
Zea
land
Hun
gary
Czec
h Rep
ublic
Slo
vak
Rep
ublic
Kor
ea
Sw
eden
Ital
y
Den
mar
k
Bel
gium
(Fr.
)
Port
ugal
Nor
way
Luxe
mbo
urg
Ger
man
y
Fra
nce
Aus
tria
Spa
in
Fin
land
Icel
and
Aus
tral
ia
Tur
key
1
Jap
an
Mex
ico
Gre
ece
In full autonomy In consultation with others Within a framework Other
%
0
20
40
60
80
100
Net
herl
ands
Eng
land
New
Zea
land
Hun
gary
Czec
h Rep
ublic
Slo
vak
Rep
ublic
Kor
ea
Sw
eden
Ital
y
Den
mar
k
Bel
gium
(Fr.
)
Port
ugal
Nor
way
Luxe
mbo
urg
Ger
man
y
Fra
nce
Aus
tria
Spa
in
Fin
land
Icel
and
Aus
tral
ia
Tur
key1
Jap
an
Mex
ico
Gre
ece
In full autonomy In consultation with others Within a framework Other
Organisation of instruction
Personnal management
Planning and structures
Resources (allocation and use)
%
%%
Der prozentuale Anteil der betrachteten Entscheidungskompetenzen, die bei den Schulen im Sek-I Bereich liegen, liegt in D mit 32% deutlich unter dem OECD-Mittel von 42%
Entscheidungskompetenzen der Schulen in den Bereichen Unterrichtsorganisation und Auswahl von Unterrichtsmethoden ausgeprägt
In den Bereichen Personalangelegenheiten, Strukturen und Planungsangelegenheiten, sowie Ressourcen sind die Entscheidungskompetenzen der Schulen in D dagegen beschränkt
B3
4242Ed
uca
tion
at
a G
lan
ce 2
00
4 –
An
dre
as
Sch
leic
her
Greece
Finland
Hungary
Germany
Austria
France
New Zealand
Belgium (Fr.)
Spain
Norway
Denmark
Portugal
I taly
Netherlands
England
Czech Republic
Korea
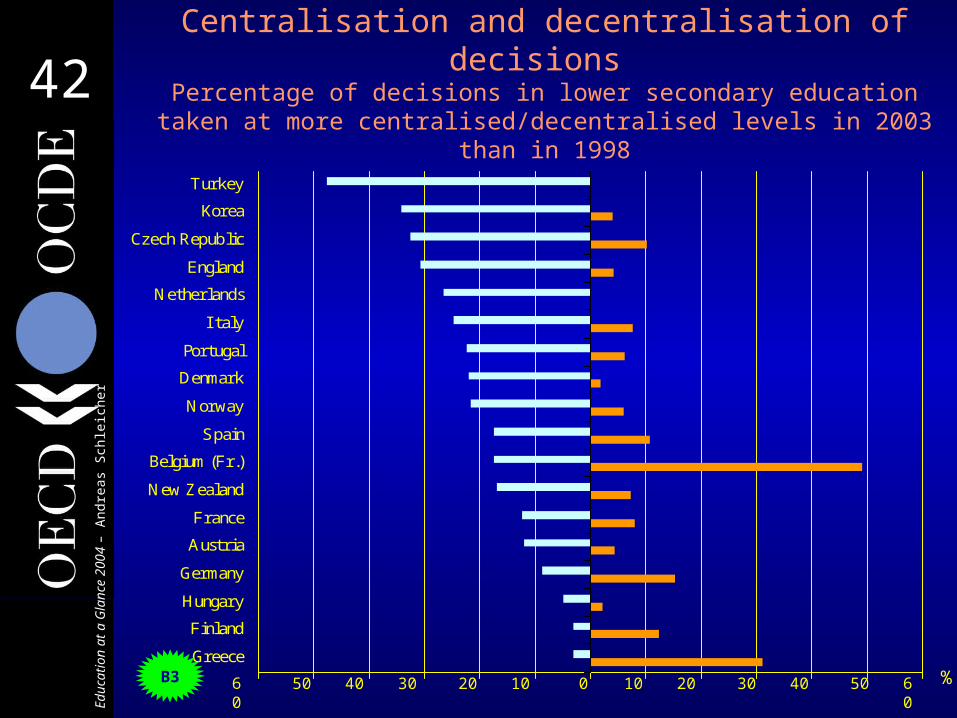
TurkeyMore centralised in 2003More decentralised in 2003
600 10 20 30 40 50102030405060
Centralisation and decentralisation of decisions Percentage of decisions in lower secondary education taken at
more centralised/decentralised levels in 2003 than in 1998
%B3

4343Ed
uca
tion
at
a G
lan
ce 2
00
4 –
An
dre
as
Sch
leic
her
4444Ed
uca
tion
at
a G
lan
ce 2
00
3 –
An
dre
as
Sch
leic
her
Student learning conditions

4545Ed
uca
tion
at
a G
lan
ce 2
00
4 –
An
dre
as
Sch
leic
her
0 1000 2000 3000 4000 5000 6000 7000 8000 9000
I taly 1
Australia
Scotland
New
Belgium (Fr.)
Greece
Mexico
I reland
England
France
Portugal
Belgium (Fl.)
Turkey
Spain
J apan
Hungary
I celand
Slovak
Germany
Korea
Sweden
Denmark
Norway
Finland
Ages 7 - 8 Ages 9 - 11 Ages 12- 14
Intended instruction hours in classroom settings in public schools between ages 7 and 14 (2002)
Total number of intended instructions hours
D1

4646Ed
uca
tion
at
a G
lan
ce 2
00
4 –
An
dre
as
Sch
leic
her
Average class size
0
5
10
15
20
25
30
35
40
Port
ugal
Sw
itze
rlan
d
Den
mar
k
Icel
and
Luxem
bou
rg
Ital
y
Hun
gary
Irel
and1
Bel
gium
(Fr.
)
Uni
ted S
tate
s
Gre
ece
Cze
ch R
epub
lic
Slo
vak
Rep
ublic
Aus
tral
ia2
Aus
tria
Fra
nce
Pola
nd
Ger
man
y
Uni
ted K
ingd
om1
Spa
in
Mex
ico
Jap
an
Kor
ea
Tur
key
Net
her
land
s
Primary education Lower secondary education
D2

4848Ed
uca
tion
at
a G
lan
ce 2
00
4 –
An
dre
as
Sch
leic
her

4949Ed
uca
tion
at
a G
lan
ce 2
00
3 –
An
dre
as
Sch
leic
her
Teacher working conditions

5050Ed
uca
tion
at
a G
lan
ce 2
00
4 –
An
dre
as
Sch
leic
her
0
10000
20000
30000
40000
50000
60000
70000
80000
Sw
itze
rlan
d
Ger
man
y
Kor
ea
Jap
an
Uni
ted S
tate
s
Sco
tlan
d
Aus
tral
ia
Eng
land
Net
her
land
s
Irel
and
Spa
in
Fin
land
Bel
gium
(Fl.)
Den
mar
k
New
Zea
land
Bel
gium
(Fr.
)
Aus
tria
Fra
nce
Port
ugal
Nor
way
Ital
y
Sw
eden
Gre
ece
Mex
ico
Icel
and
Cze
ch R
epub
lic
Hun
gary
Slo
vak
Rep
ublic
Salary after 15 years of experience/minimum trainingStarting salary/minimum trainingSalary at the top of scale/minimum training
Basic teachers' salaries in lower secondary education
Annual statutory teachers' salaries in public institutions in equivalent US dollars converted using PPPs, and ratio of salary after 15 years of experience to GDP per
capita (2002)
US $
D3

5151Ed
uca
tion
at
a G
lan
ce 2
00
4 –
An
dre
as
Sch
leic
her
0
1
2
3Kor
ea
Mex
ico
Sw
itze
rlan
d
Ger
man
y
Port
ugal
Jap
an
Spa
in
New
Zea
land
Sco
tlan
d
Aus
tral
ia
Eng
land
Gre
ece
Fin
land
Net
her
land
s
Bel
gium
(Fl.)
Bel
gium
(Fr.
)
Den
mar
k
Fra
nce
Uni
ted S
tate
s
Ital
y
Irel
and
Aus
tria
Cze
ch R
epub
lic
Sw
eden
Nor
way
Hun
gary
Icel
and
Slo
vak
Rep
ublic
Ratio of salary after 15 years of experience to GDP per capita
Ratio of lower secondary teacher salariesafter 15 years of experience to GDP per
capitaUS $
D3

5252Ed
uca
tion
at
a G
lan
ce 2
00
4 –
An
dre
as
Sch
leic
her
80
100
120
140
160
180
Mex
ico
Hun
gary
Fin
land
Aus
tral
ia
Den
mar
k
Sco
tlan
d
Nor
way
Eng
land
Ital
y
Jap
an
New
Zea
land
Port
ugal
Aus
tria
Bel
gium
(Fl.)
Gre
ece
Sw
itze
rlan
d
Net
her
land
s
Bel
gium
(Fr.
)
Irel
and
Salary after 15 years of experience Starting salary
Salary at the top of scale
Changes in teachers' salaries in lower secondary educationbetween 1996 and 2002
Index of change between 1996 and 2002 (1996=100, 2002 price levels using GDP deflators)
Index (1996=100)
D3
5353Ed
uca
tion
at
a G
lan
ce 2
00
4 –
An
dre
as
Sch
leic
her
0
10
20
30
40
50
60
70
80
90
100
Sco
tlan
d
Net
her
land
s
Ger
man
y
Slo
vak
Rep
ublic
Port
ugal
Spa
in
Den
mar
k
Nor
way
Gre
ece
Icel
and
Aus
tria
Kor
ea
Cze
ch R
epub
lic
Hun
gary
Jap
an
Tur
key
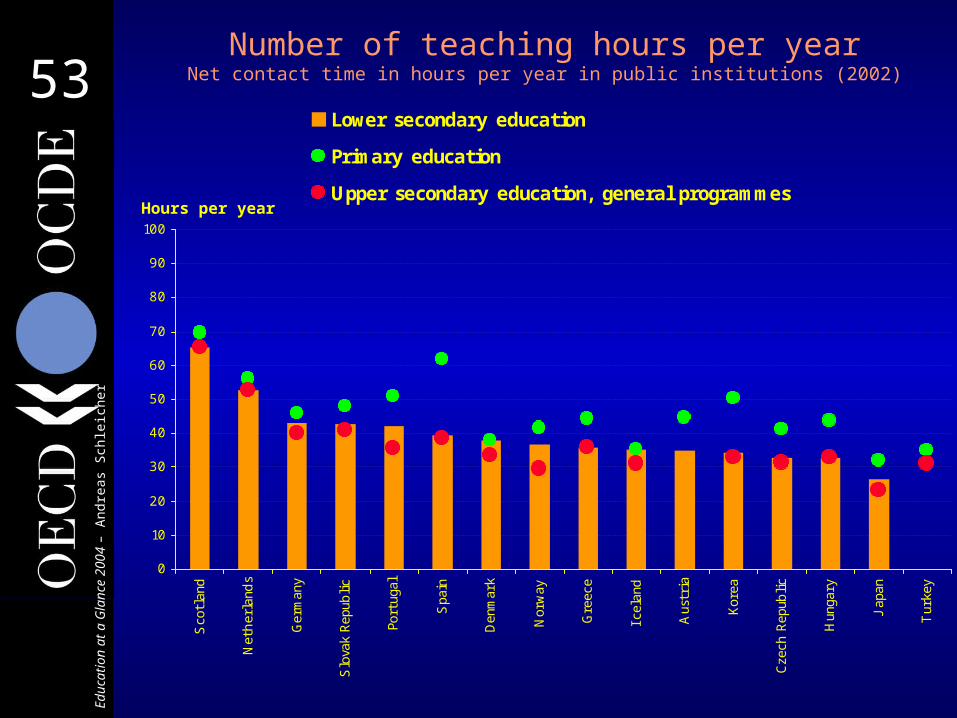
Lower secondary education
Primary education
Upper secondary education, general programmes
Number of teaching hours per yearNet contact time in hours per year in public institutions (2002)
Hours per year

5454Ed
uca
tion
at
a G
lan
ce 2
00
4 –
An
dre
as
Sch
leic
her
0
100
200
300
400
500
600
700
800
900
1000
1100
1200
1300
Mex
ico
Uni
ted S
tate
s
New
Zea
land
Sco
tlan
d
Net
her
land
s
Aus
tral
ia
Ger
man
y
Irel
and
Bel
gium
(Fl.)
Bel
gium
(Fr.
)
Slo
vak
Rep
ublic
Den
mar
k
Port
ugal
Icel
and
Nor
way
Fra
nce
Cze
ch R
epub
lic
Gre
ece
Aus
tria
Ital
y
Hun
gary
Fin
land
Spa
in
Kor
ea
Jap
an
Lower secondary education
Primary education
Upper secondary education, general programmes
Percentage of teachers’ working time spent teaching
Hours per year

5555Ed
uca
tion
at
a G
lan
ce 2
00
4 –
An
dre
as
Sch
leic
her

5656Ed
uca
tion
at
a G
lan
ce 2
00
4 –
An
dre
as
Sch
leic
her
Further information
www.oecd.org www.pisa.oecd.org email: [email protected]
…and remember:
Without data, you are just another person with an opinion

5757Ed
uca
tion
at
a G
lan
ce 2
00
4 –
An
dre
as
Sch
leic
her