Embed Size (px)
Citation preview
Organic Trade Association's 2013 Organic
Industry Survey
Intro
Organic Trade Association (OTA) 2013 Organic Industry Survey
Nutrition Business Journal, on behalf of the Organic Trade Association, is
conducting an annual survey of the organic products industry.
The objective of this survey is to gauge the size and growth of the organic
industry in North America by product category. This information will help OTA
raise the profile of the organic industry, accurately presenting its contribution to
the national economy and building credibility for its members in the eyes of the
media, the government and the private sector.
We ask you to provide information about your company and to share growth
estimates for several food and product categories. We understand that
information about your company's sales may be private, and we assure you that
your responses will remain confidential. Figures will be used to construct an
aggregate model of the industry, in addition to a list of top organic
manufacturers according to revenue ranges (specific figures derived from this
survey will not be detailed). For the success of this ambitious project, it is
important that each company fill out a survey. Respondents will receive a free
copy of the executive summary of the OTA 2013 Organic Industry Survey
If you have any questions, please contact NBJ Market Intelligence Analyst James
Johnson at [email protected] or at (303) 998-9336 or OTA
Associate Director, Conference and Product Development, Angela Jagiello at
[email protected]. or at (802) 275-3831.
If you would like a hard copy of the survey to reference while gathering the
information needed to complete the survey, please contact James at the e-mail
above or follow this link: <link to come>.

Respondent Information
1) Please enter your contact information. E-mail address and company name required to
receive Executive Summary of survey. Note: This is a confidential survey. Further contact,
if required, will be solely for the purpose of clarifying survey responses.*
First Name:: _________________________
Last Name:: _________________________
Title:: _________________________
Company:: _________________________
Subsidiary of (if applicable):: _________________________
Country:: _________________________
E-mail address:: _________________________
Phone Number:: _________________________
2) Please classify your company's core business:*
( ) Organic Food Product Manufacturer/Marketer
( ) Organic Food Grower
( ) Non-Organic Food Product Manufacturer/Marketer
( ) Personal Care Product Manufacturer/Marketer
( ) Functional Food Product Manufacturer/Marketer
( ) Pet Foods/Pet Supplements Manufacturer/Marketer
( ) Fiber Manufacturer/Marketer
( ) Flower Grower/Marketer
( ) Household Cleaner Manufacturer/Marketer
( ) Supplement Manufacturer/Marketer
( ) Organic Seed/Rootstock/Seed Treatment Producer/Seller
( ) Contract Manufacturer
( ) Distributor Jump to Q6
( ) Broker Jump to Q6

( ) Retailer Jump to Q6
( ) Raw Material/Ingredient Supplier/Importer
( ) Trade Association Jump to Q8
( ) Organic Certifier Jump to Q8
( ) Consultant/Service Provider Jump to Q8
( ) Other
Inventory Contraction - Manufacturer
Inventory Trends
The next questions address your experience with inventory management.
3) How did your overall inventory levels change in 2012 versus 2011?
( ) New company
( ) Down more than 20%
( ) Down 10% to <20%
( ) Down 0% to <10%
( ) About even
( ) Up 0% to 10%
( ) Up >10% to 20%
( ) Up more than 20%
4) If overall sales were down in 2012, what was the biggest factor?
( ) New Company
( ) Sales weren't down
( ) Reduced orders due to distributor/retailer inventory reduction
( ) Reduced orders due to decreased consumer purchases
( ) Reduced sales due to price decreases
( ) Reduced sales, not sure why

( ) Reduced sales for other reasons (please specify):: _________________
5) How did order levels from distributors and direct-order retailers change in 2012 versus
2011?
( ) New company
( ) Down more than 20%
( ) Down 10% to <20%
( ) Down 0% to <10%
( ) About even
( ) Up 0% to 10%
( ) Up >10% to 20%
( ) Up more than 20%
( ) Not Applicable
End of Page: Jump to Q8
Inventory Contraction - Retailer
Inventory Trends
The next questions address your experience with inventory management.
6) How did your overall inventory levels change in 2012 versus 2011?
( ) New company
( ) Down more than 20%
( ) Down 10% to <20%
( ) Down 0% to <10%
( ) About even
( ) Up 0% to 10%
( ) Up >10% to 20%
( ) Up more than 20%
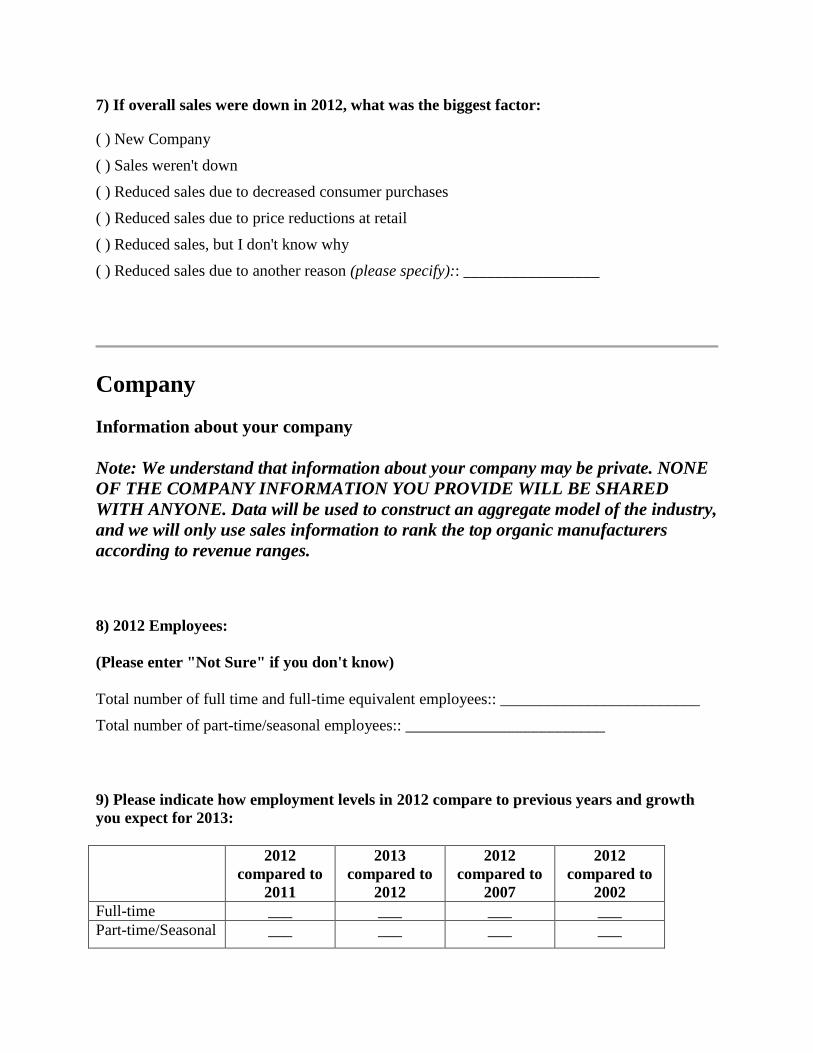
7) If overall sales were down in 2012, what was the biggest factor:
( ) New Company
( ) Sales weren't down
( ) Reduced sales due to decreased consumer purchases
( ) Reduced sales due to price reductions at retail
( ) Reduced sales, but I don't know why
( ) Reduced sales due to another reason (please specify):: _________________
Company
Information about your company
Note: We understand that information about your company may be private. NONE
OF THE COMPANY INFORMATION YOU PROVIDE WILL BE SHARED
WITH ANYONE. Data will be used to construct an aggregate model of the industry,
and we will only use sales information to rank the top organic manufacturers
according to revenue ranges.
8) 2012 Employees:
(Please enter "Not Sure" if you don't know)
Total number of full time and full-time equivalent employees:: _________________________
Total number of part-time/seasonal employees:: _________________________
9) Please indicate how employment levels in 2012 compare to previous years and growth
you expect for 2013:
2012
compared to
2011
2013
compared to
2012
2012
compared to
2007
2012
compared to
2002
Full-time ___ ___ ___ ___
Part-time/Seasonal ___ ___ ___ ___

10) Please estimate the percentage of your employees operating in the following segments in
2012: If you do not have any employees in a category, please enter "0" or leave blank.
Total should sum to 100.
_______Research & Development
_______Marketing
_______Sales
_______General or other office personnel
_______Warehousing
_______Production
_______Farming
_______Retail
_______Volunteers
_______Other
End of Page: If your core business type is Trade Association, Organic Certifier, or
Consultant/Service Provider, Jump to Q151
Overall Sales
Company Sales
Note: For the following questions, please keep these definitions in mind:
"Organic" includes products that are certified as:
"100% Organic"
"Organic" (95%+ organic)
"Made with organic ingredients" (70%+ organic)
Organic Does NOT include products that are made with less than 70% organic ingredients
11) 2012 gross TOTAL PRODUCTS dollar sales:
( ) Not Sure

( ) $0 to $50 thousand
( ) >$50 to $100 thousand
( ) >$100 thousand to $0.5 million
( ) >$0.5 million to $1 million
( ) >$1 to $2 million
( ) >$2 to $3 million
( ) >$3 to $5 million
( ) >$5 to $10 million
( ) >$10 $15 million
( ) >$15 to $20 million
( ) >$20 to $25 million
( ) >$25 to $30 million
( ) >$30 to $40 million
( ) >$40 to $50 million
( ) >$50 to $60 million
( ) >$60 to $80 million
( ) >$80 to $100 million
( ) >$100 to $150 million
( ) >$150 to $200 million
( ) >$200 to $250 million
( ) >$250 to $300 million
( ) >$300 to $400 million
( ) >$400 to $500 million
( ) >$500 to $1 billion
( ) >$1 billion
12) 2012 gross ORGANIC PRODUCTS dollar sales:
( ) Not Sure
( ) $0 to $50 thousand
( ) >$50 to $100 thousand
( ) >$100 thousand to $0.5 million
( ) >$0.5 million to $1 million
( ) >$1 to $2 million
( ) >$2 to $3 million
( ) >$3 to $5 million
( ) >$5 to $10 million
( ) >$10 $15 million
( ) >$15 to $20 million
( ) >$20 to $25 million
( ) >$25 to $30 million
( ) >$30 to $40 million
( ) >$40 to $50 million
( ) >$50 to $60 million
( ) >$60 to $80 million
( ) >$80 to $100 million
( ) >$100 to $150 million
( ) >$150 to $200 million
( ) >$200 to $250 million
( ) >$250 to $300 million
( ) >$300 to $400 million
( ) >$400 to $500 million
( ) >$500 to $1 billion
( ) >$1 billion
Organic Sales
Information about your company's organic sales
Note: "Organic" includes:
"100% Organic"
"Organic" (95%+ organic)
"Made with organic ingredients" (70%+ organic)

For the following questions, enter leave blank if you cannot provide the data
13) Please provide percentage breakdowns of your company's TOTAL 2012 organic and
conventional sales If you do not know, please leave blank. If you had none, please enter "0". Total should sum to 100.
_______Organic Food & Beverage (see above definition)
_______Non-Certified Organic Food & Beverage (contains organic but does not fit above
definition)
_______Conventional Food & Beverage (contains no organics)
_______Organic Non-Food
_______Conventional Non-Food
14) What is the breakdown of your 2012 sales of ORGANIC products by organic category? If you do not know, please leave blank. If you had none, please enter "0". Total should sum to 100.
_______100% organic
_______95%+ organic
_______Made with organic ingredients (70%+ organic)
15) What percentage of your TOTAL sales were for products containing some
organic ingredients but less than 70 percent organic ingredients Please enter a whole number from 0 to 100. If you do not know, please leave blank.
____________________________________________
16) What is the breakdown of your company's 2012 sales of organic products by region? If you do not know, please leave blank. If you had none, please enter "0". Total should sum to 100.
_______United States - domestic sales
_______United States - agents or brokers for export
_______Canada
_______Mexico
_______Latin America/South America
_______Europe
_______Asia/Pacific
_______Australia/New Zealand
_______Africa
_______Middle East
17) Please give the percentage growth of your company's gross ORGANIC sales Please enter percentages as whole numbers (For example 4 for 4%). If you do not know, please enter "Not
Sure". If you weren't in business, please enter "NA".
Growth in 2010: _________________________
Growth in 2011: _________________________
Growth in 2012: _________________________
Growth forecast for 2013: _________________________
Organic Seal
18) Do you display the USDA Organic seal on any of your products?*
( ) Yes
( ) No
Organic Labeling
USDA Organic Seal/Organic Raw Materials

19) Is a lack of a dependable supply of organic raw materials limiting your company from
generating more sales of organic products?
( ) Never Jump to Q22
( ) Rarely
( ) Occasionally
( ) Frequently
( ) It's a major problem
20) How do you expect your use of organic ingredients to change over the next 3 years?
( ) Greatly increasing percent organic ingredients/products
( ) Somewhat increasing percent organic ingredients/products
( ) Steady percent organic ingredients/products
( ) Somewhat decreasing percent organic ingredients/products
( ) Greatly decreasing percent organic ingredients/products
Organic Raw Materials
21) Which organic raw material supplies need to be more reliable:
#1: Most important product needing dependable supply: _________________________
#2: Second most import product: _________________________
#3: Third most important product: _________________________
Canada
Canada

22) Did you source any ingredients from Canada in 2012?*
( ) Yes
( ) No Jump to Q24
Canada Sourcing
Canada
23) What is the value (in thousands of U.S. Dollars) of the ingredients you
sourced from Canada in 2012?
Please enter "NA" if you don't know
____________________________________________
Canada 2
Canada
24) Were any of your products available/sold in Canada in 2012?*
( ) Yes
( ) No Jump to Q27
Canada Selling
Canada
25) What is the value (in thousands of U.S. Dollars) of your products sold in
Canada in 2012? Please enter "NA" if you don't know
____________________________________________
26) If you are a U.S. based company, how has the U.S/Canadian Organic equivalency
agreement signed in 2009 affected your sales to Canada?
( ) New Company
( ) Greatly Reduced Sales
( ) Somewhat Reduced Sales
( ) Sales About Even
( ) Somewhat Increased Sales
( ) Greatly Increased Sales
( ) Not a U.S. based company
Canada 3
Canada
27) Are you a Canadian company?*
( ) Yes
( ) No Jump to Q31
Canadian Based
Canada
28) What was the value (in thousands of U.S. Dollars) of the products/ingredients
you imported into Canada from the US in 2012?
Please enter "NA" if you don't know
____________________________________________
29) Do you currently or do you plan to use the Canadian Organic seal on any of your
compliant products?
( ) Yes, using it now
( ) Yes, in the next year
( ) No
( ) Not sure
30) How has the U.S/Canadian Organic equivalency agreement signed in 2009 affected
your sales to the U.S.?
( ) New Company
( ) Greatly Reduced Sales
( ) Somewhat Reduced Sales
( ) Sales About Even
( ) Somewhat Increased Sales
( ) Greatly Increased Sales
Europe
31) Were any of your products available/sold in Europe in 2012?*
( ) Yes

( ) No Jump to Q34
32) What was the value (in thousands of U.S. Dollars) of your products sold in
Europe in 2012?
Please enter "NA" if you don't know
____________________________________________
33) If you are a U.S. based company, how has the U.S/European Organic equivalency
agreement signed in 2012 affected your sales to Europe?
( ) New Company
( ) Greatly Reduced Sales
( ) Somewhat Reduced Sales
( ) Sales About Even
( ) Somewhat Increased Sales
( ) Greatly Increased Sales
( ) Too early to Tell
() Not a U.S. based company
Sales Channel Breakdown
34) Sales Channel Breakdown: Please provide the percentage breakdown of your
company's TOTAL organic sales in 2012.
If you are a retailer, enter "100" next to the category that describes your type of store. If you do not know, please leave blank. If you had none, please enter "0". Total should sum to 100.
_______National Natural Grocery Chain (e.g. Whole Foods)
_______Regional Natural/Health Food/Co-op
_______Mass-market Grocery (e.g. Kroger)
_______Club/Warehouse Store (e.g. Costco, Sam's Club)
_______Mass Merchandiser (e.g. Wal-Mart)
_______Farmers Market/CSA
_______Food Service/Restaurant Supply
_______Internet
_______Mail Order
_______Direct Response TV/Radio
_______Boutique/Specialty
_______Department Store
_______Export
_______Ingredients sold to Manufacturers
_______Other channel
Product Categories
Organic Sales Categories
Beverages: Fresh Juice, Refrigerated packaged juice, Frozen Juice, Shelf-stable
juice, Soft drinks, Sports/Energy Drinks, Soymilk, Non-Soy Dairy Alternatives,
Beer, Wine, Liquor, Tea, Coffee, Cocoa, Coffee Substitutes
Baked Goods & Grains: Fresh Bread & Baked Goods, Frozen Baked Goods, In-
store Bakery, Cookies, Crackers/Rice Cakes, Baking Needs, Dry Breakfast
Food/Cereal, Grains, Pasta
Meat & Seafood: Beef, Lamb, Pork, Poultry, Fish, Canned Fish & Seafood,
Canned Meats & Meat Spreads
Fruit & Vegetables: Fresh Produce, Packaged & Branded Fresh Produce, Frozen
Fruits & Vegetables, Canned Fruits & Vegetables, Dried Fruits & Vegetables,
Dried Beans
Dairy: Milk/Cream, Cheese, Butter, Eggs, Yogurt, Ice Cream, Sour Cream,
Cottage Cheese, Canned Milk
Snacks: Chocolate/Candy Bars, Other Candy & Gum, Nuts, Salty Snacks,
Nutrition Bars
Packaged/Prepared Foods:Frozen Prepared Foods, Refrigerated Prepared
Foods, Canned Prepared Foods, Dried Prepared Foods, Food Service/Deli, Baby
Food, Baby & Infant Formula, Meat Alternatives & Veggie Burgers, Tofu &
Tempeh Products, Soup, Pasta Sauces, Nut Butters, Desserts
Condiments: Salad Dressings, Salsa, Dips, Jams & Preserves, Ethnic Sauces,
Ketchup, Other condiments, Spices, Oils, Shortening, and Cooking Sprays,
Sugar, Syrup, and Sweeteners
Personal Care: Hair Care, Skin Care, Cosmetics, Oral Care,
Aromatherapy/Fragrances, Soap & Bath, Deodorants, Nail care, Feminine

hygiene, Shaving products, Tissues, Swabs, & Wipes, Baby Care
Clothing & Fibers: Men's Clothing, Women's Clothing Children & Teen's
Clothing, Infant Clothing & Diapers, Sheets & Towels, Table Linens, Mattresses
& Pillows, Furniture, Fabric
Household Products: Pet Food, Flowers, Laundry, Dishwashing, Cleaning
Supplies, Other Household Goods
Nutritional Supplements: Vitamins, Minerals, Herbs & Botanicals, Sports
Nutrition, Meal Replacement, Specialty & Homeopathic
Organic Seeds, Rootstock and Seed Treatment: Seeds, Rootstock, Planting Stock,
Seed treatments, Seed Additives (not seeds to eat)
For the following questions, please enter "Not sure" if you can't provide the data. Leave blank or enter "0" if
you have no sales in the category
35) Please indicate your company's TOTAL ORGANIC 2012 sales in these categories
(U.S. Dollar value in thousands)
_______Beverages
_______Baked Goods & Grains
_______Meat and Seafood
_______Fruits and Vegetables
_______Dairy
_______Snacks
_______Packaged/Prepared Foods
_______Condiments
_______Nutritional Supplements
_______Personal Care
_______Clothing & Fibers
_______Household Products
_______Other
Private Label
Private Label

For the following questions, please leave blank if you can't provide the data. Please enter "0" if you have no
sales in the category
36) Please provide percentage breakdowns of your company's TOTAL ORGANIC sales in
2012 If you do not know, please leave blank or if you had none, please enter "0". Total should sum to 100.
_______Contract Manufacturing
_______Private Label Manufacturing
_______Branded Products
37) Please indicate what percentage of your company's 2012 ORGANIC PRIVATE
LABEL sales were in each product category. If you are not sure or had none, please leave blank. If you had some private label sales, total should sum to 100.
_______Beverages
_______Baked Goods & Grains
_______Meat and Seafood
_______Fruits and Vegetables
_______Dairy
_______Snacks
_______Packaged/Prepared Foods
_______Condiments
_______Nutritional Supplements
_______Personal Care
_______Clothing & Fibers
_______Household Products
38) What was your company's 2012 sales growth for Private Label products in each
ORGANIC category? Please enter percent growth as a whole number (For example enter 2% as 2). If you do not participate in a
category, please leave blank.
Beverages: _________________________
Baked Goods & Grains: _________________________

Meat and Seafood: _________________________
Fruits and Vegetables: _________________________
Dairy: _________________________
Snacks: _________________________
Packaged/Prepared Foods: _________________________
Condiments: _________________________
Nutritional Supplements: _________________________
Personal Care: _________________________
Clothing & Fibers: _________________________
Household Products: _________________________
39) For the TOTAL ORGANIC INDUSTRY, please estimate what percentage of each
organic category's 2012 sales were Private Label products.
Percent of total
organic industry
Beverages ___
Baked Goods & Grains ___
Meat and Seafood ___
Fruits and Vegetables ___
Dairy ___
Snacks ___
Packaged/Prepared Foods ___
Condiments ___
Nutritional Supplements ___
Personal Care ___
Clothing & Fibers ___
Household Products ___
40) Please indicate which organic product categories you participate in (check all that
apply)*
[ ] Beverages Jump to Q42
[ ] Baked Goods & Grains Jump to Q48

[ ] Meat & Seafood Jump to Q54
[ ] Fruits and Vegetables Jump to Q60
[ ] Dairy Jump to Q66
[ ] Snacks Jump to Q72
[ ] Packaged/Prepared Foods Jump to Q78
[ ] Condiments Jump to Q84
[ ] Nutritional Supplements Jump to Q90
[ ] Personal Care Jump to Q96
[ ] Clothing & Fibers Jump to Q105
[ ] Household Products Jump to Q113
[ ] Other Jump to Q118
Jump to the first category in which you participate
Beverages
Sales Category Details
Beverages
Fresh Juice
Refrigerated packaged juice
Frozen Juice
Shelf-stable juice
Soft drinks (soda pop, RTD tea & coffee)
Sports/Energy Drinks
Soymilk
Non-Soy Dairy Alternatives (i.e. rice, oat, nut milk)
Beer
Wine
Liquor
Tea (dry)
Coffee (dry: bulk & packaged)
Cocoa
Coffee Substitutes

41) Beverages: Do you sell organic beverages?*
( ) Yes
( ) No Jump to Q47
Beverages Part 2
Sales Category Details
Please provide the following information for each type of organic product that
you sell:
1. Your company's 2012 sales, in U.S. $ thousands
2. Growth in that product's sales in 2012 and your forecasts for 2013.
For the following questions, please leave blank if you had no sales in the category. If you cannot provide the
data, please enter "NA"
42) Your company's 2012 organic sales (U.S. Dollar value in thousands)
_______Fresh Juice
_______Refrigerated packaged juice
_______Frozen Juice
_______Shelf-stable juice
_______Soft drinks (soda pop, RTD tea & coffee)
_______Sports/Energy Drinks
_______Soymilk
_______Non-Soy Dairy Alternatives (i.e., rice, oat, nut milk)
_______Beer
_______Wine
_______Liquor
_______Tea (dry)
_______Coffee (dry: bulk & packaged)
_______Cocoa
_______Coffee Substitutes
_______Other
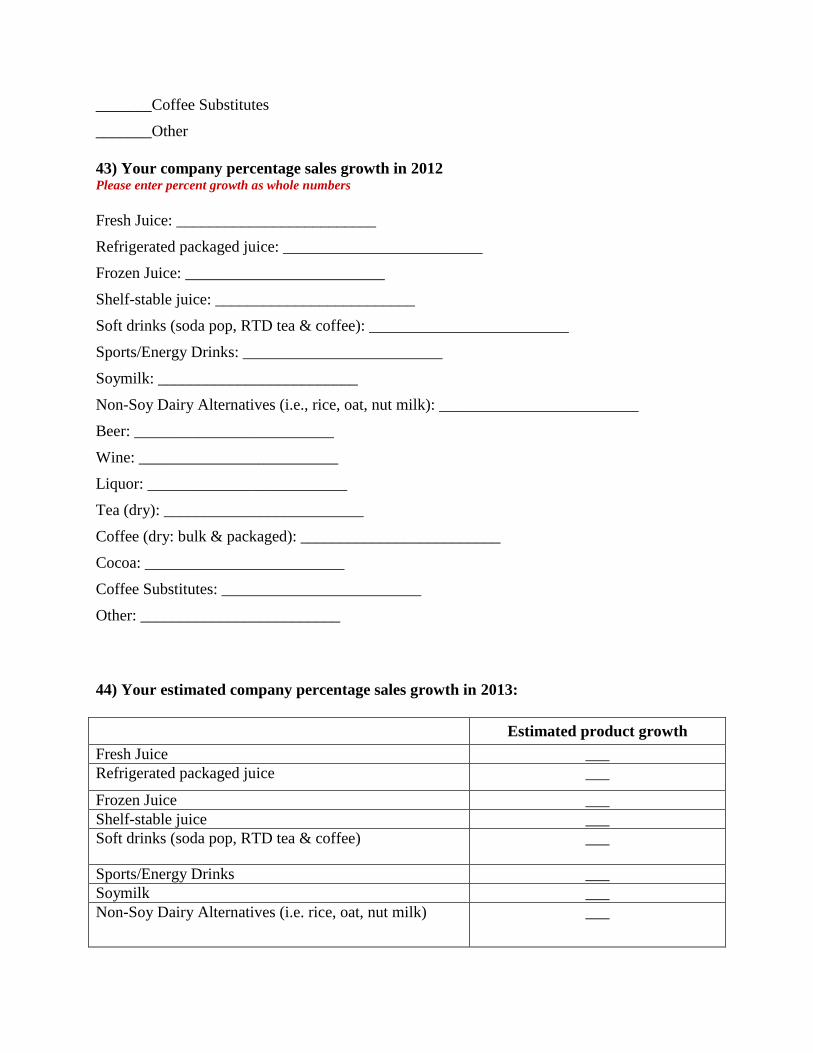
43) Your company percentage sales growth in 2012 Please enter percent growth as whole numbers
Fresh Juice: _________________________
Refrigerated packaged juice: _________________________
Frozen Juice: _________________________
Shelf-stable juice: _________________________
Soft drinks (soda pop, RTD tea & coffee): _________________________
Sports/Energy Drinks: _________________________
Soymilk: _________________________
Non-Soy Dairy Alternatives (i.e., rice, oat, nut milk): _________________________
Beer: _________________________
Wine: _________________________
Liquor: _________________________
Tea (dry): _________________________
Coffee (dry: bulk & packaged): _________________________
Cocoa: _________________________
Coffee Substitutes: _________________________
Other: _________________________
44) Your estimated company percentage sales growth in 2013:
Estimated product growth
Fresh Juice ___
Refrigerated packaged juice ___
Frozen Juice ___
Shelf-stable juice ___
Soft drinks (soda pop, RTD tea & coffee) ___
Sports/Energy Drinks ___
Soymilk ___
Non-Soy Dairy Alternatives (i.e. rice, oat, nut milk) ___

Beer ___
Wine ___
Liquor ___
Tea (dry) ___
Coffee (dry: bulk & packaged) ___
Cocoa ___
Coffee Substitutes ___
Other ___
45) Estimated and forecast overall organic beverage industry sales growth in...
Estimated
product
growth
2012 ___
2013 ___
2014 ___
46) Do you feel there are there any overarching issues driving the organic
beverage industry that should be addressed?
Baked Goods & Grains
Baked Goods & Grains
Fresh Bread & Baked Goods (i.e. bread, rolls, cakes)
Frozen Baked Goods (i.e. bread, bagels, waffles, cakes, pies)
In-store Bakery
Cookies
Crackers/Rice Cakes
Baking Needs (flour, mixes, yeast, etc.)
Dry Breakfast Food/Cereal
Grains (rice, millet, bulgar, etc.)
Pasta
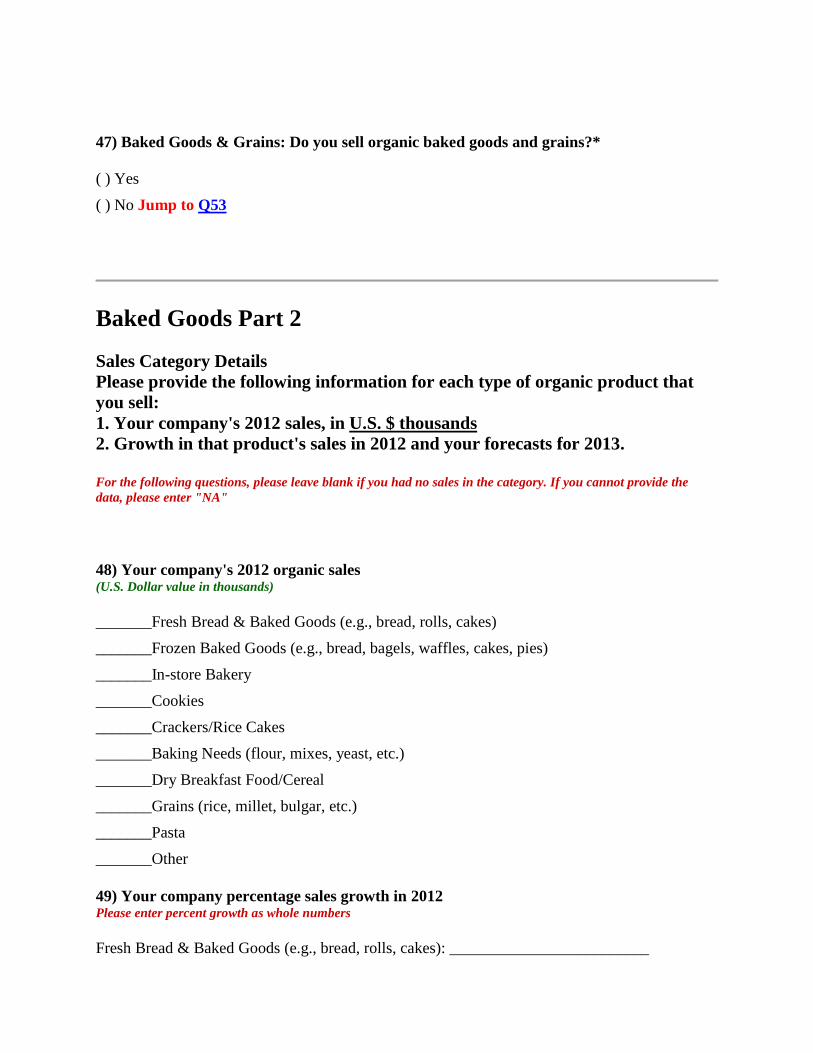
47) Baked Goods & Grains: Do you sell organic baked goods and grains?*
( ) Yes
( ) No Jump to Q53
Baked Goods Part 2
Sales Category Details
Please provide the following information for each type of organic product that
you sell:
1. Your company's 2012 sales, in U.S. $ thousands
2. Growth in that product's sales in 2012 and your forecasts for 2013.
For the following questions, please leave blank if you had no sales in the category. If you cannot provide the
data, please enter "NA"
48) Your company's 2012 organic sales (U.S. Dollar value in thousands)
_______Fresh Bread & Baked Goods (e.g., bread, rolls, cakes)
_______Frozen Baked Goods (e.g., bread, bagels, waffles, cakes, pies)
_______In-store Bakery
_______Cookies
_______Crackers/Rice Cakes
_______Baking Needs (flour, mixes, yeast, etc.)
_______Dry Breakfast Food/Cereal
_______Grains (rice, millet, bulgar, etc.)
_______Pasta
_______Other
49) Your company percentage sales growth in 2012 Please enter percent growth as whole numbers
Fresh Bread & Baked Goods (e.g., bread, rolls, cakes): _________________________

Frozen Baked Goods (e.g., bread, bagels, waffles, cakes, pies): _________________________
In-store Bakery: _________________________
Cookies: _________________________
Crackers/Rice Cakes: _________________________
Baking Needs (flour, mixes, yeast, etc.): _________________________
Dry Breakfast Food/Cereal: _________________________
Grains (rice, millet, bulgar, etc.): _________________________
Pasta: _________________________
Other: _________________________
50) Your estimated company percentage sales growth in 2013:
Estimated product growth
Fresh Bread & Baked Goods (e.g., bread, rolls,
cakes)
___
Frozen Baked Goods (e.g., bread, bagels, waffles,
cakes, pies)
___
In-store Bakery ___
Cookies ___
Crackers/Rice Cakes ___
Baking Needs (flour, mixes, yeast, etc.) ___
Dry Breakfast Food/Cereal ___
Grains (rice, millet, bulgar, etc.) ___
Pasta ___
Other ___
51) Estimated overall organic baked goods industry sales growth in...
Estimated product
growth
2012 ___
2013 ___
2014 ___
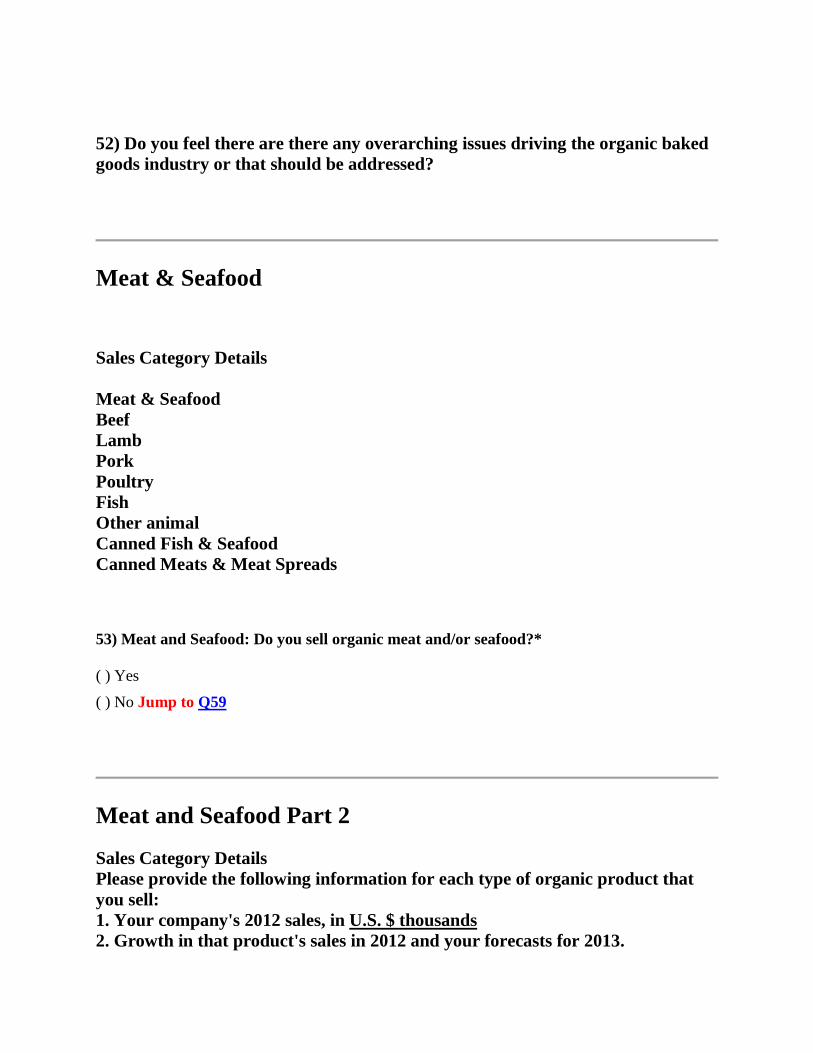
52) Do you feel there are there any overarching issues driving the organic baked
goods industry or that should be addressed?
Meat & Seafood
Sales Category Details
Meat & Seafood
Beef
Lamb
Pork
Poultry
Fish
Other animal
Canned Fish & Seafood
Canned Meats & Meat Spreads
53) Meat and Seafood: Do you sell organic meat and/or seafood?*
( ) Yes
( ) No Jump to Q59
Meat and Seafood Part 2
Sales Category Details
Please provide the following information for each type of organic product that
you sell:
1. Your company's 2012 sales, in U.S. $ thousands
2. Growth in that product's sales in 2012 and your forecasts for 2013.

For the following questions, please leave blank if you had no sales in the category. If you cannot provide the
data, please enter "NA"
54) Your company's 2012 organic sales (U.S. Dollar value in thousands)
_______Beef
_______Lamb
_______Pork
_______Poultry
_______Fish
_______Canned Fish & Seafood
_______Canned Meats & Meat Spreads
_______Other
55) Your company percentage sales growth in 2012 Please enter percent growth as whole numbers
Beef: _________________________
Lamb: _________________________
Pork: _________________________
Poultry: _________________________
Fish: _________________________
Canned Fish & Seafood: _________________________
Canned Meats & Meat Spreads: _________________________
Other: _________________________
56) Your estimated company percentage sales growth in 2013:
Estimated product growth
Beef ___
Lamb ___
Pork ___

Poultry ___
Fish ___
Canned Fish & Seafood ___
Canned Meats & Meat
Spreads
___
Other ___
57) Estimated overall organic meat and seafood industry sales growth in...
Estimated
product
growth
2012 ___
2013 ___
2014 ___
58) Do you feel there are there any overarching issues driving the organic meat
& seafood industry or that should be addressed?
Fruit and Vegetables
Fruit & Vegetables
Fresh Produce (bulk or loose)
Packaged & Branded Fresh Produce
Frozen Fruits & Vegetables
Canned Fruits & Vegetables
Dried Fruits & Vegetables
Dried Beans
59) Fruit & Vegetables: Do you sell organic fruits & vegetables?*
( ) Yes

( ) No Jump to Q65
Fruit and Vegetables Part 2
Sales Category Details
Please provide the following information for each type of organic product that
you sell:
1. Your company's 2012 sales, in U.S. $ thousands
2. Growth in that product's sales in 2012 and your forecasts for 2013.
For the following questions, please leave blank if you had no sales in the category. If you cannot provide the
data, please enter "NA".
60) Your company's 2012 organic sales (U.S. Dollar value in thousands)
_______Fresh Produce (bulk or loose)
_______Packaged & Branded Fresh Produce
_______Frozen Fruits & Vegetables
_______Canned Fruits & Vegetables
_______Dried Fruits & Vegetables
_______Dried Beans
_______Other
61) Your company percentage sales growth in 2012 Please enter percent growth as whole numbers
Fresh Produce (bulk or loose): _________________________
Packaged & Branded Fresh Produce: _________________________
Frozen Fruits & Vegetables: _________________________
Canned Fruits & Vegetables: _________________________
Dried Fruits & Vegetables: _________________________
Dried Beans: _________________________
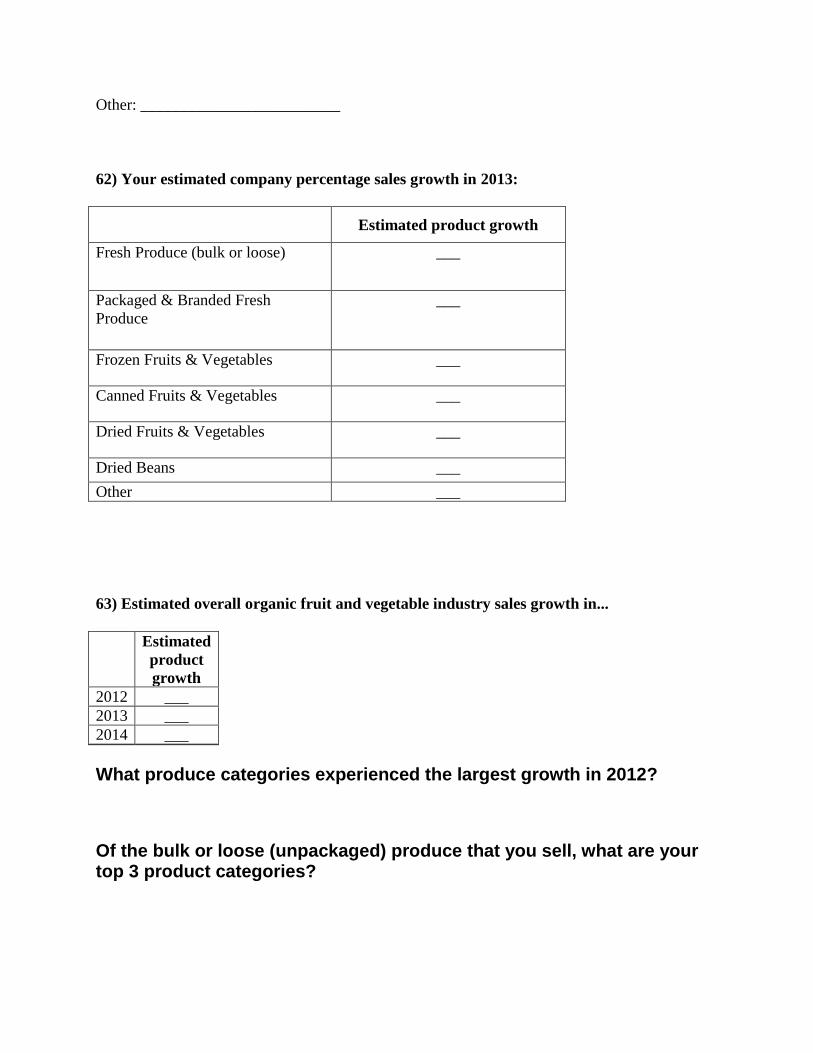
Other: _________________________
62) Your estimated company percentage sales growth in 2013:
Estimated product growth
Fresh Produce (bulk or loose) ___
Packaged & Branded Fresh
Produce
___
Frozen Fruits & Vegetables ___
Canned Fruits & Vegetables ___
Dried Fruits & Vegetables ___
Dried Beans ___
Other ___
63) Estimated overall organic fruit and vegetable industry sales growth in...
Estimated
product
growth
2012 ___
2013 ___
2014 ___
What produce categories experienced the largest growth in 2012?
Of the bulk or loose (unpackaged) produce that you sell, what are your top 3 product categories?

Of the packaged and branded produce that you sell, what are your top 3 product categories (by highest sales volume)
What surprising sales trends are you seeing in the produce category right now? (for example, newly popular products, products that aren't selling, new varieties, etc.)
64) Do you feel there are there any overarching issues driving the organic fruit &
vegetable industry or that should be addressed?
For 2012, OTA is conducting a deep dive into the produce segment. Would you be available for a follow-up interview on this topic? ()Yes
()No
Dairy
Dairy
Milk/Cream
Cheese
Butter
Eggs
Yogurt
Ice Cream
Sour Cream
Cottage Cheese
Canned Milk
65) Dairy: Do you sell organic dairy?*
( ) Yes

( ) No Jump to Q71
Dairy Part 2
Sales Category Details
Please provide the following information for each type of organic product that
you sell:
1. Your company's 2012 sales, in U.S. $ thousands
2. Growth in that product's sales in 2012 and your forecasts for 2013.
For the following questions, please leave blank if you had no sales in the category. If you cannot provide the
data, please enter "NA".
66) Your company's 2012 organic sales (U.S. Dollar value in thousands)
_______Milk/Cream
_______Cheese
_______Butter
_______Eggs
_______Yogurt
_______Ice Cream
_______Sour Cream
_______Cottage Cheese
_______Canned Milk
_______Other
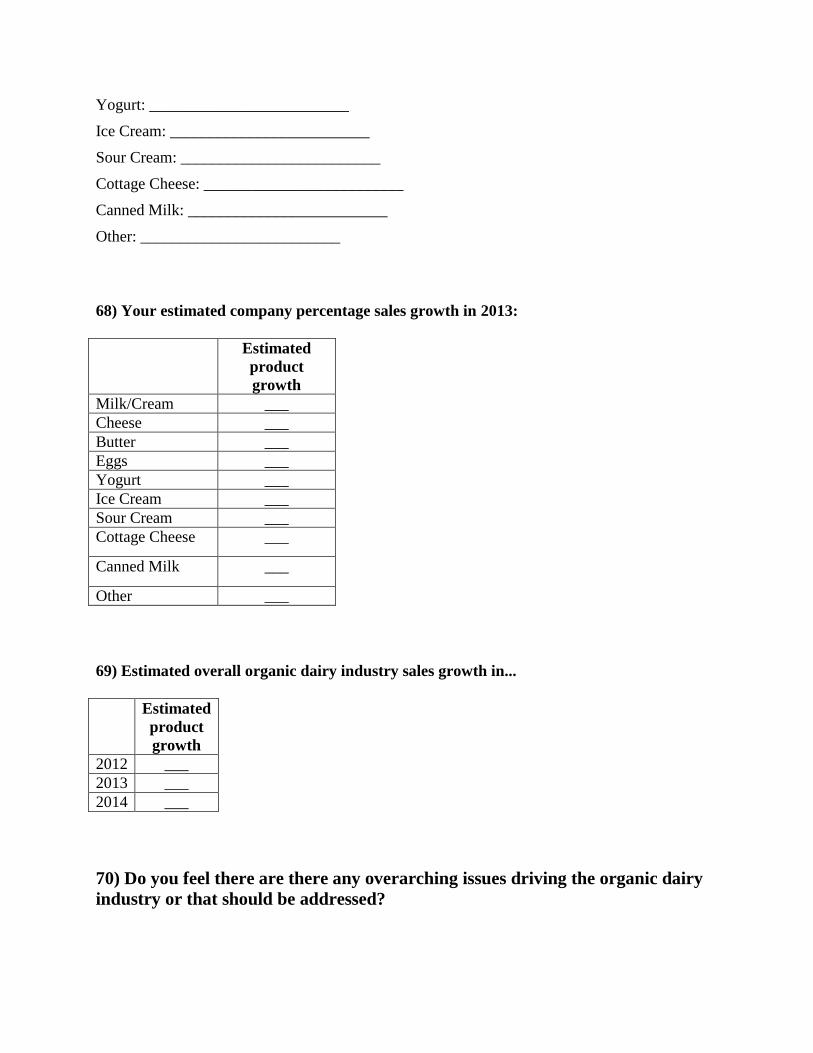
67) Your company percentage sales growth in 2012 Please enter percent growth as whole numbers
Milk/Cream: _________________________
Cheese: _________________________
Butter: _________________________
Eggs: _________________________
Yogurt: _________________________
Ice Cream: _________________________
Sour Cream: _________________________
Cottage Cheese: _________________________
Canned Milk: _________________________
Other: _________________________
68) Your estimated company percentage sales growth in 2013:
Estimated
product
growth
Milk/Cream ___
Cheese ___
Butter ___
Eggs ___
Yogurt ___
Ice Cream ___
Sour Cream ___
Cottage Cheese ___
Canned Milk ___
Other ___
69) Estimated overall organic dairy industry sales growth in...
Estimated
product
growth
2012 ___
2013 ___
2014 ___
70) Do you feel there are there any overarching issues driving the organic dairy
industry or that should be addressed?

Snacks
Snacks
Chocolate/Candy Bars
Other Candy & Gum
Nuts (bulk & packaged)
Salty Snacks (chips, pretzels, popcorn)
Nutrition Bars
71) Snacks: Do you sell organic snacks?*
( ) Yes
( ) No Jump to Q77
Snacks Part 2
Sales Category Details
Please provide the following information for each type of organic product that
you sell:
1. Your company's 2012 sales, in U.S. $ thousands
2. Growth in that product's sales in 2012 and your forecasts for 2013.
For the following questions, please leave blank if you had no sales in the category. If you cannot provide the
data, please enter "NA".
72) Your company's 2012 organic sales (U.S. Dollar value in thousands)
_______Chocolate/Candy Bars
_______Other Candy & Gum
_______Nuts (bulk & packaged)

_______Salty Snacks (chips, pretzels, popcorn)
_______Nutrition Bars
_______Other
73) Your company percentage sales growth in 2012 Please enter percent growth as whole numbers
Chocolate/Candy Bars: _________________________
Other Candy & Gum: _________________________
Nuts (bulk & packaged): _________________________
Salty Snacks (chips, pretzels, popcorn): _________________________
Nutrition Bars: _________________________
Other: _________________________
74) Your estimated company percentage sales growth in 2013:
Estimated
product growth
Chocolate/Candy Bars ___
Other Candy & Gum ___
Nuts (bulk & packaged) ___
Salty Snacks (chips, pretzels, popcorn) ___
Nutrition Bars ___
Other ___
75) Estimated overall organic snacks industry sales growth in...
Estimated
product
growth
2012 ___
2013 ___
2014 ___
76) Do you feel there are there any overarching issues driving the organic snack
industry or that should be addressed?
Packaged/Prepared Foods
Packaged/Prepared Foods
Frozen Prepared Foods (i.e. dinners, pies, pizza, ethnic, sandwiches)
Refrigerated Prepared Foods
Canned Prepared Foods (i.e. chili, pasta, ethnic, stew)
Dried Prepared Foods (i.e. dinners, rice, stuffing, etc.)
Food Service/Deli
Baby Food (excluding formula)
Baby & Infant Formula
Meat Alternatives & Veggie Burgers
Tofu & Tempeh Products
Soup (canned, packaged, dry, broth)
Pasta Sauces
Nut Butters
Desserts (gelatin, pudding, toppings)
77) Packaged/Prepared Foods: Do you sell organic packaged/prepared foods?*
( ) Yes
( ) No Jump to Q83
Packaged/Prepared Foods Part 2
Sales Category Details
Please provide the following information for each type of organic product that

you sell:
1. Your company's 2012 sales, in U.S. $ thousands
2. Growth in that product's sales in 2012 and your forecasts for 2013.
For the following questions, please leave blank if you had no sales in the category. If you cannot provide the
data, please enter "NA".
78) Your company's 2012 organic sales (U.S. Dollar value in thousands)
_______Frozen Prepared Foods (i.e. dinners, pies, pizza, ethnic, sandwiches)
_______Refrigerated Prepared Foods
_______Canned Prepared Foods (i.e. chili, pasta, ethnic, stew)
_______Dried Prepared Foods (i.e. dinners, rice, stuffing, etc.)
_______Food Service/Deli
_______Baby Food (excluding formula)
_______Baby & Infant Formula
_______Meat Alternatives & Veggie Burgers
_______Tofu & Tempeh Products
_______Soup (canned, packaged, dry, broth)
_______Pasta Sauces
_______Nut Butters
_______Desserts (gelatin, pudding, toppings)
_______Other
79) Your company percentage sales growth in 2012 Please enter percent growth as whole numbers
Frozen Prepared Foods (i.e. dinners, pies, pizza, ethnic, sandwiches):
_________________________
Refrigerated Prepared Foods: _________________________
Canned Prepared Foods (i.e. chili, pasta, ethnic, stew): _________________________
Dried Prepared Foods (i.e. dinners, rice, stuffing, etc.): _________________________
Food Service/Deli: _________________________
Baby Food (excluding formula): _________________________

Baby & Infant Formula: _________________________
Meat Alternatives & Veggie Burgers: _________________________
Tofu & Tempeh Products: _________________________
Soup (canned, packaged, dry, broth): _________________________
Pasta Sauces: _________________________
Nut Butters: _________________________
Desserts (gelatin, pudding, toppings): _________________________
Other: _________________________
80) Your estimated company percentage sales growth in 2013:
Estimated product growth
Frozen Prepared Foods (i.e. dinners, pies, pizza, ethnic,
sandwiches)
___
Refrigerated Prepared Foods ___
Canned Prepared Foods (i.e. chili, pasta, ethnic, stew) ___
Dried Prepared Foods (i.e. dinners, rice, stuffing, etc.) ___
Food Service/Deli ___
Baby Food (excluding formula) ___
Baby & Infant Formula ___
Meat Alternatives & Veggie Burgers ___
Tofu & Tempeh Products ___
Soup (canned, packaged, dry, broth) ___
Pasta Sauces ___
Nut Butters ___
Desserts (gelatin, pudding, toppings) ___
Other ___
81) Estimated overall organic packaged/prepared foods industry sales growth in...
Estimated
product
growth
2012 ___
2013 ___
2014 ___
82) Do you feel there are there any overarching issues driving the organic
packaged/prepared foods industry or that should be addressed?
Condiments
Condiments:
Salad Dressings
Salsa
Dips
Jams & Preserves
Ethnic Sauces (soy, hot sauce, etc)
Ketchup
Other condiments (i.e. may, mustard, olives, pickles)
Spices
Oils, Shortening, and Cooking Sprays
Sugar, Syrup, and Sweeteners
83) Condiments: Do you sell organic condiments?*
( ) Yes
( ) No Jump to Q89
Condiments Part 2
Sales Category Details
Please provide the following information for each type of organic product that
you sell:
1. Your company's 2012 sales, in U.S. $ thousands
2. Growth in that product's sales in 2012 and your forecasts for 2013.
For the following questions, please leave blank if you had no sales in the category. If you cannot provide the
data, please enter "NA".
84) Your company's 2012 organic sales (U.S. Dollar value in thousands)
_______Salad Dressings
_______Salsa
_______Dips
_______Jams & Preserves
_______Ethnic Sauces (soy, hot sauce, etc)
_______Ketchup
_______Other condiments (i.e. may, mustard, olives, pickles)
_______Spices
_______Oils, Shortening, and Cooking Sprays
_______Sugar, Syrup, and Sweeteners
_______Other
85) Your company percentage sales growth in 2012 Please enter percent growth as whole numbers
Salad Dressings: _________________________
Salsa: _________________________
Dips: _________________________
Jams & Preserves: _________________________
Ethnic Sauces (soy, hot sauce, etc): _________________________
Ketchup: _________________________
Other condiments (i.e. may, mustard, olives, pickles): _________________________
Spices: _________________________
Oils, Shortening, and Cooking Sprays: _________________________
Sugar, Syrup, and Sweeteners: _________________________
Other: _________________________

86) Your estimated company percentage sales growth in 2013:
Estimated product growth
Salad Dressings ___
Salsa ___
Dips ___
Jams & Preserves ___
Ethnic Sauces (soy, hot sauce, etc) ___
Ketchup ___
Other condiments (i.e. may, mustard, olives, pickles) ___
Spices ___
Oils, Shortening, and Cooking Sprays ___
Sugar, Syrup, and Sweeteners ___
Other ___
87) Estimated overall organic condiments industry sales growth in...
Estimated
product
growth
2012 ___
2013 ___
2014 ___
88) Do you feel there are there any overarching issues driving the organic
packaged/prepared foods industry or that should be addressed?
Nutritional Supplements

Nutritional Supplements
Vitamins
Minerals
Herbs & Botanicals
Sports Nutrition
Meal Replacement
Specialty & Homeopathic
89) Nutritional Supplements: Do you sell organic nutritional supplements?*
( ) Yes
( ) No Jump to Q95
Nutritional Supplements Part 2
Sales Category Details
Please provide the following information for each type of organic product that
you sell:
1. Your company's 2012 sales, in U.S. $ thousands
2. Growth in that product's sales in 2012 and your forecasts for 2013.
For the following questions, please leave blank if you had no sales in the category. If you cannot provide the
data, please enter "NA"
90) Your company's 2012 organic sales (U.S. Dollar value in thousands)
_______Vitamins
_______Minerals
_______Herbs & Botanicals
_______Sports Nutrition
_______Meal Replacement
_______Specialty & Homeopathic
_______Other
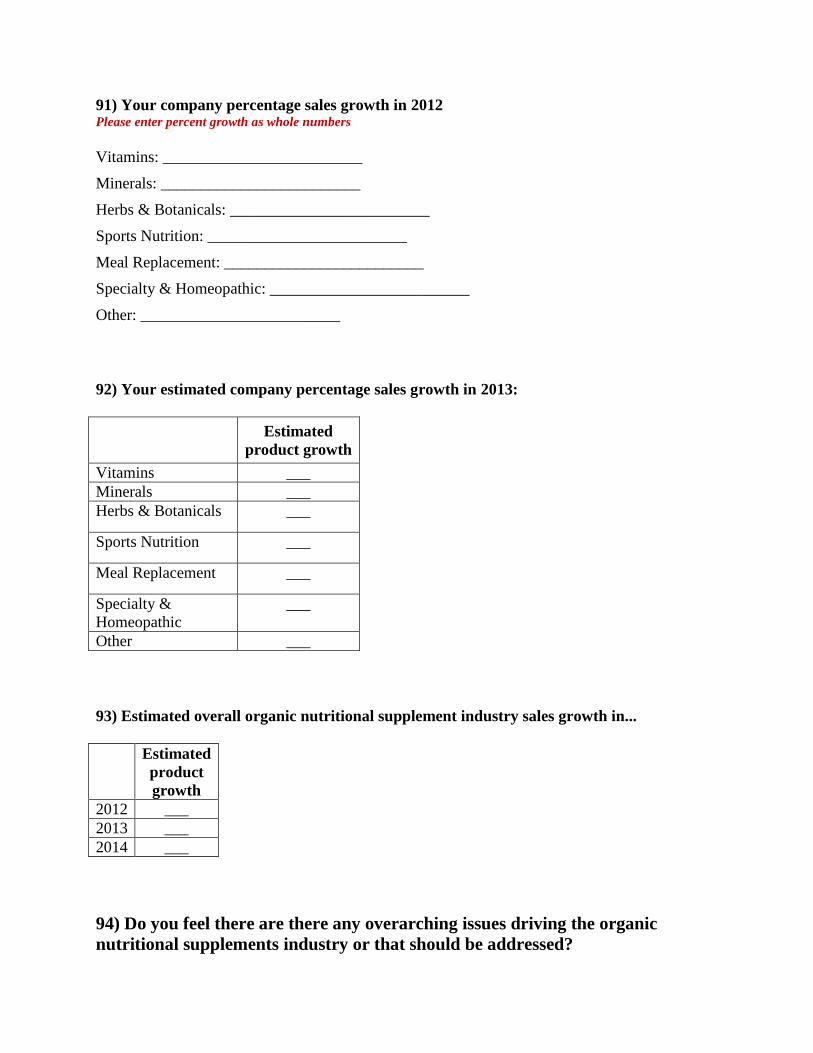
91) Your company percentage sales growth in 2012 Please enter percent growth as whole numbers
Vitamins: _________________________
Minerals: _________________________
Herbs & Botanicals: _________________________
Sports Nutrition: _________________________
Meal Replacement: _________________________
Specialty & Homeopathic: _________________________
Other: _________________________
92) Your estimated company percentage sales growth in 2013:
Estimated
product growth
Vitamins ___
Minerals ___
Herbs & Botanicals ___
Sports Nutrition ___
Meal Replacement ___
Specialty &
Homeopathic
___
Other ___
93) Estimated overall organic nutritional supplement industry sales growth in...
Estimated
product
growth
2012 ___
2013 ___
2014 ___
94) Do you feel there are there any overarching issues driving the organic
nutritional supplements industry or that should be addressed?
Personal Care
Personal Care:
Hair Care (shampoo, conditioner, colors, gel)
Skin Care (non-cosmetic lotions, cleansers, etc.)
Cosmetics (facial, colors, lipstick)
Oral Care (toothpaste, mouthwash, floss, brushes)
Aromatherapy/Fragrances
Soap & Bath
Deodorants
Nail care
Feminine hygiene
Shaving products
Tissues, Swabs, & Wipes
Baby Care
95) Personal Care: Do you sell organic personal care products?*
( ) Yes
( ) No Jump to Q104
Personal Care Part 2
Sales Category Details
Please provide the following information for each type of organic product that
you sell:
1. Your company's 2012 sales, in U.S. $ thousands
2. Growth in that product's sales in 2012 and your forecasts for 2013.
For the following questions, please leave blank if you had no sales in the category. If you cannot provide the
data, please enter "NA"
96) Your company's 2012 organic sales (U.S. Dollar value in thousands)
_______Hair Care (shampoo, conditioner, colors, gel)
_______Skin Care (non-cosmetic lotions, cleansers, etc.)
_______Cosmetics (facial, colors, lipstick)
_______Oral Care (toothpaste, mouthwash, floss, brushes)
_______Aromatherapy/Fragrances
_______Soap & Bath
_______Deodorants
_______Nail care
_______Feminine hygiene
_______Shaving products
_______Tissues, Swabs, & Wipes
_______Baby Care
_______Other
97) Your company percentage sales growth in 2012 Please enter percent growth as whole numbers
Hair Care (shampoo, conditioner, colors, gel): _________________________
Skin Care (non-cosmetic lotions, cleansers, etc.): _________________________
Cosmetics (facial, colors, lipstick): _________________________
Oral Care (toothpaste, mouthwash, floss, brushes): _________________________
Aromatherapy/Fragrances: _________________________
Soap & Bath: _________________________
Deodorants: _________________________
Nail care: _________________________
Feminine hygiene: _________________________
Shaving products: _________________________
Tissues, Swabs, & Wipes: _________________________
Baby Care: _________________________

Other: _________________________
98) Your estimated company percentage sales growth in 2013:
Estimated product
growth
Hair Care (shampoo, conditioner, colors, gel) ___
Skin Care (non-cosmetic lotions, cleansers, etc.) ___
Cosmetics (facial, colors, lipstick) ___
Oral Care (toothpaste, mouthwash, floss, brushes) ___
Aromatherapy/Fragrances ___
Soap & Bath ___
Deodorants ___
Nail care ___
Feminine hygiene ___
Shaving products ___
Tissues, Swabs, & Wipes ___
Baby Care ___
Other ___
99) Estimated overall organic personal care industry sales growth in...
Estimated
product
growth
2012 ___
2013 ___
2014 ___
100) Do you feel there are there any overarching issues driving the organic
personal care industry or that should be addressed?
Personal Care Part 3

101) What percentage of your organic personal care products carry the following
certification?
If you don't know, please enter "0". Total should sum to 100.
_______Certified to a private standard
_______NOP certified
_______Other certifier (please specify)
_______Not certified
102) Do you anticipate seeking any change in your certification in the next 12 months?
Start
Using
Greatly
Increase
Somewhat
Increase
No
Change
Somewhat
Decrease
Greatly
Decrease
Stop
Using
3rd party
private
certification
( ) ( ) ( ) ( ) ( ) ( ) ( )
NOP
certification
( ) ( ) ( ) ( ) ( ) ( ) ( )
Other
certifier
( ) ( ) ( ) ( ) ( ) ( ) ( )
103) Comments Concerning Certification:
Clothing & Fibers
Clothing & Fibers
Men's Clothing
Women's Clothing
Children & Teen's Clothing
Infant Clothing & Diapers
Sheets & Towels
Table Linens
Mattresses & Pillows
Fabric
104) Clothing & Fibers: Do you sell organic clothing & fibers?*
( ) Yes
( ) No Jump to Q112
Clothing & Fibers Part 2
Sales Category Details
Please provide the following information for each type of organic product that
you sell:
1. Your company's 2012 sales, in U.S. $ thousands
2. Growth in that product's sales in 2012 and your forecasts for 2013.
For the following questions, please leave blank if you had no sales in the category. If you cannot provide the
data, please enter "NA"
105) Your company's 2012 organic sales (U.S. Dollar value in thousands)
_______Men's Clothing
_______Women's Clothing
_______Children & Teen's Clothing
_______Infant Clothing & Diapers
_______Sheets & Towels
_______Table Linens
_______Mattresses & Pillows
_______Fabric
_______Other

If other organic clothing & fiber products, please specify:
____________________________________________
106) Your company percentage sales growth in 2012 Please enter percent growth as whole numbers
Men's Clothing: _________________________
Women's Clothing: _________________________
Children & Teen's Clothing: _________________________
Infant Clothing & Diapers: _________________________
Sheets & Towels: _________________________
Table Linens: _________________________
Mattresses & Pillows: _________________________
Fabric: _________________________
Other: _________________________
107) Your estimated company percentage sales growth in 2013:
Estimated product growth
Men's Clothing ___
Women's Clothing ___
Children & Teen's Clothing ___
Infant Clothing & Diapers ___
Sheets & Towels ___
Table Linens ___
Mattresses & Pillows ___
Fabric ___
Other ___
108) Estimated overall organic clothing & fibers industry sales growth in...
Estimated
product
growth
2012 ___
2013 ___
2014 ___
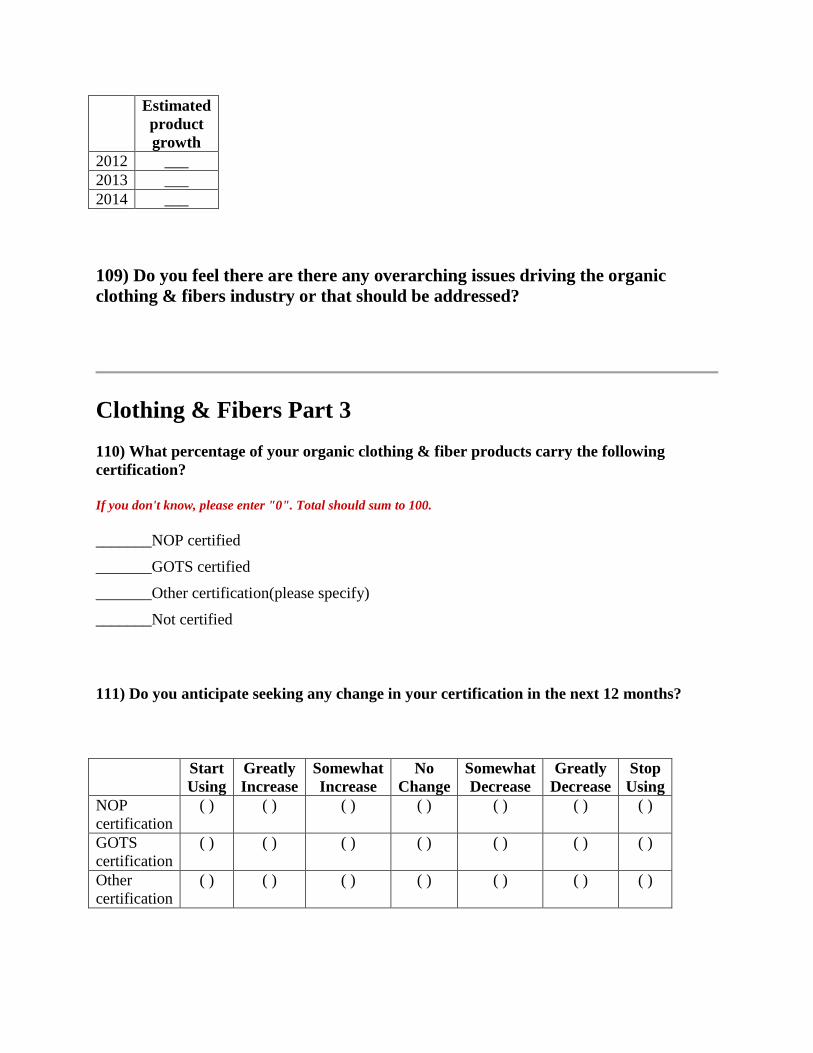
109) Do you feel there are there any overarching issues driving the organic
clothing & fibers industry or that should be addressed?
Clothing & Fibers Part 3
110) What percentage of your organic clothing & fiber products carry the following
certification?
If you don't know, please enter "0". Total should sum to 100.
_______NOP certified
_______GOTS certified
_______Other certification(please specify)
_______Not certified
111) Do you anticipate seeking any change in your certification in the next 12 months?
Start
Using
Greatly
Increase
Somewhat
Increase
No
Change
Somewhat
Decrease
Greatly
Decrease
Stop
Using
NOP
certification
( ) ( ) ( ) ( ) ( ) ( ) ( )
GOTS
certification
( ) ( ) ( ) ( ) ( ) ( ) ( )
Other
certification
( ) ( ) ( ) ( ) ( ) ( ) ( )
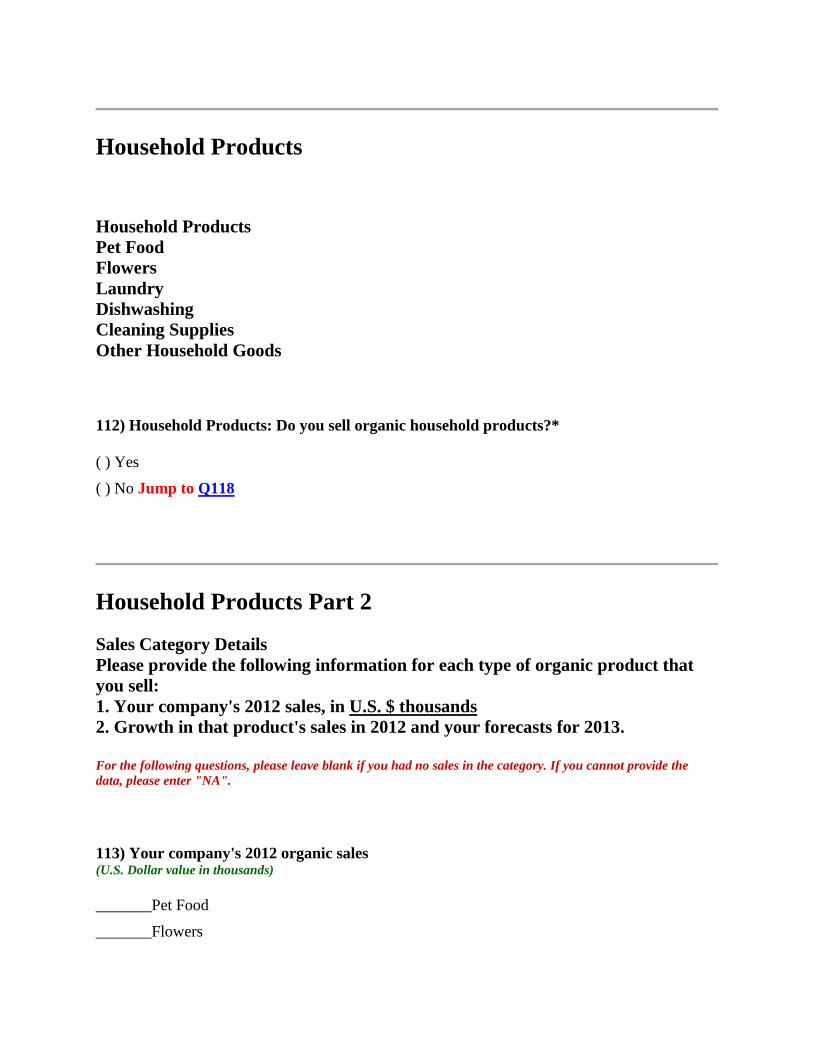
Household Products
Household Products
Pet Food
Flowers
Laundry
Dishwashing
Cleaning Supplies
Other Household Goods
112) Household Products: Do you sell organic household products?*
( ) Yes
( ) No Jump to Q118
Household Products Part 2
Sales Category Details
Please provide the following information for each type of organic product that
you sell:
1. Your company's 2012 sales, in U.S. $ thousands
2. Growth in that product's sales in 2012 and your forecasts for 2013.
For the following questions, please leave blank if you had no sales in the category. If you cannot provide the
data, please enter "NA".
113) Your company's 2012 organic sales (U.S. Dollar value in thousands)
_______Pet Food
_______Flowers

_______Laundry
_______Dishwashing
_______Cleaning Supplies
_______Other
114) Your company percentage sales growth in 2012 Please enter percent growth as whole numbers
Pet Food: _________________________
Flowers: _________________________
Laundry: _________________________
Dishwashing: _________________________
Cleaning Supplies: _________________________
Other: _________________________
115) Your estimated company percentage sales growth in 2013:
Estimated
product
growth
Pet Food ___
Flowers ___
Laundry ___
Dishwashing ___
Cleaning
Supplies
___
Other ___
116) Estimated overall organic household products industry sales growth in...
Estimated
product
growth
2012 ___
2013 ___
2014 ___
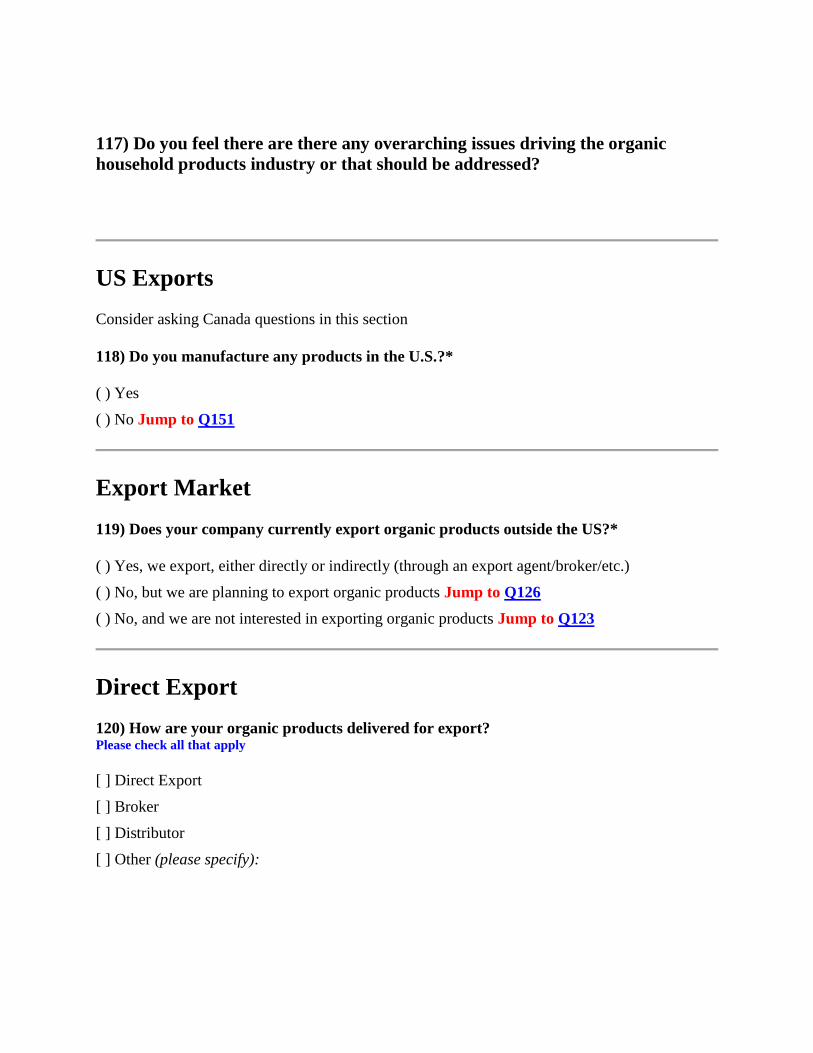
117) Do you feel there are there any overarching issues driving the organic
household products industry or that should be addressed?
US Exports
Consider asking Canada questions in this section
118) Do you manufacture any products in the U.S.?*
( ) Yes
( ) No Jump to Q151
Export Market
119) Does your company currently export organic products outside the US?*
( ) Yes, we export, either directly or indirectly (through an export agent/broker/etc.)
( ) No, but we are planning to export organic products Jump to Q126
( ) No, and we are not interested in exporting organic products Jump to Q123
Direct Export
120) How are your organic products delivered for export? Please check all that apply
[ ] Direct Export
[ ] Broker
[ ] Distributor
[ ] Other (please specify):

121) What percentage of your organic exports are delivered by these methods?
(Total should add to 100)
_______Direct
_______Broker
_______Distributor
_______Other
122) Is export growth referenced in your strategic plan?
( ) Actively building export business
( ) Passively building export business
( ) Export business is declining
If Direct Export (Q120), Jump to Q132, else Jump to Q131
Not Exporting
123) Has your company ever exported organic products in the past (directly, without using
an export agent or broker)?*
( ) Yes
( ) No
( ) Not sure
124) Why is your company not currently exporting organic products? Please check all that apply
[ ] Trade barriers severely limit export opportunities
[ ] No foreign demand for my product
[ ] Regulations are too complicated
[ ] Not sure how to locate buyers
[ ] Not sure how to begin

[ ] The domestic market provides sufficient opportunities for my business
[ ] No time to develop the export market
[ ] Not sure
[ ] Other (please specify):
125) Please tell us about one area where you would most like help to begin or
increase organic exporting:
Jump to Q151
Export Countries
126) Please indicate the first market to which you plan to export, the second and the third
*If planning to export to European countries besides those listed here, but not to ALL
European Union countries, please select "Other" and list countries in the comment section
First Second Third
Benelux (Belgium,
Netherlands, Luxembourg)
( ) ( ) ( )
France ( ) ( ) ( )
Germany ( ) ( ) ( )
Spain ( ) ( ) ( )
Italy ( ) ( ) ( )
European Union: all countries* ( ) ( ) ( )
Middle East ( ) ( ) ( )
Canada ( ) ( ) ( )
Mexico ( ) ( ) ( )
Caribbean ( ) ( ) ( )
Central America ( ) ( ) ( )
South America ( ) ( ) ( )
Russia ( ) ( ) ( )
China ( ) ( ) ( )
Hong Kong ( ) ( ) ( )
Japan ( ) ( ) ( )
South Korea ( ) ( ) ( )
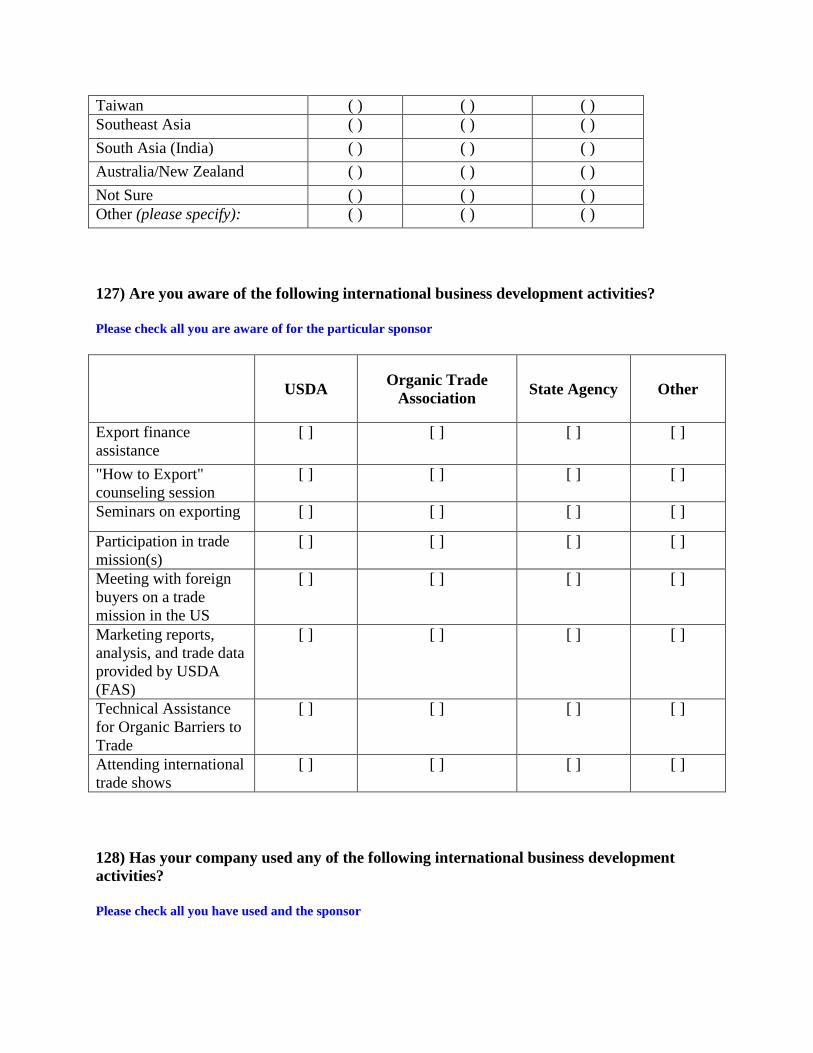
Taiwan ( ) ( ) ( )
Southeast Asia ( ) ( ) ( )
South Asia (India) ( ) ( ) ( )
Australia/New Zealand ( ) ( ) ( )
Not Sure ( ) ( ) ( )
Other (please specify): ( ) ( ) ( )
127) Are you aware of the following international business development activities?
Please check all you are aware of for the particular sponsor
USDA
Organic Trade
Association State Agency Other
Export finance
assistance
[ ] [ ] [ ] [ ]
"How to Export"
counseling session
[ ] [ ] [ ] [ ]
Seminars on exporting [ ] [ ] [ ] [ ]
Participation in trade
mission(s)
[ ] [ ] [ ] [ ]
Meeting with foreign
buyers on a trade
mission in the US
[ ] [ ] [ ] [ ]
Marketing reports,
analysis, and trade data
provided by USDA
(FAS)
[ ] [ ] [ ] [ ]
Technical Assistance
for Organic Barriers to
Trade
[ ] [ ] [ ] [ ]
Attending international
trade shows
[ ] [ ] [ ] [ ]
128) Has your company used any of the following international business development
activities?
Please check all you have used and the sponsor

USDA
Organic Trade
Association State Agency Other
Export finance assistance [ ] [ ] [ ] [ ]
"How to Export"
counseling session
[ ] [ ] [ ] [ ]
Seminars on exporting [ ] [ ] [ ] [ ]
Participation in trade
mission(s)
[ ] [ ] [ ] [ ]
Meeting with foreign
buyers on a trade mission
in the US
[ ] [ ] [ ] [ ]
Marketing reports,
analysis, and trade data
provided by USDA (FAS)
[ ] [ ] [ ] [ ]
Technical Assistance for
Organic Barriers to Trade
[ ] [ ] [ ] [ ]
Attending international
trade shows
[ ] [ ] [ ] [ ]
129) Please rate the usefulness of the international trade development programs provided
by the USA, your state agriculture agency or the Organic Trade Association.
Very useful Somewhat useful Of little use Not at all useful Not Familiar Does not apply
Export finance assistance ( ) ( ) ( ) ( ) ( ) ( )
"How to Export" counseling session ( ) ( ) ( ) ( ) ( ) ( )
Seminars on exporting ( ) ( ) ( ) ( ) ( ) ( )
Participation in trade mission(s) ( ) ( ) ( ) ( ) ( ) ( )
Meeting with foreign buyers on a trade
mission in the US
( ) ( ) ( ) ( ) ( ) ( )
Marketing reports, analysis, and trade
data provided by USDA (FAS)
( ) ( ) ( ) ( ) ( ) ( )
Technical Assistance for Organic
Barriers to Trade
( ) ( ) ( ) ( ) ( ) ( )
Attending international trade shows ( ) ( ) ( ) ( ) ( ) ( )
130) Please tell us about one area where you would most like help to begin or
increase organic exporting:
Jump to Q151

Exporting Indirectly
131) Has your company ever exported organic products directly in the past (without using
an export agent or broker)?*
( ) Yes
( ) No
( ) Not sure
Export Biz Develop
132) Are you aware of the following international business development activities?
Please check all you are aware of for the particular sponsor
USDA
Organic Trade
Association State Agency Other
Export finance
assistance
[ ] [ ] [ ] [ ]
"How to Export"
counseling session
[ ] [ ] [ ] [ ]
Seminars on exporting [ ] [ ] [ ] [ ]
Participation in trade
mission(s)
[ ] [ ] [ ] [ ]
Meeting with foreign
buyers on a trade
mission in the US
[ ] [ ] [ ] [ ]
Marketing reports,
analysis, and trade data
provided by USDA
(FAS)
[ ] [ ] [ ] [ ]
Technical Assistance
for Organic Barriers to
Trade
[ ] [ ] [ ] [ ]
Attending international
trade shows
[ ] [ ] [ ] [ ]

133) Has your company used any of the following international business development
activities?
Please check all you have used and the sponsor
USDA
Organic Trade
Association State Agency Other
Export finance assistance [ ] [ ] [ ] [ ]
"How to Export"
counseling session
[ ] [ ] [ ] [ ]
Seminars on exporting [ ] [ ] [ ] [ ]
Participation in trade
mission(s)
[ ] [ ] [ ] [ ]
Meeting with foreign
buyers on a trade mission
in the US
[ ] [ ] [ ] [ ]
Marketing reports,
analysis, and trade data
provided by USDA (FAS)
[ ] [ ] [ ] [ ]
Technical Assistance for
Organic Barriers to Trade
[ ] [ ] [ ] [ ]
Attending international
trade shows
[ ] [ ] [ ] [ ]
134) Please rate the usefulness of the international trade development programs provided
by the USA, your state agriculture agency or the Organic Trade Association.
Very useful Somewhat useful Of little use Not at all useful Not Familiar Does not apply
Export finance assistance ( ) ( ) ( ) ( ) ( ) ( )
"How to Export" counseling session ( ) ( ) ( ) ( ) ( ) ( )
Seminars on exporting ( ) ( ) ( ) ( ) ( ) ( )
Participation in trade mission(s) ( ) ( ) ( ) ( ) ( ) ( )
Meeting with foreign buyers on a trade
mission in the US
( ) ( ) ( ) ( ) ( ) ( )
Marketing reports, analysis, and trade
data provided by USDA (FAS)
( ) ( ) ( ) ( ) ( ) ( )
Technical Assistance for Organic
Barriers to Trade
( ) ( ) ( ) ( ) ( ) ( )

Attending international trade shows ( ) ( ) ( ) ( ) ( ) ( )
Export Biz 2
135) For how many years has your company been exporting organic products?
( ) Less than 1 year
( ) 1 to 2 years
( ) 3 to 5 years
( ) 6 to 10 years
( ) 11 to 20 years
( ) More than 20 years
( ) Not sure
136) What percentage of your 2012 ORGANIC sales were exports (includes sales to US
export agents/brokers)?
( ) 0%
( ) >0% to 5%
( ) >5% to 10%
( ) >10% to 25%
( ) >25% to 50%
( ) More than 50%
( ) Not sure
137) What percentage of your TOTAL 2012 sales were exports (includes sales to US export
agents/brokers)?
( ) 0%
( ) >0% to 5%
( ) >5% to 10%

( ) >10% to 25%
( ) >25% to 50%
( ) More than 50%
( ) Not sure
138) What was your 2012 ORGANIC export sales volume (include sales to US export
agents/brokers)
( ) Under $100 thousand
( ) $100 thousand to
( ) $500 thousand to
( ) $1 million to
( ) $5 million or more
( ) Not sure
139) What was your 2012 TOTAL export sales volume (include sales to US export
agents/brokers)
( ) Under $100 thousand
( ) $100 thousand to
( ) $500 thousand to
( ) $1 million to
( ) $5 million or more
( ) Not sure
Export Biz 2b
140) Please indicate your company's TOTAL 2012 ORGANIC EXPORT sales in these
categories
(U.S. Dollar value in thousands)
_______Beverages

_______Baked Goods & Grains
_______Meat and Seafood
_______Fruits and Vegetables
_______Dairy
_______Snacks
_______Packaged/Prepared Foods
_______Condiments
_______Personal Care
_______Clothing & Fibers
_______Household Products
_______Nutritional Supplements
_______Organic Seeds
_______Other
141) What do your forecast your export sales will be in 2013?
Please enter in U.S. $ Thousands
____________________________________________
Export Biz 3
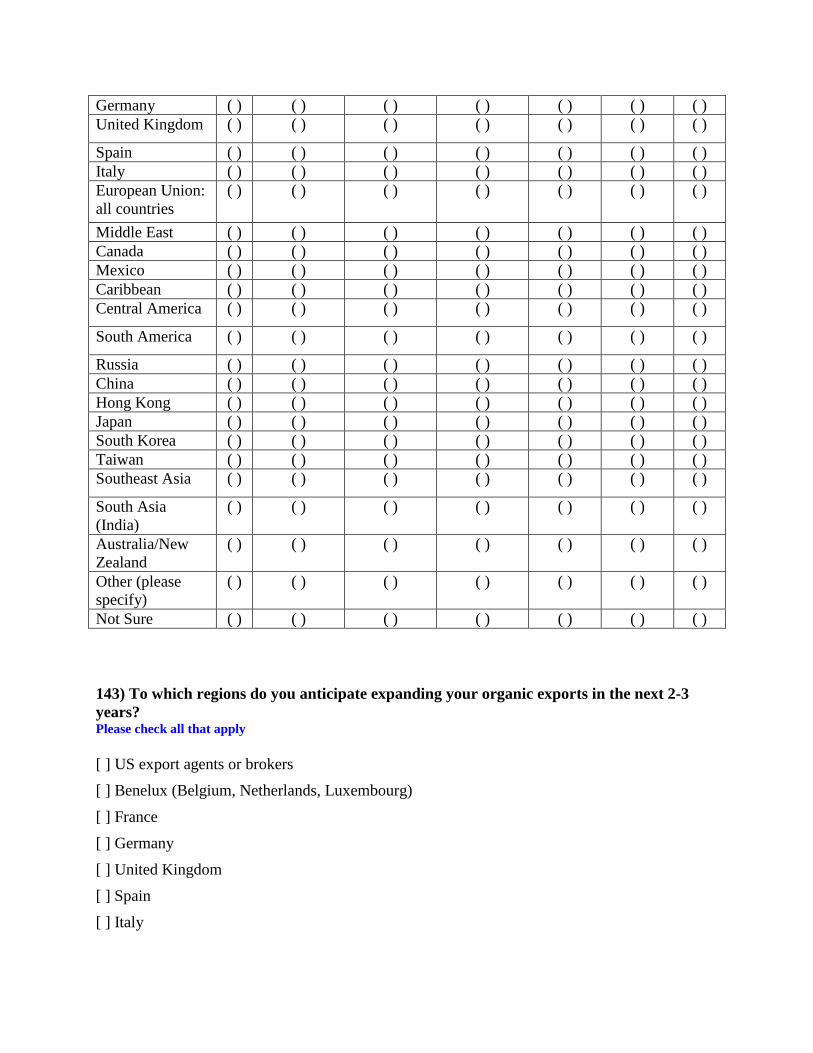
142) For each of the following regions, approximately what was the value of organic
products you exported in 2012?
$0
Under
$100
thousand
$100
thousand
to
$500
thousand
to
$1
million
to
$5
million
or more
Not
sure
US export agents
or brokers
( ) ( ) ( ) ( ) ( ) ( ) ( )
Benelux
(Belgium,
Netherlands,
Luxembourg)
( ) ( ) ( ) ( ) ( ) ( ) ( )
France ( ) ( ) ( ) ( ) ( ) ( ) ( )
Germany ( ) ( ) ( ) ( ) ( ) ( ) ( )
United Kingdom ( ) ( ) ( ) ( ) ( ) ( ) ( )
Spain ( ) ( ) ( ) ( ) ( ) ( ) ( )
Italy ( ) ( ) ( ) ( ) ( ) ( ) ( )
European Union:
all countries
( ) ( ) ( ) ( ) ( ) ( ) ( )
Middle East ( ) ( ) ( ) ( ) ( ) ( ) ( )
Canada ( ) ( ) ( ) ( ) ( ) ( ) ( )
Mexico ( ) ( ) ( ) ( ) ( ) ( ) ( )
Caribbean ( ) ( ) ( ) ( ) ( ) ( ) ( )
Central America ( ) ( ) ( ) ( ) ( ) ( ) ( )
South America ( ) ( ) ( ) ( ) ( ) ( ) ( )
Russia ( ) ( ) ( ) ( ) ( ) ( ) ( )
China ( ) ( ) ( ) ( ) ( ) ( ) ( )
Hong Kong ( ) ( ) ( ) ( ) ( ) ( ) ( )
Japan ( ) ( ) ( ) ( ) ( ) ( ) ( )
South Korea ( ) ( ) ( ) ( ) ( ) ( ) ( )
Taiwan ( ) ( ) ( ) ( ) ( ) ( ) ( )
Southeast Asia ( ) ( ) ( ) ( ) ( ) ( ) ( )
South Asia
(India)
( ) ( ) ( ) ( ) ( ) ( ) ( )
Australia/New
Zealand
( ) ( ) ( ) ( ) ( ) ( ) ( )
Other (please
specify)
( ) ( ) ( ) ( ) ( ) ( ) ( )
Not Sure ( ) ( ) ( ) ( ) ( ) ( ) ( )
143) To which regions do you anticipate expanding your organic exports in the next 2-3
years? Please check all that apply
[ ] US export agents or brokers
[ ] Benelux (Belgium, Netherlands, Luxembourg)
[ ] France
[ ] Germany
[ ] United Kingdom
[ ] Spain
[ ] Italy

[ ] European Union: all countries
[ ] Middle East
[ ] Canada
[ ] Mexico
[ ] Caribbean
[ ] Central America
[ ] South America
[ ] Russia
[ ] China
[ ] Hong Kong
[ ] Japan
[ ] South Korea
[ ] Taiwan
[ ] Southeast Asia
[ ] South Asia (India)
[ ] Australia/New Zealand
[ ] Other (please specify)
[ ] Not Sure
Export Biz 4
144) What are the challenges to expanding your organic exports programs? Please check all that apply
[ ] Phytosanitary and food safety issues
[ ] Inability to modify products to international specifications
[ ] Inability to adapt labels or packaging to international specifications
[ ] Lack of sufficient knowledge of how to export and develop exports
[ ] High tariffs
[ ] Lack of knowledge of individual markets
[ ] Inability to locate appropriate buyers/ distributors/ importers
[ ] High cost of developing markets

[ ] Trade barriers from different organic regulations of importing countries
[ ] High cost of transporting products
[ ] Shelf life issues
[ ] Other (please specify):
145) Please check all the effective ways you've found to locate foreign buyers for your
organic products. Please check all that apply
[ ] Responding to advertisements in US trade magazines
[ ] Advertising in foreign trade magazines
[ ] Advertising in US trade magazines
[ ] Hosting foreign buyers at my plant
[ ] Meeting foreign buyers at US trade shows (reverse buyer missions)
[ ] Following up on trade leads obtained through US embassies in other countries
[ ] Referrals from my business associates
[ ] Attending trade shows in the US
[ ] Attending international trade shows
[ ] Online directories
[ ] OTA's Export Directory Online
[ ] Through the Web
[ ] Technical Assistance from OTA/FAS
[ ] Other (please specify):
Most Effective
146) Please indicate which ONE of the helpful ways you've found to locate foreign buyers
for your organic products is the MOST effective way to meet foreign buyers.
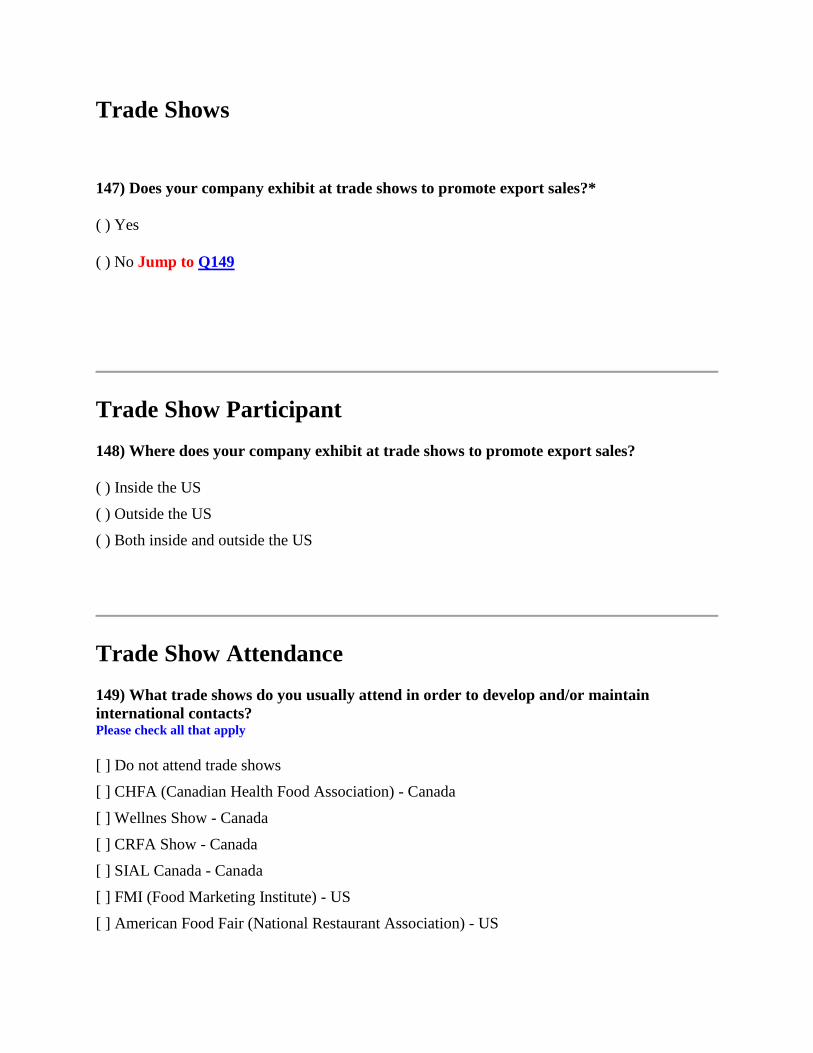
Trade Shows
147) Does your company exhibit at trade shows to promote export sales?*
( ) Yes
( ) No Jump to Q149
Trade Show Participant
148) Where does your company exhibit at trade shows to promote export sales?
( ) Inside the US
( ) Outside the US
( ) Both inside and outside the US
Trade Show Attendance
149) What trade shows do you usually attend in order to develop and/or maintain
international contacts? Please check all that apply
[ ] Do not attend trade shows
[ ] CHFA (Canadian Health Food Association) - Canada
[ ] Wellnes Show - Canada
[ ] CRFA Show - Canada
[ ] SIAL Canada - Canada
[ ] FMI (Food Marketing Institute) - US
[ ] American Food Fair (National Restaurant Association) - US

[ ] IFE Americas Food & Beverages - US
[ ] Fancy Food Show - US
[ ] Snack Expo (SNAXPO) - US
[ ] IFT (Institute of Food Technologists)-US
[ ] MAGIC Marketplace - US
[ ] NRA (National Restaurant Association) - US
[ ] NNFA Marketplace - US
[ ] PMA (Product Marketing Association) - US
[ ] Natural Products (ExpoEast)/ All Things Organic - US
[ ] Natural Products (ExpoWest) - US
[ ] ANTAD - Mexico
[ ] Alimentaria Mexico - Mexico
[ ] Abastur - Mexico
[ ] EXPHOTEL - Mexico
[ ] Food Ingredients (FI S. America) - Brazil
[ ] SIAL Mercosur - Argentina
[ ] FOODEX - Japan
[ ] IFIA International Food Ingredients & Additives Exhibition - Japan
[ ] BioFach - Japan
[ ] Supermarket Trade Show - Japan
[ ] AAHAR - India
[ ] International Food & Drink Expo - India
[ ] Food & Hotel Asia - Singapore
[ ] SIAL China - China
[ ] Food & Hotel China - China
[ ] Food Ingredients China - China
[ ] Seoul Food & Hotel Korea - S. Korea
[ ] Food Taipei - Taiwan
[ ] WOFEX World Food Expo - Philippines
[ ] Asia Fruit Logistica - Hong Kong
[ ] Hong Kong International Wine Fair - Hong Kong
[ ] HOFEX - Hong Kong
[ ] FI Food Ingredients Asia - Indonesia

[ ] Food & Hotel Indonesia - Indonesia
[ ] VIV Asia - Thailand
[ ] FI Asia Food Ingredients Asia - Thailand
[ ] Food & Hotel Vietnam - Vietnam
[ ] Fine Food Australia - Australia
[ ] ANUGA - Germany
[ ] BioFach - Germany
[ ] Fruit Logistica - Germany
[ ] Alimentaria Barcelona - Spain
[ ] HI Health Ingredients Europe - Spain
[ ] European Seafood Exposition - Belgium
[ ] World Food Moscow - Russia
[ ] Natural and Organic Products - UK
[ ] IFE International Food & Drink Exhibition London - UK
[ ] SANA - Italy
[ ] SIAL - France
[ ] Sirha - France
[ ] Food Ingredients Europe - France
[ ] Gulfood - UAE
[ ] Food Ingredients Africa - S. Africa
[ ] Morocco (American Cafe) - Morocco
[ ] Other (please specify):
150) How many export assistance programs have you participated in over the last 3 years? Export assistance programs include foreign buyers missions, trade missions, the Export Directory Online,
exporter seminars, or any export related activities hosted by OTA or the USDA
( ) 1
( ) 2
( ) 3
( ) 4
( ) 5
( ) 6
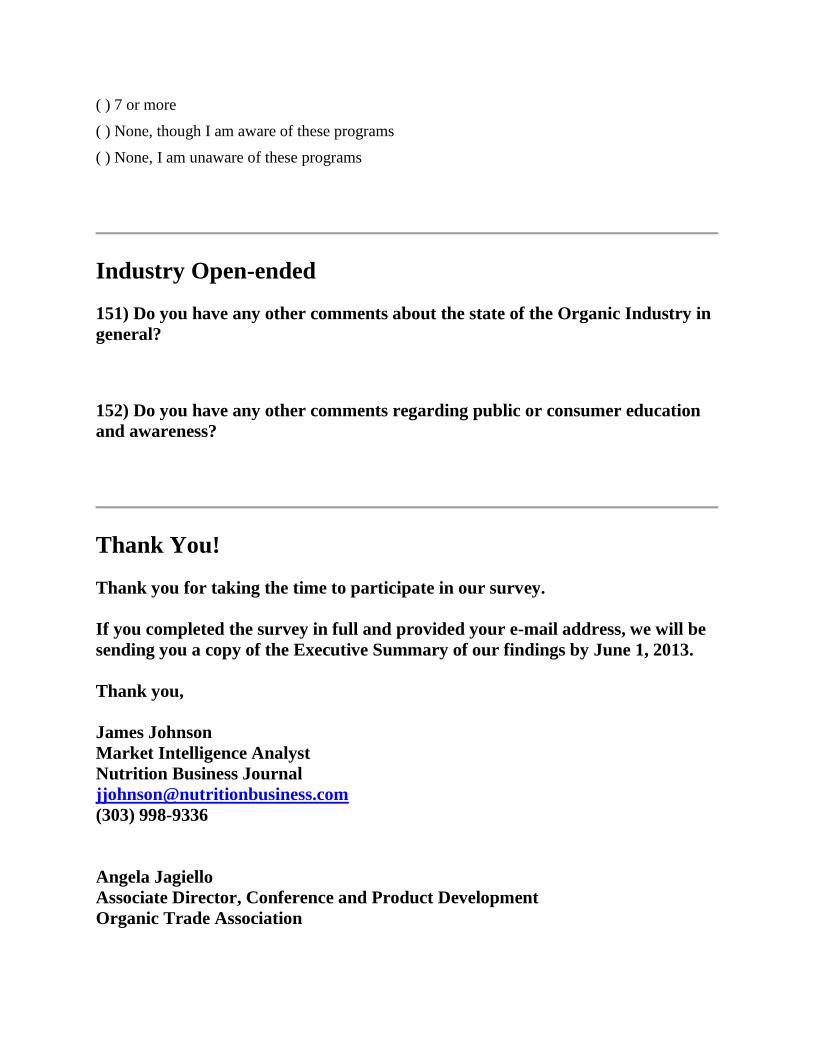
( ) 7 or more
( ) None, though I am aware of these programs
( ) None, I am unaware of these programs
Industry Open-ended
151) Do you have any other comments about the state of the Organic Industry in
general?
152) Do you have any other comments regarding public or consumer education
and awareness?
Thank You!
Thank you for taking the time to participate in our survey.
If you completed the survey in full and provided your e-mail address, we will be
sending you a copy of the Executive Summary of our findings by June 1, 2013.
Thank you,
James Johnson
Market Intelligence Analyst
Nutrition Business Journal
(303) 998-9336
Angela Jagiello
Associate Director, Conference and Product Development
Organic Trade Association