Embed Size (px)
Citation preview
Organic Matter and Natural Carbon-13 Distribution in Forested and Cultivated OxisolsV. A. Vitorello, C. C. Cerri,* F. Andreux, C. Feller, and R. L. Victoria
ABSTRACTSoil carbon (C) distribution, natural 13C abundances and their
changes as a consequence of cropping were studied in three neigh-boring areas on an Oxisol from Brazil. One site (T0) was underforest, while the two other sites (T12 and Tw) had been deforested,then cultivated with sugar cane for 12 and SO yr, respectively. Soilmorphological, chemical and mineralogical characteristics in all threesites were very similar. Total C content of the 0.06-m layer of T0was twice that of T12 and T ,̂ then decreased sharply with depth,to values similar to the other profiles. Delta 13C had practicallyconstant values of —25.1, —22.8, and — 20.4%o, throughout the 0 to0.30-m layer of TO, T12, and TM respectively. These values increasedin deeper layers, to about — 17%o, due to increased humification andpossibly to deposition of organic matter from a former "C-rich veg-etation. The 0.10- to 0.20-m layer was separated into particle-sizefractions and alkaline extract. Carbon contents decreased from T0to TSO in the sand-size fractions and alkaline extracts, but did notchange in the clay-size fractions. Delta I3C values were used to es-timate the proportions of C derived from forest (Cdff) and from sugarcane (Cdfc). Carbon derived from sugar cane represented 17.3 ±3.2% and 40.5 ± 2.2% of total C in T12 and TSO, respectively. Itreached its maximum value (67 ± 3.7%) in the coarse sand fractionof T12 and Tw and decreased with decreasing fraction size, to 13.8± 9.4% and 30.5 ± 6.5% in the fine clay fractions of T12 and TSO,respectively. Thus, Cdff persisted mainly in the clay-size fraction.
STUDIES OF SOIL organic matter (SOM) are basedprimarily on determination of total organic car-
bon (C), nitrogen (N), and their distribution in a se-quence of fractions separated by conventional meth-ods. Although differing in some aspects, allfractionation methods attempt to separate SOM intoclasses with different degrees of decomposition (McGillet al., 1975; Turchenek and Oades, 1979; Andreux etal., 1980; Feller and Ganry, 1982;TiessenetaL, 1984).Few methods are able to relate the nature of bulk SOMor SOM fractions to their sources, however. Data onchemical structures, such as sugars (Cheshire, 1979),phenolic tracers (Hedges et al., 1982) or pyrolysis spec-tra (Bracewell and Robertson, 1984) do not enable cal-
V.A. Vitorello, C.C. Cerri, and R.L. Victoria, Centro de EnergiaNuclear na Agriculture (CENA), Esc. Sup. de Agriculture "Luiz deQueiroz," Univ. de Sao Paulo, CP 96, 13400, Piracicaba, SP, Brazil;F. Andreux and C. Feller, Centre de Pedologie Biologique (CNRS),BP 5 54501 Vandoeuvre-les-Nancy Cedex, France, and the Inst.Francais de Recherche Scientifique pour le Developpement en Co-operation (ORSTOM). Joint contribution from CENA, CNRS andORSTOM. Partly funded by grant no. 85/3381-3 from Fundacaode Apoio a Pesquisa do Estado de Sao Paulo, Brazil. Received 17July 1987. "Corresponding author.
Published in Soil Sci. Soc. Am. J. 53:773-778 (1989).
774 SOIL SCI. SOC. AM. J., VOL. 53, MAY-JUNE 1989
culation of the proportions of SOM from different plantorigins.
Several investigators using isotopic methods haveattempted such a determination. One of these meth-ods is based on the natural 13C abundance in SOM,which has an isotopic composition that correspondsclosely to the vegetative cover which originated it(Nissenbaum and Shallinger, 1974; Demes, 1980).Carbon-13 abundance in any sample is expressed as5'3C%o, and is given by the relation [Rs-Rsf)Rsrl] X1000, where Rs is the 13C/12C ratio of the sample andRst is the 13C/12C ratio of the PDB (Pee Dee belemnitefrom North Carolina) international standard. Delta 13Cvalues of higher plant species vary according to theirphotosynthetic cycle, from lower values in C3 plants(-22 to -33%o) to higher values in C4 plants (-9 to— 16%o) (Deines, 1980). Thus, based on principles ofisotopic dilution, situations in which a previous andlong established vegetative cover has been replaced byanother having a different 13C isotopic compositionmay permit the study of SOM dynamics from dualorigins (Barnes et al., 1983; Dzurec et al., 1985; Mar-tinelli, 1986). However, the 513C method is restrictedto situations in which the time of vegetation changeis known, as pointed out by Cerri et al. (1985) andBalesdent et al. (1987). Furthermore, misinterpreta-tions may arise from possible heterogeneity of soil lay-ers, and the general tendency of 5I3C values to increasewith increasing humincation (VolkofFet al., 1978; Nis-senbaum and Shallinger, 1974) and with soil depth(Schleser and Pohling, 1980; Volkoff et al., 1982;Becker-Heidmann and Scharpenseel, 1986).
In the Brazilian tropics, the existence of large areasof forest recently cleared for crop production has pro-vided several situations in which relations betweenSOM content and soil fertility can be investigated. Thepresent study was carried out in an area of Dark RedLatosol (Oxisol). One part of the study area was cov-ered with native forest vegetation (C3 plants) and twoother parts had been deforested and cultivated withsugar cane (C4 plant). The main objective of this pa-per is to show that the 13C method can be used toevaluate changes in the contents of soil C from forestand sugar cane origins, but also show that more de-tailed data on 13C distribution throughout these areasis needed if some of the errors bound to the methodare to be overcome. Factors causing heterogeneity inC and 13C distributions throughout the soil profile werestudied with emphasis on the organic-rich 0- to 0.20-m soil layer. A particle-size fractionation method wasused to illustrate trends in C distribution from bothsources among soil humic constituents, and with in-creasing cropping time.
MATERIALS AND METHODSStudy Sites and Sampling
Samples studied were taken from three adjacent fields ofa soil located on a flat area near the city of Piracicaba,(22°43'S; 47°38'W), Sao Paulo, in southeastern Brazil. Thisarea was previously described by Cerri et al. (1985) and Cerri(1986). The soil is a "Latossolo Vermelho Escuro" (DarkRed Latosol), according to Brazilian soil classification, andis classified as a clayey, kaolinitic, isothermic Typic Hap-lorthox in Soil Taxonomy.
The first sampling site (T0) was under natural forest veg-etation. The second (T12) and third (T5?) sites were defor-ested and cultivated exclusively and continuously with sugarcane (Saccharum spp.) for 12 and 50 yr, respectively. TheT|2 site was mechanically cleared after an accidental forestfire, and felled forest material was piled and reburaed onsite. The T50 site was manually cleared, and no burn pileswere made after felling.
Production of fresh sugar cane was comparable in bothcultivated areas, and was approximately 9 X 10" kg ha"1
yr"1. Chemical fertilization was also the same in both areas,and consisted of 350 kg ha"1 of 0-13-8 (N-P-K) fertilizerin furrows at planting, 300 kg ha"1 of 12-0-30 (N-P-K)during initial growth, and 350 kg ha"1 of 12-0-30 (N-P-K)to the ratoon 3 yr following planting. No organic fertilizerwas applied to any of the fields.
Soils at all three sites had a similar mineralogy and par-ticle-size distribution in the first half-meter. Most of the dif-ferences observed in the micromorphological, physical, andchemical properties could be related to deforestation andcropping, rather than to a preexisting heterogeneity (Cerriet al., in press).
The maximum distance between sampling sites did notexceed 250 m. A composite sample of leaves and twigs fromthe forest live material was taken. From 1 m2 of T0, theentire litter layer and litter-soil transition layer were col-lected separately. Aerial parts and live and decomposed rootsof sugar cane were collected from T50. Soil layers were sam-pled from the first 0.80 m from a pit within each field. Depthintervals were of 0.10 m, except in T0 where the first threelayers were 0.06-, 0.06-and 0.08-m thick. On each site, within1 ha, the 0- to 0.20-m soil layer was collected with an augerat ten approximately equidistant spots.
Sample ProcessingLitter material was manually separated into fractions dif-
fering in morphology and degree of decomposition. Rootsamples were picked out from the 0- to 0.20 m and soil-litter transition layers.
Plant and litter material was oven-dried at 60 °C andground in a thoroughly cleaned laboratory mill. Soil sampleswere homogenized, air-dried and sieved to less than 2000 fim.Samples from the 0.12- to 0.20-m layer of T0 and the 0.10- to0.20-m layers of T12 and T50 were fractionated. Thorough dis-aggregation and dispersion of the soil was obtained by over-night mechanical shaking of 20 g of each sample in 200 mLof a 10 g L"1 Na4P2O7 solution adjusted to pH 11.5 with NaOH(Andreux et al., 1980). The suspension was then centrifugedat 10 000 X g for 20 min, and the separated soil residue pro-cessed once again with the Na4P2O7 solution. The two su-pernatant alkaline extracts (AE) were mixed, received 20 gKC1L"1 of extract, and were left overnight at 5 °C. The clayparticles which flocculated were then separated from AE bycentrifugatipn at 10 000 X g and added to the soil residue.The soil residue was redispersed in 200 mL of distilled waterand wet-sieved with 200-, 100- and 50-/um sieves, succes-sively. The 200- to 2000-Mm (coarse sand), 100- to 200-^m(medium sand) and 50- to 100-jum (fine sand) fractions con-tained mainly poorly decomposed plant residues and quartzgrains. These fractions were air-dried at 50 °C, weighed andground in a mechanical steel mortar.
The water suspended 0- to 50-/tm fractions were acidifiedto pH 5.0 with dilute HC1, and centrifuged for 1 h at 10 000X g, to precipitate particles larger than approximately 0.1jim. The 0.1- to 50-/mi (silt + coarse clay) and 0- to 0.1-Mm(fine clay) fractions did not present recognizable organic res-idues. They were freeze-dried, weighed and finally ground.(The particle-size fractions defined in the above procedureand their respective names do not necessarily follow theUSDA system).
VITORELLO ET AL.: ORGANIC MATTER & NATURAL CARBON-13 DISTRIBUTION IN FORESTED & CULTIVATED OXISOLS 775
Half of the AE solution was dialyzed against distilled wateruntil no color change appeared in the renewed water. Thematerial which remained inside or passed through the di-alysis membrane was called large molecule extract (LM),and small molecule extract (SM), respectively.
Analytical MethodsCarbon contents of solid samples were determined by
combustion in a C, H, N autoanalyzer. Aliquots of liquidsamples were dried in porcelain vessels and combusted ina Carbon analyzer. All samples were analyzed two or threetimes, with a coefficient of variation less than 4%. Carboncontents of soil samples (Cs) were converted from g C g-'soil to Mg ha"1 (TC), using the relation
TC = Cs X L X d X 104
in which L is the thickness of the considered soil layer (inm), and d bulk density.
Carbon-13 composition was measured by burning sam-ples together with Cu oxide under vacuum at 550 °C. Theresulting CO2 was then purified by trapping water vapor ondry ice, and analyzed by mass spectrometry in the isotopelaboratory of CENA (Centro de Energia Nuclear na Agri-culture), Piracicaba. Samples were analyzed at least twicewith differences between repetitions less than 0.3%» 6 units.
Estimation of Carbon Derived from C3and C4 Plants
Carbon derived from forest material (Cdff) and carbonderived from sugar cane crop residues (Cdfc) in any layeror SOM fraction of the cultivated soils were expressed eitheras percent of total C (PCdff and PCdfc) or as g C kg'1 offraction or soil (SCdff and SCdfc). Calculations were as fol-lows
Table 1. Dry weight distribution and J'3C values of hand-pickedforest litter components.
PCdfc = X 100; PCdff = 100 - PCdfc
Where 8 = 813C value of sample from cultivated soil50 = 513C value of corresponding sample from forest soil5C = 613C mean value of sugar cane crop residuesSCdff and SCdfc were obtained by multiplying PCdfi^K)-2)
and PCdfc(10~2) by the total C contents of the respectivesample.
RESULTS AND DISCUSSIONDelta I3C Values of Plant Material
Total forest litter material from T0 had a minimumdl3C value of —31.3 ± 0.16%o in green material anda maximum value of—25.5 ± 0.03%o in surface roots.Table 1 shows that the isotopic composition of thedecomposing material reflected that of the initial C3forest vegetation, but 513C values of litter componentsincreased by about 5%o with increasing decay, fromgreen leaves to unidentified coarse and fine materials.Sugar cane leaf material had a slightly lower 513C value(-13.2%o) than root material (-12.8%o). In the cal-culations of Cdfc contents a mean value of — 13.0%owas used for the whole sugar cane material.
Vertical Distribution of Soil C Contentand 813C Values
Cumulative C content of the 0- to 0.70-m layer washigher in T0 (126 ± 8.1 Mg hzr1) than in T12 (78 ±2.9 Mg ha"1) and T50 (92 ± 1.2 Mg ha"1). The amount
Litter components
Green leaves and twigsDry, entire leavesDecomposing leavesSlightly decomposed twigsLargely decomposed twigsSurface rootsUnidentified coarse materialUnidentified fine materialFecal aggregatesAnimal residuesTotalUnfractionated litter
Dry weightdistribution
g kg'1 oftotal litter
13
4345
1453
13646
9110
1000—
5'3C
%0
-31.3f ± 0.16$-27.8 ± 0.03-26.5 ± 0.13-26.0 ± 0.03-25.8 ± 0.08-25.5t ± 0.03-25.7 ± 0.18-26.6 ± 0.53-26.1
ND-26.4§-27.3 ± 0.55
t Values measured on fresh plant material.j SE calculated from at least two repetitions.§ Value recalculated from the above values (weighted mean).
C Mg ha'1
10 20 30
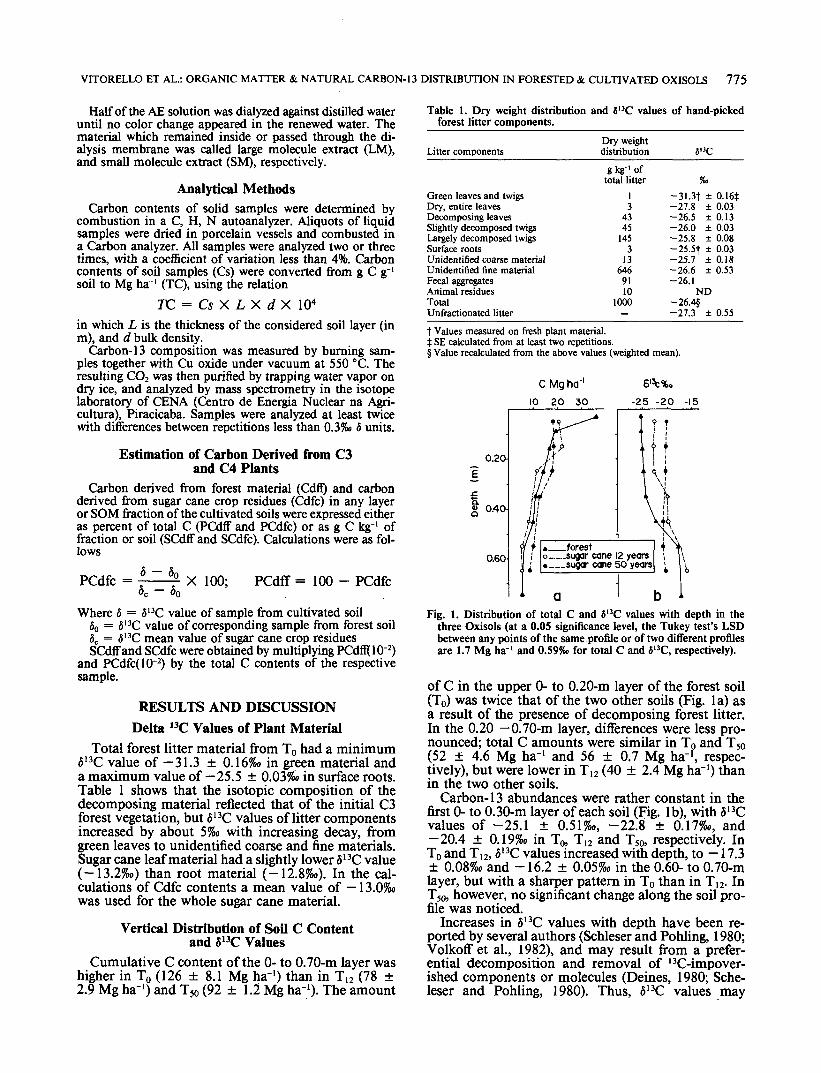
Fig. 1. Distribution of total C and 613C values with depth in thethree Oxisols (at a 0.05 significance level, the Tukey test's LSDbetween any points of the same .profile or of two different profilesare 1.7 Mg ha'1 and 0.59%o for total C and «13C, respectively).
of C in the upper 0- to 0.20-m layer of the forest soil(T0) was twice that of the two other soils (Fig. la) asa result of the presence of decomposing forest litter.In the 0.20 — 0.70-m layer, differences were less pro-nounced; total C amounts were similar in T0 and T50(52 ± 4.6 Mg ha'1 and 56 ± 0.7 Mg ha'1, respec-tively), but were lower in T12 (40 ± 2.4 Mg ha"1) thanin the two other soils.
Carbon-13 abundances were rather constant in thefirst 0- to 0.30-m layer of each soil (Fig. Ib), with 613Cvalues of -25.1 ± 0.51%o, -22.8 ± 0.17%o, and-20.4 ± 0.19%o in T0, T12 and T50, respectively. InT0 and T12, S13C values increased with depth, to -17.3± 0.08%o and -16.2 ± 0.05%o in the 0.60- to 0.70-mlayer, but with a sharper pattern in T0 than in T12. InT50, however, no significant change along the soil pro-file was noticed.
Increases in 513C values with depth have been re-ported by several authors (Schleser and Pohling, 1980;Volkoff et al., 1982), and may result from a prefer-ential decomposition and removal of '^-impover-ished components or molecules (Deines, 1980; Sche-leser and Pohling, 1980). Thus, 513C values may
776 SOIL SCI. SOC. AM. J., VOL. 53, MAY-JUNE 1989
increase as a result of humification transformations.In some cases, such an increase may be emphasizedby the selective migration and redeposition of clay-humic material with 13C content higher than that ofthe whole SOM (Becker-Heidmann and Sharpenseel,1986). However, the 8%o increase in 513C values ofSOM at 0.50- to 0.70-m was uncommon (Fig. Ib), andno enrichment of such extent was observed in any ofthe fractions from the upper layers. This result sug-gests that, together with humification processes, stableC inherited from a former C4 cycle vegetation mayhave been responsible for the high 513C values in depth(Cerri et al., 1985). This increase was more superficialin T12 than in T0, and did not occur in T50, suggestingthat the level at which this material appeared variedlocally.
Spatial Variability of Surface Soil C Contentand 513C Values
Mean and SDs of total C and 513C measurementson the 0- to 0.20-m layer from 10 different samplingsites of each area are presented in Table 2. The spatialvariation of total soil C is in agreement with data re-viewed by Campbell (1978), and temporal variationswith recent observations in tropical ecosystems by
Table 2. Mean'C content, 413C values and C derived from the sugarcane (SCdfc and PCdfc) in the 0- to 0.20-m layer of three soils.
C content SCdfc PCdfc
Forest soilSugar cane
soil (12 yr)Sugar cane
soil (50 yr)LSD*
gkg-1
21 ± I.9t22 ± 7.2
15 ± 1.7
1.4
%«-24.99 ± 0.27-23.66 ± 0.50
-20.66 + 1.05
0.87
gkg'1
02.2 ± 0.5
5.5 ± 1.6
1.0
%0
11.1 ± 4.05
36.1 ± 8.81
5.92* LSD from Tukey test for a 0.05 level of significance.t SD calculated from 10 repetitions.
_ 40O<n
30oTO>
o>
o toJ
20
y-O.O7x»l:96r-O.T2*
•-25 -24 -23
50 yr
•21 -20
6'3C%o
Sanchez et al. (1982). The main losses of SOM oc-curred during the first years following deforestationand cropping.
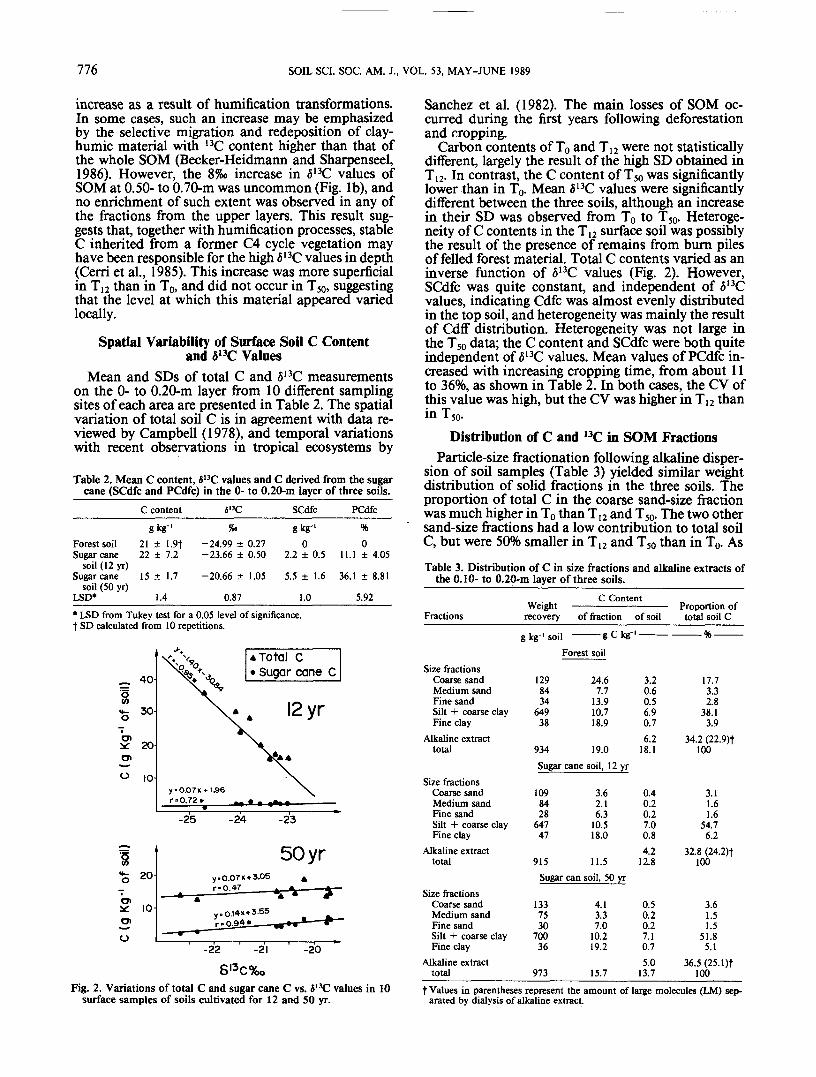
Carbon contents of T0 and T12 were not statisticallydifferent, largely the result of the high SD obtained inT12. In contrast, the C content of T50 was significantlylower than in T0. Mean 513C values were significantlydifferent between the three soils, although an increasein their SD was observed from T0 to T50. Heteroge-neity of C contents in the T12 surface soil was possiblythe result of the presence of remains from burn pilesof felled forest material. Total C contents varied as aninverse function of 513C values (Fig. 2). However,SCdfc was quite constant, and independent of 613Cvalues, indicating Cdfc was almost evenly distributedin the top soil, and heterogeneity was mainly the resultof Cdff distribution. Heterogeneity was not large inthe T50 data; the C content and SCdfc were both quiteindependent of 513C values. Mean values of PCdfc in-creased with increasing cropping time, from about 11to 36%, as shown in Table 2. In both cases, the CV ofthis value was high, but the CV was higher in T]2 thanin T50.
Distribution of C and I3C in SOM FractionsParticle-size fractionation following alkaline disper-
sion of soil samples (Table 3) yielded similar weightdistribution of solid fractions in the three soils. Theproportion of total C in the coarse sand-size fractionwas much higher in T0 than T!2 and T50. The two othersand-size fractions had a low contribution to total soilC, but were 50% smaller in T12 and T50 than in T0. AsTable 3. Distribution of C in size fractions and alkaline extracts of
the 0.10- to 0.20-m layer of three soils.
Fig. 2. Variations of total C and sugar cane C vs. i'3C values in 10surface samples of soils cultivated for 12 and SO yr.
Fractions
C ContentWeight — ————
recovery of fraction
g kg ' soil o C bcrg l~ Kg
of soili
Proportion oftotal soil C
———Forest soil
Size fractionsCoarse sandMedium sandFine sandSilt + coarse clayFine clay
Alkaline extracttotal
1298434
64938
934
24.67.7
13.910.718.9
19.0
3.20.60.56.90.76.2
18.1
17.73.32.8
38.13.9
34.2 (22.9)t100
Sugar cane soil, 12 yrSize fractions
Coarse sandMedium sandFine sandSilt + coarse clayFine clay
Alkaline extracttotal
Size fractionsCoarse sandMedium sandFine sandSilt + coarse clayFine clay
Alkaline extracttotal
1098428
64747
915Sugar can
1337530
70036
973
3.62.16.3
10.518.0
11.5soil, 50 yr
4.13.37.0
10.219.2
15.7
0.40.20.27.00.84.2
12.8
0.50.20.27.10.75.0
13.7
3.11.61.6
54.76.2
32.8 (24.2)f100
3.61.51.5
51.85.1
36.5(25.1)t100
t Values in parentheses represent the amount of large molecules (LM) sep-arated by dialysis of alkaline extract.
VITORELLO ET AL.: ORGANIC MATTER & NATURAL CARBON-13 DISTRIBUTION IN FORESTED & CULTIVATED OXISOLS 777
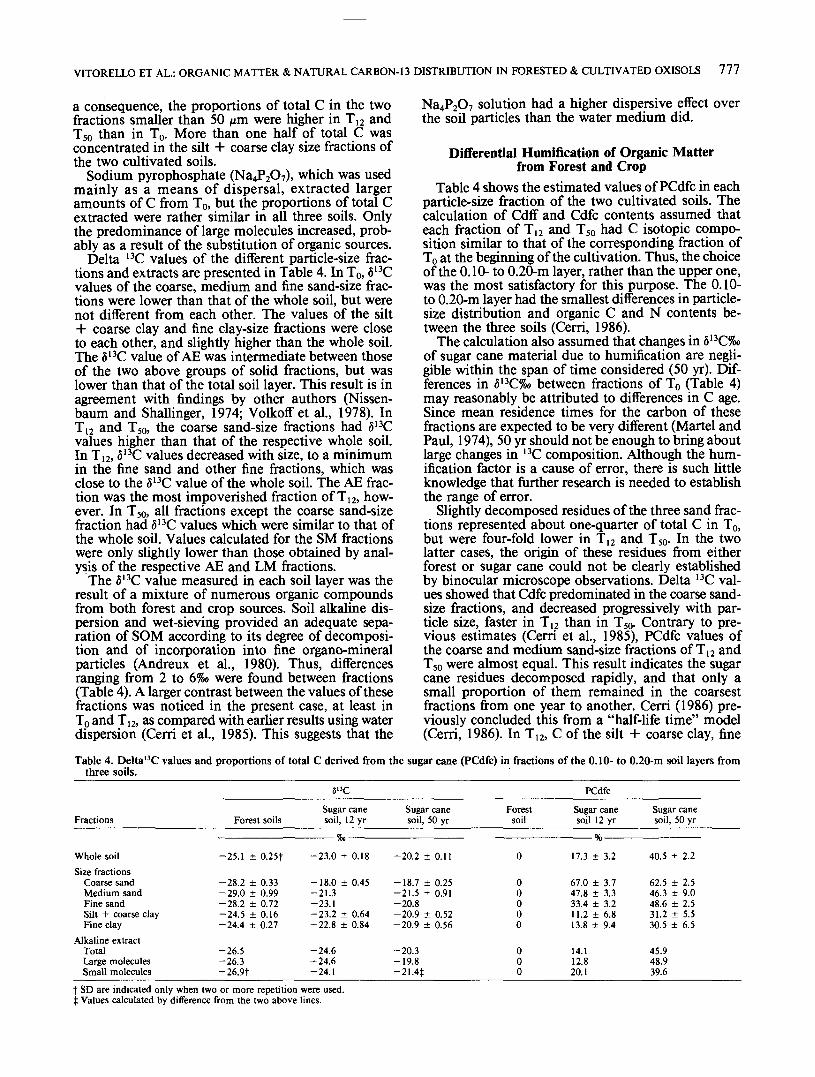
a consequence, the proportions of total C in the twofractions smaller than 50 nm were higher in T12 andT50 than in T0. More than one half of total C wasconcentrated in the silt + coarse clay size fractions ofthe two cultivated soils.
Sodium pyrophosphate (Na4P2O7), which was usedmainly as a means of dispersal, extracted largeramounts of C from T0, but the proportions of total Cextracted were rather similar in all three soils. Onlythe predominance of large molecules increased, prob-ably as a result of the substitution of organic sources.
Delta 13C values of the different particle-size frac-tions and extracts are presented in Table 4. In T0, §13Cvalues of the coarse, medium and fine sand-size frac-tions were lower than that of the whole soil, but werenot different from each other. The values of the silt+ coarse clay and fine clay-size fractions were closeto each other, and slightly higher than the whole soil.The 513C value of AE was intermediate between thoseof the two above groups of solid fractions, but waslower than that of the total soil layer. This result is inagreement with findings by other authors (Nissen-baum and Shallinger, 1974; Volkoffet al, 1978). InT12 and T50, the coarse sand-size fractions had 513Cvalues higher than that of the respective whole soil.In Ti2, 613C values decreased with size, to a minimumin the fine sand and other fine fractions, which wasclose to the 513C value of the whole soil. The AE frac-tion was the most impoverished fraction of T12, how-ever. In T50, all fractions except the coarse sand-sizefraction had <513C values which were similar to that ofthe whole soil. Values calculated for the SM fractionswere only slightly lower than those obtained by anal-ysis of the respective AE and LM fractions.
The 613C value measured in each soil layer was theresult of a mixture of numerous organic compoundsfrom both forest and crop sources. Soil alkaline dis-persion and wet-sieving provided an adequate sepa-ration of SOM according to its degree of decomposi-tion and of incorporation into fine organo-mineralparticles (Andreux et al., 1980). Thus, differencesranging from 2 to 6%o were found between fractions(Table 4). A larger contrast between the values of thesefractions was noticed in the present case, at least inTp and T12, as compared with earlier results using waterdispersion (Cerri et al., 1985). This suggests that the
Na4P2O7 solution had a higher dispersive effect overthe soil particles than the water medium did.
Differential Humification of Organic Matterfrom Forest and Crop
Table 4 shows the estimated values of PCdfc in eachparticle-size fraction of the two cultivated soils. Thecalculation of Cdff and Cdfc contents assumed thateach fraction of T,2 and T50 had C isotopic compo-sition similar to that of the corresponding fraction ofTO at the beginning of the cultivation. Thus, the choiceof the 0.10- to 0.20-m layer, rather than the upper one,was the most satisfactory for this purpose. The 0.10-to 0.20-m layer had the smallest differences in particle-size distribution and organic C and N contents be-tween the three soils (Cerri, 1986).
The calculation also assumed that changes in 513C%oof sugar cane material due to humification are negli-gible within the span of time considered (50 yr). Dif-ferences in 513C%o between fractions of T0 (Table 4)may reasonably be attributed to differences in C age.Since mean residence times for the carbon of thesefractions are expected to be very different (Martel andPaul, 1974), 50 yr should not be enough to bring aboutlarge changes in 13C composition. Although the hum-ification factor is a cause of error, there is such littleknowledge that further research is needed to establishthe range of error.
Slightly decomposed residues of the three sand frac-tions represented about one-quarter of total C in T0,but were four-fold lower in T12 and T50. In the twolatter cases, the origin of these residues from eitherforest or sugar cane could not be clearly establishedby binocular microscope observations. Delta 13C val-ues showed that Cdfc predominated in the coarse sand-size fractions, and decreased progressively with par-ticle size, faster in T,2 than in T50. Contrary to pre-vious estimates (Cerri et al., 1985), PCdfc values ofthe coarse and medium sand-size fractions of T12 andT50 were almost equal. This result indicates the sugarcane residues decomposed rapidly, and that only asmall proportion of them remained in the coarsestfractions from one year to another. Cerri (1986) pre-viously concluded this from a "half-life time" model(Cerri, 1986). In T12, C of the silt + coarse clay, fine
Table 4. Delta'3C values and proportions of total C derived from the sugar cane (PCdfc) in fractions of the 0.10- to 0.20-m soil layers fromthree soils.
S"C PCdfc
Fractions
Whole soilSize fractions
Coarse sandMedium sandFine sandSilt + coarse clayFine clay
Alkaline extractTotalLarge moleculesSmall molecules
Forest soils
-25.1 ± 0.25f
-28.2 ± 0.33-29.0 ± 0.99-28.2 ± 0.72-24.5 ± 0.16-24.4 ± 0.27
-26.5-26.3-26.9f
Sugar canesoil, 12 yr
————— %» ————
-23.0 ± 0.18
-18.0 ± 0.45-21.3-23.1-23.2 ± 0.64-22.8 ± 0.84
-24.6-24.6-24.1
Sugar canesoil, 50 yr
-20.2 ± 0.11
-18.7 ± 0.25-21.5 ± 0.91-20.8-20.9 ± 0.52-20.9 ± 0.56
-20.3-19.8-21.4$
Forestsoil
0
00000
000
Sugar canesoil 12 yr
————— % ————
17.3 ± 3.2
67.0 ± 3.747.8 ± 3.333.4 ± 3.211.2 ± 6.813.8 ± 9.4
14.112.820.1
Sugar canesoil, 50 yr
40.5 ± 2.2
62.5 ± 2.546.3 ± 9.048.6 ± 2.531.2 ± 5.530.5 ± 6.5
45.948.939.6
t SD are indicated only when two or more repetition were used,j Values calculated by difference from the two above lines.
778 SOIL SCI. SOC. AM. J., VOL. 53, MAY-JUNE 1989
clay and AE fractions was still largely of forest origin.In T50, about one-half of the C of the sand-size frac-tions, and one-third of that of the silt + coarse clayand fine clay-size fractions was of sugar cane origin.The relative increase in PCdfc from T12 to T50 wasabout 1.5 X in the fine sand-size fraction and threeX in the silt + coarse clay and fine clay-size fractionsand in the alkaline extract.
In the studied soils, most of the SOM was associatedwith the silt + coarse clay-size fractions. This waseven more pronounced in the cultivated soils, due tothe high decomposition rate of sugar cane crop resi-dues. The fine clay-size fraction, which is probablymade mostly of microbial metabolites (McGill et al.,1975; Andreux et al., 1980), had the same 13C isotopiccomposition and PCdfc as the silt + coarse clay-sizefraction, in spite of having higher total C content thanthe latter. The fact that these two clay fractions hadretained larger proportions of Cdff than the coarserfractions could be explained by a protective effect ofclay surfaces against degradation of organic com-pounds of forest origin. This would also apply in theextractable humic material (AE). However, it seemsthat beyond twelve years of cropping, this extractablematerial had been either less protected, or at least moremixed with material of sugar cane origin, than thatwhich remained bound to the clay particles.
ACKNOWLEDGMENTSThe authors wish to thank Mr. Jose Aurelio Bonassi for
the 13C abundance analysis and Dr. Eichii Matsui and LuizAntonio Martinelli for their helpful comments.