Embed Size (px)
Citation preview
Pure & Appi. Chem., Vol. 55, No. 12, pp. 1869—1885, 1983. 00334545/83 $3.OO+O.OOPrinted in Great Britain Pergamon Press Ltd.
©1983 [UPAC
ORGANIC MASS SPECTROMETRY USING THE LASER MICROPROBE
David M. Hercules
Department of Chemistry, University of Pittsburgh, Pittsburgh, PA 15260, USA
Abstract — The use of a laser microprobe for analysis of organic micro—volumes will be presented. The fundamental processes important to lasermass spectrometry of organic compounds and their "fragmentation processes"will be discussed. Examples of fragmentation will be considered in termsof the location of charge centers in organic molecules. A specificsystem to be addressed will be the amino acids. The relationship betweenSIMS and LMS spectra of amino acids will be treated. Results for
quantitative analysis of organic materials using the laser microprobewill be presented. Included will be results correlated with HPLC studiesand measurement of backwards versus forwards addition in polymer chains.Examples are presented to illustrate how the microprobe can obtain massspectra from complex matrices. Included are results of mapping oneorganic compound on the surface of another. Use of solid—state reactionsinduced by the laser for chemical ionization of solids will be given.An example will be the use of nitrocompounds for obtaining useful negativeion spectra of polynuclear aromatic hydrocarbons.
INTRODUCTION
During the last fifteen years a prolific growth in ionization sources available for massspectrometers has occurred. A major part of this growth represents development of "softionization" techniques which can be applied directly to solid state samples. A recent reviewhas summarized development of these techniques through 1979 (1).
The first mass spectral technique that was widely applicable to nonvolatile substanceswas field desorption mass spectrometry (FDMS) (2). Although FDMS is applicable to a wide
variety of materials, it presents serious operational problems to many laboratory. Thus,other solid state techniques were developed including plasma desorption mass spectrometry(PDMS) (3), secondary ion mass spectrometry (SIMS) (4), and the related technique,so—called fast atom bombardment (FAB) (5).
The use of a laser as an ionizing source in mass spectrometry is not new. Experiments weretried in the early 1960's (6) but suffered from experimental difficulties primarily dueto the state of development of laser technology and time—of—flight mass spectrometers atthat time. A recent review has summarized the historical development of laser massspectrometry (7); recently development of commercial laser mass spectrometers hasoccurred (8,9).
Although all of these techniques have been available for at least a decade, there existsno clear understanding of the mechanisms involved in forming organic ions among the
various techniques. Similarities among the spectra of the techniques suggest commonalityof mechanism. Although the initial event in the energy transfer step must differ,conversion of this energy into exitons or phonons is probably responsible for thesimilarities among the techniques.
The present paper will stress the use of a commercial laser microprobe mass spectrometer(LAMMAR_l000) for analysis of organic microvolumes. Important parameters must beconsidered when using a laser microprobe for organic mass spectrometry; the fragmentationprocesses involved, the relationship between LMS and other techniques, quantitation,how identifiable peaks from a component can be extracted from a complex matrix and waysto modify mass spectral behavior to render compounds identifiable by LMS. Also discussedwill be the use of the organic microprobe to map the presence of an organic componenton an organic surface.
LMINAR is a registered trademark of Leybold—Heraeus, GmbH
1869
1870 D. N. HERCULES
INSTRUMENTATION
The research reported here was obtained using a LMINA—l000 (LAser MicroprObe MassAnalyzer). This instrument uses a Q—switched laser as an ionization source, a microscopeto focus radiation on the sample and a time—of—flight mass spectrometer to record spectra.It has the capability of providing both high spatial resolution and high sensitivity.
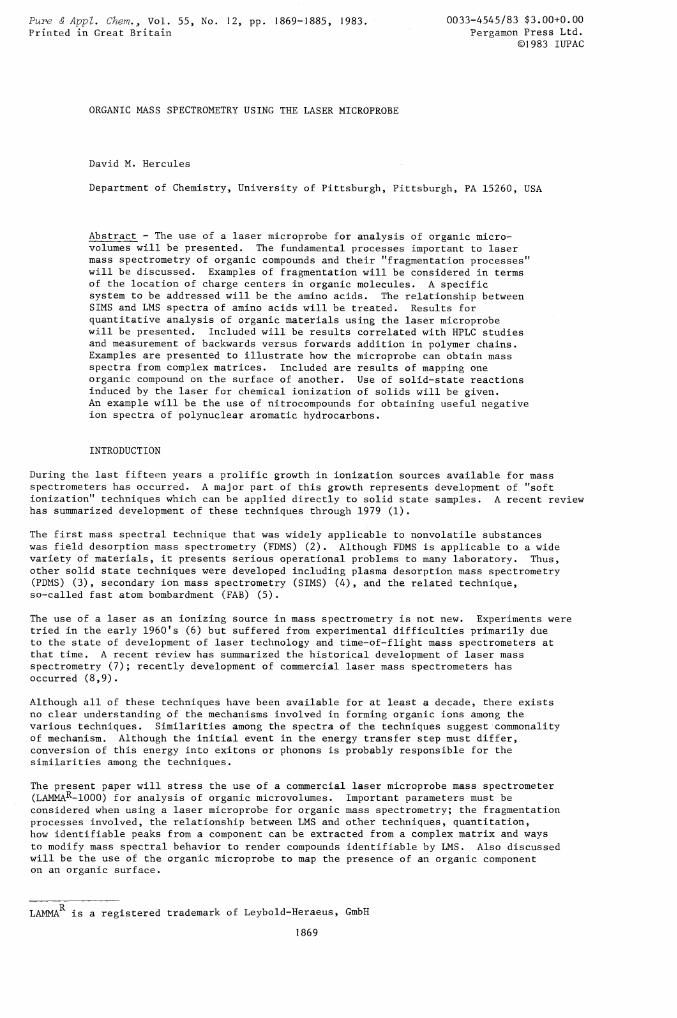
A schematic diagram of the LANMA—l000 is shown in Figure 1. The instrument basicallyconsists of four modules: the laser used for ionization, the sample and its associatedoptics, the time—of—flight mass spectrometer with its associated electronics and adetector—computer readout system. Each module will be discussed below.
analysismode
A'high—power (l0 W/cm2) laser pulse (15 nanoseconds), provided by a frequencyquadrupled (A = 265 nm) Nd—YAG Q—switched laser, is focused on the sample. A pilot He—Nelaser follows the same optical path as the Nd—YAG laser to allow precise focusing of thelaser pulse. A beam splitter provides a signal from the laser pulse to the photodiodewhich activates the time—of—flight mass spectrometer and records the pulse power on anenergy meter. Reproducibility of the laser power is ±8% from shot to shot. Averagingmultiple shots is important for quantitative analysis. A precise linear motion system isused to interchange the ion extraction system and the objective for sample observation.The instrument with the ion extraction system in place shown at the top of Figure landsample observation mode is shown at the bottom. The microscope objective has an aperatureof f/0.22 giving a resolution of about 2 microns on the sample. The intensity of the laserpower can be varied continously over three decades by a pair of twisted polarizers. Theradiation is focused on the sample to an elipse (approximately 2 x 3 m axes) because ofthe 45° angle of the incident radiation.
A time—of—flight mass spectrometer is employed in the LAMMA—l000 to obtain a completemass spectrum from a single laser shot. To achieve both high resolution and hightransmission the analyzer uses an electrostatic focusing system for the ions. The ionreflector corrects for ions of the same mass which have different initial energies. Iondetection is accomplished by use of a Cu—Be secondary electron multiplier. The multiplerpulse is preamplified and stored in a transient recorder and ultimately read out by thecomputer. An HP series 1000 computer is used for data processing.
observation energy metermode
data system
Figure 1. Diagram of the LAMMA—l000 laser mass spectrometry
Organic mass spectrometry using the laser microprobe 1871
The LANMA—1000 has a number of attractive features for chemical analysis. Virtually any
type of sample can be run because the compartment can accommodate a sample up to4 inches in diameter. Thus, one is not restricted to volatile or derivatized materialor to materials which are optically transparent. At low laser powers (in the laserdesorption mode) reproducible mass spectra can be obtained for organic and inorganicmaterials and their features can be related to molecular structure. An important featureis that both positive and negative ion spectra are obtained from the LANMA—l000 havingapproximately equal intensities. Switching from positive to negative spectra isaccomplished by push bottom selection.
By stepping the microscope stage in the x—y direction, it is possible to use the LANHA—l000as an organic microprobe. Of particular interest is the ability to obtain spectra froman organic material on an organic matrix. This type of problem is extremely difficultto do by other techniques, but as will be demonstrated here, can be accomplished withease using the LAMMA—l000.
FUNDAMENTAL PROCESSES
Mechanism of laser ionizationThe mechanism of laser ionization and volatilization of an organic solid is not wellunderstood. A recent paper has summarized the current state of thinking about laserionization processes (10). The conclusion is that much work still needs to be done onunderstanding mechanisms of laser ionization and how this can be applied fruitfully toimprove understanding of ionization mechanisms. Some factors are known. For example,duration and shape of the laser pulse influence the type of spectra which are obtained.The process appears to be wavelength independent and the laser power density is probablythe single most important parameter. Single photon absorption characteristics of thesample do not seem to correlate with LMS. The reason is that a variety of processesoperate in laser ionization including volatilization, photoionization and shock wave effects.
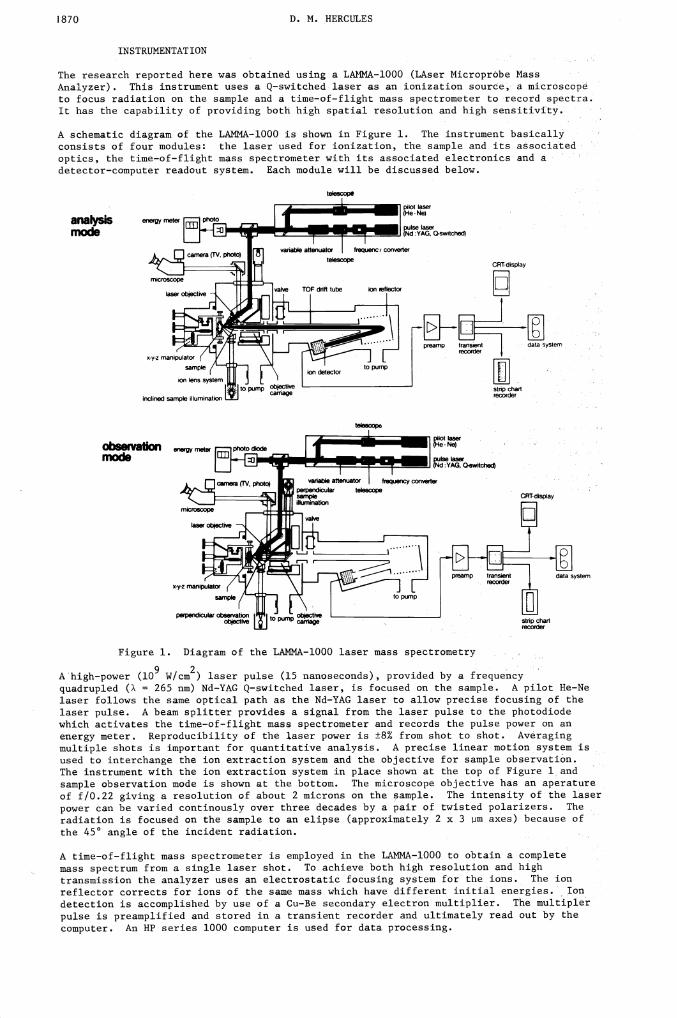
There are several processes which occur simultaneously that give rise to the observedspectra. Using a very simplistic model one can consider that there are four importantregions: 1) the region directly impacted by the laser, 2) secondary effects occurring inthe region immediately adjacent to laser impact, 3) the surface of this adjacent regionand 4) and a plume of material produced in the vacuum by laser volatilization. Figure 2illustrates a conceptual model of these processes (11). Region 1 is the area of direct
Figure 2. Model of laser ionization and volatilization (11)
interaction between the laser and the sample. Ionization undoubtedly occurs in this regionand effective temperatures of approximately 7000°K have been proposed on the basis of anLTE model (12). This region will be characterized by extensive fragmentation and it seenslikely that only atomic and small molecular fragments will be emitted from this region.At high power densities, the region of direct laser impact can truly be classified as aplasma.
ImmedIately adjacent to the region of direct laser interaction is an area of high thernalgradient. This region has been frequently referred to as the selvedge by some authorsand can be looked upon as some sort of a condensed yet highly mobile phase. The selvedgeis likely a fluid state of high temperature gradient where collisions can occur and whichresults in chemical reactions. This is probably where the najority of ions which areimportant to LMS are formed. The surface of this region (probably the true selvedge)
Laser beam
Secondoryionization (2)
(3)
by laser (I
1872 D. M. HERCULES
is a rapidly expanding region where the quasi—liquid sample becomes a "gas. It isdifficult to distinguish between ionization reactions which occur directly at the surfaceand those occurring deeper in the sample.
Region 4 is the "cloud" produced by expulsion of material into the vacuum. It is clearthat this is a region of rapid expansion going from a condensed phase (lOs atm.) to lOtorr on the order of a few microns. This will be a region of rapid cooling. There iscurrently a debate over the significance of ion molecule reactions which occur in this"gas phase" region. Reactions must occur reasonably close to the surface where the gas
density is fairly high.
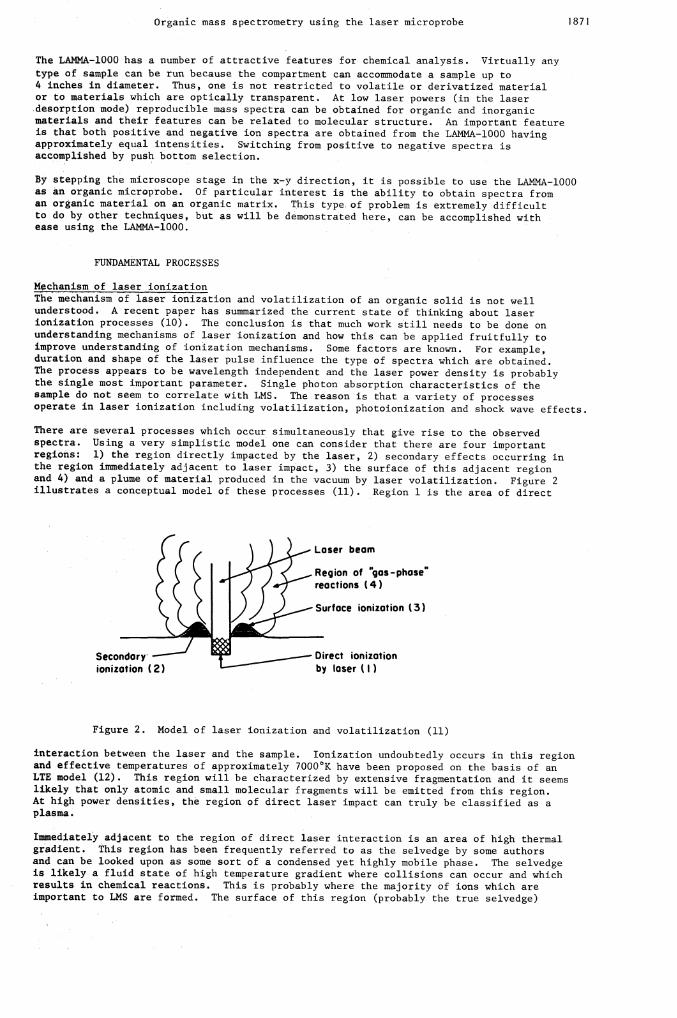
Given the above model, it is reasonable that the time characteristics of particle emissionwill vary according to different regions. This is shown qualitatively in Figure 3. Ions
20 nsec
Loser pulse
Ions p;oded
__-'"-_ jacent
Neutrals
Time
Figure 3. Time profiles of particle emissions in LMS (11)
produced in region 1 will be generated only while the laser is incident on the sample.Therefore, the time profile for emission of these ions should mimic the laser pulse exactly.Ion emission from regions 2 and 3 will also occur while the laser is incident on thesample. However, ion emission from this region should continue for a short time periodafter the laser pulse is extinguished and probably will not reach its peak at the peakof the laser pulse. Thus, one would expect to see a shift in time profile as shown inFigure 3. Emission of neutrals is a much lower energy process than ionization and neutralemission from the sample will continue as the thermal gradient established by the laserpulse dissipates through the sample. Thus, emission of neutrals will extend to muchlonger times as shown in Figure 3.
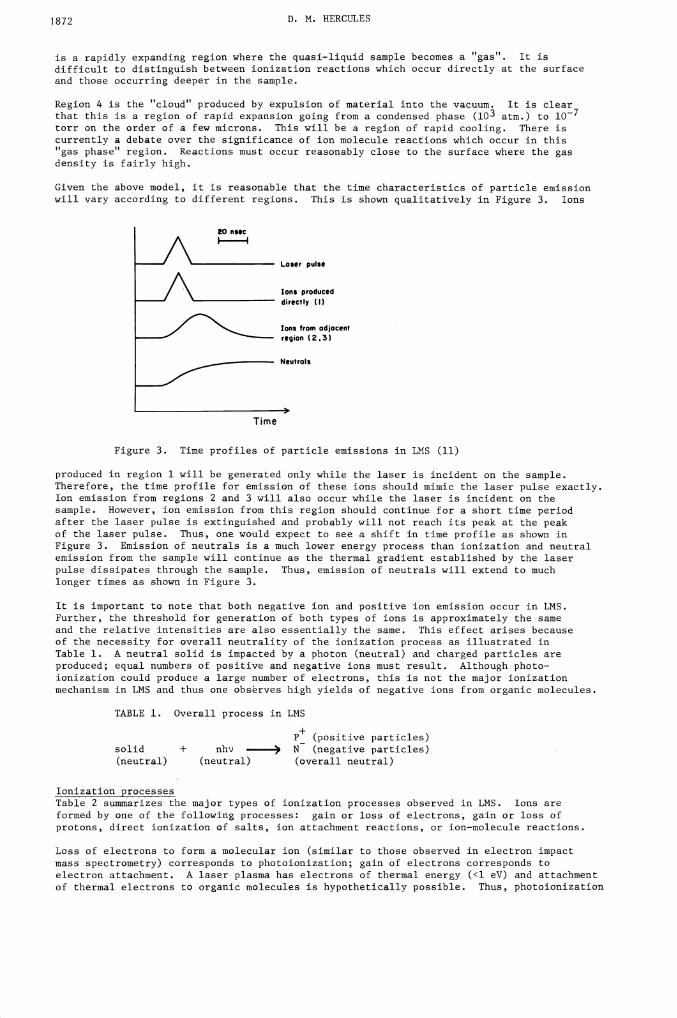
It is important to note that both negative ion and positive ion emission occur in LMS.Further, the threshold for generation of both types of ions is approximately the sameand the relative intensities are also essentially the same. This effect arises becauseof the necessity for overall neutrality of the ionization process as illustrated inTable 1. A neutral solid is impacted by a photon (neutral) and charged particles areproduced; equal numbers of positive and negative ions must result. Although photo—ionization could produce a large number of electrons, this is not the major ionizationmechanism in LMS and thus one obsbrves high yields of negative ions from organic molecules.
TABLE 1. Overall process in LNS
(positive particles)solid + nhv ) N (negative particles)(neutral) (neutral) (overall neutral)
Ionization processesTable 2 summarizes the major types of ionization processes observed in LMS. Ions areformed by one of the following processes: gain or loss of electrons, gain or loss ofprotons, direct ionization of salts, ion attachment reactions, or ion—molecule reactions.
Loss of electrons to form a molecular ion (similar to those observed in electron impactmass spectrometry) corresponds to photoionization; gain of electrons corresponds toelectron attachment. A laser plasma has electrons of thermal energy (<1 eV) and attachmentof thermal electrons to organic molecules is hypothetically possible. Thus, photoionization
Organic mass spectrometry using the laser microprobe
TABLE 2. Ionization processes in LMS
1873
Gain or Loss of Electrons
M nhv > M+ + e
M+e > M
Ionization of Salts
M+X nhv> M+ + X_
Ion—Molecule Reactions
Gain or Loss or Protons
MH+B ) M+BH+M+BH -> MH++B
Ion—Attachment Reactions
> MC+
N+A —) MA
M nhv > A++BA++M > AM+
B+M > BM
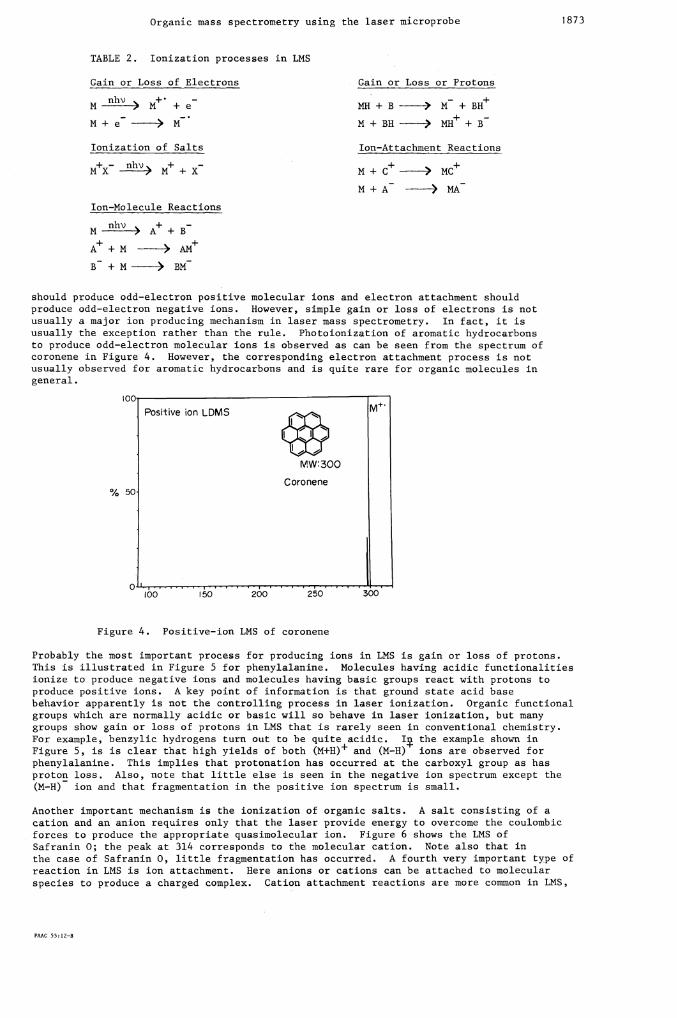
should produce odd—electron positive molecular ions and electron attachment shouldproduce odd—electron negative ions. However, simple gain or loss of electrons is notusually a major ion producing mechanism in laser mass spectrometry. In fact, it isusually the exception rather than the rule. Photoionization of aromatic hydrocarbonsto produce odd—electron molecular ions is observed as can be seen from the spectrum ofcoronene in Figure 4. However, the corresponding electron attachment process is notusually observed for aromatic hydrocarbons and is quite rare for organic molecules in
general.
,00Positive on LDMS
MW:300
M
Coronene50
('1
Figure 4. Positive—ion LMS of coronene
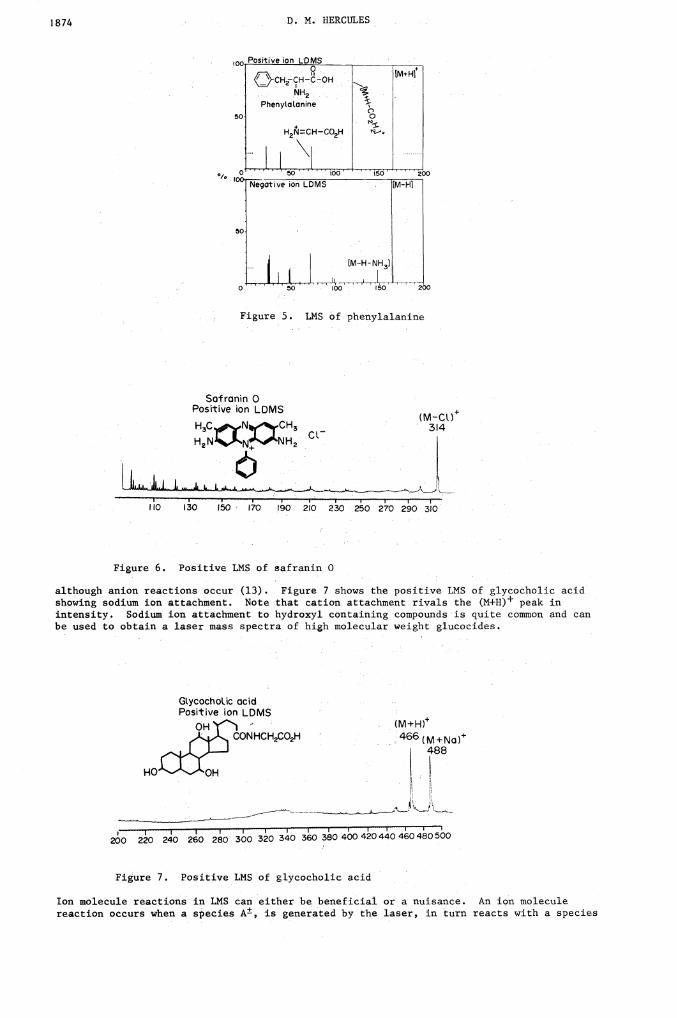
Probably the most important process for producing ions in LMS is gain or loss of protons.This is illustrated in Figure 5 for phenylalanine. Molecules having acidic functionalitiesionize to produce negative ions and molecules having basic groups react with protons toproduce positive ions. A key point of information is that ground state acid basebehavior apparently is not the controlling process in laser ionization. Organic functionalgroups which are normally acidic or basic will so behave in laser ionization, but manygroups show gain or loss of protons in LMS that is rarely seen in conventional chemistry.For example, benzylic hydrogens turn out to be quite acidic. I the example shown inFigure 5, is is clear that high yields of both (M+H)+ and (M—H) ions are observed forphenylalanine. This implies that protonation has occurred at the carboxyl group as hasproton loss. Also, note that little else is seen in the negative ion spectrum except the(M—H) ion and that fragmentation in the positive ion spectrum is small.
Another important mechanism is the ionization of organic salts. A salt consisting of acation and an anion requires only that the laser provide energy to overcome the coulombicforces to produce the appropriate quasimolecular ion. Figure 6 shows the LMS ofSafranin 0; the peak at 314 corresponds to the molecular cation. Note also that inthe case of Safranin 0, little fragmentation has occurred. A fourth very important type ofreaction in LMS is ion attachment. Here anions or cations can be attached to molecularspecies to produce a charged complex. Cation attachment reactions are more common in LMS,
PAAC 55:12—B
Oo 5o 300
Positive ion LDMS
-CHf-CH -C-OHNH2
Phenytaanine
-- i I200 220 240 260 280 300 320 340 360 380 400 420 440 460 480 500
Figure 7. Positive LMS of glycocholic acid
Ion molecule reactions in LMS can either be beneficial or a nuisance.reaction occurs when a species A±, is generated by the laser, in turn
An ion moleculereacts with a species
1874 D. N. HERCULES
5000
H2CH—C02H
S,,, 50 •1oO •150' 2
Negative ion LDMS EM-HI
so
EM-H- NH311
1! .Lo 50 100 150 200
Figure 5. LMS of phenylalanine
So-franin 0Posffive ion LOMS
H3C.,.N,.øCH3H2NJLNLNHS C1
LLLiLJLJLL L...
(M—C1)314
110 30 150 70 190 210 230 250 270 290 310
Figure 6. Positive LMS of safranin 0
although anion reactions occur (13). Figure 7 shows the positive LNS of glycocholic acidshowing sodium ion -attachment. Note that cation attachment rivals the (M+H)+ peak inintensity. Sodium ion attachment to hydroxyl containing compounds is quite common and canbe used to obtain a laser mass spectra of high molecular weight glucocides.
GlycochoUc acidPositive ion LDMS
H0'
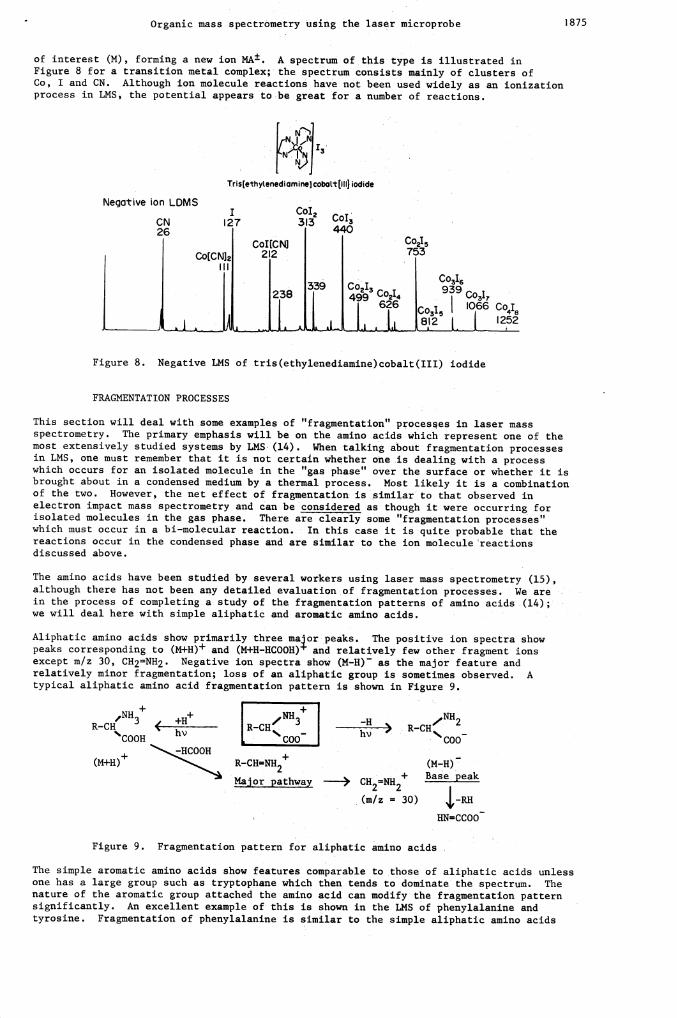
Organic mass spectrometry using the laser microprobe 875
of interest (M), forming a new ion MA±. A spectrum of this type is illustrated inFigure 8 for a transition metal complex; the Spectrum consists mainly of clusters ofCo, I and CN. Although ion molecule reactions have not been used widely as an ionizationprocess in LMS, the potential appears to be great for a number of reactions.
N)
Tris(ekhytenediaminecobatt[lII) iodide
Negative on LDMS I Co12CN 27 313 0326 440
CoIECN] CoI5
I Co(CN]2 212 753
I IIICol
238 423 Co2149:96
Co317
LFigure 8. Negative LMS of tris(ethylenediamine)cobalt(III) iodide
FRAGMENTATION PROCESSES
This section will deal with some examples of "fragmentation" processes in laser massspectrometry. The primary emphasis will be on the amino acids which represent one of themost extensively studied systems by LMS (14). When talking about fragmentation processesin LMS, one must remember that it is not certain whether one is dealing with a processwhich occurs for an isolated molecule in the "gas phase" over the surface or whether it isbrought about in a condensed medium by a thermal process. Most likely it is a combinationof the two. However, the net effect of fragmentation is similar to that observed inelectron impact mass spectrometry and can be considered as though it were occurring forisolated molecules in the gas phase. There are clearly some "fragmentation processes"which must occur in a bi—molecular reaátion. In this case it is quite probable that thereactions occur in the condensed phase and are similar to the ion molecule reactionsdiscussed above.
The amino acids have been studied by several workers using laser mass spectrometry (15),although there has not been any detailed evaluation of fragmentation processes. We arein the process of completing a study of the fragmentation patterns of amino acids (14);we will deal here with simple aliphatic and aromatic amino acids.
Aliphatic amino acids show primarily three malor peaks. The positive ion spectra showpeaks corresponding to (M+H)+ and (M+H—HCOOH) and relatively few other fragment ionsexcept m/z 30, CH2=NH2. Negative ion spectra show (M—H) as the major feature andrelatively minor fragmentation; loss of an aliphatic group is sometimes observed. Atypical aliphatic amino acid fragmentation pattern is shown in Figure 9.
,NH+ + NH+ NHR-CH I R—CH( ) R-CH(
2COOH v
L"
COO
+ -HCOOH +(M+H) R-CH=NR2 (M-H)
Major pathway —> CH2=NH2+Base peak
(m/z = 30)
HN=CCOO
Figure 9. Fragmentation pattern for aliphatic amino acids
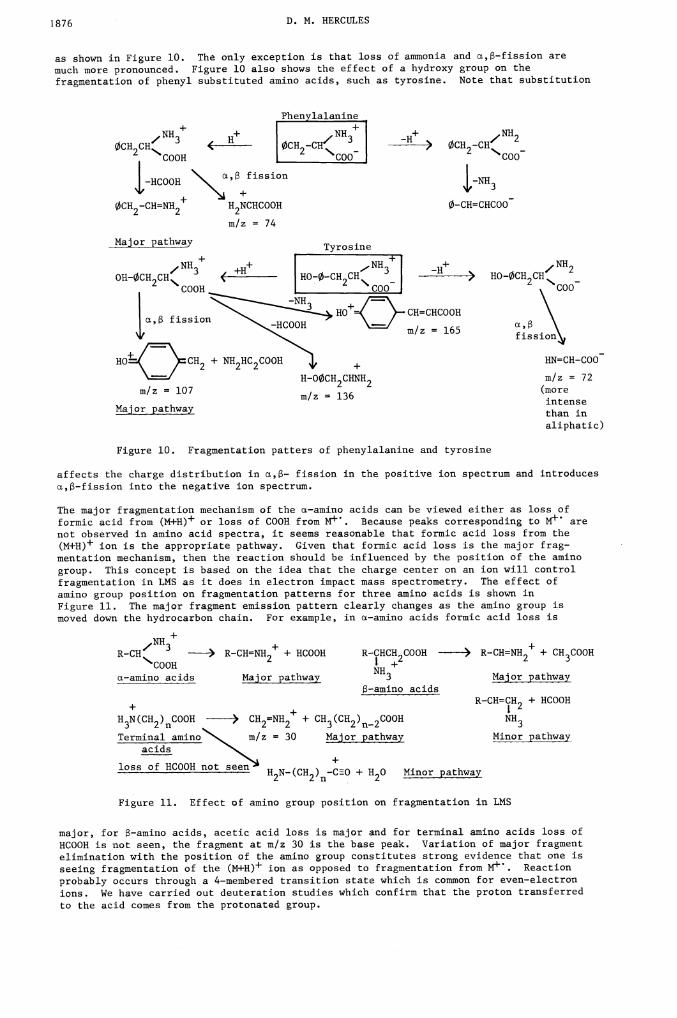
The simple aromatic amino acids show features comparable to those of aliphatic acids unlessone has a large group such as tryptophane which then tends to dominate the spectrum. Thenature of the aromatic group attached the amino acid can modify the fragmentation patternsignificantly. An excellent example of this is shown in the LMS of phenylalanine andtyrosine. Fragmentation of phenylalanine is similar to the simple aliphatic amino acids
1876 D. M. HERCULES
as shown in Figure 10. Th only exception is that loss of ammonia and n,—fission aremuch more pronounced. Figure 10 also shows the effect of a hydroxy group on thefragmentation of phenrl substituted amino acids, such as tyrosine. Note that substitution
+
+ NH2________ -H> HO-ØCH2CH
__________________ COO
165
HN=CH-COO
m/z = 72(moreintensethan in
aliphatic)
Figure 10. Fragmentation patters of phenylalamime and tyrosine
affects the charge distribution in n,— fission in the positive ion spectrum and introducesn,13—fission into the negative ion spectrum.
The major fragmentation mechanism of the n—amino acids can be viewed either as loss offormic acid from (M+H)+ or loss of COOH from 14+'. Because peaks corresponding to 14+ arenot observed in amino acid spectra, it seems reasonable that formic acid loss from the(M+H)+ ion is the appropriate pathway. Given that formic acid loss is the major frag-mentation mechanism, then the reaction should be influenced by the position of the aminogroup. This concept is based on the idea that the charge center on an ion will controlfragmentation in LMS as it does in electron impact mass spectrometry. The effect ofamino group position on fragmentation patterns for three amino acids is shown in
Figure 11. The major fragment emission pattern clearly changes as the amino group ismoved down the hydrocarbon chain. For example, in n—amino acids formic acid loss is
NH +
RCH=NH2+ + HCOOHNCOOH
n-amino acids Major pathway _____________
+
H3N(CH2)COOH > CH2=NH2+ + CH3(CH2)2COOH
Terminal amino m/z = 30 Major pathway _____________acids
loss of HCOOH not seenH2N_(CH2)n_CE0 + H20 Minor pathwa
Figure 11. Effect of amino group position on fragmentation in LMS
major, for s—amino acids, acetic acid loss is major and for terminal amino acids loss ofHCOOH is not seen, the fragment at m/z 30 is the base peak. Variation of major fragmentelimination with the position of the amino group constitutes strong evidence that one isseeing fragmentation of the (M+H)+ ion as opposed to fragmentation from M+'. Reactionprobably occurs through a 4—membered transition state which is common for even—electronions. We have carried out deuteration studies which confirm that the proton transferredto the acid comes from the protonated group.
,, NH3ØCH2CH
COOH
J,-HCOOH
ØCH2_CH=NH2+
Major pathway
Phenylalanine
H"COO
fission
H2NCHCOOHm/z = 74
Tyrosine
+ ,NH2-H >ØCH2-CH
"'COO
J,_NH3
Ø-CH=CHCOO
+H+ ,NH3 IHO-Ø-CH2CH\ I
COOJ
fission
HO+CH2 + NH2HC2COOH
m/z = 107
Major pathway
+
H-OOCH2CHNH2m/z = 136
R-CHCH2COOH -) R_CH=NH2+ + CH3COOH
3 Major pathways—amino acids
R-CHCH2 + HCOOH
NH3Minor pathway
Organic mass spectrometry using the laser microprobe 1877
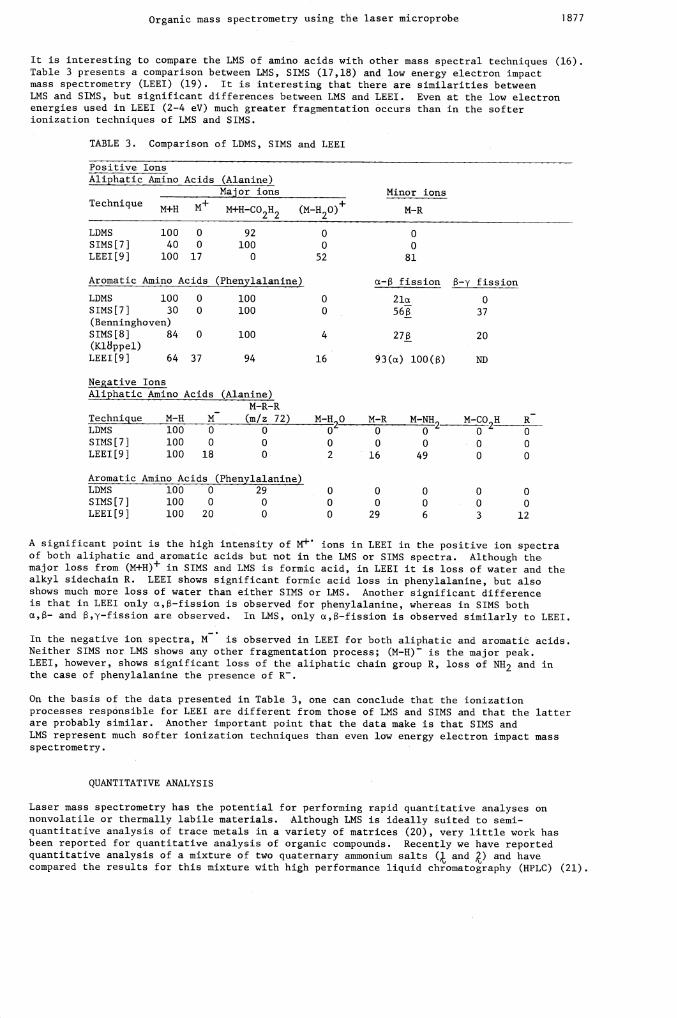
It is interesting to compare the LMS of amino acids with other mass spectral techniques (16).Table 3 presents a comparison between LMS, SIMS (17,18) and low energy electron impactmass spectrometry (LEEI) (19). It is interesting that there are similarities betweenLMS and SIMS, but significant differences between LMS and LEEI. Even at the low electronenergies used in LEEI (2—4 eV) much greater fragmentation occurs than in the softerionization techniques of LMS and SIMS.
TABLE 3. Comparison of LDMS, SIMS and LEEI
Positive Ions
(Alanine)Maj or ions Minor ions
M+H-C02H2 (M_H20)+M-R
Aliphatic Amino Acids
Technique M+H M+
LDMS 100 0 92 0 0
SIMS[7] 40 0 100 0 0
LEEI[9] 100 17 0 52 81
Aromatic Amino Acids (Phenylalanine) cx— fission 8—y fission
LDMS 100 0 100 0 2la 0
SIMS[7] 30 0 100 0 56 37(Benninghoven)SIMS[8] 84 0 100 4 27 20(KlBppel)LEEI[9J 64 37 94 16 93(u) l0O() ND
Negative IonsAliphatic Amino Acids (Alanine)
M-R-RTechnique M-H M (m/z 72) M-H20
M-RM-NH2 M-CO2H
RLDMS 100 0 0 0 0 0 0 0
SIMS[7] 100 0 0 0 0 0 0 0LEEI[9] 100 18 0 2 16 49 0 0
Aromatic Amino Acids (Phenylalanine)LDMS 100 0 29 0 0 0 0 0
SIMS[7} 100 0 0 0 0 0 0 0LEEI[9] 100 20 0 0 29 6 3 12
A significant point is the high intensity of M+ ions in LEEI in the positive ion spectraof both aliphatic and aromatic acids but not in the LMS or SIMS spectra. Although themajor loss from (M+HIF in SIMS and LMS is formic acid, in LEEI it is loss of water and thealkyl sidechain R. LEEI shows significant formic acid loss in phenylalanine, but alsoshows much more loss of water than either SIMS or LMS. Another significant differenceis that in LEEI only u,—fission is observed for phenylalanine, whereas in SIMS bothct,— and ,y—fission are observed. In LMS, only c,—fission is observed similarly to LEEI.
In the negative ion spectra, M is observed in LEEI for both aliphatic and aromatic acids.Neither SIMS nor LMS shows any other fragmentation process; (M—H) is the major peak.LEEI, however, shows significant loss of the aliphatic chain group R, loss of NH2 and inthe case of phenylalanine the presence of R.
On the basis of the data presented in Table 3, one can conclude that the ionizationprocesses responsible for LEEI are different from those of LMS and SIMS and that the latterare probably similar. Another important point that the data make is that SIMS andLMS represent much softer ionization techniques than even low energy electron impact mass
spectrometry.
QUANTITATIVE ANALYSIS
Laser mass spectrometry has the potential for performing rapid quantitative analyses onnonvolatile or thermally labile materials. -Although LMS is ideally suited to semi—quantitative analysis of trace metals in a variety of matrices (20), very little work hasbeen reported for quantitative analysis of organic compounds. Recently we have reportedquantitative analysis of a mixture of two quaternary ammonium salts ( and ) and havecompared the results for this mixture with high performance liquid chromatography (HPLC) (21).
1878 D. H. HERCULES
_CH24..C14H29Cl (_CH2±_C12H25Cl
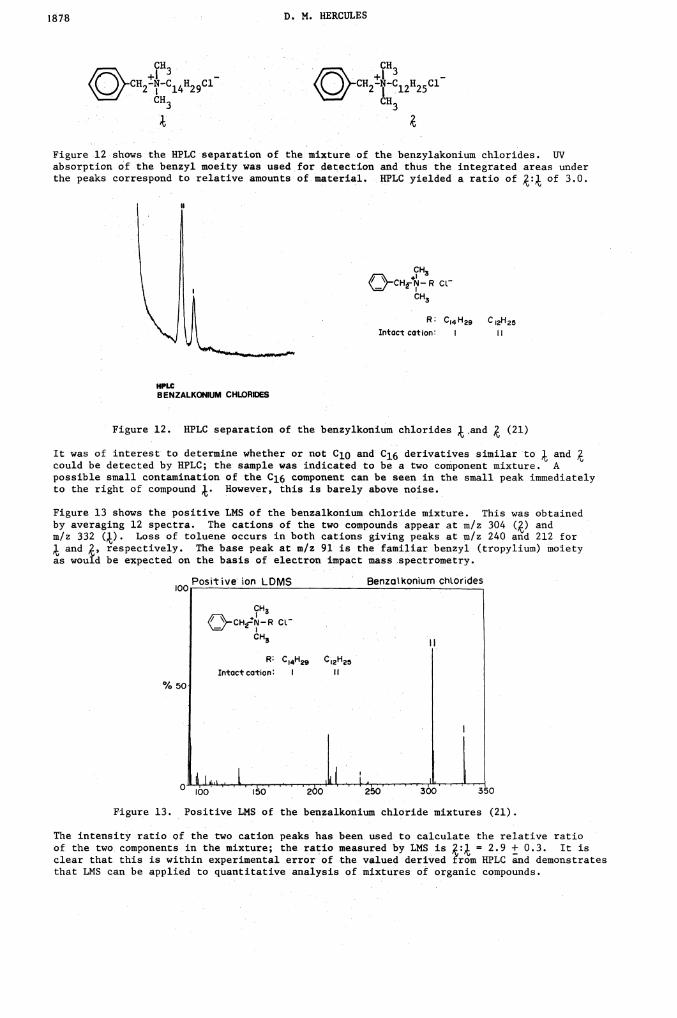
Figure 12 shows the HPLC separation of the mixture of the benzylakonium chlorides. UVabsorption of .the benzyl moeity was used for detection and thus the integrated areas underthe peaks correspond to relative amounts of material. HPLC yielded a ratio of of 3.0.
CH3
(j—CHfJ—R C1
CH3
R: C4H29 C121-125
Intact cation: I II
HPLCBENZALKONIUM CHLORIDES
Figure 12. HPLC separation of the benzylkonium chlorides .and (21)
It was of interest to determine whether or not C10 and C16 derivatives similar to andcould be detected by HPLC; the sample was indicated to be a two component mixture. Apossible small contamination of the Cl6 component can be seen in the small peak immediatelyto the right of compound ). However, this is barely above noise.
Figure 13 shows the positive LMS of the benzalkonium chloride mixture. This was obtainedby averaging 12 spectra. The cations of the two compounds appear at m/z 304 () andm/z 332 (k). Loss of toluene occurs in both cations giving peaks at m/z 240 and 212 for
and , respectively. The base peak at m/z 91 is the familiar benzyl (tropylium) moietyas wouid be expected on the basis of electron impact mass spectrometry.
Positive ion LDMS Benzatkonium chlorides
% 50
C1
CH3
R C14H29 C2H25Intact cation: I II
tI Io 00 IO 200 2O 3ô0 350
Figure 13. Positive LMS of the benzalkonium chloride mixtures (21).
The intensity ratio of the two cation peaks has been used to calculate the relative ratioof the two components in the mixture; the ratio measured by LHS is = 2.9 ± 0.3. It isclear that this is within experimental error of •the valued derived horn HPLC and demonstratesthat LMS can be applied to quantitative analysis of mixtures of organic compounds.
Organic mass spectrometry using the laser microprobe 1879
An important problem in polymer science is probing the molecular chain structure of polymers.
Polyvinylidine fluoride (PVF2) is produced by a free radical polymerization processyielding a linear polymer consisting of repeating CH2CF2 monomer units The preferredpolymer chain orientation is head—to—tail, i.e. —CH2CF2CH2CF2— with the CF2 group beingreferred to as the head and the CH2 group as the tail. All PVF2 chains contain a smallpercentage of backward additions, namely, head—to—head and tail—to—tail, which can affectpolymer properties. Quantitative measurement of the PVF2 molecular chain structurehas been accomplished through 19F NMR (22) . NNR results showed that backward additionsconstitute about 4—6% of the chain and that, these backward units are well separated alongthe chain. We were interested in seeing if LMS could perform quantitative analysis of thebackward addition units in the PVF2 chain. Such a mass spectrometric method wouldrepresent a simple, quick method involving minimal sample preparation.
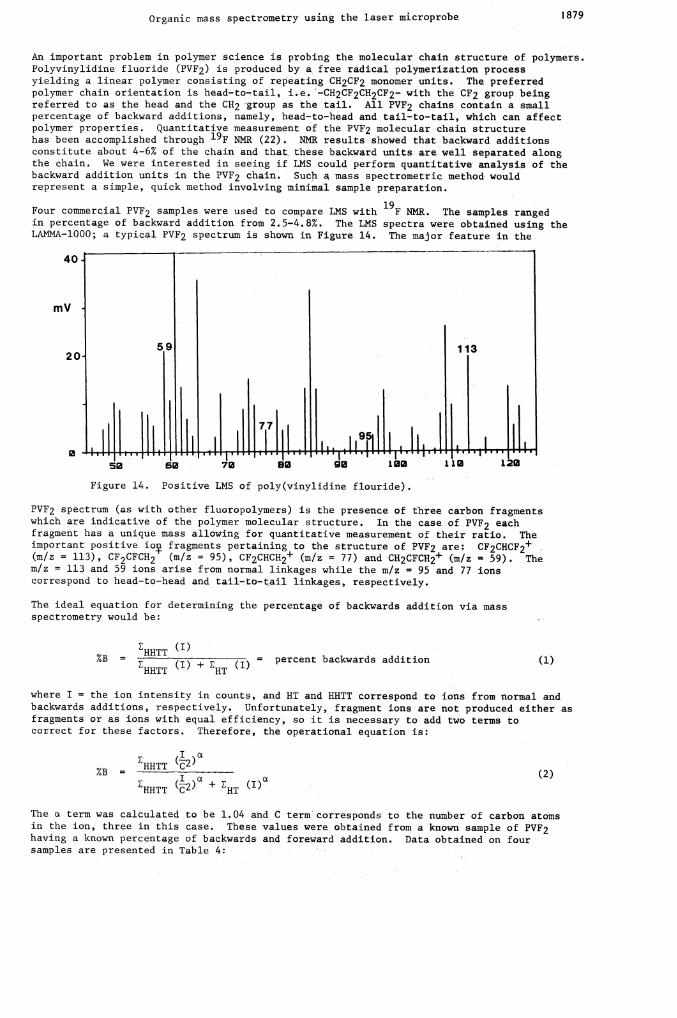
Four commercial PVF2 samples were used to compare LMS with 19F NMR. The samples rangedin percentage of backward addition from 2.5—4.8%. The LMS spectra were obtained using theLAMNA-1000; a typical PVF2 spectrum is shown in Figure 14. The major feature in the
40
mV
59 11320
11t.1h11J L1 ,111!r1d111,Ii' r50 70 80 90 102 112 122
Figure 14. Positive LMS of poly(vinylidine flouride).
PVF2 spectrum (as with other fluoropolymers) is the presence of three carbon fragmentswhich are indicative of the polymer molecular structure. In the case of PVF2 eachfragment has a unique mass allowing for quantitative measurement of their ratio. Theimportant' positive io fragments pertaining to the structure of PVF2 are: CF2CHCF2+(m/z = 113), CF2CFCH2 (n/z = 95), CF2CHCH2 (m/z = 77) and CH2CFCH2+ (m/z = 59). Them/z = 113 and 59 ions arise from normal linkages while the m/z = 95 and 77 ionscorrespond to head—to—head and tail—to—tail linkages, respectively.
The ideal equation for determining the percentage of backwards addition via massspectrometry would be:
HHTT (I)=
(I) + (I) = percent backwards addition (1)HHTT HT
where I = the ion intensity in counts, and HT and HHTT correspond to ions from normal andbackwards additions, respectively. Unfortunately, fragment ions are not produced either asfragments or as ions with equal efficiency, so it is necessary to add two terms tocorrect for these factors. Therefore, the operational equation is:
= HHTT (*%)n(2)
HHTT (*2)a + HT
The n term was calculated to be 1.04 and C term corresponds to the number of carbon atomsin the ion, three in this case. These values were obtained from a known sample of PVF2having a known percentage of backwards and foreward addition. Data obtained on foursamples are presented in Table 4:
1880 D. M. HERCULES
TABLE 4. Comparison of NMR and LMINA Analysis for Polyvinidine Fluoride
Polymer SampleA B* C D r.s.d
%B LAMNA Analysis 2.4 4.0 4.3 4.8 ±0.l
%B 19F NMR 2.5 4.0 4.7 4.8 ±0.02*. This polymer sample was used as a standard
The LAMMA and NMR results for samples A and D agree quite well. Sample C shows deviationof 0.4% which is outside the statistical limits anticipated on the basis of the other
samples. It is possible that sample C may have a higher degree of branching incorporatedinto the structure, thus deviating from the necessary assumption of a linear polymer.Nevertheless, the close agreement between the two methods demonstrates the capabilityof LMS for doing quantitative analysis of units in a polymer chain if the appropriatemathematical model can be constructed and the proper standards are available.
SOLID STATE CHEMICAL IONIZATION SOURCES
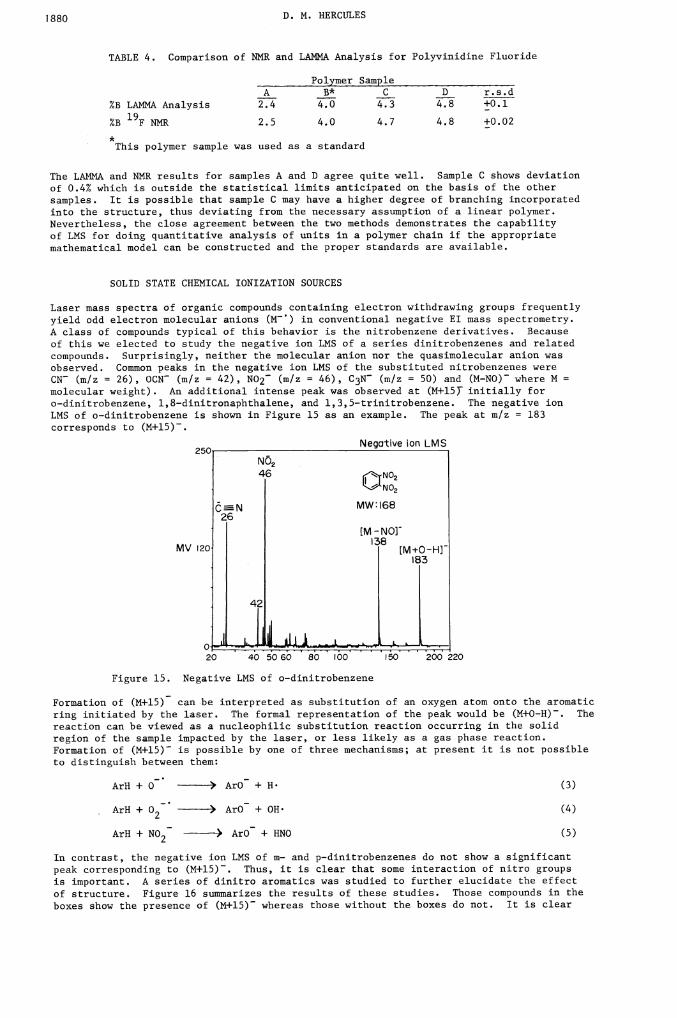
Laser mass spectra of organic compounds containing electron withdrawing groups frequentlyyield odd electron molecular anions (M) in conventional negative El mass spectrometry.A class of compounds typical of this behavior is the nitrobenzene derivatives. Becauseof this we elected to study the negative ion LMS of a series dinitrobenzenes and relatedcompounds. Surprisingly, neither the molecular anion nor the quasimolecular anion wasobserved. Common peaks in the negative ion LMS of the substituted nitrobenzenes wereCN (m/z 26), OCN (m/z = 42), NO2 (m/z = 46), C3N (m/z = 50) and (N—NO) where M =molecular weight). An additional intense peak was observed at (M+l5 initially for
o—dinitrobenzene, l,8—dinitronaphthalene, and l,3,5—trinitrobenzene. The negative ionLMS of o—dinitrobenzene is shown in Figure 15 as an example. The peak at m/z = 183corresponds to (M+l5).
Negcrtive ion LMS25C
NO246 (NO2
NO2
ÔN MW:16826
[M -NOF138
MV 20 [M+O-HF183
20 40 50 60 80 tOO 50 200 220
Figure 15. Negative LMS of o—dinitrobenzene
Formation of (M+l5) can be interpreted as substitution of an oxygen atom onto the aromaticring initiated by the laser. The formal representation of the peak would be (M+O—H). Thereaction can be viewed as a nucleophilic substitution reaction occurring in the solidregion of the sample impacted by the laser, or less likely as a gas phase reaction.Formation of (M+l5) is possible by one of three mechanisms; at present it is not possibleto distinguish between them:
ArH + 0 ArO + H• (3)
ArH + 02 ) ArO + OH (4)
ArH + NO2 > ArO + HNO (5)
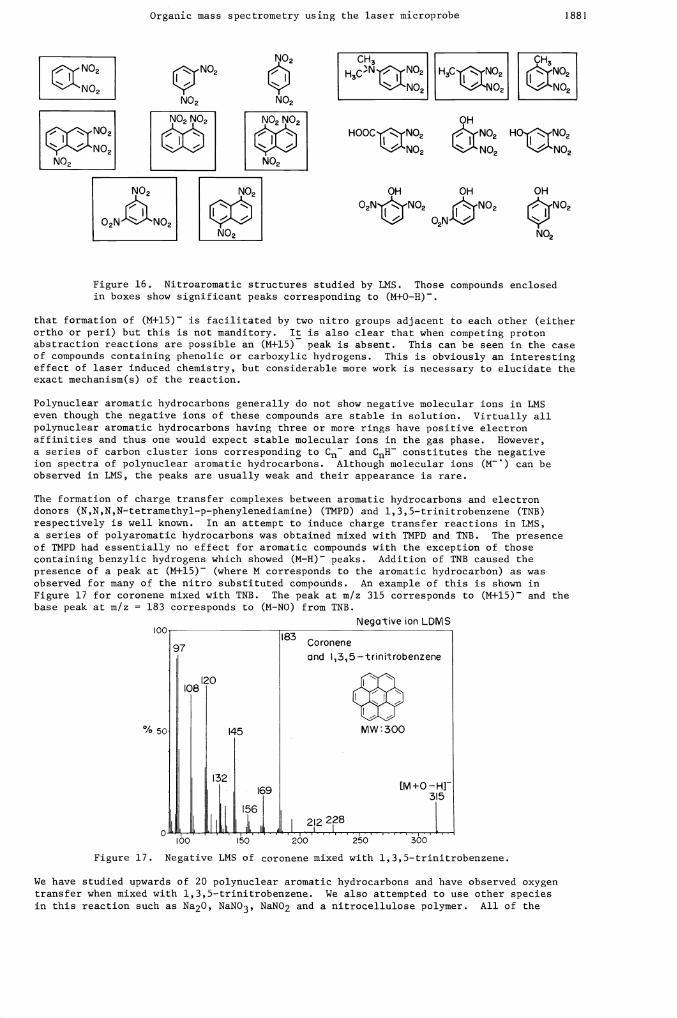
In contrast, the negative ion LMS of m— and p—dinitrobenzenes do not show a significantpeak corresponding to (M+l5). Thus, it is clear that some interaction of nitro groupsis important. A series of dinitro aromatics was studied to further elucidate the effectof structure. Figure 16 summarizes the results of these studies. Those compounds in theboxes show the presence of (M+l5) whereas those without the boxes do not. It is clear
Organic mass spectrometry using the laser microprobe 1881
_________ ________H3C)NT1INO2 rF3CNO2 _______
HOOC'-NO2 j1-NO2 HO'1-NO2NO2 NO2 NO2
OH OH OH
O2N'(NO2 rj'yNO2 1'j1'NO2L) O2NL._____________ _________ NO2
Figure 16. Nitroaromatic structures studied by LMS. Those compounds enclosedin boxes show significant peaks corresponding to (M+O—H).
that formation of (M+15) is facilitated by two nitro groups adjacent to each other (eitherortho or pen) but this is not manditory. It is also clear that when competing protonabstraction reactions are possible an (M+15) peak is absent. This can be seen in the caseof compounds containing phenolic or carboxylic hydrogens. This is obviously an interestingeffect of laser induced chemistry, but considerable more work is necessary to elucidate theexact mechanism(s) of the reaction.
Polynuclear aromatic hydrocarbons generally do not show negative molecular ions in LMSeven though the negative ions of these compounds are stable in solution. Virtually allpolynuclear aromatic hydrocarbons having three or more rings have positive electronaffinities and thus one would expect stable molecular ions in the gas phase. However,a series of carbon cluster ions corresponding to Cn and Cn}F constitutes the negativeion spectra of polymuclear aromatic hydrocarbons. Although molecular ions (N) can beobserved in LMS, the peaks are usually weak and their appearance is rare.
The formation of charge transfer complexes between aromatic hydrocarbons and electron
donors (N,N,N,N—tetramethyl—p—phenylenediamine) (TNPD) and l,3,5—trinitrobenzene (TNB)respectively is well known. In an attempt to induce charge transfer reactions in LMS,a series of polyaromatic hydrocarbons was obtained mixed with TMPD and TNB. The presenceof TMPD had essentially no effect for aromatic compounds with the exception of thosecontaining benzylic hydrogens which showed (M—H) peaks. Addition of TNB caused thepresence of a peak at (M+l5Y (where M corresponds to the aromatic hydrocarbon) as wasobserved for many of the nitro substituted compounds. An example of this is shown inFigure 17 for coronene mixed with TNB. The peak at m/z 315 corresponds to (M+15) and thebase peak at m/z = 183 corresponds to (N—NO) from TNB.
Negative ion LDMS
Figure 17. Negative LMS of coronene mixed with l,3,5—trinitrobenzene.
We have studied upwards of 20 polynuclear aromatic hydrocarbons and have observed oxygentransfer when mixed with l,3,5—trinitrobenzene. We also attempted to use other speciesin this reaction such as Na20, NaNO3, NaNO2 and a nitrocellulose polymer. All of the
-yNO2 1 - NO2NO2
IN02 __NO2 NO2
NO2 NO2 I
cy'-NO2lIL,L,LNOI
NO2 NO2
NO2 I NO2'
O2NNO2I I N02 I
Coronene
and I,3,5—trinitrobenzene
MW:300
1882 D. N. HERCULES
above gave the same result, namely, formation of a peak corresponding to (M+O—H) . Thenegative ion LMS of the reagents show formation of three potential reactants: 0 ,
and N02. Thus, the same three potential substitution mechanisms as stated above(reactions 3—5) could be operative. However, no correlation between the relative amountsof these species and the (M+O—H) peak was found in the compounds studied. Thus, it isdifficult to say whether the reaction is an analog of solution chemistry inducedthermally, or if it is brought about by species in the excited state. Nevertheless, thisrepresents the possibility of the chemical ionization reaction induced by the laser whichcan be used as an ionizing source for mass spectrometry. Preliminary studies, in ourlaboratory, for other sources have indicated that this type of reaction is quite generaland opens up the possibility for using chemical ionization in solid state mass spectrometry.
DIRECT LMS ANALYSIS OF SOLID MATERIALS
A distinct advantage o,f the LANMA—l000 and its front surface configuration is theability to perform direct analysis of solids. Essentially, any sample that cam beinserted into the sample chamber, brought under a vacuum and placed into the focus of thelaser, can be analyzed by laser mass spectrometry. This capability opens numerouspossible uses for the laser microprobe which have not been accessible by more conventionalmass spectral techniques. We are currently involved in three such areas: coupling of LMSwith thin layer chromatography, direct LMS analysis of naturally occurring materials, anddevelopment of an organic microprobe. Examples of how it is possible to perform these typesof analysis will be presented below.
Combinations of separation techniques and mass spectrometry have proved valuable foranalytical chemistry. Numerous couplings of separation techniques and mass spectrometerhave demonstrated the power and utility of this approach (23—27). Several recent reviews(23—25) have discussed the various approaches to coupling CC and LC with mass spectrometers.Several authors have recently dealt with the problem with coupling LC directly withLMS (28,29). A very promising combination is the direct coupling of thin layerchromatography (TLC) withthe laser microprobe.
TLC is probably the mosi widely used separation method because of its utility and theease of experimental operation. Its flexibility exceeds either LC or GC and making itthe most powerful separations methpd available to the practicing chemist. Thus, it wouldbe extremely valuable to couple this powerful and widely used separation technique directlyto a mass spectrometer. It is possible to couple TLC and LMS indirectly and the utilityof this combination has already been shown (27). However, no examples of the directcombination of TLC and LMS have been, reported.
TLC has been a traditional source of frustration to analytical chemists. Frequently,
small spots are observed which do not correspond to components detected by LC or GC,identification is difficult and quantitation almost impossible. Considerable effort hasbeen expended scraping spots from TLC plates, extracting and attempting to identify ormeasure the material by a combination of conventional spectroscopic techniques. Thus,direct analysis of TLC plates by LMS is particularly intriguing.
The combination of high performance thin layer chromatography (HPTLC) with the LAMMA—l000should provide a means of increasing chromatographic resolution due to the inherent lateralresolution of the LAMMA microprobe. Indeed, the combination of HPTLC and LMS representsa separations—spectroscopic combination which has potential exceeding either CC/MS orLC/MS. We present here initial resul1s on the direct analysis of samples from an HPTLCplate.
Organic dyes represent an ideal case for studying the combination of HPTLC and LMS. Thepresence of ionic groups normally limits the use of conventional mass spectrometry for dyesbut make them ideal for analysis by LMS. Because dyes are colored, it is easy for one todetect spots on HPTLC plates. One class of dyes having readily obtained LMS spectra are thetriphenylmethane dyes (30). The standard method for separating and identifying this classof dyes is TLC (31). Thus, one can use this system to confirm an assignment based on Rf byobtaining a mass spectrum of the spot.
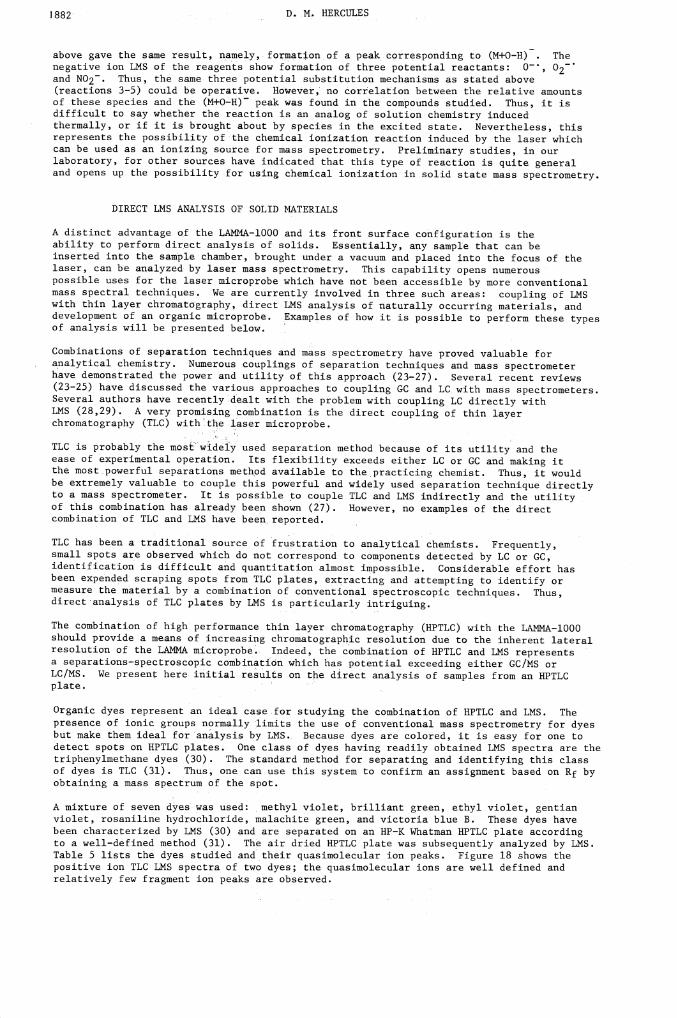
A mixture of seven dyes was used: methyl violet, brilliant green, ethyl violet, gentianviolet, rosaniline hydrochloride, malachite green, and victoria blue B. These dyes havebeen characterized by LMS (30) and are separated on an HP—K Whatman HPTLC plate accordingto a well—defined method (31). The air dried HPTLC plate was subsequently analyzed by LMS.Table 5 lists the dyes studied and their quasimolecular ion peaks. Figure 18 shows thepositive ion TLC LMS spectra of two dyes; the quasimolecular ions are well defined andrelatively few fragment ion peaks are observed.
Organic mass spectrometry using the laser microprobe 1883
TABLE 5. Quasimolecular Ions (M+) for Triphenylmethane Dyes
Dye - M (rn/zJ
Rosaniline Hydrochloride (RH) 302
Malachite Green (MG) 329
Brilliant Green (BG) 345
Methyl Violet (MV) 358
Gentian Violet (GV) 372
456
470
tion TLC—LMS briUiant green
MV
Jil I0 00 2b0 400 600
Figure 18. Positive ion TLC—LMS spectra of gentian violet and brilliant green
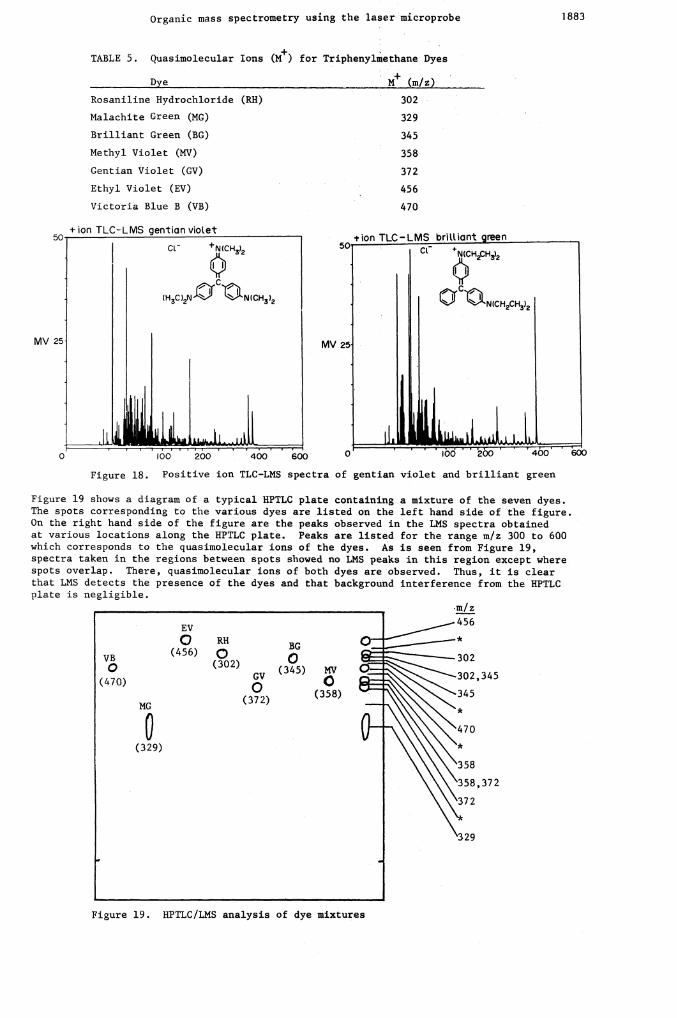
Figure 19 shows a diagram of a typical HPTLC plate containing.a mixture of the seven dyes.The spots corresponding to the various dyes are listed on the left hand side of the figure.On the right hand side of the figure are the peaks observed in the LMS spectra obtainedat various locations along the HPTLC plate. Peaks are listed for the range m/z 300 to 600which corresponds to the quasimolecular ions of the dyes. As is seen from Figure 19,spectra taken in the regions between spots showed no LMS peaks in this region except wherespots overlap. There, quasinolecular ions of both dyes are observed. Thus, it is clearthat LMS detects the presence of the dyes and that background interference from the HPTLCplate is negligible.
________________________________________ •m/z
456302
302 345
___\58,372329
Figure 19. HPTLC/LMS analysis of dye mixtures
Ethyl Violet (EV)
Victoria Blue B (VB)
MV 25
N(CHCH3)2
L) N(CH2CH3)2
I
EV
0 RH 0-BC(456)0 0VB
0 (302)(345) MV
(470)CV0 (358)
(372)MG
0-(329)
1884 D. N. HERCULES
These initial results clearly demonstrate the possibility of employing LNS as a detectorfor HPTLC. Further work is underway in our laboratory to define the nature of samplesfor which the technique can be used and to determine detection limits for theIIPTLC/LMS combination.
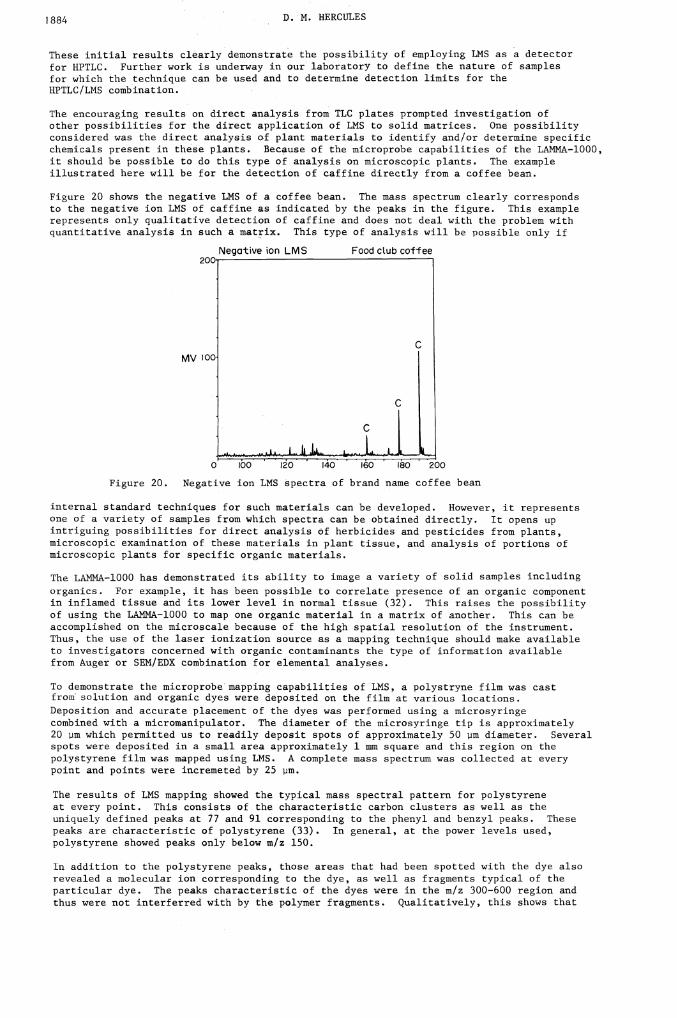
The encouraging results on direct analysis from TLC plates prompted investigation ofother possibilities for the direct application of LMS to solid matrices. One possibilityconsidered was the direct analysis of plant materials to identify and/or determine specificchemicals present in these plants. Because of the microprobe capabilities of the LAMMA—1000,it should be possible to do this type of analysis on microscopic plants. The exampleillustrated here will be for the detection of caffine directly from a coffee bean.
Figure 20 shows the negative INS of a coffee bean. The mass spectrum clearly correspondsto the negative ion LMS of caffine as indicated by the peaks in the figure. This examplerepresents only qualitative detection of caffine and does not deal with the problem withquantitative analysis in such a matrix. This type of analysis will be possible only if
Negative ion LMS Food ctub coffee20C
CMV 00
o bo 20 40 IO IO 200
Figure 20. Negative ion LMS spectra of brand name coffee bean
internal standard techniques for such materials can be developed. However, it representsone of a variety of samples from which spectra can be obtained directly. It opens upintriguing possibilities for direct analysis of herbicides and pesticides from plants,microscopic examination of these materials in plant tissue, and analysis of portions ofmicroscopic plants for specific organic materials.
The LAMMA—l000 has demonstrated its ability to image a variety of solid samples including
organics. For example, it has been possible to correlate presence of an organic componentin inflamed tissue and its lower level in normal tissue (32). This raises the possibilityof using the LMfMA—l000 to map one organic material in a matrix of another. This can beaccomplished on the microscale because of the high spatial resolution of the instrument.Thus, the use of the laser ionization source as a mapping technique should make availableto investigators concerned with organic contaminants the type of information availablefrom Auger or SEM/EDX combination for elemental analyses.
To demonstrate the microprobe mapping capabilities of LMS, a polystryne film was castfronT solution and organic dyes were deposited on the film at various locations.
Deposition and accurate placement of the dyes was performed using a microsyringecombined with a micromanipulator. The diameter of the microsyringe tip is approximately20 pm which permitted us to readily deposit spots of approximately 50 pm diameter. Severalspots were deposited in a small area approximately 1 mm square and this region on thepolystyrene film was mapped using LMS. A complete mass spectrum was collected at everypoint and points were incremeted by 25 pm.
The results of LMS mapping showed the typical mass spectral pattern for polystyreneat every point. This consists of the characteristic carbon clusters as well as theuniquely defined peaks at 77 and 91 corresponding to the phenyl and benzyl peaks. Thesepeaks are characteristic of polystyrene (33). In general, at the power levels used,polystyrene showed peaks only below m/z 150.
In addition to the polystyrene peaks, those areas that had been spotted with the dye alsorevealed a molecular ion corresponding to the dye, as well as fragments typical of theparticular dye. The peaks characteristic of the dyes were in the m/z 300—600 region andthus were not interferred with by the polymer fragments. Qualitatively, this shows that
Organic mass spectrometry using the laser microprobe 1885
it is possible to obtain characteristic peaks of a material in a napping experiment andthat combinations of peaks can be used to identify a particular species. For example,for gentian violet, two typical peaks are seen at m/z 372 and m/z 356 occurring in theratio of 2:1. In a mapping experiment on polystyrene, identical peaks and peak ratioswere observed. Thus, the combination of peaks could be used to map this dye on apolymer matrix.
Displaying the area map graphically illustrates where the dyes are located on the polymer.It also allows one to differentiate easily among the different organic dyes by their
quasimolecular and fragmentation patterns. When spots from two dyes overlap, they couldbe identified by peaks corresponding to both dyes.
The three examples illustrated here clearly indicate the potential for applicationof LMS to a variety of analytical problems. Because the LMIMA—l000 can obtain spectradirectly from solids, it represents a potentially valuable tool for characterizationof a wide variety of solid—state materials.
Acknowledgement — I would like to acknowledge the assistance of the followingpeople in obtaining the data used in this presentation: K. Viswanadham',F. Novak, K. Balasanmugam, D. Nattern, B. Wilk, and F. Lin. I also wishto acknowledge with appreciation support of this research by the NationalScience Foundation and the Office of Naval Research.
REFERENCES
1. C. D. Daves, Jr., Accts. Chem. Res. 12, 359—65 (1979).2. H. D. Beckey, InC. J. Mass Spectrom. Ion Phys. 2, 500—503 (1969).3. R. D. Mcfarlane, C. J. McNeal, J. E. Hunt, Adv. Mass Spectrom. 8A, 349—54 (1980).4. A. Benninghoven, D. Jaspers, W. Sichtermann, Appl. Phys. 11, 35—39 (1976).5. M. Barber, R. S. Bordoli, R. D. Sedgwick, A. N. Tyler, J. Chem. Soc. Chem. Comm.
325—27 (1981).6. R. E. Honig, J. R. Woolston, ppl. Phys. Letters 2, 138 (1963).7. R. J. Conzemius, J. M. Capellen, Int. J. Mass Spectrom. Ion Phys. 34, 197—271 (1980).8. H. Vogt, J. H. Heinen, S. Meier, R. Wechsung, Z. Anal. Chem. 308, 195—200 (1981).9. H. J. Heinen, S. Meier, H. Vogt, R. Wechsung, Proc. 9th Intl. Mass Spectrom. Conf.,
Vienna, Austria (1982).10. F. Hillenkanp, Int. J. Mass Spectrom. Ion Phys. 45, 305—313 (1982).11. D. M. Hercules, R. J. Day, K. Balasanmugam, T. A. Dang, C. P. Li, Anal. Chem.
54, 28OA—288A (1982).12. J. F. Ready, Effects of High—Power Laser Radiation, Academic Press, New York (1971).13. K. Balasanmugam, T. A. Dang, R. J. Day, D. N. Hercules, Anal. Chem. 53,
2296—2298 (1981).14. C. D. Parker, D. M. Hercules, to be published.15. C. Schiller, K. G. Krupke, F. Hillenkamp, Z. Anal. Chem. 308, 304 (1982).16. D. M. Hercules, C. D. Parker, K. Balasanmugam, S. K. Viswanadhan, in
A. Benninghoven, ed., Ion Formation from Organic Solids, Springer—Verlag, Berlin,pp. 222—228 (1983).
17. A. Benninghoven, D. Jaspers, W. Sichtermann, Appi. Phys. 11, 35 (1976).18. D. K. Kl8ppel, G. Von BLlnau, Int. J. of Mass pect. and Ion Phys. 39, 85 (1981).19. D. Voigt, J. Schmidt, Biomed. Mass Spectrom. 5, 44 (1978).20. R. Kaufmann, F. Hillenkamp, R. Wechsung, Med. Prog. Technol. 6, 109—21 (1979).21. K. Balasanmugan, D. M. Hercules, Anal. Chem. 55, 145—146 (1983).22. C. W. Witson, J. Polymer Sci. A 1, 3105—1310 (1963).23. M. C. Ten Noever de Brauw, J. Chromatogr., Chromatogr. Rev. 165, 207—233 (1979).24. N. M. M. Nibbering, J. Chromatogr., Chromatogr. Rev. 251, 93—104 (1982).25. H.—R. Schulten, J. Chromatogr., Chromatogr. Rev. 251, 105—128 (1982).26. P. J. Arpino, G. Guiochon, Anal. Chem., 51(7), 682A—701A (1979).27. D. A. Durden, A. V. Juovio, B. A. Davis, Anal. Chern. 52, 1815—1820 (1980).28. J. F. K. Huber, T. Dzido, F. Hevesch, J. .Chromatogr. 271(1), 27—33 (1983).29. E. D. Hardin, Laser Desorption Mass Spectrometry of Nonvolatile Biomolecules,
Dissertation, University of Houston, (1981).30. F. P. Novak, D. M. Hercules, unpublished results.31. H. Schweppe, Thin-Layer Chromatography, in K. Venkatvaman, ed., The Analytical
Chemistry of Synthetic Dyes, John Wiley & Sons, New York, pp. 23—56 (1977).32. U. Seydel, B. Lindner, in A. Benninghoven, ed., Ion Formation from Organic Solids,
Springer—Verlag, Berlin, pp. 240—244 (1983).33. J. A. Gardella, D. M. Hercules, Z. Anal. Chem. 308, 297 (1981).