Embed Size (px)
Citation preview
Oregon State Broadband
Initiative
Broadband Mapping ProjectJanuary 2013

What is the Broadband Mapping
Project?
• To create and maintain a statewide map based inventory of broadband internet
availability.
• ―support the collection of comprehensive and accurate state-level broadband
mapping data, development of state-level broadband maps, development and
maintenance of a nationwide broadband map for the use by policy makers and
consumers.‖
http://www.oregon.gov/broadband/Pages/state_broadband_project.aspx
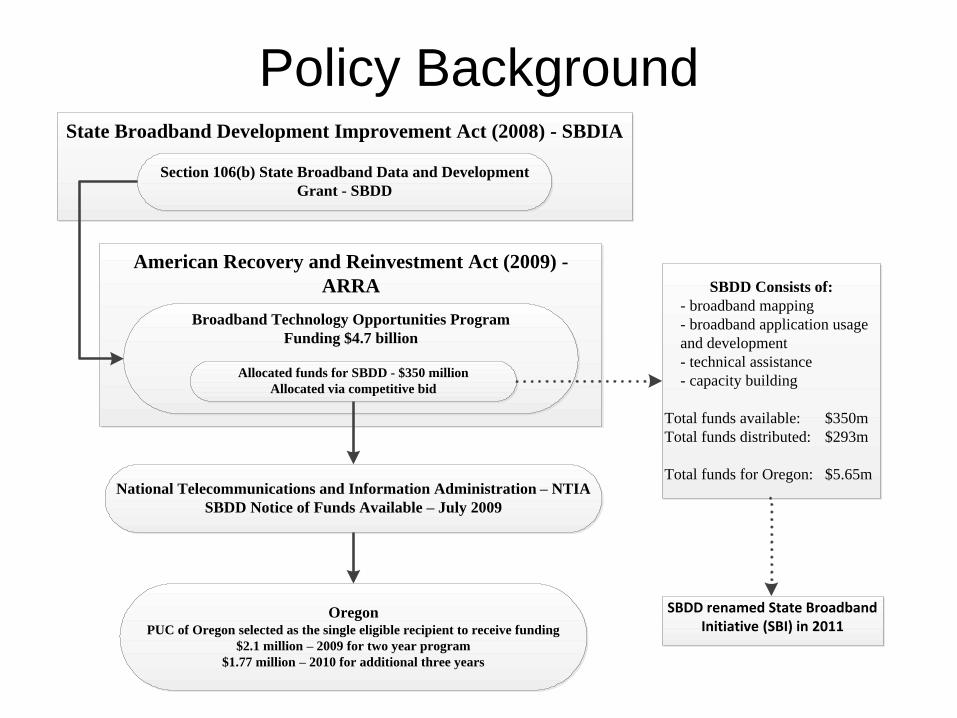
Policy BackgroundState Broadband Development Improvement Act (2008) - SBDIA
Section 106(b) State Broadband Data and Development
Grant - SBDD
American Recovery and Reinvestment Act (2009) -
ARRA
Broadband Technology Opportunities Program
Funding $4.7 billion
Allocated funds for SBDD - $350 million
Allocated via competitive bid
National Telecommunications and Information Administration – NTIA
SBDD Notice of Funds Available – July 2009
OregonPUC of Oregon selected as the single eligible recipient to receive funding
$2.1 million – 2009 for two year program
$1.77 million – 2010 for additional three years
SBDD Consists of:
- broadband mapping
- broadband application usage
and development
- technical assistance
- capacity building
Total funds available: $350m
Total funds distributed: $293m
Total funds for Oregon: $5.65m
SBDD renamed State Broadband Initiative (SBI) in 2011

Other SBI Projects
The Broadband Mapping Project is not the only project under the SBI banner:
• State Capacity Building:
NetCity survey – encourage broadband adoption.
http://netcityengineering.com/index.htm
• Technical Assistance:
Small business development – Oregon Small Business Development Center
Network.
http://www.bizcenter.org/
• Application Usage and Development:
Association of Oregon Counties.
http://www.aocweb.org/aoc/default.aspx

What is Broadband?
In the context of the project broadband is:
• A term that commonly refers to high-speed Internet access that is always on and
faster than the traditional dial-up access.
Broadband differentiates itself from other form of internet connectivity because:
• Broadband service provides higher-speed of data transmission. It allows more
content to be carried through the transmission ―pipeline.‖
• Broadband provides access to the highest quality Internet services—streaming
media, VoIP (Internet phone), gaming, and interactive services. Many of these current
and newly-developing services require the transfer of large amounts of data that may
not be technically feasible with dial-up service. Therefore, broadband service may be
increasingly necessary to access the full range of services and opportunities that the
Internet can offer.
• Broadband is always on. It does not block phone lines and there is no need to
reconnect to network after logging off.
• Less delay in transmission of content when using broadband.
http://www.broadband.gov/about_broadband.html
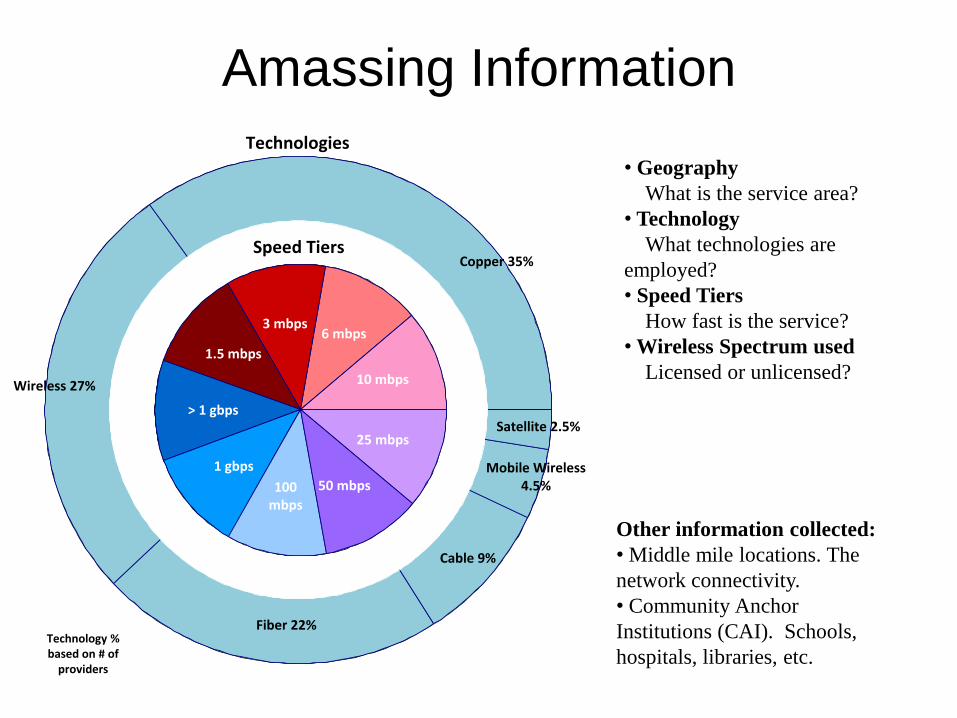
Amassing Information
Other information collected:
• Middle mile locations. The
network connectivity.
• Community Anchor
Institutions (CAI). Schools,
hospitals, libraries, etc.
• Geography
What is the service area?
• Technology
What technologies are
employed?
• Speed Tiers
How fast is the service?
• Wireless Spectrum used
Licensed or unlicensed?
Fiber 22%
Cable 9%
Wireless 27%
Copper 35%
Mobile Wireless 4.5%
Satellite 2.5%
6 mbps3 mbps
10 mbps
25 mbps
1.5 mbps
> 1 gbps
1 gbps
100 mbps
50 mbps
Technologies
Speed Tiers
Technology % based on # of
providers

System Configuration
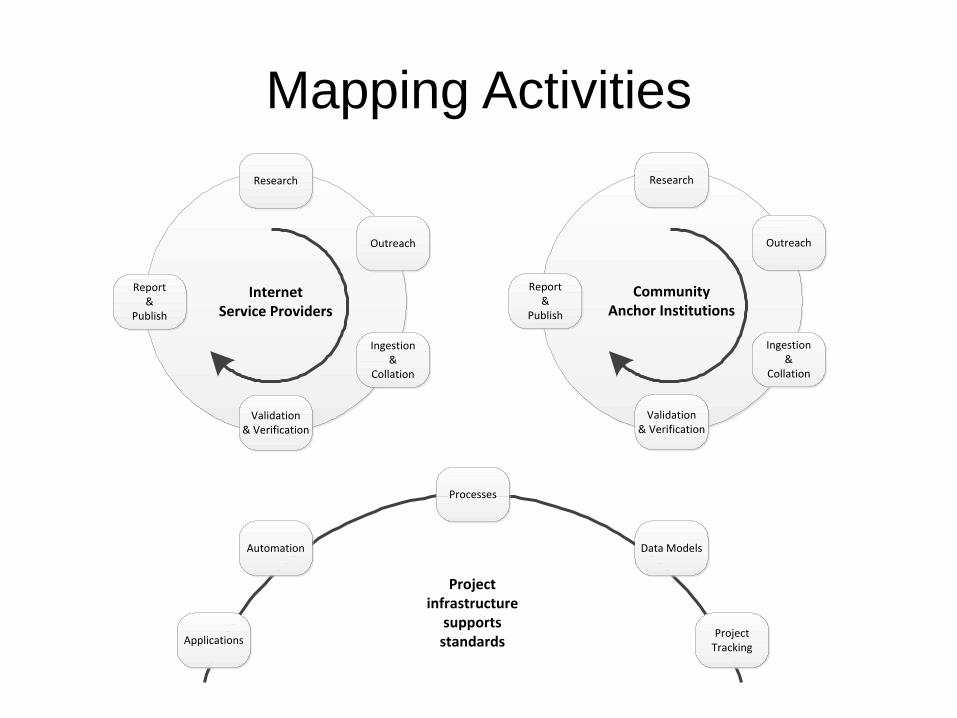
Mapping Activities
Internet Service Providers
Research
Ingestion&
Collation
Validation& Verification
Report&
Publish
Outreach
Community Anchor Institutions
Research
Ingestion&
Collation
Validation& Verification
Report&
Publish
Outreach
Processes
Project Tracking
Applications
Automation Data Models
Project infrastructure
supports standards
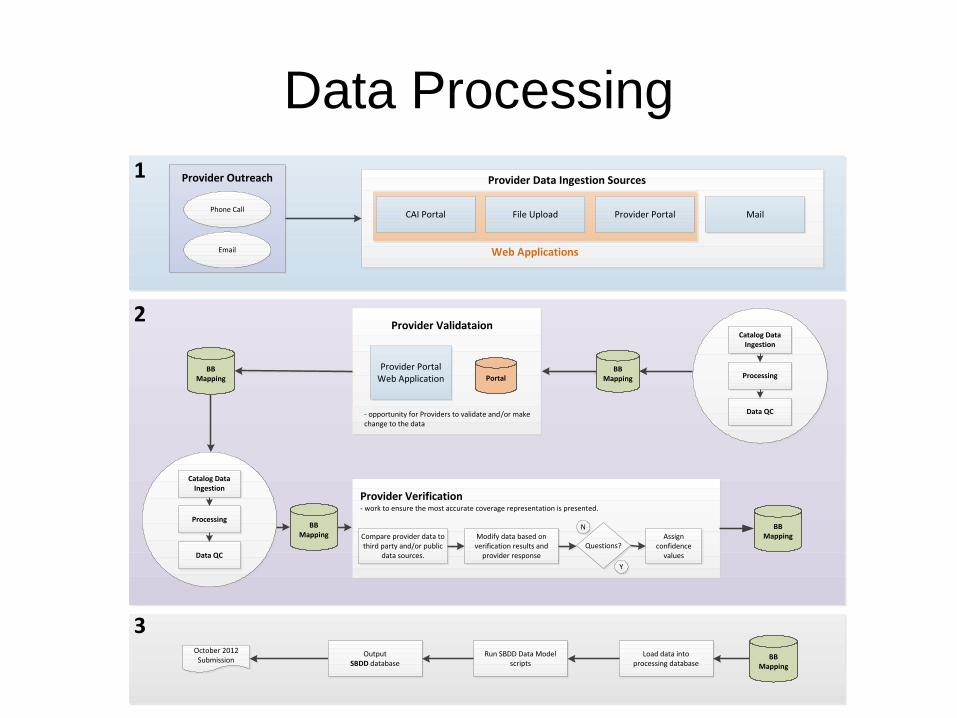
Data Processing
Provider Data Ingestion SourcesProvider Outreach
Phone Call
Load data into processing database
Run SBDD Data Model scripts
October 2012 Submission
Output SBDD database
Web Applications
CAI Portal File Upload Provider Portal
1
3BB
Mapping
Catalog DataIngestion
Processing
Data QC
Catalog DataIngestion
Processing
Data QC
BB Mapping
Provider Validataion
Provider PortalWeb Application
- opportunity for Providers to validate and/or make change to the data
Portal
Compare provider data to third party and/or public
data sources.
Modify data based on verification results and
provider response
Assign confidence
values
Provider Verification- work to ensure the most accurate coverage representation is presented.
Questions?
N
Y
2
BB Mapping
BB Mapping
BB Mapping

Data Collection Timeline
1/16
Receive NTIA Data Model
16/1 - 6/2
High Provider Activity Period
1/17
BeginProvider data submission period
StartProvider Outreach/Notification
1/18 - 2/24
Provider Data Aggregation/Ingestion
2/25 - 3/9
Provider Validation
3/31
Dataset Submission
3/12 - 3/31
Final Data Processing Period
4/1
NTIA Deadline
1/30
Send reminders to nonresponsive providers
Mar-12 - Mar-12
Internal/Team Product Extract, QC, Reviews
3/20
End Provider data submission period
1/2 - 1/13
System Prep
2/6
Startcalls to nonresponsive providers
1/16 - 1/20
Provider Portal Training
NTIA Data Submission Reporting Cyclehypothetical timeline
(This cycle is repeated twice a year, in the first and third quarters )
Jan-12 Feb-12 Mar-12
4/20/2012
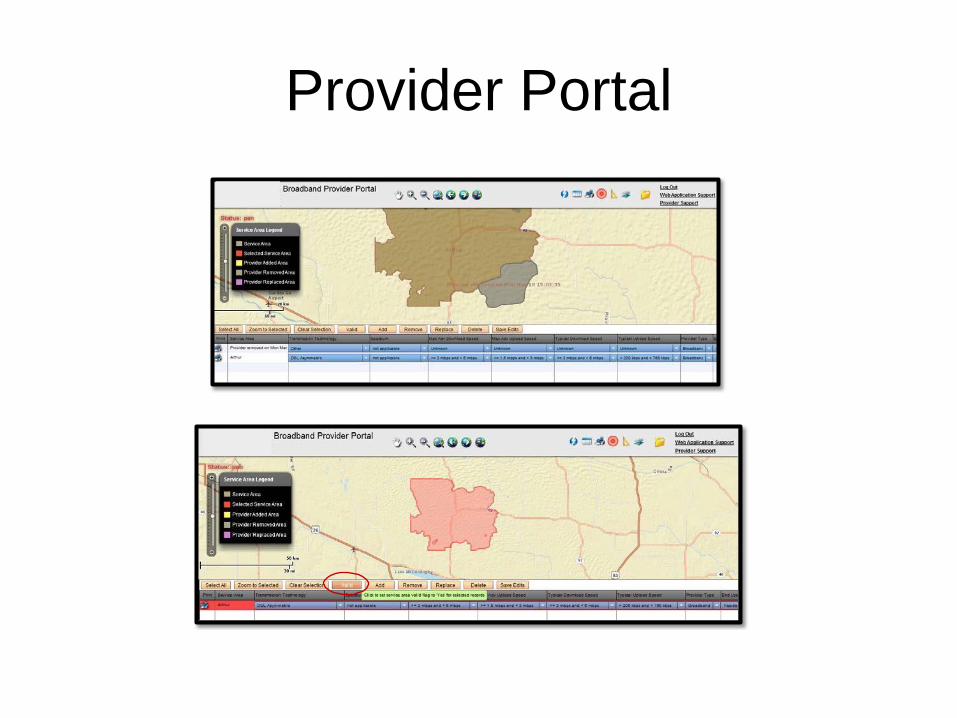
Provider Portal
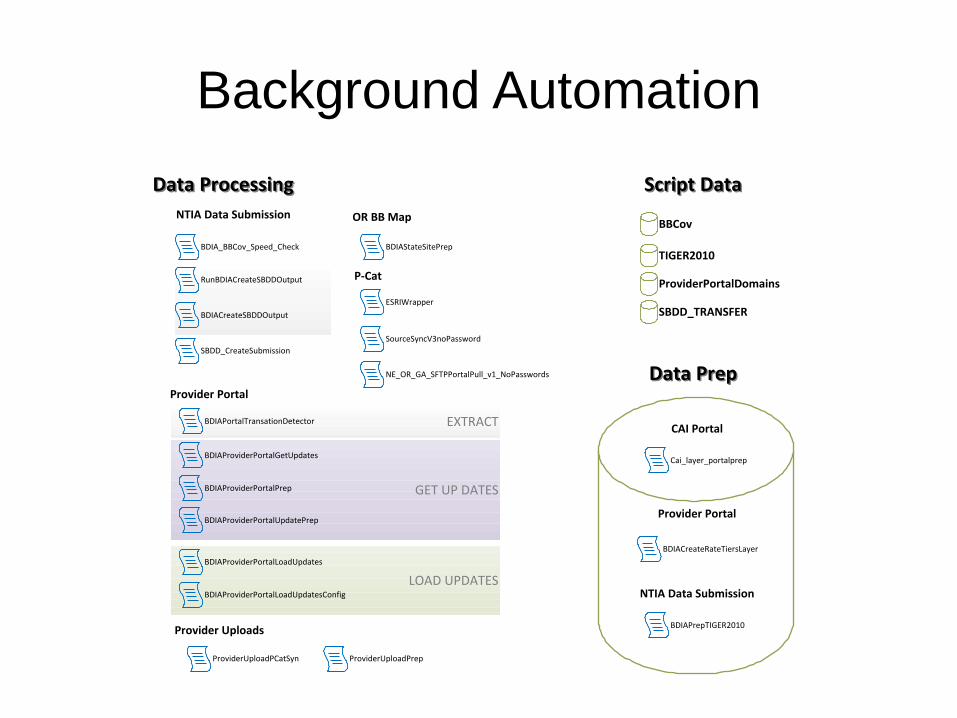
Background Automation
LOAD UPDATES
BBCov
Data ProcessingData Processing
BDIA_BBCov_Speed_Check
BDIACreateSBDDOutput
SBDD_CreateSubmission
Cai_layer_portalprep
NTIA Data Submission
Provider Portal
EXTRACTBDIAPortalTransationDetector
GET UP DATES
BDIAProviderPortalGetUpdates
BDIAProviderPortalPrep
BDIAProviderPortalUpdatePrep
BDIAProviderPortalLoadUpdates
BDIAProviderPortalLoadUpdatesConfig
CAI Portal
Provider Portal
BDIACreateRateTiersLayer
BDIAPrepTIGER2010
RunBDIACreateSBDDOutput
NTIA Data Submission
BDIAStateSitePrep
OR BB Map
Data PrepData Prep
Script DataScript Data
TIGER2010
ProviderPortalDomains
SBDD_TRANSFER
P-Cat
ESRIWrapper
SourceSyncV3noPassword
NE_OR_GA_SFTPPortalPull_v1_NoPasswords
Provider Uploads
ProviderUploadPCatSyn ProviderUploadPrep
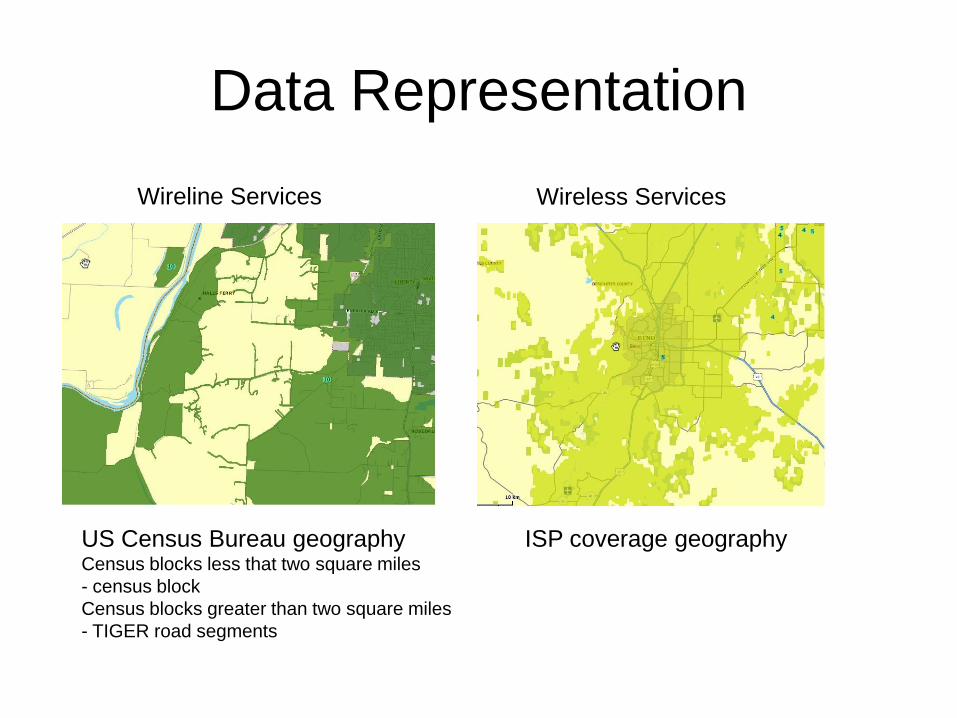
Data Representation
Wireline Services Wireless Services
ISP coverage geographyUS Census Bureau geographyCensus blocks less that two square miles
- census block
Census blocks greater than two square miles
- TIGER road segments

Data Confirmation
• ISP
– Provide confirmation of their services via the provider web portal
• Modeling
– Create service areas from provider data such as radio tower locations, network
aggregation locations
• Third party data sources
– Wire center boundaries, wireless service areas, cable service areas
• Field tests
– Testing of mobile wireless service at specific locations
• Confidence scores
– Assigned to each provider based on a number of factors

Criteria Description Points Assigned
Technology Type – Geometry
Represents the common geometry of the
specified technology 1
Technology Type – Attribution
Attribution is complete and matches
specified technology 1
3rd Party Verification
3rd party verification review supports
provider’s footprint, discrepancies are
minimal 1 per dataset (Maximum of 2 points)
Provider Validation
Provider validated their coverage via portal
or otherwise 1
Peer Review
Peer review was completed and agrees
with provider’s coverage 1
Crowd Sourcing/other
Results from the following do not show
significant discrepancies and/or supports
(agrees) with coverage and attribution,
Website, Speed Test ResultsFeedback,
anecdotal sources 1 per dataset (Maximum of 2 points)
NTIA Guidelines
Technology and attribution satisfies NTIA
guidelines. Example: Technology/Speed
tier table, doesn’t come up in the
Submission Receipt as an error 1
Currency of Overall Process
Data, validation, and verification activities
are current within a timeline of 2 data
submissions, or 1 year. 2 points if
participated in current submission, 1 point
if participated in previous submission, 0
points if have not participated within the
previous year. sliding scale 0-2
Provider Engagement
A measure of how engaged the provider is
in the project.1 point for responding to
communications, 2 points for actively
participating and submitting data in a
timely manner (not at the last minute), 3
points for significant work on ensuring
update accuracy. sliding scale 0-3
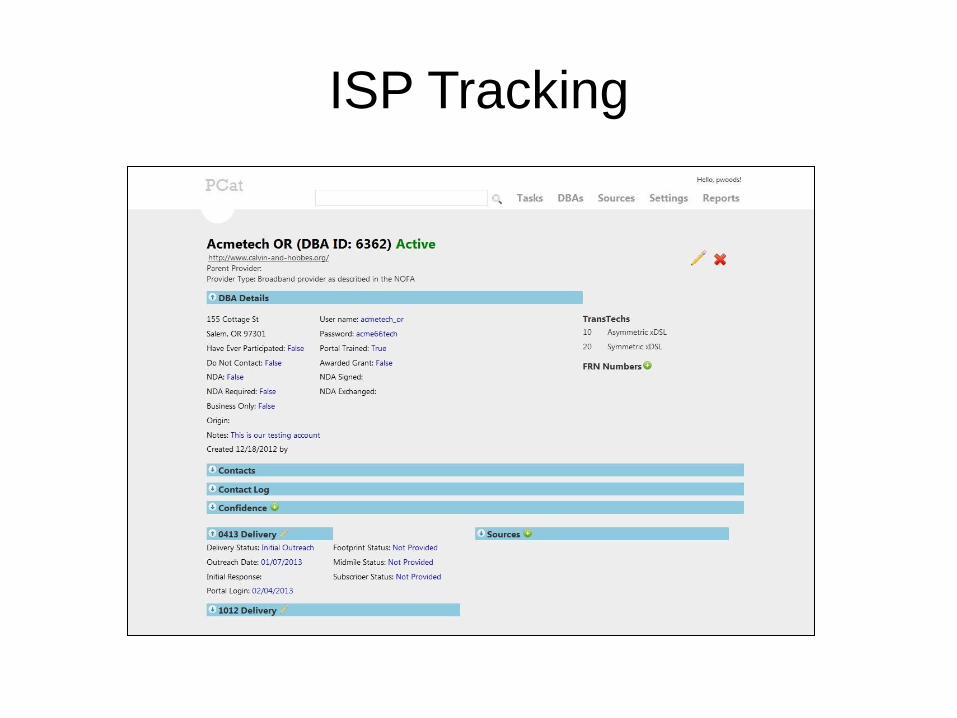
ISP Tracking
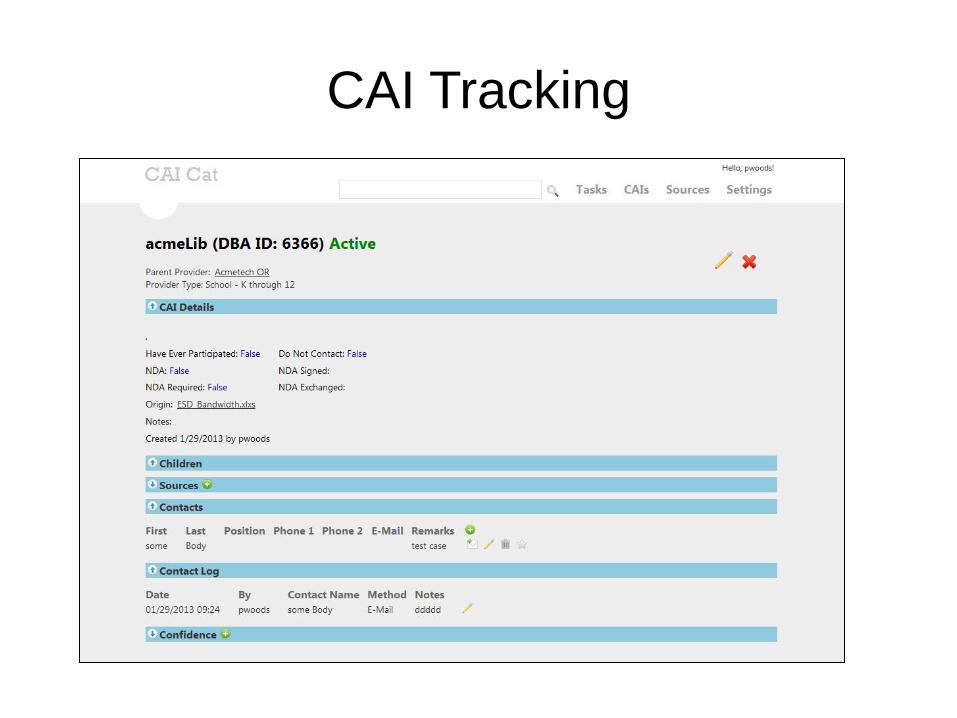
CAI Tracking
NTIA Reports
• Reporting timeline:
– Reports submitted to the NTIA every six months
– Baseline dates December 31st and June 30th
– Report deadlines April 1st and October 1st
• Reports consist of:
– File geodatabase – ISPs by technology, speeds, etc.
– Spreadsheet – lists ISPs by technology, census block/street segment
counts, etc.
– Methodology document – ISP counts, methods used, lists every
potential ISP contacted
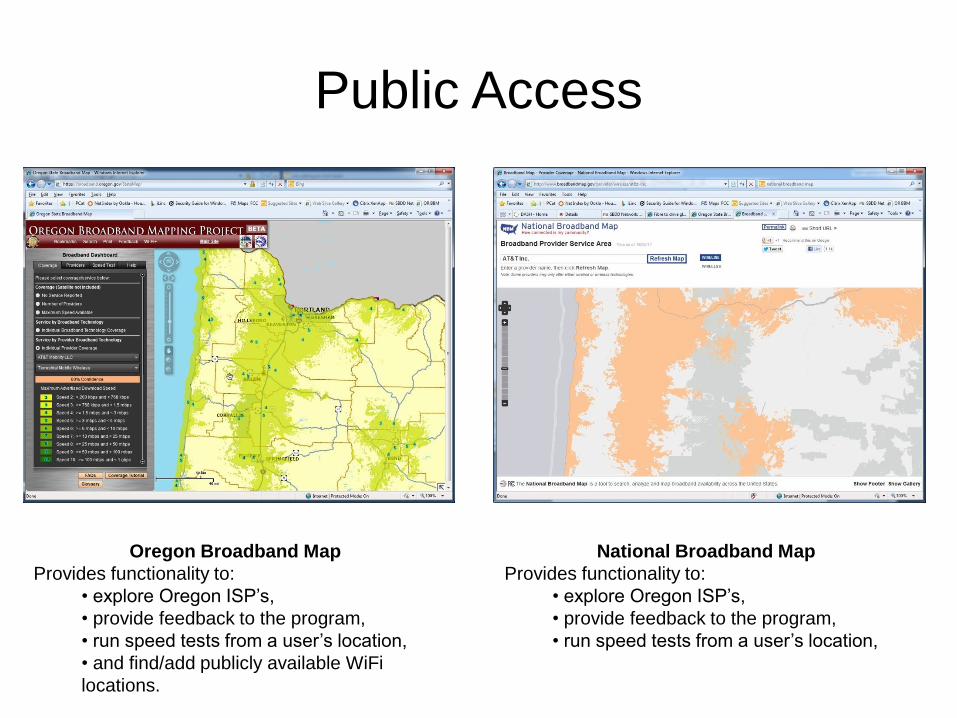
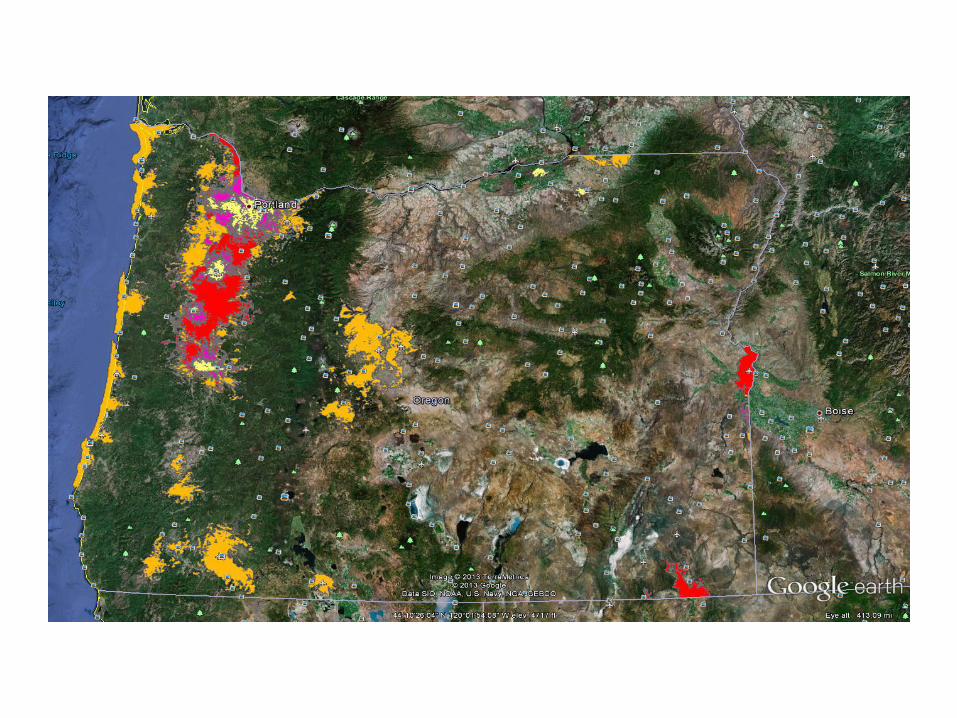
Public Access
Oregon Broadband Map
Provides functionality to:
• explore Oregon ISP’s,
• provide feedback to the program,
• run speed tests from a user’s location,
• and find/add publicly available WiFi
locations.
National Broadband Map
Provides functionality to:
• explore Oregon ISP’s,
• provide feedback to the program,
• run speed tests from a user’s location,

Links
• Oregon Broadband Map http://broadband.oregon.gov
• Project Website http://www.oregon.gov/broadband
• National Broadband Map http://www.broadbandmap.gov/
• National Telecommunications and Information Administration -
BroadbandUSAhttp://www.ntia.doc.gov/

Other related efforts…
• FirstNet (National Public Safety Broadband Network):
Implementation of 4G LTE network nation-wide for the provision of
interoperable communications (data and voice) for emergency
response
– New NTIA grant opportunity for all states
– Oregon to receive $2.2M for outreach and then data collection for
implementation
Other related efforts…(pt 2)
• NextGen 911: Implementation of map-enabled emergency response
and dispatch
– NENA Addressing Standard
– Interoperability with GIS datasets for locating emergencies and dispatching
responders
• Oregon Health Network: tele-health provision across Oregon
– Peer-to-peer connections for rural healthcare provider
– OHN Interactive Map (http://www.oregonhealthnet.org/content/ohn-interactive-
community-map)
• Smarter Balanced Assessment Consortium: dynamic testing
capability for common core standards in language arts/literacy and
mathematics
– Relies on broadband network for interactive student achievement testing
– Requires broadband connectivity across Oregon…