Embed Size (px)
Citation preview
Oregon Investment
Council April 29, 2015 - 9:00 AM
PERS Headquarters 11410 S.W. 68th Parkway
Tigard, OR 97223
Katy Durant Chair
John Skjervem Chief Investment Officer
Ted Wheeler State Treasurer
OREGON INVESTMENT COUNCIL
Agenda
April 29, 2015 9:00 AM
PERS Headquarters 11410 S.W. 68th Parkway
Tigard, OR 97223
Time A. Action Items Presenter Tab
9:00-9:05 1. Review & Approval of Minutes Katy Durant 1 March 4, 2015 Regular Meeting OIC Chair
Committee Reports John Skjervem Chief Investment Officer
9:05-9:35 2. Strategic Asset Allocation & Staffing Discussion John Skjervem 2
9:35-10:15 3. Blackstone Capital Partners VII, LP Sam Green 3 OPERF Private Equity Investment Officer
Tony James President & Chief Operating Officer, Blackstone
Mike Satirhos Senior Managing Director, Blackstone
David Fann TorreyCove Capital Partners
Tom Martin TorreyCove Capital Partners
10:15-10:30 -------------------- BREAK --------------------
B. Information Items
10:30-10:50 4. OPERF Policy Implementation Overlay Review Greg Norquist 4 Director, Overlay Strategies, Russell Investments
Philip Lee Portfolio Manager, Russell Investments
Katy Durant Rukaiyah Adams Keith Larson John Russell Ted Wheeler Steve Rodeman Chair Vice Chair Member Member State Treasurer PERS Director
OIC Meeting Agenda April 29, 2015
Page 2
10:50-11:00 5. Policy and Procedure Update John Skjervem 5 Kim Olson
Policy Analyst
11:00-11:20 6. Blackrock Solutions/Aladdin Update Byron Williams 6 OPERF Private Equity Chief Audit Executive
Shannon Smith Director of Aladdin Implementations, Blackrock
Anne Keys Senior Consultant, Cutter Associates
11:20-11:30 7. Asset Allocations & NAV Updates John Skjervem 7 a. Oregon Public Employees Retirement Fundb. SAIF Corporationc. Common School Fundd. HiEd Pooled Endowment Fund
8. Calendar — Future Agenda Items 8
9. Other Items Council Staff
Consultants
C. Public Comment Invited 15 Minutes
Katy Durant Rukaiyah Adams Keith Larson John Russell Ted Wheeler Steve Rodeman Chair Vice Chair Member Member State Treasurer PERS Director
JOHN D. SKJERVEM CHIEF INVESTMENT OFFICER INVESTMENT DIVISION
PHONE 503-378-4111 FAX 503-378-6772
STATE OF OREGON OFFICE OF THE STATE TREASURER
350 WINTER STREET NE, SUITE 100 SALEM, OREGON 97301-3896
OREGON INVESTMENT COUNCIL MARCH 4, 2015
MEETING MINUTES
Members Present: Rukaiyah Adams, Katy Durant, Keith Larson, Steve Rodeman, Dick Solomon, Ted Wheeler
Staff Present: Darren Bond, Tony Breault, Austin Carmichael, Karl Cheng, Michael Cox, Garrett Cudahey, Sam Green, Scott Harra, John Hershey, Julie Jackson, Perrin Lim, Tom Lofton, Ben Mahon, Mike Mueller, Kim Olson, Priyanka Shukla, John Skjervem, Michael Viteri, Byron Williams
Consultants Present: David Fann (TorreyCove); Allan Emkin and David Glickman (PCA); Janet Becker-Wold, Jim Callahan, Jason Ellement, Gene Podkaminer and Uvan Tseng (Callan)
Legal Counsel Present: Dee Carlson and Deena Bothello, Oregon Department of Justice
The March 4, 2015 OIC meeting was called to order at 9:00 am by Katy Durant, Vice-Chair.
I. 9:00 am Review and Approval of Minutes MOTION: Treasurer Wheeler moved approval of the February 4, 2015 meeting minutes. Mr. Larson seconded the motion, which then passed by a 5/0 vote.
COMMITTEE REPORTS John Skjervem, OST Chief Investment Officer gave an update on the following committee actions taken since the February 4, 2015 OIC meeting:
Private Equity Committee:
February 9, 2015 EnCap Energy Capital Fund X, L.P $150 million February 9, 2015 GGV Capital Select, L.P. $50 million February 9, 2015 RRJ Capital Master Fund III, L.P. $150 million
Alternatives Committee: NONE
Opportunity Portfolio Committee: February 20, 2015 TPG Specialty Lending Europe Fund I, L.P. $100 million
Real Estate Committee: NONE
OREGON INVESTMENT COUNCIL MARCH 4, 2015
MEETING MINUTES
Consistent with OST Policy 4.04.01, which requires a report on all staff-authorized investment activity, Mr. Skjervem concluded his committee remarks by noting a $17.4 million co-investment staff initiated alongside existing OPERF real estate manager Waterton Residential.
II. 9:03 am OIC Board Elections As described in OIC Policy 04.00.02, the Council is comprised of the State Treasurer and four members appointed by the Governor. The Director of the Public Employees Retirement System is also a Council member, but may not vote. Voting Council members biennially elect both a Chair and Vice Chair from among the four gubernatorial appointees. The Vice Chair functions as the Chair in the event the Chair resigns or is unable to fulfill the Chair’s duties.
MOTION: Treasurer Wheeler moved approval for Katy Durant to assume the role of Council Chair and for Rukaiyah Adams to assume the role of Council Vice Chair. Mr. Larson seconded the motion which then passed on a 5/0 vote.
III. 9:05 am OPERF Asset/Liability Study & Strategic Asset Allocation Recommendation Jim Callahan, Janet Becker-Wold, Jason Ellement, and Gene Podkaminer from Callan Associates presented an Asset/Liability Study & Strategic Asset Allocation Recommendation for OPERF. The Council discussed the merits of the recommendation as well as staff’s concerns regarding its current resource and capacity constraints. The Council directed staff to prepare an assessment of the Callan recommendation relative to the investment division’s current resource/capacity profile for further discussion at a proposed joint OIC/PERS meeting tentatively scheduled for March 30, 2015.
IV. 11:00 am HiED Endowment Review and Update Mike Mueller, Deputy Chief Investment Officer gave an update and review of the HiED Endowment Fund. Staff is seeking OIC approval for the following contingency:
Staff may revise and adjust the current HiED asset class policy targets and/or manager allocations such that any remaining OST/OIC managed accounts would conform to the following asset allocation:
Global Equities 70% Fixed Income 30%
MOTION: Mr. Solomon moved approval of the staff recommendation. Ms. Adams seconded the motion, which passed by a vote of 5/0.
V. 11:03 am Opportunity Portfolio Procedure Clarification John Hershey, Director of Alternative Investments described that the Policies and Procedures documents for OPERF’s Private Equity, Alternatives and Real Estate programs contain an “OST Staff Authority” section. In contrast, the Policies and Procedures document governing OPERF’s Opportunity Portfolio contains no such section, an omission staff recommends rectifying so that the Policies and Procedures document for the Opportunity Portfolio is consistent with the documents governing OPERF’s Private Equity, Alternatives and Real Estate programs.
Mr. Hershey indicated that staff would normally propose this policy change during the annual OPERF policies and procedures update exercise; however, staff is currently negotiating the sale of a small LP interest in the Opportunity Portfolio, a transaction that necessitates seeking Council approval for this change now.
Page 2

OREGON INVESTMENT COUNCIL MARCH 4, 2015
MEETING MINUTES
MOTION: Mr. Solomon moved approval of the staff recommendation. Mr. Larson seconded the motion, which then passed by a 5/0 vote.
VI. 11:04 am Real Estate Portfolio Policy Waiver Request Anthony Breault, Senior Investment Officer presented and described that staff is seeking OIC approval for a variance request regarding the Real Estate Committee’s $250 million commitment limitation to accommodate a first close commitment to Lone Star Real Estate Fund IV (LSREF IV). With such an approval, Staff will convene the Real Estate Committee in March in order to secure a full subscription commitment and preferred “first close” economic terms. Note this variance request applies only to the currently contemplated investment in LSREF IV.
MOTION: Mr. Solomon moved approval of the staff recommendation. Treasurer Wheeler seconded the motion which passed by a vote of 5/0.
VII. 11:05 am OPERF Q4 Performance & Risk Report Janet Becker-Wold from Callan Associates gave a fourth quarter OPERF investment performance update.
VIII. 11:20 am BlackRock Solutions Update Darren Bond, Deputy State Treasurer gave an update on the investment division’s BlackRock Solutions project as well as the status of the Investment Modernization Act.
IX. 11:30 am Asset Allocation & NAV Updates Mr. Skjervem reviewed asset allocations and NAVs across OST-managed accounts for the period ended January 31, 2015.
X. 11:30 am Calendar-Future Agenda Items Mr. Skjervem presented a revised schedule of future OIC meetings and associated agenda topics.
XI. 11:33 am Other Items None
11:34 am Public Comments Unite Here’s Elliott Mullen provided commentary from his organization in connection with recent developments at OPERF manager Lonestar. Evan Demma and Patrick Di Iorio, both servers at the Hotel Burnam in Chicago, then urged Council members to contact Lonestar regarding the firm’s Hotel Burnam ownership and unionization efforts underway by that hotel’s employees.
Ms. Durant adjourned the meeting at 11:45 am.
Respectfully submitted,
Julie Jackson Executive Support Specialist
Page 3

OREGON INVESTMENT COUNCIL REGULAR MEETING
WEDNESDAY, APRIL 29, 2015
TAB 02.01 OPERF Strategic Asset Allocation
(This will be a verbal presentation)
Blackstone Capital Partners VII, L.P.
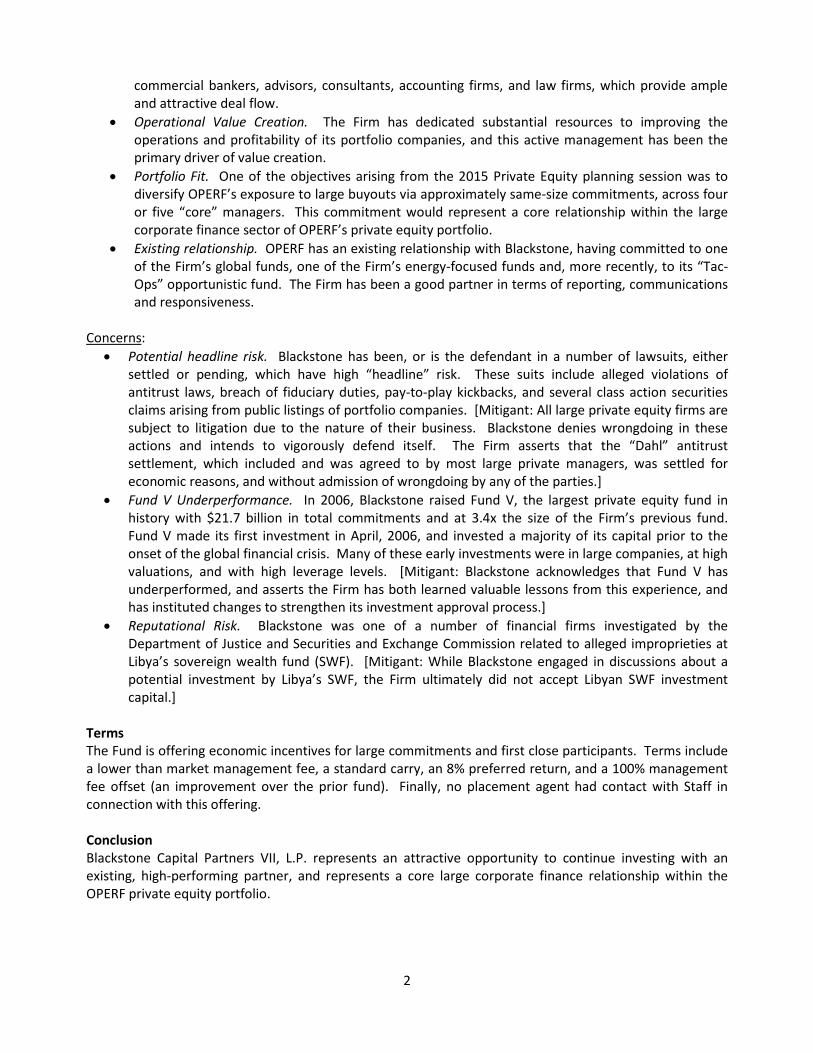
Purpose Subject to satisfactory negotiation of terms and conditions with Staff working in concert with Department of Justice personnel, Staff recommends an up to $500 million commitment to Blackstone Capital Partners VII, L.P. (the “Fund” or “Fund VII”) for the OPERF Private Equity Portfolio. This commitment would continue an existing OPERF relationship.
Background The Blackstone Group (“Blackstone” or the “Firm”) was founded in 1985, and has grown to be one of the largest private equity and asset management firms in the world, with over $290 billion in assets under management. Since inception, the Firm has grown to nearly 2,000 employees, including 137 at the Senior Managing Director (partner) level, with 24 offices around the world. Blackstone manages capital across five major themes, including private equity, credit strategies, real estate, hedge funds, and tactical opportunities. The firm also operates financial advisory businesses which serve corporate mergers and acquisitions, restructuring and reorganization, and fund placement clients. The Firm’s private equity group, which will invest and manage Fund VII, consists of 125 investment professionals, including 23 Senior Managing Directors. On behalf of OPERF, the OIC committed $200 million to a previous Blackstone global fund (Fund VI) in 2010, and another $200 million to Blackstone Energy Partners II, L.P. (BEP II) in 2014. Fund VII and BEP II are expected to share energy investments on a 60/40 basis.
Strategy With Fund VII, Blackstone is targeting $15 billion of commitments to continue its successful, control-oriented private equity strategy on a global basis. The Firm has not set a hard-cap for Fund VII, but the target is approximately the same size as Fund VI. In Fund VII, Blackstone intends to build a portfolio of 25-40 investments, diversified across geography and sectors. Typical equity investments will be $300 million to $800 million in companies with enterprise values of $500 million to $5 billion. The Firm will also seek to diversify investments across stage and size, and these investments are expected to include growth equity, development projects, buy-and-build, mid-cap buyout, and large buyout transactions. A central theme of Blackstone’s strategy is to improve their portfolio companies post-acquisition, and the Firm has built a robust infrastructure, which partners with company management, in achieving such improvements. In addition to Operating Partners and a Portfolio Operations Group, which many large private equity firms now employ, Blackstone can call on its financial advisory resources, capital markets group, and strategic advisors to assist company management teams. The Firm also established a group purchasing program in 2005 which is now producing portfolio company cost savings of approximately $600 million per year. In Blackstone’s fully realized investments, over 67 percent of value creation has been attributable to operating improvements and increased earnings, while less than a third came from paying down debt and valuation-multiple expansion.
Issues to Consider Attributes:
• Strong investment performance. Since 1988, six previous Blackstone Capital Partners funds haveinvested $43.4 billion in 183 investments. As of December 31, 2014, these investments had generated an aggregate net IRR of 16.4% and a net total value multiple of 1.7x. According to Cambridge Associates data as of September 30, 2014, of the 18 quartile rankings for these prior funds (IRR, TVM, and DPI), one ranks in the third quartile, seven in the second quartile, and ten in the first quartile.
• Deal Sourcing Capability. The Blackstone Group’s size, brand, and global reach generate a highvolume of potential deal flow. Through both its as asset management and financial advisory businesses, the Firm has cultivated a vast, global network of business leaders, investment and
commercial bankers, advisors, consultants, accounting firms, and law firms, which provide ample and attractive deal flow.
• Operational Value Creation. The Firm has dedicated substantial resources to improving the operations and profitability of its portfolio companies, and this active management has been the primary driver of value creation.
• Portfolio Fit. One of the objectives arising from the 2015 Private Equity planning session was to diversify OPERF’s exposure to large buyouts via approximately same-size commitments, across four or five “core” managers. This commitment would represent a core relationship within the large corporate finance sector of OPERF’s private equity portfolio.
• Existing relationship. OPERF has an existing relationship with Blackstone, having committed to one of the Firm’s global funds, one of the Firm’s energy-focused funds and, more recently, to its “Tac-Ops” opportunistic fund. The Firm has been a good partner in terms of reporting, communications and responsiveness.
Concerns:
• Potential headline risk. Blackstone has been, or is the defendant in a number of lawsuits, either settled or pending, which have high “headline” risk. These suits include alleged violations of antitrust laws, breach of fiduciary duties, pay-to-play kickbacks, and several class action securities claims arising from public listings of portfolio companies. [Mitigant: All large private equity firms are subject to litigation due to the nature of their business. Blackstone denies wrongdoing in these actions and intends to vigorously defend itself. The Firm asserts that the “Dahl” antitrust settlement, which included and was agreed to by most large private managers, was settled for economic reasons, and without admission of wrongdoing by any of the parties.]
• Fund V Underperformance. In 2006, Blackstone raised Fund V, the largest private equity fund in history with $21.7 billion in total commitments and at 3.4x the size of the Firm’s previous fund. Fund V made its first investment in April, 2006, and invested a majority of its capital prior to the onset of the global financial crisis. Many of these early investments were in large companies, at high valuations, and with high leverage levels. [Mitigant: Blackstone acknowledges that Fund V has underperformed, and asserts the Firm has both learned valuable lessons from this experience, and has instituted changes to strengthen its investment approval process.]
• Reputational Risk. Blackstone was one of a number of financial firms investigated by the Department of Justice and Securities and Exchange Commission related to alleged improprieties at Libya’s sovereign wealth fund (SWF). [Mitigant: While Blackstone engaged in discussions about a potential investment by Libya’s SWF, the Firm ultimately did not accept Libyan SWF investment capital.]
Terms The Fund is offering economic incentives for large commitments and first close participants. Terms include a lower than market management fee, a standard carry, an 8% preferred return, and a 100% management fee offset (an improvement over the prior fund). Finally, no placement agent had contact with Staff in connection with this offering. Conclusion Blackstone Capital Partners VII, L.P. represents an attractive opportunity to continue investing with an existing, high-performing partner, and represents a core large corporate finance relationship within the OPERF private equity portfolio.
2
MEMORANDUM
TO: Oregon Public Employees Retirement Fund (“OPERF”)
FROM: TorreyCove Capital Partners (“TorreyCove”)
DATE: April 14, 2015
RE: Blackstone Capital Partners VII, L.P. (the “Fund”)
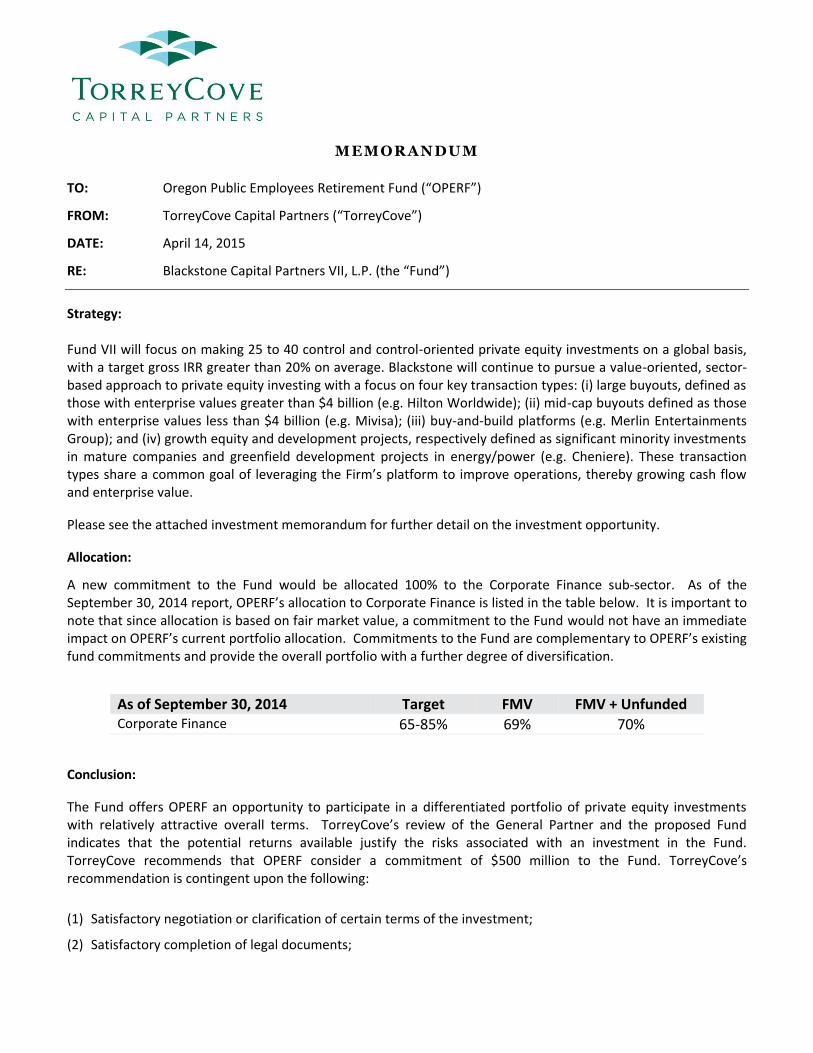
Strategy:
Fund VII will focus on making 25 to 40 control and control-oriented private equity investments on a global basis, with a target gross IRR greater than 20% on average. Blackstone will continue to pursue a value-oriented, sector-based approach to private equity investing with a focus on four key transaction types: (i) large buyouts, defined as those with enterprise values greater than $4 billion (e.g. Hilton Worldwide); (ii) mid-cap buyouts defined as those with enterprise values less than $4 billion (e.g. Mivisa); (iii) buy-and-build platforms (e.g. Merlin Entertainments Group); and (iv) growth equity and development projects, respectively defined as significant minority investments in mature companies and greenfield development projects in energy/power (e.g. Cheniere). These transaction types share a common goal of leveraging the Firm’s platform to improve operations, thereby growing cash flow and enterprise value.
Please see the attached investment memorandum for further detail on the investment opportunity.
Allocation:
A new commitment to the Fund would be allocated 100% to the Corporate Finance sub-sector. As of the September 30, 2014 report, OPERF’s allocation to Corporate Finance is listed in the table below. It is important to note that since allocation is based on fair market value, a commitment to the Fund would not have an immediate impact on OPERF’s current portfolio allocation. Commitments to the Fund are complementary to OPERF’s existing fund commitments and provide the overall portfolio with a further degree of diversification.
As of September 30, 2014 Target FMV FMV + Unfunded Corporate Finance 65-85% 69% 70%
Conclusion:
The Fund offers OPERF an opportunity to participate in a differentiated portfolio of private equity investments with relatively attractive overall terms. TorreyCove’s review of the General Partner and the proposed Fund indicates that the potential returns available justify the risks associated with an investment in the Fund. TorreyCove recommends that OPERF consider a commitment of $500 million to the Fund. TorreyCove’s recommendation is contingent upon the following:
(1) Satisfactory negotiation or clarification of certain terms of the investment;
(2) Satisfactory completion of legal documents;

(3) Satisfactory continuation and finalization of due diligence;
(4) No material changes to the investment opportunity as presented; and
(5) Confidentiality maintained regarding the commitment of OPERF to the Partnership until such time as all the preceding conditions are met.

April 2015
Blackstone Capital Partners Private Equity Overview
Prepared at the Request and for the Exclusive Use of Oregon Investment Council

BCP Overview
Blackstone 2
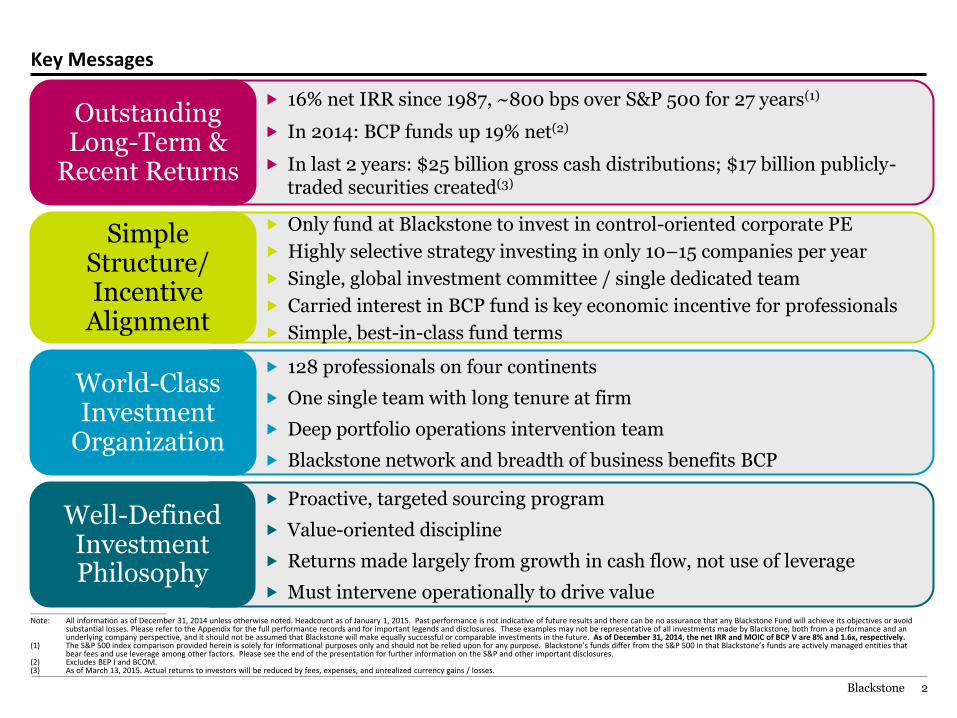
Key Messages
128 professionals on four continents
One single team with long tenure at firm
Deep portfolio operations intervention team
Blackstone network and breadth of business benefits BCP
16% net IRR since 1987, ~800 bps over S&P 500 for 27 years(1)
In 2014: BCP funds up 19% net(2)
In last 2 years: $25 billion gross cash distributions; $17 billion publicly-traded securities created(3)
Outstanding Long-Term &
Recent Returns
Only fund at Blackstone to invest in control-oriented corporate PE
Highly selective strategy investing in only 10–15 companies per year
Single, global investment committee / single dedicated team
Carried interest in BCP fund is key economic incentive for professionals
Simple, best-in-class fund terms
Simple Structure/ Incentive
Alignment
World-Class Investment
Organization
Proactive, targeted sourcing program
Value-oriented discipline
Returns made largely from growth in cash flow, not use of leverage
Must intervene operationally to drive value
Well-Defined Investment Philosophy
________________________________________________
Note: All information as of December 31, 2014 unless otherwise noted. Headcount as of January 1, 2015. Past performance is not indicative of future results and there can be no assurance that any Blackstone Fund will achieve its objectives or avoid substantial losses. Please refer to the Appendix for the full performance records and for important legends and disclosures. These examples may not be representative of all investments made by Blackstone, both from a performance and an underlying company perspective, and it should not be assumed that Blackstone will make equally successful or comparable investments in the future. As of December 31, 2014, the net IRR and MOIC of BCP V are 8% and 1.6x, respectively.
(1) The S&P 500 index comparison provided herein is solely for informational purposes only and should not be relied upon for any purpose. Blackstone’s funds differ from the S&P 500 in that Blackstone’s funds are actively managed entities that bear fees and use leverage among other factors. Please see the end of the presentation for further information on the S&P and other important disclosures.
(2) Excludes BEP I and BCOM. (3) As of March 13, 2015. Actual returns to investors will be reduced by fees, expenses, and unrealized currency gains / losses.
Blackstone 3
($ in millions)
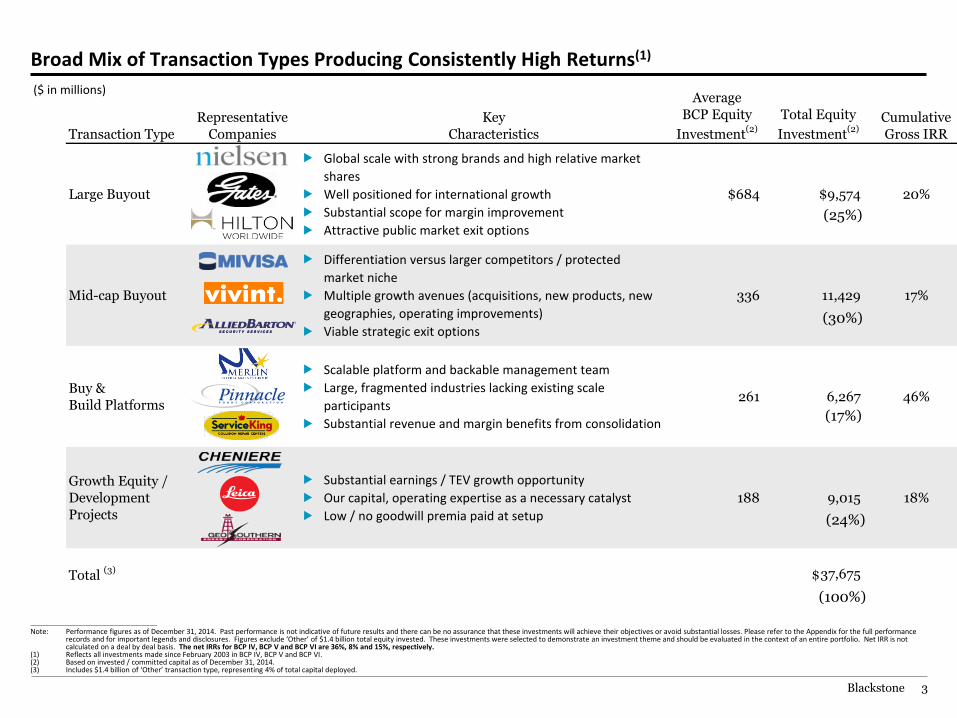
Broad Mix of Transaction Types Producing Consistently High Returns(1)
________________________________________________
Note: Performance figures as of December 31, 2014. Past performance is not indicative of future results and there can be no assurance that these investments will achieve their objectives or avoid substantial losses. Please refer to the Appendix for the full performance records and for important legends and disclosures. Figures exclude ‘Other’ of $1.4 billion total equity invested. These investments were selected to demonstrate an investment theme and should be evaluated in the context of an entire portfolio. Net IRR is not calculated on a deal by deal basis. The net IRRs for BCP IV, BCP V and BCP VI are 36%, 8% and 15%, respectively.
(1) Reflects all investments made since February 2003 in BCP IV, BCP V and BCP VI. (2) Based on invested / committed capital as of December 31, 2014. (3) Includes $1.4 billion of ‘Other’ transaction type, representing 4% of total capital deployed.
Transaction Type
Representative
Companies
Key
Characteristics
Average
BCP Equity
Investment(2)
Total Equity
Investment(2)
Cumulative
Gross IRR
Large Buyout
Global scale with strong brands and high relative market
shares
Well positioned for international growth
Substantial scope for margin improvement
Attractive public market exit options
$684 $9,574 20%
Mid-cap Buyout
Differentiation versus larger competitors / protected
market niche
Multiple growth avenues (acquisitions, new products, new
geographies, operating improvements)
Viable strategic exit options
336 11,429 17%
Buy &
Build Platforms
Scalable platform and backable management team
Large, fragmented industries lacking existing scale
participants
Substantial revenue and margin benefits from consolidation
261 6,267 46%
Growth Equity /
Development
Projects
Substantial earnings / TEV growth opportunity
Our capital, operating expertise as a necessary catalyst
Low / no goodwill premia paid at setup
188 9,015 18%
Total (3) 37,675
(25%)
(17%)
(100%)
(30%)
(24%)
$
4
184 0 92 102 0 70 0 152 195 99 206 202 201 221 3 0 103 120
Blackstone
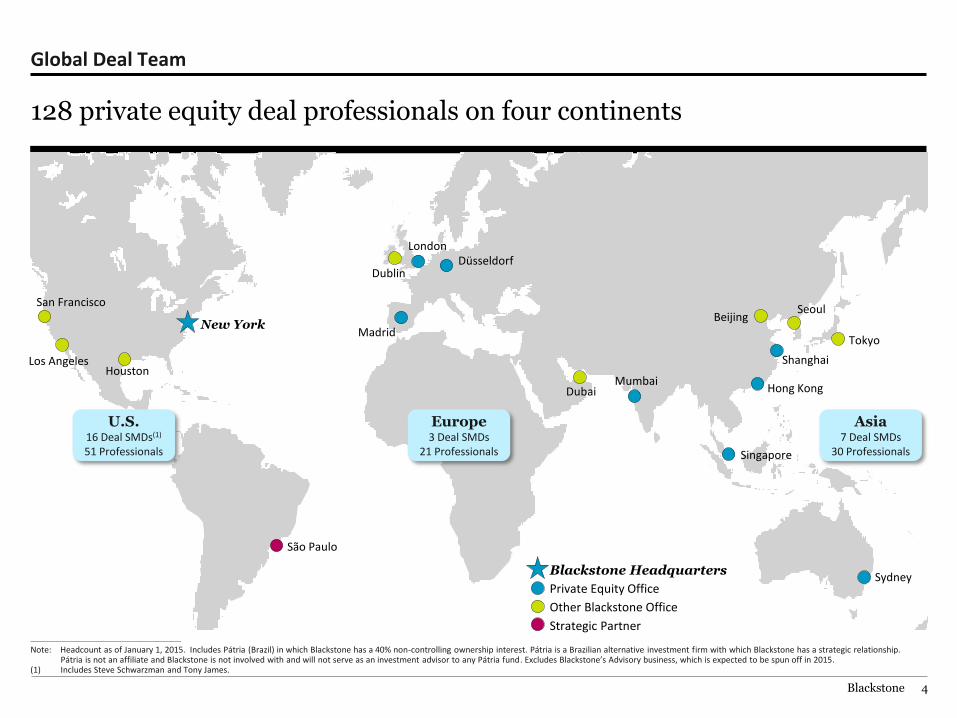
Global Deal Team
128 private equity deal professionals on four continents
Europe 3 Deal SMDs
21 Professionals
Asia 7 Deal SMDs
30 Professionals
U.S. 16 Deal SMDs(1)
51 Professionals
Sydney
Mumbai
Singapore
Seoul
Tokyo
Beijing
Hong Kong
Shanghai
São Paulo
Los Angeles
San Francisco
Houston
New York
Dublin Düsseldorf
Dubai
Madrid
London
Blackstone Headquarters
Private Equity Office
Other Blackstone Office
Strategic Partner ________________________________________________
Note: Headcount as of January 1, 2015. Includes Pátria (Brazil) in which Blackstone has a 40% non-controlling ownership interest. Pátria is a Brazilian alternative investment firm with which Blackstone has a strategic relationship. Pátria is not an affiliate and Blackstone is not involved with and will not serve as an investment advisor to any Pátria fund. Excludes Blackstone’s Advisory business, which is expected to be spun off in 2015.
(1) Includes Steve Schwarzman and Tony James.
Blackstone 5
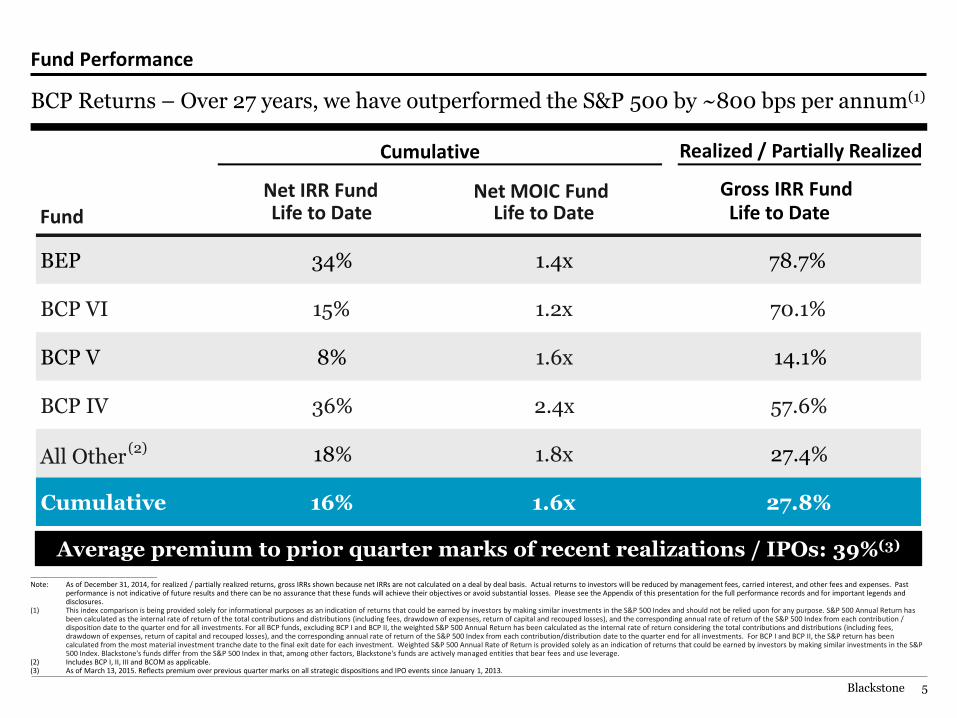
Fund Performance
BCP Returns – Over 27 years, we have outperformed the S&P 500 by ~800 bps per annum(1)
________________________________________________
Note: As of December 31, 2014, for realized / partially realized returns, gross IRRs shown because net IRRs are not calculated on a deal by deal basis. Actual returns to investors will be reduced by management fees, carried interest, and other fees and expenses. Past performance is not indicative of future results and there can be no assurance that these funds will achieve their objectives or avoid substantial losses. Please see the Appendix of this presentation for the full performance records and for important legends and disclosures.
(1) This index comparison is being provided solely for informational purposes as an indication of returns that could be earned by investors by making similar investments in the S&P 500 Index and should not be relied upon for any purpose. S&P 500 Annual Return has been calculated as the internal rate of return of the total contributions and distributions (including fees, drawdown of expenses, return of capital and recouped losses), and the corresponding annual rate of return of the S&P 500 Index from each contribution / disposition date to the quarter end for all investments. For all BCP funds, excluding BCP I and BCP II, the weighted S&P 500 Annual Return has been calculated as the internal rate of return considering the total contributions and distributions (including fees, drawdown of expenses, return of capital and recouped losses), and the corresponding annual rate of return of the S&P 500 Index from each contribution/distribution date to the quarter end for all investments. For BCP I and BCP II, the S&P return has been calculated from the most material investment tranche date to the final exit date for each investment. Weighted S&P 500 Annual Rate of Return is provided solely as an indication of returns that could be earned by investors by making similar investments in the S&P 500 Index. Blackstone's funds differ from the S&P 500 Index in that, among other factors, Blackstone's funds are actively managed entities that bear fees and use leverage.
(2) Includes BCP I, II, III and BCOM as applicable. (3) As of March 13, 2015. Reflects premium over previous quarter marks on all strategic dispositions and IPO events since January 1, 2013.
Average premium to prior quarter marks of recent realizations / IPOs: 39%(3)
Net IRR Fund Life to Date
Net MOIC Fund Life to Date
Gross IRR Fund Life to Date
BEP 34% 1.4x 78.7%
BCP VI 15% 1.2x 70.1%
BCP V 8% 1.6x 14.1%
BCP IV 36% 2.4x 57.6%
All Other (2) 18% 1.8x 27.4%
Cumulative 16% 1.6x 27.8%
Fund
Realized / Partially Realized Cumulative
Blackstone 6
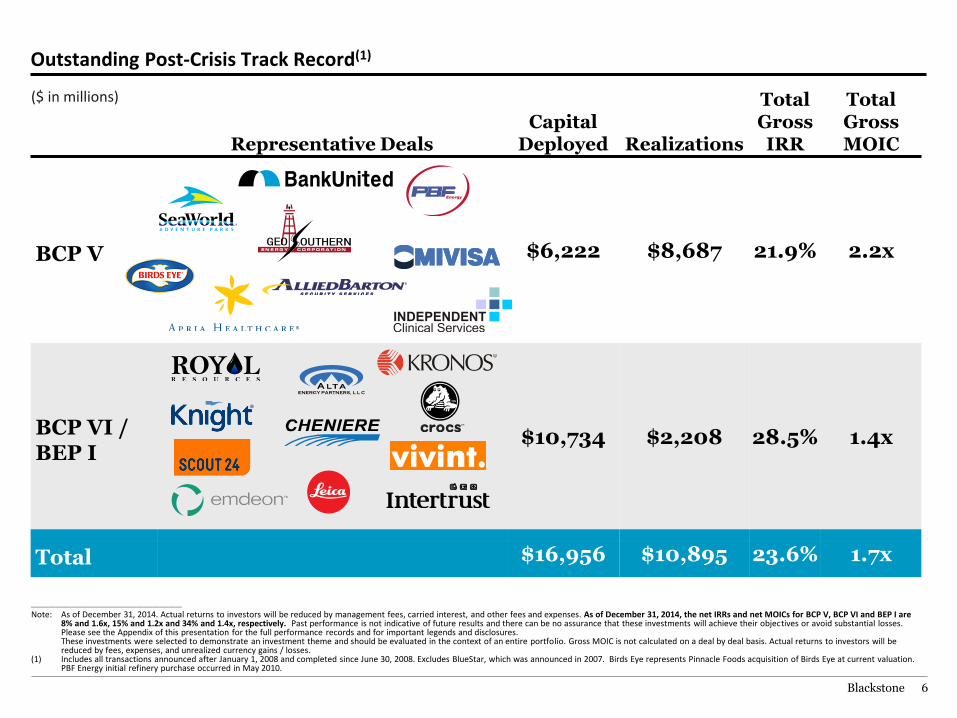
Outstanding Post-Crisis Track Record(1)
Representative Deals
Capital Deployed Realizations
Total Gross IRR
Total Gross MOIC
BCP V $6,222 $8,687 21.9% 2.2x
BCP VI / BEP I
$10,734 $2,208 28.5% 1.4x
Total $16,956 $10,895 23.6% 1.7x
________________________________________________
Note: As of December 31, 2014. Actual returns to investors will be reduced by management fees, carried interest, and other fees and expenses. As of December 31, 2014, the net IRRs and net MOICs for BCP V, BCP VI and BEP I are 8% and 1.6x, 15% and 1.2x and 34% and 1.4x, respectively. Past performance is not indicative of future results and there can be no assurance that these investments will achieve their objectives or avoid substantial losses. Please see the Appendix of this presentation for the full performance records and for important legends and disclosures. These investments were selected to demonstrate an investment theme and should be evaluated in the context of an entire portfolio. Gross MOIC is not calculated on a deal by deal basis. Actual returns to investors will be reduced by fees, expenses, and unrealized currency gains / losses.
(1) Includes all transactions announced after January 1, 2008 and completed since June 30, 2008. Excludes BlueStar, which was announced in 2007. Birds Eye represents Pinnacle Foods acquisition of Birds Eye at current valuation. PBF Energy initial refinery purchase occurred in May 2010.
($ in millions)
Blackstone 7
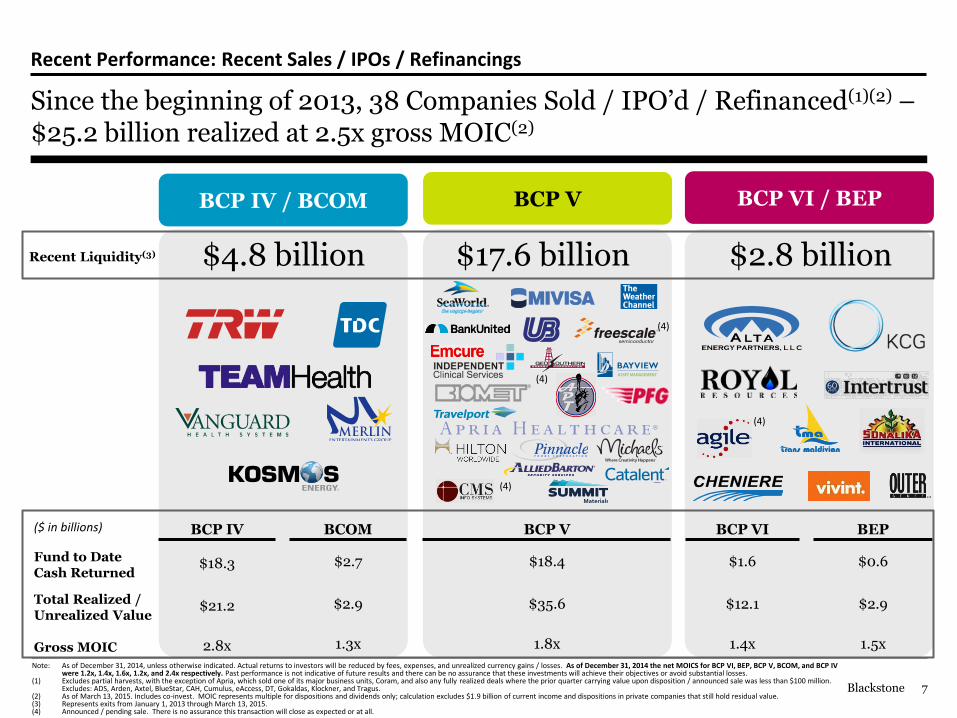
Recent Performance: Recent Sales / IPOs / Refinancings
Since the beginning of 2013, 38 Companies Sold / IPO’d / Refinanced(1)(2) – $25.2 billion realized at 2.5x gross MOIC(2)
Note: As of December 31, 2014, unless otherwise indicated. Actual returns to investors will be reduced by fees, expenses, and unrealized currency gains / losses. As of December 31, 2014 the net MOICS for BCP VI, BEP, BCP V, BCOM, and BCP IV were 1.2x, 1.4x, 1.6x, 1.2x, and 2.4x respectively. Past performance is not indicative of future results and there can be no assurance that these investments will achieve their objectives or avoid substantial losses.
(1) Excludes partial harvests, with the exception of Apria, which sold one of its major business units, Coram, and also any fully realized deals where the prior quarter carrying value upon disposition / announced sale was less than $100 million. Excludes: ADS, Arden, Axtel, BlueStar, CAH, Cumulus, eAccess, DT, Gokaldas, Klockner, and Tragus.
(2) As of March 13, 2015. Includes co-invest. MOIC represents multiple for dispositions and dividends only; calculation excludes $1.9 billion of current income and dispositions in private companies that still hold residual value. (3) Represents exits from January 1, 2013 through March 13, 2015. (4) Announced / pending sale. There is no assurance this transaction will close as expected or at all.
BCP IV / BCOM BCP V BCP VI / BEP
$4.8 billion $17.6 billion $2.8 billion
(4)
(4)
(4)
(4)
Recent Liquidity(3)
($ in billions) BCP IV BCOM BCP V BCP VI BEP
Fund to Date Cash Returned
$18.3 $2.7 $18.4 $1.6 $0.6
Total Realized / Unrealized Value
$21.2 $2.9 $35.6 $12.1 $2.9
Gross MOIC 2.8x 1.3x 1.8x 1.4x 1.5x

How We Generate Returns
Blackstone 9
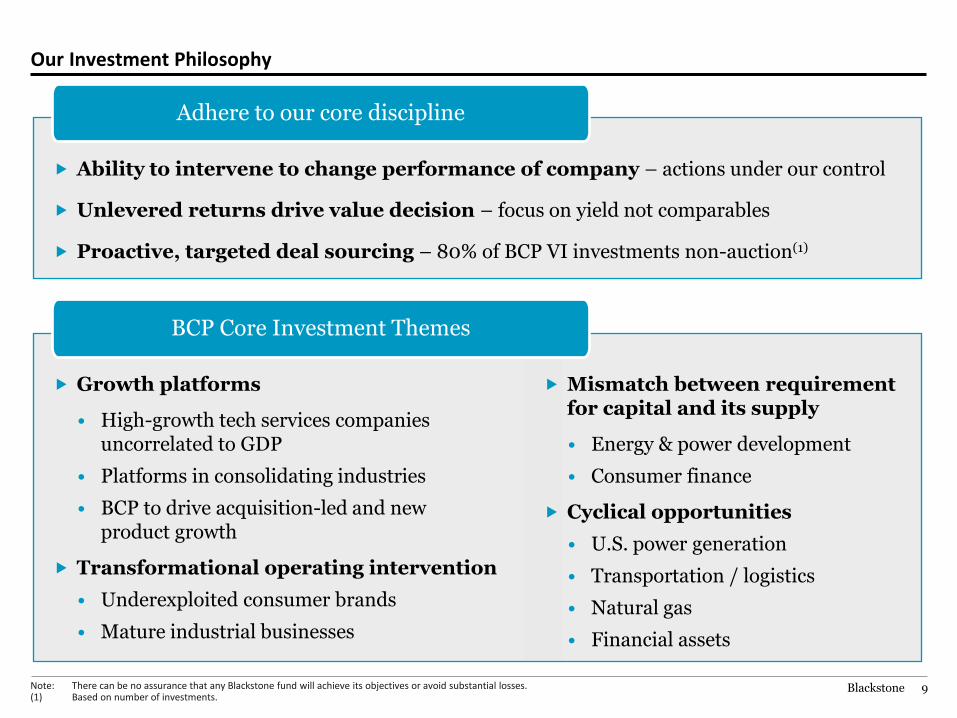
Our Investment Philosophy
Ability to intervene to change performance of company – actions under our control
Unlevered returns drive value decision – focus on yield not comparables
Proactive, targeted deal sourcing – 80% of BCP VI investments non-auction(1)
Adhere to our core discipline
Growth platforms
• High-growth tech services companies uncorrelated to GDP
• Platforms in consolidating industries
• BCP to drive acquisition-led and new product growth
Transformational operating intervention
• Underexploited consumer brands
• Mature industrial businesses
Mismatch between requirement for capital and its supply
• Energy & power development
• Consumer finance
Cyclical opportunities
• U.S. power generation
• Transportation / logistics
• Natural gas
• Financial assets
BCP Core Investment Themes
Note: There can be no assurance that any Blackstone fund will achieve its objectives or avoid substantial losses. (1) Based on number of investments.
Blackstone 10
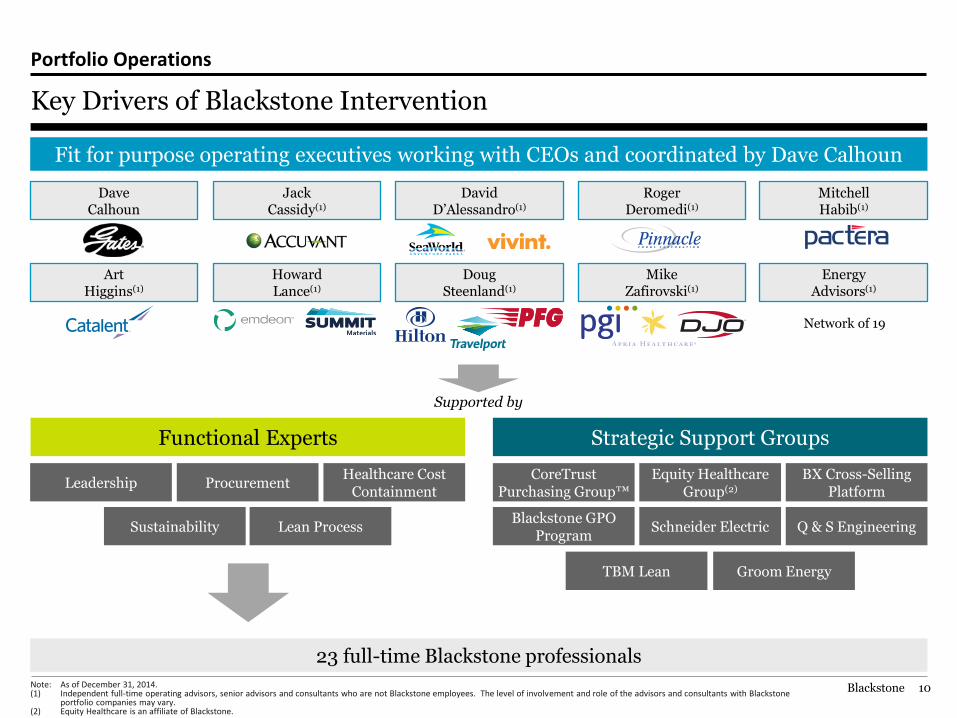
Portfolio Operations
Key Drivers of Blackstone Intervention
Note: As of December 31, 2014. (1) Independent full-time operating advisors, senior advisors and consultants who are not Blackstone employees. The level of involvement and role of the advisors and consultants with Blackstone
portfolio companies may vary. (2) Equity Healthcare is an affiliate of Blackstone.
Fit for purpose operating executives working with CEOs and coordinated by Dave Calhoun
Functional Experts
23 full-time Blackstone professionals
Dave Calhoun
Energy Advisors(1)
Howard Lance(1)
Art Higgins(1)
Mike Zafirovski(1)
David D’Alessandro(1)
Roger Deromedi(1)
Leadership Procurement Healthcare Cost
Containment
Lean Process Sustainability
Supported by
Doug Steenland(1)
Mitchell Habib(1)
Jack Cassidy(1)
Network of 19
Strategic Support Groups
CoreTrust Purchasing Group™
Equity Healthcare Group(2)
BX Cross-Selling Platform
Blackstone GPO Program
Schneider Electric Q & S Engineering
TBM Lean Groom Energy
184 0 92 102 0 70 0 152 195 99 206 202 201 221 3 0 103 120 0 115 99 0 171 146 184 0 92 102 0 70 0 152 195 99 206 202 201 221 3 0 103 120 0 115 99 0 171 146
Blackstone 11
2.5% 2.5% 1.6%
8.7%
5.2%
6.6%
11.2%
14.3%
10.8%10.4%
3Q '13YoY
4Q '13YoY
1Q '14YoY
2Q '14YoY
3Q '14YoY
How We Generate Returns
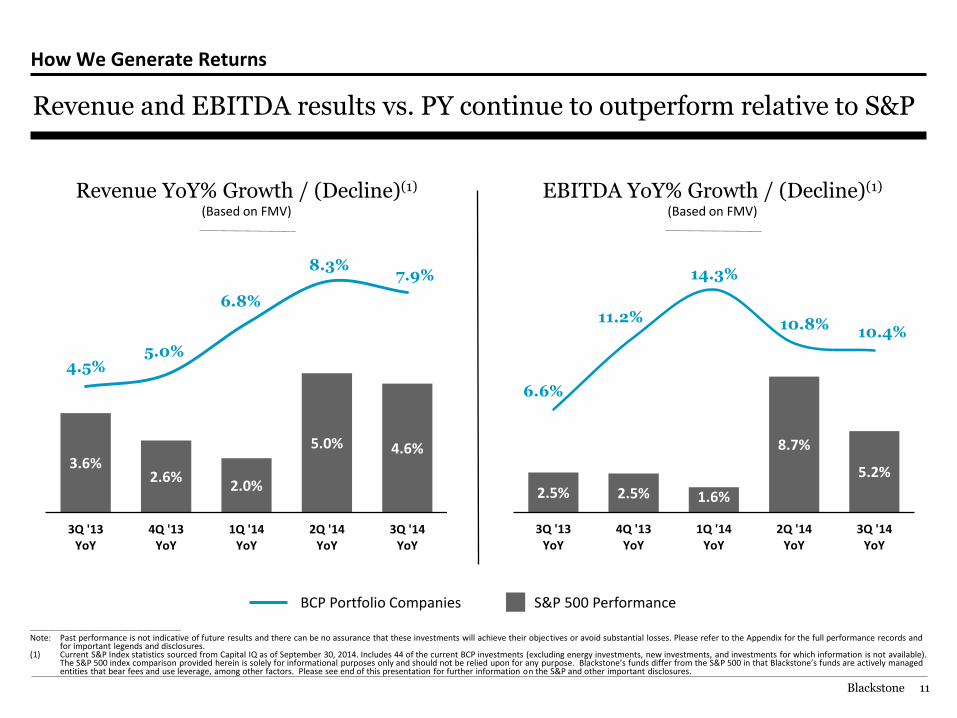
Revenue and EBITDA results vs. PY continue to outperform relative to S&P
Revenue YoY% Growth / (Decline)(1) (Based on FMV)
________________________________________________
Note: Past performance is not indicative of future results and there can be no assurance that these investments will achieve their objectives or avoid substantial losses. Please refer to the Appendix for the full performance records and for important legends and disclosures.
(1) Current S&P Index statistics sourced from Capital IQ as of September 30, 2014. Includes 44 of the current BCP investments (excluding energy investments, new investments, and investments for which information is not available). The S&P 500 index comparison provided herein is solely for informational purposes only and should not be relied upon for any purpose. Blackstone’s funds differ from the S&P 500 in that Blackstone’s funds are actively managed entities that bear fees and use leverage, among other factors. Please see end of this presentation for further information on the S&P and other important disclosures.
EBITDA YoY% Growth / (Decline)(1) (Based on FMV)
BCP Portfolio Companies S&P 500 Performance
3.6%2.6%
2.0%
5.0% 4.6%
4.5%5.0%
6.8%
8.3%7.9%
3Q '13YoY
4Q '13YoY
1Q '14YoY
2Q '14YoY
3Q '14YoY

Conclusion
Blackstone 13
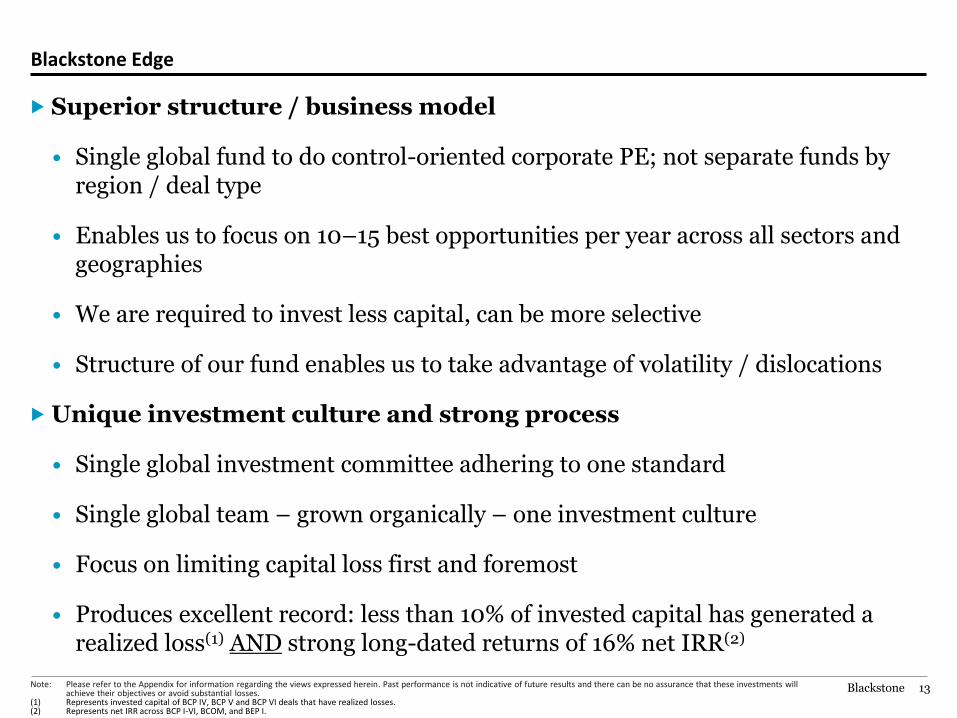
Blackstone Edge
Superior structure / business model
• Single global fund to do control-oriented corporate PE; not separate funds by region / deal type
• Enables us to focus on 10–15 best opportunities per year across all sectors and geographies
• We are required to invest less capital, can be more selective
• Structure of our fund enables us to take advantage of volatility / dislocations
Unique investment culture and strong process
• Single global investment committee adhering to one standard
• Single global team – grown organically – one investment culture
• Focus on limiting capital loss first and foremost
• Produces excellent record: less than 10% of invested capital has generated a realized loss(1) AND strong long-dated returns of 16% net IRR(2)
Note: Please refer to the Appendix for information regarding the views expressed herein. Past performance is not indicative of future results and there can be no assurance that these investments will achieve their objectives or avoid substantial losses.
(1) Represents invested capital of BCP IV, BCP V and BCP VI deals that have realized losses. (2) Represents net IRR across BCP I-VI, BCOM, and BEP I.
Blackstone 14
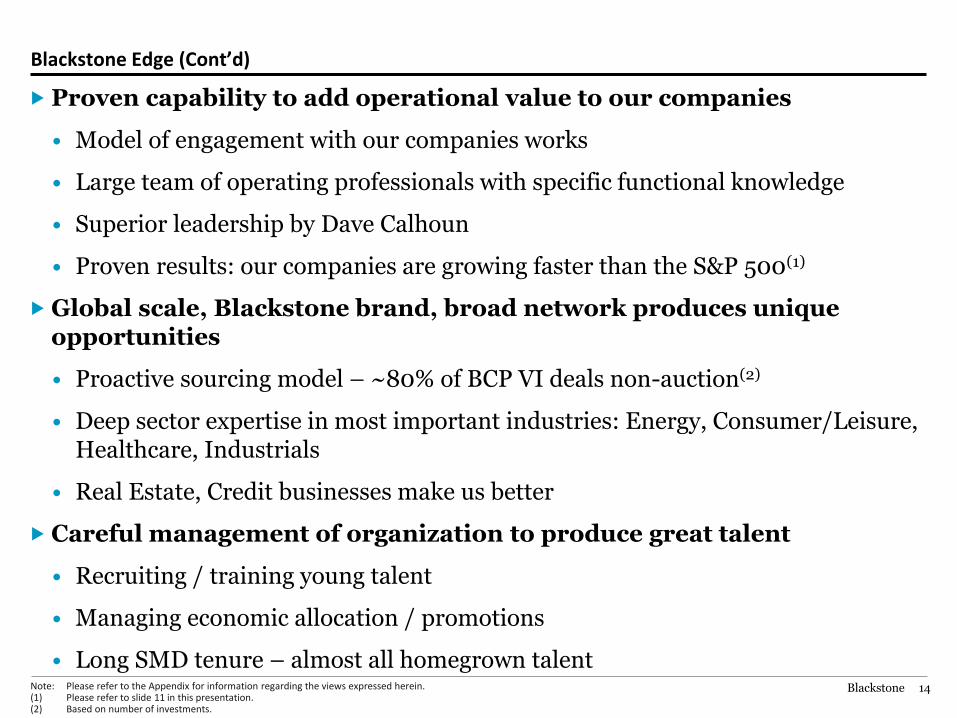
Blackstone Edge (Cont’d)
Proven capability to add operational value to our companies
• Model of engagement with our companies works
• Large team of operating professionals with specific functional knowledge
• Superior leadership by Dave Calhoun
• Proven results: our companies are growing faster than the S&P 500(1)
Global scale, Blackstone brand, broad network produces unique opportunities
• Proactive sourcing model – ~80% of BCP VI deals non-auction(2)
• Deep sector expertise in most important industries: Energy, Consumer/Leisure, Healthcare, Industrials
• Real Estate, Credit businesses make us better
Careful management of organization to produce great talent
• Recruiting / training young talent
• Managing economic allocation / promotions
• Long SMD tenure – almost all homegrown talent
Note: Please refer to the Appendix for information regarding the views expressed herein. (1) Please refer to slide 11 in this presentation. (2) Based on number of investments.

Appendix
Blackstone 16
184 0 92 102 0 70 0 152 195 99 206 202 201 221 3 0 103 120
Important Disclosures
Past performance is not necessarily indicative of future results. Unless otherwise indicated, all internal rates of return are presented on a “gross” basis (i.e., they do not reflect reductions for the management fees, organizational expenses, the general partner’s carried interest, and other expenses and taxes to be borne by investors, which in the aggregate are expected to be substantial, and do not take into account potential defaults on unrealized investments). Actual realized value of currently unrealized investments will depend on, among other factors, future operating results, the value of the assets and market conditions at the time of disposition, holding periods, any related transaction costs and the timing and manner of sale, all of which may differ from the assumptions and circumstances on which the current unrealized valuations are based. Accordingly, the actual realized values of unrealized investments may differ materially from the values indicated herein. Net Annual Rate of Return represents the IRR after management fees, drawdowns for organizational expenses and partnership expenses, taxes and other amounts withheld from distributions, and the General Partner’s allocation of profits but does not include taxes or withholdings specific to certain limited partners. Further information is available upon request.
Prospective investors should be aware that an investment in a Fund involves a high degree of risk. The following is a summary of only certain considerations and is qualified in its entirety by the more detailed “Risk Factors and Potential Conflicts of Interest” set forth in the applicable Offering Memorandum. Capitalized terms used below have the meanings set forth in the applicable Offering Memorandum, which must be read carefully prior to investing in the Fund.
No Assurance of Investment Return. There can be no assurance that the Fund’s objectives will be achieved or that a Limited Partner will receive any distribution from the Fund. An investment should only be considered by persons who can afford a loss of their entire investment. Past activities of investment entities sponsored by Blackstone provide no assurance of future results.
Leveraged Investments. Certain assets in which the Fund will invest are expected to employ significant leverage. The leveraged capital structure of such assets will increase their exposure to certain factors such as rising interest rates, downturns in the economy, or deterioration in the financial condition of such assets or industry. In the event an asset cannot generate adequate cash flow to meet its debt service, the Fund will suffer a partial or total loss of capital invested in the asset, which would adversely affect the returns of the Fund.
No Market for Limited Partnership Interests and Restrictions on Transfer. Interests in the Fund have not been registered under the securities laws of any jurisdiction, and, therefore, cannot be sold unless they are subsequently registered under applicable securities laws or an exemption from registration is available. There is no public market for Interests in the Fund and one is not expected to develop. A Limited Partner will generally not be permitted to assign, sell, exchange, or transfer its Interest in the Fund without the consent of the General Partner (which consent may not be unreasonably withheld).
Failure to Make Payments. In the case of a private equity fund, if a Limited Partner fails to pay when due installments of its capital commitment or its portion of Management Fees, Organizational Expenses or other obligations to the Fund, such Limited Partner will be subject to various remedies including, without limitation, preclusion from further investment in the Fund, reductions in its capital or loan account balance, and a forced sale of its Interest in the Fund.
Highly Competitive Market for Investment Opportunities. The activity of identifying, completing and realizing attractive investments is highly competitive and involves a high degree of uncertainty. There can be no assurance that the Fund will be able to locate, consummate and exit investments that satisfy the Fund’s rate of return objectives or realize upon their values or that it will be able to invest fully its committed capital.
Reliance on the General Partner and the Investment Advisor. The success of the Fund will depend in part upon the skill and expertise of the professionals of the Fund’s investment advisor and General Partner. The interests of these professionals in the General Partner and the Investment Advisor should tend to discourage them from withdrawing from participation in the Fund’s investment activities. However, there can be no assurance that such professionals will continue to be associated with the Investment Advisor or General Partner throughout the life of the Fund.
In calculating IRRs, the amount of capital that was invested via fund- or deal-level leverage secured by the commitments of the fund is only reflected in the calculations to the extent capital contributions were made by the partners of the fund to repay such leverage. In the case of Gross IRRs, such repayments by the partners are treated as outflows on the date of the initial investment; in the case of the Net IRR, such amounts are treated as outflows only on the dates of the actual capital contributions. As a result, the Net IRR as shown herein may be higher than it otherwise would be if these temporary timing differences in the recognition of the repayment of leverage did not exist and may, in certain cases, result in the Net IRR exceeding the Gross IRR even though Net IRR reflects reduction for management fees, carried interest, taxes and other fees and expenses as fully described in the fund’s PPM.
Blackstone 17
184 0 92 102 0 70 0 152 195 99 206 202 201 221 3 0 103 120
Important Disclosures
Any target or similar returns set forth herein are based on Blackstone’s belief about the returns that may be achievable on investments that the Partnership intends to pursue. Such returns are based on the General Partner’s current view in relation to future events and financial performance of potential investments and various models, estimations and “base case” assumptions made by the General Partner, including estimations and assumptions about events that have not occurred. Among the assumptions to be made by the General Partner in performing its analysis are (i) the amount and frequency of current income from an investment, (ii) the holding period length, (iii) EBITDA growth and cost savings over time, (iv) the manner and timing of sale, (v) exit multiples reflecting long-term averages for the relevant asset type, (vi) customer growth and other business initiatives, (vii) availability of financing, (viii) potential investment opportunities Blackstone is currently or has recently reviewed and (ix) overall macroeconomic conditions such as GDP growth, unemployment and interest rate levels. While such “base case” assumptions are based on assumptions that General Partner believes are reasonable under the circumstances, they are subject to uncertainties, and changes. Any such modification could be adverse to the actual overall returns. Actual events and conditions may differ materially from the assumptions used to establish returns and there is no guarantee that the assumptions will be applicable to the Partnership’s investments. None of Blackstone, its affiliates or any of the respective directors, officers, employees, partners, shareholders, advisers and agents of any of the foregoing makes any assurance, representation or warranty as to the accuracy of such assumptions.
Potential Conflicts of Interest. There may be occasions when the General Partner, the Investment Advisor, and their affiliates will encounter potential conflicts of interest in connection with the Fund’s activities including, without limitation, the allocation of investment opportunities, relationships with Blackstone’s investment banking and advisory clients, and the diverse interests of the Fund’s limited partner group.
Material, Non-Public Information. By reason of their responsibilities in connection with other activities of Blackstone, certain employees of the General Partner, the Advisor and their respective affiliates may acquire confidential or material non-public information or be restricted from initiating transactions in certain securities. The Fund will not be free to act upon any such information. Due to these restrictions, the Fund may not be able to initiate a transaction that it otherwise might have initiated and may not be able to sell an Investment that it otherwise might have sold.
This presentation and any related documents are for informational purposes only and do not constitute an offer to sell, or a solicitation of an offer to buy, any security or instrument in or to participate in any trading strategy with any Blackstone Fund. If such offer is made, it will only be made by means of an offering memorandum as it may be amended, supplemented or restated from time to time (the “Offering Memorandum”), which would contain material information (including certain risks of investing in such Fund) not contained in this document and which would supersede and which would qualify in its entirety the information set forth in this document. Any decision to invest in a Fund should be made after reviewing the Offering Memorandum of the Fund, conducting such investigations as the investor deems necessary and consulting the investor’s own legal, accounting and tax advisors in order to make an independent determination of the suitability and consequences of an investment in the Fund.
None of the Funds or their affiliates make any representation or warranty, express or implied, as to the accuracy or completeness of the information contained herein and nothing contained herein should be relied upon as a promise or representation as to past or future performance of a Fund or any other entity. Any prior investment results of any Fund or any of its affiliates and any hypothetical information are presented in this document for illustrative purposes only and are not indicative of the future results of such Fund.
Certain information contained in this presentation has been obtained from sources outside Blackstone. While such information is believed to be reliable for purposes used herein, no representations are made as to the accuracy or completeness thereof and none of the Funds or their affiliates take any responsibility for such information.
Certain information contained in the presentation discusses general market activity, industry or sector trends, or other broad-based economic, market or political conditions and should not be construed as research or investment advice.
Certain information has been derived from surveys of Blackstone portfolio companies. Such surveys were not scientifically conducted and may not constitute a representative sample of companies across industries and geographies. Investors should not rely on the results of the survey in making any investment decision.
Past performance is not necessarily indicative of future results. Except as otherwise noted, the Gross Annual Rate of Return represents the compound annual rate of return (“IRR”) before partnership expenses, management fees, drawdowns for organizational and partnership expenses, and the General Partner’s allocation of profit, but after partnership expenses withheld from distributions. The Net Annual Rate of Return represents the IRR after management fees, drawdowns for organizational expenses and partnership expenses, partnership expenses withheld from distributions, and the General Partner’s allocation of profits but does not include taxes or withholdings specific to certain limited partners.
Please be advised that certain information contained herein might constitute material non-public information and, therefore, potentially could impose certain trading restrictions on the recipient.
The S&P 500 index comparison provided herein is solely for informational purposes as an indication of returns that could be earned by investors by making similar investments in the S&P 500 Index and should not be relied upon for any purpose. S&P 500 annual return has been calculated as the internal rate of return assuming each amount contributed or paid to BCP I-VI (and excluding BEP I and BCOM) were invested and disposed of in the S&P 500 Total Return Index on the same respective dates. Outperformance measures the net IRR to Limited Partners for such an investment in BCP I-VI compared to the aggregate hypothetical S&P 500 Total Return Index for such periods. The performance of each of BCP I-VI relative to the S&P 500 is different from the overall performance of such funds relative to the S&P 500. Blackstone’s funds differ from the S&P 500 Total Return Index in that, among other factors, (i) the volatility of the S&P 500 Total Return Index may be materially different from that of the Blackstone funds; (ii) the S&P 500 Total Return Index employs different investment guidelines and criteria than the Blackstone funds and, therefore, holdings in such funds differ significantly from holdings of the securities that comprise the S&P 500 Total Return Index; (iii) the performance of the S&P 500 Index may not necessarily have been selected to represent an appropriate benchmark or index to compare to the performance of the referenced Blackstone funds, but rather, is disclosed to allow for comparison of the referenced Blackstone funds’ performance to that of a well-known benchmark or index; and (iv) Blackstone’s funds are actively managed entities that bear fees and use leverage. Further information regarding the methodologies and other related information referred to above is available upon request.
Blackstone 18
184 0 92 102 0 70 0 152 195 99 206 202 201 221 3 0 103 120
Forward-Looking Statements
This presentation may contain forward‐looking statements within the meaning of Section 27A of the Securities Act of 1933 and Section 21E of the Securities Exchange Act of 1934 which reflect Blackstone’s current views with respect to, among other things, Blackstone’s operations and financial performance. You can identify these forward‐looking statements by the use of words such as “outlook,” “believes,” “expects,” “potential,” “continues,” “may,” “will,” “should,” “seeks,” “approximately,” “predicts,” “intends,” “plans,” “estimates,” “anticipates” or the negative version of these words or other comparable words. Such forward‐looking statements are subject to various risks and uncertainties. Accordingly, there are or will be important factors that could cause actual outcomes or results to differ materially from those indicated in these statements. Blackstone believes these factors include but are not limited to those described under the section entitled “Risk Factors” in its Annual Report on Form 10‐K for the fiscal year ended December 31, 2014, as such factors may be updated from time to time in its periodic filings with the Securities and Exchange Commission, which are accessible on the SEC’s website at www.sec.gov. These factors should not be construed as exhaustive and should be read in conjunction with the other cautionary statements that are included in this presentation and in the filings. Blackstone undertakes no obligation to publicly update or review any forward‐looking statement, whether as a result of new information, future developments or otherwise.
All information regarding projected performance is with regard to past investments and is provided solely as an update to existing limited partners on the status of their current investments. Nothing herein is intended as an offer to invest in, or the solicitation of an investment in, any Blackstone managed fund, account or transaction.
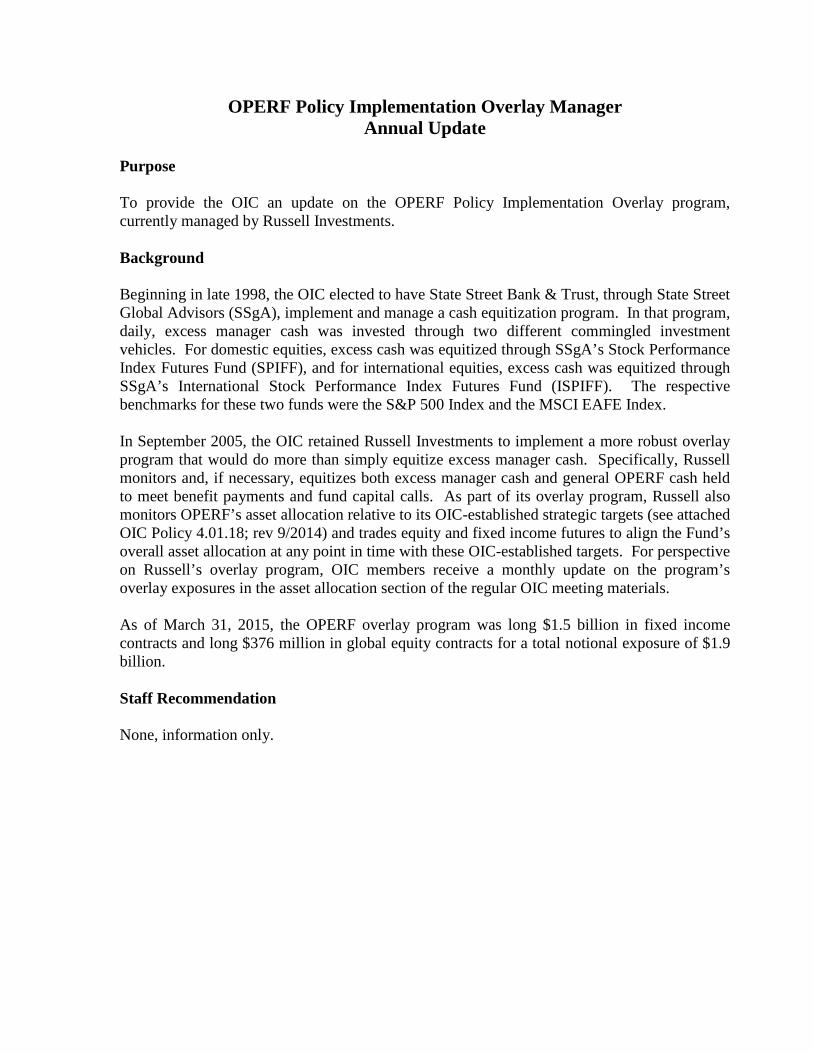
OPERF Policy Implementation Overlay Manager Annual Update
Purpose
To provide the OIC an update on the OPERF Policy Implementation Overlay program, currently managed by Russell Investments.
Background
Beginning in late 1998, the OIC elected to have State Street Bank & Trust, through State Street Global Advisors (SSgA), implement and manage a cash equitization program. In that program, daily, excess manager cash was invested through two different commingled investment vehicles. For domestic equities, excess cash was equitized through SSgA’s Stock Performance Index Futures Fund (SPIFF), and for international equities, excess cash was equitized through SSgA’s International Stock Performance Index Futures Fund (ISPIFF). The respective benchmarks for these two funds were the S&P 500 Index and the MSCI EAFE Index.
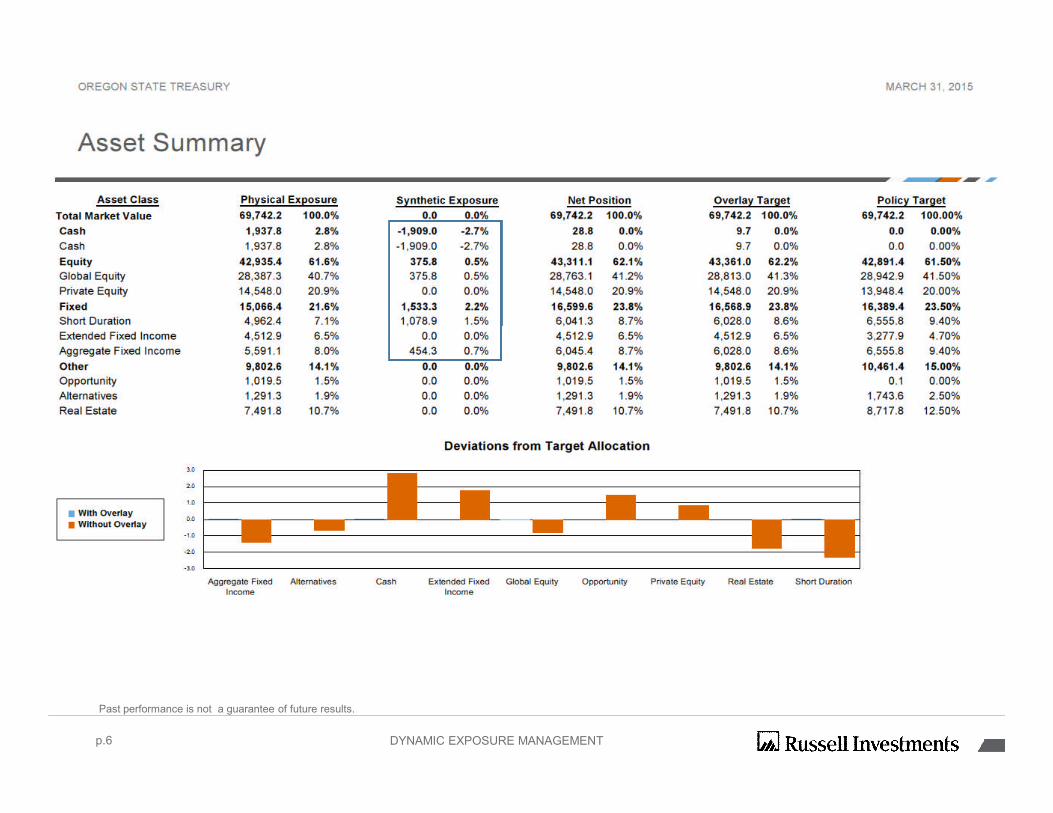
In September 2005, the OIC retained Russell Investments to implement a more robust overlay program that would do more than simply equitize excess manager cash. Specifically, Russell monitors and, if necessary, equitizes both excess manager cash and general OPERF cash held to meet benefit payments and fund capital calls. As part of its overlay program, Russell also monitors OPERF’s asset allocation relative to its OIC-established strategic targets (see attached OIC Policy 4.01.18; rev 9/2014) and trades equity and fixed income futures to align the Fund’s overall asset allocation at any point in time with these OIC-established targets. For perspective on Russell’s overlay program, OIC members receive a monthly update on the program’s overlay exposures in the asset allocation section of the regular OIC meeting materials.
As of March 31, 2015, the OPERF overlay program was long $1.5 billion in fixed income contracts and long $376 million in global equity contracts for a total notional exposure of $1.9 billion.
Staff Recommendation
None, information only.
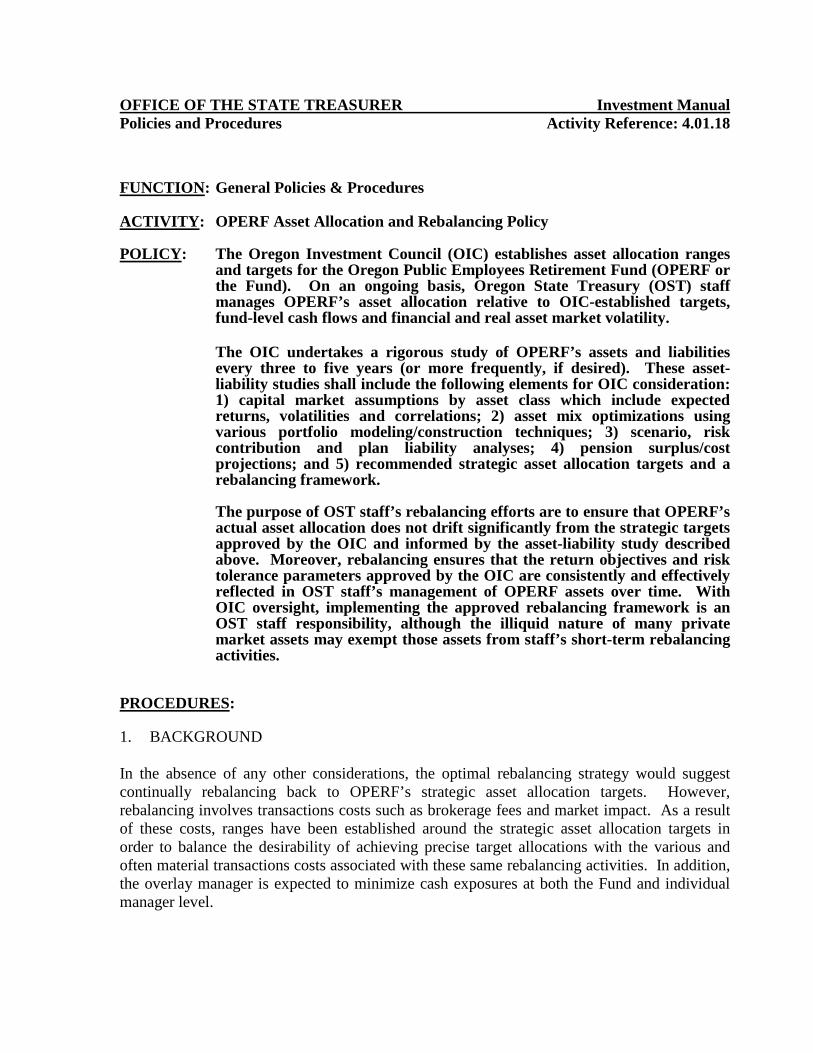
OFFICE OF THE STATE TREASURER Investment Manual Policies and Procedures Activity Reference: 4.01.18 FUNCTION: General Policies & Procedures ACTIVITY: OPERF Asset Allocation and Rebalancing Policy POLICY: The Oregon Investment Council (OIC) establishes asset allocation ranges
and targets for the Oregon Public Employees Retirement Fund (OPERF or the Fund). On an ongoing basis, Oregon State Treasury (OST) staff manages OPERF’s asset allocation relative to OIC-established targets, fund-level cash flows and financial and real asset market volatility.
The OIC undertakes a rigorous study of OPERF’s assets and liabilities
every three to five years (or more frequently, if desired). These asset-liability studies shall include the following elements for OIC consideration: 1) capital market assumptions by asset class which include expected returns, volatilities and correlations; 2) asset mix optimizations using various portfolio modeling/construction techniques; 3) scenario, risk contribution and plan liability analyses; 4) pension surplus/cost projections; and 5) recommended strategic asset allocation targets and a rebalancing framework.
The purpose of OST staff’s rebalancing efforts are to ensure that OPERF’s
actual asset allocation does not drift significantly from the strategic targets approved by the OIC and informed by the asset-liability study described above. Moreover, rebalancing ensures that the return objectives and risk tolerance parameters approved by the OIC are consistently and effectively reflected in OST staff’s management of OPERF assets over time. With OIC oversight, implementing the approved rebalancing framework is an OST staff responsibility, although the illiquid nature of many private market assets may exempt those assets from staff’s short-term rebalancing activities.
PROCEDURES: 1. BACKGROUND In the absence of any other considerations, the optimal rebalancing strategy would suggest continually rebalancing back to OPERF’s strategic asset allocation targets. However, rebalancing involves transactions costs such as brokerage fees and market impact. As a result of these costs, ranges have been established around the strategic asset allocation targets in order to balance the desirability of achieving precise target allocations with the various and often material transactions costs associated with these same rebalancing activities. In addition, the overlay manager is expected to minimize cash exposures at both the Fund and individual manager level.
A breach of any of the established asset allocation ranges triggers a review and possible rebalancing back to established targets with due consideration given to the liquidity of the affected investments, all anticipated transaction costs and the current portfolio structure within each asset class. 2. IMPLEMENTATION
A. OST Staff will undertake the implementation of the rebalancing program. B. The Fund's actual asset allocation shall be reviewed at the end of each month when
asset valuations become available. More frequent reviews may be undertaken, if appropriate, provided the required asset value information is also available. Rebalancing will take place if the allocation to any particular asset class exceeds the corresponding, stipulated policy range. Staff shall manage liquidity by rebalancing assets between and among managers, as necessary, to a) meet the Fund’s cash needs and b) maintain the preferred portfolio structure (i.e., maintain specific manager weightings) within each asset class. All physical rebalancings shall be executed in concert with the overlay manager as described above.
C. Rebalancing should be implemented by the most cost-effective means available. For
example, cash flows into and out of the Fund will first be used to rebalance back toward asset class targets, whenever possible. Crossing opportunities in index fund investments and futures/options may also be used in rebalancing in order to reduce costs.
D. When rebalancing occurs, OST staff shall make a recommendation to the Chief
Investment Officer regarding the most appropriate asset allocation, taking into account portfolio characteristics, preferred portfolio structure, existing manager weights, market conditions and the Fund’s cash flow requirements.
E. All rebalancing shall take place within the asset class and sub-asset class ranges
established in policy by the OIC.
F. For illiquid assets such as private equity and real estate, rebalancing considerations should include higher transaction costs and the availability of alternative rebalancing opportunities, if any.
G. Staff shall report to the OIC the actual market valuations versus the target allocations
by asset class monthly as well as any and all rebalancing activity quarterly.

3. ASSET ALLOCATION POLICY TARGETS AND RANGES
Asset Class Target Allocation Range Public Equities 37.5% 32.5 – 42.5% Private Equity 20.0% 16.0 – 24.0%
Total Equity 57.5% 52.5 – 62.5% Fixed Income 20.0% 15.0 – 25.0% Real Estate 12.5% 9.5 – 15.5% Alternatives 10.0% 0.0 – 10.0% Opportunity Portfolio 0.0% 0.0 – 3.0% Cash 0.0% 0.0 – 3.0%
Total Fund 100.0%
Note: Targets and ranges as established by the OIC in June 2013. Full implementation will take multiple years.
4. ASSET ALLOCATION AND EXPECTED RETURNS
A. Periodically (annually or twice a year) the OIC’s general consultant updates its capitalmarket and asset class return assumptions.
B. At least annually, and for OIC approval, OST staff will work with the general consultant to update the policy mix and return expectations for the OPERF Regular Account as reflected in the Statement of Investment Objectives and Policy Framework.
SAMPLE FORMS, DOCUMENTS OR REPORTS (Attached): None
APRIL 29, 2015
Russell Overlay UpdateSteve Cauble – Regional Director
Philip Lee, CFA – Portfolio manager
Greg Nordquist, CFA – Director, Overlay Strategies

p.2
Important information
Russell Investments is a trade name and registered trademark of Frank Russell Company, a Washington USA corporation, which operates through subsidiaries worldwide, includingRussell Implementation Services Inc. a SEC registered investment adviser and broker-dealer, member FINRA. Russell Investments is a subsidiary of London Stock ExchangeGroup.
Date of first use: April 2015
RIS RC: 2562
Contents
› Overlay update
› 1 Year ending March 31, 2015
› 5 Years ending March 31, 2015
› Appendix
p.3

Overlay update
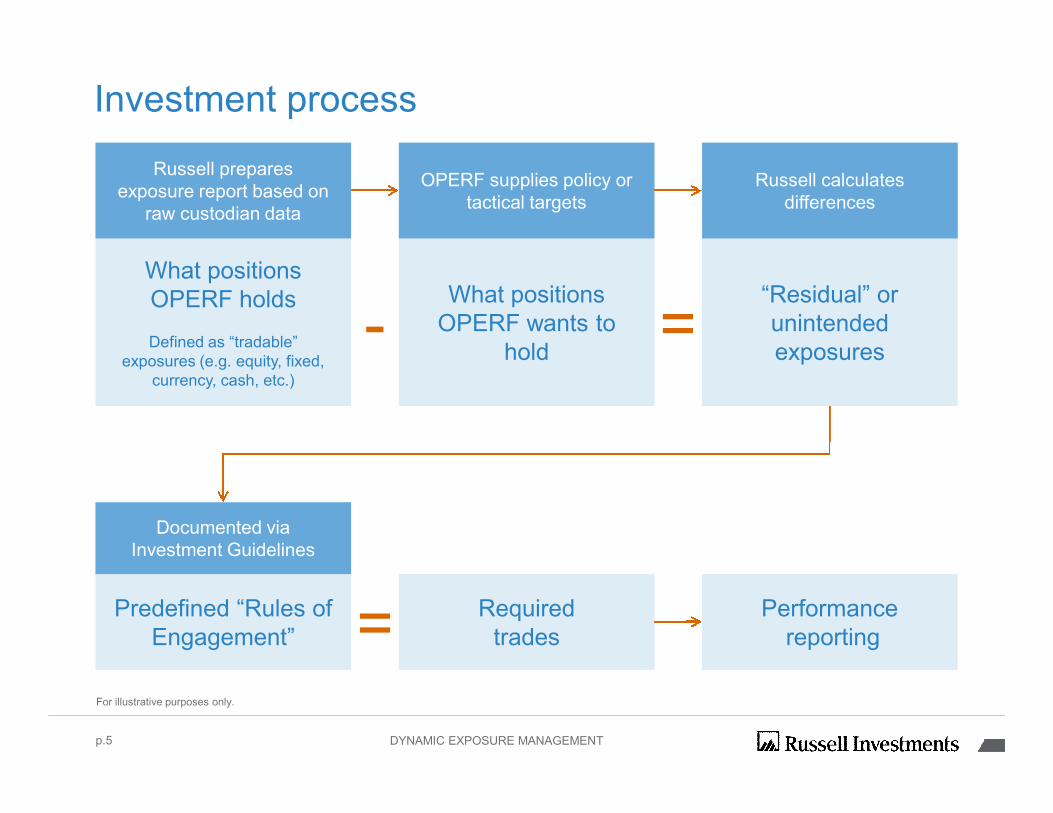
Investment process
For illustrative purposes only.
What positionsOPERF holds
Defined as “tradable”exposures (e.g. equity, fixed,
currency, cash, etc.)
What positionsOPERF wants to
hold-
“Residual” orunintendedexposures
=
Predefined “Rules ofEngagement”
Requiredtrades=
Russell preparesexposure report based on
raw custodian data
OPERF supplies policy ortactical targets
Russell calculatesdifferences
p.5
Performancereporting
Documented viaInvestment Guidelines
DYNAMIC EXPOSURE MANAGEMENT
p.6
Past performance is not a guarantee of future results.
DYNAMIC EXPOSURE MANAGEMENT
($500)
$0
$500
$1,000
$1,500
$2,000
4/1/2014 5/1/2014 6/1/2014 7/1/2014 8/1/2014 9/1/2014 10/1/2014 11/1/2014 12/1/2014 1/1/2015 2/1/2015 3/1/2015
Change in Cash Cash
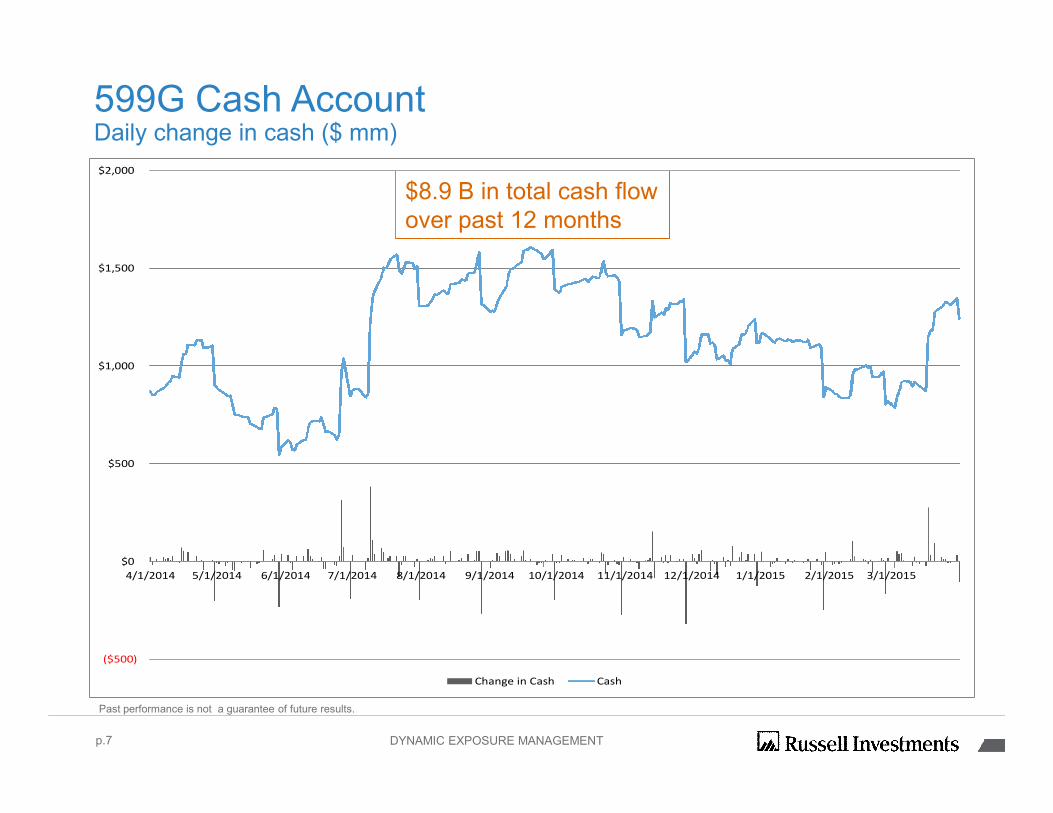
599G Cash AccountDaily change in cash ($ mm)
p.7
$8.9 B in total cash flowover past 12 months
Past performance is not a guarantee of future results.
DYNAMIC EXPOSURE MANAGEMENT
Russell Investments
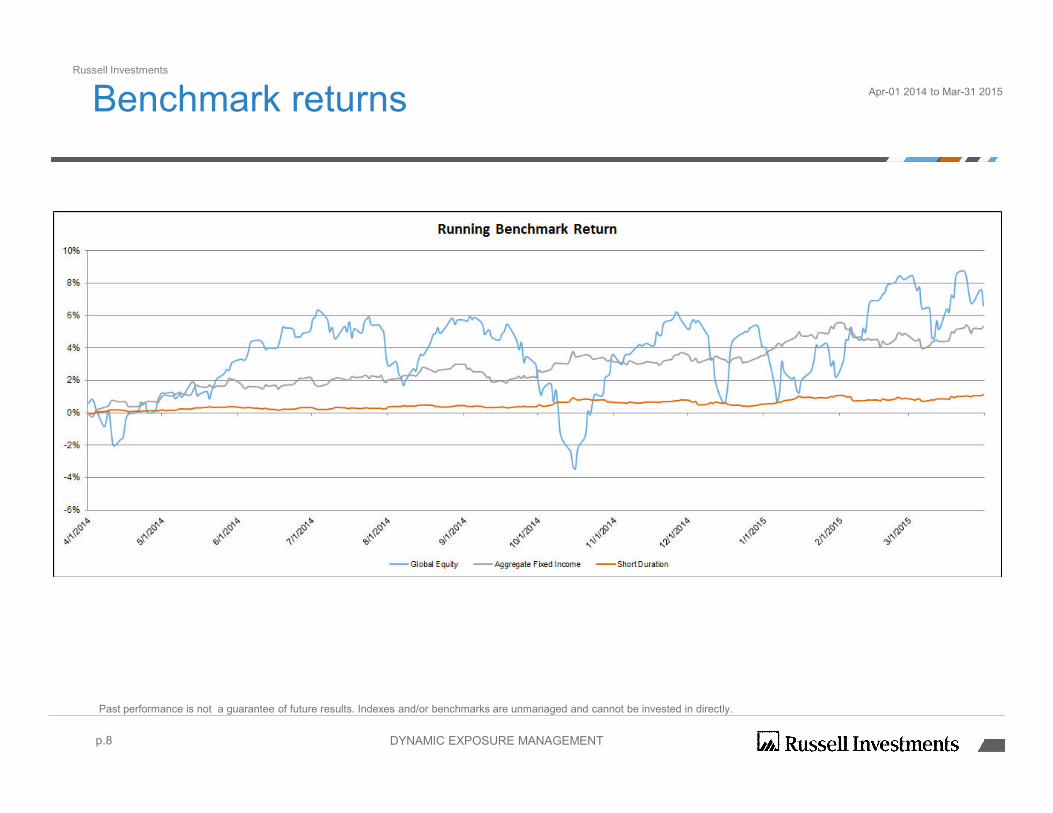
Apr-01 2014 to Mar-31 2015Benchmark returns
p.8
Past performance is not a guarantee of future results. Indexes and/or benchmarks are unmanaged and cannot be invested in directly.
DYNAMIC EXPOSURE MANAGEMENT
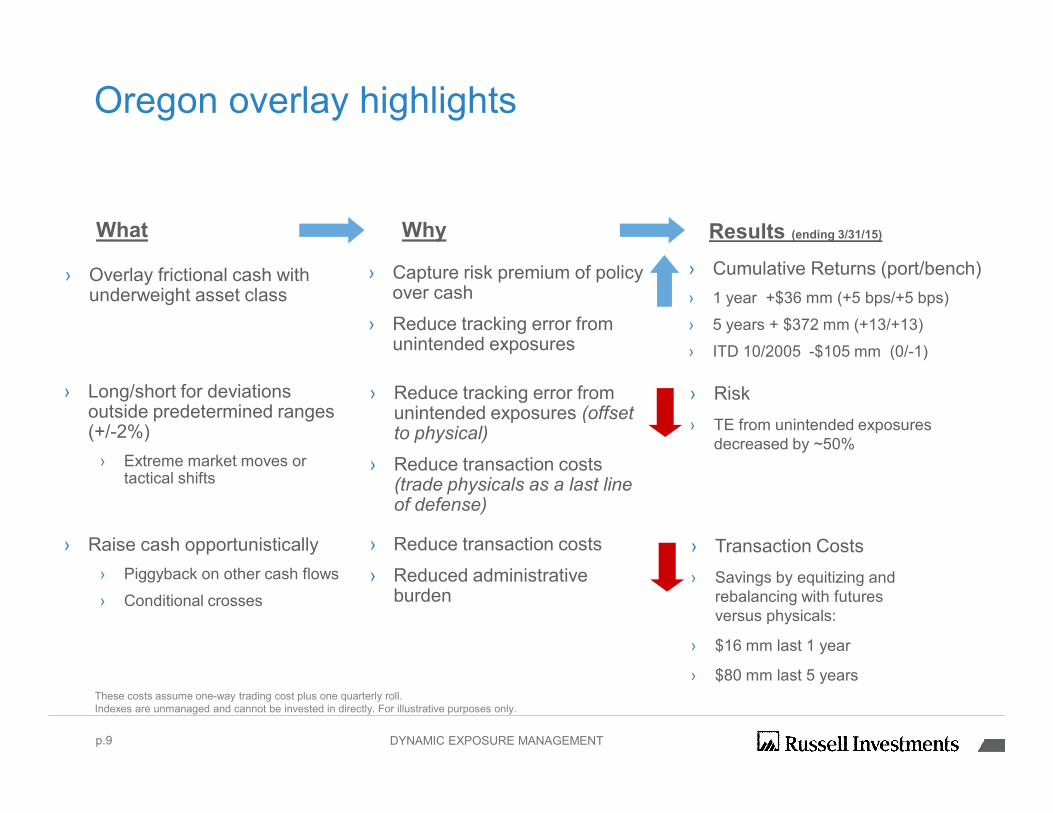
Oregon overlay highlights
› Capture risk premium of policyover cash
› Reduce tracking error fromunintended exposures
› Reduce transaction costs
› Reduced administrativeburden
› Reduce tracking error fromunintended exposures (offsetto physical)
› Reduce transaction costs(trade physicals as a last lineof defense)
› Long/short for deviationsoutside predetermined ranges(+/-2%)
› Extreme market moves ortactical shifts
› Raise cash opportunistically
› Piggyback on other cash flows
› Conditional crosses
What Why Results (ending 3/31/15)
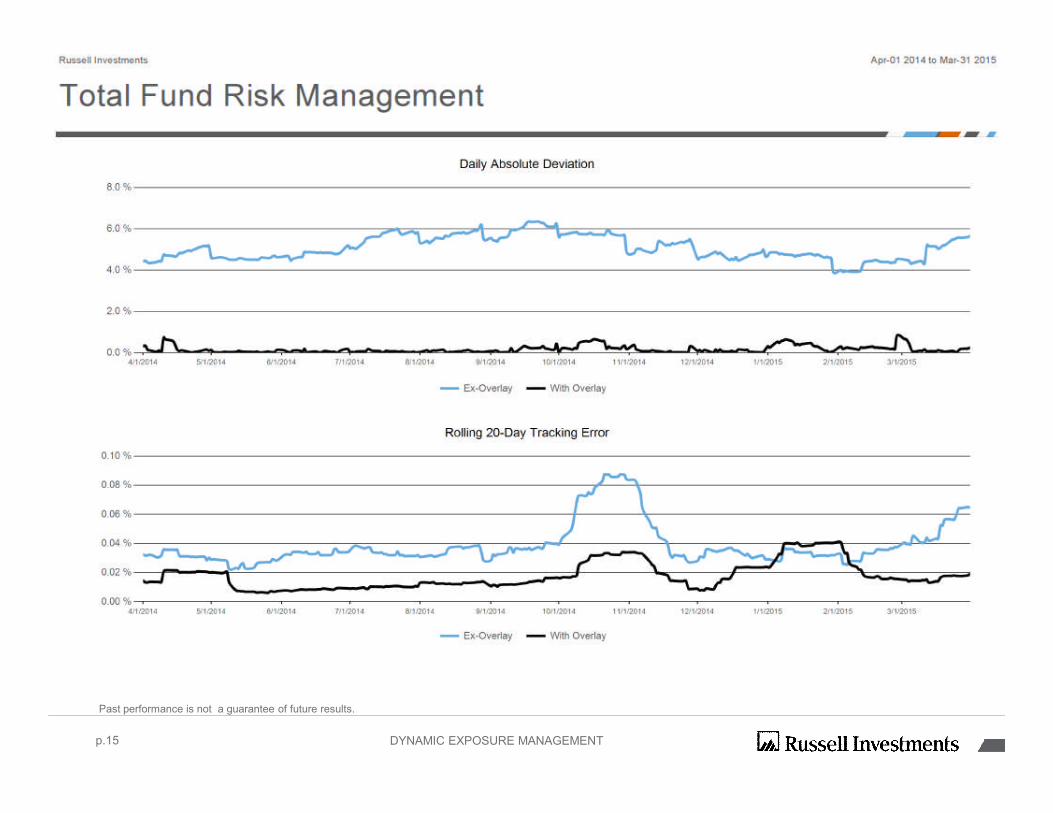
› Risk
› TE from unintended exposuresdecreased by ~50%
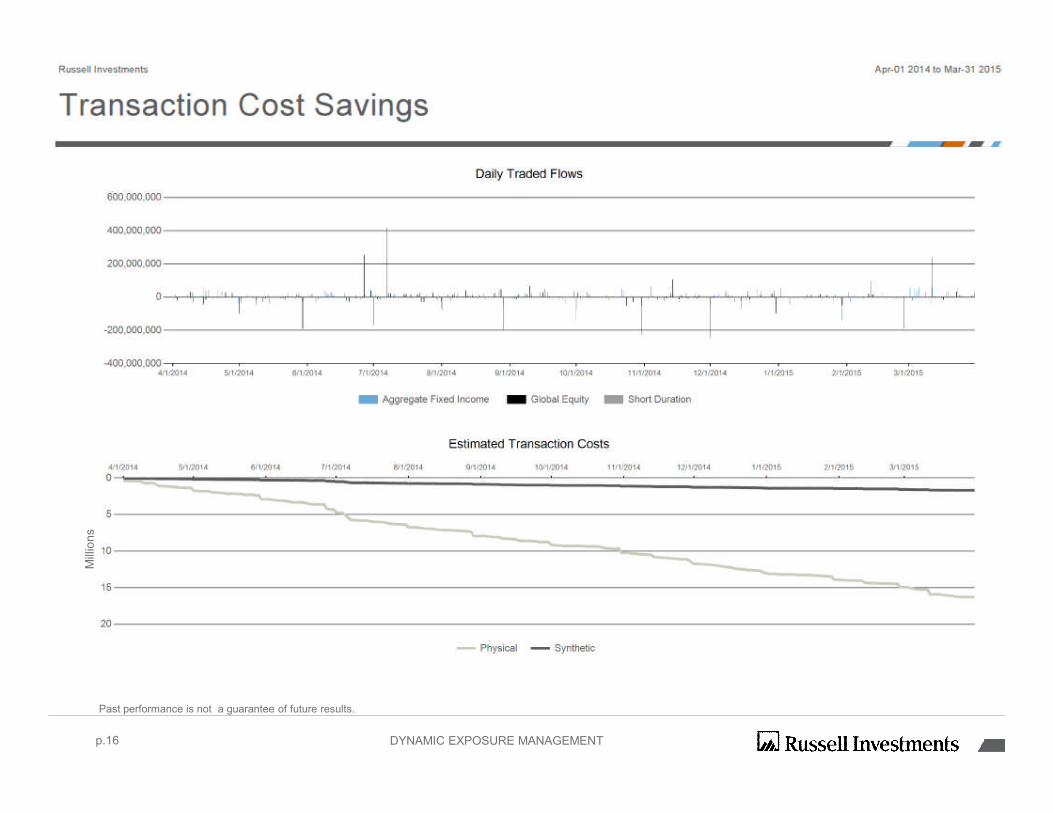
› Transaction Costs
› Savings by equitizing andrebalancing with futuresversus physicals:
› $16 mm last 1 year
› $80 mm last 5 yearsThese costs assume one-way trading cost plus one quarterly roll.Indexes are unmanaged and cannot be invested in directly. For illustrative purposes only.
› Overlay frictional cash withunderweight asset class
› Cumulative Returns (port/bench)
› 1 year +$36 mm (+5 bps/+5 bps)
› 5 years + $372 mm (+13/+13)
› ITD 10/2005 -$105 mm (0/-1)
p.9 DYNAMIC EXPOSURE MANAGEMENT
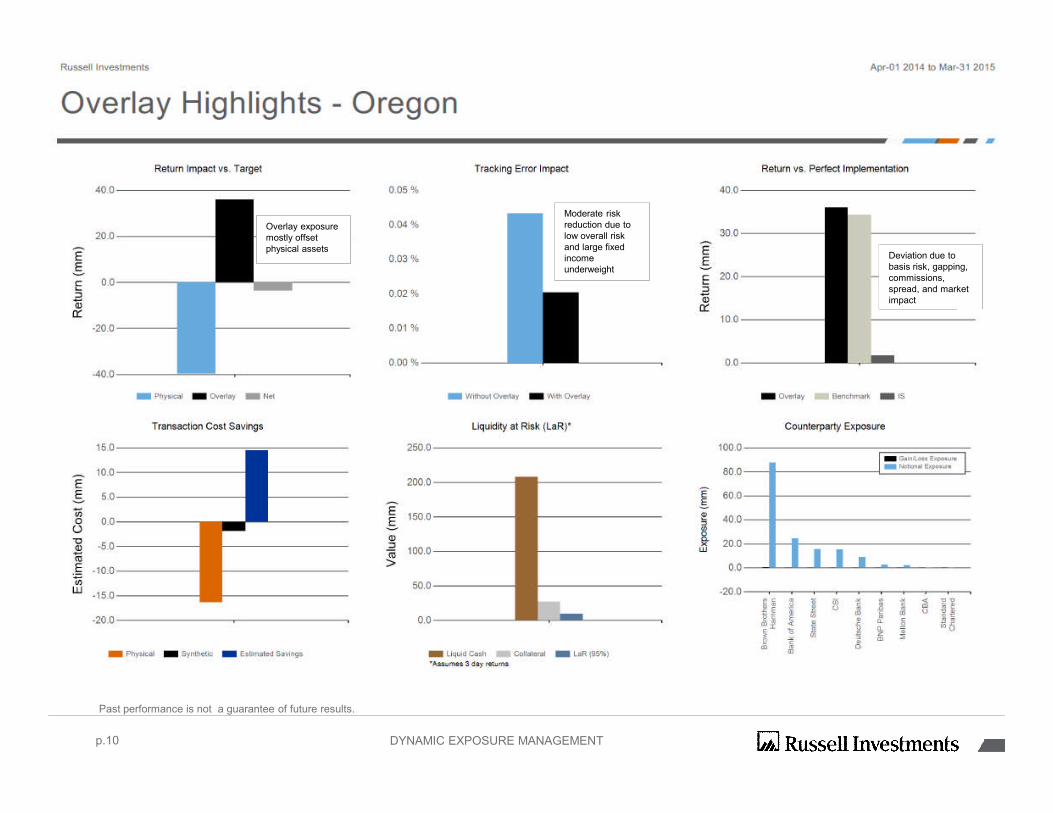
Overlay exposuremostly offsetphysical assets
Moderate riskreduction due tolow overall riskand large fixedincomeunderweight
Deviation due tobasis risk, gapping,commissions,spread, and marketimpact
p.10
Past performance is not a guarantee of future results.
DYNAMIC EXPOSURE MANAGEMENT
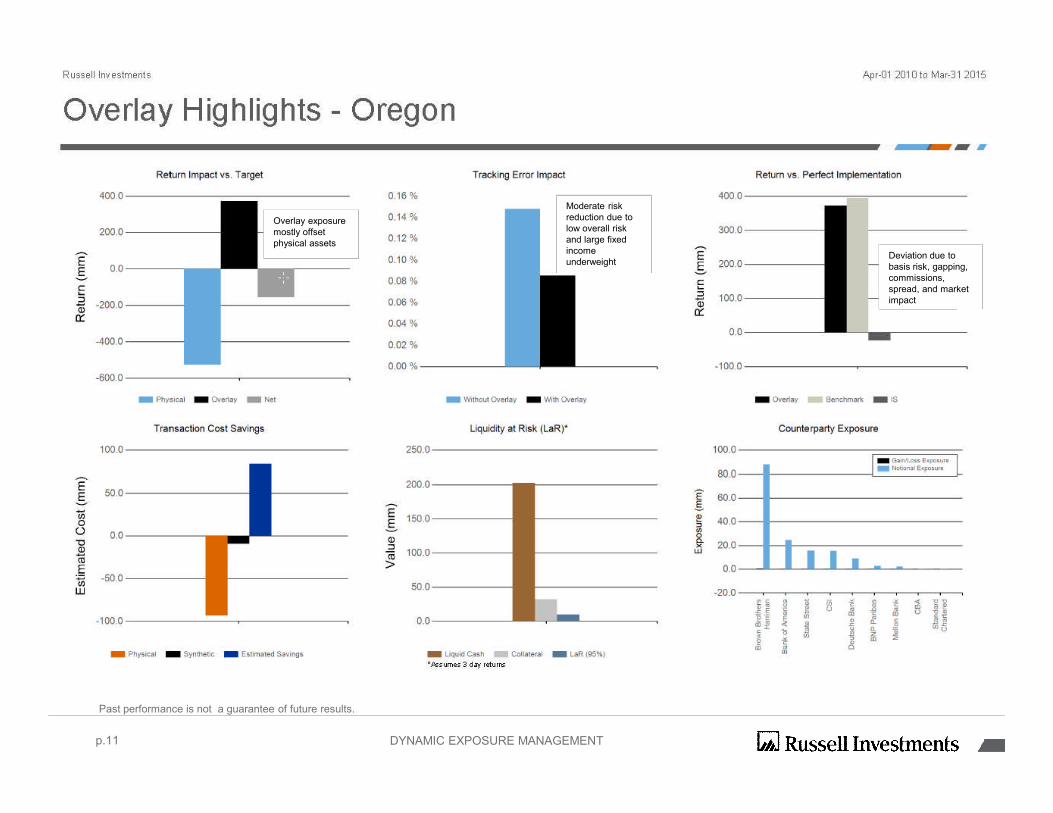
Overlay exposuremostly offsetphysical assets
Moderate riskreduction due tolow overall riskand large fixedincomeunderweight
Deviation due tobasis risk, gapping,commissions,spread, and marketimpact
p.11
Past performance is not a guarantee of future results.
DYNAMIC EXPOSURE MANAGEMENT
p.12
Past performance is not a guarantee of future results.
DYNAMIC EXPOSURE MANAGEMENT
Appendix
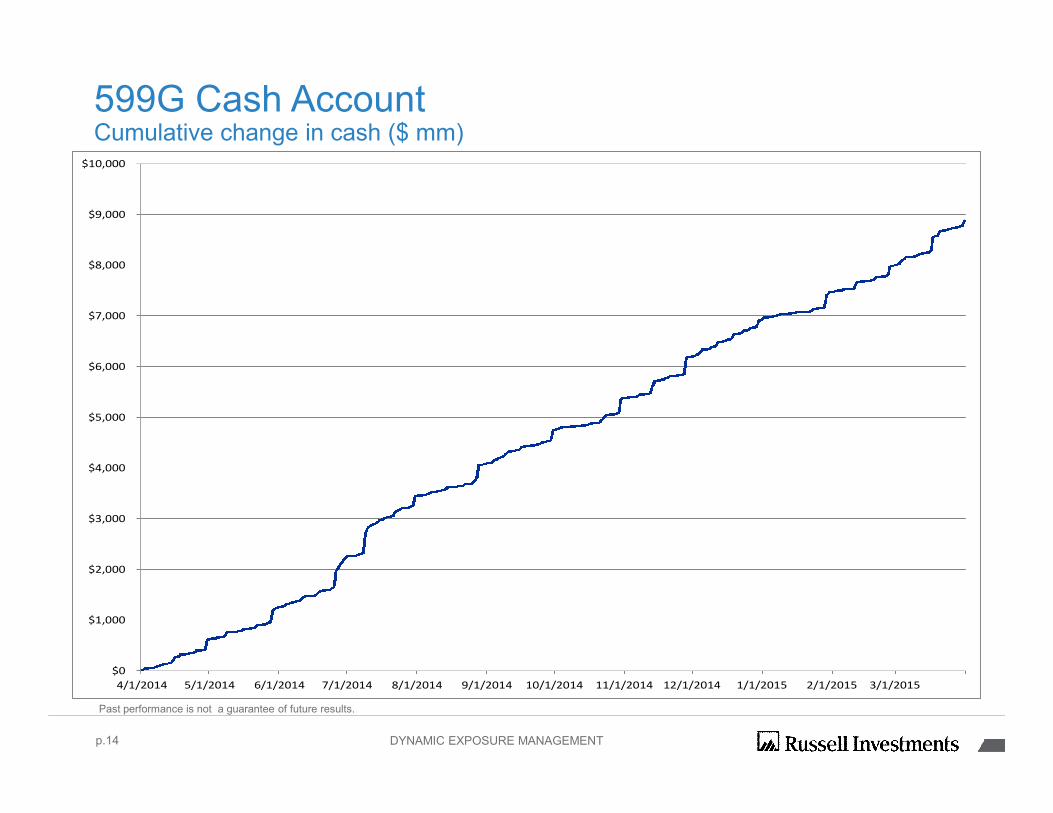
599G Cash AccountCumulative change in cash ($ mm)
p.14
Past performance is not a guarantee of future results.
$0
$1,000
$2,000
$3,000
$4,000
$5,000
$6,000
$7,000
$8,000
$9,000
$10,000
4/1/2014 5/1/2014 6/1/2014 7/1/2014 8/1/2014 9/1/2014 10/1/2014 11/1/2014 12/1/2014 1/1/2015 2/1/2015 3/1/2015
DYNAMIC EXPOSURE MANAGEMENT
p.15
Past performance is not a guarantee of future results.
DYNAMIC EXPOSURE MANAGEMENT
p.16
Past performance is not a guarantee of future results.
DYNAMIC EXPOSURE MANAGEMENT
Mill
ion
s
p.17
Past performance is not a guarantee of future results. Indexes and/or benchmarks are unmanaged and cannot be invested in directly.
DYNAMIC EXPOSURE MANAGEMENT

www.russell.com/institutional
Policy and Procedure Update Purpose To provide the OIC an update on OST’s plans to institute an automated, systematic approach to policy and procedure reviews. Background In September 2014, OST hired a policy analyst to evaluate OST’s policies and procedures and design an efficient method for their review and approval. The policy analyst assessed nearly a dozen web-based policy management tools and ultimately recommended OST procure PolicyStat to streamline and automate the policy review, revision and approval process. During the first phase of PolicyStat’s implementation, OST management identified owners, review dates and sets of approvers for each OST policy, and then uploaded all policies into the PolicyStat application. Going forward, PolicyStat will automatically email the owner when a policy is coming due for review, and push the policy through an approval workflow. The Policy Analyst estimates the first round of review for OST’s policies will be complete in mid-2017. In addition to implementing PolicyStat, the policy analyst also evaluated outstanding audit findings related to policy management. In August 2012, OST hired Cortex Applied Research Inc. to produce a Fiduciary Benchmarking Study comparing Oregon to peer groups. With regards to investment policies and procedures, Cortex noted two issues: 1) lack of clarity concerning which entity, OIC or OST, approves individual policies or procedures; and 2) lack of separation between Council-level policies and OST operating procedures. These findings were reiterated in a January 2013 OST internal audit and again during a May 2013 OIC meeting presentation. The second phase of the PolicyStat implementation will resolve these audit findings. During the individual policy review process, the policy owner, together with the policy analyst, will establish a clear distinction between policy and procedure and clearly identify the approving entity. The revised policies will come before the OIC for approval, while operating procedures will be approved by the CIO. Staff Recommendation None, information only.
Investment Policies and Procedures Update
April 29, 2015
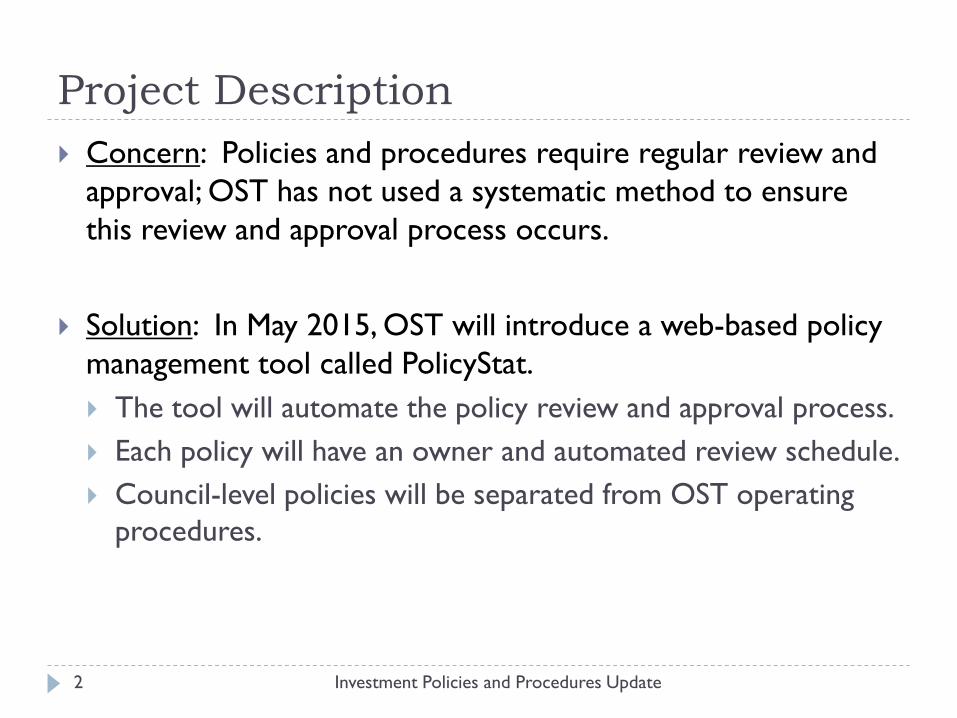
Project Description Concern: Policies and procedures require regular review and
approval; OST has not used a systematic method to ensure this review and approval process occurs.
Solution: In May 2015, OST will introduce a web-based policy
management tool called PolicyStat. The tool will automate the policy review and approval process. Each policy will have an owner and automated review schedule. Council-level policies will be separated from OST operating
procedures.
Investment Policies and Procedures Update
2
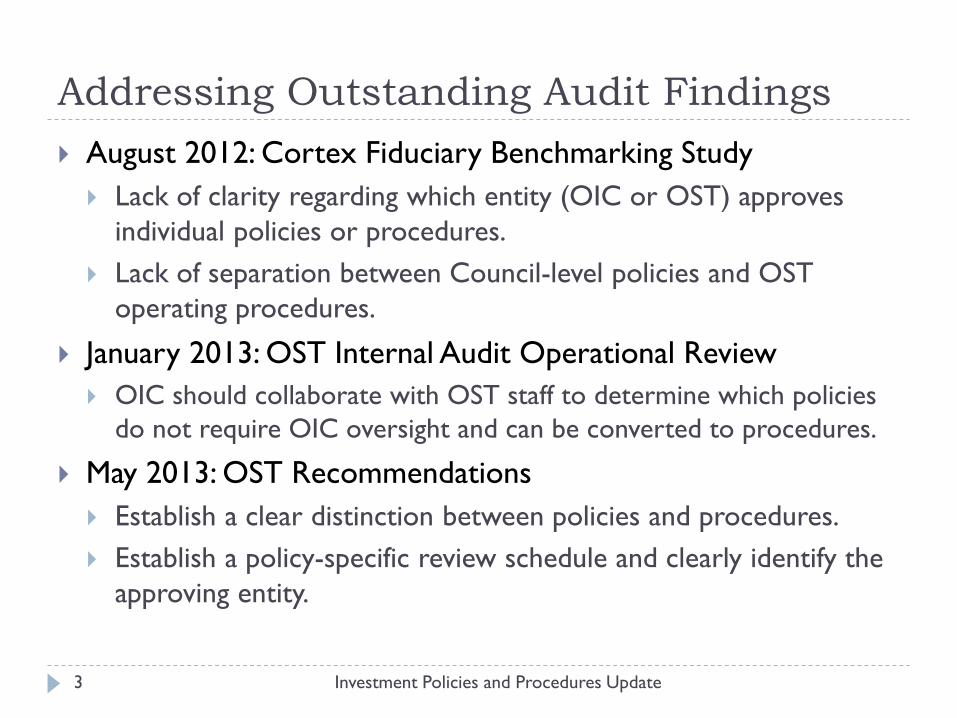
Addressing Outstanding Audit Findings August 2012: Cortex Fiduciary Benchmarking Study Lack of clarity regarding which entity (OIC or OST) approves
individual policies or procedures. Lack of separation between Council-level policies and OST
operating procedures.
January 2013: OST Internal Audit Operational Review OIC should collaborate with OST staff to determine which policies
do not require OIC oversight and can be converted to procedures.
May 2013: OST Recommendations Establish a clear distinction between policies and procedures. Establish a policy-specific review schedule and clearly identify the
approving entity.
Investment Policies and Procedures Update 3
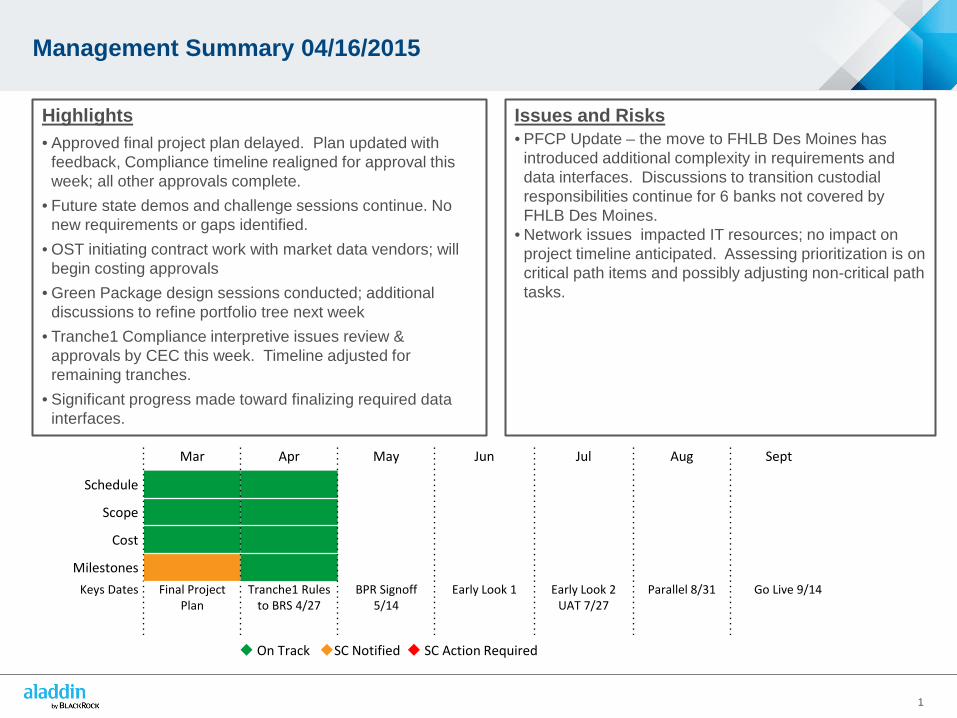
Management Summary 04/16/2015
1
Highlights • Approved final project plan delayed. Plan updated with
feedback, Compliance timeline realigned for approval thisweek; all other approvals complete.
• Future state demos and challenge sessions continue. Nonew requirements or gaps identified.
• OST initiating contract work with market data vendors; willbegin costing approvals
• Green Package design sessions conducted; additionaldiscussions to refine portfolio tree next week
• Tranche1 Compliance interpretive issues review &approvals by CEC this week. Timeline adjusted forremaining tranches.
• Significant progress made toward finalizing required datainterfaces.
Issues and Risks • PFCP Update – the move to FHLB Des Moines has
introduced additional complexity in requirements and data interfaces. Discussions to transition custodial responsibilities continue for 6 banks not covered by FHLB Des Moines.
• Network issues impacted IT resources; no impact onproject timeline anticipated. Assessing prioritization is on critical path items and possibly adjusting non-critical path tasks.
Mar Apr May Jun Jul Aug Sept
Schedule
Scope
Cost
Milestones Keys Dates Final Project
Plan Tranche1 Rules
to BRS 4/27 BPR Signoff
5/14 Early Look 1 Early Look 2
UAT 7/27 Parallel 8/31 Go Live 9/14
On Track SC Notified SC Action Required

Channel Summary
2
Status Completed Tasks Next Steps
Planning • Team Lead approvals in for all but Compliance• Compliance timeline realigned• No impact to project Go Live date
• Finalize Compliance Channel approval
Technical Infrastructure
• Weekly call with vendors to solicit updates & gettarget install dates
• Continue environment build, expected for BRS accesson May 1
• Begin FTP environment build; target May 1
BPRs
• Completed majority of Future State Challenge 1sessions
• Distributed draft documentation and performeddemos
• Conduct additional Future State sessions to finalizefuture state – Cash Mgmt., Alternatives, CIO Risk Rptg.
• Continue dialogue with teams to address remainingquestions and provide sign-off
Green Package & Analytics
• Design sessions completed – public and privatemarket teams
• Discuss and incorporate feedback regarding portfoliotree and groups
Data Interfaces • Continue to confirm scope of critical interface
development; a few remaining questions• Cash requirement discussions conducted
• Finalize Misc. Cash and New Cash input file sources• Begin requirement docs for confirmed files
Market Data • Contacted all vendors and initiating discussions• Provided security data required for cost estimates• Responding to questionnaires as received
• Update costs estimates as new information arrives• Initiate contract discussions with vendors• Begin cost approvals – BRS pass-thru’s
Data Conversion
• Communicate expected data requests/timing to SSB• Determine position review criteria and responsibilities
Compliance
• Deloitte provided Tranch1 interpretive issues toBRS for feedback to OST
• OST interpretive issue review and approvalunderway
• Began review of Tranche 2 rules
• Complete rule validation for Tranche 1• Begin Tranche 2 interpretive issue analysis
Completed On-track At-risk Delayed
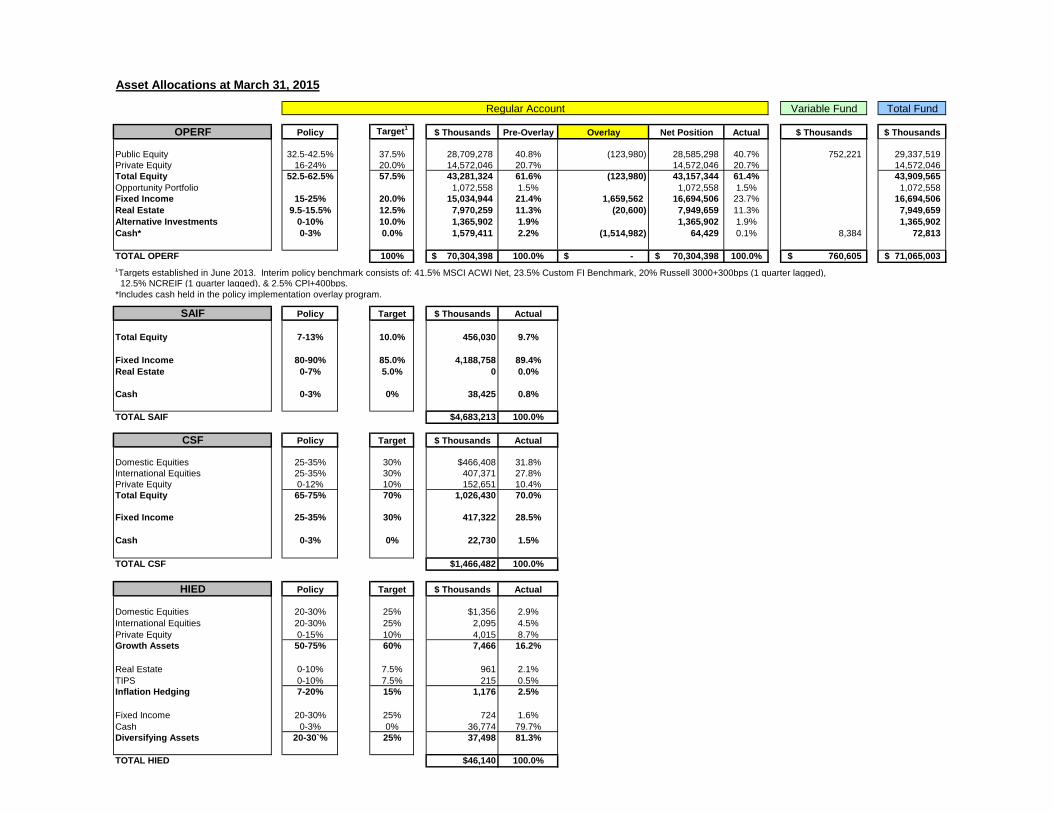
Asset Allocations at March 31, 2015
Variable Fund Total Fund
OPERF Policy Target1
$ Thousands Pre-Overlay Overlay Net Position Actual $ Thousands $ Thousands
Public Equity 32.5-42.5% 37.5% 28,709,278 40.8% (123,980) 28,585,298 40.7% 752,221 29,337,519
Private Equity 16-24% 20.0% 14,572,046 20.7% 14,572,046 20.7% 14,572,046
Total Equity 52.5-62.5% 57.5% 43,281,324 61.6% (123,980) 43,157,344 61.4% 43,909,565
Opportunity Portfolio 1,072,558 1.5% 1,072,558 1.5% 1,072,558
Fixed Income 15-25% 20.0% 15,034,944 21.4% 1,659,562 16,694,506 23.7% 16,694,506
Real Estate 9.5-15.5% 12.5% 7,970,259 11.3% (20,600) 7,949,659 11.3% 7,949,659
Alternative Investments 0-10% 10.0% 1,365,902 1.9% 1,365,902 1.9% 1,365,902
Cash* 0-3% 0.0% 1,579,411 2.2% (1,514,982) 64,429 0.1% 8,384 72,813
TOTAL OPERF 100% 70,304,398$ 100.0% -$ 70,304,398$ 100.0% 760,605$ 71,065,003$
1Targets established in June 2013. Interim policy benchmark consists of: 41.5% MSCI ACWI Net, 23.5% Custom FI Benchmark, 20% Russell 3000+300bps (1 quarter lagged),
12.5% NCREIF (1 quarter lagged), & 2.5% CPI+400bps.
*Includes cash held in the policy implementation overlay program.
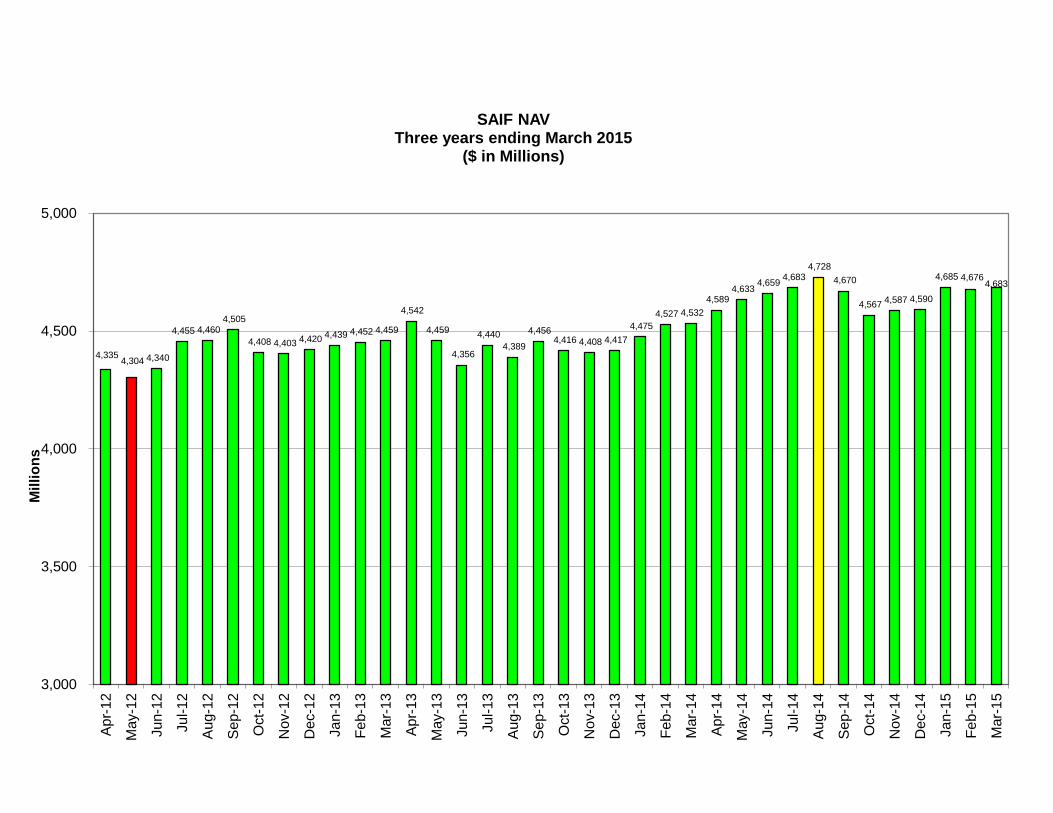
SAIF Policy Target $ Thousands Actual
Total Equity 7-13% 10.0% 456,030 9.7%
Fixed Income 80-90% 85.0% 4,188,758 89.4%
Real Estate 0-7% 5.0% 0 0.0%
Cash 0-3% 0% 38,425 0.8%
TOTAL SAIF $4,683,213 100.0%
CSF Policy Target $ Thousands Actual
Domestic Equities 25-35% 30% $466,408 31.8%
International Equities 25-35% 30% 407,371 27.8%
Private Equity 0-12% 10% 152,651 10.4%
Total Equity 65-75% 70% 1,026,430 70.0%
Fixed Income 25-35% 30% 417,322 28.5%
Cash 0-3% 0% 22,730 1.5%
TOTAL CSF $1,466,482 100.0%
HIED Policy Target $ Thousands Actual
Domestic Equities 20-30% 25% $1,356 2.9%
International Equities 20-30% 25% 2,095 4.5%
Private Equity 0-15% 10% 4,015 8.7%
Growth Assets 50-75% 60% 7,466 16.2%
Real Estate 0-10% 7.5% 961 2.1%
TIPS 0-10% 7.5% 215 0.5%
Inflation Hedging 7-20% 15% 1,176 2.5%
Fixed Income 20-30% 25% 724 1.6%
Cash 0-3% 0% 36,774 79.7%
Diversifying Assets 20-30`% 25% 37,498 81.3%
TOTAL HIED $46,140 100.0%
Regular Account
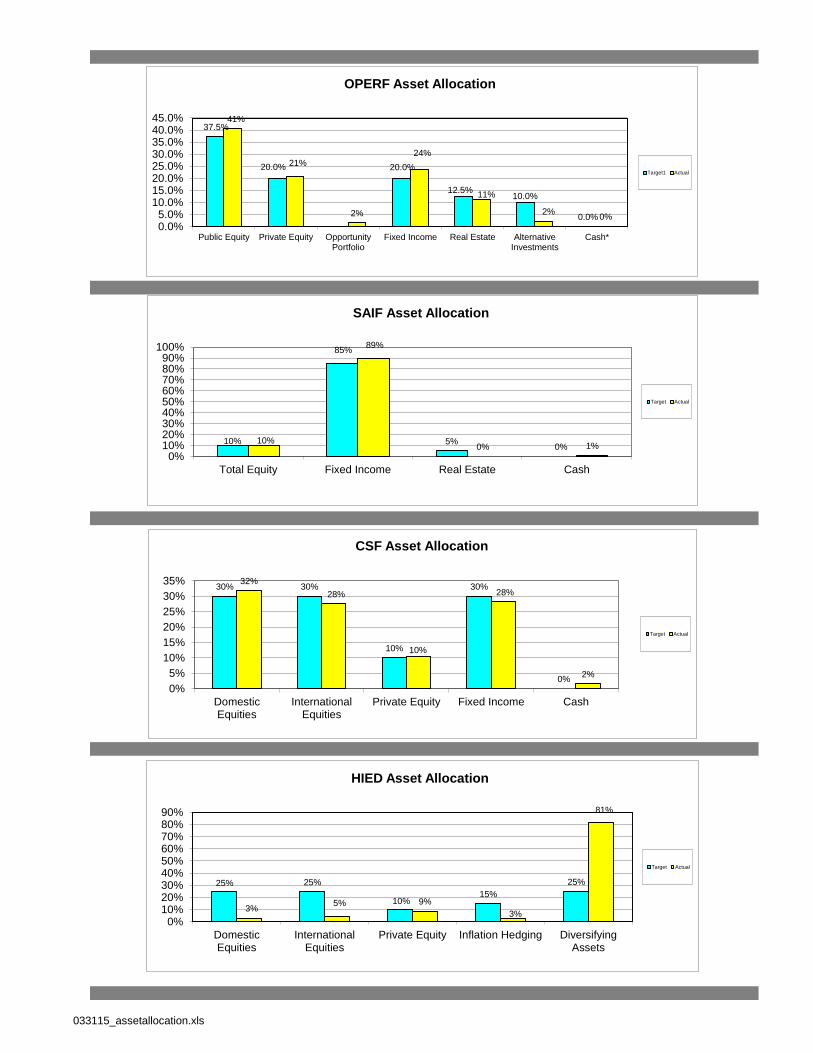
37.5%
20.0% 20.0%
12.5% 10.0%
0.0%
41%
21%
2%
24%
11%
2% 0%
0.0%5.0%
10.0%15.0%20.0%25.0%30.0%35.0%40.0%45.0%
Public Equity Private Equity OpportunityPortfolio
Fixed Income Real Estate AlternativeInvestments
Cash*
OPERF Asset Allocation
Target1 Actual
10%
85%
5% 0%
10%
89%
0% 1%
0%10%20%30%40%50%60%70%80%90%
100%
Total Equity Fixed Income Real Estate Cash
SAIF Asset Allocation
Target Actual
30% 30%
10%
30%
0%
32%
28%
10%
28%
2%
0%
5%
10%
15%
20%
25%
30%
35%
DomesticEquities
InternationalEquities
Private Equity Fixed Income Cash
CSF Asset Allocation
Target Actual
25% 25%
10% 15%
25%
3% 5% 9%
3%
81%
0%10%20%30%40%50%60%70%80%90%
DomesticEquities
InternationalEquities
Private Equity Inflation Hedging DiversifyingAssets
HIED Asset Allocation
Target Actual
033115_assetallocation.xls
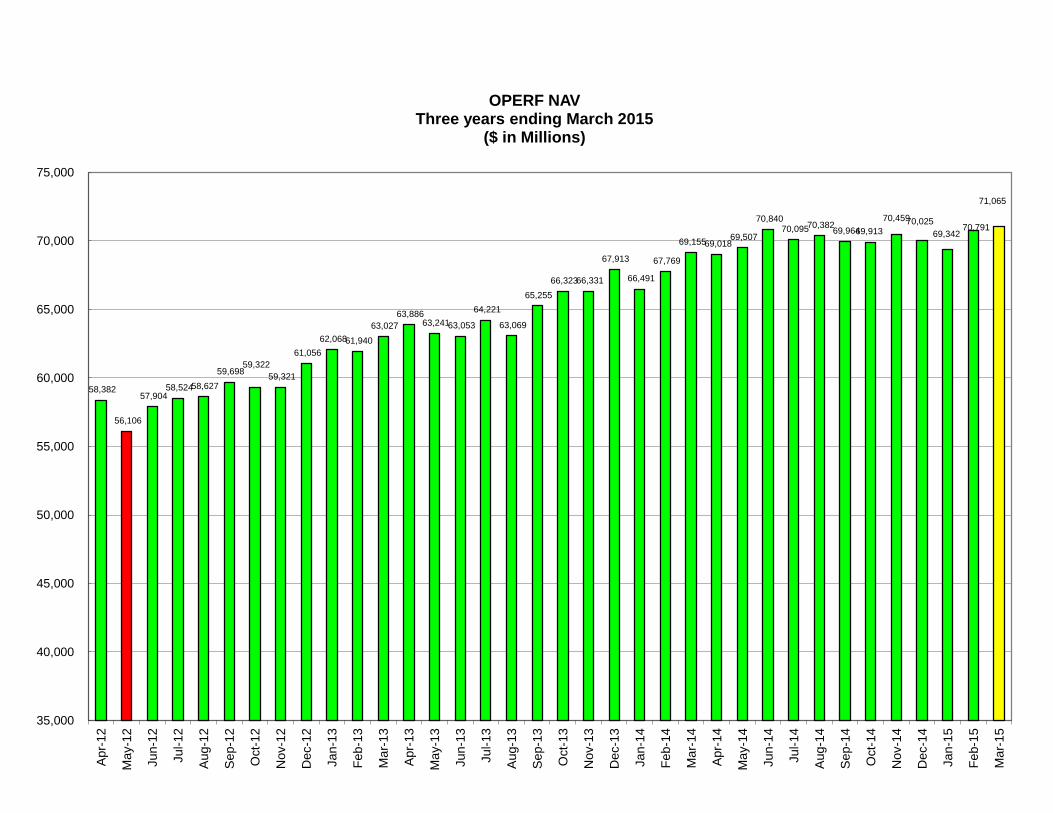
58,382
56,106
57,904 58,524 58,627
59,698 59,322
59,321
61,056
62,068 61,940
63,027
63,886 63,241 63,053
64,221
63,069
65,255
66,323 66,331
67,913
66,491
67,769
69,155 69,018 69,507
70,840 70,095 70,382
69,964 69,913
70,459 70,025
69,342 70,791
71,065
35,000
40,000
45,000
50,000
55,000
60,000
65,000
70,000
75,000
Apr-
12
Ma
y-1
2
Jun-1
2
Jul-
12
Aug-1
2
Sep-1
2
Oct-
12
No
v-1
2
Dec-1
2
Jan-1
3
Feb-1
3
Ma
r-13
Apr-
13
Ma
y-1
3
Jun-1
3
Jul-
13
Aug-1
3
Sep-1
3
Oct-
13
Nov-1
3
Dec-1
3
Jan-1
4
Feb-1
4
Ma
r-14
Ap
r-1
4
Ma
y-1
4
Jun-1
4
Jul-
14
Aug-1
4
Sep-1
4
Oct-
14
Nov-1
4
Dec-1
4
Jan-1
5
Feb-1
5
Ma
r-15
OPERF NAV Three years ending March 2015
($ in Millions)
4,335 4,304 4,340
4,455 4,460 4,505
4,408 4,403 4,420 4,439 4,452 4,459
4,542
4,459
4,356
4,440
4,389
4,456 4,416 4,408 4,417
4,475
4,527 4,532
4,589 4,633
4,659 4,683
4,728
4,670
4,567 4,587 4,590
4,685 4,676 4,683
3,000
3,500
4,000
4,500
5,000
Apr-
12
May-1
2
Jun-1
2
Jul-12
Aug-1
2
Sep-1
2
Oct-
12
Nov-1
2
Dec-1
2
Jan-1
3
Feb-1
3
Mar-
13
Apr-
13
May-1
3
Jun-1
3
Jul-13
Aug-1
3
Sep-1
3
Oct-
13
Nov-1
3
Dec-1
3
Jan-1
4
Feb-1
4
Mar-
14
Apr-
14
May-1
4
Jun-1
4
Jul-14
Aug-1
4
Sep-1
4
Oct-
14
Nov-1
4
Dec-1
4
Jan-1
5
Feb-1
5
Mar-
15
Mil
lio
ns
SAIF NAV Three years ending March 2015
($ in Millions)
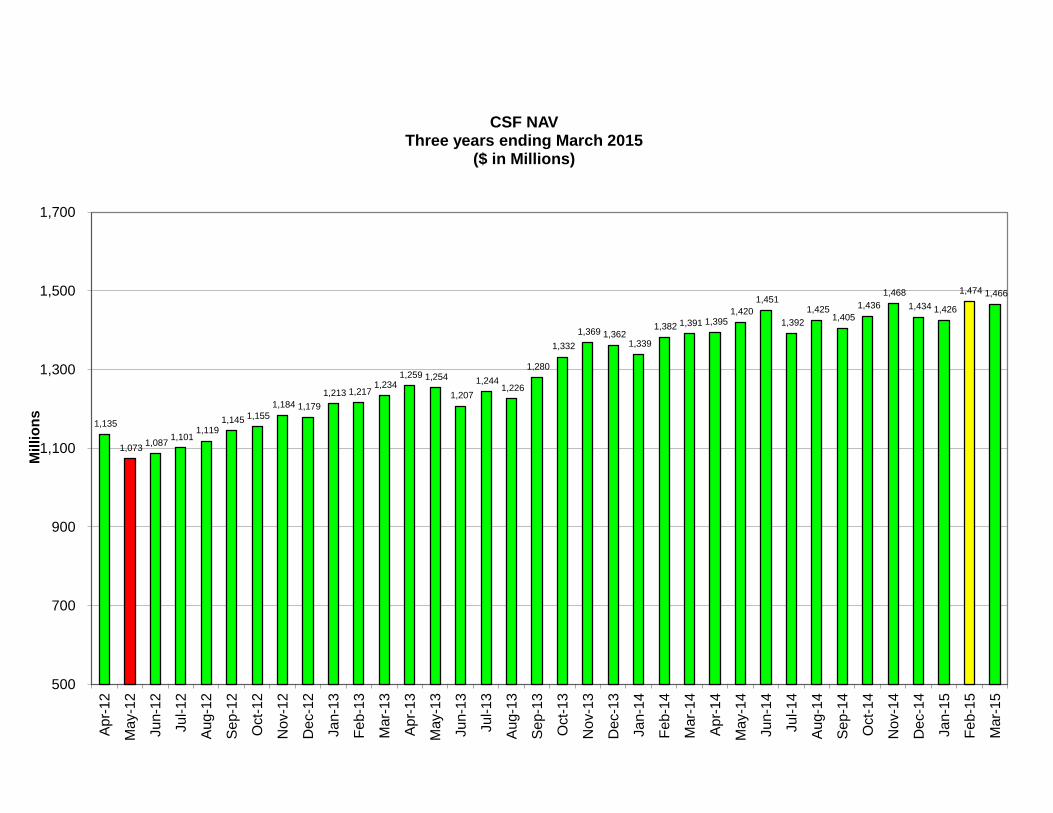
1,135
1,073 1,087
1,101 1,119
1,145 1,155
1,184 1,179
1,213 1,217 1,234
1,259 1,254
1,207
1,244 1,226
1,280
1,332
1,369 1,362 1,339
1,382 1,391 1,395 1,420
1,451
1,392
1,425 1,405
1,436
1,468
1,434 1,426
1,474 1,466
500
700
900
1,100
1,300
1,500
1,700
Apr-
12
May-1
2
Jun-1
2
Jul-12
Aug-1
2
Sep-1
2
Oct-
12
Nov-1
2
Dec-1
2
Jan-1
3
Feb-1
3
Mar-
13
Apr-
13
May-1
3
Jun-1
3
Jul-13
Aug-1
3
Sep-1
3
Oct-
13
Nov-1
3
Dec-1
3
Jan-1
4
Feb-1
4
Mar-
14
Apr-
14
May-1
4
Jun-1
4
Ju
l-1
4
Aug-1
4
Sep-1
4
Oct-
14
Nov-1
4
Dec-1
4
Jan-1
5
Feb-1
5
Mar-
15
Mil
lio
ns
CSF NAV Three years ending March 2015
($ in Millions)
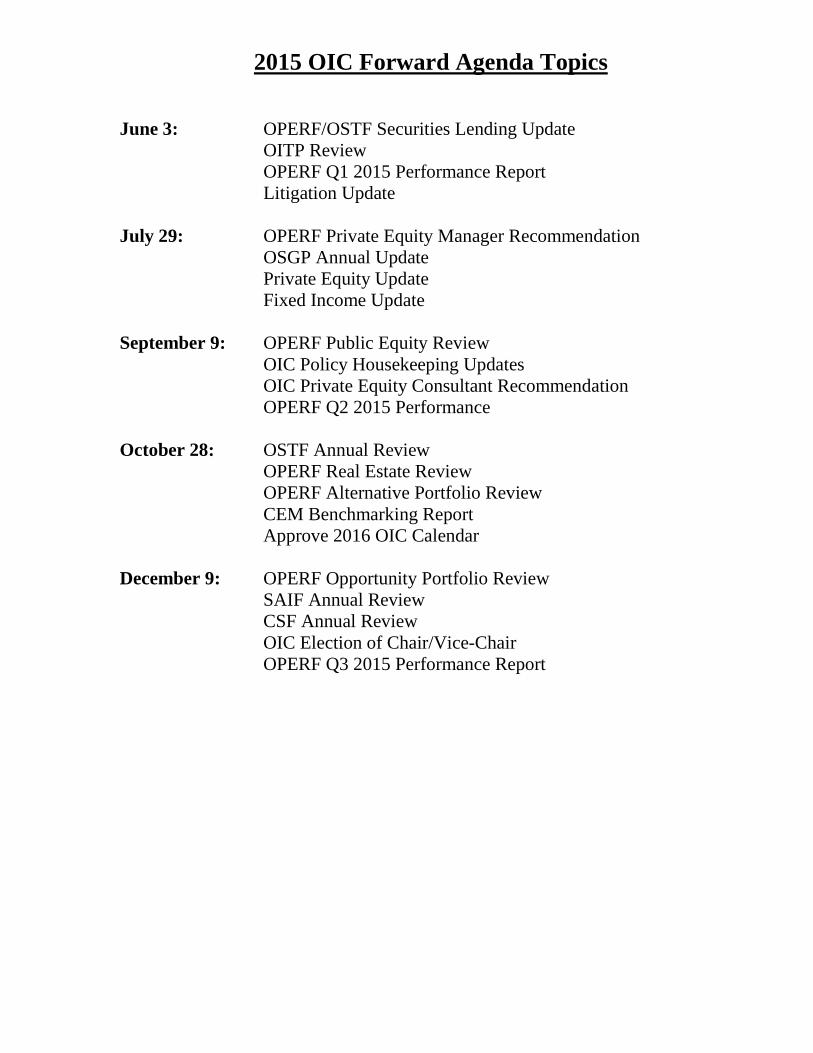
2015 OIC Forward Agenda Topics
June 3: OPERF/OSTF Securities Lending Update OITP Review OPERF Q1 2015 Performance Report Litigation Update
July 29: OPERF Private Equity Manager Recommendation OSGP Annual Update Private Equity Update Fixed Income Update
September 9: OPERF Public Equity Review OIC Policy Housekeeping Updates OIC Private Equity Consultant Recommendation OPERF Q2 2015 Performance
October 28: OSTF Annual Review OPERF Real Estate Review OPERF Alternative Portfolio Review CEM Benchmarking Report Approve 2016 OIC Calendar
December 9: OPERF Opportunity Portfolio Review SAIF Annual Review CSF Annual Review OIC Election of Chair/Vice-Chair OPERF Q3 2015 Performance Report