Embed Size (px)
Citation preview

Oregon Investment
Council April 26, 2017 9:00 AM
Oregon State Treasury
16290 SW Upper Boones Ferry Road Tigard, OR 97224
Rukaiyah Adams
Chair
John Skjervem
Chief Investment Officer
Tobias Read State Treasurer

Rukaiyah Adams John Russell Rex Kim Rick Miller, Jr. Tobias Read Steve Rodeman Chair Vice Chair Member Member State Treasurer PERS Director
OREGON INVESTMENT COUNCIL
Agenda
April 26, 2017
9:00 AM
Oregon State Treasury Investment Division
16290 SW Upper Boones Ferry Road Tigard, OR 97224
Time A. Action Items Presenter Tab 9:00-9:02 1. Review & Approval of Minutes Rukaiyah Adams 1 March 15, 2017 OIC Chair 9:02-9:10 2. Committee Reports and CIO Update John Skjervem 2 Chief Investment Officer 9:10-9:50 3. Morgan Stanley Prime Property Fund Tony Breault 3 OPERF Real Estate Portfolio Senior Investment Officer Christy Fields Pension Consulting Alliance, LLC
Scott Brown Morgan Stanley Investment Management
Claiborne Johnson Morgan Stanley Investment Management 9:50-10:45 4. Strategic Asset Allocation & Capital Market Assumptions Update Karl Cheng 4 OPERF Investment Officer Janet Becker-Wold Callan Associates Jim Callahan Callan Associates Allan Emkin Pension Consulting Alliance 10:45-11:00 -------------------- BREAK --------------------

Rukaiyah Adams John Russell Rex Kim Rick Miller, Jr. Tobias Read Steve Rodeman Chair Vice Chair Member Member State Treasurer PERS Director
OIC Meeting Agenda April 26, 2017 Page 2
11:00-11:20 5. Policy Updates Kim Olson 5 OPERF and other OST-managed Accounts Senior Policy Advisor Deena Bothello Acting General Counsel Jennifer Peet Director of Legal Affairs Michael Viteri Senior Investment Officer, Public Equity
B. Information Items 11:20-11:50 6. Alternatives Portfolio Review Ben Mahon 6 OPERF Senior Investment Officer, Alternatives Tom Martin TorreyCove Partners Jim Callahan 11:50-12:20 7. Opportunity Portfolio Review John Hershey 7 OPERF Director of Alternative Investments 12:20-12:40 8. State Accident Insurance Fund Perrin Lim 8 Annual Review Director of Capital Markets Kerry Barnett President & CEO Gina Manley, CPA Vice President, Finance & CFO 12:40-12:41 9. Asset Allocations & NAV Updates John Skjervem 9 a. Oregon Public Employees Retirement Fund b. SAIF Corporation c. Common School Fund d. Southern Oregon University Endowment Fund 12:41-12:42 10. Calendar — Future Agenda Items John Skjervem 10 12:42-12:55 11. Open Council Discussion Council Members C. Public Comment Invited 5 Minutes

TAB 1 – REVIEW & APPROVAL OF MINUTES
March 15, 2017 Regular Meeting

JOHN D. SKJERVEM CHIEF INVESTMENT OFFICER INVESTMENT DIVISION
PHONE 503-431-7900 FAX 503-620-4732
STATE OF OREGON
OFFICE OF THE STATE TREASURER 16290 SW UPPER BOONES FERRY ROAD
TIGARD, OREGON 97224
OREGON INVESTMENT COUNCIL MARCH 15, 2017
MEETING MINUTES Members Present: Rukaiyah Adams, Tobias Read, John Russell, Rex Kim, Rick Miller and
Steve Rodeman Staff Present: Darren Bond, John Skjervem, Deena Bothello, Karl Cheng, May Fanning,
Michael Langdon, Perrin Lim, Jen Plett, Jen Peet, James Sinks, Michael Viteri, Tony Breault, Amanda Kingsbury, Austin Carmichael, Dana Millican, Ricardo Lopez, William Hiles, Andrew Coutu, Jo Recht, Mark Selfridge, Ben Mahon, Kim Olson, John Hersehy, Debra Day, Tom Lofton, Chelsea Brossard, Garrett Cudahey, Angela Schaffers, Lisa Massena, Eric Messer, David Randall, Paola Nealon, AmyWojcicki
Consultants Present: Tom Martin, (TorreyCove); Christy Fields, Allan Emkin (PCA); Janet Becker-
Wold, and James Callahan (Callan) Legal Counsel Present: Steven Marlowe, Oregon Department of Justice The March 15th, 2017 OIC meeting was called to order at 9:00 am by Rukaiyah Adams, OIC Chair. I. 9: 01am Review and Approval of Minutes
MOTION: Mr. Russell moved approval of the February 1, 2017 OIC meeting minutes, and Mr. Kim seconded the motion which then passed by a 5/0 vote.
II. 9:27 am Committee Reports and CIO Update
Committee Reports: John Skjervem, OST Chief Investment Officer gave an update on the following committee actions taken since the February 1, 2017 OIC meeting: Private Equity Committee
February 2, 2017 KKR Asia Fund III, L.P. $250 million February 2, 2017 EnCap Energy Capital Fund XI, L.P. $250 million March 10, 2017 GI Partners Fund V, L.P. $250 million March 10, 2017 Genstar Capital Partners VIII, L.P. $150 million Alternatives Portfolio Committee None Opportunity Portfolio Committee None Real Estate Committee None Mr. Skjervem then reviewed progress for the Oregon investment program in 2016, and provided an outline of the program’s 2017 goals and objectives.

OREGON INVESTMENT COUNCIL March 15, 2017
Meeting Summary
2
According to Mr. Skjervem, 2016 program hi-lights including the following: • Completed division consolidation in and relocation to new Tigard office; • Hired and assimilated several new employees in various investment, operations and
administrative support positions; • Realized good investment performance in non-interest rate sensitive allocations; • Completed important asset class restructurings in fixed income, real estate and public equity; • Expanded and further refined Aladdin use in both capital markets transaction activities as well as
total fund risk management efforts; • Enhanced rigor and consistency of private markets due diligence and underwriting processes;
and • Improved data integrity (e.g., Operations team identified and resolved over $800M in reporting
errors last year).
Mr. Skjervem then noted the following as primary program goals in 2017: • Execute, execute, execute; • Recruit, hire and assimilate; • Insource additional fixed income and public equity mandates; • Maintain momentum and direction of real estate restructuring initiative; • Continue research in private market focus areas (e.g., portfolio monitoring, benchmarking,
performance calculation & risk measurement); • Complete currency project and improve integration of ESG and Corporate Governance activities; • Expand Aladdin use and expertise; and • Advance strategic partnership discussions with one or more key GP/manager relationships.
III. 09:28 am 2018 OIC Meeting Schedule
Mr. Skjervem presented the amended 2018 OIC Meeting Schedule. MOTION: Treasurer Read moved approval, and Mr. Kim seconded the motion which then passed by a 5/0 vote.
IV. 10:20 am Apollo Investment Fund IX, L.P. – OPERF Private Equity Portfolio Founded in 1990, Apollo Global Management is a publicly-traded, global alternative investment manager with approximately $189 billion of assets under management across three primary business segments (private equity, credit, and real estate) as of September 30, 2016. The Firm continues to be led by founding Managing Partners Leon Black (CEO), Joshua Harris, and Marc Rowan who have worked together for more than 30 years and currently oversee nearly 1,000 employees based in offices in New York, Los Angeles, Houston, London, Hong Kong, Singapore, and Mumbai. The Firm includes 24 Senior Partners and 106 total investment professionals who are focused on its global private equity practice. Private equity was Apollo’s original investment platform, and the Firm has raised more than $50 billion across eight funds since inception. Apollo is now targeting at least $20 billion for Fund IX as a continuation of its flagship, global private equity investment practice. Mike Langdon, Senior Investment Officer, Private Equity, recommended a capital commitment of up to $500 million to Apollo Investment Fund IX, L.P. which represents, in staff’s opinion, an attractive, core opportunity for the large buyout segment of the OPERF Private Equity portfolio. MOTION: Mr. Russell moved approval of the staff recommendation, and Mr. Kim seconded the motion which then passed by a 5/0 vote.
V. 10:26 am Fixed Income Policy Update – OPERF Fixed Income Portfolio

OREGON INVESTMENT COUNCIL March 15, 2017
Meeting Summary
3
Tom Lofton, Investment Officer, Fixed Income provided the OIC with an update on the OPERF Fixed Income Government strategy and requested Council approval of several guideline revisions recommended by staff. MOTION: Treasurer Read moved approval of the proposed guideline revisions, and Mr. Russell seconded the motion which then passed by a 5/0 vote.
VI. 11:06 am Securities Lending Update – OPERF/SAIF/CSF/OSTF/Agency Accounts
Perrin Lim, Director of Capital Markets introduced Mr. Robert “Bo” Jackson, Vice President, Senior Portfolio Manager, State Street Global Advisors and Mr. Johnson Shum, Vice President, Securities Finance, State Street Global Markets who provided an update and review of the securities lending program in place for OPERF, OSTF and other state agency funds.
VII. 11:23 am Overlay Review – OPERF
Karl Cheng, Investment Officer, Portfolio Risk & Research provided the OIC with an update on the OPERF overlay program, currently managed by Russell Investments.
VIII. 11:57 am Currency Project Update – OPERF
Jiangning (Jen) Plett, Senior Internal Investment Auditor and Karl Cheng delivered an update on the OPERF currency project and discussed various approaches to currency management.
IX. 12:14 pm Q4 2016 Performance & Risk Report – OPERF Karl Cheng and Janet Becker-Wold, Callan Associates presented the OPERF risk and performance report, respectively for the period ending December 31, 2016.
X. 12:15 pm Asset Allocation & NAV Updates Mr. Skjervem reviewed asset allocations and NAVs across OST-managed accounts for the period ended January 31, 2017.
XI. 12:16 pm Calendar – Future Agenda Items
A calendar listing of future OIC meetings and scheduled agenda topics was included in the Council’s meeting material.
XII. 12:16 pm Other Items None 12:16 pm Public Comments None
Ms. Adams adjourned the meeting at 12:16 pm. Respectfully submitted,
May Fanning Executive Support Specialist

TAB 2 – Committee Reports and CIO Update

Opening RemarksJohn D. Skjervem, Chief Investment Officer
April 26, 2017

April 26, 2017 OIC Meeting
Opening Remarks2
OPERF Currency Project
Context on Timing Facts v. Narratives Agnostic on Outcome
OPERF Strategic Asset Allocation
No SAA changes CMA Updates: more of the same (i.e., lower) Alpha assumption key
Alternatives Portfolio Review
Alts as the SAA “frontier” No longer at the kids table, but……… Oregon tradition: we expect success

TAB 3 – Morgan Stanley Prime Property Fund
OPERF Real Estate Portfolio

Morgan Stanley Prime Property Fund
Purpose Subject to the satisfactory negotiation of all terms and conditions with Staff working in concert with legal counsel, Staff recommends approval of an up to $250 million commitment to Morgan Stanley Prime Property Fund (“PPF” or the “Fund”) for the OPERF real estate portfolio. This proposed commitment represents a new relationship with Morgan Stanley Real Estate Investing (“MSREI”) for the OPERF real estate portfolio. Background Morgan Stanley was founded in 1935 and is a global financial services firm with securities underwriting, asset management, and wealth management services. Morgan Stanley maintains significant market positions in each of its business segments – Wealth Management, Investment Management, and Institutional Securities. Morgan Stanley Investment Management (“MSIM”) has more than $406 billion under management across multiple geographies, strategies, and asset classes, including equity, fixed income, alternatives, and private markets. MSREI resides within Real Assets, itself a part of MSIM and is Morgan Stanley’s global real estate investment management platform. MSREI was established in the early 1990s and is primarily focused on opportunistic and core strategies. MSREI has 17 offices across 13 countries throughout the U.S., Europe, and Asia. The Fund sponsor is Morgan Stanley Real Estate Advisor, Inc. (“MSREA”). PPF’s predecessor fund was originally formed in 1973 as a separate account for a life insurance company, The Equitable Life Assurance Society of the United States. The Fund was added to the NCREIF Fund Index – Open-Ended Diversified Core Equity Index (“NFI-ODCE Index”) upon the index’s formation in 1978 and was eventually acquired by Morgan Stanley in 2003. MSREA, as the Fund’s Advisor, is registered with the SEC as an investment advisor under the Investment Advisers Act of 1940. The Fund is established as a REIT and governed by an independently controlled Board of Directors that has delegated day-to-day management of the Fund to MSREA. The selection of PPF for OPERF’s real estate portfolio was the result of an analysis during which Staff and consultant evaluated all 24 funds currently included in the NFI-ODCE Index. Specifically, Staff and PCA reviewed each fund’s underlying assets, performance characteristics, sector and geographic exposures, and historical returns. An in-depth performance assessment was then conducted over different investment horizons using simulated bear or bull market conditions, while also comparing volatility and Sharpe ratios relative to the index. Strategy PPF is an Open-Ended Diversified Core Equity (ODCE) fund, and, at $20.9 billion GAV ($17.5 billion NAV), is the fourth largest fund within the NFI-ODCE Index comprising approximately 11% of current index capitalization. The objective of MSREA is to maintain a diversified portfolio of U.S. commercial real estate that offers stable, highly predicable cash flow returns. The product focus is primarily on high-quality office buildings, Class A multifamily communities, warehouse distribution and storage facilities, and top-tier regional malls and shopping centers in targeted primary markets across the U.S. MSREA may deploy up to 15% of the Fund’s capital into non-core assets, including development. As of Q3 2016, PPF had 8.8% of gross assets in non-core holdings compared to 7.4% for the index. PPF uses moderate leverage with a target range of 20-30%. As of Q3 2016, the Fund was below its target with 18.1% LTV vs. the index of 22.1%.

2
Unique to PPF is the ownership of two captive management platforms: AMLI Residential; and Safeguard Storage. These two platforms are wholly-owned by the Fund and provide property type expertise, asset management, and deal flow solely to the benefit of the Fund. The AMLI platform has been a consistently strong driver of returns and relative outperformance with multifamily apartments accounting for approximately 25% of Fund assets. Self-storage has been both a diversifier and accretive to fund-level returns, with this property type accounting for approximately 5% of PPF’s assets. Another key attribute, and complementary to OPERF’s broader real estate portfolio holdings, is PPF’s exposure to super regional malls, primarily via partnerships with public REITs, which the Fund has maintained an overweight position relative to the benchmark. Given the complexity and capital intense nature of the regional mall asset class, OPERF’s exposure has been limited to publicly-held securities within the REIT portfolio. Issues to Consider
Attributes:
Asset size and quality: PPF’s ten largest assets comprise nearly 28% of the Fund and the 25 largest assets comprise 46% of the Fund. PPF’s concentration of large assets, particularly in regional malls and CBD office assets with average market values over $500M, is complementary to OPERF’s existing separate account portfolio which generally does not have the scale to invest in such large properties.
Existing asset pool with ODCE governance: A commitment to PPF would provide OPERF immediate and transparent exposure to an existing portfolio of well-diversified, income-producing, core real estate assets, which Staff was able to underwrite with detailed levels of return attribution. Further, as a NFI-ODCE Index participant, the Fund’s strategy operates within pre-defined parameters and governance rules that all member funds must adhere to, thereby reducing the inherent risks of blind-pool commitments as well as the potential style-drift associated with less-defined and higher risk strategies and/or structures.
Alignment with OPERF Real Estate Strategic Plan: As an open-ended investment vehicle focused on long-term growth and deriving the majority of its returns from recurring income, a commitment to SPF is strategically aligned with the broader objectives established for the OPERF real estate portfolio, namely reduced return volatility and the pursuit of high quality, inflation-protected income streams.
Top-quartile performance: PPF has consistently outperformed, on a net of fee basis, the NFI-ODCE Index over the trailing one-, three-, five-, seven-, and ten-year periods as well as since its inception dating back to 1978. This outperformance has, in large part, been driven by MSREA’s investment focus on high quality assets located in prime markets and an asset management focus on delivering consistent net operating income growth. To a lesser extent, PPF has maintained a moderate exposure to value added investment acquisitions, via development and/or taking lease up risk, which has also been accretive to the long term performance of the Fund.
Team continuity and long-term track record: MSREA has 73 investment professionals dedicated to the Fund and located in four offices in the U.S. Officers within the management team have an average of 19 years with the Fund. Additionally, PPF was one of the founding funds within the NCREIF-ODCE Index created in 1978 and has an established track record of core real estate investing.
Concerns:
Lack of direct individual co-invest: Neither the employees of Morgan Stanley nor the firm directly co-invest into the Fund. [Mitigant: A significant portion of the management team’s compensation is tied to the performance of the Fund and bonus structures are directly correlated to both the Fund’s incentive fee and same store net operating income growth.]

3
Passive investment vehicle: The Fund has an Advisory Committee that meets annually and consists of larger investors within the Fund; however, the Advisory Committee only serves in an advisory role insofar as recommendations provided to either the Fund’s Advisor or the Independent Board of Directors is concerned. This approach is similar to other ODCE funds, all of which have narrowly defined investment parameters and a lower risk strategy and, hence, generally require a lower level of active oversight and engagement for investors than the typical closed-end fund. [Mitigant: Unlike closed-end fund structures with contract terms defined by the general partner, NFI-ODCE funds adhere to a uniform set of rules defined by participation within the NFI-ODCE Index. Investors can be assured of a homogenous set of governance and investment parameters across all ODCE funds, thereby minimizing conflicts of interest and the need for an advisory board and additional governance rights for investors.]
Imperfect liquidity: Consistent with other ODCE funds, investors can make redemption requests from PPF on a quarterly basis. However, liquidity is available only upon management’s discretion and MSREA is not required to liquidate assets to fulfill redemption requests. [Mitigant: Historically, larger ODCE funds have been able to provide redemption-related liquidity more readily than smaller funds.]
Terms The Fund’s management fees are unique relative to the majority of the NFI-ODCE Index peer group. PPF charges a flat asset management fee on net asset value that is the same for all investors, regardless of commitment size (the majority of funds in the index provide tiered discounts for larger investors). Furthermore, PPF’s fees include an incentive fee based upon improving net operating income for the trailing 12-month period (the majority of the index funds do not charge an incentive fee). The incentive fee does have a cap. In years when MSREA earns the maximum incentive fee, the Fund’s fee drag can be larger than its peer group. However, the incentive fee can provide a level of alignment between MSREA and investors as demonstrated by the Fund’s consistent outperformance to the benchmark over nearly all time periods on a net of fee basis. No placement agent had contact with Staff in connection with this commitment recommendation. Conclusion PPF represents an opportunity to invest in an existing pool of core real estate assets that are stabilized, income-producing, modestly-leveraged, and well-diversified by property type, market, tenant type, lease duration, and debt maturity. With an open-ended structure, the Fund allows for a level of liquidity not generally available within private real estate partnerships. Managed by a deep team with a strong track record relative to its index, PPF simultaneously provides immediate access to a significant component of the OPERF real estate benchmark (NFI-ODCE Index), and is in-line with the OPERF real estate portfolio’s long-term goal of achieving strong, risk-adjusted returns primarily through durable income streams.

TAB 4 – Strategic Asset Allocation &
Capital Market Assumptions Update
OPERF

Oregon State Treasury 2017 Capital Market Assumptions and OPERF Expected Returns and Risk
April 26, 2017
Janet Becker-Wold. CFA Denver Fund Sponsor Consulting
Jason Ellement, FSA, CFA Capital Markets Research
James Callahan, CFA San Francisco Fund Sponsor Consulting
Uvan Tseng, CFA San Francisco Fund Sponsor Consulting

1 Oregon State Treasury Knowledge. Experience. Integrity.
Callan 2017 – 2026 Capital Market Expectations
● Callan’s 10-year capital market expectations represent passive exposure (beta only), net of fees, except for private market investments – real estate, private equity and hedge funds.
Asset Class IndexExpected
Return RiskExpected
Return RiskExpected
Return RiskEquities
Broad Domestic Equity Russell 3000 6.85% 18.25% -0.50% -0.45% 7.35% 18.70%Large Cap S&P 500 6.75% 17.40% -0.50% -0.55% 7.25% 17.95%Small/Mid Cap Russell 2500 7.00% 22.60% -0.55% -0.15% 7.55% 22.75%Global ex-US Equity MSCI ACWI ex USA 7.00% 21.00% -0.55% -0.30% 7.55% 21.30%International Equity MSCI World ex USA 6.75% 19.70% -0.50% -0.35% 7.25% 20.05%Emerging Markets Equity MSCI Emerging Markets 7.00% 27.45% -0.60% -0.40% 7.60% 27.85%
Fixed IncomeShort Duration Barclays 1-3 Yr G/C 2.60% 2.10% 0.00% -0.15% 2.60% 2.25%Domestic Fixed Barclays Aggregate 3.00% 3.75% 0.00% 0.00% 3.00% 3.75%Long Duration Barclays Long G/C 3.20% 10.90% -0.50% -0.50% 3.70% 11.40%TIPS Barclays TIPS 3.00% 5.25% 0.00% -0.05% 3.00% 5.30%High Yield Barclays High Yield 4.75% 10.35% -0.25% -0.15% 5.00% 10.50%Non-US Fixed Barclays Global Aggregate ex-USD 1.40% 9.20% 0.00% 0.00% 1.40% 9.20%Emerging Market Debt EMBI Global Diversified 4.50% 9.60% -0.10% -0.30% 4.60% 9.90%
OtherReal Estate Callan Real Estate Database 5.75% 16.35% -0.25% -0.10% 6.00% 16.45%Private Equity TR Post Venture Capital 7.35% 32.90% -0.80% 0.10% 8.15% 32.80%Hedge Funds Callan Hedge FoF Database 5.05% 9.15% -0.20% -0.15% 5.25% 9.30%Commodities Bloomberg Commodity 2.65% 18.30% -0.10% -0.20% 2.75% 18.50%Cash Equivalents 90-Day T-Bill 2.25% 0.90% 0.00% 0.00% 2.25% 0.90%
Inflation CPI-U 2.25% 1.50% 0.00% 0.00% 2.25% 1.50%
The Expected Return is the 10-year annualized (geometric) return.
2016 - 20252017 - 2026 Difference

2 Oregon State Treasury Knowledge. Experience. Integrity.
Oregon Custom 2017 – 2026 Capital Market Expectations
● Capital market expectations for Private Equity and Real Assets are customized to Oregon’s unique experience and implementation.
● The Diversifying Strategies asset class is assumed to outperform a global 60/40 portfolio by .4%.
Asset Class IndexExpected
Return RiskExpected
Return RiskExpected
Return RiskEquities
Global Equity OIC Blend1 7.1% 19.5% 0.0% 0.0% 7.1% 19.5%Private Equity OIC Private Equity 7.4% 32.9% 2.1% -6.6% 9.5% 26.3%
Fixed IncomeFixed Income BB Aggregate 3.0% 3.8% 0.0% 0.0% 3.0% 3.8%
Inflation SensitiveReal Assets OIC Real Assets 5.8% 16.4% 0.8% -1.4% 6.6% 15.0%
OtherDiversifying Strategies Global 60/40 5.8% 11.0% 0.4% 0.0% 6.2% 11.0%
1 - 41% Large Cap US equity / 8% Small/mid Cap US equity / 34% Global ex-US equity / 12% Emerging Markets equity / 5% International Small Cap equity
Customized Oregon State TreasuryCallan Difference
2017 - 2026 Capital Market Expectations

3 Oregon State Treasury Knowledge. Experience. Integrity.
Rationale for Difference In Private Equity Assumptions
● Private equity expected return is a function of the same arithmetic return and lower risk – “Volatility drag” has a much larger impact on Callan’s return expectation. – Oregon private equity risk was determined to fall between observed volatility (17%) and Callan’s risk estimate
(32.9%). – Observed volatility reflects subjective asset valuation and pricing lags; it may not capture all risks associated
with the asset class (e.g. illiquidity risk, implementation risk, leverage risk). – Callan’s estimate of risk reflects illiquidity risk, typical amounts of leverage, and manager implementation risk.
2017 Expectations
Asset ClassArithmetic
Return RiskExpected
ReturnPrivate Equity
Oregon Portfolio Expectations 12.5% 26.3% 9.5%Callan Standard Expectations 12.5% 32.9% 7.4%Difference 0.0% -6.6% 2.1%
1 - The Expected Return is a 10-year annualized (geometric) return derived from the arithmetic return and associated risk
1

4 Oregon State Treasury Knowledge. Experience. Integrity.
Rationale for Difference In Real Assets Assumptions
● Real Assets expected return is a function of higher arithmetic return and lower risk. – Callan’s standard risk-return expectations are based on the NCREIF benchmark and represent open-
ended core real estate only. – Observed volatility of NCREIF is 3-4% (rolling 12-quarter standard deviation over 10-20 years). – Callan’s estimate of risk reflects illiquidity risk, typical amounts of leverage, and manager implementation
risk. – Historically, the OPERF real estate program has more than double the risk of NCREIF due to
investments in value-added real estate, opportunistic real estate and REITs. – As a result, higher return and risk relative to a core real estate program are expected.
Asset ClassArithmetic
Return RiskExpected
ReturnReal Assets
Oregon Portfolio Expectations 7.6% 15.0% 6.6%Callan Standard Expectations 6.9% 16.4% 5.8%Difference 0.7% -1.4% 0.8%
1 - The Expected Return is a 10-year annualized (geometric) return derived from the arithmetic return and associated risk
1
2017 Expectations

5 Oregon State Treasury Knowledge. Experience. Integrity.
Oregon 2017 – 2026 Portfolio Risk/Return Results
● The New Target was recommended to the OIC in the 2015 asset liability study to further diversify the portfolio, enhance risk-adjusted returns and improve liquidity.
● Above calculations utilize Oregon’s 2017-2026 customized assumptions.
Asset Class Current Target Chg from Target New TargetGlobal Equity 37.5% 0.0% 37.5%Private Equity 20.0% -2.5% 17.5%Fixed Income 20.0% 0.0% 20.0%Real Assets 20.0% 0.0% 20.0%Diversifying Strategies 2.5% 2.5% 5.0%Total 100.0% 0.0% 100.0%
Expected Return 7.1% -0.1% 7.1%Risk 14.6% -0.5% 14.1%Sharpe Ratio 0.33 0.01 0.34

6 Oregon State Treasury Knowledge. Experience. Integrity.
Change From 2015
● Expected return of Current and New Target declined 50 and 40 bps respectively from 2015 (shaded in green).
● The reduction is mostly due to lower return expectations for public and private equity.
Asset ClassExpected
Return RiskExpected
Return RiskExpected
Return Risk Equities Global Equity 7.8% 19.6% -0.7% -0.1% 7.1% 19.5%
Private Equity 10.3% 24.0% -0.7% 2.3% 9.5% 26.3%
Fixed Income Fixed Income 3.0% 3.8% 0.0% 0.0% 3.0% 3.8%
Inflation Sensitive Real Assets 7.0% 15.0% -0.4% 0.0% 6.6% 15.0%
Other Diversifying Strategies 6.4% 11.0% -0.2% 0.0% 6.2% 11.0%
Current Target* 7.6% 14.4% -0.5% 0.2% 7.1% 14.6% New Target* 7.5% 14.0% -0.4% 0.1% 7.1% 14.1%
2015-2024 Difference 2017-2026Customized OPERF
* Current Target = 37.5% public equity; 20% private equity; 20% fixed income; 20% real assets; 2.5% diversifying strategies New Target = 37.5% public equity;17.5% private equity; 20% fixed income; 20% real assets; 5.0% diversifying strategies

CAPITAL MARKET ASSUMPTIONS AND PORTFOLIO REVIEW
OPERF
April 2017

Pension Consulting Alliance LLC • Presentation to OIC 2
2017 10-Year Capital Market Assumptions: Overview
• PCA’s capital market assumptions are in-line with peers and generally near the median
Data is sorted by expected compound return from highest to lowest
0.00%
1.00%
2.00%
3.00%
4.00%
5.00%
6.00%
7.00%
8.00%
9.00%
10.00%
0.00% 5.00% 10.00% 15.00% 20.00% 25.00% 30.00% 35.00%
10-Y
ear E
xpec
ted
Com
poun
d Re
turn
Standard Deviation
2017 Capital Market Assumptions Comparison
US Equity
Fixed Income
Real Estate
Private EquityPCA
PCA (unlevered)
PCA
PCA
FirmGeo.
ReturnArith.
ReturnRisk Firm
Geo. Return
Arith.Return
Risk FirmGeo.
ReturnArith.
ReturnRisk Firm
Geo. Return
Arith. Return
Risk
Robeco 8.00% 9.50% 18.00% Robeco 3.50% 3.50% 3.00% AON Hewitt 7.50% 8.50% 15.00% AON Hewitt 9.30% 12.00% 24.50%AON Hewitt 7.20% 8.80% 18.50% Callan 3.00% 3.10% 3.75% Robeco 6.00% 6.50% 10.00% PCA 8.50% 11.75% 27.00%Callan 6.85% 8.40% 18.25% JPM 3.00% 3.10% 3.50% JPM 6.00% 7.40% 17.00% Robeco 8.00% 10.90% 25.00%JPM 6.25% 7.30% 14.75% SSGA 3.00% 3.20% 5.50% Voya 5.80% 7.90% 21.20% JPM 8.00% 9.90% 20.50%PCA 6.25% 8.00% 19.50% PCA 2.90% 3.05% 5.50% Callan 5.75% 7.00% 16.35% SSGA 7.40% 10.30% 25.00%SSGA 6.10% 7.30% 16.00% AON Hewitt 2.60% 2.60% 3.00% PCA - unlevered 5.00% 5.50% 10.00% Callan 7.35% 12.30% 32.90%Voya 5.00% 6.30% 16.70% Voya 2.50% 2.80% 7.10% SSGA 4.90% 6.60% 19.00% BlackRock 5.80% 8.60% 24.60%BlackRock 4.90% 6.00% 15.50% BlackRock 1.60% 1.70% 5.10% BlackRock 3.00% 4.10% 15.30%
US Equity Fixed Income Private EquityReal Estate

Pension Consulting Alliance LLC • Presentation to OIC
Efficient Frontier Analysis
Min MaxGlobal Equity 30 100Private Equity 0 25OIC Real Estate 0 25 OIC Fixed Income 10 100OIC Liquid Alts 0 100OIC Il l iquid Alts 0 100
1 2 3 4 5 6 7 8 9 10 11 12 13 14 15 CP 60/40Risk (StDev) 8.2% 8.2% 8.3% 8.5% 8.7% 9.1% 9.4% 9.8% 10.3% 10.8% 11.5% 12.4% 13.5% 14.7% 16.4% 13.0% 12.9%
Geometric Return 5.4% 5.6% 5.9% 6.1% 6.4% 6.6% 6.8% 7.1% 7.3% 7.5% 7.7% 7.8% 8.0% 8.1% 8.1% 7.5% 5.9%Sharpe Ratio 0.42 0.45 0.48 0.50 0.51 0.52 0.53 0.54 0.54 0.54 0.52 0.51 0.49 0.47 0.43 0.46 0.34
Global Equity 30% 30% 30% 30% 30% 30% 30% 30% 30% 30% 30% 30% 30% 30% 40% 38% 60%
Private Equity 0% 0% 0% 0% 0% 0% 0% 0% 0% 1% 7% 13% 18% 24% 25% 18% 0%
OIC Real Estate 8% 10% 12% 14% 16% 18% 20% 22% 22% 25% 25% 25% 25% 25% 25% 13% 0%
OIC Fixed Income 56% 51% 45% 40% 35% 30% 24% 19% 13% 10% 10% 10% 10% 10% 10% 20% 40%OIC Liquid Alts 6% 10% 13% 16% 19% 23% 26% 29% 32% 29% 26% 22% 17% 11% 0% 6% 0%
OIC Il l iquid Alts 0% 0% 0% 0% 0% 0% 0% 0% 3% 5% 2% 0% 0% 0% 0% 7% 0%
Allocation Constraints
12
34
56
78
910
1112
1314 15
Current Portfolio
60/40
5.0%
5.5%
6.0%
6.5%
7.0%
7.5%
8.0%
8.5%
7.5% 8.5% 9.5% 10.5% 11.5% 12.5% 13.5% 14.5% 15.5% 16.5%
Geom
etri
c Re
turn
Risk (Standard Deviation)
Efficient Frontier
Sharpe Ratio: 0.46
Sharpe Ratio: 0.34

Pension Consulting Alliance LLC • Presentation to OIC
Summary of Investment Class Assumptions
2017 PCA Generic Capital Market Assumptions
Expected Arithmetic
Average Nominal
Annual Return
Expected Geometric
Compound Nominal
Annual Return
Expected
Risk of Nominal Returns
(Annl. SD)
Cash TIPS TSY CoreFxd Credit RealEst USEq IntlEq GlblEq HIntlEq PrivEq
Cash 2.25 2.25 1.50 Treasury Infl. Protected Securities 3.00 2.75 7.00 0.20 US Treasuries Only Fixed Income 2.35 2.10 7.00 0.30 0.50
US Core Fixed Income 3.05 2.90 5.50 0.25 0.60 0.40 US Credit Fixed Income 3.75 3.50 7.00 0.00 0.65 0.00 0.75
Core Real Estate 5.50 5.00 10.00 0.30 0.00 0.00 0.00 0.00 Domestic Equity 8.00 6.25 19.50 0.00 0.00 -0.25 0.20 0.40 0.40
International Equity 9.50 7.25 22.00 0.00 0.00 -0.35 0.10 0.20 0.30 0.80 Global Equity 9.00 7.15 20.00 0.00 0.00 -0.30 0.15 0.30 0.35 0.90 0.90
Hedged International Equity 9.35 7.40 20.50 0.00 0.00 -0.30 0.10 0.30 0.35 0.85 0.90 0.90 Private Equity/Venture Capital 11.75 8.50 27.00 0.00 0.00 -0.30 0.00 0.30 0.30 0.85 0.80 0.80 0.80
Inflation 2.25 2.25 1.50 0.50 0.45 -0.10 0.00 0.10 0.35 0.20 0.20 0.20 0.20 0.10
1. Assumption was based on a 32% Core (20% leveraged) and 68% Non-Core allocation modeled with a private equity profile 2. Assumption was based on 46% BC Aggregate, 37% BC US Treasury, and 17% BC High Yield allocation 3. Assumption was based on 60% Risk Premia and 40% Systematic Trend Following allocation 4. Assumption was based on 60% Infrastructure (40% leverage) and 40% Natural Resources/Agriculture/Mining (25% leverage) allocation
OIC Specific Class
Assumptions
Expected Arithmetic Average Annual Return
Expected GeometricC
ompound Nominal Annual Return
Expected Risk of
Nominal Returns
Global Equity Private Equity OIC Real Estate
OIC Fixed Income OIC Liquid Alts
Global Equity 9.00 7.15 20.00 Private Equity 11.75 8.50 27.00 0.80 OIC Real Estate1 9.90 7.90 21.00 0.10 0.50 OIC Fixed Income2 3.20 2.90 7.70 0.20 0.00 -0.20
OIC Liquid Alts3 7.00 6.10 14.00 0.00 0.00 0.30 0.30
OIC Illiquid Alts4 7.80 6.80 14.90 0.60 0.30 0.30 0.50 0.20

DISCLOSURES: This document is provided for informational purposes only. It does not constitute an offer of securities of any of the issuers that may be described herein. Information contained herein may have been provided by third parties, including investment firms providing information on returns and assets under management, and may not have been independently verified. The past performance information contained in this report is not necessarily indicative of future results and there is no assurance that the investment in question will achieve comparable results or that the Firm will be able to implement its investment strategy or achieve its investment objectives. The actual realized value of currently unrealized investments (if any) will depend on a variety of factors, including future operating results, the value of the assets and market conditions at the time of disposition, any related transaction costs and the timing and manner of sale, all of which may differ from the assumptions and circumstances on which any current unrealized valuations are based.
Neither PCA nor PCA’s officers, employees or agents, make any representation or warranty, express or implied, in relation to the accuracy or completeness of the information contained in this document or any oral information provided in connection herewith, or any data subsequently generated herefrom, and accept no responsibility, obligation or liability (whether direct or indirect, in contract, tort or otherwise) in relation to any of such information. PCA and PCA’s officers, employees and agents expressly disclaim any and all liability that may be based on this document and any errors therein or omissions therefrom. Neither PCA nor any of PCA’s officers, employees or agents, make any representation of warranty, express or implied, that any transaction has been or may be effected on the terms or in the manner stated in this document, or as to the achievement or reasonableness of future projections, management targets, estimates, prospects or returns, if any. Any views or terms contained herein are preliminary only, and are based on financial, economic, market and other conditions prevailing as of the date of this document and are therefore subject to change.
The information contained in this report may include forward-looking statements. Forward-looking statements include a number of risks, uncertainties and other factors beyond the control of the Firm, which may result in material differences in actual results, performance or other expectations. The opinions, estimates and analyses reflect PCA’s current judgment, which may change in the future.
Any tables, graphs or charts relating to past performance included in this report are intended only to illustrate investment performance for the historical periods shown. Such tables, graphs and charts are not intended to predict future performance and should not be used as the basis for an investment decision.
All trademarks or product names mentioned herein are the property of their respective owners. Indices are unmanaged and one cannot invest directly in an index. The index data provided is on an “as is” basis. In no event shall the index providers or its affiliates have any liability of any kind in connection with the index data or the portfolio described herein. Copying or redistributing the index data is strictly prohibited.
The Russell indices are either registered trademarks or trade names of Frank Russell Company in the U.S. and/or other countries.
The MSCI indices are trademarks and service marks of MSCI or its subsidiaries.
Standard and Poor’s (S&P) is a division of The McGraw-Hill Companies, Inc. S&P indices, including the S&P 500, are a registered trademark of The McGraw-Hill Companies, Inc.
CBOE, not S&P, calculates and disseminates the BXM Index. The CBOE has a business relationship with Standard & Poor's on the BXM. CBOE and Chicago Board Options Exchange are registered trademarks of the CBOE, and SPX, and CBOE S&P 500 BuyWrite Index BXM are servicemarks of the CBOE. The methodology of the CBOE S&P 500 BuyWrite Index is owned by CBOE and may be covered by one or more patents or pending patent applications.
The Barclays Capital indices (formerly known as the Lehman indices) are trademarks of Barclays Capital, Inc.
The Citigroup indices are trademarks of Citicorp or its affiliates.
The Merrill Lynch indices are trademarks of Merrill Lynch & Co. or its affiliates.
FTSE is a trademark of the London Stock Exchange Group companies and is used by FTSE under license. All rights in the FTSE indices and/or FTSE ratings vest in FTSE and/or its licensors. No further distribution of FTSE data is permitted with FTSE’s express written consent.

CMA Summary Based on its consultants’ recommendations, the OIC formally adopts a set of capital
market assumptions through approval of policy (INV 1203). Current set of projected returns includes considerable dispersion (ex-active
component) among our consulting partners:
* Table output generated by OST staff using data from Callan, PCA and BlackRock.
20-year projections also have very wide error ranges which render incremental adjustments to return forecasts not particularly meaningful (i.e., slight adjustments to the projected signal are inconsequential relative to the magnitude of the accompanying noise).
Primary emphasis should be on process methodology which in this case is robust.
Expected Return Callan PCA BlackRock
Global Equity 7.1% 7.2% 6.2% Private Equity 9.5% 8.5% 6.8% Fixed Income 3.0% 2.9% 3.1% Real Estate 6.6% 8.0% 4.2% Alternatives 6.8% 6.9% 3.6% OPERF* 7.1% 7.4% 5.7%
“Prediction is very difficult, especially about the future.” - Niels Bohr (and Yogi Berra?)

PURPOSE 1. This Statement of Investment Objectives and Policy Framework (the "Statement") summarizes the
philosophy, objectives and policies approved by the Oregon Investment Council (the “OIC” or the "Council") for the investment of Oregon Public Employees Retirement Fund ("OPERF" or the "Fund") assets.
2. The Council approved these objectives and framework after careful consideration of OPERF benefit provisions, and the implications of alternative objectives and policies.
3. The Statement has been prepared with five audiences in mind: 1) incumbent, new and prospective Council members; 2) Treasury staff; 3) active and retired Oregon Public Employees Retirement System (OPERS) members; 4) the Oregon State Legislature and Governor; and 5) agents engaged by the Council to manage and administer Fund assets.
4. The Statement summarizes more detailed policy and procedure documents prepared and maintained by the staff of the Oregon State Treasury ("OST"), and numerous other documents that govern the day-to-day management of OPERF assets including agent agreements, individual investment manager mandates and limited partnership documents.
5. The Council regularly assesses the continued suitability of its approved investment objectives and policies, initiates change as necessary and updates these documents accordingly.
INVESTMENT OBJECTIVE 1. Subject to ORS 293.721 and 293.726, the investment objective for the Regular Account is earning,
over rolling, consecutive twenty-year periods, an annualized return that equals or exceeds the actuarial discount rate (ADR) approved by the Public Employees Retirement Board (PERB) and used to value OPERF liabilities.
2.1. The Council believes, based on the assumptions outlined herein, that the investment policies summarized in this document will provide the highest probability of achieving this objective,possible return at a level of risk that is acceptable toappropriate for active and retired OPERF members. The Council evaluates risk in terms of both short-term asset price volatility and long-term plan viability (specifically, the probability of not achieving the actuarial discount rate (ADR) over a consecutive, twenty-year time horizon. ).
2. Subject to ORS 293.721 and 293.726 and the risk parameters described directly above, the investment objective for the Regular Account is earning an annualized return that equals or exceeds the ADR that is approved by the Public Employees Retirement Board (“PERB”) and used by PERB actuaries to value OPERF liabilities. The return projection period comprises a consecutive, twenty-year time horizon that matches the period PERB and its actuaries consider in their analyses.
3. Historically, members were allowed to direct up to 75% of their contributions to the Variable Account. While no longer receiving new contributions, the Variable Account's objective remains investment performance consistent with the MSCI All Country World Investable Market Index. .
4. The Council has established investment objectives for individual asset classes that are also summarized in this Statement.
POLICY ASSET MIX, RISK DIVERSIFICATION AND RETURN EXPECTATIONS
1. After careful consideration of OPERF's investment objective, liability structure, funded status and liquidity needs, as well as the return, risk and diversification characteristics of different asset classes, the Council approved the asset mix policy presented in Exhibit 1 for the OPERF Regular Account. The Council's total fund asset mix policy and active management return expectations are also summarized in Exhibit 1.

2. Of its total assets, 55 percent of OPERF is targeted for investment in equities, inclusive of private equity. Equity investments have generated the highest returns over long time periods, but can also produce low and even negative returns over shorter time periods.
3. The risk of low returns over shorter time periods makes 100% equity policies unsuitable for most pension funds, including OPERF. By investing across multiple equity asset classes, and in lower return but less risky fixed- income and real estate assets, the Council is managing and diversifying the Fund's overall risk.
4. Specific asset class exposures are maintained within the ranges outlined in Exhibit 1. 5.4. At a 7.6% expected annual return, the Fund has a 50% probability of earning an annualized return
equal to or exceeding its actuarial discount rate over a consecutive 20-year horizon or, approximately, the next two to three market cycles. Exhibit 1: Policy Mix and Return Expectations for OPERF Regular Account
Asset Class Target
Allocation (%)
Re-balancing
Range (%)
Expected Annual
Policy Return1,
2 (%)
Expected Annual Active
Management Return (net
of fees) (%)
Expected Annual
Total Return
(%)
Public Equities 37.5 32.5-42.5 7.81 0.75 8.67.9
Private Equity 17.5 14-21 10.29.5 0.7 10.9.5
Total Equity 55 50-60
Fixed Income 20 15-25 3.0 0.25 3.343
Real Estate 12.5 9.5-15.5 6.7.0 0.50 7.52
Alternatives 12.5 0-12.5 6.43 0.5 6.93
Total FundFund2 100 7.01 0.639 7.65
1 Based on capital market forecasts developed by the Council's investment consultant, Callan Associates, for the next two to three market cycles. 2 Total Fund expected returns are simply calculated geometrically using the investment consultant’s forecasts for the arithmetic returns and covariances of the asset classes. Accordingly, the Total Fund’s expected returns are not equivalent to the weighted averagesaverage of the individual asset class returns. The policy mix's geometric mean return expectation is approximately 7.9%. listed in the Exhibit.
6.5. The policy mix's 7.65% average annual return expectation was developed with reference to observed long-term relationships among major asset classes, adjusted to account for current market

conditions. The Council believes this return expectation is reasonable, but recognizes that over shorter time periods, actualrealized returns can deviate significantly from expectations – both positively and negatively.
7.6. U.S. equity, non-U.S. equity, and fixed- income asset classes are managed using both passive and active management strategies. Active management of the Fund's public market equity and real estate allocations is expected to earn respectively a 0.75% and a 0.5025% per annum return premium over rolling, consecutive five-year periods (and relative to those allocation's respective benchmarks). The Council recognizes that unsuccessful active management can reduce total fund returns.
8.7. The OIC has allocated up to 3.0% of total Fund assets for investment in an Opportunity Portfolio, the objective of which is to provide enhanced returns and better diversification for OPERF. Investments in the Opportunity Portfolio are expected to comprise a combination of both shorter-term (1-3 year) and longer-term holdings. The Opportunity Portfolio has no strategic target since, by definition, eligible investments will only be pursued on an opportunistic or episodic basis; moreover, the Opportunity Portfolio allocation shall not result in an allocation range breach for any of the other five, primary asset class allocations.
9.8. OPERF cash balances are invested in the Oregon Short Term Fund and managed to levels that are deliberately minimized but still sufficient to cover OPERF's short-term cash flow needs.
10.9. In an effort to minimize cash balances at both the fund and manager level, the OIC has retained an overlay manager to more closely align the actual Fund portfolio with the approved policy mix, generally through the purchase and sale of futures contracts to increase or decrease specific asset class exposures, as necessary.
11.10. The Council shall review, at least biennially, its expectations for asset class and active management performance, and assess how the updated expectations affect the probability that the Regular Account will achieve its investment objective.
PASSIVE AND ACTIVE MANAGEMENT 1. Passive management uses lower cost index funds to access the return streams available from the
world's capital markets. Active management tries to earn higher returns than those available from index funds through the application of manager skill in the form of sector and security selection as well as market and/or asset mix timing decisions.
2. The Council uses passive management to control costs, evaluate active management strategies, capture exposure to efficient market segments, manage tracking error and facilitate policy mix re-balancing activities. Exchange-traded real estate investment trusts (REITSREITs) may also be used to maintain the Fund's real estate exposure within specified policy ranges.
3. The Council approves active management of Fund assets when proposed active strategies offer sufficiently high expected incremental returns, net of fees, and when the magnitude of potential under-performance can be estimated, monitored and managed.
4. The Council must accept active management in those asset classes for which there are no passive management alternatives,; in particular, real estate, private equity and other alternative and opportunistic investment strategies. 4.5
5. The Council prefers active management strategies that emphasize sector and/or security selection decisions rather than market and/or asset mix timing decisions as the former are much better supported by professional experience and academic research. 4.6
4.6. At the aggregate level of the Regular Account, active management strategies authorized by the Council are expected to add 0.64% of annualized excess return, net of fees, over rolling, consecutive five-year periods. Relative to the policy benchmark, Regular Account active risk shall be managed to a 2 to 3 percent annualized tracking error target.

PUBLIC EQUITY STRATEGY 1. OPERF's public equity allocation is managed with the objective of earning at least 75 basis points in
annualized net excess return relative to the MSCI All Country World Investable Market Index (ACWI IMI – net) (unhedged) over rolling, consecutive five-year periods. Relative to that same benchmark, active risk shall be managed to a 0.75 to 2.0 percent annualized tracking error target.
2. Key elements of the strategy: include the following: a. In an effort to enhance return, maintain an over-weight to small capitalization stocks and other
well supported sources of return premia. These strategic overweights or "tilts" are based on and supported by robust empirical research that historically links persistent and pervasive evidence of excess returns to systematic "factor exposures" such as size (i.e., small cap), value and momentum. Implementation of other factor tilts may be considered at the manager, strategy or mandate level upon approval of both the Chief Investment Officer (CIO) and OIC.
b. Multiple, specialist active managers with complementary investment styles are employed. For example, some OPERF managers focus on growth stocks, some on value stocks, some on large capitalization stocks and others on small capitalization stocks. This diversified approach produces more consistent excess return opportunities and minimizes the Fund's exposure to any single investment organization.
c. Active management is more common within OPERF's non-U.S. equity allocation because non-U.S. markets appear to provide more opportunities for the successful application of manager skill.
d. Managers with skills in security selection and country allocation are utilized as these attributes have been shown to be the principal sources of excess returns in non-U.S. equity portfolios. In addition, managers who have demonstrated an ability to add value through currency management are permitted to do so.
e. Aggregate exposures to countries, economic sectors, investment styles and market capitalization tiers are monitored and managed relative to corresponding benchmark exposures.
FIXED INCOME STRATEGY 1. OPERF's fixed income allocation is managed with the objective of earning 25 basis points in
annualized, net excess returns relative to a blended benchmark comprised of 46% Bloomberg Barclays U.S. Aggregate Index, 37% Bloomberg Barclays U.S. Treasury Index, 13% S&P/LSTA Leveraged Loan Index and 4% Bank of America Merrill Lynch High Yield Master II Index over rolling, consecutive five-year periods. Relative to the above-described benchmark, active risk with the OPERF fixed income allocation is managed to a 0.5 to 1.0 percent annualized tracking error target.
2. Key elements of the strategy: include the following: a. At least 70%A significant proportion of the OPERF fixed income allocation is actively
managed due to performance and cost considerations. Specifically, excess returns from active fixed income management are more likely as many investors hold fixed income securities to meet regulatory and liability matching objectives, and hence are not total return oriented. This market dynamic produces systematic mis-pricings of fixed income securities that skilled investment managers can exploit. Active fixed income management fees are also much lower than active equity management fees.
b. Multiple active generalist managers will be used for a majority of the fixed income asset class, rather than the specialist manager approach used within OPERF's public equity allocation. However, the OIC may utilize specialist fixed income managers as warranted or necessary, although fixed income manager mandates generally have little impact on the Fund's total risk due to fixed income's lower overall Fund allocation and fixed income managers' generally low

tracking error. c. Fixed income managers are selected for their skills in issue selection, credit analysis, sector
allocations and duration management. d. Aggregate exposures to duration, credit and sectors are monitored and managed relative to
corresponding exposures in the fixed income allocation benchmark.
REAL ESTATE STRATEGY 1. OPERF's real estate allocation is managed with the objective of earning at least 50 basis points in
annualized, net excess returns relative to the NCREIF Fund Index – Open End Diversified Core Equity (NFI-ODCE)), net of management fees, over rolling, consecutive five-year periods. Because 80% of the Fund's real estate investments are illiquid and/or traded infrequently, conventional risk budget concepts are not applicable.
2. Key elements of the strategy: include the following: a. Real Estate is 100% actively managed because a passive replication of the full breadth and
depth of the real estate asset class is not viable. b. Core property investments represent 55% of the Fund's real estate allocation, with a range of
45% to 65%. Specialist managers are utilized. Risk is diversified by investing across the following major property types: office; apartments; retail; and industrial. The OPERF real estate allocation may also include structured investments in alternative property types with Core-like risk and return attributes.
c. Exchange traded real estate investment trusts (REITs) represent 5% of the Fund's real estate allocation, with a range of 0% to 10%. Active management will include style and capitalization specialists, as well as broad market managers. Up to 50% of the REIT exposure may be invested in markets outside the United States.
d. Value Added property investments represent 20% of the OPERF real estate allocation, with a range of 10% to 30%, and may include direct investments in each of the property types listed above, as well as structured investments in alternative property types. Risk is diversified by property type and geography.
e. Opportunistic property investments represent 20% of the OPERF real estate allocation, with a range of 10% to 30%. Relative to Core and Value Added strategies, real estate investments will be characterized as "opportunistic" based on higher risk/return expectations and other prevailing market conditions.
f. Within its real estate allocation, the Fund may participate in co-investment opportunities.
PRIVATE EQUITY STRATEGY 1. OPERF's private equity allocation is managed with the objective of earning at least 300 basis points
in annualized, net excess returns relative to the Russell 3000 Index over very long time horizons, typically rolling, consecutive 10-year periods. Because private equity investments are often illiquid and/or traded infrequently, risk budget concepts are not applicable.
2. Key elements of the strategy: include the following: a. Private Equity is 100% actively managed because private equity index funds are not available. b. Risk within OPERF's private equity allocation is diversified by investing across different fund
types and strategies including venture capital, leverage buyout, mezzanine debt, distressed debt, sector funds, secondaries and fund-of-funds.
c. OPERF's private equity allocation is further diversified by investing across vintage year, industry sectors, investment size, development stage and geography.
d. OPERF's private equity investments are managed by external managers operating as general partners. Considerations for private equity manager selection include access to transactions (i.e., "deal flow"), specialized areas of operating expertise, established or promising net of fees

performance track records, unique or differentiated investment methodologies and transparent/verifiable reporting processes.
e. Within its private equity allocation, the Fund may participate in co-investment opportunities.
ALTERNATIVES STRATEGY 1. OPERF's allocation to Alternatives is managed with the objective of earning at least 400 basis points
in annualized, net excess returns relative to CPI over rolling, consecutive ten-year periods. Because 80% of the OPERF alternatives allocation is illiquid and/or traded infrequently, risk budget concepts are not applicable.
2. Key elements of the strategy: include the following: a. Alternatives are 100% actively managed because index funds replicating the broad alternatives
market are not available. b. Infrastructure investments represent 25% of the Fund's alternatives allocation, with a range of
20% to 30%. Specialist managers are utilized, and risk is diversified by investment type, size and geography. Specific infrastructure sector exposures will likely include energy, transportation, ports and water in both domestic and international markets and comprising both mid-size and large capitalization enterprises.
c. Natural Resource investments represent 35% of the Fund's alternatives allocation, with a range of 30% to 40%. Risk is diversified by investing across multiple industry sectors including oil and gas, agriculture, timberland, mining and commodities. Specialist managers are utilized in both domestic and international markets and across both active and some passive strategies.
d. Diversifying Assets represent 40% of the Fund's alternatives allocation, with a range of 35% to 45%. Diversifying Assets investments may include relative value, macro, arbitrage and long/short equity strategies. The objective of this sleeve is to invest in strategies with returns uncorrelated with those of the broader Fund. Risk is diversified by investing in multiple managers and across several strategies.
e. Other investments may represent 5% of the Fund's alternatives allocation, with a range of 0% to 10%. Investment strategies will be characterized as "other" based on prevailing market conditions as well as a specific strategy's unique "value proposition" or investment thesis.
f. Within its alternatives allocation, the Fund may also participate in co-investment opportunities.
PERFORMANCE MONITORING AND EVALUATION 1. The Council and its agents use a variety of compliance verification and performance measurement
tools to monitor, measure and evaluate the management of OPERF assets. Monitoring, reporting and evaluation frequencies range from daily to annually, although quarterly is the most commonly used reporting frequency.
2. The Council has developed a performance monitoring and evaluation system that answers two fundamental fiduciary questions:
• Are Fund assets being prudently managed? More specifically, are Fund assets being managed in accordance with established laws, policies and procedures, and are individual investment managers in compliance with their respective mandates?
• Are Fund assets being profitably managed? More specifically, has Fund investment performance affected benefit security, and has capital market risk in general and active management in particular been sufficiently rewarded?
3. When a breach of policies, procedures or portfolio mandates is reported or detected, the Council requires a supporting report explaining how the breach was discovered, the reasons for the breach, actions taken to rectify the breach, and steps taken to mitigate future occurrences.
4. One of many reports used by the Council to satisfy the above requirements of 10.2 above is a simple

comparison of Regular Account investment performance relative to the ADR over rolling, consecutive five-year periods. Other reports help the Council assess whether or not the Fund was rewarded for its allocations to higher return, higher risk equity investments and whether or not the active management strategies utilized added or subtracted from policy returns on a net of fees basis.
5. The reporting described in this section gives the Council a consolidated or "big picture" view of Regular Account investment performance. This view is the first level of a comprehensive four-level performance report used by the Council to monitor and evaluate Regular Account investment performance over different time horizons. Level two examines Regular Account investment performance excluding hard-to-price illiquid assets such as real estate and private equity investments. Level three examines Regular Account investment performance across the six, primary asset class allocations: U.S. equity; non-U.S. equity; fixed income; real estate; private equity; and alternatives. Level four examines the performance of individual managers within each of the asset class allocations. This four-level reporting structure allows the Council to "drill down" to the level of detail it may need to identify potential performance problems and take whatever corrective actions that may be required.
GLOSSARY Actuarial Discount Rate (ADR): The interest rate used to calculate the present value of a defined benefit plan's future obligations and determine the size of the plan sponsor's annual contribution. The ADR approved by the PERB is currently 7.755%.
Alternatives: Investments that are considered non-traditional or emerging in nature. Presently, the following investment types are included within the OPERF alternatives allocation: hedge funds; infrastructure; natural resources; and commodities.
Asset Class: A collection of securities that have conceptually similar claims on income streams and have returns that are highly correlated with each other. The most frequently referenced asset classes include equities, fixed income, real estate and cash.
Bank of America Merrill Lynch U.S. High Yield Master II Index: At September 30, 2013, this index had a market value of approximately $1.2 trillion comprised of approximately 2,200 issues.This index tracks the performance of publicly-issued, U.S. dollar-denominated, below investment-grade corporate debt. Its constituents are capitalization-weighted based on their current amount outstanding times the market price plus accrued interest. This index tracks and must conform to the performance of publicly issued, U.S. dollar-denominated,following parameters:
• Be rated below investment grade corporate debt. Qualifying securities must have a below investment -grade rating (based on an average of Moody's, S&P and Fitch),;
• Have at least 18 months to final maturity at the time of issuance, and at least one year remaining to final maturity as of an index rebalancing date,;
• Have a fixed coupon schedule and a minimum outstanding of $100 million. In addition, qualifying; and
• Qualifying securities must have risk exposure to countries that are members of the FX-G10, Western Europe or territories of the U.S. and Western Europe (the FX-G10 includes all Euro members, the U.S., Japan, the UK, Canada, Australia, New Zealand, Switzerland, Norway and Sweden).
Bloomberg Barclays U.S. Aggregate Index: At September 30, 2013, this index had a market value of approximately $16.7 trillion comprised of approximately 8,500 issues. Its constituents are SEC-registered, taxable, dollar denominated securities. This index covers the U.S. investment -grade fixed rate bond market, and includes government, corporate, mortgage pass-through and asset-backed securities. These major sectors

are subdivided into more specific indices that are calculated and reported on a regular basis. The Aggregate Index was officially launched by the former Lehman Brothers on January 1, 1976, and its constituents Its constituents are SEC-registered, taxable, dollar-denominated securities and must conform to the following parameters:
• Have at least one year to final maturity regardless of call features; • Be rated investment-grade (Baa3/BBB- or higher) by at least two of the major ratings agencies
(Moody's, S&P or Fitch); • Be fixed rate, although securities with a coupon that steps up or changes according to a predetermined
schedule are permitted;Be fixed rate, although securities with a coupon that steps up or changes according to a predetermined schedule are permitted;
• Be dollar-denominated and non-convertible; and • Be publicly issued, although 144A securities with registration rights and Reg-S issues are included.
Bloomberg Barclays U.S. Treasury Index: At September 30, 2013, this index had a market value of approximately $6.0 trillion comprised of 236 issues. It This index is a sub-component of the Bloomberg Barclays Aggregate Index and includes Treasuries, or more specifically, public obligations of the U.S. Treasury that have remaining maturities of more than one year. This index is a sub-component of the Barclays Aggregate Index, was officially launched by the former Lehman Brothers on January 1, 1976, and its Its constituents must conform to the following parameters:
• Be a U.S. Government or investment -grade credit security; • Have at least one year to final maturity regardless of call features; • Have at least $250 million par amount outstanding; • Be rated Baa3/BBB- or higher (i.e., "investment grade") by at least two of the major ratings agencies
(Moody's, S&P or Fitch); • Be fixed rate, although securities with a coupon that steps up or changes according to a predetermined
schedule are permitted;Be fixed rate, although securities with a coupon that steps up or changes according to a predetermined schedule are permitted;
• Be dollar-denominated and non-convertible; and • Be publicly issued.
Basis Point: One basis point equals 0.01%. One hundred basis points equalsequal one percentage point.
Benchmark: A standard by which investment performance can be measured and evaluated. For example, the performance of U.S. equity managers is often measured and evaluated relative to the Russell 3000 Index. In this case, the Russell 3000 Index serves as or represents the U.S. equity benchmark.
Benchmark Exposure: The proportion that a given stock represents within a benchmark, such as the Russell 3000 Index of U.S. equity securities. Allows investors to measure the extent to which a portfolio or specific investment strategy is over- or under-exposed to a particular stock or investment characteristic (e.g., market capitalization) relative to a benchmark.
Co-investment: Although used loosely to describe any two parties that invest alongside one another in the same company, this term has a special meaning in the context of an investment fund's limited partners. By having co-investment rights, a limited partner can invest directly in a company that is simultaneously backed by the fund's general partner. In this way, the limited partner has two separate stakes in the company: onethe first, an indirect investment through its participation in the general partner's fund; the second, a direct investment alongside the general partner. While the direct, co-investment opportunity is usually offered at terms and conditions more favorable than the fund investment, the direct, concentrated nature of the co-investment opportunity implies higher risk for the limited partner.

Core: Real estate investment strategies which exhibit "institutional" qualities, such as superior location, high occupancy and premium design and construction quality.
Credit: The measure of an organization's ability to re-pay borrowed money. Used most often in a fixed income context. Organizations with the highest credit rating (i.e., those most likely to re-pay borrowed money) are assigned a AAA credit rating.
Distressed Debt: A private equity investment strategy that involves purchasing discounted bonds of a financially-distressed firm. Distressed debt investors frequently convert their holdings into equity and become actively involved in the management of the distressed firm.
Diversification: Reducing risk without a commensurate reduction in expected return by combining assets and/or investment strategies with low or uncorrelated return and volatility profiles. For example, a decline in the price of one asset (e.g., oil stocks) is offset by an increase in the price of another asset (e.g., airline stocks). In lay terms, this principal is often described as "putting your eggs into more than one basket".
Duration: A financial measure used by investors to estimate the price sensitivity of a fixed- income security relative to changes in interest rates. For example, if interest rates increase by 1 percentage point, a 5-year duration bond will decline in price by approximately 5 percent.
Efficient Market: A market in which security prices rapidly reflect all information germane to the price discovery process. A primary implication of an efficient market is that active management efforts often fail to produce results that consistently beat the performance of an index fund or other passive strategy net of fees, transactions costs and other expenses.
Equities: Investments that represent ownership in a company and therefore a proportional share of company profits.
Fixed- Income: Debt obligations that specify the precise repayment of previously borrowed money. Typically, repayment takes the form of a series of fixed-amount, semi-annual interest payments and a single, final repayment of principal.
Funded Status: A comparison of a pension plan's assets and liabilities where the latter are often referred to as the plan's projected benefit obligation (PBO). When a plan's assets exceed its PBO, the plan is considered overfunded. Conversely, if a plan's assets are less than its PBO, the plan is considered underfunded and the plan sponsor has a net liability position with respect to its pension plan.
Fund-of-funds: Often organized by an investment advisor or investment bank, a fund that invests in other funds rather than directly in securities, operating firms or other assets.
Growth Stock: Stocks exhibiting faster-than-average earnings growth with expectations that such growth will continue. Growth stocks usually have high price-to-earnings ratios, high price-to-book ratios and low to no dividend yields.
Hedged: A term applied to one, more or an entire portfolio of assets indicating that the base country value of such assets is partially or wholly protected from foreign currency fluctuations. Forward currency contracts are typically used to hedge or offset the effects of these fluctuations.
Index Fund: A portfolio management strategy that seeks to match the composition and performance of a select index such as the Russell 3000 or S&P 500.
Leverage Buyout (LBO): A strategy in which debt financing is use to acquire a firm or business unit,

typically in a mature industry. LBO debt is usually repaid according to a strict schedule that absorbs most of the acquired firm's cash flow.
Liability: A claim on assets by individuals or companies. In a pension context, liabilities represent the claim on fund assets by active and retired plan beneficiaries.
MSCI All Country World Investable Market Index (ACWI-IMI): A capitalization-weighted index that includes overapproximately 9,000 publically -traded equity securities and is designed to measure equity market performance across developed and emerging markets. As of September 2013, this index consisted of 45 separate country indices comprising 24 developed and 21 emerging market countries. The developed market countries included are Australia, Austria, Belgium, Canada, Denmark, Finland, France, Germany, Greece, Hong Kong, Ireland, Israel, Italy, Japan, Netherlands, New Zealand, Norway, Portugal, Singapore, Spain, Sweden, Switzerland, the United Kingdom and the United States. The emerging market countries included are Brazil, Chile, China, Colombia, Czech Republic, Egypt, Hungary, India, Indonesia, Korea, Malaysia, Mexico, Morocco, Peru, Philippines, Poland, Russia, South Africa, Taiwan, Thailand and Turkey This index consists of over 40 separate developed and emerging market country indices.
MSCI World Ex-U.S. Index: Same asA subset of the MSCI ACWI-IMI index described directly above, exceptAll Country World Index that contains only securities from developed market countries, excluding those from the U.S. stocks are excluded.
Market Capitalization: The value of a corporation as determined by multiplying the price of its shares by the number of shares outstanding. Investors often use market capitalization as an indicator of portfolio risk or volatility. In general, smaller capitalized companies are more volatile or risky than larger capitalized companies.
Mezzanine: Either a private equity financing undertaken shortly before an initial public offering, or an investment strategy that employs subordinated debt (which has fewer privileges than bank debt but more standing than equity) and often is issued with attached equity warrants.
NCREIF Fund Index – Open End Diversified Core Equity (NFI-ODCE): The NFI-ODCE is an investment performance composite published quarterly by the National Council of Real Estate Investment Fiduciaries (NCREIF). This index is a capitalization-weighted index of approximately 30 open-ended, commingled funds pursuing a "core" investment strategy. The specific qualifications for NFI-ODCE inclusion are as follows:
• At least 80% of fund market value must be in private equity operating real estate; • At least 95% of fund market value must be in U.S. markets; • At least 80% of fund market value must be invested in apartments, industrial properties, office
buildings, and retail; • No more than 65% of fund market value can be in one property type or one region as define by the
NPI; • No more than 40% leverage; and • Compliance with the NCREIF/PREA Reporting Standards.
Oregon State Treasury: Headed by the State Treasurer as the chief financial officer for the state, the Oregon State Treasury is responsible for managing the day to day investment operations of the state pension fund (and other funds), issuing all state debt, and serving as the central bank for state agencies. Within the Oregon State Treasury, the Investment Division also manages investment programs for the state's deferred compensation and college savings plans, and serves as staff to the Oregon Investment Council.
Opportunistic: Higher risk but higher expected return real estate investments that are usually illiquid,

produce little or no current income and are often focused on distressed and/or highly leveraged properties.
Opportunity Portfolio: Includes non-traditional and/or concentrated investment strategies that may provide enhanced diversification and/or unique sources of return relative to the other asset classes included in the OIC's approved policy mix. The Opportunity Portfolio's objectives are pursued by investing in strategies that fall outside the boundaries of "strategic" or approved policy mix allocations including new or innovative strategies across a wide range of potential investment opportunities and with few limitations or constraints.
Oregon Investment Council (OIC): Oregon Revised Statute (ORS) 293.706 establishes the OIC, which consists of five voting members, four of whom are appointed by the Governor and subject to Senate confirmation (the Treasurer serves by position, and is not subject to confirmation). The members appointed by the Governor must be qualified by training and experience in the field of investment or finance. In addition, the Director of the Oregon Public Employees Retirement System is an ex-officio member of the OIC. ORS 293.721 and 293.726 establish the OIC's investment objectives and standards of judgment and care: "Moneys in the investment funds shall be invested and reinvested to achieve the investment objective of the investment funds, which is to make the moneys as productive as possible, subject to the prudent investor standard".
Oregon Public Employees Retirement Fund (OPERF): Holds the assets of beneficiaries of the Oregon Public Employees Retirement System (PERS). PERS is a state-wide, defined benefit retirement plan for units of state government, political subdivisions, community colleges and school districts. PERS is administered under ORS chapters 237, 238, 238A, and applicable provisions of the Internal Revenue Code by the Public Employees Retirement Board (PERB). Participation by state government units, school districts, and community colleges is mandatory. Participation by most political subdivisions is optional but irrevocable if elected. All system assets accumulated for the payment of benefits may legally be used to pay benefits to any of the plan members or beneficiaries of the system. PERS is responsible for administrating the management of the plan's liability and participant benefits.
Oregon Short Term Fund (OSTF): The state's commingled cash investment pool managed internally by Treasury staff. The OSTF includes all excess state agency cash, as required by law, as well as cash invested by local governments on a discretionary basis. The OSTF is invested in accordance with investment guidelines recommended by the state's Oregon Short Term Fund Board and approved by the OIC.
Overweight: A stock, sector or capitalization exposure that is higher than the corresponding exposure in a given asset class benchmark, such as the Russell 3000 Index.
Private Equity: Venture Economics (VE) uses the term to describe the universe of all venture investing, buyout investing and mezzanine investing. Fund-of-funds investing and secondaries are also included in this term's broadest interpretation. VE is not using the term to include angel investors or business angels, real estate investments or other investing scenarios outside of the public market. See also Alternatives.
Real Estate: Investments in land and/or buildings.
Real Estate Investment Trusts (REITREITs): A real estate portfolio managed by an investment company for the benefit of the trust unit holders. Most REIT The units of most REITs are publically and exchange traded.
Regular Account: That portion of the Oregon Public Employees Retirement Fund that excludes the Variable Account. A diversified investment portfolio for which the asset allocation and general investment policies are established and approved by the OIC. Tier One participants are guaranteed a minimum rate of return based on the long-term interest rate used by the actuary, currently 7.7550 percent. Tier Two participants have no guaranteed rate of return and receive benefits that reflect the Regular Account's actual or realized investment return.

Return: The gain or loss in value of an investment over a given period to time expressed as a percentage of the original amount invested. For example, an initial investment of $100 that grows to $105 over one year has produced a 5% return.
Risk: The probability of losing money or not achieving the expected investment outcome.
Russell 3000 Index: Measures the investment performance of a composite comprised of stocks issued by the approximately 3,000 largest U.S. companies. Based on total market capitalization, this index represents approximately 98% of the investable U.S. equity market.
S&P/LSTA Leveraged Loan Index: At September 30, 2013, this index had a market value of approximately $622 billion comprised of approximately 800 issuers and over 1,000 loan facilities. The index is designed to mirror the market-weighted performance of the largest institutional leveraged loan portfolios based on market weightings, spreads and interest payments. Facilities are eligible for inclusion in the index if they are senior secured institutional term loans with a minimum initial spread of 125 basis points and minimum one-year term. Facilities are retired from the index when there is no bid posted on the facility for at least 12 successive weeks or when the loan is repaid.
Secondaries: The purchase and sale of existing limited partnership commitments to other limited partners and/or fund sponsors.
Sector: A particular group of stocks or bonds that usually characterize a given industry or economic activity. For example, "pharmaceuticals" is the name given to stocks issued by companies researching, manufacturing and selling over-the-counter and prescription medicines. "Corporates" is the name given to fixed- income instruments issued by private and public companies.
Sector Funds: A pooled investment product that focuses on a particular industry or economic activity. For example, pooled funds that invest principally in technology stocks would be termed a technology sector fund.
Tracking Error: The amount by which an investor's investment performance differed from a corresponding or assigned benchmark. Usually measured and expressed as the standard deviation of returns relative to a pre-specified benchmark.
Unhedged: A term indicating that the value of one, more or an entire portfolio of assets may be affected by foreign currency fluctuations and that no deliberate attempt has been made to protect against such fluctuations.
Value Added: As used in real estate, may include office, retail, industrial and apartment properties, but may target structured investments in alternative property types such as hotels, student housing, senior housing and specialized retail uses. Portfolios or strategies that are positioned as Value Added are expected to produce returns between Core and Opportunistic portfolios/strategies. For example, a Value Added property may exhibit some "institutional" qualities such as good location and high design and construction quality, but may need significant leasing improvements to stabilized and enhance its value. Value Added investments may also include development opportunities with balanced risk/return profiles.
Value Stock: Stocks that appear to be undervalued for reasons other than low potential earnings growth. Value stocks usually have low price-to-earnings ratios, low price-to-book ratios and a high dividend yield.
Variable Account: The Variable Annuity Program allowed active PERS members to allocate a portion of their yearly employee contributions to a domestic equity portfolio. No such contributions were allowed after December 31, 2003. Active members who participated in the Variable Program had part of their balance invested in the Regular Account and part invested in the Variable Account. Unless a member explicitly elected to participate in the Variable Program, all of that member's employee contributions were invested in

the Regular Account. This "primary" election allowed members to place 25 percent, 50 percent or 75 percent of their employee contributions in the Variable Account. Variable Account balances increase or decrease depending on the investment performance of the variable fund, and individual participant accounts are credited for any amount (gain or loss) available for distribution. The OIC's asset allocation policy purview only applies to the Regular Account since the OIC cannot control the investment option elections of Variable Program participants.
Venture Capital: Independently managed, dedicated pools of capital that focus on equity or equity-linked investments in privately held, high growth companies. Outside of the United States, the term venture capital is used as a synonym for all types of alternative or private equity.
Vintage Year: The calendar year in which an investment fund's first closing occurs. For example, the 1995 vintage year for venture capital includes all venture capital funds that held a first closing in 1995.

PURPOSE 1. This Statement of Investment Objectives and Policy Framework (the "Statement") summarizes the
philosophy, objectives and policies approved by the Oregon Investment Council (the “OIC” or the "Council") for the investment of Oregon Public Employees Retirement Fund ("OPERF" or the "Fund") assets.
2. The Council approved these objectives and framework after careful consideration of OPERF benefit provisions, and the implications of alternative objectives and policies.
3. The Statement has been prepared with five audiences in mind: 1) incumbent, new and prospective Council members; 2) Treasury staff; 3) active and retired Oregon Public Employees Retirement System (OPERS) members; 4) the Oregon State Legislature and Governor; and 5) agents engaged by the Council to manage and administer Fund assets.
4. The Statement summarizes more detailed policy and procedure documents prepared and maintained by the staff of the Oregon State Treasury ("OST"), and numerous other documents that govern the day-to-day management of OPERF assets including agent agreements, individual investment manager mandates and limited partnership documents.
5. The Council regularly assesses the continued suitability of its approved investment objectives and policies, initiates change as necessary and updates these documents accordingly.
INVESTMENT OBJECTIVE 1. The Council believes, based on the assumptions outlined herein, that the investment policies
summarized in this document will provide the highest possible return at a level of risk that is appropriate for active and retired OPERF members. The Council evaluates risk in terms of both short-term asset price volatility and long-term plan viability (specifically, the probability of not achieving the actuarial discount rate (ADR) over a consecutive, twenty-year time horizon).
2. Subject to ORS 293.721 and 293.726 and the risk parameters described directly above, the investment objective for the Regular Account is earning an annualized return that equals or exceeds the ADR that is approved by the Public Employees Retirement Board (“PERB”) and used by PERB actuaries to value OPERF liabilities. The return projection period comprises a consecutive, twenty-year time horizon that matches the period PERB and its actuaries consider in their analyses.
3. Historically, members were allowed to direct up to 75% of their contributions to the Variable Account. While no longer receiving new contributions, the Variable Account's objective remains investment performance consistent with the MSCI All Country World Investable Market Index.
4. The Council has established investment objectives for individual asset classes that are also summarized in this Statement.
POLICY ASSET MIX, RISK DIVERSIFICATION AND RETURN EXPECTATIONS
1. After careful consideration of OPERF's investment objective, liability structure, funded status and liquidity needs, as well as the return, risk and diversification characteristics of different asset classes, the Council approved the asset mix policy presented in Exhibit 1 for the OPERF Regular Account. The Council's total fund asset mix policy and active management return expectations are also summarized in Exhibit 1.
2. Of its total assets, 55 percent of OPERF is targeted for investment in equities, inclusive of private equity. Equity investments have generated the highest returns over long time periods, but can also produce low and even negative returns over shorter time periods.
3. The risk of low returns over shorter time periods makes 100% equity policies unsuitable for most pension funds, including OPERF. By investing across multiple equity asset classes, and in lower return but less risky fixed income and real estate assets, the Council is managing and diversifying the Fund's overall risk.

4. Specific asset class exposures are maintained within the ranges outlined in Exhibit 1. Exhibit 1: Policy Mix and Return Expectations for OPERF Regular Account
Asset Class Target
Allocation (%)
Re-balancing
Range (%)
Expected Annual
Policy Return1
(%)
Expected Annual Active
Management Return (net
of fees) (%)
Expected Annual
Total Return
(%)
Public Equities 37.5 32.5-42.5 7.1 0.75 7.9
Private Equity 17.5 14-21 9.5 9.5
Total Equity 55 50-60
Fixed Income 20 15-25 3.0 0.25 3.3
Real Estate 12.5 9.5-15.5 6.7 0.50 7.2
Alternatives 12.5 0-12.5 6.3 6.3
Total Fund2 100 7.1 0.39 7.5
1 Based on capital market forecasts developed by the Council's investment consultant, Callan Associates. 2 Total Fund expected returns are calculated geometrically using the investment consultant’s forecasts for the arithmetic returns and covariances of the asset classes. Accordingly, the Total Fund’s expected returns are not equivalent to the weighted average of individual asset class returns listed in the Exhibit.
5. The policy mix's 7.5% average annual return expectation was developed with reference to observed long-term relationships among major asset classes, adjusted to account for current market conditions. The Council believes this return expectation is reasonable, but recognizes that realized returns can deviate significantly from expectations – both positively and negatively.
6. U.S. equity, non-U.S. equity, and fixed income asset classes are managed using both passive and active management strategies. Active management of the Fund's public market equity and real estate allocations is expected to earn respectively a 0.75% and a 0.25% per annum return premium over rolling, consecutive five-year periods (and relative to those allocation's respective benchmarks). The Council recognizes that unsuccessful active management can reduce total fund returns.
7. The OIC has allocated up to 3.0% of total Fund assets for investment in an Opportunity Portfolio, the objective of which is to provide enhanced returns and better diversification for OPERF. Investments in the Opportunity Portfolio are expected to comprise a combination of both shorter-term (1-3 year) and longer-term holdings. The Opportunity Portfolio has no strategic target since, by definition, eligible investments will only be pursued on an opportunistic or episodic basis; moreover, the Opportunity Portfolio allocation shall not result in an allocation range breach for any of the other five,

primary asset class allocations. 8. OPERF cash balances are invested in the Oregon Short Term Fund and managed to levels that are
deliberately minimized but still sufficient to cover OPERF's short-term cash flow needs. 9. In an effort to minimize cash balances at both the fund and manager level, the OIC has retained an
overlay manager to more closely align the actual Fund portfolio with the approved policy mix, generally through the purchase and sale of futures contracts to increase or decrease specific asset class exposures, as necessary.
10. The Council shall review, at least biennially, its expectations for asset class and active management performance, and assess how the updated expectations affect the probability that the Regular Account will achieve its investment objective.
PASSIVE AND ACTIVE MANAGEMENT 1. Passive management uses lower cost index funds to access the return streams available from the
world's capital markets. Active management tries to earn higher returns than those available from index funds through the application of manager skill in the form of sector and security selection as well as market and/or asset mix timing decisions.
2. The Council uses passive management to control costs, evaluate active management strategies, capture exposure to efficient market segments, manage tracking error and facilitate policy mix re-balancing activities. Exchange-traded real estate investment trusts (REITs) may also be used to maintain the Fund's real estate exposure within specified policy ranges.
3. The Council approves active management of Fund assets when proposed active strategies offer sufficiently high expected incremental returns, net of fees, and when the magnitude of potential under-performance can be estimated, monitored and managed.
4. The Council must accept active management in those asset classes for which there are no passive management alternatives; in particular, real estate, private equity and other alternative and opportunistic investment strategies.
5. The Council prefers active management strategies that emphasize sector and/or security selection decisions rather than market and/or asset mix timing decisions as the former are much better supported by professional experience and academic research.
6. At the aggregate level of the Regular Account, active management strategies authorized by the Council are expected to add 0.4% of annualized excess return, net of fees, over rolling, consecutive five-year periods. Relative to the policy benchmark, Regular Account active risk shall be managed to a 2 to 3 percent annualized tracking error target.
PUBLIC EQUITY STRATEGY 1. OPERF's public equity allocation is managed with the objective of earning at least 75 basis points in
annualized net excess return relative to the MSCI All Country World Investable Market Index (ACWI IMI – net) (unhedged) over rolling, consecutive five-year periods. Relative to that same benchmark, active risk shall be managed to a 0.75 to 2.0 percent annualized tracking error target.
2. Key elements of the strategy include the following: a. In an effort to enhance return, maintain an over-weight to small capitalization stocks and other
well supported sources of return premia. These strategic overweights or "tilts" are based on and supported by robust empirical research that historically links persistent and pervasive evidence of excess returns to systematic "factor exposures" such as size (i.e., small cap), value and momentum. Implementation of other factor tilts may be considered at the manager, strategy or mandate level upon approval of both the Chief Investment Officer (CIO) and OIC.
b. Multiple, specialist active managers with complementary investment styles are employed. For example, some OPERF managers focus on growth stocks, some on value stocks, some on large capitalization stocks and others on small capitalization stocks. This diversified approach produces more excess return opportunities and minimizes the Fund's exposure to any single

investment organization. c. Active management is more common within OPERF's non-U.S. equity allocation because
non-U.S. markets appear to provide more opportunities for the successful application of manager skill.
d. Managers with skills in security selection and country allocation are utilized as these attributes have been shown to be the principal sources of excess returns in non-U.S. equity portfolios. In addition, managers who have demonstrated an ability to add value through currency management are permitted to do so.
e. Aggregate exposures to countries, economic sectors, investment styles and market capitalization tiers are monitored and managed relative to corresponding benchmark exposures.
FIXED INCOME STRATEGY 1. OPERF's fixed income allocation is managed with the objective of earning 25 basis points in
annualized, net excess returns relative to a blended benchmark comprised of 46% Bloomberg Barclays U.S. Aggregate Index, 37% Bloomberg Barclays U.S. Treasury Index, 13% S&P/LSTA Leveraged Loan Index and 4% Bank of America Merrill Lynch High Yield Master II Index over rolling, consecutive five-year periods. Relative to the above-described benchmark, active risk with the OPERF fixed income allocation is managed to a 0.5 to 1.0 percent annualized tracking error target.
2. Key elements of the strategy include the following: a. A significant proportion of the OPERF fixed income allocation is actively managed due to
performance and cost considerations. Specifically, excess returns from active fixed income management are more likely as many investors hold fixed income securities to meet regulatory and liability matching objectives, and hence are not total return oriented. This market dynamic produces systematic mis-pricings of fixed income securities that skilled investment managers can exploit. Active fixed income management fees are also much lower than active equity management fees.
b. Multiple active generalist managers will be used for a majority of the fixed income asset class, rather than the specialist manager approach used within OPERF's public equity allocation. However, the OIC may utilize specialist fixed income managers as warranted or necessary, although fixed income manager mandates generally have little impact on the Fund's total risk due to fixed income's lower overall Fund allocation and fixed income managers' generally low tracking error.
c. Fixed income managers are selected for their skills in issue selection, credit analysis, sector allocations and duration management.
d. Aggregate exposures to duration, credit and sectors are monitored and managed relative to corresponding exposures in the fixed income allocation benchmark.
REAL ESTATE STRATEGY 1. OPERF's real estate allocation is managed with the objective of earning at least 50 basis points in
annualized, net excess returns relative to the NCREIF Fund Index – Open End Diversified Core Equity (NFI-ODCE), net of management fees, over rolling, consecutive five-year periods. Because 80% of the Fund's real estate investments are illiquid and/or traded infrequently, conventional risk budget concepts are not applicable.
2. Key elements of the strategy include the following: a. Real Estate is 100% actively managed because a passive replication of the full breadth and
depth of the real estate asset class is not viable. b. Core property investments represent 55% of the Fund's real estate allocation, with a range of
45% to 65%. Specialist managers are utilized. Risk is diversified by investing across the following major property types: office; apartments; retail; and industrial. The OPERF real

estate allocation may also include structured investments in alternative property types with Core-like risk and return attributes.
c. Exchange traded real estate investment trusts (REITs) represent 5% of the Fund's real estate allocation, with a range of 0% to 10%. Active management will include style and capitalization specialists, as well as broad market managers. Up to 50% of the REIT exposure may be invested in markets outside the United States.
d. Value Added property investments represent 20% of the OPERF real estate allocation, with a range of 10% to 30%, and may include direct investments in each of the property types listed above, as well as structured investments in alternative property types. Risk is diversified by property type and geography.
e. Opportunistic property investments represent 20% of the OPERF real estate allocation, with a range of 10% to 30%. Relative to Core and Value Added strategies, real estate investments will be characterized as "opportunistic" based on higher risk/return expectations and other prevailing market conditions.
f. Within its real estate allocation, the Fund may participate in co-investment opportunities.
PRIVATE EQUITY STRATEGY 1. OPERF's private equity allocation is managed with the objective of earning at least 300 basis points
in annualized, net excess returns relative to the Russell 3000 Index over very long time horizons, typically rolling, consecutive 10-year periods. Because private equity investments are often illiquid and/or traded infrequently, risk budget concepts are not applicable.
2. Key elements of the strategy include the following: a. Private Equity is 100% actively managed because private equity index funds are not available. b. Risk within OPERF's private equity allocation is diversified by investing across different fund
types and strategies including venture capital, leverage buyout, mezzanine debt, distressed debt, sector funds, secondaries and fund-of-funds.
c. OPERF's private equity allocation is further diversified by investing across vintage year, industry sectors, investment size, development stage and geography.
d. OPERF's private equity investments are managed by external managers operating as general partners. Considerations for private equity manager selection include access to transactions (i.e., "deal flow"), specialized areas of operating expertise, established or promising net of fees performance track records, unique or differentiated investment methodologies and transparent/verifiable reporting processes.
e. Within its private equity allocation, the Fund may participate in co-investment opportunities.
ALTERNATIVES STRATEGY 1. OPERF's allocation to Alternatives is managed with the objective of earning at least 400 basis points
in annualized, net excess returns relative to CPI over rolling, consecutive ten-year periods. Because 80% of the OPERF alternatives allocation is illiquid and/or traded infrequently, risk budget concepts are not applicable.
2. Key elements of the strategy include the following: a. Alternatives are 100% actively managed because index funds replicating the broad alternatives
market are not available. b. Infrastructure investments represent 25% of the Fund's alternatives allocation, with a range of
20% to 30%. Specialist managers are utilized, and risk is diversified by investment type, size and geography. Specific infrastructure sector exposures will likely include energy, transportation, ports and water in both domestic and international markets and comprising both mid-size and large capitalization enterprises.
c. Natural Resource investments represent 35% of the Fund's alternatives allocation, with a range of 30% to 40%. Risk is diversified by investing across multiple industry sectors including oil and gas, agriculture, timberland, mining and commodities. Specialist managers

are utilized in both domestic and international markets and across both active and some passive strategies.
d. Diversifying Assets represent 40% of the Fund's alternatives allocation, with a range of 35% to 45%. Diversifying Assets investments may include relative value, macro, arbitrage and long/short equity strategies. The objective of this sleeve is to invest in strategies with returns uncorrelated with those of the broader Fund. Risk is diversified by investing in multiple managers and across several strategies.
e. Other investments may represent 5% of the Fund's alternatives allocation, with a range of 0% to 10%. Investment strategies will be characterized as "other" based on prevailing market conditions as well as a specific strategy's unique "value proposition" or investment thesis.
f. Within its alternatives allocation, the Fund may also participate in co-investment opportunities.
PERFORMANCE MONITORING AND EVALUATION 1. The Council and its agents use a variety of compliance verification and performance measurement
tools to monitor, measure and evaluate the management of OPERF assets. Monitoring, reporting and evaluation frequencies range from daily to annually, although quarterly is the most commonly used reporting frequency.
2. The Council has developed a performance monitoring and evaluation system that answers two fundamental fiduciary questions:
• Are Fund assets being prudently managed? More specifically, are Fund assets being managed in accordance with established laws, policies and procedures, and are individual investment managers in compliance with their respective mandates?
• Are Fund assets being profitably managed? More specifically, has Fund investment performance affected benefit security, and has capital market risk in general and active management in particular been sufficiently rewarded?
3. When a breach of policies, procedures or portfolio mandates is reported or detected, the Council requires a supporting report explaining how the breach was discovered, the reasons for the breach, actions taken to rectify the breach, and steps taken to mitigate future occurrences.
4. One of many reports used by the Council to satisfy the above requirements is a simple comparison of Regular Account investment performance relative to the ADR over rolling, consecutive five-year periods. Other reports help the Council assess whether or not the Fund was rewarded for its allocations to higher return, higher risk equity investments and whether or not the active management strategies utilized added or subtracted from policy returns on a net of fees basis.
5. The reporting described in this section gives the Council a consolidated or "big picture" view of Regular Account investment performance. This view is the first level of a comprehensive four-level performance report used by the Council to monitor and evaluate Regular Account investment performance over different time horizons. Level two examines Regular Account investment performance excluding hard-to-price illiquid assets such as real estate and private equity investments. Level three examines Regular Account investment performance across the six, primary asset class allocations: U.S. equity; non-U.S. equity; fixed income; real estate; private equity; and alternatives. Level four examines the performance of individual managers within each of the asset class allocations. This four-level reporting structure allows the Council to "drill down" to the level of detail it may need to identify potential performance problems and take whatever corrective actions that may be required.
GLOSSARY Actuarial Discount Rate (ADR): The interest rate used to calculate the present value of a defined benefit plan's future obligations and determine the size of the plan sponsor's annual contribution. The ADR approved by the PERB is currently 7.5%.
Alternatives: Investments that are considered non-traditional or emerging in nature. Presently, the following

investment types are included within the OPERF alternatives allocation: hedge funds; infrastructure; natural resources; and commodities.
Asset Class: A collection of securities that have conceptually similar claims on income streams and have returns that are highly correlated with each other. The most frequently referenced asset classes include equities, fixed income, real estate and cash.
Bank of America Merrill Lynch U.S. High Yield Master II Index: This index tracks the performance of publicly-issued, U.S. dollar-denominated, below investment-grade corporate debt. Its constituents are capitalization-weighted based on their current amount outstanding times the market price plus accrued interest and must conform to the following parameters:
• Be rated below investment-grade rating based on an average of Moody's, S&P and Fitch; • Have at least 18 months to final maturity at the time of issuance and at least one year remaining to
final maturity as of an index rebalancing date; • Have a fixed coupon schedule and a minimum outstanding of $100 million; and • Qualifying securities must have risk exposure to countries that are members of the FX-G10, Western
Europe or territories of the U.S. and Western Europe (the FX-G10 includes all Euro members, the U.S., Japan, the UK, Canada, Australia, New Zealand, Switzerland, Norway and Sweden).
Bloomberg Barclays U.S. Aggregate Index: This index covers the U.S. investment-grade fixed rate bond market, and includes government, corporate, mortgage pass-through and asset-backed securities. These major sectors are subdivided into more specific indices that are calculated and reported on a regular basis. Its constituents are SEC-registered, taxable, dollar-denominated securities and must conform to the following parameters:
• Have at least one year to final maturity regardless of call features; • Be rated investment-grade (Baa3/BBB- or higher) by at least two of the major ratings agencies
(Moody's, S&P or Fitch); • Be fixed rate, although securities with a coupon that steps up or changes according to a predetermined
schedule are permitted; • Be dollar-denominated and non-convertible; and • Be publicly issued, although 144A securities with registration rights and Reg-S issues are included.
Bloomberg Barclays U.S. Treasury Index: This index is a sub-component of the Bloomberg Barclays Aggregate Index and includes public obligations of the U.S. Treasury that have remaining maturities of more than one year. Its constituents must conform to the following parameters:
• Be a U.S. Government or investment-grade credit security; • Have at least one year to final maturity regardless of call features; • Have at least $250 million par amount outstanding; • Be rated Baa3/BBB- or higher (i.e., "investment grade") by at least two of the major ratings agencies
(Moody's, S&P or Fitch); • Be fixed rate, although securities with a coupon that steps up or changes according to a predetermined
schedule are permitted; • Be dollar-denominated and non-convertible; and • Be publicly issued.
Basis Point: One basis point equals 0.01%. One hundred basis points equal one percentage point.
Benchmark: A standard by which investment performance can be measured and evaluated. For example, the performance of U.S. equity managers is often measured and evaluated relative to the Russell 3000 Index. In
this case, the Russell 3000 Index serves as or represents the U.S. equity benchmark.
Benchmark Exposure: The proportion that a given stock represents within a benchmark, such as the Russell 3000 Index of U.S. equity securities. Allows investors to measure the extent to which a portfolio or specific investment strategy is over- or under-exposed to a particular stock or investment characteristic (e.g., market capitalization) relative to a benchmark.
Co-investment: Although used loosely to describe any two parties that invest alongside one another in the same company, this term has a special meaning in the context of an investment fund's limited partners. By having co-investment rights, a limited partner can invest directly in a company that is simultaneously backed by the fund's general partner. In this way, the limited partner has two separate stakes in the company: the first, an indirect investment through its participation in the general partner's fund; the second, a direct investment alongside the general partner. While the direct, co-investment opportunity is usually offered at terms and conditions more favorable than the fund investment, the direct, concentrated nature of the co-investment opportunity implies higher risk for the limited partner.
Core: Real estate investment strategies which exhibit "institutional" qualities, such as superior location, high occupancy and premium design and construction quality.
Credit: The measure of an organization's ability to re-pay borrowed money. Used most often in a fixed income context. Organizations with the highest credit rating (i.e., those most likely to re-pay borrowed money) are assigned a AAA credit rating.
Distressed Debt: A private equity investment strategy that involves purchasing discounted bonds of a financially-distressed firm. Distressed debt investors frequently convert their holdings into equity and become actively involved in the management of the distressed firm.
Diversification: Reducing risk without a commensurate reduction in expected return by combining assets and/or investment strategies with low or uncorrelated return and volatility profiles. For example, a decline in the price of one asset (e.g., oil stocks) is offset by an increase in the price of another asset (e.g., airline stocks). In lay terms, this principal is often described as "putting your eggs into more than one basket".
Duration: A financial measure used by investors to estimate the price sensitivity of a fixed income security relative to changes in interest rates. For example, if interest rates increase by 1 percentage point, a 5-year duration bond will decline in price by approximately 5 percent.
Efficient Market: A market in which security prices rapidly reflect all information germane to the price discovery process. A primary implication of an efficient market is that active management efforts often fail to produce results that consistently beat the performance of an index fund or other passive strategy net of fees, transactions costs and other expenses.
Equities: Investments that represent ownership in a company and therefore a proportional share of company profits.
Fixed Income: Debt obligations that specify the precise repayment of previously borrowed money. Typically, repayment takes the form of a series of fixed-amount, semi-annual interest payments and a single, final repayment of principal.
Funded Status: A comparison of a pension plan's assets and liabilities where the latter are often referred to as the plan's projected benefit obligation (PBO). When a plan's assets exceed its PBO, the plan is considered overfunded. Conversely, if a plan's assets are less than its PBO, the plan is considered underfunded and the plan sponsor has a net liability position with respect to its pension plan.
Fund-of-funds: Often organized by an investment advisor or investment bank, a fund that invests in other funds rather than directly in securities, operating firms or other assets.
Growth Stock: Stocks exhibiting faster-than-average earnings growth with expectations that such growth will continue. Growth stocks usually have high price-to-earnings ratios, high price-to-book ratios and low to no dividend yields.
Hedged: A term applied to one, more or an entire portfolio of assets indicating that the base country value of such assets is partially or wholly protected from foreign currency fluctuations. Forward currency contracts are typically used to hedge or offset the effects of these fluctuations.
Index Fund: A portfolio management strategy that seeks to match the composition and performance of a select index such as the Russell 3000 or S&P 500.
Leverage Buyout (LBO): A strategy in which debt financing is use to acquire a firm or business unit, typically in a mature industry. LBO debt is usually repaid according to a strict schedule that absorbs most of the acquired firm's cash flow.
Liability: A claim on assets by individuals or companies. In a pension context, liabilities represent the claim on fund assets by active and retired plan beneficiaries.
MSCI All Country World Investable Market Index (ACWI-IMI): A capitalization-weighted index that includes approximately 9,000 publically-traded equity securities and is designed to measure equity market performance across developed and emerging markets. This index consists of over 40 separate developed and emerging market country indices.
MSCI World Ex-U.S. Index: A subset of the MSCI All Country World Index that contains only securities from developed market countries, excluding those from the U.S.
Market Capitalization: The value of a corporation as determined by multiplying the price of its shares by the number of shares outstanding. In general, smaller capitalized companies are more volatile or risky than larger capitalized companies.
Mezzanine: Either a private equity financing undertaken shortly before an initial public offering, or an investment strategy that employs subordinated debt (which has fewer privileges than bank debt but more standing than equity) and often is issued with attached equity warrants.
NCREIF Fund Index – Open End Diversified Core Equity (NFI-ODCE): The NFI-ODCE is an investment performance composite published quarterly by the National Council of Real Estate Investment Fiduciaries (NCREIF). This index is a capitalization-weighted index of approximately 30 open-ended, commingled funds pursuing a "core" investment strategy. The specific qualifications for NFI-ODCE inclusion are as follows:
• At least 80% of fund market value must be in private equity operating real estate; • At least 95% of fund market value must be in U.S. markets; • At least 80% of fund market value must be invested in apartments, industrial properties, office
buildings, and retail; • No more than 65% of fund market value can be in one property type or one region as define by the
NPI; • No more than 40% leverage; and • Compliance with the NCREIF/PREA Reporting Standards.

Oregon State Treasury: Headed by the State Treasurer as the chief financial officer for the state, the Oregon State Treasury is responsible for managing the day to day investment operations of the state pension fund (and other funds), issuing all state debt, and serving as the central bank for state agencies. Within the Oregon State Treasury, the Investment Division also manages investment programs for the state's deferred compensation and college savings plans, and serves as staff to the Oregon Investment Council.
Opportunistic: Higher risk but higher expected return real estate investments that are usually illiquid, produce little or no current income and are often focused on distressed and/or highly leveraged properties.
Opportunity Portfolio: Includes non-traditional and/or concentrated investment strategies that may provide enhanced diversification and/or unique sources of return relative to the other asset classes included in the OIC's approved policy mix. The Opportunity Portfolio's objectives are pursued by investing in strategies that fall outside the boundaries of "strategic" or approved policy mix allocations including new or innovative strategies across a wide range of potential investment opportunities and with few limitations or constraints.
Oregon Investment Council (OIC): Oregon Revised Statute (ORS) 293.706 establishes the OIC, which consists of five voting members, four of whom are appointed by the Governor and subject to Senate confirmation (the Treasurer serves by position, and is not subject to confirmation). The members appointed by the Governor must be qualified by training and experience in the field of investment or finance. In addition, the Director of the Oregon Public Employees Retirement System is an ex-officio member of the OIC. ORS 293.721 and 293.726 establish the OIC's investment objectives and standards of judgment and care: "Moneys in the investment funds shall be invested and reinvested to achieve the investment objective of the investment funds, which is to make the moneys as productive as possible, subject to the prudent investor standard".
Oregon Public Employees Retirement Fund (OPERF): Holds the assets of beneficiaries of the Oregon Public Employees Retirement System (PERS). PERS is a state-wide, defined benefit retirement plan for units of state government, political subdivisions, community colleges and school districts. PERS is administered under ORS chapters 237, 238, 238A, and applicable provisions of the Internal Revenue Code by the Public Employees Retirement Board (PERB). Participation by state government units, school districts, and community colleges is mandatory. Participation by most political subdivisions is optional but irrevocable if elected. All system assets accumulated for the payment of benefits may legally be used to pay benefits to any of the plan members or beneficiaries of the system. PERS is responsible for administrating the management of the plan's liability and participant benefits.
Oregon Short Term Fund (OSTF): The state's commingled cash investment pool managed internally by Treasury staff. The OSTF includes all excess state agency cash, as required by law, as well as cash invested by local governments on a discretionary basis. The OSTF is invested in accordance with investment guidelines recommended by the state's Oregon Short Term Fund Board and approved by the OIC.
Overweight: A stock, sector or capitalization exposure that is higher than the corresponding exposure in a given asset class benchmark, such as the Russell 3000 Index.
Private Equity: Venture Economics (VE) uses the term to describe the universe of all venture investing, buyout investing and mezzanine investing. Fund-of-funds investing and secondaries are also included in this term's broadest interpretation. VE is not using the term to include angel investors or business angels, real estate investments or other investing scenarios outside of the public market. See also Alternatives.
Real Estate: Investments in land and/or buildings.
Real Estate Investment Trusts (REITs): A real estate portfolio managed by an investment company for the benefit of the trust unit holders. The units of most REITs are publically traded.

Regular Account: That portion of the Oregon Public Employees Retirement Fund that excludes the Variable Account. A diversified investment portfolio for which the asset allocation and general investment policies are established and approved by the OIC. Tier One participants are guaranteed a minimum rate of return based on the long-term interest rate used by the actuary, currently 7.50 percent. Tier Two participants have no guaranteed rate of return and receive benefits that reflect the Regular Account's actual or realized investment return.
Return: The gain or loss in value of an investment over a given period to time expressed as a percentage of the original amount invested. For example, an initial investment of $100 that grows to $105 over one year has produced a 5% return.
Risk: The probability of losing money or not achieving the expected investment outcome.
Russell 3000 Index: Measures the investment performance of a composite comprised of stocks issued by the approximately 3,000 largest U.S. companies. Based on total market capitalization, this index represents approximately 98% of the investable U.S. equity market.
S&P/LSTA Leveraged Loan Index: The index is designed to mirror the market-weighted performance of the largest institutional leveraged loan portfolios based on market weightings, spreads and interest payments. Facilities are eligible for inclusion in the index if they are senior secured institutional term loans with a minimum initial spread of 125 basis points and minimum one-year term. Facilities are retired from the index when there is no bid posted on the facility for at least 12 successive weeks or when the loan is repaid.
Secondaries: The purchase and sale of existing limited partnership commitments to other limited partners and/or fund sponsors.
Sector: A particular group of stocks or bonds that usually characterize a given industry or economic activity. For example, "pharmaceuticals" is the name given to stocks issued by companies researching, manufacturing and selling over-the-counter and prescription medicines. "Corporates" is the name given to fixed income instruments issued by private and public companies.
Sector Funds: A pooled investment product that focuses on a particular industry or economic activity. For example, pooled funds that invest principally in technology stocks would be termed a technology sector fund.
Tracking Error: The amount by which an investor's investment performance differed from a corresponding or assigned benchmark. Usually measured and expressed as the standard deviation of returns relative to a pre-specified benchmark.
Unhedged: A term indicating that the value of one, more or an entire portfolio of assets may be affected by foreign currency fluctuations and that no deliberate attempt has been made to protect against such fluctuations.
Value Added: As used in real estate, may include office, retail, industrial and apartment properties, but may target structured investments in alternative property types such as hotels, student housing, senior housing and specialized retail uses. Portfolios or strategies that are positioned as Value Added are expected to produce returns between Core and Opportunistic portfolios/strategies. For example, a Value Added property may exhibit some "institutional" qualities such as good location and high design and construction quality, but may need significant leasing improvements to stabilized and enhance its value. Value Added investments may also include development opportunities with balanced risk/return profiles.
Value Stock: Stocks that appear to be undervalued for reasons other than low potential earnings growth. Value stocks usually have low price-to-earnings ratios, low price-to-book ratios and a high dividend yield.

Variable Account: The Variable Annuity Program allowed active PERS members to allocate a portion of their yearly employee contributions to a domestic equity portfolio. No such contributions were allowed after December 31, 2003. Active members who participated in the Variable Program had part of their balance invested in the Regular Account and part invested in the Variable Account. Unless a member explicitly elected to participate in the Variable Program, all of that member's employee contributions were invested in the Regular Account. This "primary" election allowed members to place 25 percent, 50 percent or 75 percent of their employee contributions in the Variable Account. Variable Account balances increase or decrease depending on the investment performance of the variable fund, and individual participant accounts are credited for any amount (gain or loss) available for distribution. The OIC's asset allocation policy purview only applies to the Regular Account since the OIC cannot control the investment option elections of Variable Program participants.
Venture Capital: Independently managed, dedicated pools of capital that focus on equity or equity-linked investments in privately held, high growth companies. Outside of the United States, the term venture capital is used as a synonym for all types of alternative or private equity.
Vintage Year: The calendar year in which an investment fund's first closing occurs. For example, the 1995 vintage year for venture capital includes all venture capital funds that held a first closing in 1995.

TAB 5 – Policy Updates
OPERF and other OST-managed Accounts

OIC Policy Updates April 26, 2017
Purpose To update several OIC Policies to conform with Treasury’s new PolicyStat application. Background This work is a continuation of the policy updates brought by staff beginning with the September 2015 meeting. As noted at that time:
In April 2015, Kim Olson informed the OIC of a new online application, PolicyStat, acquired by Oregon State Treasury (OST) to facilitate the management of policies and procedures for the Oregon Investment Council (OIC) and the rest of OST. As the current OIC Policies and Procedures have been migrated to this new application, staff is now engaged in a staged project to reformat existing documents to fit the new rubric approved by Treasury management. Of particular significance is the segregation of Policy and Procedure sections, a recommendation made by Cortex Applied Research during a review completed in August 2012. As staff moves to implement these recommendations going forward, revised policies will come before the OIC for approval, while operating procedures will be approved by the Chief Investment Officer.
Discussion The following is a brief summary of the attached Policies and updates thereto. Due to the quantity of revisions to INV 203, INV 204 and INV 205, we are providing both the revised policy and the previous policy for purposes of a side-by-side comparison. The remaining policies are provided only in their revised form.
1. INV 203: Dodd-Frank Regulatory Compliance
Changes: We are recommending updating the OIC’s existing Dodd-Frank policy to reflect current market practice. We continuously monitor best practices with respect to compliance matters pertaining to large institutional investors. As the guidance surrounding regulatory requirements evolves, the OIC is well served to update its policies from time to time to reflect such advice. Our outside legal counsel has recommended the enclosed and revised version of INV 203. This revised language does not represent a substantive change in policy or procedure, but more fully describes the requirements of the OIC’s external managers and provides a clearer metric for OIC staff to use in monitoring the investment managers’ performance.
The first policy is the revised version, followed by the previous version.

2
2. INV 204: Investment Performance Reports
Changes: The Director of Investment Operations (DIO) completely revised and reformatted this policy. The original is attached for comparison purposes. In the original, reporting requirements were listed for each asset class. The revised version avoids the repetition inherent in the previous policy by summarizing the report types and information provided. The updated policy also references the Investment Division’s newly created operations unit and the corresponding centralization of the division’s reporting activities. David Randall, the DIO, is now the primary contact for the division’s reporting function.
This revised policy was originally presented at the September 2016 OIC meeting. At that time, Council members presented concerns that the changes potentially reduced the deliverables. The revised policy addresses those concerns, and includes a reporting section on PERS. Changes to this policy retain the spirit of the original, but are still too extensive to try and summarize in this memo. Accordingly, we have attached both the original and revised versions of this policy for comparison purposes.
The first policy is the revised version, followed by the previous version.
3. INV 205: Consideration of Investments INV 206: Divestiture Initiatives
These two documents were combined into a single policy – INV 205: Consideration of Investments and Divestiture Initiatives.
Consideration of Investments was previously maintained in the form of an “advisory letter” articulating the guidelines within which the OIC would consider existing and potential investments. Following a discussion of this historical advisory letter format with legal counsel, we believe the OIC is better served to instead reconstitute this advisory letter as an integrated policy document. Therefore, we have removed references to “advisory letter” and reformatted the letter’s language into our now standard policy template.
The original INV 206 language remains largely the same. We removed policy statements 1, 2 and 3 because they are redundant with statute quotations or INV 205 language. The result is a reduced total number of investment policies and elimination of an anomalous advisory letter.
This revised policy was originally presented at the September 2016 OIC meeting. At that time, Council members presented concerns about the clarity of the language. The revised

3
policy addresses those concerns. The first policy is the revised version, followed by the previous version of INV 205, then the previous version of INV 206.
Public Equity Series (INV 601, 602, 603)
4. INV 601: Public Equity Investments: Strategic Role of Public Equity Securities within OPERF This policy was reformatted and approved by the OIC in April 2016. This policy was previously a main policy (INV 601) and three attachments. In this version, staff has combined two of the previous attachments (INV 601A and INV 601C) into the main body of INV 601. The remaining attachment has been renamed INV 601A (previously INV 601B).
Changes: Added Section (D) OST Staff Authority and Reporting and Section (previously in INV 601A, plus additional language) and (E) Investment Management Agreement Execution (previously in INV 601C, plus additional language).
Changes: INV 601A Investment Manager Benchmarks includes one new mandate (OST International Risk Premia) and deletes nine mandates (Internal RAFI, BlackRock Russell 1000 Growth and Value, Columbia Wanger, TT International, Wells Cap CEF, Pyramis, Victory, SSGA World X –US Index).
The first two policies are the revised versions of INV 601 and INV 601A, followed by the previous versions of INV 601A and INV 601C.
5. INV 602: Equity Investments: Selecting and Terminating Investment Management
Firms This policy was reformatted and approved by the OIC in April 2016. Addition: Added “Investment Officer” to this statement: “6a. Immediately following a termination, the Senior Investment Officer or Investment Officer for Public Equity shall notify the terminated firm.” Deletion: Deleted the phrase “transitioning securities through an index fund” from the following statement: “6c. Unless directed otherwise by the OIC, OST staff shall proceed with an liquidation plan that may include redistributing securities to the other, existing

4
managers, transitioning securities through an index fund or liquidating assets altogether.”
6. INV 603: Internal Equity - Portfolio Objectives and Strategies This policy was reformatted and approved by the OIC in April 2016. Change: This version removes the Russell/RAFI Fundamental Large Cap Index Strategy and inserts the International Developed Risk Premia Strategy.
Common School Fund Series (INV 901, 903-905)
7. INV 901: Common School Fund: Asset Classes, Asset Allocation, and Reporting Requirements This policy was reformatted and approved by the OIC in April 2016. This version contains minor language changes for improved clarity.
8. INV 903: Common School Fund: Public Equity Investments This policy was reformatted and approved by the OIC in April 2016. Addition: This version contains a new section (B) OST Staff Authority and Reporting. This section allows OST staff, with approval from the Chief Investment Officer and quarterly notification to the OIC, to:
• terminate “at will” any public equity manager mandate according to the terms of its contract with, and on behalf of, the OIC;
• exercise discretion to rebalance between and among managers within the public equity portfolio; and
• exercise discretion to retain any public equity manager that has been approved by the Council on behalf of OPERF.
In addition, OST staff, with approval from the Chief Investment Officer and OIC Consultant, will have discretion to convert any public equity long-only implementation to a 130/30 strategy, provided such implementation does not change the mandate’s role within the public equity portfolio.
9. INV 904: Common School Fund: Fixed Income Investments

5
This policy was reformatted and approved by the OIC in April 2016. Addition: This version contains a new section (B) OST Staff Authority and Reporting. This section allows OST staff, with approval from the Chief Investment Officer and quarterly notification to the OIC, to:
• terminate “at will” any fixed income manager mandate according to the terms of its contract with, and on behalf of, the OIC;
• exercise discretion to rebalance between, and among, managers within the fixed income portfolio; and
• exercise discretion to retain any fixed income manager that has been approved by the Council on behalf of OPERF.
10. INV 905: Common School Fund: Private Equity Investments This policy was reformatted and approved by the OIC in April 2016. Addition: This version contains a new section (B) OST Staff Authority and Reporting. This section allows OST staff, with approval from the Chief Investment Officer and quarterly notification to the OIC, to have discretion to retain any private equity manager/strategy that has been approved by the Council on behalf of OPERF.
Recommendation: Approve policy language as presented in the attached documents.

INV 203: Dodd-Frank Regulatory Compliance
OREGON INVESTMENT COUNCIL POLICY
INTRODUCTION & OVERVIEW
Summary Policy Statement
The State of Oregon by and through the Oregon Investment Council (“OIC”) acting on behalf of
certain funds (“OIC”) intends to transact in swaps, directly or indirectly through investment managers,
with dealers who will be acting as counterparties to and not as advisors to the OIC., Moreover, theand
OIC intends to institute policies and procedures that will enable itOIC to so transact and to make the
necessary representations to such dealers so that they dealers can comply with their business conduct
requirements under the Wall Street Transparency and Accountability Act of 2010 ("Dodd-Frank") and
rules and regulations thereunder.
Applicability
Classified represented, management service, unclassified executive service employees
BACKGROUND
Dodd-Frank imposes business conduct requirements generally on dealers in over-the-counter
derivative products and those business conduct requirements are expanded when the dealer transacts
with an entity such as the OIC. Pursuant to authority conferred by Dodd-Frank, the Commodity
Futures Trading Commission ("CFTC") promulgated business conduct rules and regulations for swap
dealers (i.e., dealers in “swaps” as defined in Section 1a(47) of the Commodity Exchange Act and
CFTC Regulation 1.3(xxx), which term includes over-the-counter derivatives on interest rates,
currencies, commodities and indices, including credit default swap indices).
A swap dealer will generally not transact with an entity such as the OIC if the dealer would be
considered to be an advisor of such entity because such status would require the swap dealer to act in
the best interests of the entity. In order for a swap dealer to not be considered to be an advisor to OIC
with a duty to act in the best interests of the OIC, the swap dealer must have a reasonable basis to
believe that the OIC has a representative that:
(i) has sufficient knowledge to evaluate the swap and the risks of the swap;,
(ii) is not subject to statutory disqualification;,
(iii) is independent of the swap dealer;,
(iv) undertakes to act in the best interest of the OIC;,
(v) makes appropriate and timely disclosures to the OIC;,
(vi) evaluates fair pricing and the appropriateness of the swap, consistent with any
guidelines of the OIC;, and
(vii) is subject to restrictions on political contributions imposed by a regulatory
authority.
A representative is considered to be independent if:
(a) the representative is not and within one year of representing the OIC was not

associated with the swap dealer;,
(b) there is no principal relationship between the representative and the swap dealer;,
(c) the representative provides timely and effective disclosure to the OIC of all material
conflicts of interest that could reasonably affect the judgment or decision making of the
representative, and the representative complies with policies and procedures reasonably
designed to manage and mitigate such conflicts of interest;,
(d) the representative is not directly or indirectly controlled by, in control of or under
common control with the swap dealer;, and
(e) the swap dealer did not recommend or introduce the representative to the OIC
within one year of the representative’s representation of the OIC in connection with the
swap.
A swap dealer is deemed to have a reasonable basis to believe that the OIC has a representative that
satisfies the foregoing requirements if:
(i) the OIC represents in writing that it has complied in good faith with written policies
and procedures reasonably designed to ensure that it has selected a representative that
meets the foregoing requirements, and that such policies and procedures provide for
ongoing monitoring of the representative’s performance of the requirements described
above;, and
(ii) the representative represents to the OIC and the swap dealer that the representative
has policies and procedures reasonably designed to ensure that it satisfies the foregoing
provisions, meets the independence test described above, and is legally obligated to
comply with the foregoing requirements by contract, regulation or other enforceable
duty.
To take advantage of the foregoing safe harbor, swap dealers will require the OIC either directly or
through its investment managers to make the written representations described above.
Policy Statements
Oregon State Treasury (“OST”) staff monitoring, combined with written representations obtained from
external investment managers, will provide the means for policy implementation.
(1) Before permitting any investment manager to engage in swaps on behalf of the OIC, the OIC shall have
a reasonable basis to believe that such representative satisfies the requirements of CFTC Regulation
§23.450, which requires that the OIC has a reasonable basis to believe that the representative:
(i) has sufficient knowledge to evaluate the swap transactions and risks;
(ii) is not subject to “statutory disqualification,” which term means grounds for refusal to register or
revoke, condition, or restrict the registration of the investment manager as set forth in Sections 8a(2)
and 8a(3) of the Commodity Exchange Act (“CEA”);
(iii) is “independent” of the swap dealer within the meaning of CFTC Regulation §23.450(c), and a
representative will be deemed to be independent of the swap dealer if:
(a) the representative is not and, within one year of representing OIC in connection with the
swap, was not an associated person of the swap dealer within the meaning of Section 1a(4)
of the CEA (i.e., was not a partner, officer, employee, agent or similar person that solicits
swaps or supervises such person);
(b) there is no principal relationship between the representative and the swap dealer. In this
regard, a principal relationship arises where a swap dealer is a principal of the representative
or the representative is a principal of the swap dealer. Principals include directors,
presidents, chief executive officers, chief operating officers, chief financial officers, chief
compliance officers, persons in charge of principal business units, general partners,
managing members, persons having the power to exercise a controlling influence over an
entity’s activities, 10% shareholders and persons entitled to receive 10% of the profits of an
entity;
(c) the representative: (1) provides timely and effective disclosures to OIC of all material
conflicts of interest that could reasonably affect the judgment or decision making of the
representative with respect to its obligations to OIC; and (2) complies with policies and
procedures reasonably designed to manage and mitigate such material conflicts of interest;
(d) the representative is not directly or indirectly, through one or more persons, controlled
by, in control of, or under common control with the swap dealer; and
(e) the swap dealer did not refer, recommend, or introduce the representative to the OIC
within one year of the representative’s representation of the OIC in connection with the
swap;
(iv) undertakes a duty to act in the best interests of the OIC;
(v) makes appropriate and timely disclosures to the OIC;
(vi) evaluates, consistent with any guidelines provided by the OIC, fair pricing and the
appropriateness of the swap; and
(vii) is subject to restrictions on certain political contributions imposed by the CFTC, the Securities
Exchange Commission, or a self-regulatory organization subject to the jurisdiction of any of such
commissions.
(2) The determination required in clause (1) above shall be made by OST staff;
(3) In making the determination required in clause (1), OST staff may reasonably rely upon written
representations provided by the representative, which may be in the form attached hereto; and
(4) OST staff shall monitor the investment manager’s performance with the items set forth in clause
(1) above.
EXCEPTIONS
None.
FORMS
The OIC shall require each investment manager that is authorized to transact in swaps to execute a
letter in substantially the form attached hereto.
REVIEW
This policy shall be reviewed as necessary and no less frequently than annually.
FEEDBACK
Your comments are extremely important to improving the effectiveness of this policy. If you would
like to comment on the provisions of this policy, you may do so by e-mailing the Policy Analyst. To
ensure your comments are received without delay, please list the policy number and name in your e-
mail's subject. Your comments will be reviewed during the policy revisions process and may result in
changes to the policy.

Appendix A
[Form of Representative Representation Letter]
[Letterhead of Representative]
[Date]
State of Oregon by and through the Oregon Investment Council
[OIC Address]
Re: Representation Letter for CFTC Regulation §23.450
Dear Sir/Madam:
[Name of Representative] (“Manager”) acts as investment manager to the State of Oregon by
and through the Oregon Investment Council (“OIC”) acting on behalf of certain funds (“OIC”) pursuant to
that Investment Manager Agreement, dated [Insert Date], between Manager and the OIC. Pursuant to that
agreement and in compliance with the guidelines therein, Manager may invest in derivative instruments.
Manager hereby represents and warrants to the OIC as follows, which representations and
warranties shall be continuously made at all times during which Manager acts as investment manager to the
OIC unless Manager otherwise notifies the OIC in writing:
(i) Manager is familiar with and understands Regulation §23.450 promulgated by the
Commodity Futures Trading Commission (“CFTC”);
(ii) Manager has policies and procedures reasonably designed to ensure that Manager
satisfies the applicable requirements of CFTC Regulation §23.450(b);
(iii) Manager meets the independence test of CFTC Regulation §23.450(c); and
(iv) Manager is legally obligated to comply with the applicable requirements of CFTC
Regulation §23.450(b) by agreement, condition of employment, law, rule, regulation or
other enforceable duty.
Sincerely,
[Name of Representative]
By: ___________________________
Name:
Title:


INV 204: Investment Performance Reports
INTRODUCTION & OVERVIEW
Summary Policy Statement
Oregon law requires the Treasurer, acting as chief investment officer for the State, among other duties,
to retain and manage investments of the investment funds. This policy establishes a uniform process for
reporting investment performance and activity, consistent with that mandate.
Purpose and Goals
The goal of this policy is to establish general parameters for reporting the performance and activity of
investment funds managed by Oregon State Treasury (OST).
Applicability
Classified represented, management service, unclassified executive service
Authority
ORS 293.731; 293.736; 293.741; 293.761; 293.766; 293.771
POLICY PROVISIONS
Definitions
Terms not otherwise defined herein have the meanings ascribed to them in ORS 293.701, et. seq.
Policy Statements
The Treasurer is tasked with the management of the investment funds and has delegated portions of that
task to the OST Chief Investment Officer and certain OST investment staff. As part of their duties, OST
Investment Division staff (“Staff”) are tasked with providing periodic reports on the investment funds to
various parties, as detailed below.
The Director of Investment Operations shall generally oversee preparation of each report and shall
obtain any information necessary for a report from applicable custodians and other third partyie service
providers. However, certain reports may be overseen by other Staff, including the Director of
Alternatives, the Director of Capital Markets and/or their designees.
COUNCIL REPORTS
Staff shall provide the Council with periodic reports (each an “OIC Report”) on the investment funds,
which includeing their performance history and a summary of transaction activity. Generally, each OIC
Report will be delivered to the Council on a monthly basis unless otherwise specifiedrequested by the

Council.
OIC Reports shall include relevant pPerformance information over applicable time periods shall
illuminate total plan performance as well as for both internally- and externally- managed investment
fund performances relative against relevanto appropriate benchmarks. These reports shall also include
and a summary of portfolio holdings, purchases and sales, as well as all gains and losses, total plan
performance; and may also include any other information Staff or the OIC deems relevant or useful.,
including information from custodians, consultants and other third parties. In most cases, tThe OIC
Reports in most cases will be asset classstrategy specific (i.e., Private Equity, Alternatives,
OpportunFixed Income, etc.istic Investments, Public Equities) or plan specific (i.e., OPERF, CSF, SAIF,
OSGP, etc. 457 Plan) specific.
Staff shall also assist the Council in providing periodic reports to the Governor and Legislative
Assembly on the investment funds’ performance and transaction activity. Such reports shall be provided
on a bi-annual basis orand at such other times as the Council considers in the public interest or as may
be required by statute or rule.
OST ANNUAL REPORT
Staff shall assist in the production of OST’s annual report, providing necessary information on the
investment funds, including their performance and transaction activity, including portfolio holdings,
purchases and sales as well as all gains and losses.
PERS REPORTS
Staff shall provide reports that will include returns for the OPERF Regular and Variable Account to the
Public Employees Retirement System (PERS), typically on a monthly basis, so that PERS is able to
determine the earnings rates to be credited to various accounts and reserves in OPERF in accordance
with applicable statutes and rules. The structure and methodology of these reports will be developed in
cooperation with PERS to reflect the reasonably determined the rate of return that should be periodically
credited to these accounts and reserves.
Staff shall also provide periodic reports to PERS or its designees as necessary for the timely and
accurate production of thate agency’s Comprehensive Annual Financial Report (CAFR).
THIRD PARTY REPORTS
Council and Staff may periodically employ consultants to provide advice or otherwise assist in the
management of the investment funds. Staff shall provide information and assist such consultants as
reasonably necessary in the preparation of reports for the Council, OST or other investment funds
stakeholders relating to the investment funds.
OTHER REPORTS
Staff shall provide information to OST internal and external auditors as may be requested to complete
annual audits of any investment fund and/or any comprehensive annual financial report ofor OST
reasury or any of its divisions.
Staff shall provide OST’s Finance Division with a monthly performance report for the holdings of the
Oregon Short Term Fund, and such other present or future investment funds as may be applicable, as
well as a summary of holdings and a portfolio compliance report.

Staff shall assist OST and other OST division staff in preparing reports related to the investment funds
or their management thereof.
Staff shall assist OST in providing information periodically to the public concerning the investment
funds via OST’s website and other sources as requested by the Treasurer and/or the Council.
PUBLIC REPORTS
Investment fund holdings and performance data are highly sensitive information. As such, Staff may
provide such information on a one-quarter lag basis when it will be used in any external or public
setting.
REPORT CONTENT
OIC Reports should include relevant information for each applicable investment fund and/or asset class,
including the Ffixed Iincome (both internally- and externally- managed), Ppublic Eequity (both
internally- and externally- managed), Rreal Eestate, Pprivate Eequity, Aalternatives and Oopportunity
portfolioies. Reports should generally include some or all of the following: a current holdings summary
of the investment fund/asset class holdings;, performance information including comparisons to
measured against one or more an applicable benchmarks;, security purchases and sales of securities,(or
funds, portfolio company or real property held, as applicable);, and gains and losses realized (or current
appraisal or valuation, as applicable).
All other reports shall contain information deemed relevant and/or responsive in Staff’s reasonable
discretion.
Exceptions
None.
Failure to Comply
Failure to comply with this policy may be cause for disciplinary action up to and including dismissal.
PROCEDURES and FORMS
None.
ADMINISTRATION
Review
Annually.
Feedback
Your comments are extremely important to improving the effectiveness of this policy. If you would like
to comment on the provisions of this policy, you may do so by e-mailing the Policy Analyst. To ensure
your comments are received without delay, please list the policy number and name in your e-mail's
subject. Your comments will be reviewed during the policy revisions process and may result in changes
to the policy.


INV 205: Consideration of Investments and Divestiture Initiatives
OREGON INVESTMENT COUNCIL POLICY
INTRODUCTION & OVERVIEW
Summary Policy Statement
This policy articulates the guidelines within which the Oregon Investment Council (“OIC” or “Council”)
considers existing and potential investments. The statutory standards of prudence and productivity are
the only standards that apply to the investment of the Oregon Public Employees Retirement Fund
(OPERF) and all other Oregon public trust funds. The OIC recognizes its obligation to adhere to
applicable law and that political, social and legal circumstances in various nations and regions of the
world may impact the productivity and prudence of investments made in or connected with those nations
and regions.
Applicability
Classified represented, management service, unclassified executive service
Authority
ORS 293.721, 292.726
The OIC can only consider investments that meet the productivity objectives of Oregon Revised Statutes
(ORS) 293.721 and the prudence standards of ORS 293.726. Each proposed investment is separately
evaluated based on its unique structure and potential in accordance with standard OIC and Oregon State
Treasury (“OST”) investment criteria. The standard stated in 293.721(1) "requires the exercise of
reasonable care, skill and caution, and is to be applied to investments not in isolation but in the context
of each investment fund's investment portfolio and as a part of an overall investment strategy, which
should incorporate risk and return objectives reasonably suitable to the particular investment fund."
ORS 293.721 states, in part: "Moneys in the investment funds shall be invested and reinvested to
achieve the investment objective of the investment funds, which is to make the moneys as productive as
possible." Under ORS 293.726 (1) and (2), the OIC and its investment officer (the "Treasurer" or OST)
also are also required to invest with prudence, reasonable care, skill and caution. Under subsection (4),
the OIC and OST must adhere to the fundamental fiduciary duties of loyalty and impartiality.
POLICY PROVISIONS
Policy Statements
I. Consideration of Investments

The Council's statutory duties, as defined in ORS 293.721, to formulate and review investment
policies consistent with the productivity objectives set forth in ORS 293.721 and the prudence
standards set forth in ORS 293.726, shall take precedence over any other consideration. The
Council's implementation of these objectives and standards can be stated as follows:
A. Consideration of investments is limited to those which, when judged solely on the basis of
economic value, enhance portfolio returns on a risk-adjusted basis;
B. Any benefit an investment may confer, other than meeting the statutory standards of prudence
and productivity, is not and shall not be considered the responsibility or within the control of
OST, the Council, or its agents;
C. For allocation purposes, proposed investments are categorized by asset class and subject to the
Council's asset allocation guidelines, ranges, and targets;
D. Proposed investments shall be consistent with the Council's desired level of portfolio
diversification as defined by the mix of asset types and allocations to different economic,
industry, and geographic exposures;
E. Investments shall at all times conform to the laws, requirements, policies, and procedures
governing the Council, OST, and OPERF;
F. Because investments are part of an actively managed portfolio, full due diligence is exercised.
This due diligence, conducted by OST staff, designated private managers, consultants, and/or
advisors, addresses, at a minimum, (1) legal sufficiency, (2) investment sufficiency, and (3) the
identification of any potential conflicts of interest. Only those investment proposals that comply
with the Council's prescribed proposal format shall be considered. The costs associated with all
legal and financial review for each investment proposal shall be addressed pursuant to policy
consistent with similar investment types. Where no such policies exist, these costs shall be borne
entirely by the proposer. Furthermore, the proposer shall provide all information that the
Council, OST staff and designated private managers, consultants and/or advisors deem necessary
to perform appropriate levels of due diligence and evaluation. If the information is not provided
within a specified, reasonable time frame, the Council, OST staff, or designated private
managers, consultants, and/or advisors may discontinue their individual and collective due
diligence and evaluation considerations. All investments that are approved by the Council shall
be subject to a continuing obligation to disclose certain requested information;
G. Investments shall be valued at current market prices and will be subject to performance
measurement at least annually;
H. The Council carefully considers investment structures such as partnerships and joint ventures
when evaluating an initial investment and ongoing participation with a sponsoring entity. The
Council will only consider those structures that appropriately align financial rewards and risk
among all other partners/participants. OST staff or designated private managers, consultants
and/or advisors shall consider and recommend to the Council structural features to mitigate
investment risks, losses, and liabilities such as federal government credit insurance, personal
guarantees, corporate guarantees, cross-corporate collateralization, and other such mechanisms.
Furthermore, only those investment proposals that stipulate explicit exit strategies and define the
means by which investment returns may be realized shall be considered;
I. Due to resource constraints, investment proposals that may impose unreasonable administrative
burdens directly upon the Council, OST investment staff, or the State Treasurer shall not be
considered;

J. All persons or firms managing, evaluating, or monitoring investments on behalf of the Council
shall act in a fiduciary capacity when giving advice or information to the Council and OST staff;
K. The OIC recognizes that excellent investment opportunities may exist within Oregon and
actively considers such in-state investments, but specific decisions regarding whether or not
investments are made in Oregon-based companies or real property are delegated to third-party
managers selected by the OIC;
L. The Council recognizes that Oregon is an underserved market for venture capital investments
and that such circumstances may, from time to time, result in attractive investment opportunities.
Further, the Council recognizes that prudent, local investments may satisfy the exclusive benefit
rule for pension plan participants, as well as provide the collateral benefit of encouraging
economic development within the state. Accordingly, whenever diversification and quality
standards permit, the Council will endeavor to hire local partners or will encourage leading
national firms to open an Oregon office; and
M. The methodology that the Council applies to all its investments also applies and will be applied
to investment opportunities within Oregon. Consequently, the risk, return, and liquidity
characteristics of investments in Oregon must be determined to assure that such characteristics
are consistent with (i.e., meet or exceed) the evaluation criteria, legal standards, and investment
policies that govern all Council investment activity.
II. Divestiture Initiatives
While social, political, social, and legal circumstances material to prudent and productive investment
activities should receive appropriate consideration in making and maintaining investments, such
factors may not be given undue weight (i.e., weight disproportionate to their impact upon economic
prudence and productivity) when implementing the OIC's and OST's investment responsibility to a)
act with prudence to make the moneys under their care as productive as possible and b) adhere to
their fundamental fiduciary duties of loyalty and impartiality.
The OIC and OST are subject to, and will comply with, applicable federal and state law.
A. The federal government of the United States of America (the "United States") has preeminent
governmental power for those subject to its jurisdiction with respect to the conduct of foreign
policy and interstate commerce. When the United States sanctions or restricts investment by
subject entities in other nations, as when it regulates interstate commerce, the OIC requires all of
its investment managers to comply with those regulations, as applicable. The OIC also expects
companies in which it invests, that are subject to such regulations, to comply with those
regulations.
B. The OIC requires its investment managers to consider all material risks and benefits when
making an investment. Material risks or benefits may include those factors that arise from the
social, political, social, or legal circumstances affecting regions or governments with or within
which companies considered for investment conduct business.
C. OST will maintain a dialogue with the OIC's proxy voting agent(s) and investment managers to
ascertain how ballot issues and investment decisions related to international investments and
compliance with government regulations are addressed.
D. When not inconsistent with the policies described above, the OIC prefers that its managers avoid
holdings in companies doing business with or in countries where such conduct is prohibited if

performed by companies subject to the jurisdiction of the United States.
Exceptions
None.
Failure to Comply
Failure to comply with this policy may be cause for disciplinary action up to and including dismissal.
PROCEDURES and FORMS
None.
ADMINISTRATION
Feedback
Your comments are extremely important to improving the effectiveness of this policy. If you would like
to comment on the provisions of this policy, you may do so by e-mailing the OST Policy Analyst. To
ensure your comments are received without delay, please list the policy number and name in your e-
mail's subject. Your comments will be reviewed during the policy revisions process and may result in
changes to the policy.


INV 601: Public Equity Investments: Strategic Role of Public Equity
Securities within OPERF
OREGON INVESTMENT COUNCIL POLICY
Summary Policy Statement
The strategic role of publicly-traded equity securities is to provide enhanced return and diversification
opportunities for the Oregon Public Employees Retirement Fund ("OPERF" or the "Fund"). The OPERF
public equity portfolio also provides liquidity relative to the Fund's cash flow requirements. Staff, with
approval from the Chief Investment Officer (CIO) and quarterly notification to the OIC, will have the
discretion to rebalance between and among managers with the public equity portfolio. Public equity
securities are subject to the specific, strategic allocation targets established by OIC Policy INV 215: OPERF
Asset Allocation and Rebalancing Policy.
Purpose and Goals
The purpose of these Public Equity Investment Policies & Strategies is to define the objectives of public
equities as an asset class within the general investment policies of the Oregon Investment Council ("OIC" or
the "Council"), and to outline strategies used to implement the Council's public equity investment policies.
POLICY PROVISIONS
Policy Statements
A. GENERAL POLICY
To provide one of the highest expected returns among approved OPERF asset classes. Over the long-
term, public equity returns are expected to exceed inflation by approximately 5 percent on an average,
annual basis.
B. OBJECTIVES
1. To achieve a public equities portfolio return of 0.75 percent or more above the MSCI All Country
World Index Investable Market Index (ACWI IMI) (net) over a market cycle of three to five years and
on a net-of-fees basis.
2. To manage active risk to a targeted annualized tracking error of 0.75 to 2.0 percent, relative to the
MSCI ACWI IMI (net).
A. Objectives
1. To provide one of the highest expected returns among approved OPERF asset classes. Over the long-
term, public equity returns are expected to exceed inflation by approximately 5 percent on an average,
annual basis.
2. To achieve a public equities portfolio return of 0.75 percent or more above the MSCI All Country
World Index Investable Market Index (ACWI IMI) (net) over a market cycle of three to five years on
a net-of-fees basis.
3. To manage active risk to a targeted annualized tracking error of 0.75 to 2.0 percent, relative to the
MSCI ACWI IMI (net).
C. DIVERSIFICATION

Subject to periodic review and revision, the Council adopts the following strategic allocation targets:
1. The OPERF public equity portfolio shall be structured on a global basis, seeking to loosely
replicate the country and market capitalization characteristics of the investable universe of public
equity securities which can be further categorized as U.S., non-U.S. developed countries and
emerging market countries.
Allocation Targets Ranges
U.S. ACWI IMI weight +/- 10%
Non-U.S. ACWI IMI weight +/- 10%
Emerging Markets ACWI IMI weight +/- 4%
2. A strategic allocation to Size (small cap) and Value (style exposure), domestically:
Allocation Targets Ranges
U.S. Small Cap Overweight 70% 0% - 100%
U.S. Value 60% +/- 10%
Note: The U.S. small cap overweight is based on the Russell 2000 index weight relative to the Russell 3000 index weight,
the latter of which approximates 8%. A 70% U.S. Small Cap overweight target equates to a 13.6% [((8% x (1+0.7)])
allocation within the Domestic Equity portfolio. The U.S. value target is determined and calculated using a Russell 3000
baseline which weighs growth and value equally. A 60% U.S. Value weight implies that the US Growth weight is 40%.
3. A 25% strategic allocation of the OPERF Public Equity portfolio to Low Volatility strategies,
globally:
Allocation Targets Ranges
Global Low Volatility 25% +/- 10%
4. Unless tax, regulatory or liquidity constraints suggest otherwise, diversify public equity allocations
across the stock markets of all investable countries to ensure exposure to a wide range of investment
opportunities, and participate broadly in those markets in an attempt to capture the full market rate of
equity return generated therein. The size of any commitment to an individual investment strategy will
be based on that strategy's expected portfolio impact, the Staff's confidence in the strategy's manager,
the manager's investment style, and the capacity available in/with a particular strategy/manager.
5. Maintain an overall equity portfolio capitalization that broadly reflects the MSCI ACWI IMI, but with
deliberate, and systematic overweights to small capitalization and value stocks. These strategic
overweights or "tilts" are based on and supported by robust empirical research that historically links
persistent and pervasive evidence of excess returns to systematic small cap and value "factor"
exposures. Implementation of other such "factor" tilts may be considered at the manager, strategy or
mandate level upon approval of both the Chief Investment Officer (CIO) and OIC.
6. Invest opportunistically, using unique investment approaches, within a controlled and defined
portfolio allocation.
7. Enhance returns through selective active management provided such actively-managed strategies
demonstrate empirical efficacy relative to embedded factor exposures and net of all fees and

transactions costs.
8. Actively-managed strategies are expected to outperform stated benchmarks on an after-fee and risk-
adjusted basis. Comparisons against a representative peer group universe will also be considered in
evaluating the performance and risk characteristics of these strategies.
9. Benchmarks assigned to all non-U.S. strategies should be unhedged. Managers may be permitted to
hedge currency exposures, and in cases where currency represents an explicit element of a manager's
stated investment approach, may take active currency positions; however, all managers will be
measured against an unhedged benchmark.
The Council's selection of active managers will be based on those managers' demonstrated ability to add
value on a "triple net" basis (i.e., net of all fees, transactions costs and factor exposures) relative to a
passive management alternative. Additional considerations include managers' stated style and volatility
parameters relative to the strategic allocation targets outlined above
Strategies
1. The OPERF public equity portfolio shall be structured on a global basis, seeking to loosely replicate
the country and market capitalization characteristics of the investable universe of public equity
securities which can be further categorized as U.S., non-U.S. developed countries and emerging
market countries.
2. Unless tax, regulatory or liquidity constraints suggest otherwise, diversify public equity allocations
across the stock markets of all investable countries to ensure exposure to a wide range of investment
opportunities, and participate broadly in those markets in an attempt to capture the full market rate of
equity return generated therein. The size of any commitment to an individual investment strategy will
be based on that strategy's expected portfolio impact, the Staff's confidence in the strategy's manager,
the manager's investment style, and the capacity available in/with a particular strategy/manager.
3. Maintain an overall equity portfolio capitalization that broadly reflects the MSCI ACWI IMI, but with
deliberate and systematic overweights to small capitalization and value stocks. These strategic
overweights or "tilts" are based on and supported by robust empirical research that historically links
persistent and pervasive evidence of excess returns to systematic small cap and value "factor"
exposures. Implementation of other such "factor" tilts may be considered at the manager, strategy or
mandate level upon approval of both the Chief Investment Officer (CIO) and OIC.
4. Invest opportunistically, using unique investment approaches, within a controlled and defined
portfolio allocation. Specifically, "130/30" strategies may be implemented with any existing OPERF
public equity mandate conditional upon consultant and CIO concurrence and provided such
implementation does not change the mandate's role within the public equity portfolio. Staff will report
any such 130/30 implementations to the Council in the quarter immediately following the
implementation.
5. Enhance returns through selective active management provided such actively-managed strategies
demonstrate empirical efficacy relative to embedded factor exposures and net of all fees and
transactions costs.
6. Actively-managed strategies are expected to outperform stated benchmarks on an after-fee and risk-
adjusted basis. Comparisons against a representative peer group universe will also be considered in
evaluating the performance and risk characteristics of these strategies.
7. Benchmarks assigned to all non-U.S. strategies should be unhedged. Managers may be permitted to
hedge currency exposures, and in cases where currency represents an explicit element of a manager's
stated investment approach, may take active currency positions; however, all managers will be
measured against an unhedged benchmark.
8. The Council's selection of active managers will be based on those managers' demonstrated ability to
add value on a "triple net" basis (i.e., net of all fees, transactions costs and factor exposures) relative
to a passive management alternative. Additional considerations include managers' stated style and
volatility parameters relative to the strategic allocation targets set forth in Appendix A. Finally, the
management guidelines described in Appendix C will be attached to and incorporated into the
Council's contract with each investment manager.
D. OST STAFF AUTHORITY & REPORTING
1. With CIO approval and subsequent quarterly reporting to the OIC, staff will also have
discretion to rebalance between and among managers within the public equity portfolio. The
aggregate structural characteristics of the public equity portfolio will be considered during
such rebalancing, while re-allocations between asset classes shall remain governed by Policy
INV 215: OPERF Asset Allocation and Rebalancing Policy.
2. 130/30 strategies may be implemented with any existing OPERF public equity mandate,
conditional upon consultant and CIO concurrence, and provided such implementation does not
change the mandate's role within the public equity portfolio. Staff will report any such 130/30
implementations to the Council in the quarter immediately following the implementation.
3. On a quarterly basis, staff will prepare and deliver to the Council a report that includes public
equity portfolio performance relative to return and risk objectives as outlined in this policy
including the portfolio’s style (growth/value) and construction (active/passive) weightings, as
well as its geographic allocation relative to the MSCI ACWI IMI benchmark.
E. INVESTMENT MANAGEMENT AGREEMENT (IMA) EXECUTION
Management guidelines shall be attached to and incorporated into every separate account contract entered
into between the Council and an investment manager. These guidelines may be modified from time to time
as considered necessary by the CIO; however, the assigned benchmark may not be changed without OIC
approval, and each contract must specify the following:
1. The specific category to which a manager’s strategy is assigned;
2. A description of the manager’s investment style;
3. The manager’s specific performance objective relative to an index or passively managed
alternative;
4. The strategy’s expected risk (tracking error) relative to its assigned benchmark;
5. Portfolio characteristics which the OIC expects the manager’s strategy to exhibit on average
throughout a market cycle; and
6. A list of permissible equity securities in which the manager may invest.

Exceptions
None.
Failure to Comply
Failure to comply with this policy may be cause for disciplinary action up to and including dismissal.
PROCEDURES AND FORMS
A. OST Procedure: Investment Manager Benchmarks (Appendix A)
PROCEDURES AND FORMS
A. OIC Policy: Public Equity Strategic Allocation Targets (Appendix A)
B. OST Procedure: Investment Manager Benchmarks (Appendix B)
C.A. OIC Policy: Management Guidelines (Appendix C)
ADMINISTRATION
Feedback
Your comments are extremely important to improving the effectiveness of this policy. If you would like to
comment on the provisions of this policy, you may do so by e-mailing the Policy Analyst. To ensure your
comments are received without delay, please list the policy number and name in your e-mail's subject. Your
comments will be reviewed during the policy revisions process and may result in changes to the policy.
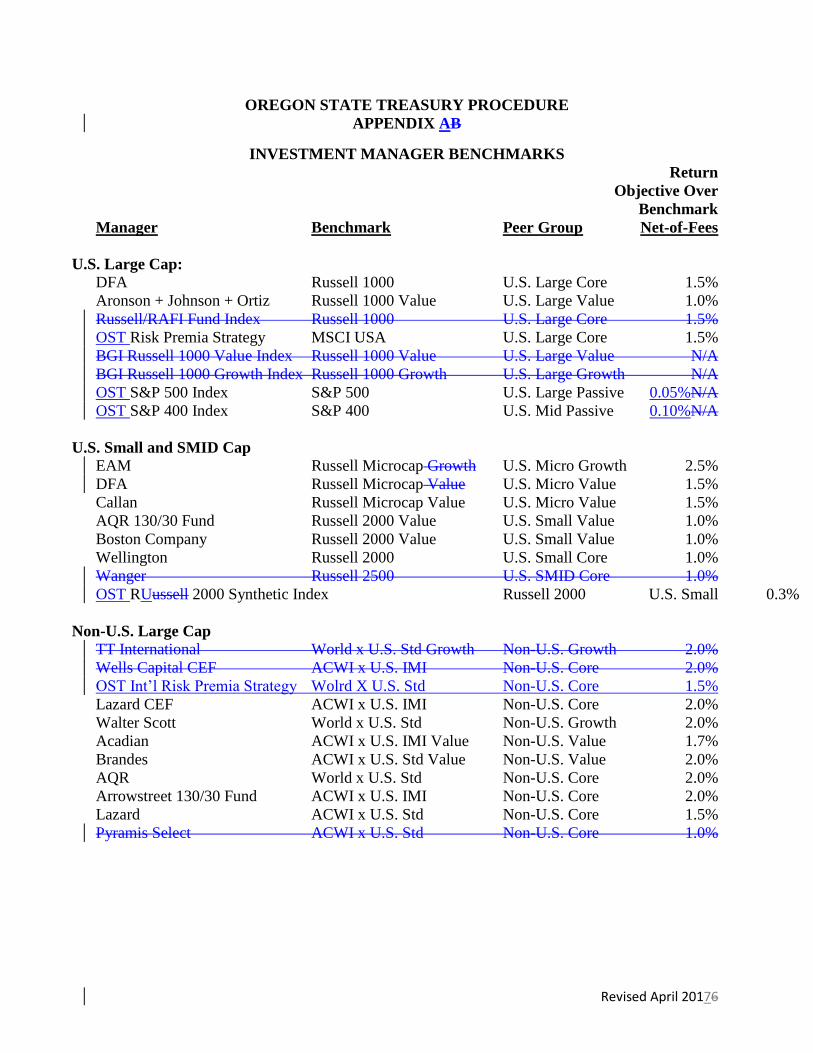
Revised April 20176
OREGON STATE TREASURY PROCEDURE
APPENDIX AB
INVESTMENT MANAGER BENCHMARKS
Return
Objective Over
Benchmark
Manager Benchmark Peer Group Net-of-Fees
U.S. Large Cap:
DFA Russell 1000 U.S. Large Core 1.5%
Aronson + Johnson + Ortiz Russell 1000 Value U.S. Large Value 1.0%
Russell/RAFI Fund Index Russell 1000 U.S. Large Core 1.5%
OST Risk Premia Strategy MSCI USA U.S. Large Core 1.5%
BGI Russell 1000 Value Index Russell 1000 Value U.S. Large Value N/A
BGI Russell 1000 Growth Index Russell 1000 Growth U.S. Large Growth N/A
OST S&P 500 Index S&P 500 U.S. Large Passive 0.05%N/A
OST S&P 400 Index S&P 400 U.S. Mid Passive 0.10%N/A
U.S. Small and SMID Cap
EAM Russell Microcap Growth U.S. Micro Growth 2.5%
DFA Russell Microcap Value U.S. Micro Value 1.5%
Callan Russell Microcap Value U.S. Micro Value 1.5%
AQR 130/30 Fund Russell 2000 Value U.S. Small Value 1.0%
Boston Company Russell 2000 Value U.S. Small Value 1.0%
Wellington Russell 2000 U.S. Small Core 1.0%
Wanger Russell 2500 U.S. SMID Core 1.0%
OST RUussell 2000 Synthetic Index Russell 2000 U.S. Small 0.3%
Non-U.S. Large Cap
TT International World x U.S. Std Growth Non-U.S. Growth 2.0%
Wells Capital CEF ACWI x U.S. IMI Non-U.S. Core 2.0%
OST Int’l Risk Premia Strategy Wolrd X U.S. Std Non-U.S. Core 1.5%
Lazard CEF ACWI x U.S. IMI Non-U.S. Core 2.0%
Walter Scott World x U.S. Std Non-U.S. Growth 2.0%
Acadian ACWI x U.S. IMI Value Non-U.S. Value 1.7%
Brandes ACWI x U.S. Std Value Non-U.S. Value 2.0%
AQR World x U.S. Std Non-U.S. Core 2.0%
Arrowstreet 130/30 Fund ACWI x U.S. IMI Non-U.S. Core 2.0%
Lazard ACWI x U.S. Std Non-U.S. Core 1.5%
Pyramis Select ACWI x U.S. Std Non-U.S. Core 1.0%

Revised April 20176
Return
Objective Over
Benchmark
Manager Benchmark Peer Group Net-of-Fees
Non-U.S. Large Cap (cont.)
SSgA World ex-US Index World x U.S. Std Non-U.S. Passive N/A
Non-U.S. Small Cap
DFA World x U.S. SC Value Non-U.S. Small Value 1.5%
Harris Associates ACWI x U.S. SC Value Non-U.S. Small Value 2.0%
Pyramis Select World x U.S. SC Non-U.S. Small Core 2.0%
Victory International World x U.S. SC Non-U.S. Small Growth 2.0%
DFA Global x U.S. Micro Non-U.S. Small Value 2.0%
EAM Investors Global x U.S. Micro Non-U.S. Small Growth 2.0%
Emerging Markets
Arrowstreet EM IMI Emerging Markets 2.0%
DFA EM Small Cap Emerging Markets 1.5%
William Blair EM Small Cap Emerging Markets 2.0%
Genesis EM IMI Emerging Markets 2.0%
William Blair EM Std Emerging Markets 2.0%
Westwood Global EM Std Emerging Markets 2.5%
Global
AllianceBernstein Value ACWI Value Std Global Value 2.0%
LA Capital Low Volatility ACWI Std Global Low Volatility 0.0%
Acadian Low Volatility ACWI IMI Global Low Volatility 0.0%
AQR Low Volatility ACWI Std Global Low Volatility 0.0%
Arrowstreet Low Volatility 70% ACWI IMI + 30% Cash Global Low Volatility 0.0%
ACWI – MSCI All-Country World Index (U.S. + Non-U.S. Developed + Emerging Markets)
IMI – MSCI IMI Index (Large Cap + Mid Cap + Small Cap)
Std – MSCI Standard Index (Large Cap + Mid Cap)
SC – MSCI Index (Small Cap)
EM – MSCI Emerging Markets Index

Revised October 2015
OREGON INVESTMENT COUNCIL POLICY
APPENDIX A
PUBLIC EQUITY
STRATEGIC ALLOCATION TARGETS
Subject to periodic review and revision, the Council adopts the following strategic allocation
targets1:
a. Capitalization exposure similar to stated benchmark with the exception of strategic
overweights to small cap and value factors;
b. The Council's strategic allocation targets represent percentages of the total OPERF public
equity portfolio. Each such target has an accompanying percentage range. The strategic
allocation targets and ranges are summarized as follows:
Targets Ranges
U.S. ACWI IMI weight +/- 10%
Non-U.S. ACWI IMI weight +/- 10%
Emerging Markets ACWI IMI weight +/- 4%
U.S. Small Cap Overweight 70% 0% - 140%
U.S. Value 60% +/- 10%
Note: The U.S. small cap overweight is based on the Russell 2000 index weight relative
to the Russell 3000 index weight, the latter of which approximates 8%. The U.S. value
overweight is determined and calculated using a Russell 3000 baseline.
c. On a quarterly basis, staff will prepare and deliver to the Council a report that includes
public equity portfolio performance relative to return and risk objectives as outlined in
this policy including the portfolio’s style (growth/value) and construction (active/passive)
weightings as well as its geographic allocation relative to the MSCI ACWI IMI
benchmark. With CIO approval and subsequent quarterly reporting to the OIC, staff will
also have discretion to rebalance between and among managers within the public equity
portfolio. The aggregate structural characteristics of the public equity portfolio will be
considered during such rebalancings, while re-allocations between asset classes shall
remain governed by Policy INV 215: OPERF Asset Allocation and Rebalancing Policy.
1 All targets measured relative to the MSCI ACWI IMI index.

OREGON INVESTMENT COUNCIL POLICY
APPENDIX C
MANAGEMENT GUIDELINES
Management guidelines shall be attached to and incorporated into every separate account
contract entered into between the Council and an investment manager. These guidelines may be
modified from time to time as considered necessary by the CIO; however, the assigned
benchmark may not be changed without OIC approval, and each contract must specify the
following:
1. The specific category to which a manager’s strategy is assigned;
2. A description of the manager’s investment style;
3. The manager’s specific performance objective relative to an index or passively
managed alternative;
4. The strategy’s expected risk (tracking error) relative to its assigned benchmark;
5. Portfolio characteristics which the OIC expects the manager’s strategy to exhibit on
average throughout a market cycle; and
6. A list of permissible equity securities in which the manager may invest.
Revised October 2015

INV 602: Equity Investments: Selecting and Terminating
Investment Management Firms
OREGON INVESTMENT COUNCIL POLICY
INTRODUCTION & OVERVIEW
Summary Policy Statement
The Oregon Investment Council (OIC) may enter into contracts with one or more persons whom the OIC
determines to be qualified, whereby the persons undertake, in lieu of the investment officer, to perform the
functions specified in ORS 293.736 to the extent provided in the contract (ORS 293.741). Staff, with
approval from the Chief Investment Officer (CIO) and quarterly notification to the OIC, may terminate "at
will" any manager according to the terms of its contract with and on behalf of the OIC.
Purposes and Goals
The goal of this policy is to establish criteria for selecting and terminating public equity investment
managers.
Authority
ORS 293.736; ORS 293.741.
POLICY PROVISIONS
A. PolicyOLICY StatementsTATEMENTS
1. Factors to be considered when hiring an investment management firm may include, but are not
limited to the following:
a. The firm's major line of business;
b. The firm's oOwnership and organizational structure of the firm;
c. The background and experience of the firm’s key members of the firm, including the portfolio
manager expected to be responsible for the Oregon account;
d. The size of the firm's asset base, and the proportion of that base that would be comprised by
Oregon's portfolio if the firm were hired;
e. Equity managers will be screened by staff and the OIC's consultant via various quantitative and
qualitative means. At least one visit to the firm's offices should be made prior to hiring and
funding;
f. If the firm has a readily determinable investment style, it should complement those of existing
managers; and
g. Firms should not be hired on a short-term or trial basis.
2. Factors to be considered for the termination of an investment management firm may include, but are
not limited to the following:

h.a. Major personnel changes within the firm's decision-making group;
i.b. Changes in the firm's ownership or organizational structure;
j.c. Administrative problems;
k.d.Radical or continual changes in investment style;
l.e. Inferior performance, although a firm should be given ample time to demonstrate the purported
efficacy of its strategy. Performance deficiencies during short-term time periods (e.g., quarterly
or annually) shall not be the basis for termination so long as the firm can demonstrate that it is
adhering to its defined investment philosophy. A firm's philosophy must continue to enjoy
confidence with Staff and the OIC for inclusion in the Oregon portfolio, and the firm should
compare reasonably well with its peers using a similar investment style; and
m.f. Non-compliance with contractual responsibilities to the OIC.
3. Selection of Investment Management Firms.
n.a. OST investment staff shall meet with and obtain information from prospective investment
management firms. Members of the OIC may also choose to familiarize themselves with
prospective firms.
o.b.Consultants may be used to assist in evaluating prospective investment management firms;
however, the OIC will not delegate its policy- or decision-making responsibilities to consultants
or others.
p.c. The OIC shall select investment managers by majority vote.
q.d.The Chief Investment Officer is authorized to engage and fund any systematic or passive equity
strategy considered necessary to allocate assets from terminated or defunded managers or to fill
gaps identified in, or reduce risk in, the Public Equity portfolio. Any such actions shall be
communicated to the OIC on a quarterly basis.
4. Investment Manager Selection Criteria
r.a. Identification of a strategic role within the Public Equity portfolio that a prospective investment
manager shall fulfill.
s.b. Description of the manager's style, or how the manager will fulfill the proposed, strategic role.
t.c. Identification of the universe of securities from which the manager will construct its portfolio.
u.d.Identification of the expected risk level, as measured by commonly accepted investment risk
measures, relative to the strategic role the prospective investment manager shall fulfill. The risk
level can be expressed either relative to a) the universe of securities from which the manager
selects; b) other, similar managers; or c) the market as a whole. Alternatively, the risk level can
be expressed in absolute terms.
v.e. Identification of a specific performance objective. The performance objective should be
expressed on a risk-adjusted basis. For example, a manager's performance may be compared to

an index, which represents the universe of securities from which the manager may select, plus
some degree of excess return over that index which is commensurate with the risk the manager
takes to achieve that excess return.
w.f. Identification of a time horizon considered acceptable by the manager and the OIC for the
delivery of the expected performance results. This time horizon should be determined with
consideration for an appropriate market cycle for that manager's specific management style. A
manager's specific management style should also inform the selection of an appropriate index. A
market cycle is defined as "peak to trough" performance for the corresponding index.
5. Compensation of Investment Management Firms.
x.a. Management and/or performance-based fees shall be negotiated by staff.
y.b.Typically, a manager's fees are set as a percentage of assets managed, and vary on a sliding scale
inversely with the total value of assets managed by the firm.
6. Terminating Management Firms.
z.a. Immediately following a termination, the Senior Investment Officer or Investment Officer for
Public Equity shall notify the terminated firm.
aa.b. Separate account managers will be instructed to discontinue trading immediately, and
the custodian will be instructed to suspend trading in that same account.
bb.c. Unless directed otherwise by the OIC, OST staff shall proceed with a liquidation plan
that may include redistributing securities to the other, existing managers, transitioning securities
through an index fund or liquidating assets altogether.
cc.d. For equity mandates structured through commingled trusts, OST staff shall ensure
that a liquidation or in-kind transfer is effected in a timely and efficient manner given all relevant
constraints and parameters.
B. OST StaffTAFF AuthorityUTHORITY & ReportingEPORTING
1. OST Staff, with approval from the Chief Investment Officer (CIO) and quarterly notification to the
OIC, may terminate "at will" any manager according to the terms of its contract with and on behalf of
the OIC.
2. OST Staff, with approval from the Chief Investment Officer (CIO) and quarterly notification to the
OIC is authorized to engage and fund any systematic or passive equity strategy considered necessary
to allocate assets from terminated or defunded managers or to fill gaps identified in, or reduce risk in,
the Public Equity portfolio.
Exceptions
None.
Failure to Comply
Failure to comply with this policy may be cause for disciplinary action up to and including dismissal.

PROCEDURES and FORMS
None
ADMINISTRATION
Feedback
Your comments are extremely important to improving the effectiveness of this policy. If you would like to
comment on the provisions of this policy, you may do so by e-mailing the Policy Analyst. To ensure your
comments are received without delay, please list the policy number and name in your e-mail's subject. Your
comments will be reviewed during the policy revisions process and may result in changes to the policy.

INV 603: Internal Equity – Portfolio Objectives and Strategies
OREGON INVESTMENT COUNCIL POLICY
INTRODUCTION & OVERVIEW
Summary Policy Statement
All internal equity investments shall be authorized by a public equity investment officer, and such
authorization shall be documented in accordance with portfolio guidelines established by the Oregon
Investment Council (OIC). Subject to prior notification of the OIC, the Chief Investment Officer (CIO) has
the authority to approve changes to the "Permitted Holdings" section of this policy.
Purpose and Goals
The purpose of this policy is to specify portfolio strategies staff is authorized to manage internally and to
define governing risk, performance, and permitted investments parameters.
POLICY PROVISIONS
Policy Statements and Strategies
S&P 500 Index Strategy
1. The objective of the S&P 500 Index Strategy is to closely match the S&P 500 Total Return Index
performance using full index replication.
2. The S&P 500 Index Strategy is expected to outperform the S&P 500 Total Return Index by 5 basis
points annualized over a market cycle with an expected tracking error of 10 basis points or less.
S&P 400 Index Strategy
1. The objective of the S&P 400 Index Strategy is to closely match the S&P 400 Total Return Index
performance using full index replication.
2. The S&P 400 Index Strategy is expected to outperform the S&P 400 Total Return Index by 10 basis
points annualized over a market cycle with an expected tracking error of 30 basis points or less.
Russell 2000 Synthetic Index Strategy
1. The objective of the Russell 2000 Index Strategy is to closely match the Russell 2000 Total Return
Index performance using synthetic replication.
2. The Russell 2000 Index Strategy is expected to outperform the Russell 2000 Index Total Return Index
by 30 basis points annualized over a market cycle with an expected tracking of 50 basis points or less.
Russell/RAFI Fundamental Large Cap Index Strategy
The objective of the RAFI/Russell 1000 Strategy is to outperform the Russell 1000 Total Return Index by
200 basis points annualized over a market cycle with an expected tracking error of 450 basis points or less.
This strategy is managed using fundamental factors, and its security weights are derived from non-price
metrics such as sales, earnings, book value, and dividends. A key tenet behind the fundamental strategy is
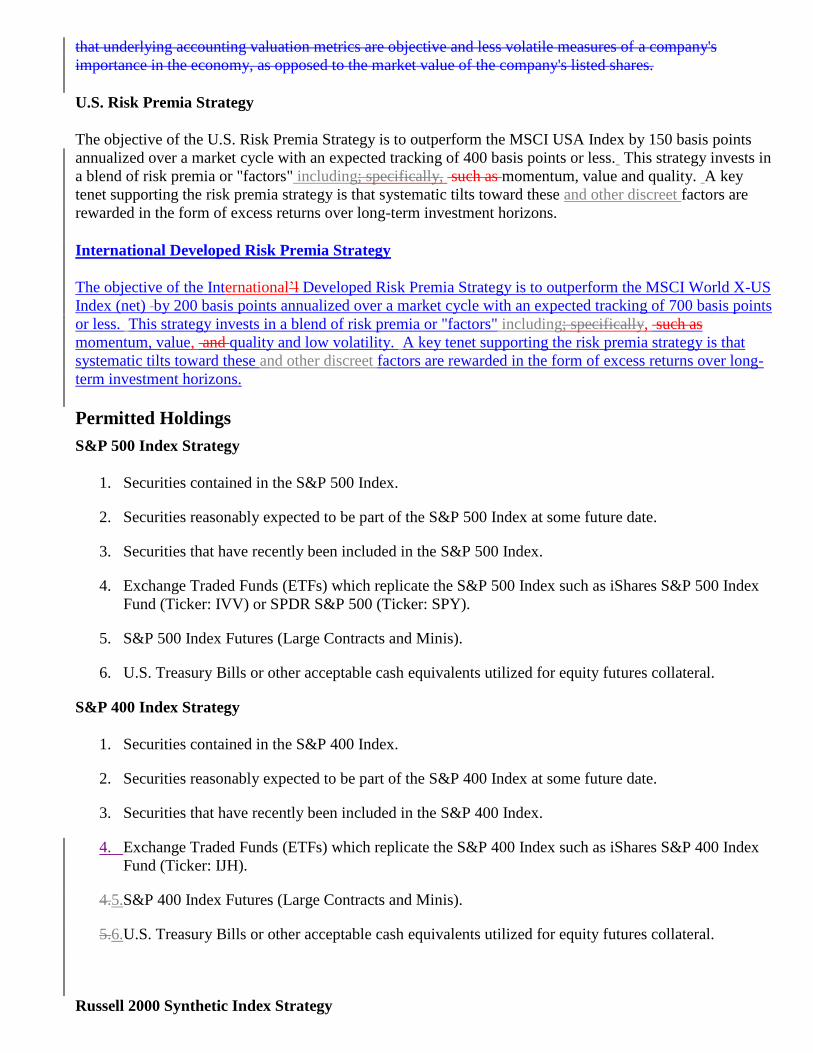
that underlying accounting valuation metrics are objective and less volatile measures of a company's
importance in the economy, as opposed to the market value of the company's listed shares.
U.S. Risk Premia Strategy
The objective of the U.S. Risk Premia Strategy is to outperform the MSCI USA Index by 150 basis points
annualized over a market cycle with an expected tracking of 400 basis points or less. This strategy invests in
a blend of risk premia or "factors" including; specifically, such as momentum, value and quality. A key
tenet supporting the risk premia strategy is that systematic tilts toward these and other discreet factors are
rewarded in the form of excess returns over long-term investment horizons.
International Developed Risk Premia Strategy
The objective of the International’l Developed Risk Premia Strategy is to outperform the MSCI World X-US
Index (net) by 200 basis points annualized over a market cycle with an expected tracking of 700 basis points
or less. This strategy invests in a blend of risk premia or "factors" including; specifically, such as
momentum, value, and quality and low volatility. A key tenet supporting the risk premia strategy is that
systematic tilts toward these and other discreet factors are rewarded in the form of excess returns over long-
term investment horizons.
Permitted Holdings
S&P 500 Index Strategy
1. Securities contained in the S&P 500 Index.
2. Securities reasonably expected to be part of the S&P 500 Index at some future date.
3. Securities that have recently been included in the S&P 500 Index.
4. Exchange Traded Funds (ETFs) which replicate the S&P 500 Index such as iShares S&P 500 Index
Fund (Ticker: IVV) or SPDR S&P 500 (Ticker: SPY).
5. S&P 500 Index Futures (Large Contracts and Minis).
6. U.S. Treasury Bills or other acceptable cash equivalents utilized for equity futures collateral.
S&P 400 Index Strategy
1. Securities contained in the S&P 400 Index.
2. Securities reasonably expected to be part of the S&P 400 Index at some future date.
3. Securities that have recently been included in the S&P 400 Index.
4. Exchange Traded Funds (ETFs) which replicate the S&P 400 Index such as iShares S&P 400 Index
Fund (Ticker: IJH).
4.5.S&P 400 Index Futures (Large Contracts and Minis).
5.6.U.S. Treasury Bills or other acceptable cash equivalents utilized for equity futures collateral.
Russell 2000 Synthetic Index Strategy
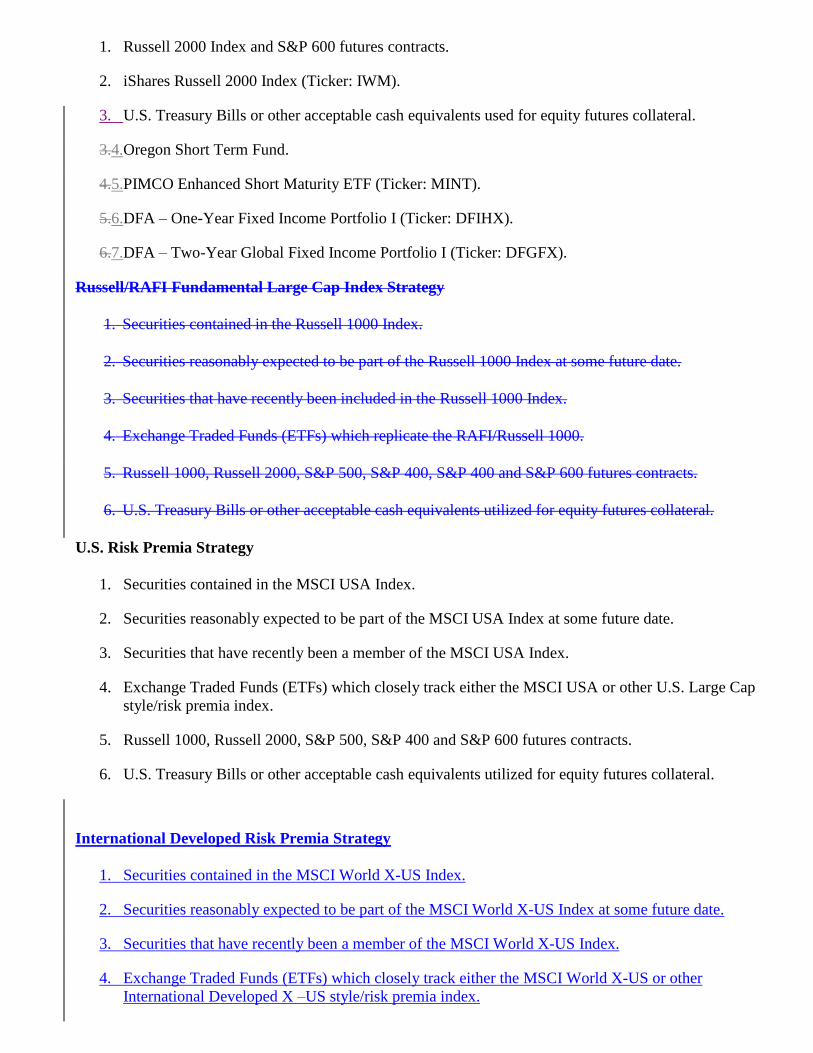
1. Russell 2000 Index and S&P 600 futures contracts.
2. iShares Russell 2000 Index (Ticker: IWM).
3. U.S. Treasury Bills or other acceptable cash equivalents used for equity futures collateral.
3.4.Oregon Short Term Fund.
4.5.PIMCO Enhanced Short Maturity ETF (Ticker: MINT).
5.6.DFA – One-Year Fixed Income Portfolio I (Ticker: DFIHX).
6.7.DFA – Two-Year Global Fixed Income Portfolio I (Ticker: DFGFX).
Russell/RAFI Fundamental Large Cap Index Strategy
1. Securities contained in the Russell 1000 Index.
2. Securities reasonably expected to be part of the Russell 1000 Index at some future date.
3. Securities that have recently been included in the Russell 1000 Index.
4. Exchange Traded Funds (ETFs) which replicate the RAFI/Russell 1000.
5. Russell 1000, Russell 2000, S&P 500, S&P 400, S&P 400 and S&P 600 futures contracts.
6. U.S. Treasury Bills or other acceptable cash equivalents utilized for equity futures collateral.
U.S. Risk Premia Strategy
1. Securities contained in the MSCI USA Index.
2. Securities reasonably expected to be part of the MSCI USA Index at some future date.
3. Securities that have recently been a member of the MSCI USA Index.
4. Exchange Traded Funds (ETFs) which closely track either the MSCI USA or other U.S. Large Cap
style/risk premia index.
5. Russell 1000, Russell 2000, S&P 500, S&P 400 and S&P 600 futures contracts.
6. U.S. Treasury Bills or other acceptable cash equivalents utilized for equity futures collateral.
International Developed Risk Premia Strategy
1. Securities contained in the MSCI World X-US Index.
2. Securities reasonably expected to be part of the MSCI World X-US Index at some future date.
3. Securities that have recently been a member of the MSCI World X-US Index.
4. Exchange Traded Funds (ETFs) which closely track either the MSCI World X-US or other
International Developed X –US style/risk premia index.

5. MSCI EAFE, MSCI Canada futures contracts.
6. U.S. Treasury Bills or other acceptable cash equivalents utilized for equity futures collateral.
Absolute Restrictions
The Internal Public Equity Portfolios may not purchase the following investments or types of investments
without the specific advanced approval of both the CIO and OIC:
1. Short sales of securities;
2. Notional equity exposure in excess of a portfolio's Net Asset Value;
3. Commodities; and
4. Non-U.S. dollar denominated fixed income securities issued by entities incorporated or chartered
outside of the United States.
Correction of Non-Compliance
If an internally-managed equity fund is found to be out of compliance with one or more adopted investment
guidelines or is being managed inconsistently with its policy and objectives, Staff shall bring the internally
managed equity fund into compliance as soon as is prudently feasible. Actions to bring internally-managed
equity funds back into compliance and justification for such actions, including documentation of proposed
and actual resolution strategies shall be coordinated with the OST investment compliance program.
Investment Transaction Authorization
All trades shall be entered into the Order Management System (OMS) of record (e.g., Aladdin), and are
authorized electronically by a Public Equity Investment Officer who. The Public Equity Investment Officer
shall act in accordance with established procedures and internal controls for the operation of the investment
program consistent with this policy.
Exceptions
None.
Failure to Comply
Failure to comply with this policy may be cause for disciplinary action up to and including dismissal.
PROCEDURES and FORMS
None.
ADMINISTRATION
Feedback
Your comments are extremely important to improving the effectiveness of this policy. If you would like to
comment on the provisions of this policy, you may do so by e-mailing the Policy Analyst. To ensure your
comments are received without delay, please list the policy number and name in your e-mail's subject. Your
comments will be reviewed during the policy revisions process and may result in changes to the policy.
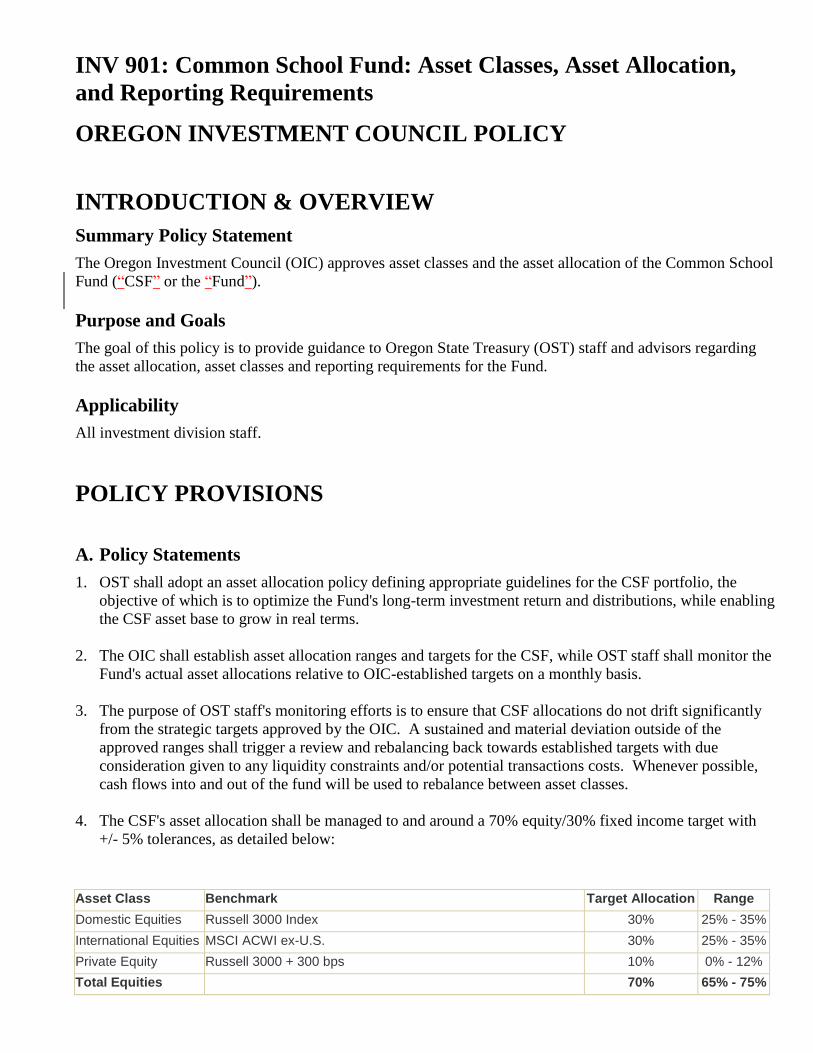
INV 901: Common School Fund: Asset Classes, Asset Allocation,
and Reporting Requirements
OREGON INVESTMENT COUNCIL POLICY
INTRODUCTION & OVERVIEW
Summary Policy Statement
The Oregon Investment Council (OIC) approves asset classes and the asset allocation of the Common School
Fund (“CSF” or the “Fund”).
Purpose and Goals
The goal of this policy is to provide guidance to Oregon State Treasury (OST) staff and advisors regarding
the asset allocation, asset classes and reporting requirements for the Fund.
Applicability
All investment division staff.
POLICY PROVISIONS
A. Policy Statements
1. OST shall adopt an asset allocation policy defining appropriate guidelines for the CSF portfolio, the
objective of which is to optimize the Fund's long-term investment return and distributions, while enabling
the CSF asset base to grow in real terms.
2. The OIC shall establish asset allocation ranges and targets for the CSF, while OST staff shall monitor the
Fund's actual asset allocations relative to OIC-established targets on a monthly basis.
3. The purpose of OST staff's monitoring efforts is to ensure that CSF allocations do not drift significantly
from the strategic targets approved by the OIC. A sustained and material deviation outside of the
approved ranges shall trigger a review and rebalancing back towards established targets with due
consideration given to any liquidity constraints and/or potential transactions costs. Whenever possible,
cash flows into and out of the fund will be used to rebalance between asset classes.
4. The CSF's asset allocation shall be managed to and around a 70% equity/30% fixed income target with
+/- 5% tolerances, as detailed below:
Asset Class Benchmark Target Allocation Range
Domestic Equities Russell 3000 Index 30% 25% - 35%
International Equities MSCI ACWI ex-U.S. 30% 25% - 35%
Private Equity Russell 3000 + 300 bps 10% 0% - 12%
Total Equities 70% 65% - 75%

U.S. Fixed Income Barclays U.S. Aggregate Bond Index 30% 25% - 35%
Cash 0% 0% - 3%
Policy Mix Weighted aggregate of indices listed above at target allocation 100%
5. OST will work with the State Land Board and Department of State Lands (DSL) staff to ensure the
implementation of the Fund’s asset allocation policy comports with DSL business needs. Moreover, the
OIC shall not make asset allocation changes without considering input from the State Land Board.
6. Formal asset allocation reviews will be performed at least every 3 years to ensure that CSF capital is
positioned properly. These reviews will be performed by OST staff in conjunction with the OIC's general
consultant, and any asset classes not specifically addressed in the policy below will be reviewed by OST
and State Land Board staff for approval by the OIC.
7. Recognizing the general objectives and operating philosophy of the Fund, the OIC has approved the
following asset classes:
a. Public Equity. Domestic and international investments that represent a direct ownership of, or
interest in, a corporation, and the shares of which are traded in public securities markets.
b. Fixed Income. Investments in loans and other debt obligations that have pre-defined interest and
principal repayment schedules. This asset class may include mortgage obligations.
c. Private Equity. Investments in privately-held companies or corporations including buyouts, venture
capital and mezzanine finance techniques. Fund of funds investing and purchases of secondary
interests may also be included in this category.
d. Cash. Cash and cash equivalents are defined as cash held in OST's Oregon Short Term Fund.
8. Reporting Requirements. Formal review with the State Land Board shall be undertaken at least
annually.
9. Reporting Package to CSFDepartment of State Lands (DSL). The material covered during each
meeting should be summarized and available in advance, and unless otherwise indicated, the material
distributed should include the following information:
a. Economic and market outlook;
b. Portfolio structure and asset allocation summary;
c. Current investment strategy;
d. Recent portfolio performance including an attribution analysis; and
e. Other items of importance, such as changes in personnel, legislative impacts or any changes in
investment philosophy and approach.
10. OST/OIC Reviews. Review of the asset allocation policy and investment performance will occur at least
annually with the OIC and more frequently by OST staff. These reviews will focus on the continued
appropriateness of existing policy, compliance with guidelines and performance relative to Fund
objectives. A formal process shall be established allowing DSL staff to meet with OIC's consultants on
an annual basis to discuss investment management and asset allocation issues. In addition, DSL staff will

have the opportunity to address the OIC annually to discuss the State Land Board's particular views
regarding Fund performance and related management issues.
Exceptions
None.
Failure to Comply
In general, this statement will suffice: "Failure to comply with this policy may be cause for disciplinary
action up to and including dismissal."
PROCEDURES AND FORMS
ADMINISTRATION
Feedback
Your comments are extremely important to improving the effectiveness of this policy. If you would like to
comment on the provisions of this policy, you may do so by e-mailing the Policy Analyst. To ensure your
comments are received without delay, please list the policy number and name in your e-mail's subject. Your
comments will be reviewed during the policy revisions process and may result in changes to the policy.

INV 903: Common School Fund: Public Equity Investments
OREGON INVESTMENT COUNCIL POLICY
INTRODUCTION & OVERVIEW
Summary Policy Statement
The strategic role of publicly-traded equity securities is to provide enhanced return and diversification
opportunities for the Common School Fund ("CSF" or the "Fund"). The Fund's public equity securities
portfolio also provides liquidity relative to its regular cash distribution obligations. Public equity securities
are subject to the specific, strategic allocation targets established by OIC Policy INV 901: CSF Asset Class,
Allocations and Reporting Requirements. Currently, 60 percent of the Fund is invested in publicly -traded
equity securities.
Purpose and Goals
The purpose of this policy is to define the objectives of public equity as an asset class within the general
investment policies of the Oregon Investment Council ("OIC" or the "Council"), and to outline the strategies
used to implement the Council's public equity investment policies.
Applicability
All Investment Division staff.
POLICY PROVISIONS
A. Policyolicy Statementstatements
To provide one of the highest expected returns among approved CSF asset classes.
B. Strategy
1. The CSF public equity portfolio shall be structured on a global basis, seeking to loosely replicate the
country and market capitalization characteristics of the investable universe of public equity securities
which can be further categorized as U.S., non-U.S. developed countries and emerging market
countries.
2. Unless tax, regulatory or liquidity constraints suggest otherwise, diversify public equity allocations
across the stock markets of all investable countries to ensure exposure to a wide range of investment
opportunities, and participate broadly in those markets in an attempt to capture the full market rate of
equity return generated therein. The size of any commitment to an individual investment strategy will
be based on that strategy's expected portfolio impact, staff's confidence in the strategy's manager, the
manager's investment style, and the capacity available in/with a particular strategy/manager.
3. Enhance returns through selective active management, provided such actively-managed strategies
demonstrate empirical efficacy relative to factor exposures and net of all fees and transactions costs.

4. Actively-managed strategies are expected to outperform stated benchmarks on an after-fee and risk-
adjusted basis, over a full market cycle. Quarterly manager reviews will focus on adherence to
guidelines and assessments of investment performance relative to objectives.
5. Benchmarks assigned to all non-U.S. strategies should be unhedged. Managers may be permitted to
hedge currency exposures, and in cases where currency represents an explicit element of a manager's
stated investment approach, may take active currency positions; however, all managers will be
measured against an unhedged benchmark.
6. Proxies associated with separately managed accounts will be voted by the third-party proxy voting
agent retained by the OIC.
CB. OST StaffTAFF AuthorityUTHORITY & ReportingEPORTING
1. OST Staff, with approval from the Chief Investment Officer (CIO) and quarterly notification to the
OIC, may terminate "at will" any public equity manager mandate according to the terms of its
contract with, and on behalf, of, the OIC.
2. OST Staff, with approval from the Chief Investment Officer (CIO) and quarterly notification to the
OIC, will also have discretion to rebalance between and among managers within the public equity
portfolio. The aggregate, structural characteristics of the public equity portfolio will be considered
during such rebalancing, while re-allocations between asset classes shall remain governed by INV
901 Common School Fund: Asset Classes, Asset Allocation, and Reporting Requirements.
3. OST Staff, with approval from the Chief Investment Officer (CIO) and quarterly notification to the
OIC, will have the discretion to retain any public equity manager that has been approved by the board
on behalf of the Oregon Public Employees Retirement Fund (OPERF).
4. OST Staff, with approval from the Chief Investment Officer (CIO) and OIC Consultant, will havethe
the discretion to convert any public equity long-only implementation to a 130/30 strategy, provided
such implementation does not change the mandate's role within the public equity portfolio. Staff will
report any such 130/30 implementations to the CouncilOIC in the quarter immediately following the
implementation.
Exceptions
None.
Failure to Comply
Failure to comply with this policy may be cause for disciplinary action up to and including dismissal.

PROCEDURES AND FORMS
None.
ADMINISTRATION
Feedback
Your comments are extremely important to improving the effectiveness of this policy. If you would like to
comment on the provisions of this policy, you may do so by e-mailing the Policy Analyst. To ensure your
comments are received without delay, please list the policy number and name in your e-mail's subject. Your
comments will be reviewed during the policy revisions process and may result in changes to the policy.

INV 904: Common School Fund: Fixed Income Investments
OREGON INVESTMENT COUNCIL POLICY
INTRODUCTION & OVERVIEW
Summary Policy Statement
The strategic role of fixed income securities is to diversify the Common School Fund (CSF) asset base in
general and its allocation to equity securities in particular. The fixed income securities portfolio within CSF
is also designed to provide liquidity in connection with CSF's regular cash distribution obligations. Fixed
income securities are subject to the specific, strategic allocation targets established by OIC Policy INV 901:
Asset Class, Allocations and Reporting Requirements. Approximately 30 percent of the CSF shall be
invested in fixed income securities.
Purpose and Goals
The purpose of these Fixed Income Investment Policies is to define the objectives of fixed income as an asset
class within the general investment policies of the Oregon Investment Council ("OIC" or the "Council"), and
to outline the strategies used to implement the Council's fixed income investment policies.
Applicability
All Investment Division staff.
POLICY PROVISIONS
A. Policy Statements
To provide diversification to equity securities.
B. Strategy:
1. Manage a well-diversified bond portfolio to maximize total return while closely tracking the
portfolio's benchmark, the Barclays Capital U.S. Aggregate Bond Index (the "Benchmark").;
2. Invest opportunistically, using innovative investment approaches within a controlled and defined
portfolio allocation.;
3. Maintain a minimum-weighted, average credit quality of one rating category below that of the
Benchmark. For example, if the Benchmark's average credit quality is AA2, the minimum-weighted,
average credit quality should be A2.;
4. Maintain a target duration band of +/-20% relative to the effective duration of the Benchmark.;
5. Actively-managed strategies are expected to outperform stated benchmarks on an after-fee and risk-
adjusted basis, over a full market cycle.;
6. Quarterly manager reviews will focus on adherence to guidelines and assessments of investment
performance relative to objectives.; and
7. The OIC's selection of active managers will be based upon demonstrated expertise as reflected by an
ability to add value over passive management alternatives and within reasonable risk parameters.

C. Permitted Holdings:
1. Obligations issued or guaranteed by the U.S. Federal Government, U.S. Federal agencies or U.S.
government-sponsored corporations and agencies.;
2. Obligations of U.S. and non-U.S. corporations such as debentures issued by industrial, utility,
finance, commercial banking or bank holding company organizations, bank loans, common stock
received in connection with the restructuring of corporate debt.;
3. Mortgage-backed, asset-backed and structured securities.;
4. Securities eligible for the Oregon Short-Term Fund (OSTF).;
5. Yankee Bonds (dollar denominated sovereign and corporate debt).;
6. Obligations, including the securities of emerging market issuers, denominated in U.S. dollars or
foreign currencies of international agencies, supranational entities and foreign governments (or their
subdivisions or agencies).;
7. Rule 144A securities with the expectation that they will carry registration rights.;
8. Credit Criteria: In addition to the eligibility requirements described above, securities considered for
purchase must be rated investment grade at the time of purchase. If no ratings are available for a
particular security, then an equivalent credit rating, as deemed by the Manager, may be used. The
methodology utilized by the Benchmark Index shall be used to determine the rating on any holding.
9. For certain securities or instruments, such as newly-issued bonds, expected ratings may be used until
actual ratings are issued and assigned by the rating agencies.
D. Diversification
1. : The portfolio should be adequately diversified to minimize various risks. The following specific
limitations reflect, in part, the OIC's current investment philosophy regarding diversification:
a. No fixed income investment in any one issue shall be in excess of 5% of the outstanding fixed
income obligations of that issuer;
b. Not more than 3% of the total market value of the CSF fixed income portfolio shall be invested in
fixed income securities of any one issuer, except U.S. Government and Agency obligations (no
limit) and private mortgage-backed and asset-backed securities, which shall be limited to 10% per
issuer;
c. Obligations of other national governments are limited to 10% per issuer;
d. Not more than 10% of the CSF fixed income portfolio may be invested in non-dollar denominated
securities; and
e. Currency hedging is at the Manager's discretion.
D.E. Portfolio Restrictions:
1. No more than 10% of the total CSF fixed income portfolio, at market value, may be maintained in

securities rated less than Baa3.;
2. No more than 10% of the total CSF fixed income portfolio, at market value, may be maintained in
Rule 144A securities.;
3. Not more than 25% of the CSF fixed income portfolio shall be invested in a single industry or
government agency.; and
4. Leverage in any fixed income securities holding (excluding use of securities in a securities lending
program) is not permitted.
F. Liquidity
: CSF may have occasional need to draw on a portion of its invested capital to pay expenses, make
distributions or satisfy other operating or funding obligations. Prior to any withdrawal, CSF will
communicate its requirement as soon as possible to provide advance notice for portfolio sales and
rebalancing purposes.
G. Performance Expectations/Reviews
: Over a market cycle of 3-5 years, the CSF fixed income portfolio is expected to outperform its
benchmarkthe index by at least 35 basis points, net-of-fees. Quarterly investment portfolio reviews will
focus on performance relative to objectives and adherence to guidelines.
HB. OST StTaffAFF AuthorityUTHORITY & ReportingEPORTING
1. OST Staff, with approval from the Chief Investment Officer (CIO) and quarterly notification to the
OIC, may terminate "at will" any fixed income manager mandate according to the terms of its
contract with and on behalf of the OIC.
2. OST Staff, with approval from the Chief Investment Officer (CIO) and quarterly notification to the
OIC, will also have discretion to rebalance between, and among, managers within the fixed income
portfolio. The aggregate, structural characteristics of the fixed income portfolio will be considered
during such rebalancing, while re-allocations between asset classes shall remain governed by INV
901 Common School Fund: Asset Classes, Asset Allocation, and Reporting Requirements.
3. OST Staff, with approval from the Chief Investment Officer (CIO) and quarterly notification to the
OIC, will have the discretion to retain any fixed income manager/strategy that has been approved by
the board on behalf of the Oregon Public Employees Retirement Fund (OPERF).
Exceptions
None.
Failure to Comply
Failure to comply with this policy may be cause for disciplinary action up to and including dismissal.

PROCEDURES AND FORMS
ADMINISTRATION
Feedback
Your comments are extremely important to improving the effectiveness of this policy. If you would like to
comment on the provisions of this policy, you may do so by e-mailing the Policy Analyst. To ensure your
comments are received without delay, please list the policy number and name in your e-mail's subject. Your
comments will be reviewed during the policy revisions process and may result in changes to the policy.

INV 905: Common School Fund: Private Equity Investments
OREGON INVESTMENT COUNCIL POLICY
INTRODUCTION & OVERVIEW
Summary Policy Statement
The strategic role of private equity investments is to enhance return and diversification opportunities for the
Common School Fund (“CSF”). While traditionally more volatile than the public equity asset class, private
equity provides a diversification benefit and the opportunity to achieve higher returns. Private equity
securities are subject to the specific, strategic allocation targets established by OIC Policy INV 901: CSF
Asset Class, Allocations and Reporting Requirements. Currently, 10 percent of the CSF is allocated to
private equity investments.
Purpose and Goals
The purpose of these Private Equity Investment Policies is to define the objectives of private equity as an
asset class within the general investment policies of the Oregon Investment Council ("OIC" or the
"Council"), and to outline strategies used to implement the Council's private equity investment policies.
Applicability
All Investment Division staff.
POLICY PROVISIONS
A. Policy Statements
To provide one of the highest expected returns among approved CSF asset classes, and increase Fund
diversification.
B. Strategies
1. The CSF Private Equity portfolio will include investments with a select group of large, established
and historically successful private equity partners and will generally be accessed through limited
partnership interests.
2. The OIC recognizes the need for high levels of diversification to minimize the risk of significant
losses to the Fund. Diversification in private equity may manifest in one or more of the following
dimensions: investment style; geographic location; sector allocation; and capitalization.
3. Partnership agreements shall be in conformance with current industry standards and shall be subject
to legal sufficiency approval by and through the Oregon State Treasury Department of J(OST) legal
counselustice.

4. The CSF private equity portfolio is expected to achieve total returns 300 basis points greater than its
public market benchmark, net of fees, over a three- to five-year investment cycle.
5. Quarterly manager reviews will be conducted by Staff and Consultant and will focus on adherence to
guidelines and assessments of investment performance relative to objectives. However, given the
illiquid nature of private equity investments, managers may not generally be terminated other than for
breach of contract.
C. B. OST StaffTAFF AuthorityUTHORITY & ReportingEPORTING
OST Staff, with approval from the Chief Investment Officer (CIO) and quarterly notification to the OIC,
will have the discretion to retain any private equity manager/strategy that has been approved by the board
on behalf of the Oregon Public Employees Retirement Fund (OPERF).
Exceptions
None.
Failure to Comply
Failure to comply with this policy may be cause for disciplinary action up to and including dismissal.
PROCEDURES AND FORMS
ADMINISTRATION
Feedback
Your comments are extremely important to improving the effectiveness of this policy. If you would like to
comment on the provisions of this policy, you may do so by e-mailing the Policy Analyst. To ensure your
comments are received without delay, please list the policy number and name in your e-mail's subject. Your
comments will be reviewed during the policy revisions process and may result in changes to the policy.

TAB 6 – Alternatives Portfolio Review
OPERF
OPERF Alternatives Portfolio 2017 Plan and Review Ben Mahon, Senior Investment Officer
April 26, 2017

Executive Summary
Alternatives Portfolio 2017 Plan and Review 2
Portfolio development on track
Primary role of Alternatives Portfolio = diversification The “keyboard” in ‘70s rock band analogy Seeking less correlated and diversifying sources of returns, as well as inflation
hedges or inflation-sensitive returns
Pacing on target Market value as of December 31, 2016 = $4 billion Market value as a % of OPERF as of December 31, 2016 = 5.8% (vs. 12.5% target)
Portfolio still early in its build-out ≈ 75% of total commitments made in last three years Weighted-average age of 2.3 years “Fourth inning” of portfolio development
Dynamic market and evolving opportunity set
Steady flow of new managers, strategies, and structures

Alternatives Portfolio 2017 Plan and Review 3
Topics
1. Background/Objectives
2. 2016 Review
3. Looking Forward
4. Appendix

Background/Objectives
Alternatives Portfolio 2017 Plan and Review 4
Alternatives Portfolio Background Alternatives Portfolio approved at January 26, 2011 OIC meeting Portfolio seeded July 1, 2011 with three investments from the Opportunity
Portfolio Target allocation for the Portfolio has increased twice since its inception:
• First, from 5% to 10% at June 26, 2013 OIC meeting • Second, from 10% to 12.5% at June 3, 2015 OIC meeting
o Actual allocation at December 31, 2016 is 5.8% Portfolio comprised of three primary sectors:
• Infrastructure = 20-30% • Natural Resources = 30-40% • Diversifying Strategies = 35-45%
Alternatives Portfolio Objectives
Participate in attractive long-term investment opportunities Diversify the overall OPERF investment portfolio Seek non-real estate “real assets” and “diversifying strategies” exposures Less correlated returns, diversifying risk premia Includes inflation hedging objective Benchmark: CPI + 4%
Enumerated in OIC Investment Beliefs

OIC Investment Beliefs
Alternatives Portfolio 2017 Plan and Review 5
Diversification, asset class correlations, and private market investment expectations and considerations are all enumerated in the OIC’s investment beliefs, which serve to guide portfolio construction, strategy, and manager selection decisions in the Alternatives Portfolio.
Importance of asset allocation, which is the primary driver of risk and return:
Belief 1C: “To exploit market inefficiencies, the OIC must be contrarian, innovative and opportunistic in its investment approach.”
Belief 2A: “Asset allocation is the OIC’s primary policy tool for managing the investment program’s long-term risk/return profile.”
Belief 2B: “Portfolio construction, including diversification and correlation considerations, is essential to maximizing risk-adjusted returns.”
Private market investments can add significant value and represent a core
OIC/OST competency: Belief 4A: “The OIC can capitalize on its status as a true, long-term investor
by making meaningful allocations to illiquid, private market investments.”
Belief 4B: “Dispersion in private market investment returns is wide; accordingly, top-quartile manager selection and vintage year diversification are paramount.”

Target Weights
Alternatives Portfolio 2017 Plan and Review 6
Infrastructure25%
Natural Resources
35%
Diversifying Strategies
40%Real Assets
60%
Public Equity37.5%
Private Equity17.5%
Fixed Income20.0%
Opportunity0.0%
Real Estate12.5%
Alternatives Portfolio
12.5%
OPERF Target Allocation
Alternatives Portfolio Target Allocation

Defining Real Assets
Alternatives Portfolio 2017 Plan and Review 7
“Real assets” are broadly defined as long-lived, capital intensive, physical or “hard” assets that provide essential products and services to the global economy or generally serve as the inputs to economic production. Real assets typically share three key characteristics: Tangible, with intrinsic value Relatively stable demand and/or revenue profile Inflation-linkage
Real assets offer investment characteristics and risk profiles that are differentiated from other asset classes, and which therefore provide valuable diversification benefits. These differentiations include the potential for capital preservation, long-term growth, current income, low volatility, and inflation protection. The primary driver for the low correlation of real assets to other asset classes
is the relatively low cyclicality and volatility of their demand profiles, and the consequent stability of their cash flows and earnings. This stability is a function of the essential nature of real assets and their contracted, regulated, or commodity-linked revenues.
Underpinning their role in economic and social activity, real assets also stand to benefit from long-term macro trends such as population growth, urbanization, and economic development.

Defining Real Assets, cont.
Alternatives Portfolio 2017 Plan and Review 8
Composition of real asset universe is broad; sub-sectors themselves include a wide range of assets, characteristics, and risk profiles:
ASSET CLASS
SUB-SECTORS OF INTEREST ASSET DESCRIPTIONS
TransportationAssets and networks that move freight, bulkcommodities, and passengers, including: airports,seaports, rail, toll roads, bridges, and tunnels
Northern Shipping
PowerGeneration of electricity from renewable andconventional sources
LS Power
EnergyEncompasses pipelines, processing, storage, anddistrict energy systems
EnCap Flatrock
Utilities
Transmit and distribute essential products andservices, including: electricity transmission anddistribution, natural gas, water processing andtreatment, and waste management
CommunicationIncludes towers, fiber networks, distributed networksystems, subsea cables, and data centers
SocialEncompasses public transportation, housing,education and healthcare facilities
EnergyIncludes land, facilities, and related interestsinvolved in the extraction of energy resources
Metals & MiningCompanies or projects, with rights to extract metal and mineral resources
Timber Investment in the ownership or lease of timberland
AgricultureEncompasses land, production, processing, storage, and trading & distribution
Liquid commodities & natural resources
Exposure to raw materials or agricultural products
GP EXAMPLES generalists specialists
BrookfieldEQTGIP
StarwoodStonepeak
SailingStone
Natural Resources
Infrastructure
EnerVest, Sheridan, NGP, Warwick
Appian, EMR, Taurus
Brookfield, Twin Creeks
Brookfield, Homestead, Teays River, Tillridge

“Diversifying strategies” is a category comprising strategies that attempt to systematically capture certain risk premia beyond traditional equity and bond market exposures using alternative investment techniques.
Underlying the “risk premia” terminology is the notion that there should be a premium (i.e., a higher expected return) for bearing risk. For example, the March 1, 2017 yield on the U.S. 1-month T-bill was 0.46%, while the yield on the U.S. 30-year T-bond was 3.06%. The 2.60% differential represents the risk premium (in this case, the term premium) that compensates investors for the additional price volatility associated with the longer duration instrument.
Defining Diversifying Strategies
Alternatives Portfolio 2017 Plan and Review 9
* The term “smart beta” refers to long-only exposure to an asset class with a style premium bias; e.g., OPERF public equity portfolio utilizing size, value and low volatility tilts.
Smart beta*
These dominate typical investor portfolios
Seek similar exposures as smart beta, but in a market-neutral fashion and in multiple asset classes
Equity84%
Alt Assets11%Other
6%
OPERF Risk Contribution
Traditional risk premia = “beta” aka asset class premia
(e.g., long-only equity, credit, etc.)
Alternative risk premia = “alternative beta” aka style and strategy premia
(e.g., momentum, value, merger arbitrage, etc.)

Defining Diversifying Strategies, cont.
Alternatives Portfolio 2017 Plan and Review 10
“Diversifying strategies” nomenclature is intentional. Unlike a broad hedge fund program, focus is on strategies with low correlation to equity markets.*
Universe is further narrowed by sharp attention to fees, transparency, and underlying liquidity, leading to a concentrated set of prioritized sub-sectors.
Initial implementation focuses on alternative beta, which are essentially the building blocks of returns, and which provide systematic explanations for returns. It is important to note that alternative beta investment strategies are not new: the majority of the relevant premia have been studied in academic literature and/or used by hedge funds for decades.
* See “Why diversify” slides in appendix for more detailed discussion.
ASSET CLASS SUB-SECTORS OF INTEREST DESCRIPTION GP EXAMPLESRisk Premia Non-directional harvesting of style and strategy
risk premiaAQR Style Premia, AQR DELTA
Managed Futures Directional harvesting of momentum (trend-following) risk premia
AQR Managed Futures
Absolute Return/Global Macro Forecasting security or market direction based on movements in economic variables; aims to capture perceived mispricings
Diversifying Strategies

Portfolio Construction: Putting It All Together
Alternatives Portfolio 2017 Plan and Review 11
ASSET CLASSTARGET ALLOCATION SOURCES OF RETURN MACROECONOMIC SENSITIVITIES Ca
pita
l Pro
tect
ion
Dive
rsifi
catio
n
Curr
ent I
ncom
e
Infla
tion-
Link
age
Infrastructure 25% Cash flows are generated by long-lived assetsthat deliver essential products or services.These cash flows tend to be a function of price(often tied to a regulatory or concessionframework) and volume (throughput generallytied to underlying economic conditions).Additional sources of return throughimprovement and/or expansion to operations.
The cash flows from infrastructure assets tend to becontracted under terms with periodic priceescalators tied to inflation. Since cash flows aregenerally contracted or feature monopolistic-likepricing power, and are therefore inelastic,infrastructure can be defensive in periods ofeconomic contraction.
Natural Resources
35% Cash flows are generally derived from theproduction, processing, and distribution ofcommodities or globally traded goods comingfrom these resources. Additional sources ofreturn through resource expansion and/orimprovement to operations.
The essential nature of natural resources (i.e., food)generally results in inelastic demand. Factors suchas weather and overproduction, however, cansignificantly impact short-term supply and demand.Implicit inflation linkage arises because naturalresources include many of the underlyingcomponents of inflation (i.e., the production inputsthat determine the cost of many goods andservices).
Diversifying Strategies
40% Returns generated by using a systematic, rules-based process of harvesting recognized andexploitable risk premia for which an economicor behavioral rationale exists, driving a positiveexpected return over time.
Owing to the use of alternative investmenttechniques such as shorting and leverage, sources of returns largely independent of the marketenvironment.
= Primary objective = Secondary objective = Not an objective

Alternatives Portfolio 2017 Plan and Review 12
Topics
1. Background/Objectives
2. 2016 Review
3. Looking Forward
4. Appendix

2016 Year in Review
Alternatives Portfolio 2017 Plan and Review 13
Progress-to-date Authorized $1.7 billion in commitments in 2016 (11 investments)
• Midpoint of expected $1.5 - $2.0 billion range Portfolio exposures are balanced and within target ranges Continue to refine strategy and develop anchor positions complemented by
specialists/next generation relationships. No shortage of deal flow! Challenge has been discriminating among opportunities.
Consultant
TorreyCove contract extended for a two-year period ending December 31, 2018
“Firsts” for the Portfolio
First dedicated maritime investment (Northern Shipping III) First dedicated U.S. land-based agriculture investment (Homestead Capital II) First dedicated trend-following (aka managed futures) investment (AQR)

2016 Year in Review, cont.
Alternatives Portfolio 2017 Plan and Review 14
During 2016, OIC/OST authorized $1.7 billion in commitments across 11 investments
6 of the commitments were new relationships; 5 were “re-ups” or extensions of existing strategies
2016 commitments comprised a diverse set of investment strategies:
INVESTMENT NAME AUTHORIZED DATE
FIRST OPERF DRAWDOWN
COMMITMENT AMOUNT
SailingStone Global Natural Resources Strategy 2/1/2016 3/11/2016 $50,000,000Brookfield Infrastructure Fund III, L.P. 3/9/2016 5/16/2016 $400,000,000Warwick Partners III, L.P. 4/22/2016 5/13/2016 $150,000,000EMR Capital Resources Fund II, L.P. 8/17/2016 9/13/2016 $125,000,000Northern Shipping Fund III, L.P. 8/17/2016 10/21/2016 $125,000,000Homestead Capital USA Farmland Fund II, L.P. 9/29/2016 10/21/2016 $100,000,000Starwood Energy Infrastructure Fund III, L.P. 9/29/2016 N/A $150,000,000AQR Managed Futures 10/26/2016 1/1/2017 $250,000,000Tillridge II Global Agribusiness Partners, L.P. 11/17/2016 1/13/2017 $100,000,000Taurus Mining Finance Annex Fund, L.P. 11/22/2016 1/30/2017 $50,000,000EQT Infrastructure III (No.2) SCSp 12/7/2017 N/A $212,000,000 *TOTAL $1,712,000,000
*Euro = $1.06

Commitments and Market Values
Alternatives Portfolio 2017 Plan and Review 15
Alternatives Portfolio weight increasing as a percentage of OPERF; equal to 5.8% at year-end Since inception, $6.9 billion of commitments have been authorized, with the majority ($5.1
billion or ≈ 75%) over the past three years
$883 $225 $700 $1,355 $2,150 $1,712$375 $460
$871$1,363
$2,300
$4,034
0.7% 0.8%1.3%
1.9%
3.4%
5.8%5.0% 5.0%
10.0% 10.0%
12.5% 12.5%
0.0%
2.0%
4.0%
6.0%
8.0%
10.0%
12.0%
14.0%
$0
$1,000
$2,000
$3,000
$4,000
$5,000
$6,000
$7,000
$8,000
$9,000
$10,000
2011 2012 2013 2014 2015 2016
CY Authorized Commitments* Total Alts FMV Alts FMV as a % of OPERF (rhs) Alts Target as a % of OPERF (rhs)
Source: State Street. Data as of December 31, 2016. $ in millions.*Calendar Year 2011 commitments include initial transfer from Opportunity Portfolio.

Portfolio Snapshot
Alternatives Portfolio 2017 Plan and Review 16
Sector exposures are within targeted allocation ranges Diversifying strategies and listed natural resources/commodities funds are liquid and
can be deployed more quickly than illiquid investments in infrastructure and natural resources…
… while cognizant of allocation ranges, anticipate deviations to occur as the program scales.
SECTOR TARGET ($)
TARGET (%)
TARGET RANGE (%)
MARKET VALUE
($)
MARKET VALUE
(%)
Infrastructure $2,182.9 25% 20-30% $1,161.0 29%Natural Resources $3,056.1 35% 30-40% $1,441.6 36%Diversifying Strategies $3,492.7 40% 35-45% $1,431.0 35%TOTAL: $8,731.8 100% 0-10% $4,033.6 100%Source: State State. Data as of December 31, 2016. $ in millions.

Cash Flow Activity Since Inception
Alternatives Portfolio 2017 Plan and Review 17
As anticipated, Portfolio cash outflows have outweighed cash inflows by a meaningful amount with pace of contributions increasing as capital commitments are made
As of December 31, 2016, OPERF has contributed $4.2 billion in capital, funding approximately 61% of aggregate capital commitments. Approximately $2.9 billion of capital commitments remain outstanding.
A total of $609.0 million has been distributed to OPERF As new commitments continue to be made, the weighted-average age of commitments has
remained consistent, averaging approximately 2 years Since inception, 36 commitments to closed-end vehicles:
9 have reached end of investment period 0 have reached end of term 0 have been fully realized
2011 2012 2013 2014 2015 2016
Authorized Commitments* $882.5 $225.0 $700.0 $1,355.0 $2,150.0 $1,712.0Contributions -$383.7 -$155.8 -$435.1 -$363.9 -$1,102.0 -$1,760.2Distributions $58.6 $67.1 $57.3 $126.2 $63.9 $236.0Net Cash Flow -$325.0 -$88.6 -$377.8 -$237.7 -$1,038.1 -$1,524.2Unfunded Commitments $282.5 $534.4 $574.3 $1,643.1 $2,353.6 $2,871.5Weighted Avg. Age of Commitments (yrs) 2.0 2.1 2.1 1.9 2.1 2.3
Source: State Street. Data as of December 31, 2016. $ in millions.*Calendar Year 2011 commitments include initial transfer from Opportunity Portfolio.

Performance
Alternatives Portfolio 2017 Plan and Review 18
As noted, Alternatives Portfolio is early in its build-out, and nearly all returns are unrealized ≈ 77% of total contributions made in the last three years Weighted-average age of 2.3 years
Given the long-term nature of alternative investments, as well as the J-curve effect, performance less than three years is generally not meaningful
Time-Weighted 1 Year 3 Year 5 year InceptionAlternatives Portfolio 11.6 3.7 2.8 2.8CPI + 4% 6.5 5.1 5.3 5.4Difference 5.2 -1.4 -2.4 -2.6Source: State Street. Data as of March 31, 2017. Net of fees.
Dollar-Weighted 1 Year 3 Year 5 year InceptionAlternatives Portfolio 9.5 3.7 3.4 3.1CPI + 4% 6.0 5.2 5.2 5.2Difference 3.5 -1.5 -1.8 -2.1Source: TorreyCove. Data as of December 31, 2016. Net of fees.

Alternatives Portfolio 2017 Plan and Review 19
Topics
1. Background/Objectives
2. 2016 Review
3. Looking Forward
4. Appendix

2017 Portfolio Initiatives
Alternatives Portfolio 2017 Plan and Review 20
Diversifying Strategies Kicked off second year of “three-year plan” with Callan onsite February 3, 2017 Assistance from Karl Cheng on managed futures 2-3 recommendations expected in second half of 2017
Co-investment
Staff and consultant continue to evaluate co-investment opportunities and refine program model
• Objective function is to reduce fee drag • No one-size-fits-all approach exists
Separate accounts/strategic relationships
Staff and consultant continue to evaluate existing anchor relationships for potential separate account/strategic relationship programs
Benchmarking
Evaluation of primary and secondary benchmarks underway

2017 Portfolio Initiatives, cont.
Alternatives Portfolio 2017 Plan and Review 21
Investment Pipeline Alternative risk premia (2) (Global, public markets) Upstream energy (North America, private markets) Diversified infrastructure (North America, private markets) Diversified energy (North America, private markets) Midstream infrastructure (North America, private markets) Managed futures (Global, public markets) Upstream energy (North America, private markets) Power infrastructure (North America, private markets)
Current Market Themes Rise of non-traditional funds and fund sponsors North American energy plays Energy storage Reduction in traditional lending Renewable power Emerging markets

Portfolio Structure/Relationships
Alternatives Portfolio 2017 Plan and Review 22
Total OPERF Alternatives Portfolio
$1.2 billion NAV $1.4 billion NAV $1.4 billion NAV
Number of Ongoing Relationships / Managers
Brookfield EnCap Flatrock EQT GIP LS Power Northern Shipping Starwood Energy Stonepeak
8
Appian Brookfield EMR EnerVest Homestead NGP SailingStone Sheridan Taurus Teays River Tillridge Twin Creeks Warwick
13
AQR 1
* Source: State Street. Market values as of December 31, 2016.
Infrastructure Natural Resources
Diversifying Strategies
$4.0 billion NAV

Portfolio Structure/Relationships Vision
Alternatives Portfolio 2017 Plan and Review 23
Total OPERF Alternatives Portfolio
$1.2 billion NAV $2.2 billion target $1.7 billion unfunded
$1.4 billion NAV $3.1 billion target $1.1 billion unfunded
$1.4 billion NAV $3.5 billion target $0 unfunded
Number of Ongoing Relationships / Managers
Brookfield EnCap Flatrock EQT GIP LS Power Northern Shipping Starwood Energy Stonepeak
8
Appian Brookfield EMR EnerVest Homestead NGP SailingStone Sheridan Taurus Teays River Tillridge Twin Creeks Warwick
13
AQR 1
* Source: State Street. Market values as of December 31, 2016.
Infrastructure Natural Resources
Diversifying Strategies
$4.0 billion NAV $8.7 billion target $2.9 billion unfunded
Goals: • Target 30 active
relationships • Use for priority setting • Assess current targets – are
they reasonable?
• Envision 10-12 relationships • Larger manager and
investable universe, so average commitment larger
• Envision 14-16 relationships • Smaller manager and
investable universe, so average commitment smaller
• Envision 4-6 relationships
• Maintain style and strategy premia manager bias

Portfolio Pacing
Alternatives Portfolio 2017 Plan and Review 24
2017 Plan $2.0 – $2.5 billion in commitments Based on balanced portfolio allocation, not driven by need to fill an exposure
Longer-term pacing
Staff has been measured, given entry point risk, research requirements and resource constraints
At current pace, will not reach target allocation for several years Can deploy liquid strategies (e.g., diversifying strategies and listed commodities funds)
more quickly than illiquid strategies (e.g., infrastructure, timber, agriculture, metals & mining, etc.)
Remain cognizant of exposures while aiming for vintage year diversification
Topics
Alternatives Portfolio 2017 Plan and Review 25
1. Background/Objectives
2. 2016 Review
3. Looking Forward
4. Appendix

Appendix: Investment Process
Alternatives Portfolio 2017 Plan and Review 26
Very high-level summary of Alternatives Portfolio investment evaluation framework philosophy
In practice, many more variables, non-linear, and with numerous feedback channels
-Low expected overlap and correlation with other strategies-Sources of risk/return-Scope of mandate-Pacing-Relationship target*Additive to the Portfolio
-Firm, team, strategy evaluation-Investment performance evaluation-Differentiated-Culture-Financial discipline-Effective implementation *Confidence manager will achieve their objectives
-Valuations-Fundraising activity-Contrarian approach-Asymmetric return profile-Manager assessment of opportunity set*Awareness of cycles
-Ownership-Economics-Protections/remedies-Transparency-GP commitment*GP/LP Alignment and spirit of partnership
Fit Skill Assessment Timing/Opportunity Set Governance
Internal Review ATL > CIO > Consultant
Underwriting PackageScorecard > Reference Calls > Track Record > Memo
Terms and Conditions
Portfolio

Appendix: Relative Risk & Return Expectations
Alternatives Portfolio 2017 Plan and Review 27
, or about 8.5% net after cash
Lower Risk
Medium Risk
Higher Risk
Expe
cted
Ret
urn
Expected Risk
-Mature, operating asset or property-Revenue contracted, inflation-linked, predictable-Limited GDP sensitivity-Target net returns of 5-10%-Income a meaningful component of total return -E.g., AQR, Sheridan, Brookfield
-Some development/expansion risk-Revenue partially contracted, inflation-linked-Opportunity to de-risk-Target net returns of 10-15%-Moderate cash yield plus growth-E.g., Stonepeak, GIP
-Greenfield construction or development-Revenue mostly merchant-GDP/market exposure-Private equity-l ike-Target net returns of >15%-Low cash yield, focus on growth-E.g., NGP, Appian, Til lridge
More volatile but also potentially more diversifying, e.g., managed
futures and metals & mining
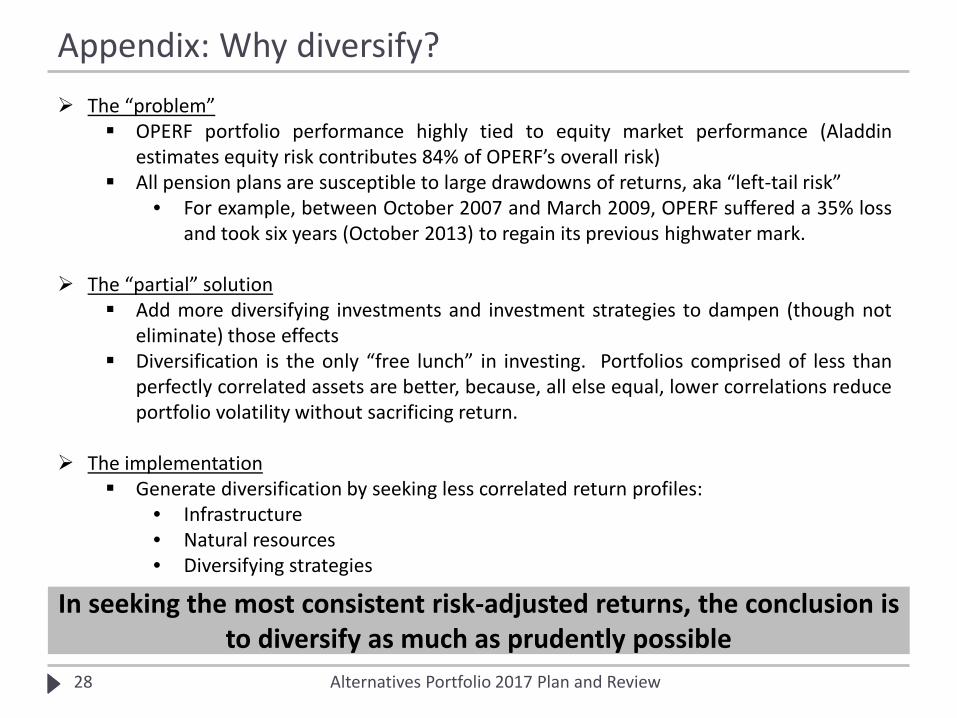
Appendix: Why diversify?
Alternatives Portfolio 2017 Plan and Review 28
In seeking the most consistent risk-adjusted returns, the conclusion is to diversify as much as prudently possible
The “problem” OPERF portfolio performance highly tied to equity market performance (Aladdin
estimates equity risk contributes 84% of OPERF’s overall risk) All pension plans are susceptible to large drawdowns of returns, aka “left-tail risk”
• For example, between October 2007 and March 2009, OPERF suffered a 35% loss and took six years (October 2013) to regain its previous highwater mark.
The “partial” solution
Add more diversifying investments and investment strategies to dampen (though not eliminate) those effects
Diversification is the only “free lunch” in investing. Portfolios comprised of less than perfectly correlated assets are better, because, all else equal, lower correlations reduce portfolio volatility without sacrificing return.
The implementation Generate diversification by seeking less correlated return profiles:
• Infrastructure • Natural resources • Diversifying strategies

Appendix: Why diversify? Timberland Example
Alternatives Portfolio 2017 Plan and Review 29
Timberland investment returns have moved in a manner quite different from those of many other asset classes. This is due to the unique drivers of return for timberland: Biological growth – historically, biological tree growth has been the largest component
of timberland return. Regardless of what is happening in financial markets and the economy, trees continue to grow. As trees grow in volume, they also turn into higher value products (called “ingrowth”).
Timber prices – influenced by a variety of macroeconomic factors, including population growth, GDP per capital, housing starts, etc. Importantly, the various utilities of timber in the consumer market tends to produce a return that is linked with inflation.
Land prices – related to local supply and demand conditions, namely highest and best use (“HBU”) considerations.
Other characteristics: • Ability to defer harvest – investors can “store-on-the-stump” at low, marginal
costs, thus adjusting production to varying levels of demand.
Biological Growth
61%
Land6%
Timber Prices33%
0% 20% 40% 60% 80% 100%
1
Sources of Timberland Return
Representative Southern pine plantation (Caulfield, 1998)

TAB 7 – Opportunity Portfolio Review
OPERF

OPERF Opportunity Portfolio 2015-2016 Review
John Hershey, Director of Alternative Investments April 26, 2017

2
Topics
1. Opportunity Portfolio Overview
2. 2015-2016 Review
3. Active Funds Review
Opportunity Portfolio 2015-2016 Review

Opportunity Portfolio Overview
Opportunity Portfolio 2015-2016 Review 3
Role Provide enhanced risk adjusted returns and diversification to OPERF Investments typically a combination of shorter-term (1-3 years) and longer-term holdings May be up to 3.0% allocation of OPERF No strategic target allocation
Objectives
Policy 9.0% target return, net of fees Secondary policy benchmark CPI + 5.0%, over trailing three-year period Low correlation with other OPERF holdings Less risk than OPERF public equity component Opportunistic/dislocation oriented Innovation oriented Non-diversified – may concentrate investments
Strategies of Interest
Dislocation oriented (illiquid credit, mortgages, regulatory capital arbitrage) Less correlation oriented (drug royalties, insurance and reinsurance, intellectual property) Strategic partnerships (“club deals”, tactical/opportunistic partnerships)

4
Topics
1. Opportunity Portfolio Overview
2. 2015-2016 Review
3. Active Funds Review
Opportunity Portfolio 2015-2016 Review

New Investments / Pipeline / Dispositions
Opportunity Portfolio 2015-2016 Review 5
2015 Commitments TPG European Specialty Lending ($100mm – Feb) TPG TAO ($250mm – Sep)
2016 Commitments Owl Rock ($150mm – Sep) Lone Star Fund X ($150mm – Oct)
2015 Dispositions
Endeavor SEAM ($20mm – Q1’15)
2016 Commitment Reductions Lone Star Residential Mortgages ($43mm – June)

Cash Flows and Commitments (as of 6/30/2016)
Opportunity Portfolio 2015-2016 Review 6
$(30)
$(428)
$(652)
$(447)
$(311)
$(87) $(177)
$(37)
$(258) $(358)
$(117)
$- $9 $121
$429 $417 $349
$201 $307
$106 $145
$22
$(800)
$(600)
$(400)
$(200)
$-
$200
$400
$600
$800
2006 2008 2010 2012 2014 2016YTD
ContributionsDistributionsNet Cash Flow
$200
$590
$792
$200 $211 $100
$175
$550 $550
$221
$- $30
$443
$734
$968 $1,053
$939 $976 $828
$1,050
$1,286 $1,438
$-
$200
$400
$600
$800
$1,000
$1,200
$1,400
$1,600
2006 2008 2010 2012 2014 2016YTD
Commitments
Opp Port Value
millions
millions

Investments (as of 6/30/2016)
Opportunity Portfolio 2015-2016 Review 7
Fund Strategy FMV ($mm)
% Commitment ($mm)
Date of Commitment
Vintage Year Contribution-Weighted Age
(years) Fidelity RE Opp Inc Debt 186.8 13% 100.0 2/2007 2007 8.8
BlackRock Credit Inv Debt 0.2 < 1% 200.0 11/2007 2007 8.7
Providence TMT Bank Loan 4.0 < 1% 100.0 6/2008 2008 7.4
Apollo Credit Opp II Bank Loan 1.4 < 1% 250.0 8/2008 2008 7.1
BlackRock Credit Inv II Debt 0.2 < 1% 100.0 9/2008 2008 7.8
BlackRock Credit Inv Co-Inv Debt 0.1 < 1% 72.0 10/2008 2008 7.7
Sanders All Asset Equity 320.5 22% 200.0 1/2010 2010 6.3
Nephila Juniper Reinsurance 74.6 5% 50.0 1/2012 2012 4.5
Nephila Palmetto Reinsurance 67.4 5% 50.0 1/2012 2012 4.5
SailingStone Nat Gas Equity 73.6 5% 75.0 10/2012 2012 2.5
Blackstone Tactical Opps Diversified 390.5 27% 500.0 9/2013 2013 1.5
Content Partners 3 Royalties 15.9 1% 50.0 4/2014 2014 1.0
TPG TAO Diversified 223.6 16% 500.0 5/2014 2014 1.0
Lone Star Res Mtg I Debt (0.6) < 1% 43.2 12/2014 2015 0.8
Galton Mortgage Debt 49.9 3% 50.0 1/2015 2015 0.6
OrbiMed Royalties 5.2 < 1% 35.0 1/2015 2015 0.6
TPG Specialty Europe I Debt 24.5 2% 100.0 3/2015 2015 0.6
Total Opportunity Portfolio $1,437.7 4.6 (FMV-weighted)
Allocation within OPERF 2.1% 78% of Portfolio
in 4 Funds

Portfolio Snapshot
Opportunity Portfolio 2015-2016 Review 8
Blackstone Tactical Opps
Sanders All Asset
Fidelity RE Opp Inc
TPG TAO
Nephila Juniper
Nephila Palmetto
SailingStone Other < $50mm
June 2015 FMV $1.1 billion
Blackstone Tactical Opps
Sanders All Asset TPG TAO
Fidelity RE Opp Inc
Nephila Juniper
Nephila Palmetto
SailingStone
Galton Mortgage Other < $50mm
June 2016 FMV $1.4 billion

Portfolio Strategy Snapshot
Opportunity Portfolio 2015-2016 Review 9
Bank Loans
Debt
Diversified Credit
Equity
Reinsurance Royalties
June 2015 Strategy FMV
Bank Loans
Debt
Diversified Credit
Equity
Reinsurance Royalties
June 2016 Strategy FMV

Portfolio Liquidity Snapshot
Opportunity Portfolio 2015-2016 Review 10
< 1 year
1 to 5 years
> 5 years
June 2015 Liquidity FMV
< 1 year
1 to 5 years
> 5 years
June 2016 Liquidity FMV

Portfolio Age Snapshot
Opportunity Portfolio 2015-2016 Review 11
6 years or more 46%
1 to 6 years 52%
< 1 year 2%
June 2015 Contribution-Weighted Age FMV
6 years or more 36%
1 to 6 years 59%
< 1 year 5%
June 2016 Contribution-Weighted Age FMV

Portfolio Age Snapshot (as of 6/30/2016)
Opportunity Portfolio 2015-2016 Review 12
Blackstone Tactical Opps Sanders All Asset
TPG TAO
Fidelity RE Opp Inc
Nephila Juniper
SailingStone Nat Gas Nephila Palmetto Galton Mtg OrbiMed TPG SLE
Lone Star
Content Partners 3
Providence TMT Apollo Cred Opp II
BlackRock Cred Inv, Inv II, Co-Inv
-$100
$0
$100
$200
$300
$400
$500
$600
$700
< 1 year 1 year 2 years 3 years 4 years 5 years 6 years or more
FMV (millions)
Fund Age (Contribution-Weighted)

Performance
Opportunity Portfolio 2015-2016 Review 13
Measure 6/30/2015 6/30/2016
FMV + Distributions $3,055mm $3,365mm
FMV $1,121mm $1,437mm
FMV % of OPERF ~1.6% ~2.1%
FMV + unfunded commitments % of OPERF ~2.3% ~3.0%
Multiple ((FMV + Distributions)/Drawn) 1.26x 1.34x
IRR since inception (9/2006) 8.2% 7.7%
Time-weighted returns (source: State Street)
YTD 2.9% 0.9%
1 Year 3.3% 0.8%
3 Years 9.0% 6.3%
5 Years 11.9% 7.2%
7 Years 11.6% 12.3%
Since inception (9/2006) 9.2% 7.0%

Opportunity Portfolio 2015-2016 Review 14
Topics
1. Opportunity Portfolio Overview
2. 2015-2016 Review
3. Active Funds Review

Active Funds Review
Opportunity Portfolio 2015-2016 Review 15
Fidelity Real Estate Opportunities
Strategy Real estate debt (CMBS, private debt, term loans)
Vintage 2007
Performance 7.3% net IRR since inception (2/07)
Outlook • 7.7% current yield • Focus on CMBS recently, given that CMBS have lagged broader rally
and attractive spread levels
Sanders Capital All Asset Value
Strategy All asset value fund
Vintage 2010
Performance 9.4% net time-weighted return since inception (3/10) as of 3/17
Outlook • 10% hurdle rate for each investment • 35% cash position, defensively positioned, few opportunities
meeting hurdle requirement, focusing on high tech particularly in Information Technology and Health Care

Active Funds Review
Opportunity Portfolio 2015-2016 Review 16
Nephila Juniper Fund Strategy Natural hazard catastrophe risk reinsurance
Vintage 2012
Performance 9.3% net time-weighted return since inception (1/12)
Outlook • Catastrophe risk premiums have declined • Average expected return may not meet Portfolio threshold • Few major catastrophes since inception • Evaluating a shift in strategy/implementation
Nephila Palmetto Fund Strategy Natural hazard catastrophe risk reinsurance
Vintage 2012
Performance 6.9% net time-weighted return since inception (1/12)
Outlook • Catastrophe risk premiums have declined • Average expected return may not meet Portfolio threshold • Few major catastrophes since inception • Evaluating a shift in strategy/implementation

Active Funds Review
Opportunity Portfolio 2015-2016 Review 17
SailingStone Natural Gas Portfolio Strategy Natural Gas E&P
Vintage 2012
Performance (5.8)% net time-weighted return since inception (11/12)
Outlook • Estimating point forward annualized return of 20% over 5-year horizon based on natural gas price assumptions
• Targeting companies with advantaged assets generating low double digit returns at $3.0/mmbtu
• Expect increasing demand and prices for gas over medium term • Have dollar-cost averaged down
Blackstone Tactical Opportunities Strategy All assets
Vintage 2013
Performance High single-digit IRR since inception (9/13) for separately managed account
Outlook • Expected 13% net IRR • Significant investments in telecom infrastructure and services,
specialty finance, insurance, metals and mining, and energy • In harvest period

Active Funds Review
Opportunity Portfolio 2015-2016 Review 18
Content Partners 3 Strategy Entertainment royalties
Vintage 2014
Performance NM (less than 3 years)
Outlook • Target 10-15% return • Current projected IRR on assets expected to be 15% • Closed $330mm investment in Revolution Studios in Jan 2017 with
12% projected gross IRR and potential upside
TPG TSSP Adjacent Opportunities Partners Strategy Diversified credit
Vintage 2014
Performance NM (less than 3 years)
Outlook • Expect 10-15% total returns with upside potential • Some outstanding investments in 2015-2016 vintages • Significant realization on ‘Project Greek’ financing

Active Funds Review
Opportunity Portfolio 2015-2016 Review 19
OrbiMed Royalty Opportunities III Strategy Pharmaceutical royalties
Vintage 2015
Performance NM (less than 3 years)
Outlook • Target 10-15% total return • 45% invested with ~18% in pipeline
Lone Star Residential Mortgage Fund I Strategy Residential mortgage securities
Vintage 2015
Performance NM (less than 3 years)
Outlook • Target 15-20% total return • Smaller market opportunity drove Lone Star to reduce fund
commitment by 50% and to reduce management fee • Recent volume has ticked up

Active Funds Review
Opportunity Portfolio 2015-2016 Review 20
TPG Specialty Lending Europe I
Strategy Direct lending
Vintage 2015
Performance NM (less than 3 years)
Outlook • Target 14% net IRR • Running in line with target on current portfolio • Approximately 30% invested
Galton Mortgage Recovery Fund III
Strategy Residential mortgages
Vintage 2015
Performance NM (less than 3 years)
Outlook • Market opportunity slow to develop because of change in FHA policy and lower than expected organic borrower demand
• Recently implemented a well-received securitization to secure low funding cost
• Original target return of 15% is now 10%

Active Funds Review
Opportunity Portfolio 2015-2016 Review 21
Owl Rock Capital Corporation Strategy Direct lending
Vintage 3Q2016
Performance NM (less than 3 years)
Outlook • Targeting 20% gross IRR • Market opportunity driven by bank regulatory concerns • Focused on PE sponsor transactions
Lone Star Fund X Strategy Debt
Vintage 4Q2016
Performance NM (less than 3 years)
Outlook • Targeting 25% gross IRR • Moved from Real Estate Portfolio given poor fit for newer Real
Estate Portfolio mandate

TAB 8 – State Accident Insurance Fund
Annual Review
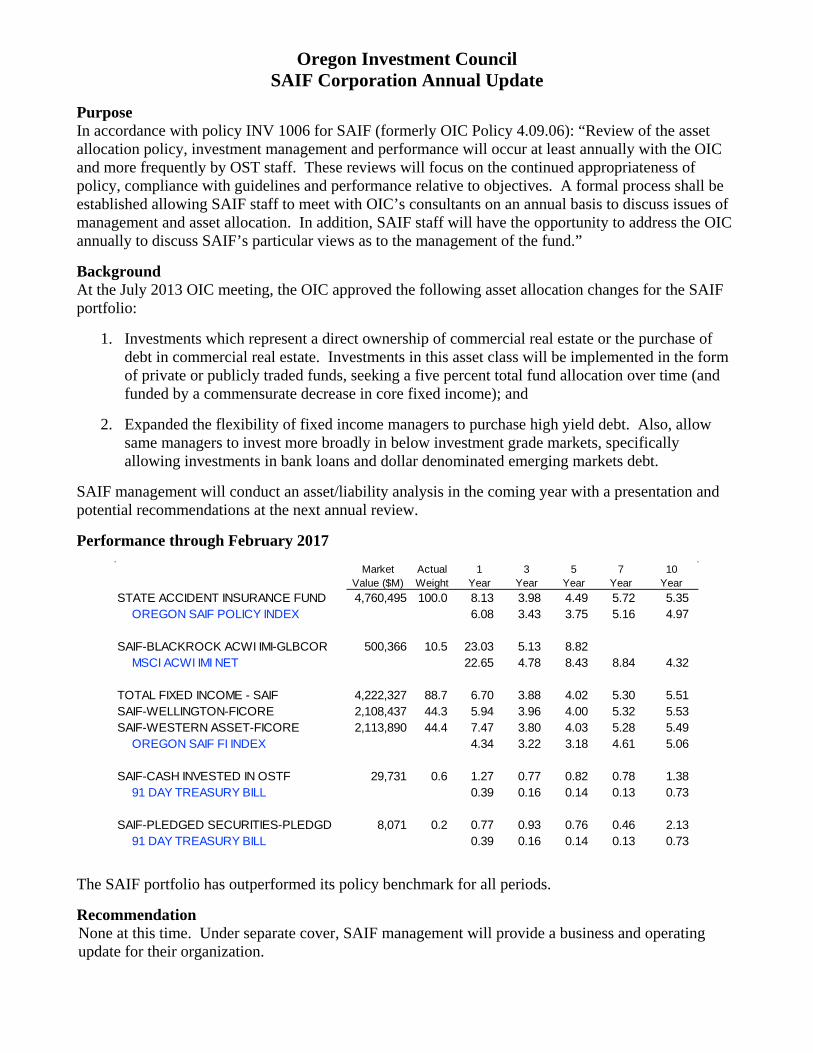
Oregon Investment Council SAIF Corporation Annual Update
Purpose In accordance with policy INV 1006 for SAIF (formerly OIC Policy 4.09.06): “Review of the asset allocation policy, investment management and performance will occur at least annually with the OIC and more frequently by OST staff. These reviews will focus on the continued appropriateness of policy, compliance with guidelines and performance relative to objectives. A formal process shall be established allowing SAIF staff to meet with OIC’s consultants on an annual basis to discuss issues of management and asset allocation. In addition, SAIF staff will have the opportunity to address the OIC annually to discuss SAIF’s particular views as to the management of the fund.”
Background At the July 2013 OIC meeting, the OIC approved the following asset allocation changes for the SAIF portfolio:
1. Investments which represent a direct ownership of commercial real estate or the purchase of debt in commercial real estate. Investments in this asset class will be implemented in the form of private or publicly traded funds, seeking a five percent total fund allocation over time (and funded by a commensurate decrease in core fixed income); and
2. Expanded the flexibility of fixed income managers to purchase high yield debt. Also, allow same managers to invest more broadly in below investment grade markets, specifically allowing investments in bank loans and dollar denominated emerging markets debt.
SAIF management will conduct an asset/liability analysis in the coming year with a presentation and potential recommendations at the next annual review.
Performance through February 2017
MarketValue ($M)
Actual Weight
1Year
3Year
5Year
7Year
10Year
STATE ACCIDENT INSURANCE FUND 4,760,495 100.0 8.13 3.98 4.49 5.72 5.35OREGON SAIF POLICY INDEX 6.08 3.43 3.75 5.16 4.97
SAIF-BLACKROCK ACWI IMI-GLBCOR 500,366 10.5 23.03 5.13 8.82 MSCI ACWI IMI NET 22.65 4.78 8.43 8.84 4.32
TOTAL FIXED INCOME - SAIF 4,222,327 88.7 6.70 3.88 4.02 5.30 5.51SAIF-WELLINGTON-FICORE 2,108,437 44.3 5.94 3.96 4.00 5.32 5.53SAIF-WESTERN ASSET-FICORE 2,113,890 44.4 7.47 3.80 4.03 5.28 5.49
OREGON SAIF FI INDEX 4.34 3.22 3.18 4.61 5.06
SAIF-CASH INVESTED IN OSTF 29,731 0.6 1.27 0.77 0.82 0.78 1.3891 DAY TREASURY BILL 0.39 0.16 0.14 0.13 0.73
SAIF-PLEDGED SECURITIES-PLEDGD 8,071 0.2 0.77 0.93 0.76 0.46 2.1391 DAY TREASURY BILL 0.39 0.16 0.14 0.13 0.73
The SAIF portfolio has outperformed its policy benchmark for all periods.
Recommendation None at this time. Under separate cover, SAIF management will provide a business and operating update for their organization.

Financial Overview
OREGON INVESTMENT COUNCIL
April 2017
April 26, 2017 1
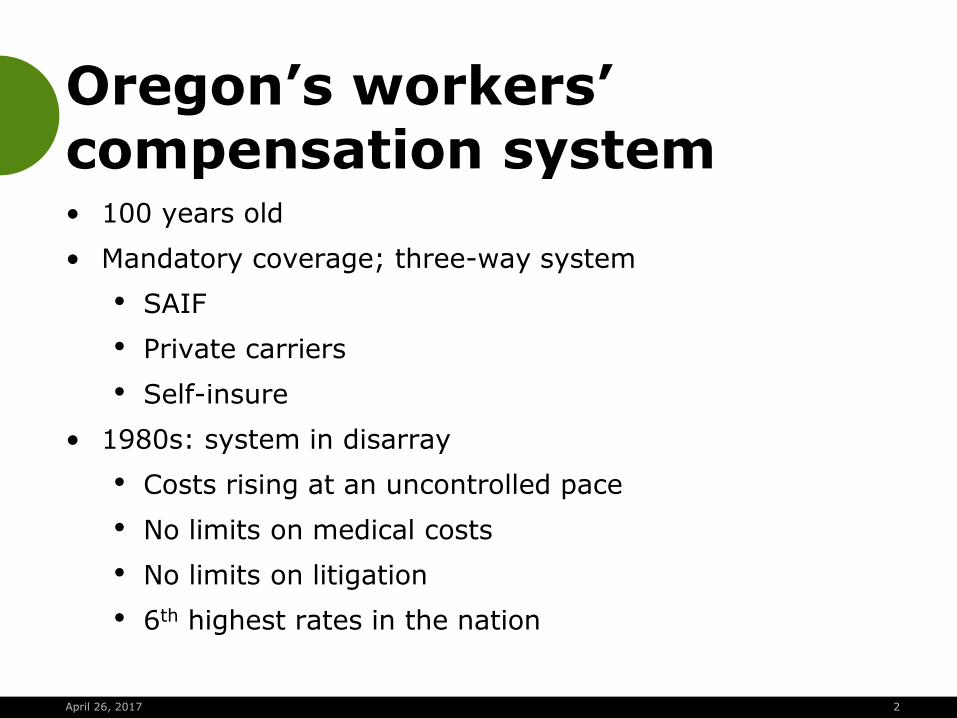
Oregon’s workers’ compensation system • 100 years old
• Mandatory coverage; three-way system
• SAIF
• Private carriers
• Self-insure
• 1980s: system in disarray
• Costs rising at an uncontrolled pace
• No limits on medical costs
• No limits on litigation
• 6th highest rates in the nation
April 26, 2017 2

Oregon’s workers’ compensation system • 1990 Mahonia Hall reforms
• Restructured the system to benefit employers and employees
• 70.2 percent reduction in pure premium rates
• 7th lowest rates in the nation
• Increased most benefit levels for workers
• Other states’ (IL, FL, NY, IA, KY, etc.) systems in crisis, but not here
• Management Labor Advisory Committee created
• SAIF’s goal: maintain balance in the system
April 26, 2017 3
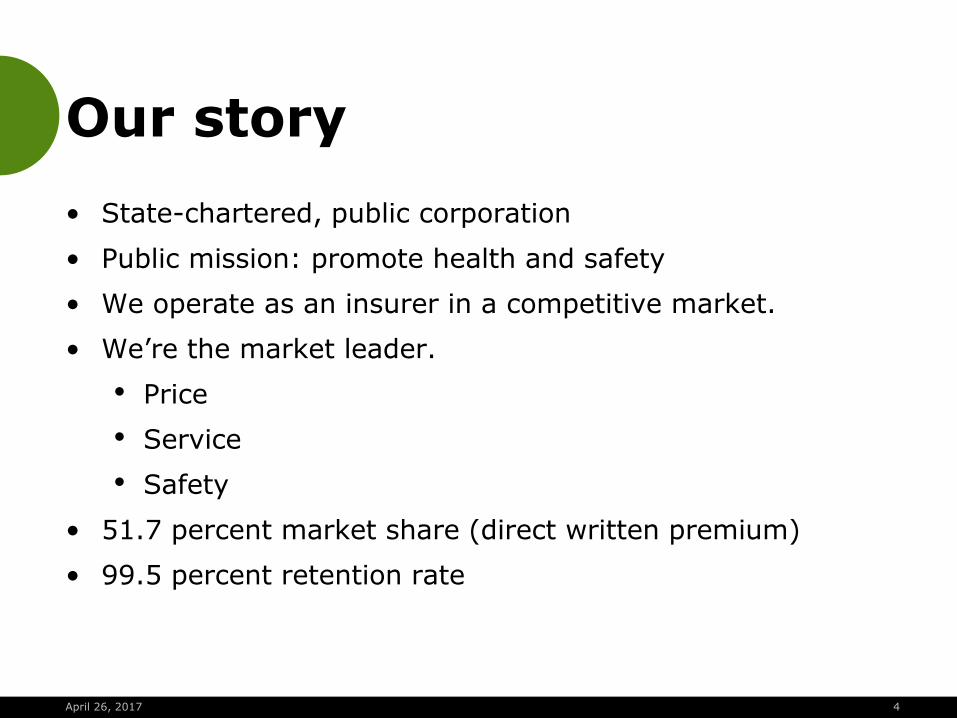
Our story
• State-chartered, public corporation
• Public mission: promote health and safety
• We operate as an insurer in a competitive market.
• We’re the market leader.
• Price
• Service
• Safety
• 51.7 percent market share (direct written premium)
• 99.5 percent retention rate
April 26, 2017 4
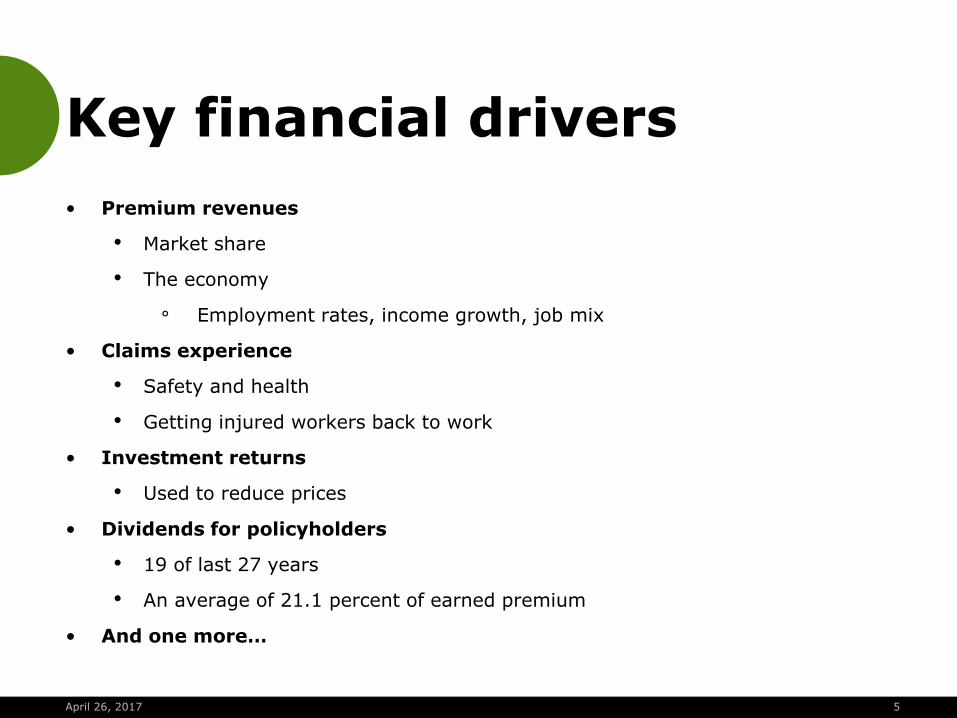
Key financial drivers
• Premium revenues
• Market share
• The economy
° Employment rates, income growth, job mix
• Claims experience
• Safety and health
• Getting injured workers back to work
• Investment returns
• Used to reduce prices
• Dividends for policyholders
• 19 of last 27 years
• An average of 21.1 percent of earned premium
• And one more…
April 26, 2017 5

Changes to loss reserves
• Total asset base: $5.0 billion
• Claim reserves: $2.8 billion
• A reserve is set for every significant claim.
• Represents the full amount to be paid over the life of the claim
• Claims can last for decades.
• Loss reserves are recalculated twice a year.
• Adjusted for loss patterns: frequency and severity
• Medical cost inflation
• Can result in substantial shifts of capital
• $270 million in 2016
• Major impact on bottom line
• Can go both ways!
April 26, 2017 6

Capital base: “surplus”
• Surplus: assets not offset by a liability
• Why is surplus necessary?
• Minimize the risk of breaking the promise we make to policyholders and workers
• Maintain credibility in the market
• How much surplus is “enough”?
• There is no formula.
• Regulators impose a minimum, but not a maximum.
• It’s really about risk tolerance.
• Reinsurance can extend surplus, but at a price
April 26, 2017 7

Capital base: “surplus”
Risk factors
• Catastrophe
• Major economic downturn
• Changes in loss patterns or business mix
• Decline in investments
• Negative development in loss reserves
• Regulatory and statutory changes
• Inflation
• Workers’ compensation has a “long tail.”
Special risk factors for SAIF
• We are unable to spread risk: mono-state, mono-line.
• No other sources of capital
• Growth in market share requires more capital.
April 26, 2017 8

Facts
Number of employers insured (including share of Assigned Risk Pool) 51,419 51,764
Total invested assets $4.4 billion $4.6 billion
Total assets $4.8 billion $5.0 billion
Claims and loss adjustment expense reserves $2.9 billion $2.8 billion
Total liabilities $3.4 billion $3.3 billion
Surplus/capital $1.4 billion $1.6 billion
Net earned premium $491.1 million $516.5 million
Premium market share (as of Dec. 31, 2015) 51.7 percent —
Total investment income $155.7 million $183.7 million
Policyholder dividend $120.0 million $139.9 million
Number of employees 944 992
Retention percentage 99.6 percent 99.5 percent
Average weighted expense load factor 1.258 —
April 26, 2017 9
2015 2016

Average weighted expense load factor
April 26, 2017 10

Net earned premium
April 26, 2017 11

April 26, 2017 12
Total investment income
April 14, 2017 SAIF Corporation 12
$ M
illions

Claim reserves As of December 31, 2016
Total $2,841.2 (dollars in millions)
April 26, 2017 13
Definitions
LAE (Loss adjustment expenses)
Reserves for the future cost of adjusting and processing claims
PTD (Permanent total disability)
Reserves for the loss of use or function of any portion of the body which permanently incapacitates the worker from regularly performing work at a gainful and suitable occupation
PPD (Permanent partial disability)
Reserves for permanent, complete, or partial loss of use of bodily extremities, including vision or hearing
Other Reserves for claims involving fatalities,
claims which only include medical costs, injured worker attorney fees, vocational rehabilitation costs, and other claims related costs

Dividend history
April 26, 2017 14

Surplus/capital
as of December 31
April 26, 2017 15

Adequacy of surplus and reserves
• As of December 31, 2016 our surplus/capital balance was within the board approved risk appetite and tolerance statement.
• A 2016 audit by an independent actuary hired by the Secretary of State Audits Division determined that SAIF’s loss reserves, as of December 31, 2015, are in the reasonable range.
• Given SAIF’s adequate loss reserves, the independent actuary concluded that SAIF’s surplus appears to be sufficient to support SAIF as an ongoing concern over a five-year forecast horizon.
April 26, 2017 16

SAIF's current investment policy
At its September 25, 2013, meeting the Oregon Investment Council adopted
the following policy.
Asset allocation
April 26, 2017 17
Asset class Benchmark Strategic target allocation Range
Global equities MSCI ACWI IMI index
10% 7%–13%
US fixed income Custom fixed- income benchmark
85% 80%–90%
Real estate NCREIF property index
5% 0%–7%
Cash 0% 0%–3%

April 26, 2017

TAB 9 – Asset Allocations & NAV Updates

Asset Allocations at March 31, 2017
Variable Fund Total Fund
OPERF Policy Target1
$ Thousands Pre-Overlay Overlay Net Position Actual $ Thousands $ Thousands
Public Equity 32.5-42.5% 37.5% 28,054,075 39.3% (606,159) 27,447,916 38.4% 617,042 28,064,958
Private Equity 13.5-21.5% 17.5% 13,895,366 19.5% 13,895,366 19.5% 13,895,366
Total Equity 50.0-60.0% 55.0% 41,949,441 58.7% (606,159) 41,343,282 57.9% 41,960,324
Opportunity Portfolio 0-3% 0.0% 1,477,260 2.1% 1,477,260 2.1% 1,477,260
Fixed Income 15-25% 20.0% 13,853,478 19.4% 1,613,454 15,466,932 21.7% 15,466,932
Real Estate 9.5-15.5% 12.5% 8,900,194 12.5% (33,200) 8,866,994 12.4% 8,866,994
Alternative Investments 0-12.5% 12.5% 4,255,385 6.0% 4,255,385 6.0% 4,255,385
Cash2
0-3% 0.0% 984,804 1.4% (974,096) 10,708 0.0% 9,409 20,117
TOTAL OPERF 100% 71,420,561$ 100.0% -$ 71,420,561$ 100.0% 626,451$ 72,047,012$
1Targets established in June 2015. Interim policy benchmark consists of: 40% MSCI ACWI IMI Net, 22.5% Custom FI Benchmark, 20% Russell 3000+300bps (1 quarter lagged),
12.5% NCREIF ODCE net (1 quarter lagged), & 5% CPI+400bps. 2Includes cash held in the policy implementation overlay program.
SAIF Policy Target $ Thousands Actual
Total Equity 7-13% 10.0% 506,445 10.6%
Fixed Income 80-90% 85.0% 4,227,618 88.9%
Real Estate 0-7% 5.0% 0 0.0%
Cash 0-3% 0% 22,047 0.5%
TOTAL SAIF 4,756,111$ 100.0%
CSF Policy Target $ Thousands Actual
Domestic Equities 25-35% 30% 462,150 30.3%
International Equities 25-35% 30% 434,818 28.5%
Private Equity 0-12% 10% 178,294 11.7%
Total Equity 65-75% 70% 1,075,262 70.6%
Fixed Income 25-35% 30% 433,035 28.4%
Cash 0-3% 0% 15,609 1.0%
TOTAL CSF 1,523,906$ 100.0%
Regular Account

2805407537.5%
17.5%
0.0%
20.0%
12.5% 12.5%
0.0%
38.4%
19.5%
2.1%
21.7%
12.4%
6.0%
0.0% 0%
5%
10%
15%
20%
25%
30%
35%
40%
45%
Public Equity Private Equity Opportunity
Portfolio
Fixed Income Real Estate Alternative
Investments
Cash
Target
Actual
OPERF Asset Allocation
10.0%
85.0%
5.0%
0.0%
10.6%
88.9%
0.0% 0.5% 0%
10%
20%
30%
40%
50%
60%
70%
80%
90%
100%
Total Equity Fixed Income Real Estate Cash
Target
Actual
SAIF Asset Allocation
30.0% 30.0%
10.0%
30.0%
0.0%
30.3%
28.5%
11.7%
28.4%
1.0%
0%
5%
10%
15%
20%
25%
30%
35%
Domestic Equities International Equities Private Equity Fixed Income Cash
Target
Actual
CSF Asset Allocation
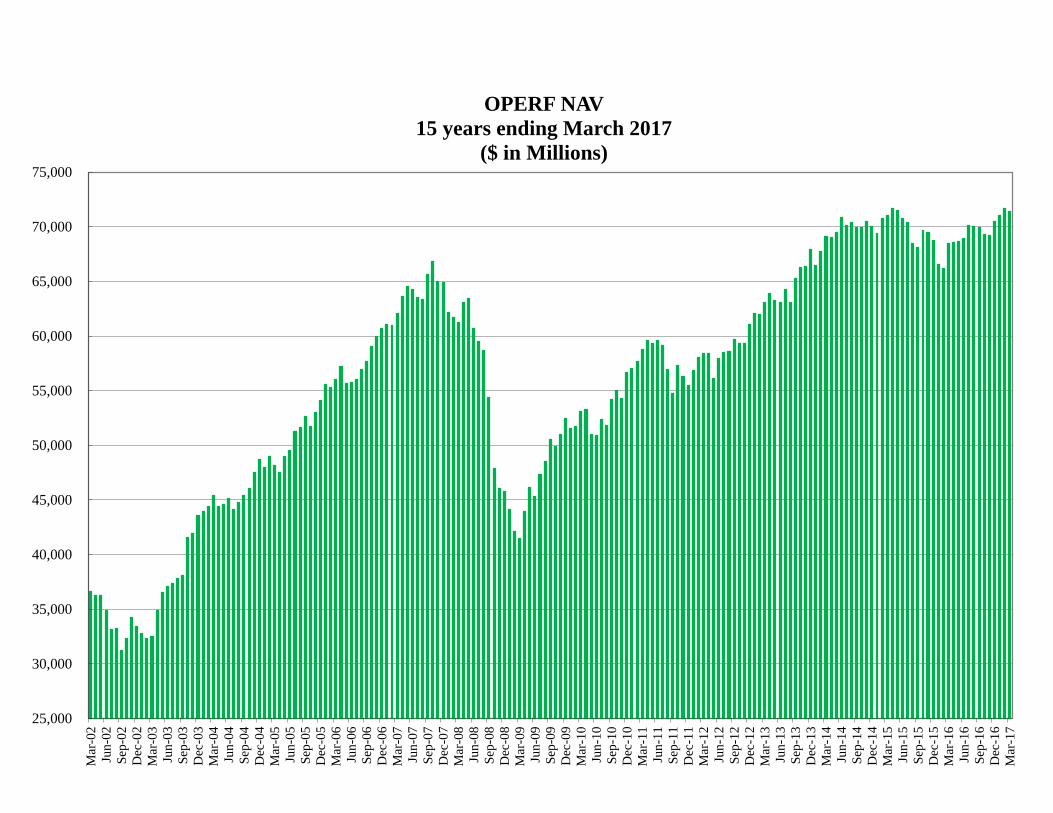
25,000
30,000
35,000
40,000
45,000
50,000
55,000
60,000
65,000
70,000
75,000
Mar
-02
Jun
-02
Sep
-02
Dec
-02
Mar
-03
Jun
-03
Sep
-03
Dec
-03
Mar
-04
Jun
-04
Sep
-04
Dec
-04
Mar
-05
Jun
-05
Sep
-05
Dec
-05
Mar
-06
Jun
-06
Sep
-06
Dec
-06
Mar
-07
Jun
-07
Sep
-07
Dec
-07
Mar
-08
Jun
-08
Sep
-08
Dec
-08
Mar
-09
Jun
-09
Sep
-09
Dec
-09
Mar
-10
Jun
-10
Sep
-10
Dec
-10
Mar
-11
Jun
-11
Sep
-11
Dec
-11
Mar
-12
Jun
-12
Sep
-12
Dec
-12
Mar
-13
Jun
-13
Sep
-13
Dec
-13
Mar
-14
Jun
-14
Sep
-14
Dec
-14
Mar
-15
Jun
-15
Sep
-15
Dec
-15
Mar
-16
Jun
-16
Sep
-16
Dec
-16
Mar
-17
OPERF NAV
15 years ending March 2017
($ in Millions)

2,000
2,500
3,000
3,500
4,000
4,500
5,000
Mar
-02
Jun
-02
Sep
-02
Dec
-02
Mar
-03
Jun
-03
Sep
-03
Dec
-03
Mar
-04
Jun
-04
Sep
-04
Dec
-04
Mar
-05
Jun
-05
Sep
-05
Dec
-05
Mar
-06
Jun
-06
Sep
-06
Dec
-06
Mar
-07
Jun
-07
Sep
-07
Dec
-07
Mar
-08
Jun
-08
Sep
-08
Dec
-08
Mar
-09
Jun
-09
Sep
-09
Dec
-09
Mar
-10
Jun
-10
Sep
-10
Dec
-10
Mar
-11
Jun
-11
Sep
-11
Dec
-11
Mar
-12
Jun
-12
Sep
-12
Dec
-12
Mar
-13
Jun
-13
Sep
-13
Dec
-13
Mar
-14
Jun
-14
Sep
-14
Dec
-14
Mar
-15
Jun
-15
Sep
-15
Dec
-15
Mar
-16
Jun
-16
Sep
-16
Dec
-16
Mar
-17
SAIF NAV
15 years ending March 2017
($ in Millions)

500
700
900
1,100
1,300
1,500
1,700
Mar
-02
Jun
-02
Sep
-02
Dec
-02
Mar
-03
Jun
-03
Sep
-03
Dec
-03
Mar
-04
Jun
-04
Sep
-04
Dec
-04
Mar
-05
Jun
-05
Sep
-05
Dec
-05
Mar
-06
Jun
-06
Sep
-06
Dec
-06
Mar
-07
Jun
-07
Sep
-07
Dec
-07
Mar
-08
Jun
-08
Sep
-08
Dec
-08
Mar
-09
Jun
-09
Sep
-09
Dec
-09
Mar
-10
Jun
-10
Sep
-10
Dec
-10
Mar
-11
Jun
-11
Sep
-11
Dec
-11
Mar
-12
Jun
-12
Sep
-12
Dec
-12
Mar
-13
Jun
-13
Sep
-13
Dec
-13
Mar
-14
Jun
-14
Sep
-14
Dec
-14
Mar
-15
Jun
-15
Sep
-15
Dec
-15
Mar
-16
Jun
-16
Sep
-16
Dec
-16
Mar
-17
CSF NAV
15 years ending March 2017
($ in Millions)

TAB 10 – Calendar — Future Agenda Items

2017/18 OIC Forward Calendar and Planned Agenda Topics June 7, 2017: Q1 2017 OPERF Performance & Risk Report Operations Update Corporate Governance Update CSF Annual Review August 9, 2017: OPERF Currency Policy Recommendation Alternatives Portfolio Manager Recommendation IAP Recommendation September 20, 2017: OPERF Currency Manager Recommendation Alternatives Portfolio Manager Recommendations (2) Q2 2017 OPERF Performance & Risk Report November 1, 2017: Alternatives Portfolio Manager Recommendation Public Equity Program Review CEM Benchmarking Report OIC Policy Updates December 13, 2017: OIC Officer Election Q3 2017 OPERF Performance & Risk Report Fixed Income Program Review February 1, 2018: Private Equity Program Review Placement Agent Report 2019 OIC Calendar Approval OIC Strategic Issues Discussion March 14, 2018: OPERF Overlay Review Securities Lending Update Real Estate Program Review Q4 2017 OPERF Performance & Risk Report April 25, 2018: OPERF Asset Allocation & Capital Market Assumptions Update Alternatives Portfolio Review OIC Policy Updates SAIF Annual Review