Embed Size (px)
Citation preview
Attachment 3
Oregon Furbearer Regulation Proposals
2010–2011 and 2011–2012
June 4, 2010
1
General Furtaker Regulation Proposals Trap size clarification Although referred to in the Furtaker Regulations, there is no definition of a Number 3 foothold trap. Some trappers are building traps from purchased or scrounged components, or they are buying factory traps which do not follow standard sizing guidelines. The Oregon State Police (OSP) have checked traps with a seven inch jaw spread and the trap pan is marked No. 2. The intent of the rule is to have adequate spacing for the larger traps. Specifying the jaw spread will standardize spacing irrespective of manufacturer Wording in bold is proposed to be added to clarify regulations and reduce the advantage of placing the trap pan from a number 2 trap on a number 3 or home modified trap to circumvent the requirement for offset jaws. ● It is unlawful for any person to trap for wild animals using: A No. 3 or larger foothold trap or any foothold trap with an inside jaw spread at dog greater than 6” not having a jaw spacing of at least 3/16 of one inch when the trap is sprung (measurement excludes pads on padded jaw traps) and when the set is not capable of drowning the trapped animal. Documentation for use of traps belonging to another individual The current regulation states: ● It is unlawful for any person to trap for wild animals using:
6. Or possessing the branded traps or snares of another unless in possession of written permission or a bill of sale from the person to whom the brand is registered. The Department is proposing to delete “or a bill of sale “, this will continue the requirement for written permission to use borrowed traps however it will remove the requirement to perpetually need a bill of sale when using previously owned traps even after they have been marked with the current owners brand. Clarification of requirements to qualify for a bobcat or otter ownership tag
The furbearer regulations state that the jaw must "accompany" the pelt in order to receive an ownership tag for a bobcat or otter pelt. It does not explicitly state the trapper/hunter provide the jaw to the department. Age data derived from analyzing teeth from the lower jaw provides important information regarding the structure of the population. This information is considered when setting seasons and bag limits. While the data can survive less than 100% of the jaws being sampled, it is an issue when furtakers refuse to leave the jaws from any of their animals, which is occurring with the present wording of the regulation. The proposed wording below makes it clear the jaws must be relinquished to the Department. 635-050-0183 Bobcat and River Otter Ownership Tags
2
(7) A furtaker shall be responsible for surrendering to the Oregon Department of Fish and Wildlife the lower jawbone and information on sex, date of catch and county of harvest with each individual Oregon bobcat and river otter to qualify for ownership tags….. License Requirements In the past the OSP have checked furtakers in the field who did not have their Trapping or Furbearer Hunting License on their person. This proposal would create consistency with other hunting and fishing license requirements and reflect regulations many trappers and furbearer hunters already believe are in place. The Department proposes to add the following statement in the regulations: The appropriate Furtaker’s license or Hunting License for Furbearers must be in possession to hunt and/or trap furbearers. Use of a light to aid in dispatch of restrained animals Most trapping occurs during the winter when daylight hours are short. Many trappers attend to trap lines in the early morning to minimize time an animal may be in the trap or snare. Traps are also checked in the evening after dark rather than waiting until the next day. Current regulations do not allow the use of an artificial light to assist in the humane dispatch of animals caught in traps or snares with a firearm. The Department is proposing the following regulation to reflect an ongoing practice that has not caused any enforcement problems. An artificial light may be used to provide light to aid in the dispatch of animals legally restrained in a trap or snare. Replace the term “wild animals” The term "wild animals" is not defined in OAR or ORS; however furbearers, unprotected mammals, and predatory animals are defined in the Furbearer Regulations. For consistency and to reduce confusion these defined terms would replace “wild animals” in the regulation below. ● It is unlawful for any person to trap for wild animals furbearers, predatory animals, and/or unprotected mammals using: Taxidermy and Fur Dealer inspection inconsistency It is unclear if wildlife parts in possession of a taxidermist are subject to inspection by OSP or staff during routine checks. OAR 497.218 and 497.238 establish the requirement for a license to engage in taxidermy and fur dealing. OAR Division 200 furthers defines the conditions. In OAR 635-200-0030 (5) fur dealer records and pelts are subject to inspection. In OAR 635-200-0030 (10) only records are noted as subject to inspection, there is no mention of inspection of parts in possession. The and OSP recommend this rule be modified to specifically include inspection of all wildlife parts in possession of a taxidermist similar to the fur dealer requirement. The modified OAR would read: (10) Taxidermy records and all wildlife possessed by licensed taxidermists for the purpose of taxidermy are subject to inspection at any time by any Oregon State Police officer or representative.
3
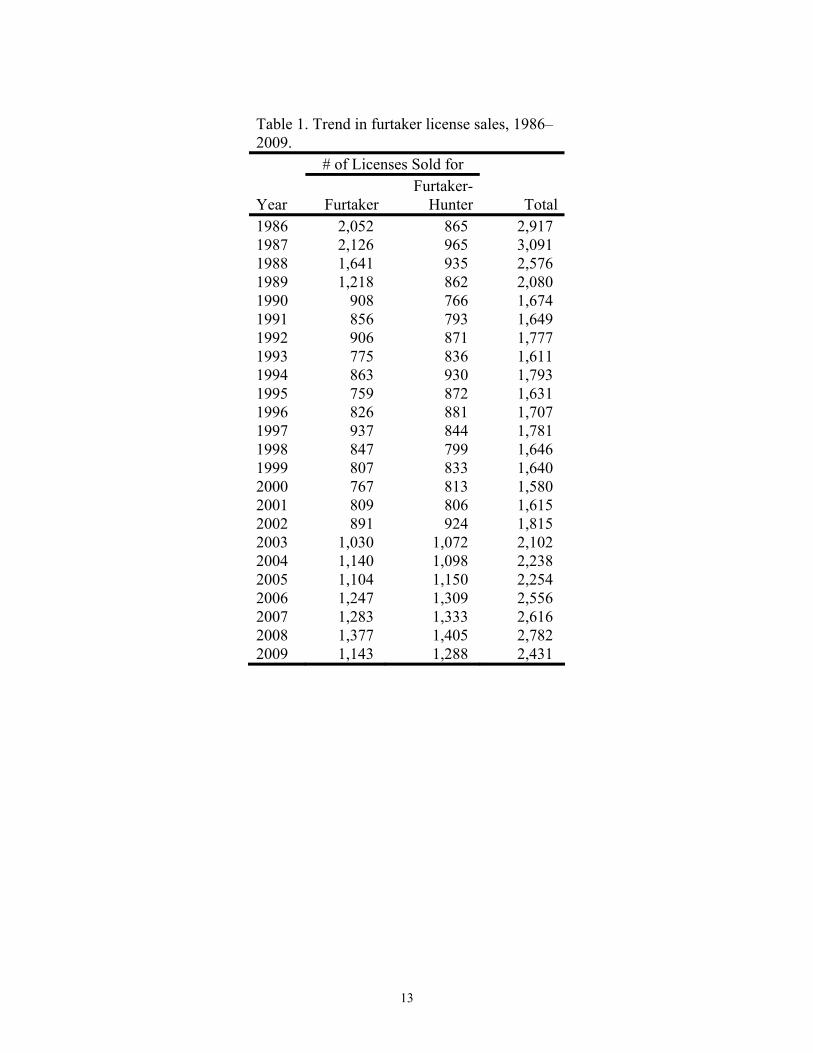
Species Specific Information and Regulation Proposals Note: Due to changing the discussion and adoption of the Oregon Furbearer Trapping and Hunting Regulations from the July, 2010 meeting of the Oregon Fish and Wildlife Commission (Commission) to the June meeting, and the limited time between the April 15 deadline for furtakers to report harvest and effort and deadlines to develop the Commission Packet, there are places in the narrative and tables where 2009-2010 data was not yet available. Updated information will be provided at the June 4, 2010 Commission Meeting. General Trend in Licenses and Report Cards Both Furtaker (valid for both trapping and hunting) and Hunting License for Furbearer sales peaked for the 2008–2009 season at 2,782, declining to 2,431 for the 2009–2010 season (Table 1). The percentage of licensed furtakers returning report cards dropped from 92% for the 2007–2008 seasons to 87% for the 2008-9 season (Table 2). River otter and bobcat are both specifically listed by CITES (Council on International Trade in Endangered Species) and CITES require each animal be tagged and number harvested recorded. The number of bobcat record cards purchased increased for both eastern and western Oregon in 2008–2009 and declined in both areas for 2009–2010 (Table 3). For river otter, (Table 3) the number of record cards purchased increased slightly to ~500 in 2008–2009 and 2009–2010. Bobcat Guidelines for Bobcat Season Structure (emphasis on eastern Oregon) Since the July 2008 Commission meeting the Department has been working with furtakers, primarily the Oregon Trappers Association (OTA) and Oregon United Sporting Dog Association (OUSDA) to develop guidelines for determining the structure of the bobcat season in Oregon. Avoiding excessive take that would cause a long term impact to the bobcat population is ultimately what both furtakers and the Department are striving for. Ideas include, 1) setting an annual take/harvest objective, and 2) adjusting season length. Following is a discussion of these two concepts. Note: unless noted otherwise the following discussion is directed at eastern Oregon since there is no bag limit for bobcats in western Oregon. 1) Annual Harvest Objective (Total Take) Concept:
Set a target number for total bobcat catch/year in any two year period. Adjust the season length up or down biennially if + or – 20% of the average is harvested.
b. Use the Male/Female ratio as a secondary consideration for determining if the bobcat population is in balance.
4
c. Review the harvest target number every five years based on all available data and information. Re-adjust total target harvest number if necessary.
Setting an annual harvest objective based on total take as proposed by furtakers has merit. Total bobcat take is heavily influenced by a number of factors that are difficult to predict or control such as weather conditions during the season, pelt price, and total effort. These factors may affect harvest independent of the bobcat population. For example, when pelt prices drop, harvest is likely to decline regardless of whether the bobcat population increases or decreases. It is therefore possible that relying solely on total take could lead to frequent unwarranted changes to bobcat seasons. Frequent changes to bobcat regulations and seasons would complicate the bobcat management process, potentially confuse furtakers, and make it more difficult to evaluate the results of regulation changes. The Department will use total take as one of the considerations for determining if bobcat bag limit changes are necessary during the two-year regulations cycle. Initially the Department is considering a Harvest Objective of 1,250 bobcats per season in eastern Oregon. The average take per season from 1989-90 to 2008-09 was ~1,200 bobcats per year. Harvest adjustments could occur if the take is more than 1,500 (+20%) for two years or less than 1,000 (-20%) for two years and the change is consistent with other criteria discussed below. The Department and furtakers are also in agreement that excessive take of females can be detrimental to bobcat populations. Due to differences in susceptibility to harvest between males and females, harvest tends to be biased toward males. Because of this bias it should be remembered that male/female ratio in the harvest is not necessarily the same as the male/female ratio in the population. As a criteria Utah uses 45 % females in the harvest as a consideration for harvest reduction; Montana uses 40%. The Department proposes to use 45% females in the harvest as a secondary consideration for harvest adjustments. Generally a low proportion of young of the year (YOY) in the take may indicate low production, and a high proportion of YOY in the take cannot occur without good production in the population. However, when the proportion of YOY in the harvest is >30%, or the proportion of juveniles (YOY plus yearlings) is >50% (Utah uses 49% as a mean) the Department has concerns that the potential gain from the high reproduction is being removed from the population by high harvest pressure; particularly if the proportion of females in the harvest is also high (>45%)and the average age of the harvest is low (<2.5, a criteria used by Montana) indicating few animals are surviving to older age classes. Because weather, pelt prices and other factors influence harvest the Department will continue to annually monitor Catch Per Unit Effort (CPUE) and biological parameters of the population including, percent of the total take that are females, average age of the harvest, % kittens and % juveniles in the harvest. The harvest objective will be reviewed after 5 seasons. The harvest objective could be reduced if any two population parameters show a negative trend compared to the long term mean. If harvest is below the annual harvest objective and population parameters are stable or show positive trends increasing the harvest objective will be considered.
5
This type of harvest strategy provides triggers to prevent long term over harvest, and applies adaptive management that will hopefully provide stability to season structure and harvest. 2) Season Length: Concept:
Manage bobcat harvest by adjusting season length. There are a number of factors to consider related to using season length rather than bag limit to manage total harvest.
Harvest data from Oregon indicates that with the current season length typically ~15% (12%-21%) of the bobcats harvested are taken during the last three weeks of the season. A three week reduction in season length as proposed by some furtakers would not be likely to achieve the desired effect of significantly reducing total bobcat harvest.
Bobcat populations and associated management are different in eastern and western Oregon. There is no indication that total take in western Oregon warrants a season change. Shortening the season statewide would unnecessarily restrict furtakers in western Oregon.
Shortening the season in only eastern Oregon, when data indicates the need, but not western Oregon would complicate law enforcement relative to bobcats.
Currently all bobcat seasons (trapping, hunting, and pursuit) have the same opening and closing dates. Removing the last three weeks of the bobcat season would also reduce opportunities for individuals to hunt or pursue bobcats without taking them during the pursuit season. The alternative of different dates would complicate seasons and enforcement.
There is a long history of bag limits in eastern Oregon and furtakers are familiar with the strategy.
Using bag limits allows for longer seasons and provides more flexibility for furtakers to go when and where time and weather conditions allow.
Many trappers would compensate for shorter seasons by starting trapping earlier and/or setting more traps.
Reducing the late portion of the season eliminates the opportunity for furtakers to go late to avoid conflicts with bird hunters (chukar seasons ends Jan. 31) and others more active during the early season.
For the reasons outlined above, at this time the Department is not proposing to manage bobcat harvest based on season length. Data and Discussion for 2010-2011 and 2011-2012 Bobcat Seasons In winter 2006–2007, furtakers harvested 4,500 bobcats, the highest total bobcat take since 1989. In winter 2007–2008 1,187 furtakers harvested 3,144 bobcats, the decline continued with 2,335
6
reported taken in 2008-2009 (Table 4). The decline in take is consistent with reduced average pelt prices which peaked in 2007–2008 at $265 representing the highest average price recorded in Oregon (Table 5). Average prices were $134 in 2008-2009 and $154 for the 2009-2010 season. The price decrease can be attributed to reduced demand from foreign markets. Approximately 60% (1,366) of the total take was from eastern Oregon for 2008–2009. Oregon's bobcat populations are monitored using two primary methods: catch per unit effort (CPUE) and the distribution of sexes and ages within the harvest. CPUE measures the harvest per unit of time, usually 100 hunt days or 100 trap nights, and allows biologists to infer potential impacts of harvest levels. Decreased values of CPUE indicate greater effort (trap nights or days hunted) was required to harvest individual animals. Population size, trapper/hunter experience, and weather conditions can affect CPUE. Monitoring changes in the distribution of sex and ages of harvest animals can be used to infer relative changes in the population. The Department requires furtakers to turn in lower jaws from all harvested bobcat, along with information on location, date, and sex of each bobcat harvested. A sample of teeth from lower jaws is submitted annually for age determination. Ages from the sample are then used for population monitoring using life tables. For bobcat trappers, CPUE has generally declined since 1998 in eastern Oregon and since 2000 in western Oregon (Table 6) suggesting increasing difficulty trapping bobcats. CPUE for eastern Oregon bobcat trappers and hunters for the 2008-2009 season was the lowest since1990 (Table 6). The sex composition of the harvest remained relatively stable at 46% male/ 54% female for eastern Oregon and 44% male/ 56% female for western Oregon (Table 7). The mean ages for bobcats taken in eastern Oregon increased to 3.2 and in western Oregon to 4.0 (Table 8). Currently, a person must choose to hunt/trap bobcats either in western Oregon with no limit on harvest during the season or in eastern Oregon with a five bobcat limit. Current seasons for both areas of the state open December 1 and close February 28. Total effort and total take of bobcats is related to average pelt price the previous year. With continued high prices for bobcat pelts (Table 5), expectations are that hunting and trapping effort for bobcats will remain high. Because of the declining trend in CPUE for eastern Oregon bobcats (Table 6), the declining trend in the percent of adults in the harvest in eastern Oregon (Table 7), the decline in average age of the harvest (Table 8), and expectations that effort and take would remain high due to high pelt prices, in 2008 the eastern Oregon bobcat limit was reduced from 7 to 5. Most data for the 2009-2010 season is not yet available; at this time staff proposes to maintain the eastern Oregon bag limit at 5 for the 2010-2011 and 201-2012 seasons.
Staff Recommendations for Bobcat Western Oregon: December 1, 2010 – February 28, 2011 and
December 1, 2011– February 29, 2012 Eastern Oregon: December 1, 2010 – February 28, 2011 and
December 1, 2011– February 29, 2012
7
Bag Limit: Eastern Oregon: Five per Season Bag Limit: Western Oregon: No Limit Maintain current requirement for all bobcat jaws to be collected.
Gray Fox Combined total gray fox take increased to 562 during 2008–2009. The increase was in the trapped segment of the harvest, hunting take was stable (Table 10). CPUE for gray fox increased for trappers but declined for hunters during the 2008–2009 season. Average pelt prices for gray fox decreased from $36.00 during the 2007–2008 season to ~ $18.00 (Table 5).
Staff Recommendations for Gray Fox Season: November 15, 2010 - February 28, 2011 and
November 15, 2011 - February 29, 2012 Entire state
Red Fox Combined total red fox take increased slightly to 126 during the 2008–2009 season (Table 10). CPUE increased for trappers and hunters. Average pelt prices for red fox remain stable at ~$20.00 (Table 5).
Staff Recommendations for Red Fox Season open year round in Umatilla, Malheur, Harney, Baker, Morrow, Gilliam, Umatilla, Wallowa, Wheeler, and Union counties. Season October 15, 2010 – January 15, 2011 and October 15, 2011 – January 15, 2012 in
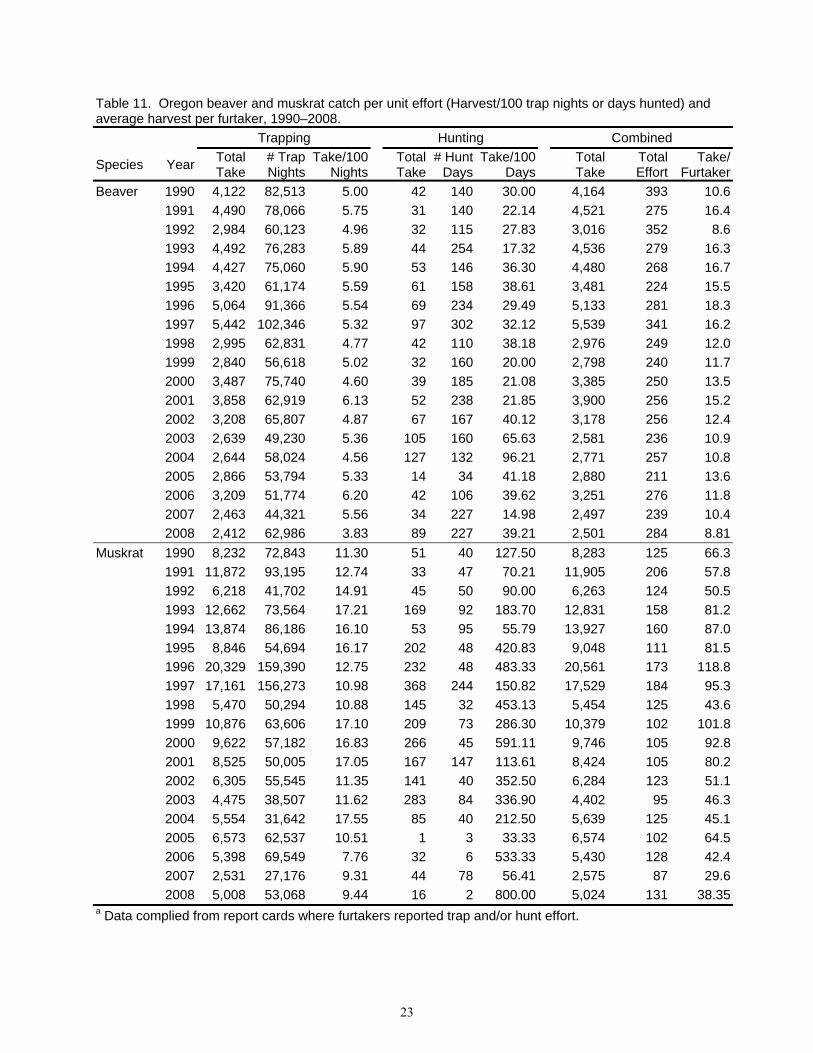
remainder of the State. Beaver Beaver harvest was stable at ~2,500 (Table 11). Average beaver pelt prices were down slightly and varied from $17.00 –$19.00 (Table 5). Most areas with good quality beaver habitat currently support beaver populations. Many beaver are harvested in response to damage complaints. The department proposes to open beaver trapping in Umatilla County. The closure has been in place since 1973, beaver are now found throughout the county in appropriate habitat. The department sees no biological reason to continue the beaver season closure in Umatilla County and in discussions with the USFS no information was provided to support maintaining the closure.
Staff Recommendations for Beaver Season: November 15, 2010 – March 15, 2011 and
November 15, 2011 – March 15, 2012 Open Area: Entire state with closures as specified in synopsis.
8
Muskrat Harvest essentially doubled to ~5,000 and CPUE increase slightly for the 2008-2009 season (Table 11). Increased interest was likely influenced by the average pelt price increasing to $6.00 from $3.20 (Table 5). Staff proposes no changes to muskrat regulations.
Staff Recommendation for Muskrat Season: November 15, 2010 – March 31, 2011 and
November 15, 2011 – March 31, 2012 Open Area: Entire state.
River Otter In winter 2008–2009, Oregon furtakers harvested 302 river otter compared to 208 during 2007–2008 although CPUE declined (Table 12). Statewide, average river otter pelt prices declined slightly to $51.00 and $49.00 for 2008–2009 and 2009–2010, respectively (Table 5). The Department is proposing to open otter trapping in Grant County. The closure has been in place since 1983, and it occurred simultaneously with the closure of some areas to beaver trapping. River otter are now found throughout the county in appropriate habitat. The Department sees no biological reason to continue the otter season closure in Grant County. The change would create consistency with beaver trapping occurring in the area since otter trapping would continue to be closed in areas closed to beaver trapping.
Staff Recommendation for River Otter Season: November 15, 2010 – March 15, 2011 and
November 15, 2011 – March 15, 2012 Open Area: Entire State, except for all areas closed to beaver trapping.
Marten Interest in marten trapping continues to be low with 13 furtakers reporting trapping effort during the 2008–2009 season. Take was up from 100 marten in 2007–2008 to 127 during the 2008-2009 season (Table 13). Seventy-five percent of the harvest and 89% of the effort was in eastern Oregon. Average pelt price decreased from $31.00 in 2008-2009 to $22.00 in 2009-2010 (Table 5). Staff proposes no changes to marten regulations.
Staff Recommendation for Marten Season: November 1, 2010 – January 31, 2011 and
November 1, 2011 – January 31, 2012 Open Area: Entire state.
Mink
9
Total mink take increased from 239 in 2007–2008 to 263 in 2008-2009 (Table 14). Average mink pelt prices dropped to ~$10.00 (Table 5). Staff proposes no changes to mink regulations.
Staff Recommendation for Mink Season: November 15, 2010 – March 31, 2011 and
November 15, 2011 – March 31, 2012 Open Area: Entire state.
Raccoon Harvest was stable for 2008–2009 at ~2,400 (Table 14). Average pelt price for raccoons dropped from $16.00 in 2007–2008 to $8.00-$10.00 (Table 5). District biologists continue to report high numbers of raccoon damage complaints registered by landowners. Staff proposes no changes to raccoon regulations.
Staff Recommendation for Raccoon Season: November 15, 2010 – March 15, 2011 and
November 15, 2011 – March 15, 2012 Open Area: Entire state.
Protected Species No changes are proposed for protected species. Seasons would remain closed yearlong for fisher, ringtail cat, wolverine, kit fox, and sea otter.
Staff Recommendation for Protected Species Season: Closed Season entire year
Unprotected Species Many furtakers continue to take unprotected species (Table 4). Total harvest is generally considered minimal for unprotected species and is not at levels likely to be detrimental to populations. Additionally, current season structure provides flexibility for landowners when addressing damage situations. No changes are proposed at this time for badger, coyote, nutria, opossum, porcupine, spotted and striped skunks, and weasels.
Staff Recommendation for Unprotected Species Season: Open Season Entire Year Open Area: Entire state.
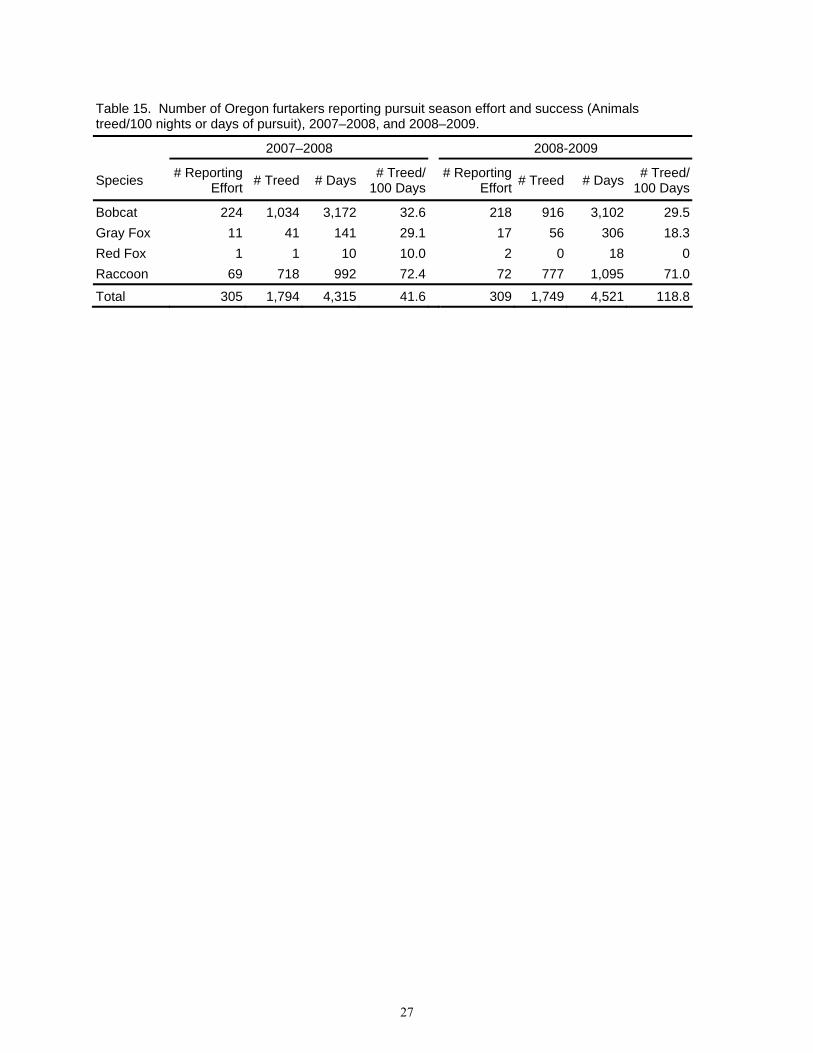
Pursuit Seasons Pursuit seasons allow individuals with a Furtaker’s License or Hunting License for Furbearers to pursue bobcat, raccoon, red fox, and gray fox with dogs. No animals may be harvested outside defined take seasons. Pursuit seasons end the same day as the take season. During 2008–2009,
10
pursuit effort was very similar to the previous year, 309 participants reported 4,521 days of pursuit effort and treed 1,749 animals, down ~200 from 2007-2008 (Table 15). The bulk of the pursuit effort was for bobcat but the CPUE was highest for individuals pursuing raccoon. No changes to pursuit seasons are proposed at this time. The Department is planning to propose revisions to rules related to dogs in the field late summer 2010. After the new “Dog Rules” are adopted the structure of pursuit seasons will be reviewed.
Staff Recommendation for Pursuit Seasons Bobcat: September 1, 2010 – February 28, 2011 and
September 1, 2011 – February 29, 2012 Red and Gray Fox: September 1, 2010 – February 28, 2011 and
September 1, 2011 – February 29, 2012 Raccoon: September 1, 2010 – March 15, 2011 and
September 1, 2011 – March 15, 2012 Special Area Trapping and Hunting Regulations No changes are proposed.
11
Supporting Data Summaries
Table 1. Trend in furtaker license sales, 1986–2009 .....................................................................13
Table 2. Trend in license sales and reporting of effort for furbearers in Oregon, 2003–2008. ....14
Table 3. Number of individuals purchasing tag or record cards and number of tag or record cards purchased for river otter, western bobcat, and eastern bobcat in Oregon, 1986–2009. .......15
Table 4. Number of successful furtakers and number of animals taken by species in Oregon, 1998–2008......................................................................................................................................16
Table 5. Average pelt prices (Rounded to nearest $1.00) for selected furbearers from Oregon fur sales, 1954–2009............................................................................................................................17
Table 6. Oregon bobcat catch per unit effort (Harvest/100 trap nights or days hunted) and average harvest per furtaker in Oregon. 1990–2008......................................................................18
Table 7. Proportion of total bobcat taken by sex and proportion adult, 1983–2008. ...................19
Table 8. Mean age of bobcat taken in Oregon, 1983–2008..........................................................20
Table 9. Number of furtakers taking specific numbers of bobcats in Oregon, 2000–2008..........21
Table 10. Oregon gray and red fox catch per unit effort (Harvest/100 trap nights or days hunted) and average harvest per furtaker 1990–2008.................................................................................22
Table 11. Oregon beaver and muskrat catch per unit effort (Harvest/100 trap nights or days hunted) and average harvest per furtaker 1990–2008....................................................................23
Table 12. Oregon river otter catch per unit effort (Harvest/100 trap nights or days hunted) and average harvest per furtaker 1990–2008........................................................................................24
Table 13. Oregon marten catch per unit effort (Harvest/100 trap nights or days hunted) and average harvest per furtaker 1990–2008........................................................................................25
Table 14. Oregon mink and raccoon catch per unit effort (Harvest/100 trap nights or days hunted) and average harvest per furtaker 1990–2008....................................................................26
Table 15. Number of Oregon furtakers reporting pursuit season effort and success (Animals treed/100 nights or days of pursuit) in 2007–2008 and 2008–2009. .............................................27
12
13
Table 1. Trend in furtaker license sales, 1986–2009. # of Licenses Sold for
Year FurtakerFurtaker-
Hunter Total1986 2,052 865 2,917 1987 2,126 965 3,091 1988 1,641 935 2,576 1989 1,218 862 2,080 1990 908 766 1,674 1991 856 793 1,649 1992 906 871 1,777 1993 775 836 1,611 1994 863 930 1,793 1995 759 872 1,631 1996 826 881 1,707 1997 937 844 1,781 1998 847 799 1,646 1999 807 833 1,640 2000 767 813 1,580 2001 809 806 1,615 2002 891 924 1,815 2003 1,030 1,072 2,102 2004 1,140 1,098 2,238 2005 1,104 1,150 2,254 2006 1,247 1,309 2,556 2007 1,283 1,333 2,616 2008 1,377 1,405 2,782 2009 1,143 1,288 2,431
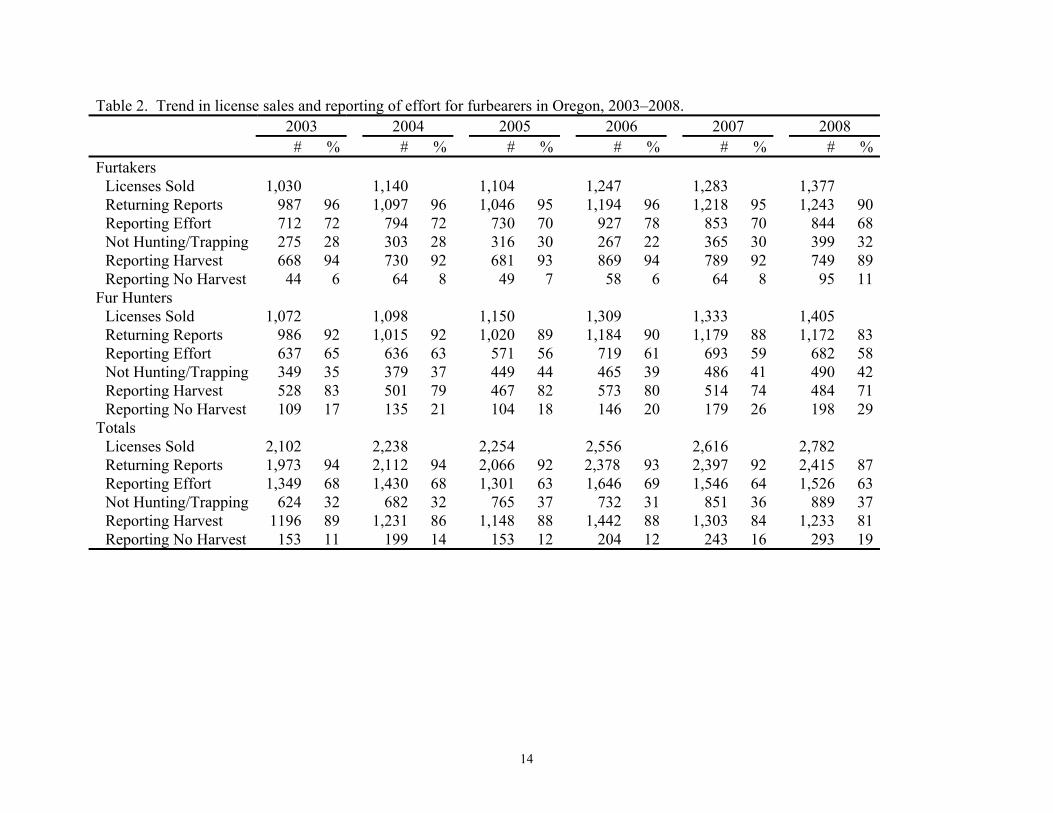
Table 2. Trend in license sales and reporting of effort for furbearers in Oregon, 2003–2008. 2003 2004 2005 2006 2007 2008 # % % % % % %# # # # #Furtakers
Licenses Sold 1,030 1,140 1,104 1,247 1,283 1,377Returning Reports 987 96 1,097 96 1,046 95 1,194 96 1,218 95 1,243 90Reporting Effort 712 72 794 72 730 70 927 78 853 70 844 68Not Hunting/Trapping 275 28 303 28 316 30 267 22 365 30 399 32Reporting Harvest 668 94 730 92 681 93 869 94 789 92 749 89Reporting No Harvest 44 6 64 8 49 7 58 6 64 8 95 11
Fur Hunters Licenses Sold 1,072 1,098 1,150 1,309 1,333 1,405Returning Reports 986 92 1,015 92 1,020 89 1,184 90 1,179 88 1,172 83Reporting Effort 637 65 636 63 571 56 719 61 693 59 682 58Not Hunting/Trapping 349 35 379 37 449 44 465 39 486 41 490 42Reporting Harvest 528 83 501 79 467 82 573 80 514 74 484 71Reporting No Harvest 109 17 135 21 104 18 146 20 179 26 198 29
Totals Licenses Sold 2,102 2,238 2,254 2,556 2,616 2,782Returning Reports 1,973 94 2,112 94 2,066 92 2,378 93 2,397 92 2,415 87Reporting Effort 1,349 68 1,430 68 1,301 63 1,646 69 1,546 64 1,526 63Not Hunting/Trapping 624 32 682 32 765 37 732 31 851 36 889 37Reporting Harvest 1196 89 1,231 86 1,148 88 1,442 88 1,303 84 1,233 81Reporting No Harvest 153 11 199 14 153 12 204 12 243 16 293 19
14
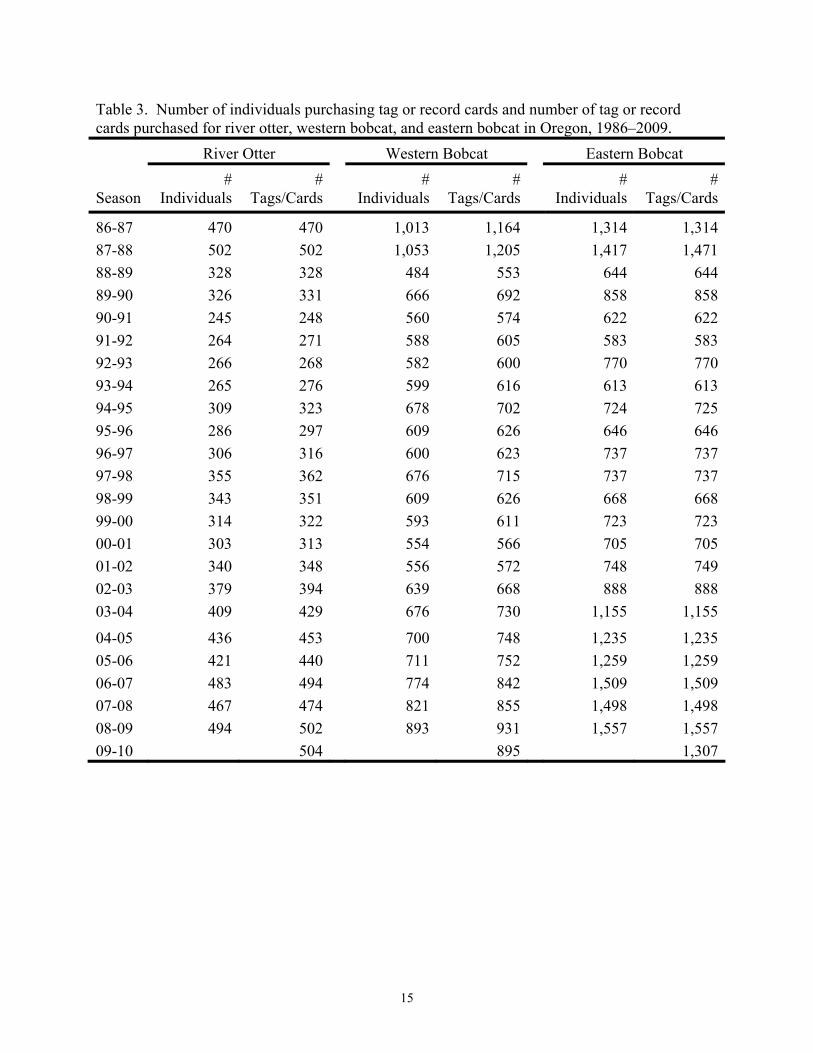
Table 3. Number of individuals purchasing tag or record cards and number of tag or record cards purchased for river otter, western bobcat, and eastern bobcat in Oregon, 1986–2009.
River Otter Western Bobcat Eastern Bobcat
Season #
Individuals #
Tags/Cards #
Individuals#
Tags/Cards #
Individuals #
Tags/Cards
86-87 470 470 1,013 1,164 1,314 1,314
87-88 502 502 1,053 1,205 1,417 1,471
88-89 328 328 484 553 644 644
89-90 326 331 666 692 858 858
90-91 245 248 560 574 622 622
91-92 264 271 588 605 583 583
92-93 266 268 582 600 770 770
93-94 265 276 599 616 613 613
94-95 309 323 678 702 724 725
95-96 286 297 609 626 646 646
96-97 306 316 600 623 737 737
97-98 355 362 676 715 737 737
98-99 343 351 609 626 668 668
99-00 314 322 593 611 723 723
00-01 303 313 554 566 705 705
01-02 340 348 556 572 748 749
02-03 379 394 639 668 888 888
03-04 409 429 676 730 1,155 1,155
04-05 436 453 700 748 1,235 1,235
05-06 421 440 711 752 1,259 1,259
06-07 483 494 774 842 1,509 1,509
07-08 467 474 821 855 1,498 1,498
08-09 494 502 893 931 1,557 1,557
09-10 504 895 1,307
15
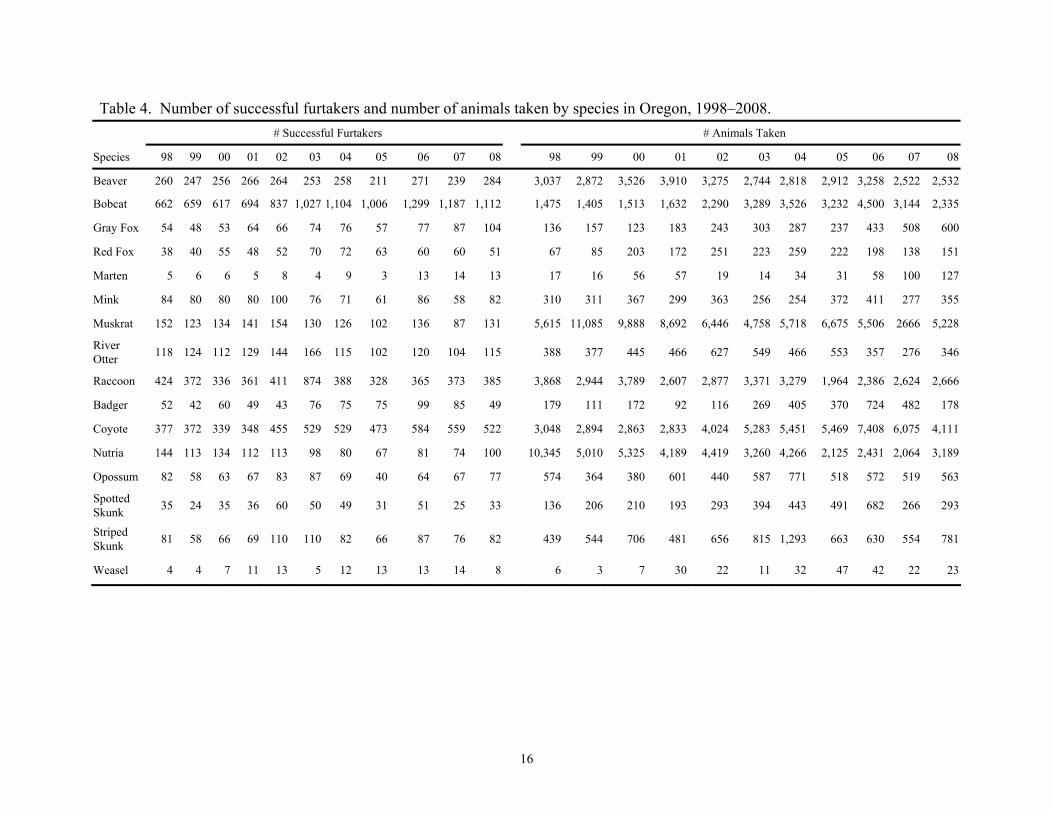
Table 4. Number of successful furtakers and number of animals taken by species in Oregon, 1998–2008.
# Successful Furtakers # Animals Taken
Species 98 99 00 01 02 03 04 05 06 07 08 98 99 00 01 02 03 04 05 06 07 08
Beaver 260 247 256 266 264 253 258 211 271 239 284 3,037 2,872 3,526 3,910 3,275 2,744 2,818 2,912 3,258 2,522 2,532
Bobcat 662 659 617 694 837 1,027 1,104 1,006 1,299 1,187 1,112 1,475 1,405 1,513 1,632 2,290 3,289 3,526 3,232 4,500 3,144 2,335
Gray Fox 54 48 53 64 66 74 76 57 77 87 104 136 157 123 183 243 303 287 237 433 508 600
Red Fox 38 40 55 48 52 70 72 63 60 60 51 67 85 203 172 251 223 259 222 198 138 151
Marten 5 6 6 5 8 4 9 3 13 14 13 17 16 56 57 19 14 34 31 58 100 127
Mink 84 80 80 80 100 76 71 61 86 58 82 310 311 367 299 363 256 254 372 411 277 355
Muskrat 152 123 134 141 154 130 126 102 136 87 131 5,615 11,085 9,888 8,692 6,446 4,758 5,718 6,675 5,506 2666 5,228
River Otter
118 124 112 129 144 166 115 102 120 104 115 388 377 445 466 627 549 466 553 357 276 346
Raccoon 424 372 336 361 411 874 388 328 365 373 385 3,868 2,944 3,789 2,607 2,877 3,371 3,279 1,964 2,386 2,624 2,666
Badger 52 42 60 49 43 76 75 75 99 85 49 179 111 172 92 116 269 405 370 724 482 178
Coyote 377 372 339 348 455 529 529 473 584 559 522 3,048 2,894 2,863 2,833 4,024 5,283 5,451 5,469 7,408 6,075 4,111
Nutria 144 113 134 112 113 98 80 67 81 74 100 10,345 5,010 5,325 4,189 4,419 3,260 4,266 2,125 2,431 2,064 3,189
Opossum 82 58 63 67 83 87 69 40 64 67 77 574 364 380 601 440 587 771 518 572 519 563
Spotted Skunk
35 24 35 36 60 50 49 31 51 25 33 136 206 210 193 293 394 443 491 682 266 293
Striped Skunk
81 58 66 69 110 110 82 66 87 76 82 439 544 706 481 656 815 1,293 663 630 554 781
Weasel 4 4 7 11 13 5 12 13 13 14 8 6 3 7 30 22 11 32 47 42 22 23
16
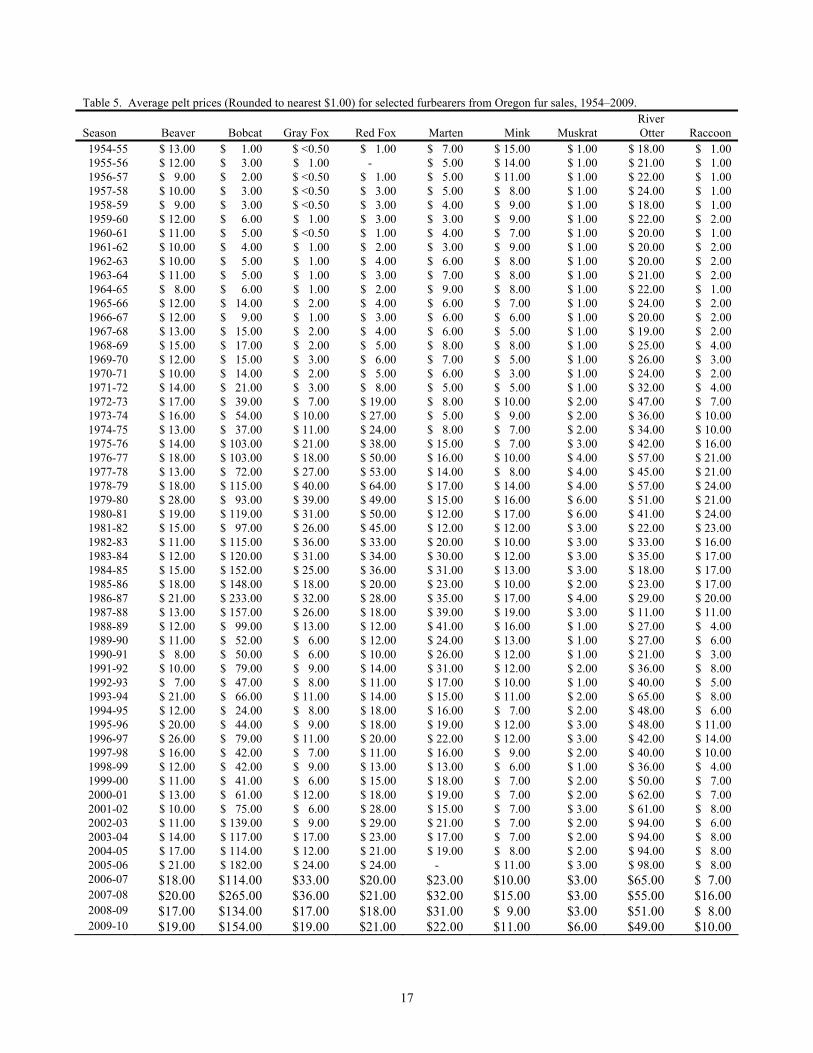
Table 5. Average pelt prices (Rounded to nearest $1.00) for selected furbearers from Oregon fur sales, 1954–2009.
Season Beaver Bobcat Gray Fox Red Fox Marten Mink Muskrat River Otter Raccoon
1954-55 $ 13.00 $ 1.00 $ <0.50 $ 1.00 $ 7.00 $ 15.00 $ 1.00 $ 18.00 $ 1.00 1955-56 $ 12.00 $ 3.00 $ 1.00 - $ 5.00 $ 14.00 $ 1.00 $ 21.00 $ 1.00 1956-57 $ 9.00 $ 2.00 $ <0.50 $ 1.00 $ 5.00 $ 11.00 $ 1.00 $ 22.00 $ 1.00 1957-58 $ 10.00 $ 3.00 $ <0.50 $ 3.00 $ 5.00 $ 8.00 $ 1.00 $ 24.00 $ 1.00 1958-59 $ 9.00 $ 3.00 $ <0.50 $ 3.00 $ 4.00 $ 9.00 $ 1.00 $ 18.00 $ 1.00 1959-60 $ 12.00 $ 6.00 $ 1.00 $ 3.00 $ 3.00 $ 9.00 $ 1.00 $ 22.00 $ 2.00 1960-61 $ 11.00 $ 5.00 $ <0.50 $ 1.00 $ 4.00 $ 7.00 $ 1.00 $ 20.00 $ 1.00 1961-62 $ 10.00 $ 4.00 $ 1.00 $ 2.00 $ 3.00 $ 9.00 $ 1.00 $ 20.00 $ 2.00 1962-63 $ 10.00 $ 5.00 $ 1.00 $ 4.00 $ 6.00 $ 8.00 $ 1.00 $ 20.00 $ 2.00 1963-64 $ 11.00 $ 5.00 $ 1.00 $ 3.00 $ 7.00 $ 8.00 $ 1.00 $ 21.00 $ 2.00 1964-65 $ 8.00 $ 6.00 $ 1.00 $ 2.00 $ 9.00 $ 8.00 $ 1.00 $ 22.00 $ 1.00 1965-66 $ 12.00 $ 14.00 $ 2.00 $ 4.00 $ 6.00 $ 7.00 $ 1.00 $ 24.00 $ 2.00 1966-67 $ 12.00 $ 9.00 $ 1.00 $ 3.00 $ 6.00 $ 6.00 $ 1.00 $ 20.00 $ 2.00 1967-68 $ 13.00 $ 15.00 $ 2.00 $ 4.00 $ 6.00 $ 5.00 $ 1.00 $ 19.00 $ 2.00 1968-69 $ 15.00 $ 17.00 $ 2.00 $ 5.00 $ 8.00 $ 8.00 $ 1.00 $ 25.00 $ 4.00 1969-70 $ 12.00 $ 15.00 $ 3.00 $ 6.00 $ 7.00 $ 5.00 $ 1.00 $ 26.00 $ 3.00 1970-71 $ 10.00 $ 14.00 $ 2.00 $ 5.00 $ 6.00 $ 3.00 $ 1.00 $ 24.00 $ 2.00 1971-72 $ 14.00 $ 21.00 $ 3.00 $ 8.00 $ 5.00 $ 5.00 $ 1.00 $ 32.00 $ 4.00 1972-73 $ 17.00 $ 39.00 $ 7.00 $ 19.00 $ 8.00 $ 10.00 $ 2.00 $ 47.00 $ 7.00 1973-74 $ 16.00 $ 54.00 $ 10.00 $ 27.00 $ 5.00 $ 9.00 $ 2.00 $ 36.00 $ 10.00 1974-75 $ 13.00 $ 37.00 $ 11.00 $ 24.00 $ 8.00 $ 7.00 $ 2.00 $ 34.00 $ 10.00 1975-76 $ 14.00 $ 103.00 $ 21.00 $ 38.00 $ 15.00 $ 7.00 $ 3.00 $ 42.00 $ 16.00 1976-77 $ 18.00 $ 103.00 $ 18.00 $ 50.00 $ 16.00 $ 10.00 $ 4.00 $ 57.00 $ 21.00 1977-78 $ 13.00 $ 72.00 $ 27.00 $ 53.00 $ 14.00 $ 8.00 $ 4.00 $ 45.00 $ 21.00 1978-79 $ 18.00 $ 115.00 $ 40.00 $ 64.00 $ 17.00 $ 14.00 $ 4.00 $ 57.00 $ 24.00 1979-80 $ 28.00 $ 93.00 $ 39.00 $ 49.00 $ 15.00 $ 16.00 $ 6.00 $ 51.00 $ 21.00 1980-81 $ 19.00 $ 119.00 $ 31.00 $ 50.00 $ 12.00 $ 17.00 $ 6.00 $ 41.00 $ 24.00 1981-82 $ 15.00 $ 97.00 $ 26.00 $ 45.00 $ 12.00 $ 12.00 $ 3.00 $ 22.00 $ 23.00 1982-83 $ 11.00 $ 115.00 $ 36.00 $ 33.00 $ 20.00 $ 10.00 $ 3.00 $ 33.00 $ 16.00 1983-84 $ 12.00 $ 120.00 $ 31.00 $ 34.00 $ 30.00 $ 12.00 $ 3.00 $ 35.00 $ 17.00 1984-85 $ 15.00 $ 152.00 $ 25.00 $ 36.00 $ 31.00 $ 13.00 $ 3.00 $ 18.00 $ 17.00 1985-86 $ 18.00 $ 148.00 $ 18.00 $ 20.00 $ 23.00 $ 10.00 $ 2.00 $ 23.00 $ 17.00 1986-87 $ 21.00 $ 233.00 $ 32.00 $ 28.00 $ 35.00 $ 17.00 $ 4.00 $ 29.00 $ 20.00 1987-88 $ 13.00 $ 157.00 $ 26.00 $ 18.00 $ 39.00 $ 19.00 $ 3.00 $ 11.00 $ 11.00 1988-89 $ 12.00 $ 99.00 $ 13.00 $ 12.00 $ 41.00 $ 16.00 $ 1.00 $ 27.00 $ 4.00 1989-90 $ 11.00 $ 52.00 $ 6.00 $ 12.00 $ 24.00 $ 13.00 $ 1.00 $ 27.00 $ 6.00 1990-91 $ 8.00 $ 50.00 $ 6.00 $ 10.00 $ 26.00 $ 12.00 $ 1.00 $ 21.00 $ 3.00 1991-92 $ 10.00 $ 79.00 $ 9.00 $ 14.00 $ 31.00 $ 12.00 $ 2.00 $ 36.00 $ 8.00 1992-93 $ 7.00 $ 47.00 $ 8.00 $ 11.00 $ 17.00 $ 10.00 $ 1.00 $ 40.00 $ 5.00 1993-94 $ 21.00 $ 66.00 $ 11.00 $ 14.00 $ 15.00 $ 11.00 $ 2.00 $ 65.00 $ 8.00 1994-95 $ 12.00 $ 24.00 $ 8.00 $ 18.00 $ 16.00 $ 7.00 $ 2.00 $ 48.00 $ 6.00 1995-96 $ 20.00 $ 44.00 $ 9.00 $ 18.00 $ 19.00 $ 12.00 $ 3.00 $ 48.00 $ 11.00 1996-97 $ 26.00 $ 79.00 $ 11.00 $ 20.00 $ 22.00 $ 12.00 $ 3.00 $ 42.00 $ 14.00 1997-98 $ 16.00 $ 42.00 $ 7.00 $ 11.00 $ 16.00 $ 9.00 $ 2.00 $ 40.00 $ 10.00 1998-99 $ 12.00 $ 42.00 $ 9.00 $ 13.00 $ 13.00 $ 6.00 $ 1.00 $ 36.00 $ 4.00 1999-00 $ 11.00 $ 41.00 $ 6.00 $ 15.00 $ 18.00 $ 7.00 $ 2.00 $ 50.00 $ 7.00 2000-01 $ 13.00 $ 61.00 $ 12.00 $ 18.00 $ 19.00 $ 7.00 $ 2.00 $ 62.00 $ 7.00 2001-02 $ 10.00 $ 75.00 $ 6.00 $ 28.00 $ 15.00 $ 7.00 $ 3.00 $ 61.00 $ 8.00 2002-03 $ 11.00 $ 139.00 $ 9.00 $ 29.00 $ 21.00 $ 7.00 $ 2.00 $ 94.00 $ 6.00 2003-04 $ 14.00 $ 117.00 $ 17.00 $ 23.00 $ 17.00 $ 7.00 $ 2.00 $ 94.00 $ 8.00 2004-05 $ 17.00 $ 114.00 $ 12.00 $ 21.00 $ 19.00 $ 8.00 $ 2.00 $ 94.00 $ 8.00 2005-06 $ 21.00 $ 182.00 $ 24.00 $ 24.00 - $ 11.00 $ 3.00 $ 98.00 $ 8.00 2006-07 $18.00 $114.00 $33.00 $20.00 $23.00 $10.00 $3.00 $65.00 $ 7.00 2007-08 $20.00 $265.00 $36.00 $21.00 $32.00 $15.00 $3.00 $55.00 $16.00 2008-09 $17.00 $134.00 $17.00 $18.00 $31.00 $ 9.00 $3.00 $51.00 $ 8.00 2009-10 $19.00 $154.00 $19.00 $21.00 $22.00 $11.00 $6.00 $49.00 $10.00
17
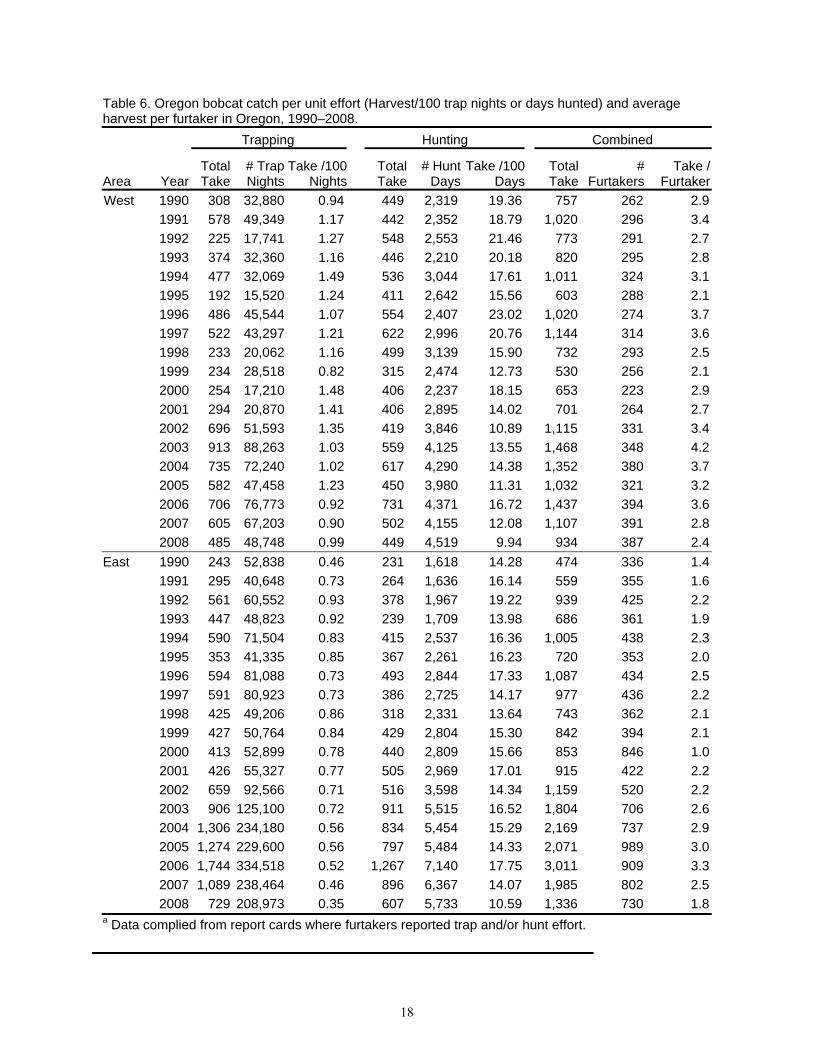
Table 6. Oregon bobcat catch per unit effort (Harvest/100 trap nights or days hunted) and average harvest per furtaker in Oregon, 1990–2008.
Trapping Hunting Combined
Area Year Total Take
# Trap Nights
Take /100Nights
Total Take
# Hunt Days
Take /100 Days
Total Take
# Furtakers
Take / Furtaker
West 1990 308 32,880 0.94 449 2,319 19.36 757 262 2.9
1991 578 49,349 1.17 442 2,352 18.79 1,020 296 3.4
1992 225 17,741 1.27 548 2,553 21.46 773 291 2.7
1993 374 32,360 1.16 446 2,210 20.18 820 295 2.8
1994 477 32,069 1.49 536 3,044 17.61 1,011 324 3.1
1995 192 15,520 1.24 411 2,642 15.56 603 288 2.1
1996 486 45,544 1.07 554 2,407 23.02 1,020 274 3.7
1997 522 43,297 1.21 622 2,996 20.76 1,144 314 3.6
1998 233 20,062 1.16 499 3,139 15.90 732 293 2.5
1999 234 28,518 0.82 315 2,474 12.73 530 256 2.1
2000 254 17,210 1.48 406 2,237 18.15 653 223 2.9
2001 294 20,870 1.41 406 2,895 14.02 701 264 2.7
2002 696 51,593 1.35 419 3,846 10.89 1,115 331 3.4
2003 913 88,263 1.03 559 4,125 13.55 1,468 348 4.2
2004 735 72,240 1.02 617 4,290 14.38 1,352 380 3.7
2005 582 47,458 1.23 450 3,980 11.31 1,032 321 3.2
2006 706 76,773 0.92 731 4,371 16.72 1,437 394 3.6
2007 605 67,203 0.90 502 4,155 12.08 1,107 391 2.8
2008 485 48,748 0.99 449 4,519 9.94 934 387 2.4
East 1990 243 52,838 0.46 231 1,618 14.28 474 336 1.4
1991 295 40,648 0.73 264 1,636 16.14 559 355 1.6
1992 561 60,552 0.93 378 1,967 19.22 939 425 2.2
1993 447 48,823 0.92 239 1,709 13.98 686 361 1.9
1994 590 71,504 0.83 415 2,537 16.36 1,005 438 2.3
1995 353 41,335 0.85 367 2,261 16.23 720 353 2.0
1996 594 81,088 0.73 493 2,844 17.33 1,087 434 2.5
1997 591 80,923 0.73 386 2,725 14.17 977 436 2.2
1998 425 49,206 0.86 318 2,331 13.64 743 362 2.1
1999 427 50,764 0.84 429 2,804 15.30 842 394 2.1
2000 413 52,899 0.78 440 2,809 15.66 853 846 1.0
2001 426 55,327 0.77 505 2,969 17.01 915 422 2.2
2002 659 92,566 0.71 516 3,598 14.34 1,159 520 2.2
2003 906 125,100 0.72 911 5,515 16.52 1,804 706 2.6
2004 1,306 234,180 0.56 834 5,454 15.29 2,169 737 2.9
2005 1,274 229,600 0.56 797 5,484 14.33 2,071 989 3.0
2006 1,744 334,518 0.52 1,267 7,140 17.75 3,011 909 3.3
2007 1,089 238,464 0.46 896 6,367 14.07 1,985 802 2.5
2008 729 208,973 0.35 607 5,733 10.59 1,336 730 1.8a Data complied from report cards where furtakers reported trap and/or hunt effort.
18
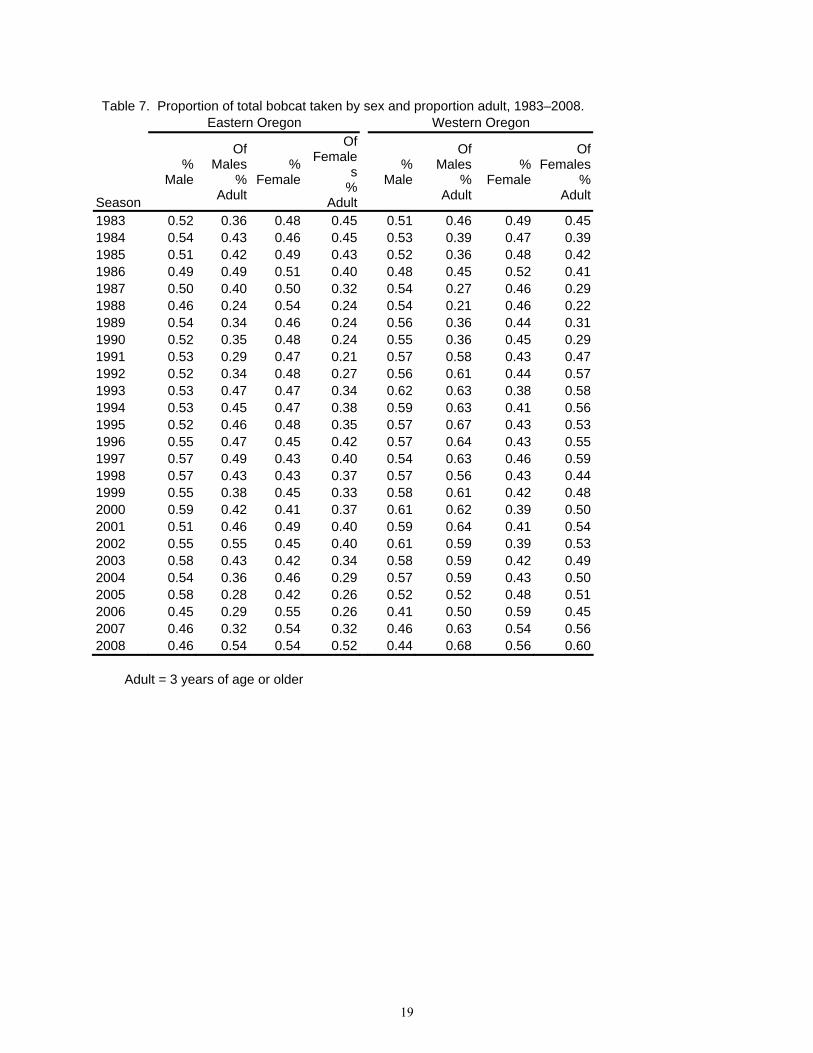
Table 7. Proportion of total bobcat taken by sex and proportion adult, 1983–2008. Eastern Oregon Western Oregon
Season
% Male
Of Males
% Adult
% Female
Of Female
s%
Adult
% Male
Of Males
% Adult
% Female
Of Females
% Adult
1983 0.52 0.36 0.48 0.45 0.51 0.46 0.49 0.45 1984 0.54 0.43 0.46 0.45 0.53 0.39 0.47 0.39 1985 0.51 0.42 0.49 0.43 0.52 0.36 0.48 0.42 1986 0.49 0.49 0.51 0.40 0.48 0.45 0.52 0.41 1987 0.50 0.40 0.50 0.32 0.54 0.27 0.46 0.29 1988 0.46 0.24 0.54 0.24 0.54 0.21 0.46 0.22 1989 0.54 0.34 0.46 0.24 0.56 0.36 0.44 0.31 1990 0.52 0.35 0.48 0.24 0.55 0.36 0.45 0.29 1991 0.53 0.29 0.47 0.21 0.57 0.58 0.43 0.47 1992 0.52 0.34 0.48 0.27 0.56 0.61 0.44 0.57 1993 0.53 0.47 0.47 0.34 0.62 0.63 0.38 0.58 1994 0.53 0.45 0.47 0.38 0.59 0.63 0.41 0.56 1995 0.52 0.46 0.48 0.35 0.57 0.67 0.43 0.53 1996 0.55 0.47 0.45 0.42 0.57 0.64 0.43 0.55 1997 0.57 0.49 0.43 0.40 0.54 0.63 0.46 0.59 1998 0.57 0.43 0.43 0.37 0.57 0.56 0.43 0.44 1999 0.55 0.38 0.45 0.33 0.58 0.61 0.42 0.48 2000 0.59 0.42 0.41 0.37 0.61 0.62 0.39 0.50 2001 0.51 0.46 0.49 0.40 0.59 0.64 0.41 0.54 2002 0.55 0.55 0.45 0.40 0.61 0.59 0.39 0.53 2003 0.58 0.43 0.42 0.34 0.58 0.59 0.42 0.49 2004 0.54 0.36 0.46 0.29 0.57 0.59 0.43 0.50 2005 0.58 0.28 0.42 0.26 0.52 0.52 0.48 0.51 2006 0.45 0.29 0.55 0.26 0.41 0.50 0.59 0.45 2007 0.46 0.32 0.54 0.32 0.46 0.63 0.54 0.56 2008 0.46 0.54 0.54 0.52 0.44 0.68 0.56 0.60
Adult = 3 years of age or older
19
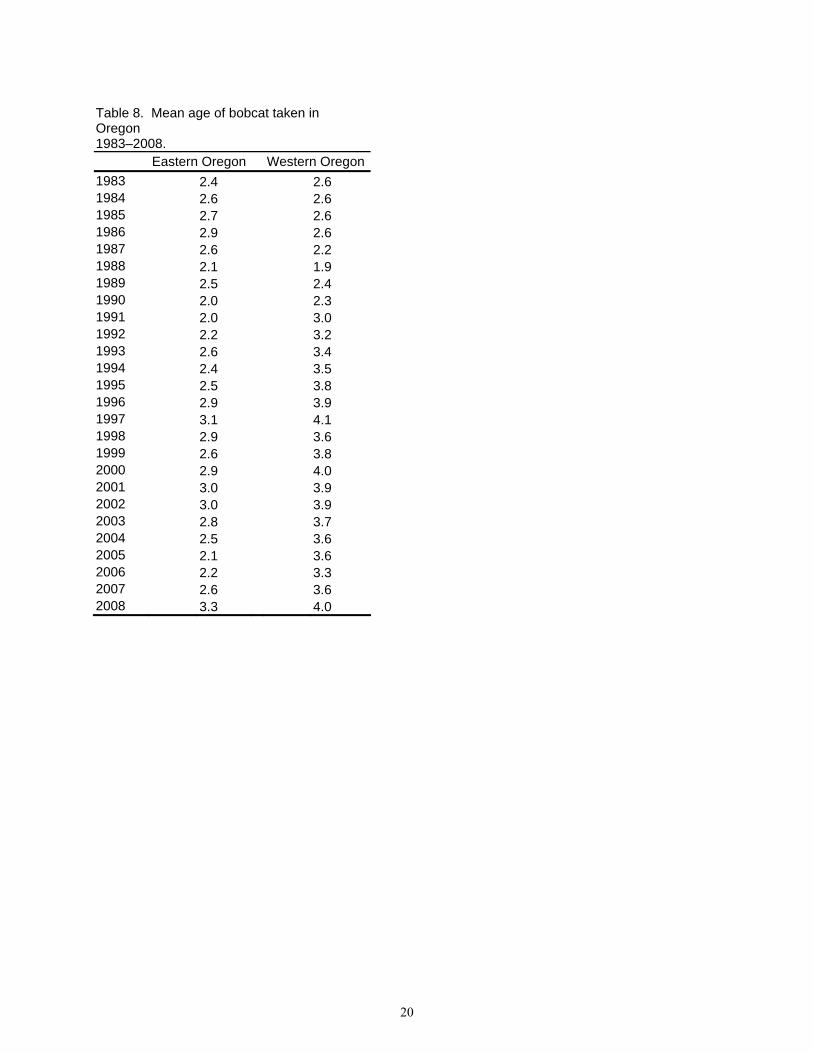
Table 8. Mean age of bobcat taken in Oregon 1983–2008. Eastern Oregon Western Oregon
1983 2.4 2.6 1984 2.6 2.6 1985 2.7 2.6 1986 2.9 2.6 1987 2.6 2.2 1988 2.1 1.9 1989 2.5 2.4 1990 2.0 2.3 1991 2.0 3.0 1992 2.2 3.2 1993 2.6 3.4 1994 2.4 3.5 1995 2.5 3.8 1996 2.9 3.9 1997 3.1 4.1 1998 2.9 3.6 1999 2.6 3.8 2000 2.9 4.0 2001 3.0 3.9 2002 3.0 3.9 2003 2.8 3.7 2004 2.5 3.6 2005 2.1 3.6 2006 2.2 3.3 2007 2.6 3.6 2008 3.3 4.0
20
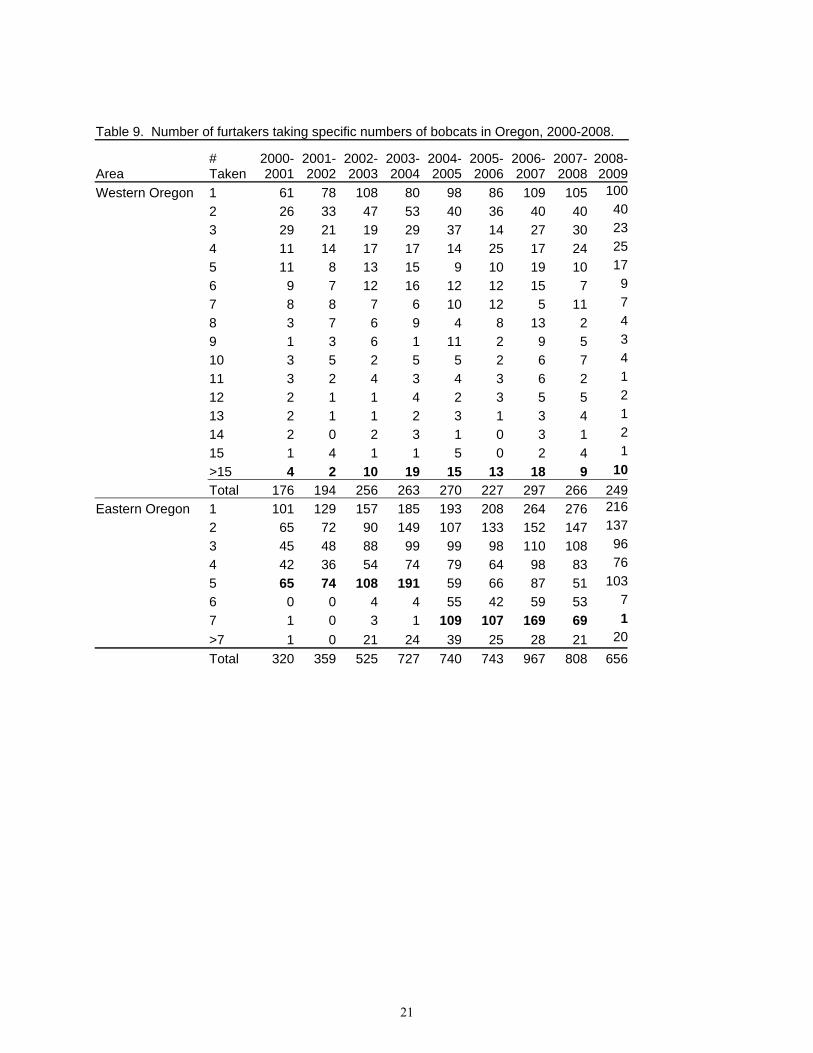
Table 9. Number of furtakers taking specific numbers of bobcats in Oregon, 2000-2008.
Area # Taken
2000-2001
2001-2002
2002-2003
2003-2004
2004-2005
2005-2006
2006-2007
2007-2008
2008-2009
Western Oregon 1 61 78 108 80 98 86 109 105 100
2 26 33 47 53 40 36 40 40 40
3 29 21 19 29 37 14 27 30 23
4 11 14 17 17 14 25 17 24 25
5 11 8 13 15 9 10 19 10 17
6 9 7 12 16 12 12 15 7 9
7 8 8 7 6 10 12 5 11 7
8 3 7 6 9 4 8 13 2 4
9 1 3 6 1 11 2 9 5 3
10 3 5 2 5 5 2 6 7 4
11 3 2 4 3 4 3 6 2 1
12 2 1 1 4 2 3 5 5 2
13 2 1 1 2 3 1 3 4 1
14 2 0 2 3 1 0 3 1 2
15 1 4 1 1 5 0 2 4 1
>15 4 2 10 19 15 13 18 9 10
Total 176 194 256 263 270 227 297 266 249
Eastern Oregon 1 101 129 157 185 193 208 264 276 216
2 65 72 90 149 107 133 152 147 137
3 45 48 88 99 99 98 110 108 96
4 42 36 54 74 79 64 98 83 76
5 65 74 108 191 59 66 87 51 103
6 0 0 4 4 55 42 59 53 7
7 1 0 3 1 109 107 169 69 1
>7 1 0 21 24 39 25 28 21 20
Total 320 359 525 727 740 743 967 808 656
21
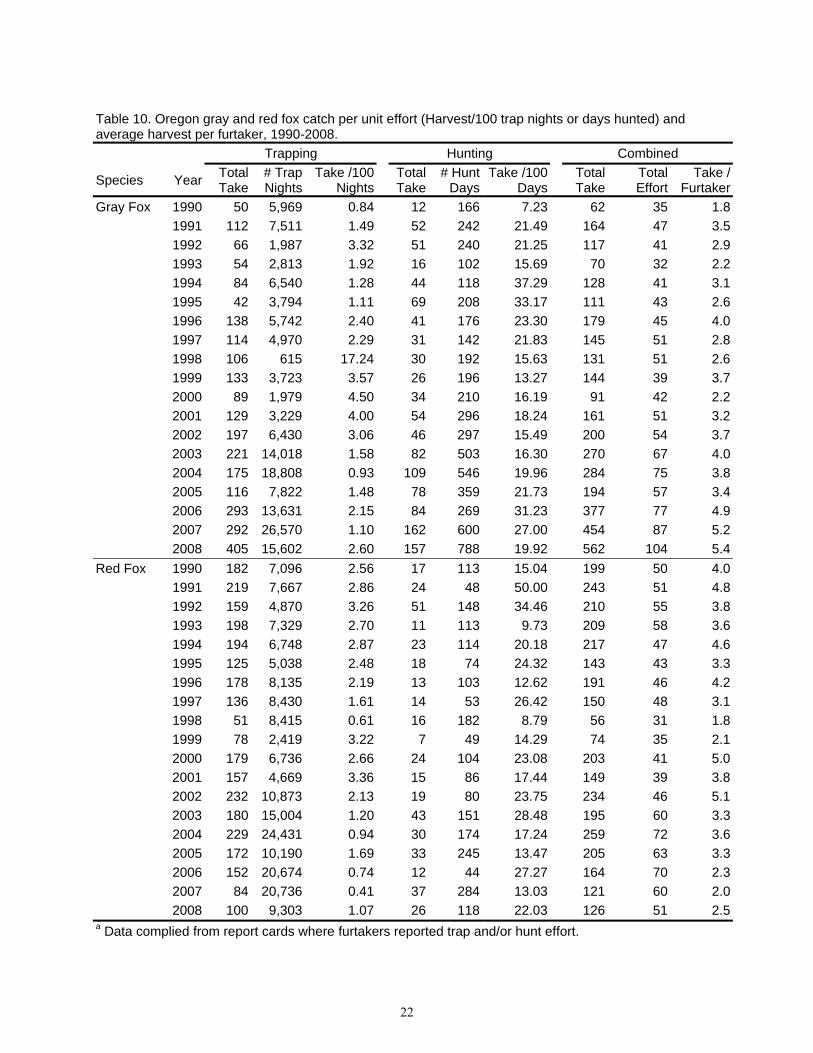
Table 10. Oregon gray and red fox catch per unit effort (Harvest/100 trap nights or days hunted) and average harvest per furtaker, 1990-2008.
Trapping Hunting Combined
Species Year Total Take
# Trap Nights
Take /100 Nights
Total Take
# Hunt Days
Take /100 Days
Total Take
Total Effort
Take / Furtaker
Gray Fox 1990 50 5,969 0.84 12 166 7.23 62 35 1.8
1991 112 7,511 1.49 52 242 21.49 164 47 3.5
1992 66 1,987 3.32 51 240 21.25 117 41 2.9
1993 54 2,813 1.92 16 102 15.69 70 32 2.2
1994 84 6,540 1.28 44 118 37.29 128 41 3.1
1995 42 3,794 1.11 69 208 33.17 111 43 2.6
1996 138 5,742 2.40 41 176 23.30 179 45 4.0
1997 114 4,970 2.29 31 142 21.83 145 51 2.8
1998 106 615 17.24 30 192 15.63 131 51 2.6
1999 133 3,723 3.57 26 196 13.27 144 39 3.7
2000 89 1,979 4.50 34 210 16.19 91 42 2.2
2001 129 3,229 4.00 54 296 18.24 161 51 3.2
2002 197 6,430 3.06 46 297 15.49 200 54 3.7
2003 221 14,018 1.58 82 503 16.30 270 67 4.0
2004 175 18,808 0.93 109 546 19.96 284 75 3.8
2005 116 7,822 1.48 78 359 21.73 194 57 3.4
2006 293 13,631 2.15 84 269 31.23 377 77 4.9
2007 292 26,570 1.10 162 600 27.00 454 87 5.2
2008 405 15,602 2.60 157 788 19.92 562 104 5.4
Red Fox 1990 182 7,096 2.56 17 113 15.04 199 50 4.0
1991 219 7,667 2.86 24 48 50.00 243 51 4.8
1992 159 4,870 3.26 51 148 34.46 210 55 3.8
1993 198 7,329 2.70 11 113 9.73 209 58 3.6
1994 194 6,748 2.87 23 114 20.18 217 47 4.6
1995 125 5,038 2.48 18 74 24.32 143 43 3.3
1996 178 8,135 2.19 13 103 12.62 191 46 4.2
1997 136 8,430 1.61 14 53 26.42 150 48 3.1
1998 51 8,415 0.61 16 182 8.79 56 31 1.8
1999 78 2,419 3.22 7 49 14.29 74 35 2.1
2000 179 6,736 2.66 24 104 23.08 203 41 5.0
2001 157 4,669 3.36 15 86 17.44 149 39 3.8
2002 232 10,873 2.13 19 80 23.75 234 46 5.1
2003 180 15,004 1.20 43 151 28.48 195 60 3.3
2004 229 24,431 0.94 30 174 17.24 259 72 3.6
2005 172 10,190 1.69 33 245 13.47 205 63 3.3
2006 152 20,674 0.74 12 44 27.27 164 70 2.3
2007 84 20,736 0.41 37 284 13.03 121 60 2.0
2008 100 9,303 1.07 26 118 22.03 126 51 2.5a Data complied from report cards where furtakers reported trap and/or hunt effort.
22
23
Table 11. Oregon beaver and muskrat catch per unit effort (Harvest/100 trap nights or days hunted) and average harvest per furtaker, 1990–2008.
Trapping Hunting Combined
Species Year Total Take
# Trap Nights
Take/100 Nights
Total Take
# Hunt Days
Take/100 Days
Total Take
Total Effort
Take/ Furtaker
Beaver 1990 4,122 82,513 5.00 42 140 30.00 4,164 393 10.6
1991 4,490 78,066 5.75 31 140 22.14 4,521 275 16.4
1992 2,984 60,123 4.96 32 115 27.83 3,016 352 8.6
1993 4,492 76,283 5.89 44 254 17.32 4,536 279 16.3
1994 4,427 75,060 5.90 53 146 36.30 4,480 268 16.7
1995 3,420 61,174 5.59 61 158 38.61 3,481 224 15.5
1996 5,064 91,366 5.54 69 234 29.49 5,133 281 18.3
1997 5,442 102,346 5.32 97 302 32.12 5,539 341 16.2
1998 2,995 62,831 4.77 42 110 38.18 2,976 249 12.0
1999 2,840 56,618 5.02 32 160 20.00 2,798 240 11.7
2000 3,487 75,740 4.60 39 185 21.08 3,385 250 13.5
2001 3,858 62,919 6.13 52 238 21.85 3,900 256 15.2
2002 3,208 65,807 4.87 67 167 40.12 3,178 256 12.4
2003 2,639 49,230 5.36 105 160 65.63 2,581 236 10.9
2004 2,644 58,024 4.56 127 132 96.21 2,771 257 10.8
2005 2,866 53,794 5.33 14 34 41.18 2,880 211 13.6
2006 3,209 51,774 6.20 42 106 39.62 3,251 276 11.8
2007 2,463 44,321 5.56 34 227 14.98 2,497 239 10.4
2008 2,412 62,986 3.83 89 227 39.21 2,501 284 8.81
Muskrat 1990 8,232 72,843 11.30 51 40 127.50 8,283 125 66.3
1991 11,872 93,195 12.74 33 47 70.21 11,905 206 57.8
1992 6,218 41,702 14.91 45 50 90.00 6,263 124 50.5
1993 12,662 73,564 17.21 169 92 183.70 12,831 158 81.2
1994 13,874 86,186 16.10 53 95 55.79 13,927 160 87.0
1995 8,846 54,694 16.17 202 48 420.83 9,048 111 81.5
1996 20,329 159,390 12.75 232 48 483.33 20,561 173 118.8
1997 17,161 156,273 10.98 368 244 150.82 17,529 184 95.3
1998 5,470 50,294 10.88 145 32 453.13 5,454 125 43.6
1999 10,876 63,606 17.10 209 73 286.30 10,379 102 101.8
2000 9,622 57,182 16.83 266 45 591.11 9,746 105 92.8
2001 8,525 50,005 17.05 167 147 113.61 8,424 105 80.2
2002 6,305 55,545 11.35 141 40 352.50 6,284 123 51.1
2003 4,475 38,507 11.62 283 84 336.90 4,402 95 46.3
2004 5,554 31,642 17.55 85 40 212.50 5,639 125 45.1
2005 6,573 62,537 10.51 1 3 33.33 6,574 102 64.5
2006 5,398 69,549 7.76 32 6 533.33 5,430 128 42.4
2007 2,531 27,176 9.31 44 78 56.41 2,575 87 29.6
2008 5,008 53,068 9.44 16 2 800.00 5,024 131 38.35a Data complied from report cards where furtakers reported trap and/or hunt effort.
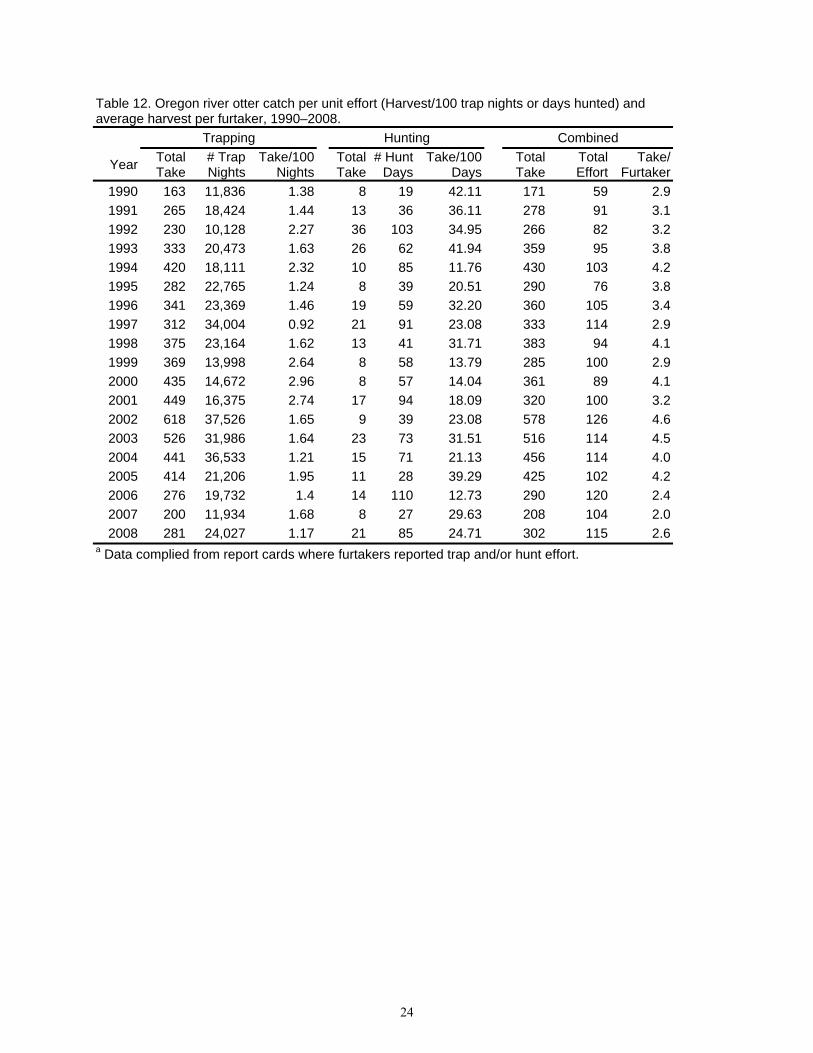
Table 12. Oregon river otter catch per unit effort (Harvest/100 trap nights or days hunted) and average harvest per furtaker, 1990–2008.
Trapping Hunting Combined
Year Total Take
# Trap Nights
Take/100 Nights
Total Take
# Hunt Days
Take/100 Days
Total Take
Total Effort
Take/ Furtaker
1990 163 11,836 1.38 8 19 42.11 171 59 2.9
1991 265 18,424 1.44 13 36 36.11 278 91 3.1
1992 230 10,128 2.27 36 103 34.95 266 82 3.2
1993 333 20,473 1.63 26 62 41.94 359 95 3.8
1994 420 18,111 2.32 10 85 11.76 430 103 4.2
1995 282 22,765 1.24 8 39 20.51 290 76 3.8
1996 341 23,369 1.46 19 59 32.20 360 105 3.4
1997 312 34,004 0.92 21 91 23.08 333 114 2.9
1998 375 23,164 1.62 13 41 31.71 383 94 4.1
1999 369 13,998 2.64 8 58 13.79 285 100 2.9
2000 435 14,672 2.96 8 57 14.04 361 89 4.1
2001 449 16,375 2.74 17 94 18.09 320 100 3.2
2002 618 37,526 1.65 9 39 23.08 578 126 4.6
2003 526 31,986 1.64 23 73 31.51 516 114 4.5
2004 441 36,533 1.21 15 71 21.13 456 114 4.0
2005 414 21,206 1.95 11 28 39.29 425 102 4.2
2006 276 19,732 1.4 14 110 12.73 290 120 2.4
2007 200 11,934 1.68 8 27 29.63 208 104 2.0
2008 281 24,027 1.17 21 85 24.71 302 115 2.6a Data complied from report cards where furtakers reported trap and/or hunt effort.
24
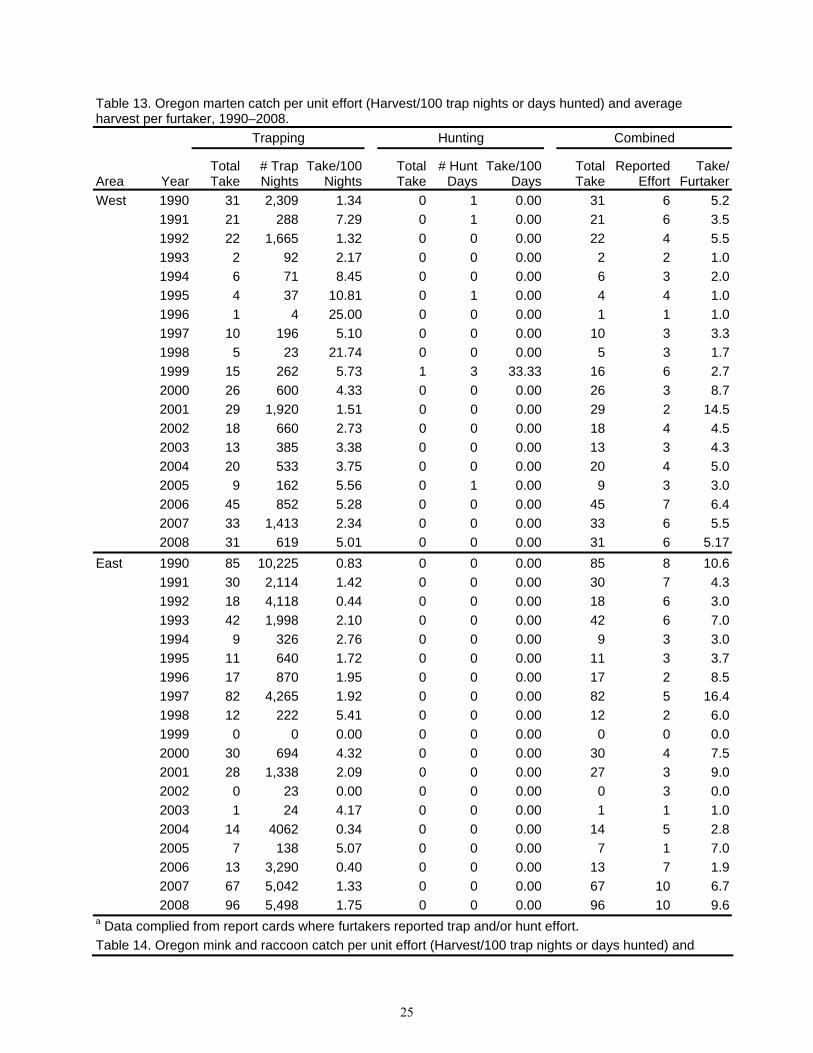
Table 13. Oregon marten catch per unit effort (Harvest/100 trap nights or days hunted) and average harvest per furtaker, 1990–2008.
Trapping Hunting Combined
Area Year Total Take
# Trap Nights
Take/100 Nights
Total Take
# Hunt Days
Take/100 Days
Total Take
Reported Effort
Take/ Furtaker
West 1990 31 2,309 1.34 0 1 0.00 31 6 5.2
1991 21 288 7.29 0 1 0.00 21 6 3.5
1992 22 1,665 1.32 0 0 0.00 22 4 5.5
1993 2 92 2.17 0 0 0.00 2 2 1.0
1994 6 71 8.45 0 0 0.00 6 3 2.0
1995 4 37 10.81 0 1 0.00 4 4 1.0
1996 1 4 25.00 0 0 0.00 1 1 1.0
1997 10 196 5.10 0 0 0.00 10 3 3.3
1998 5 23 21.74 0 0 0.00 5 3 1.7
1999 15 262 5.73 1 3 33.33 16 6 2.7
2000 26 600 4.33 0 0 0.00 26 3 8.7
2001 29 1,920 1.51 0 0 0.00 29 2 14.5
2002 18 660 2.73 0 0 0.00 18 4 4.5
2003 13 385 3.38 0 0 0.00 13 3 4.3
2004 20 533 3.75 0 0 0.00 20 4 5.0
2005 9 162 5.56 0 1 0.00 9 3 3.0
2006 45 852 5.28 0 0 0.00 45 7 6.4
2007 33 1,413 2.34 0 0 0.00 33 6 5.5
2008 31 619 5.01 0 0 0.00 31 6 5.17
East 1990 85 10,225 0.83 0 0 0.00 85 8 10.6
1991 30 2,114 1.42 0 0 0.00 30 7 4.3
1992 18 4,118 0.44 0 0 0.00 18 6 3.0
1993 42 1,998 2.10 0 0 0.00 42 6 7.0
1994 9 326 2.76 0 0 0.00 9 3 3.0
1995 11 640 1.72 0 0 0.00 11 3 3.7
1996 17 870 1.95 0 0 0.00 17 2 8.5
1997 82 4,265 1.92 0 0 0.00 82 5 16.4
1998 12 222 5.41 0 0 0.00 12 2 6.0
1999 0 0 0.00 0 0 0.00 0 0 0.0
2000 30 694 4.32 0 0 0.00 30 4 7.5
2001 28 1,338 2.09 0 0 0.00 27 3 9.0
2002 0 23 0.00 0 0 0.00 0 3 0.0
2003 1 24 4.17 0 0 0.00 1 1 1.0
2004 14 4062 0.34 0 0 0.00 14 5 2.8
2005 7 138 5.07 0 0 0.00 7 1 7.0
2006 13 3,290 0.40 0 0 0.00 13 7 1.9
2007 67 5,042 1.33 0 0 0.00 67 10 6.7
2008 96 5,498 1.75 0 0 0.00 96 10 9.6a Data complied from report cards where furtakers reported trap and/or hunt effort.
Table 14. Oregon mink and raccoon catch per unit effort (Harvest/100 trap nights or days hunted) and
25
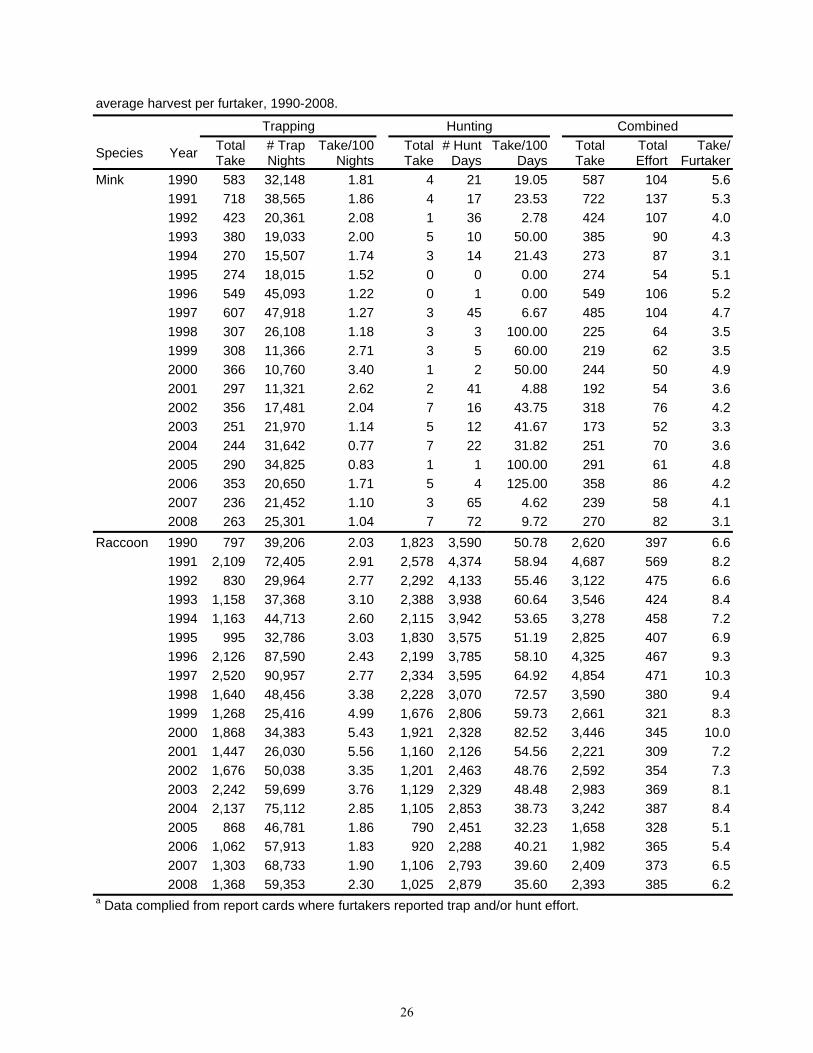
average harvest per furtaker, 1990-2008.
Trapping Hunting Combined
Species Year Total Take
# Trap Nights
Take/100 Nights
Total Take
# Hunt Days
Take/100 Days
Total Take
Total Effort
Take/ Furtaker
Mink 1990 583 32,148 1.81 4 21 19.05 587 104 5.6
1991 718 38,565 1.86 4 17 23.53 722 137 5.3
1992 423 20,361 2.08 1 36 2.78 424 107 4.0
1993 380 19,033 2.00 5 10 50.00 385 90 4.3
1994 270 15,507 1.74 3 14 21.43 273 87 3.1
1995 274 18,015 1.52 0 0 0.00 274 54 5.1
1996 549 45,093 1.22 0 1 0.00 549 106 5.2
1997 607 47,918 1.27 3 45 6.67 485 104 4.7
1998 307 26,108 1.18 3 3 100.00 225 64 3.5
1999 308 11,366 2.71 3 5 60.00 219 62 3.5
2000 366 10,760 3.40 1 2 50.00 244 50 4.9
2001 297 11,321 2.62 2 41 4.88 192 54 3.6
2002 356 17,481 2.04 7 16 43.75 318 76 4.2
2003 251 21,970 1.14 5 12 41.67 173 52 3.3
2004 244 31,642 0.77 7 22 31.82 251 70 3.6
2005 290 34,825 0.83 1 1 100.00 291 61 4.8
2006 353 20,650 1.71 5 4 125.00 358 86 4.2
2007 236 21,452 1.10 3 65 4.62 239 58 4.1
2008 263 25,301 1.04 7 72 9.72 270 82 3.1
Raccoon 1990 797 39,206 2.03 1,823 3,590 50.78 2,620 397 6.6
1991 2,109 72,405 2.91 2,578 4,374 58.94 4,687 569 8.2
1992 830 29,964 2.77 2,292 4,133 55.46 3,122 475 6.6
1993 1,158 37,368 3.10 2,388 3,938 60.64 3,546 424 8.4
1994 1,163 44,713 2.60 2,115 3,942 53.65 3,278 458 7.2
1995 995 32,786 3.03 1,830 3,575 51.19 2,825 407 6.9
1996 2,126 87,590 2.43 2,199 3,785 58.10 4,325 467 9.3
1997 2,520 90,957 2.77 2,334 3,595 64.92 4,854 471 10.3
1998 1,640 48,456 3.38 2,228 3,070 72.57 3,590 380 9.4
1999 1,268 25,416 4.99 1,676 2,806 59.73 2,661 321 8.3
2000 1,868 34,383 5.43 1,921 2,328 82.52 3,446 345 10.0
2001 1,447 26,030 5.56 1,160 2,126 54.56 2,221 309 7.2
2002 1,676 50,038 3.35 1,201 2,463 48.76 2,592 354 7.3
2003 2,242 59,699 3.76 1,129 2,329 48.48 2,983 369 8.1
2004 2,137 75,112 2.85 1,105 2,853 38.73 3,242 387 8.4
2005 868 46,781 1.86 790 2,451 32.23 1,658 328 5.1
2006 1,062 57,913 1.83 920 2,288 40.21 1,982 365 5.4
2007 1,303 68,733 1.90 1,106 2,793 39.60 2,409 373 6.5
2008 1,368 59,353 2.30 1,025 2,879 35.60 2,393 385 6.2a Data complied from report cards where furtakers reported trap and/or hunt effort.
26
27
Table 15. Number of Oregon furtakers reporting pursuit season effort and success (Animals treed/100 nights or days of pursuit), 2007–2008, and 2008–2009.
2007–2008 2008-2009
Species # Reporting
Effort # Treed # Days
# Treed/ 100 Days
# Reporting Effort
# Treed # Days # Treed/
100 Days
Bobcat 224 1,034 3,172 32.6 218 916 3,102 29.5
Gray Fox 11 41 141 29.1 17 56 306 18.3
Red Fox 1 1 10 10.0 2 0 18 0
Raccoon 69 718 992 72.4 72 777 1,095 71.0
Total 305 1,794 4,315 41.6 309 1,749 4,521 118.8