Embed Size (px)
Citation preview

OREGON FOREST FACTS
2019-20 EDITION

Oregon is number oneOregon’s vast forests have come to define a way of life here. Many of us cherish our forests not only for their scenic beauty, but also for the recreational opportunities, clean air and water, wildlife habitat and wood products they provide. More than 61,000 Oregonians employed by the forest sector depend on the state’s forests for their livelihood.
In 1971, the Oregon Forest Practices Act became the first law in the U.S. to regulate forest practices, ensure reforestation, and safeguard water, fish and wildlife habitat, soil and air. It has continually evolved since then to keep pace with the latest scientific findings. So it’s no wonder Oregon leads the nation when it comes to practicing sustainable forestry.
Sustainably harvesting timber from our highly productive forests allows Oregon to make more wood building materials than any other state. We’ve long been the top U.S. producer of both softwood lumber and plywood. And, more recently, Oregon has become a leader in manufacturing innovative “mass timber” engineered wood products such as cross-laminated timber (CLT) and Mass Plywood Panels (MPP).
In recent years Oregon has also become a hub for expertise in wood building design, construction and research. The state is home to some of the largest and tallest mass timber buildings in the country.
This 2019-20 edition of Oregon Forest Facts is full of information we hope will help you better understand Oregon’s forests, forest management and forest products – and why we’re number one.
Sincerely,
Mike Cloughesy, Director of Forestry Oregon Forest Resources Institute

Forestland area 1, 2 Nearly half of Oregon is forestland. About 80 percent of this forestland is classified as “timberland.” Timberland is forestland that can productively grow commercial-grade timber. It excludes forestland with low growth and reserve areas where logging is restricted, such as wilderness areas and national parks. 3
Oregon forestland area Acres % of total
U.S. Forest Service 14,073,000 47%
Bureau of Land Management 3,566,000 12%
National Park Service 161,000 1%
Other federal 33,000 <1%
Total federal forestland 17,833,000 60%
State 945,000 3%
County and municipal 203,000 1%
Total state and local forestland 1,148,000 4%
Total government forestland 18,981,000 64%
Large private landowners (>/= 5,000 acres) 6,584,000 22%
Small private landowners (<5,000 acres) 3,607,000 12%
Total private forestland 10,191,000 34%
Native American tribal forestland 484,000 2%
TOTAL FORESTLAND, all owners 29,656,000 100%
Oregon total land area (acres)
FORESTLAND 29,656,000
NONFOREST LAND (urban, cropland, range, etc.) 31,826,800
WATER AREA 1,807,600
47%
50%
3%
1

FEDERAL GOVERNMENT
LARGE PRIVATE
SMALL PRIVATE
STATE & OTHER PUBLIC
TRIBAL
Forestland ownership 4
FORESTLAND CONVERSION 5 Oregon has done remarkably well in protecting forests, farms and rangeland from development. In fact, 97 percent of all non-federal land in Oregon that was in resource land uses in 1974 remained in those uses in 2014. When forestland is lost today, it tends to happen because of residential or commercial development. Between 1974 and 2014, about 247,000 acres of private Oregon forestland were converted to other uses, mostly to low-density housing. However, Oregon’s loss was less than half the loss seen in Washington state over the same period. That’s due largely to a difference in Oregon’s land-use and forest-practices laws, which work in tandem to keep forestland and farmland in forest and farm uses.
2

0
5
10
15
20
25
30
1953
1963
1977
1987
1997
2007
2012
MIL
LIO
NS O
F A
CRES
Oregon forestland acreage
60%
22%
12%
4%
2%
FEDERAL GOVERNMENT
LARGE PRIVATE
SMALL PRIVATE
STATE AND OTHER PUBLIC
TRIBAL
FORESTLAND ACREAGE BY OWNER (2016) 1
TIMBER HARVEST BY OWNER (2017) 7
66%
13%
12%
9%
<1%
Historic forestland changes 6 The amount of total public and private forestland in Oregon has held mostly steady, at about 30 million acres, for more than 60 years. In fact, it’s estimated to have been about 30 million acres in the 1600s, as well.
FORESTLAND OWNERSHIP AND TIMBER HARVESTWhile the federal government manages most of the forestland in Oregon, only a small fraction of Oregon’s timber harvest happens on federal land, and most of that is from thinning. About 78 percent of the total state harvest comes from private timberlands.
3
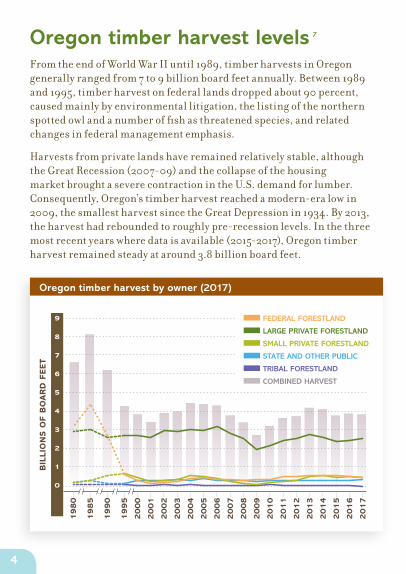
Oregon timber harvest levels 7 From the end of World War II until 1989, timber harvests in Oregon generally ranged from 7 to 9 billion board feet annually. Between 1989 and 1995, timber harvest on federal lands dropped about 90 percent, caused mainly by environmental litigation, the listing of the northern spotted owl and a number of fish as threatened species, and related changes in federal management emphasis.
Harvests from private lands have remained relatively stable, although the Great Recession (2007-09) and the collapse of the housing market brought a severe contraction in the U.S. demand for lumber. Consequently, Oregon’s timber harvest reached a modern-era low in 2009, the smallest harvest since the Great Depression in 1934. By 2013, the harvest had rebounded to roughly pre-recession levels. In the three most recent years where data is available (2015-2017), Oregon timber harvest remained steady at around 3.8 billion board feet.
1980
1985
1990
1995
2000
2001
2002
2003
2004
2005
2006
2007
2008
2009
2010
2011
2012
2013
2014
2015
2016
2017
9
8
7
6
5
4
3
2
1
0
BIL
LIO
NS O
F B
OA
RD
FEET
FEDERAL FORESTLAND
LARGE PRIVATE FORESTLAND
SMALL PRIVATE FORESTLAND
STATE AND OTHER PUBLIC
TRIBAL FORESTLAND
COMBINED HARVEST
0
2000
4000
6000
8000
10000
0
2000
4000
6000
8000
10000
0
2000
4000
6000
8000
10000
Oregon timber harvest by owner (2017)
4

Sustainability of Oregon’s timber harvest 8
Growth, mortality and harvest 2006-2015
FEDERAL
0 20 40 60 80 100
0 20 40 60 80 100
-20 0 20 40 60 80 100
MORTALITY
REMOVALS
CHANGE IN NET GROWTH
USFS
65% 8% 27%
ANNUAL GROWTH
STATE
19% 56% 25%
PRIVATE
12% 99%-11%
HARVEST MORTALITY NET CHANGE
-0.5 0.0 0.5 1.0 1.5 2.0 2.5 3.0
0 20 40 60 80 100
0.0 0.5 1.0 1.5 2.0 2.5 3.0 3.5
% 25 50 75 100
ANNUAL GROWTH
STATE
PRIVATE
TOTAL
HARVEST MORTALITY NET CHANGE
% 25 50 75 100
STATE
FEDERAL
PRIVATE
TOTAL
.16.13.88
1.02.551.09
.03.10 .04
.39.11 .82
12%11%77%
36%25%39%
18%56% 26%
36%8% 56%
Lorem ipsum
TOTAL GROWTH(million cubic feet)
1,515
176
1,149
2,840
On Oregon’s private forestland, where most timber harvest happens in the state, the amount of wood harvested each year is about 77 percent of the annual timber growth. About 11 percent of that growth is offset by trees that die from causes such as fire, insects and disease.
On federal lands, only about 8 percent of the annual timber growth is harvested each year. The amount of timber that dies offsets annual growth by 36 percent. The remainder of the growth, a net change of 56 percent, adds to the volume of standing timber in those forests.
High net change in growth isn’t always beneficial, however. For example, in federal ponderosa pine and mixed conifer forests in eastern and south central Oregon, it has created unusually dense forests with stressed trees that are more prone to insect infestation, disease and uncharacteristically severe fire.
5

Forest sector wages 9 Forest-related employment in Oregon totaled 61,051 jobs in Oregon in 2017, according to the Oregon Employment Department. This includes positions in forest management, logging and producing wood products such as lumber and plywood. (For a complete breakdown of the job figures, see the back cover.) The average annual wage of those jobs was $54,200, roughly 6 percent higher than the average wage of $51,100 for all Oregon employment. In some Oregon counties, especially rural ones, forest sector jobs have significantly higher-than-average wages. In Clatsop County, for instance, forest sector wages are 92 percent higher than the county average.
Oregon counties with greatest forest sector wage differences (2017)
30000
40000
50000
60000
70000
80000
Cla
tsop
Linco
ln
Harn
ey
Curr
y
Hood R
iver
Wallow
a
Tilla
mook
Unio
n
Lane
Kla
math
Coos
Colu
mbia
Dougla
s
Ore
gon
9
8
7
6
5
4
3
2
1
0
WA
GES
70K
60K
50K
40K
30K
92%
86%
54%
54%
46%
43%
38%
38%
32%
35%
33%
33%
30%
6%
FOREST SECTOR AVERAGE ANNUAL WAGE
OVERALL AVERAGE ANNUAL WAGE
PERCENT DIFFERENCE
WA
GES
0
10000
20000
30000
40000
50000
60000
70000
80000
70K
60K
50K
40K
30K
20K
10K
92
8
6
54
5
4
46
43
35
38
3
8
32
3
5
3
3
3
3
3
0
6
Cla
tsop
Linco
ln
Harn
ey
Curr
y
Hood R
iver
Wallow
a
Linn
Tilla
mook
Unio
n
Lane
Kla
math
Coos
Colu
mbia
Dougla
s
Ore
gon
FOREST SECTOR AVERAGE ANNUAL WAGE
OVERALL AVERAGE ANNUAL WAGE
PERCENT DIFFERENCE38
6

A range of forest productsOregon’s wood products industry is a traded sector, with close to 75 percent of all products made here sold outside the state. This generates revenue that supports mill jobs in Oregon timber towns.
Here are some of the many different types of products that can be made from trees harvested in Oregon:
• Softwood lumber such as dimension lumber, beams, studs, wood paneling, siding, flooring, decking, moulding and millwork, door and window frames, and furniture parts (see page 8)
• Plywood from softwood veneer (see page 9)
• Hardwood lumber and plywood used in cabinetry, millwork, furniture and flooring
• Engineered wood products, such as laminated veneer lumber, glulam beams and columns, finger-jointed lumber, I-beams, cross-laminated timber (CLT), mass plywood panels (MPP) and other products (see page 10)
• Composite wood products, such as particleboard, hardboard and fiberboard, made largely from residuals generated by sawmills and plywood mills
• Posts, poles and timbers, such as utility poles, fence posts, pilings, treated timbers, cross-arms and railroad ties
• Pulp and paper products from wood fiber, including packaging, printing paper, newsprint, tissue, toweling, absorbents, adhesives and fluff pulp
• Millwork, including products such as moulding, cabinets, furniture and fencing
• Biomass energy from mills burning wood waste to generate heat and electricity for manufacturing, or power plants replacing coal with timber harvest waste
• Heating uses, such as pellets and bricks, made from sawdust and mill residue
• Other wood products, including shipping pallets, pencils and musical instruments, as well as products that contain cellulose and other substances that come from trees, such as rayon, cellophane, toothpaste, chewing gum, nail polish, hairspray, and food additives and flavorings
7

No. 1 in softwood lumberOregon has led the nation in the production of softwood lumber for many years.
Oregon’s lumber output of 5.5 billion board feet in 2017 accounted for about 16.2 percent of total U.S. production. That’s an increase of 43 percent from the recessionary low in 2009 of 3.8 billion board feet. However, Oregon sawmill output in 2017 is only about 73 percent of the pre-recessionary high in 2005.
2012 2013 2014 2015 2016 2017 % of
U.S. total for 2017
Oregon 4,659 5,119 5,448 5,222 5,288 5,459 16.2%
Washington 3,763 3,942 4,035 3,745 3,759 3,884 11.5%
Georgia 2,273 2,367 2,561 2,669 2,803 2,915 8.6%
Arkansas 1,947 2,008 2,103 2,103 2,231 2,489 7.4%
Alabama 1,947 2,107 2,205 2,344 2,400 2,430 7.2%
Mississippi 1,746 1,853 1,977 1,964 2,078 2,363 7.0%
North Carolina 1,638 1,690 1,803 1,820 1,899 1,939 5.7%
California 1,838 1,937 1,938 1,957 2,029 1,928 5.7%
Idaho 1,494 1,647 1,667 1,717 1,781 1,789 5.3%
Texas 1,283 1,362 1,405 1,450 1,494 1,526 4.5%
TOTAL U.S. 28,257 29,951 31,496 31,644 32,535 33,779
Softwood lumber productionTop 10 states and U.S. total production (in millions of board feet)10
8

No. 1 in plywoodOregon dominates U.S. production of softwood construction plywood. In fact, Oregon accounted for about 28 percent of total U.S. plywood production in 2017, up from 22 percent in 2009.
In 2017, 15 plywood mills were operating in Oregon, of 50 total nationwide. Louisiana, the second-place state in production, had only five plywood mills, and no other state had more than three.
Overall, U.S. plywood production has been challenged by cheaper strand-board products that have taken market share in some uses. Oregon has no mills that make strand-board. Yet plywood is still a significant business that has rebounded from its recessionary low in 2009.
2012 2013 2014 2015 2016 2017 % of
U.S. total for 2017
Oregon 2,553 2,704 2,589 2,534 2,512 2,518 28%
Louisiana 1,236 1,251 1,191 1,195 1,180 1,250 14%
Mississippi 656 654 611 582 659 818 9%
Texas 763 726 700 671 693 695 8%
Washington 751 791 760 756 666 604 7%
Georgia 649 609 589 588 593 601 7%
Arkansas 470 505 520 481 500 501 6%
TOTAL U.S. 9,181 9,345 8,985 8,749 8,805 9,026
Top plywood-producing states 11 (million square feet, 3/8” basis)
9

A leader in engineered wood 11
Some Oregon companies are using innovative techniques to turn raw timber or lumber into value-added engineered wood products. Of the 70 engineered wood manufacturing plants operating in the U.S., 18 are located in Oregon.
Here are some examples of engineered wood products made in Oregon:
• Cross-laminated timber (CLT) is made by adhering dimension lumber into large panels several layers thick, with each layer’s wood fibers running perpendicular to the adjacent layers. CLT panels, which typically range in thickness from 5 to 16 inches, can be prefabricated with cutouts for windows, plumbing, electrical wiring, heating and ventilation. They are then assembled into large, multistory buildings that otherwise might be built from steel or concrete.
• Glued-laminated timber (glulam) is a stress-rated engineered wood product made up of wood laminations, or “lams,” that are bonded together with strong, waterproof adhesives. They are used in commercial and residential applications, from simple garage-door headers and roof beams to huge, dramatic, curving beams that are an architectural focal point.
• Laminated veneer lumber (LVL) is the most widely used structural composite lumber product. It is produced by bonding thin wood veneers together into a large board called a billet. The LVL billet is then sawed to desired dimensions depending on the construction application. The many uses of LVL include headers and beams, rafters, rim board, scaffold planking, studs and flange material for prefabricated wood I-joists and truss components.
• Mass plywood panel (MPP) is a veneer-based engineered wood product that is similar to plywood, but at a massive scale. The panels can be used as an alternative to CLT in similar applications, including constructing multistory buildings.
• Nail-laminated timber (NLT) is created by nailing together dimension lumber stacked on edge into a single structural element. NLT is used in floors, decks and roofs, as well as elevator and stair shafts.
• Parallel Strand Lumber (PSL), Laminated Strand Lumber (LSL) and Oriented Strand Lumber (OSL) are all structural composite lumber products made from flakes of wood (strands) that are combined with adhesive and used for studs, headers or beams.
10

The Oregon Forest Practices Act 12 In 1971, Oregon became the first state to pass a comprehensive law to regulate forest practices and safeguard water, fish and wildlife habitat, soil and air. The rules of the Oregon Forest Practices Act are continually reviewed and updated to keep pace with the most current scientific research. Here are some of the key requirements:
IMPORTANT RULES• Reforestation: Landowners must complete replanting within two years after a
timber harvest, with at least 200 tree seedlings per acre. Within six years, the harvest area must contain healthy trees that can outgrow competing grass and brush on their own.
• Water and stream protection: Timber harvesting, road building and the use of chemicals are restricted close to streams, to protect fish and safeguard the source of much of Oregon’s drinking water.
• Wildlife habitat protection: Live trees, standing dead trees (snags) and fallen logs must be left after a timber harvest, to provide wildlife habitat.
• Limits on clearcutting: Clearcuts cannot exceed 120 acres within a single owner-ship, including the combined acreage of any clearcuts within 300 feet of each other.
• Chemical application: Forest protection laws limit the use of chemicals. Foresters must follow a variety of state and federal regulations when using herbicides to slow down the growth of invasive plants and other vegetation that compete with newly planted seedlings for water, sunlight and nutrients. This helps the young trees survive and become established enough that herbicides are no longer needed until the next replanting.
11
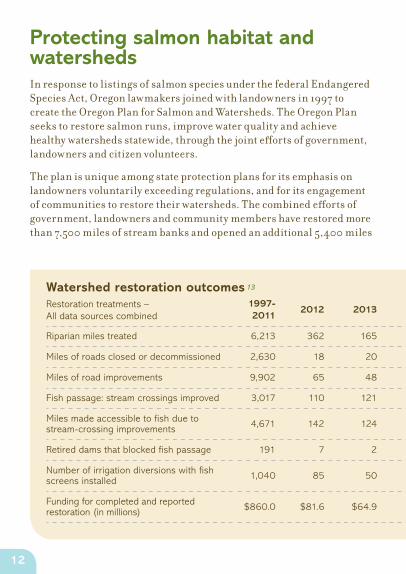
Protecting salmon habitat and watershedsIn response to listings of salmon species under the federal Endangered Species Act, Oregon lawmakers joined with landowners in 1997 to create the Oregon Plan for Salmon and Watersheds. The Oregon Plan seeks to restore salmon runs, improve water quality and achieve healthy watersheds statewide, through the joint efforts of government, landowners and citizen volunteers.
The plan is unique among state protection plans for its emphasis on landowners voluntarily exceeding regulations, and for its engagement of communities to restore their watersheds. The combined efforts of government, landowners and community members have restored more than 7,500 miles of stream banks and opened an additional 5,400 miles
1997-2011
2012 2013 2014 2015-16 Total
Riparian miles treated 6,213 362 165 227 561 7,528
Miles of roads closed or decommissioned 2,630 18 20 16 296 2,980
Miles of road improvements 9,902 65 48 388 289 10,692
Fish passage: stream crossings improved 3,017 110 121 114 163 3,525
Miles made accessible to fish due to stream-crossing improvements 4,671 142 124 131 341 5,409
Retired dams that blocked fish passage 191 7 2 6 14 220
Number of irrigation diversions with fish screens installed 1,040 85 50 35 31 1,241
Funding for completed and reported restoration (in millions) $860.0 $81.6 $64.9 $49.6 $70.6 $1,126.7
Watershed restoration outcomes 13
Restoration treatments –All data sources combined
12

1997-2011
2012 2013 2014 2015-16 Total
Riparian miles treated 6,213 362 165 227 561 7,528
Miles of roads closed or decommissioned 2,630 18 20 16 296 2,980
Miles of road improvements 9,902 65 48 388 289 10,692
Fish passage: stream crossings improved 3,017 110 121 114 163 3,525
Miles made accessible to fish due to stream-crossing improvements 4,671 142 124 131 341 5,409
Retired dams that blocked fish passage 191 7 2 6 14 220
Number of irrigation diversions with fish screens installed 1,040 85 50 35 31 1,241
Funding for completed and reported restoration (in millions) $860.0 $81.6 $64.9 $49.6 $70.6 $1,126.7
of streams for fish through stream-crossing improvements.
The Oregon Plan is one part of a three-pronged effort to protect water and fish habitat, along with forest practice rules (see page 11) and land-use laws that work to keep forestland from being converted to other uses that are less compatible with quality fish habitat. Since 1997, more than $1.1 billion has been invested in watershed restoration projects in Oregon.
KEY ELEMENTS OF THE OREGON PLAN• Voluntary restoration activities by private landowners (especially forest
landowners), supported by local citizens, students, businesses and government
• Coordinated tribal, state and federal agency actions
• Continued monitoring of watershed health, water quality and salmon recovery
• Rigorous technical oversight by independent scientists and specialists
13

Water quality in Oregon’s forestsStreams originating on forestlands supply water for Oregonians to drink, use in their homes and businesses, irrigate their fields and run industrial processes. Forest soils provide natural filtration to keep streams clean and water quality high. Some 35 municipal water systems in Oregon source their drinking water supply from forested watersheds. More than 30 of those watersheds include actively managed lands that employ modern timber-harvest and resource-protection methods.
OREGON WATER QUALITY INDEX 14
According to a statewide index, the highest water quality in Oregon occurs in forested watersheds.
The Oregon Department of Environmental Quality (DEQ) regularly measures water quality in major rivers and streams throughout the state. DEQ developed the Oregon Water Quality Index (OWQI) using eight measures to express water quality as a number between 10 (worst) and 100 (ideal). There are currently 160 monitoring sites in the DEQ network. Among all land uses, the highest water quality generally occurs in forested watersheds, including those that have significant active management.
According to the index, 64 percent of the forestland test sites had a good or excellent water quality rating, compared to 51 percent of all the sites statewide, which include range, agricultural and urban areas.
See more about the OWQI at www.oregon.gov/deq/wq/Pages/WQI.aspx
14

Sustainable forestry Oregon forest landowners meet some of the strictest environmental standards in the world through compliance with the Oregon Forest Practices Act (see page 11). Yet they may choose to meet additional standards to gain recognition from independent, third-party forest sustainability certification systems.
America’s three largest certification systems are the American Tree Farm System (ATFS), the Forest Stewardship Council (FSC) and the Sustainable Forestry Initiative (SFI).
Forest certification gives wood-product consumers, architects, engineers and builders an added level of assurance that the products were produced using responsible and sustainable forestry practices.
Certification system Acres
American Tree Farm System 15 744,756
Forest Stewardship Council 16 193,057
Sustainable Forestry Initiative 17 4,111,054
TOTAL 5,048,867
Oregon acres certified by the three major forest certification systems (as of June 2018)
OREGON WOOD AND LEED Wood from Oregon forestland regulated by the state’s forest protection laws can count toward Leadership in Energy & Environmental Design (LEED) certification of sustainable building projects. An independent third-party audit commissioned by the Oregon Department of Forestry found that Oregon-grown wood meets the LEED credit for wood use in a project if it comes from timberland subject to the Oregon Forest Practices Act (see page 11). The audit showed the provisions of the law meet an international standard for responsible forestry.
15
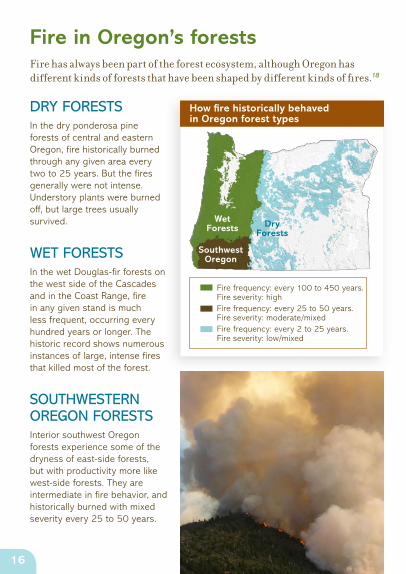
Fire in Oregon’s forestsFire has always been part of the forest ecosystem, although Oregon has different kinds of forests that have been shaped by different kinds of fires.18
DRY FORESTSIn the dry ponderosa pine forests of central and eastern Oregon, fire historically burned through any given area every two to 25 years. But the fires generally were not intense. Understory plants were burned off, but large trees usually survived.
WET FORESTSIn the wet Douglas-fir forests on the west side of the Cascades and in the Coast Range, fire in any given stand is much less frequent, occurring every hundred years or longer. The historic record shows numerous instances of large, intense fires that killed most of the forest.
SOUTHWESTERN OREGON FORESTSInterior southwest Oregon forests experience some of the dryness of east-side forests, but with productivity more like west-side forests. They are intermediate in fire behavior, and historically burned with mixed severity every 25 to 50 years.
How fire historically behaved in Oregon forest types
Wet Forests
Southwest Oregon
Dry Forests
Fire frequency: every 100 to 450 years. Fire severity: highFire frequency: every 25 to 50 years. Fire severity: moderate/mixedFire frequency: every 2 to 25 years. Fire severity: low/mixed
16

2018 and 2017 fire seasons Oregon faced back-to-back challenging fire seasons in 2017 and 2018, with large blazes consuming hundreds of thousands of acres, destroying structures, damaging recreation sites and pouring hazardous smoke into communities. The total cost to fight fires across the state was $454 million in 2017 and $504 million in 2018.
2018A total of 1,954 wildfires burned approximately 892,707 acres of forested and non-forested lands during Oregon’s 2018 fire season. Fire danger forced thousands of Oregonians to evacuate their homes. Much of the state also experienced significant wildfire smoke impacts, economic loss, natural resource damage and threats to watersheds.
2017Fires raged across 717,219 acres of Oregon in 2017, in 2,058 separate fires that caused damage to both forested and non-forested lands. More than 7,600 people were evacuated from their homes due to fire danger. Smoke from the fires impacted public health and forced many school sporting events, outdoor concerts and performances to be canceled. Restaurants, retailers and other businesses lost revenue. Numerous outdoor recreation areas were also fully or partially closed because of wildfire damage.
Year Total Fires
Total Acres
Acres/ Fire
2018 1,657 442,791 267
2017 1,808 517,883 286
2016 1,375 52,386 38
2015 2,534 206,231 81
2014 2,480 213,375 86
2013 2,339 133,240 57
2012 1,319 168,554 128
2011 1,524 37,045 24
2010 1,590 32,629 21
2009 1,952 67,424 35
2008 2,314 66,942 29
10-yr. avg (2008-2017)
1,924 149,571 78
Total forest fires and forested acres burned in Oregon 19, 20
The total number of forest fires per year has remained fairly stable, but the total acres of forestland burned in recent years has increased dramatically. (Table includes Forest Service, state, private, tribal and BLM forestlands.)
17
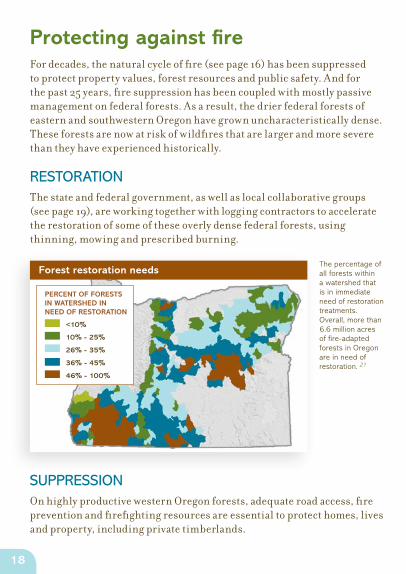
Protecting against fireFor decades, the natural cycle of fire (see page 16) has been suppressed to protect property values, forest resources and public safety. And for the past 25 years, fire suppression has been coupled with mostly passive management on federal forests. As a result, the drier federal forests of eastern and southwestern Oregon have grown uncharacteristically dense. These forests are now at risk of wildfires that are larger and more severe than they have experienced historically.
RESTORATIONThe state and federal government, as well as local collaborative groups (see page 19), are working together with logging contractors to accelerate the restoration of some of these overly dense federal forests, using thinning, mowing and prescribed burning.
The percentage of all forests within a watershed that is in immediate need of restoration treatments. Overall, more than 6.6 million acres of fire-adapted forests in Oregon are in need of restoration. 21
SUPPRESSIONOn highly productive western Oregon forests, adequate road access, fire prevention and firefighting resources are essential to protect homes, lives and property, including private timberlands.
PERCENT OF FORESTS IN WATERSHED IN NEED OF RESTORATION
<10%
10% - 25%
26% - 35%
36% - 45%
46% - 100%
Forest restoration needs
18

Forest collaborative groups 22 Throughout Oregon, collaborative groups are bringing together diverse stakeholders to find consensus on efforts to manage federal forests.
For instance, in central and eastern Oregon, group members are developing “zones of agreement” on ways to restore forest health and fire resiliency on public forests while also achieving economic and environmental benefits. The goal is to give the U.S. Forest Service candid feedback on projects such as thinning, mowing and prescribed burning, and avoid forest management gridlock caused by lawsuits that stop timber harvests.
Restoration projects support jobs with local logging companies and lumber mills. Revenue from harvested timber also helps pay for related efforts such as wildlife habitat enhancements and stream restorations.
Oregon currently has 29 collaborative groups, partnering with 11 national forests and involving hundreds of Oregonians working together to find common ground on important forest management issues across the state.
19
1. Pacific Northwest Forest Inventory and Analysis Database (PNW-FIADB). Resource Monitoring and Assessment Program, USDA Forest Service, Pacific Northwest Research Station, Portland, Ore. 2016.
2. Oregon Department of Forestry Resources Planning Program.
3. Definitions of “forestland” and “timberland” can be found in Bechtold, W.A., and Patterson, P.L., eds. The Enhanced Forest Inventory and Analysis Program — National Sampling Design and Estimation Procedures. General Technical Report SRS-80. USDA Forest Service, Asheville, N.C. 2005. Glossary, pp. 80-84. http://www.treesearch.fs.fed.us/pubs/20371.
4. Oregon Department of Forestry. About Oregon’s Forests. https://www.oregon.gov/ODF/ForestBenefits/Pages/AboutForests.aspx.
5. Gray, Andrew N.; Hubner, Dan; Lettman, Gary J.; McKay, Neil; Thompson, Joel L. Forests, farms & people: Land use change on non-federal land in Oregon 1974-2014. Oregon Department of Forestry. June 2016. http://hdl.handle.net/1957/58941.
6. Oswalt, Sonja N.; Smith, W. Brad; Miles, Patrick D.; Pugh, Scott A. Forest Resources of the United States, 2012. General Technical Report WO-91. USDA Forest Service, Washington, D.C. 2014. http://srs.fs.usda.gov/pubs/47322.
7. Oregon Department of Forestry Forest Resources Planning Program, Harvest Reports. https://data.oregon.gov/Natural-Resources/Timber-Harvest-Data-1942-2017/v7yh-3r7a.
8. Palmer, Marin; Kuegler, Olaf; Christensen, Glenn, tech. eds. Oregon’s Forest Resources, 2006-2015: Ten-year Forest Inventory and Analysis Report. General Technical Report PNW-GTR-971. USDA Forest Service, Pacific Northwest Research Station, Portland, Ore. 2018. 54 p. https://www.fs.usda.gov/pnw/publications/oregon’s-forest-resources-2006–2015-ten-year-forest-inventory-and-analysis-report.
9. Krumenauer, Gail. Oregon’s Forest Sector Employment Totals 61,000 in 2017. Oregon Employment Department, in cooperation with the Oregon Department of Forestry and the Oregon Forest Resources Institute. November 2018. http://bit.ly/2017ORForestJobs.
ENDNOTES – SOURCES OF INFORMATION
20

10. Forest Economic Advisors LLC. Personal communication, November 2018. http://www.getfea.com.
11. Elling, Joe. Structural Panel and Engineered Wood Yearbook. APA – The Engineered Wood Association, Tacoma, Wash. April 2018.
12. Oregon Forest Resources Institute. Oregon’s Forest Protection Laws: An Illustrated Manual – Revised – Third Edition. 2018.
13. Oregon Watershed Restoration Inventory. Oregon Plan Biennial Report Watershed Outcomes Summary (1999-2015). Oregon Watershed Enhancement Board. 2016. www.oregon.gov/OWEB/Pages/BiennialReport.aspx.
14. Coffeen, Greg; Mulvey, Michael. Oregon Water Quality Index Summary Report: Water Years 2004-2013. Oregon Department of Environmental Quality. June 2014. http://www.deq.state.or.us/lab/wqm/docs/wqiAnnualRep2014.pdf.
15. American Tree Farm System. http://www.treefarmsystem.org.
16. Forest Stewardship Council. https://us.fsc.org.
17. Sustainable Forestry Initiative, as of August 2018. http://www.sfiprogram.org.
18. Oregon Forest Resources Institute. State of Fire. 2014.
19. Northwest Coordination Center, U.S. Bureau of Land Management, Predictive Services Unit, Portland, Ore. http://gacc.nifc.gov/nwcc/admin/publications.aspx.
20. Oregon Department of Forestry, fire reports: http://www.oregon.gov/odf/fire/Pages/default.aspx (Annual Fire Season Reports).
21. Haugo, Ryan; Zanger, Chris; DeMeo, Tom; Ringo, Chris; Shlisky, Ayn; Blankenship, Kori; Simpson, Mike; Mellen-McLean, Kim; Kertis, Jane; Stern, Mark. A New Approach to Evaluate Forest Structure Restoration Needs across Oregon and Washington, USA. Forest Ecology and Management, Vol. 335, pgs. 37-50. Jan. 1, 2015. Also at: http://www.sciencedirect.com/science/article/pii/S0378112714005519.
22. USDA Forest Service. Collaborative Directory, Pacific Northwest Region. 2017. https://www.fs.usda.gov/Internet/FSE_DOCUMENTS/fseprd567241.pdf.
21

An array of jobsOregon’s forest sector includes a wide variety of employment, from forestry, logging, millwork and cabinet-making to engineering, hydrology, business management and academic research. Economists estimate that each million board feet of timber harvest creates or retains about 11 forest sector jobs.
Here’s a rundown of Oregon’s forest sector jobs by type of employment in 2017.
Forest Management
Company management 1,125
Forestry and environmental consultants, researchers, academics 274
Bureau of Land Management 1,567
State of Oregon 858
U.S. Forest Service 3,128
Subtotal 6,952
Forestry Support
Forestry support (nurseries, machinery manufacturing, firefighting) 6,001
Logging 7,238
Subtotal 13,239
Primary Forest Products
Pulp and paper manufacturing 4,163
Sawmills and wood preservation 6,391
Veneer, plywood and engineered wood 9,334
Subtotal 19,888
Secondary Forest Products
Millwork (doors, windows, custom) 5,762
Wood kitchen cabinets and countertops 3,614
Other (manufactured homes, wood buildings, pallets, furniture, etc.) 2,821
Subtotal 12,197
Distribution, Transportation and Other
Wood products wholesalers 2,364
Paper products wholesalers 774
Transportation of logs, chips, goods 4,974
Other (biomass electric power, airport operations, marine cargo handling, etc.) 663
Subtotal 8,775
TOTAL 61,051
Oregon’s forest sector jobs - 2017 9
317 SW Sixth Ave., Ste. 400 Portland, OR 97204-1705 971-673-2944
OregonForests.org OregonForestFacts.org
Follow OFRI on Facebook, Twitter and Instagram
© 2019 Oregon Forest Resources Institute