Embed Size (px)
Citation preview

Oregon Department of ENERGY The Developing EV Market Rick Wallace 9/22/2017

Transportation Plays a Major Role in Oregon’s Energy Mix
Residential 25%
Commercial 19.2% Industrial
25%
Transportation 30.8%
SECTOR ENERGY CONSUMPTION 2014
Residential 18.1%
Commercial 11.86%
Indusdtrial 12.94%
Transportation 57.18%
SECTOR ENERGY COST 2014
0.00%
1.00%
2.00%
3.00%
4.00%
5.00%
6.00%
7.00%
8.00%
Fuel Cost As A Percent of Oregon Household Median Income
Cost to drive 100 Miles (9/13/17) ICE = $10.39
At $2.91/gal & 28 mpg EV = $3.08 At $0.11/kWh & 3.57miles/kWh
HH Fuel Cost EV Verse ICE 2016
ICE = $2,321 EV = $ 761

Transportation & OR GHG Emissions
0% 5% 10% 15% 20% 25% 30% 35% 40%
Transportation
Residential & Commercial
Industrial
Agriculture
Oregon GHG Emissions by Sector - 2015
Light-duty vehicles are a major contributor of GHG
overall at about 25%
Oregon Fuel Mix
ICE GHG Emissions 28 mpg 11,346 miles/year 4.78 MT CO2e
EV GHG Emissions 3.57 m/kWh 11,346 miles/year 1.38 MT CO2e
A Light-Duty EV has GHG emissions of 25% to 33% of a
similar model ICE vehicle 2015 On-Highway Fuel Mix Fuel Type GGE % GGE GHG MT Gasoline 1,398,726,073 64.85% 16,844,859 Diesel 559,307,710 25.93% 6,795,870 Ethanol 155,831,454 7.22% 1,476,603 Biodiesel 35,958,121 1.67% 250,366 Renewable Diesel 73,856 0.003% 536 LPG 946,831 0.04% 9,401 CNG 3,140,667 0.15% 30,002 LNG 431,490 0.02% 4,872 Electricity(GGE) 2,543,081 0.12% 9,678 Petroleum 1,958,033,783 90.78% 23,640,730 All Others 198,925,500 9.22% 1,781,458 Total 2,156,959,283 25,422,188

EV GHG Emissions Vary by Region

Why EVs: Benefits of Going Electric
• Improved air quality, particularly in urban disadvantaged neighborhoods where vehicle emissions are high
• EV greenhouse gas emissions are far less than ICEVs • EVs have potential to benefit the electrical grid through demand
response and storage strategies to help integrate renewables, and EVs can help balance load
• EVs have superior technology to ICEVs – they do a better job of getting from A to B
• Reduced operational and maintenance costs • EVs are safer, quieter, and don’t smell • Diversification of transportation fuels lessens petroleum supply volatility
and cost fluctuations on the economy, supports energy security

EV 2.0 Will Expand the EV Market
• EVs’ range will expand to 200 to 400 miles per charge • Battery prices have come down 73%/kWh since 2010 • Near future vehicles will be able to recharge to 80% in 15 to 30 minutes • More models will become available • EVs are nearing price parity to ICE vehicles
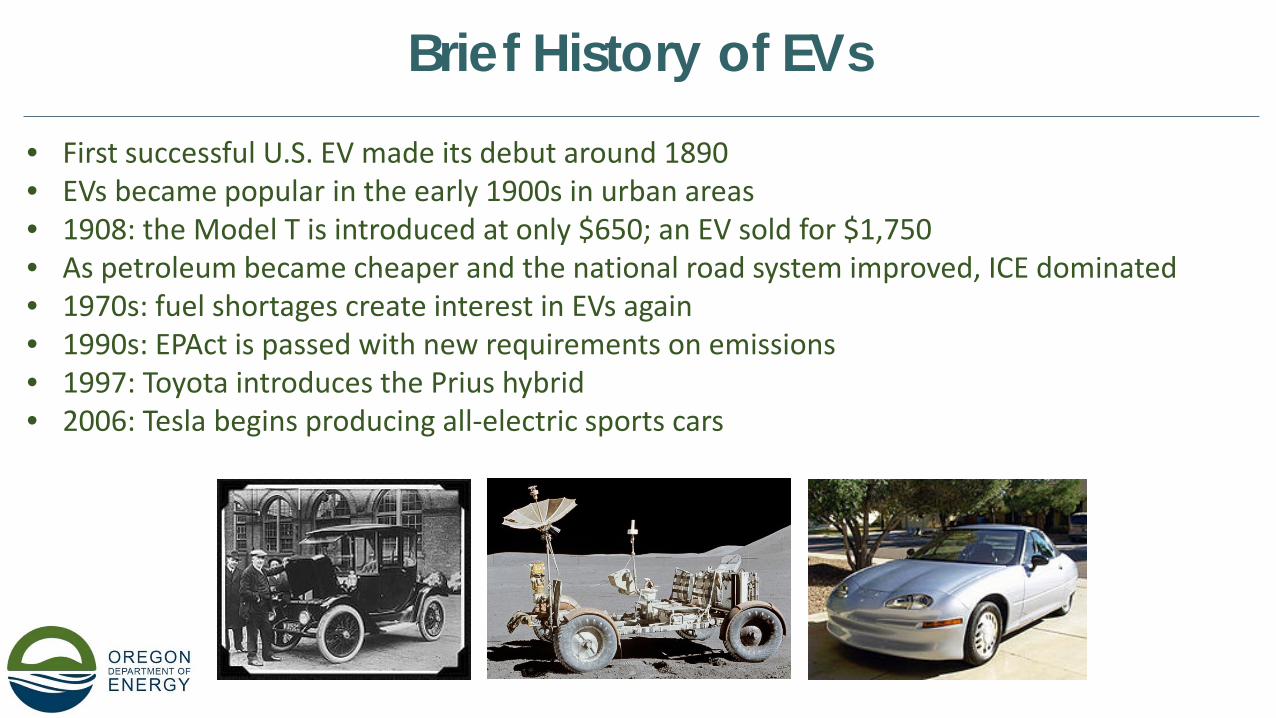
Brief History of EVs • First successful U.S. EV made its debut around 1890 • EVs became popular in the early 1900s in urban areas • 1908: the Model T is introduced at only $650; an EV sold for $1,750 • As petroleum became cheaper and the national road system improved, ICE dominated • 1970s: fuel shortages create interest in EVs again • 1990s: EPAct is passed with new requirements on emissions • 1997: Toyota introduces the Prius hybrid • 2006: Tesla begins producing all-electric sports cars

Brief History of EV Batteries
Flooded lead acid batteries have been used in vehicles since the 1880s. They were not very good for the application as they were heavy and typically needed replacing every three years. Most early EVs used lead acid. EV1 began with a 16.5-18.7 kWh lead acid battery; later versions used a 26.4 kWh Nickel Metal Hydride (NiMH) battery, lead acid about 30-50 Wh/kg, and has a maintenance requirement.
Nickel Metal Hydride batteries offer low cost and long life. First gen batteries developed memory problems. Typically 70 to 80 Wh/kg for vehicle applications. Has a maintenance requirement. Used in hybrid
vehicles, Prius, and first gen RAV 4 BEV.
Lithium Ion batteries are now the fastest growing battery system. Li-ion is used where high-energy density and lightweight are of prime importance. 100 to 265 Wh/kg, no maintenance requirement; lithium based batteries continue to improve. Examples include: lithium cobalt oxide, lithium manganese oxide, lithium iron phosphate, lithium nickel manganese cobalt oxide, and lithium titanate.

Lithium Batteries Lead the Pack Pouch Cell
Prismatic Cell
Cylindrical Cell
Button Cell

Battery Production Will Grow • Increasing the scale in all aspects of battery production will drive down cost • Electric cars and their motors require significantly fewer moving parts and less assembly
work • Battery production tends to be highly automated

Barriers – High First Cost, Vehicle Purchase Price Many Predictions for EV Cost Parity with ICEV
Source: NADA Guides, ARK Investment Management LLC
• Navigant Research forecasts cost competitiveness by 2025
• According to Goldman Sachs, battery cost and weight for EVs will decline by 63% and 52%, respectively, in the next five years, while capacity and range will improve by 50% and 72%.
Bloomberg

Barriers – Popular Vehicle Types Are Unavailable in EV Platforms
The most popular vehicle models – pickups, SUVs, crossovers, and minivans – are not available or under represented in the plug-in format

Electric Car Boom: Models by Style and Range Available Through 2020

Multiple Model Types Available at Cost Parity Will Increase EV Sales
At Oregon’s current adoption rate of 35%
yr/yr
2016 2020 2025
13,833 45,946
206,025
EVs as a percentage of car sales predicted to rise significantly

Federal Incentives • Each automaker’s eligible plug-in vehicles can a receive a credit of up to $7,500 until the
200,000th eligible vehicle is registered inside the U.S. • At the time of the 200,000th sale, full credits continue for the remainder of that quarter
and continue until the end of the next quarter • Credit is then reduced to $3,750 for the next 6 months, then reduced again to $1,875 for
the next 6 months before expiring completely

Oregon Transportation Bill, EV Rebate Program at DEQ
• Up to $2,500 for an EV with >10kWh battery under $50,000
• Up to $1,500 for an EV with <10kWh battery under $50,000
• Oregon residents, plus companies and public entities, are eligible
• Motorcycles and low speed vehicles will be eligible in 2019
• Program funds from privilege tax on sales of vehicles, .5%
• Program to sunset December 31, 2023

Where Are We Now: U.S.

Where Are We Now: Oregon • 6/30/2017: Registered vehicles in
Oregon included: • 9,529 BEVs • 6,414 PHEVs • Total of 15,943 plug-in vehicles
• 12/31/2016: 3,501,908 light-duty
vehicles registered in Oregon – plug-in vehicles accounted for only .4 % of total vehicles in the state

Cost per Mile of Range is Dropping
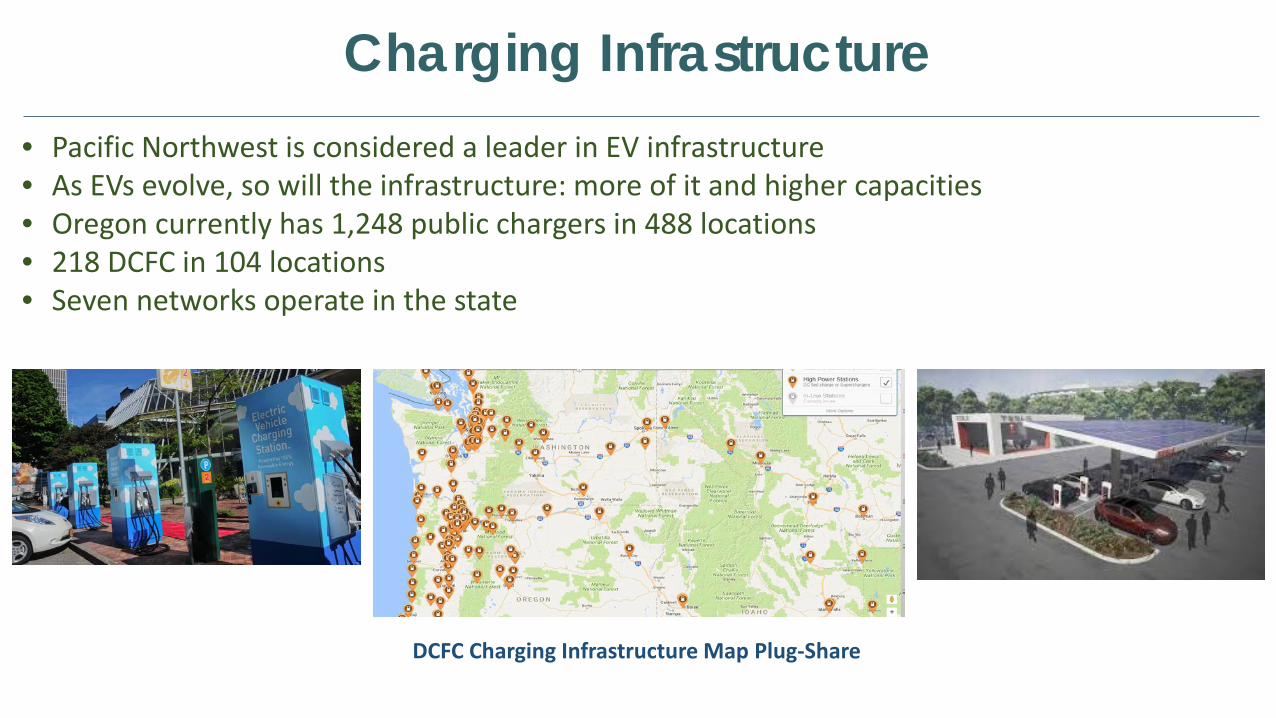
Charging Infrastructure
DCFC Charging Infrastructure Map Plug-Share
• Pacific Northwest is considered a leader in EV infrastructure • As EVs evolve, so will the infrastructure: more of it and higher capacities • Oregon currently has 1,248 public chargers in 488 locations • 218 DCFC in 104 locations • Seven networks operate in the state

Electric Grid

• As car batteries get larger, charging infrastructure will get more powerful, enabling more range per minute of charge
• Future charging locations will offer several chargers in a pod and variable or different charging power rates
• There will still be multiple standards for DCFC. However, most future charging locations will offer both the combo and CHAdeMO standards.
EV Infrastructure Will Get Faster, More Powerful
Miles per Charging Rate and Time EV = 3.57 miles/kWh
DCFC/kW Miles per/min.
Miles per/15 min.
Miles per/30 min.
50 2.98 44.63 89.25 80 4.76 71.40 142.8
100 5.95 89.25 178.5 150 8.93 133.88 267.75 300 17.85 267.75 535.5 350 20.83 312.38 624.75
SAE Combo CHAdeMO

VW Incentive Funds, Electrify America • Over 10 years, VW will spend $2 billion on infrastructure – $800 million for California and
$1.2 billion for the rest of the U.S. • In the first 30 month cycle, VW has identified I-5 (10+) and I-84 (2-4) as part of a high-speed
highway network • Average station will charge five vehicles at once • Stations will focus on 150 kW & 320 kW chargers that are 50 kW capable and support both
DCFC standards • Stations will be located about 66 miles but no more than 120 miles apart.

VW Incentive Funds, Electrify America • City of Portland was chosen as one of 11 cities to get community based local network
infrastructure • Electrify America plans to invest about $40 million in local community based charging in
the first 30 months, with 300+ stations • Stations will run the gamut from level 2 to 350 kW DCFC

Utility Programs Will Increase Infrastructure • SB 1547 (2016) requires utilities to develop
and implement transportation electrification programs
• PGE will develop & implement six pods of DCFCs in its service territory
• PacifiCorp plans to own and operate up to seven charging pods in its service territory

More Than 80% Charging Occurs at Home
At 7PM, 50% of EVs are plugged-in at home
(INL data)
If 50% = 1.75kW & 50% = 6.6kW
• Home charging rates can be anywhere from 1.75kW to 19.7kW • EV demand can ramp up quickly, and if not managed appropriately can occur
during the Northwest’s traditional peak period
28,876 95,912
430,077
2016 2020 2025
EV Home Charging Demand in kW

2013, 4th Quarter EV Project Oregon Data Oregon Residential Charging Demand versus Time of Day Range of Percent of Oregon Residential Charging Units with a
Vehicle Connected versus Time of Day
Most charging happens at home beginning at 6 PM until about 11 PM. Nearly 80 percent of vehicles are plugged-in from 6 PM until 6 AM. Much of the charging
occurs during the recognized Northwest peak time of 4 PM to 8 PM.

2013, 4th Quarter EV Project San Diego Data San Diego Residential Charging Demand versus Time of Day
Range of Percent of San Diego Residential Charging Units with a Vehicle Connected versus Time of Day
The percent of time that the vehicle is plugged in versus time of day is very similar to Oregon. However, the charging demand versus time is very
different due to SDG&E’s rate structures encouraging TOU.

Projected California Uncontrolled EV Demand

California Optimized EV Charging

Uncontrolled, Aggregate EV Charging Load

Smart Charging Benefits
• The ability to flexibly manage charging while still meeting customer requirements can provide a new kind of distributed resource
• Once the utility is in the house managing EV demand, the next steps to managing other sources of demand – such as water heaters, HVAC and refrigerator/freezers – will be easier
• New communications and control technologies, together with innovative tariffs and incentive structures, enable utilities to tap the potential of smart electric-vehicle
charging to benefit the grid, utility customers, and the utilities’ bottom line • The Clean Fuels Program offers a unique opportunity to provide participants incentives
for chargers and management of the chargers

Questions?

PHEV Expected to be the Most Popular Platform