Embed Size (px)
Citation preview

OREGON BUSINESS DEVELOPMENT DEPARTMENT
Annual Performance Progress Report (APPR) for Fiscal Year (2014-2015)
Original Submission Date: 2015
Finalize Date: 9/30/2015

2014-2015 Approved Key Performance Measures (KPMs)2014-2015
KPM #
Number of jobs created 1
Number of jobs retained 2
Personal income tax generated by the Department’s investment in jobs 3
New export sales of assisted clients 4
Number of federal contracts awarded to Oregon businesses receiving Government Contract Assistance Program assistance.a 5
Total dollar amount of federal contracts awarded to Oregon Businesses receiving Government Contract Assistance Program assistance.b 5
Number of new industrial sites/acres certified "project ready." 6
Number of community capital projects assisted for planning (infrastructure, community and organizational). 7
Number of community capital construction financing projects that address public health and safety issues. 8
Number of community capital construction financing projects that assist with future economic and community development. 9
Percent of customers rating their satisfaction with the agency's customer service as "good" or "excellent": overall, timeliness, accuracy,
helpfulness, expertise, availability of information.
10

Proposed Key Performance Measures (KPM's) for Biennium 2015-2017New
Delete
Title:
Rationale:
Business Oregon works to create, retain, expand and attract businesses that provide sustainable, living-wage jobs for Oregonians through
public-private partnerships, leveraged funding and support of economic opportunities for Oregon companies and entrepreneurs.
OREGON BUSINESS DEVELOPMENT DEPARTMENT I. EXECUTIVE SUMMARY
Agency Mission:
503-986-0036Alternate Phone:Alternate: Mindee Sublette
Lisa Ansell, Project Manager/Tribal RelationsContact: 503-986-0039Contact Phone:
Green
Pending
Red
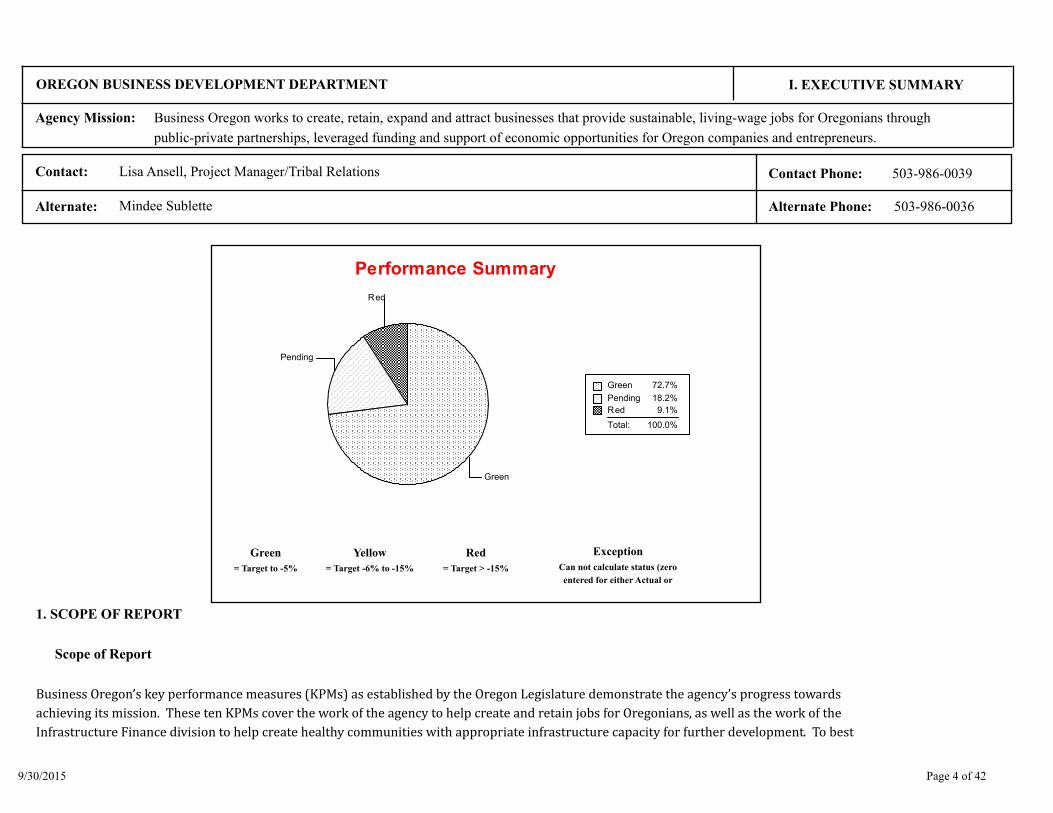
Green 72.7%
Pending 18.2%
Red 9.1%
Total: 100.0%
Performance Summary
Green
= Target to -5%
Exception
Can not calculate status (zero
entered for either Actual or
Red
= Target > -15%
Yellow
= Target -6% to -15%
1. SCOPE OF REPORT
Scope of Report
Business Oregon’s key performance measures (KPMs) as established by the Oregon Legislature demonstrate the agency’s progress towards
achieving its mission. These ten KPMs cover the work of the agency to help create and retain jobs for Oregonians, as well as the work of the
Infrastructure Finance division to help create healthy communities with appropriate infrastructure capacity for further development. To best
Page 4 of 429/30/2015

achieve its mission, Business Oregon will focus service delivery in these six areas:
Business retention, expansion and recruitment
Innovation and entrepreneurship
Infrastructure finance
Global trade
Access to capital
Research
2. THE OREGON CONTEXT
Business Oregon plays a vital role in achieving the Oregon Shines Vision II of 1) Quality jobs for all Oregonians; 2) Safe, caring and engaged communities; and
3) Healthy, sustainable surroundings.
All KPMs relate directly to the Oregon Benchmarks (OBM): KPM 1: OBM 1, 3, 4, 6, 7a, 8, 12, 15, 29; KPM 2: OBM 1, 15; KPM 3: OBM 4, 12, 15; KPM
4: OBM 2, 6, 16; KPM 5: OBM 1, 15; KPM 6: OBM: 1, 2, 3, 4, 6, 10, 11, & 15; KPM 7: OBM 1, 3, 10b, 32, 69; KPM 8: OBM 1, 3, 10b, 69; KPM 9: 1,
3, 32; KPM 10: OBM 35
Additional Related Oregon Benchmarks: OBM 7: Research and Development; OBM 8: Venture Capital; OBM 9: Cost of Doing Business; OBM 10: On-time
Permits; OBM 12: Pay Per Worker; OBM 13: Income Disparity; OBM 14: Workers at 150% or More of Poverty.
Agency Partners in Related Work: Employment Department, Community Colleges and Workforce Development, as well as the departments of State Lands, Land
Conservation and Development, Transportation, Environmental Quality, Human Services, Agriculture, Housing and Community Services and Energy.
3. PERFORMANCE SUMMARY
For KPM 1, Business Oregon investments helped create 2,214 jobs in Oregon in FY 2015, exceeding the 2,000 target, an increase of 192 jobs from FY 2014.
The 2,214 jobs created reflect those investments from the Strategic Reserve Fund, Business Expansion Program, Business Finance programs, and Oregon
Page 5 of 429/30/2015
Innovation Council.
For KPM 2, Business Oregon investments helped retain 6,677 jobs in Oregon in FY 2015, exceeding the 5,000 target, an decrease of 34 jobs from FY 2014.
The 6,677 jobs retained reflect investments from the Strategic Reserve Fund, Business Expansion Program, Business Finance programs, and Oregon Innovation
Council.
For KPM 3, in FY 2015, businesses assisted by Business Oregon generated an estimated $29.5 million in state personal income taxes, which exceeded the $18.5
million target.
For KPM 4, documented export sales hit $115.9 million in FY2015, exceeding the target of $18.5 million. This number includes immediate and expected export
sales reported by companies receiving export assistance from Business Oregon.
For KPM 5, an E-Board action in September 2014 approved a change for this key performance measure. The change takes effect in fiscal year 2016.
For KPM 6, the target for FY 2015 was 5 new certified industrial lands sites. Business Oregon surpassed the target as 6 sites were certified, with a total acreage
of 788.
For KPM 7, the department awarded 336 projects and exceeded the goal of 30 projects for the fiscal year, an increase of 7 projects from FY 2014.
For KPM 8, the department met and exceeded its target having funded 21 projects, one more project than the set target, however 5 fewer projects from FY
2014.
For KPM 9, the department missed its target of 25 projects by committing funding to 16 projects in FY 2015, which is one less project than in FY 2014.
For KPM 10, the department met or exceeded the set targets in three of the categories: helpfulness, expertise and information accuracy. Business Oregon nearly
met the targets in the categories of overall satisfaction with agency services. In the category of timeliness and availability of information the department was five and
four percent, respectively, below the target.
4. CHALLENGES
Business Oregon faces a number of challenges: lower household incomes with a median income of $50,000 lags the U.S. average by 5% and the state of
Washington by 18%; workforce gaps with the nation?s second-highest high school dropout rate; and uneven economic recovery with Portland and Bend areas
growing fast and attracting the talent while rural Oregon faces continued challenges, particularly with the decline in natural resource employment.
Page 6 of 429/30/2015

The department recognizes these challenges and looks for ways to improve and better the state?s economic standing. The Infrastructure Finance division is
addressing the need for additional projects for schools and emergency providers through the addition of funds to the Seismic Rehabilitation Program . The
department continues to work with existing Oregon companies to help retain and create jobs that generate critical revenues for the state, with a focus on high-wage
jobs. In addition, the department continues to capitalize on opportunities to supplement its funding stream by applying for federal grants where appropriate to assist
business growth and retention and create opportunities for businesses to export goods and services, as well as utilizing new tools to help address some of the
challenges noted above.
5. RESOURCES AND EFFICIENCY
Business Oregon created a new Innovation & Entrepreneurship division to recognize the critical role that startups and small businesses play in our economy.
This new division received permanent funding for the Oregon Innovation Council, which invests in three Signature Research Centers and four innovation
initiatives. This division also received $500,000 for the Oregon Growth Fund to support small business? access to capital. The division is responsible for
producing an Oregon Innovation Plan by December 31, 2015.
The Infrastructure Finance division received funding to recapitalize programs that support school safety, public works, brownfields and levees. The Seismic
Rehabilitation Grant program received $205 million, $175 million to stabilize school buildings and $30 million for emergency service buildings. The Special Public
Works Fund received a $13 million recapitalization, Brownfields received a $7 million recapitalization and the new levee program received $5 million.
We also received additional capacity in programs critical to our ?Grow Our Own? economic development strategy. Those positions are an international trade
specialist; the Oregon Growth Board executive director; a regional infrastructure coordinator; a research analyst; an Oregon Cultural Trust office manager; and a
public arts coordinator.
To become more efficient, Business Oregon continues to pursue a number of projects. The Infrastructure Finance division continues is LEAN project and the
Office of Minority, Women, Emerging Small Business is now working on its own LEAN program. We have also migrated to DAS servers, use Skype and other
teleconference technologies to reduce travel costs and improved coordination with Regional Solutions and other state agencies.
Page 7 of 429/30/2015

OREGON BUSINESS DEVELOPMENT DEPARTMENT II. KEY MEASURE ANALYSIS
Number of jobs createdKPM #1 2004
Promote a favorable investment climate to strengthen businesses, create jobs and raise real wages. Improve national and global
competitiveness of Oregon companies.
Goal
Oregon Context Oregon Benchmarks: 1 - Employment in Rural Oregon; 3 - New Employers; 4 - Net Job Growth; 6 - Economic Diversification; 7a -
Research and Development; 8 - Venture Capital Investments; 12 - Pay Per Worker; 15 - Unemployment; 29 - Labor Force Skills Training.
The primary data source is the covered employment and wage data from the Oregon Employment Department. Employment numbers and
wages are analyzed for each business that received financial assistance and directly benefited in job creation efforts .
Data Source
Economist, Michael Meyers, (503) 229-6179, [email protected] Owner
0
1000
2000
3000
4000
5000
6000
2008 2009 2010 2011 2012 2013 2014 2015 2016 2017
3538
15592005 1957
1510 1732 2022 2214
Bar is actual, line is target
Total jobs created
Data is represented by number
1. OUR STRATEGY
Business Oregon works with businesses, communities, state agencies and other economic development partners to conduct the following
Page 8 of 429/30/2015

OREGON BUSINESS DEVELOPMENT DEPARTMENT II. KEY MEASURE ANALYSIS
activities: retain and create jobs, recruit new investment to the state and support innovation and research.
2. ABOUT THE TARGETS
The job creation target is set by forecasting when jobs created by projects are likely to appear over the five year job counting cycle. The
forecast is based on historical job creation trends of Business Oregon programs, including an analysis of past five year cycles and when
jobs created appeared in each year. The following percentages were used for the 2013-15 Biennium to forecast when expected jobs
would be created for all projects: Year 1= 20%, Year 2= 20%, Year 3= 30%, Year 4= 20%, Year 5= 10%. These percentage are also applied
to future projects forecasted for the department over the next biennium. Future projects are forecasted based on proposed program
budgets, average cost per job analysis, job creation trends, current and forecasted economic conditions, and any policy changes that are
expected to impact job creation. The Department partnered with LFO to establish a target of 2,000 jobs for fiscal years 2014 and 2015.
3. HOW WE ARE DOING
Business Oregon funds helped create 2,214 jobs in Oregon in FY 2015, surpassing the target of 2,000 jobs created. The 2,214 jobs created
reflect investments from the Strategic Reserve Fund, Business Expansion Program, Business Finance programs, and Oregon Innovation
Council.
4. HOW WE COMPARE
In FY 2015, the number of jobs created increased by 192 jobs from FY 2014, an increase of 9.5 percent.
5. FACTORS AFFECTING RESULTS
Job creation from businesses funded by Business Oregon continued to increase in FY 2015, just as it did in FY 2014, although at a slower
pace. Oregon's economy and employment grew at a faster-than-average rate over FY 2015, which helped push job creation over the
target for FY 2015.
6. WHAT NEEDS TO BE DONE
Business Oregon continues to focus efforts by prioritizing the investments and delivery of services with growing traded-sector businesses
across the state to create and retain jobs. These industries have the best potential for job growth, high wage jobs and bringing new
Page 9 of 429/30/2015
OREGON BUSINESS DEVELOPMENT DEPARTMENT II. KEY MEASURE ANALYSIS
dollars into the economy. The department continues to form critical partnerships with cities and regional economic development groups
to help serve existing business and to recruit major employers to the state.
7. ABOUT THE DATA
Covered employment and wage data from the Oregon Employment Department was analyzed to calculate KPM #1. Jobs created by
businesses funded by Business Oregon are from FY 2015 only. All jobs are defined and counted using a full-time equivalency of 1,820
hours worked a year.
Page 10 of 429/30/2015

OREGON BUSINESS DEVELOPMENT DEPARTMENT II. KEY MEASURE ANALYSIS
Number of jobs retainedKPM #2 2004
Promote a favorable investment climate to strengthen businesses, create jobs and raise real wages. Improve national and global
competitiveness of Oregon companies.
Goal
Oregon Context Oregon Benchmarks: 1 - Employment in Rural Oregon; 15 - Unemployment.
The primary data source is the covered employment and wage data from the Oregon Employment Department. Employment numbers and
wages are analyzed for each business that received financial or technical assistance and directly benefited in job retention efforts .
Data Source
Economist, Michael Meyers, (503) 229-6179, [email protected] Owner
0
1000
2000
3000
4000
5000
6000
7000
8000
2008 2009 2010 2011 2012 2013 2014 2015 2016 2017
3169
60605035
3760
49985974
6711 6677
Bar is actual, line is target
Total Jobs Retained
Data is represented by number
1. OUR STRATEGY
Business Oregon works with businesses, communities, state agencies and other economic development partners to conduct the following
Page 11 of 429/30/2015

OREGON BUSINESS DEVELOPMENT DEPARTMENT II. KEY MEASURE ANALYSIS
activities: retain and create jobs, recruit new investment to the state and support innovation and research.
2. ABOUT THE TARGETS
The job retention target is set by summing expected jobs retained by all current projects for remaining years in their five year job counting cycle , and by
forecasting future jobs retained based on historical trends and proposed program budgets. The Department counts a job as retained each year it exists, up to
five years after the investment was made. The forecast assumes that projects maintain 100 percent of their job retention targets. The Department partnered
with LFO to establish a target of 5,000 jobs for fiscal years 2014 and 2015.
3. HOW WE ARE DOING
Business Oregon funds helped retain 6,677 jobs in Oregon in FY 2015, surpassing the target of 5,000 jobs retained. The 6,677 jobs
retained reflect investments from the Strategic Reserve Fund, Business Expansion Program, Business Finance programs, and Oregon
Innovation Council.
4. HOW WE COMPARE
In FY 2015, the number of jobs retained decreased by 34 jobs from FY 2014, an decrease of 0.5 percent.
5. FACTORS AFFECTING RESULTS
Job retention from businesses funded by Business Oregon was 34 percent higher than the FY 2015 job retention target. The main factor
that led to FY 2015’s higher than expected job retention was the approval of a Business Expansion Program project in FY 2014 that
included larger than normal job retention.
6. WHAT NEEDS TO BE DONE
Business Oregon first supports the retention and expansion of existing Oregon traded-sector businesses. Efforts are focused on
traded-sector businesses across the state to create and retain jobs. These industries have the best potential for job growth, high wage
jobs and bringing new dollars into the economy. Oregon Innovation Plan is critical for Oregon companies to access research and
development assets and to enhance the state’s global competitiveness. The department also evaluates its programs against its main
competitors, both geographically and by industry, to ensure the state is best positioned to realize economic opportunities when they are
Page 12 of 429/30/2015

OREGON BUSINESS DEVELOPMENT DEPARTMENT II. KEY MEASURE ANALYSIS
encountered.
7. ABOUT THE DATA
Covered employment and wage data from the Oregon Employment Department was analyzed to calculate KPM #2. Jobs retained by
businesses funded by Business Oregon are from FY 2015 only. All jobs are defined and counted using a full-time equivalency of 1,820
hours worked a year.
Page 13 of 429/30/2015

OREGON BUSINESS DEVELOPMENT DEPARTMENT II. KEY MEASURE ANALYSIS
Personal income tax generated by the Department’s investment in jobsKPM #3 2008
Promote a favorable investment climate to strengthen businesses, create jobs and raise real wages. Improve national and global competitiveness of
Oregon companies.Goal
Oregon Context Oregon Benchmarks: 4 Net Job Growth; 12 - Pay Per Worker; 15 Unemployment.
The primary data source is the covered employment and wage data from the Oregon Employment Department and effective tax rate data
from the Oregon Department of Revenue. Employment and wages are analyzed for each business that received financial or technical
assistance and directly benefited in job creation or retention efforts.
Data Source
Economist, Michael Meyers (503) 229-6179, [email protected] Owner
0
4000000
8000000
12000000
16000000
20000000
24000000
28000000
32000000
2008 2009 2010 2011 2012 2013 2014 2015 2016 2017
6190000
1720000018900000
1390000015937747
22800000
2830000029500000
Bar is actual, line is target
State Income Tax Revenue
Data is represented by currency
1. OUR STRATEGY
Page 14 of 429/30/2015

OREGON BUSINESS DEVELOPMENT DEPARTMENT II. KEY MEASURE ANALYSIS
Promote a favorable investment climate to strengthen businesses, create and retain jobs, and raise real wages.
2. ABOUT THE TARGETS
This measure estimates state personal income tax generated by jobs created and retained from existing projects. Average annual wages
are calculated for existing projects and the corresponding effective tax rates from the Oregon Department of Revenue are applied to
these wages for all jobs created and retained for each project. Estimates of state personal income tax to be generated by future projects
are calculated by applying a forecasted annual average wage to jobs forecasted to be created and retained over the next biennium. The
target for this measure was $18.5 million in FY 2015.
3. HOW WE ARE DOING
In FY 2015, jobs created and retained by businesses funded by Business Oregon generated an estimated $29.5 million in state personal income tax revenue,
exceeding the target of $18.5 million. The $29.5 million in state personal income tax revenue reflect investments from the Strategic Reserve
Fund, Business Expansion Program, Business Finance programs, and Oregon Innovation Council.
4. HOW WE COMPARE
In FY 2015, estimated state personal income tax revenue from job creation and retention was $1.2 million higher than FY 2014, an
increase of 4.1 percent.
5. FACTORS AFFECTING RESULTS
The combined jobs created and retained in FY 2015 were higher than in FY 2014. Aided by positive wage growth in Oregon's economy in FY 2015, the
result was the generation of more state personal income tax revenue in FY 2015.
6. WHAT NEEDS TO BE DONE
Business Oregon will continue to work with Oregon businesses to retain and create jobs, particularly jobs above average wages
throughout the state, thus generating a significant return back to the general fund in tax revenues.
Page 15 of 429/30/2015

OREGON BUSINESS DEVELOPMENT DEPARTMENT II. KEY MEASURE ANALYSIS
7. ABOUT THE DATA
Covered employment and wage data from the Oregon Employment Department and effective tax rate data from the Oregon Department
of Revenue were analyzed to calculate KPM #3. Estimated state personal income tax revenue is from FY 2015 only. Effective tax rates are
taken from the most recent, published Oregon Personal Income Tax Statistics report, and represents tax as a percent of adjusted gross
income for the appropriate average wage at each business.
Page 16 of 429/30/2015

OREGON BUSINESS DEVELOPMENT DEPARTMENT II. KEY MEASURE ANALYSIS
New export sales of assisted clientsKPM #4 2004
Improve national and global competitiveness of Oregon companies.Goal
Oregon Context Oregon Benchmarks: 2 - Trade Outside of Oregon; 6 - Economic Diversification; 16 - Exports.
Companies report sales data to Business Oregon’s Global Trade Team.
Data Source
Assistant Director Business Development, Samantha Julian 971-221-3609
Owner
0
20000000
40000000
60000000
80000000
100000000
120000000
2008 2009 2010 2011 2012 2013 2014 2015 2016 2017
235826382220000019900000154839235590000
22270000
87700000
115900000
Bar is actual, line is target
New export sales of assisted clients (in millions of dollars)
Data is represented by currency
1. OUR STRATEGY
Working with private and public sector partners, the department's strategy is to promote international exports, helping Oregon companies increase revenues by
Page 17 of 429/30/2015

OREGON BUSINESS DEVELOPMENT DEPARTMENT II. KEY MEASURE ANALYSIS
selling goods to foreign markets. The Global Trade team of Business Oregon:
· provides technical assistance through export-specific expertise of its staff;
· provides market support through foreign representatives in China, Japan, South Korea and the European Union;
· helps Oregon companies attend foreign trade shows and missions via two separate grant programs;
· supports Oregon companies selling products into foreign markets through leveraging partnerships with the federal Softwood Export Council and the federal
Export-Import Bank; and
· assists Oregon companies in foreign markets by leveraging partnerships with other international trade-focused organizations such as the US-Saudi Arabia
Business Council, the Japanese American Society of Oregon, the District Export Council of Oregon, and others.
2. ABOUT THE TARGETS
“Assisted sales” refers to immediate and expected export sales reported by Oregon business clients of the department's Global Strategies team. The measure
targets growth of revenues to the state via international trade and reflects efforts to promote exports of Oregon goods and services by Oregon?s
Small-to-Medium Enterprises (SME). The export sales target for FY 2015 is $18.5 million. The export sales target for FY 2013 is $17 million.
3. HOW WE ARE DOING
Documented export sales hit $115.9 million in FY 2015, exceeding the target of $18.5 million. This number includes immediate and expected export sales reported
by companies receiving export assistance from Business Oregon.
Business Oregon helps Oregon SMEs (up to 500 employees) grow revenue through export sales, which also diversifies their customer base. In FY 2015, Business
Oregon continued to track and report sales in detail by the type of assistance provided. This comprehensive reporting process helps track the number and type of
companies assisted, as well as immediate and future sales growth. Reports from the assisted companies back to Business Oregon also track the number of sales
leads, potential agents, distributors and licensees met as a result of participating in a Business Oregon supported trade event.
In FY 2015, Business Oregon continued to utilize both a state-funded export grant program? the Oregon Trade Promotion Program (OTPP)?and a federally-funded export
grant program?the State Trade Export Promotion program (STEP)?to help companies attend international trade events. In FY 2015, OTPP and STEP grantees reported
$114.8 million in immediate and expected export sales as a result of their OTPP/STEP-funded activities. Technical assistance and additional in-market support provided
by Business Oregon staff and overseas consultants led to additional sales of $817,000 reported export sales by Oregon companies.
In FY 2015, Business Oregon continued to work with the Softwood Export Council (SEC). Through our membership to the SEC, Oregon forest and wood products
companies can attend SEC-led international trade shows and trade missions and receive financial assistance from the SEC. The Oregon forest and wood products
companies that attended Business Oregon/SEC supported shows and missions in FY 2015 reported total sales of $275,000.
Page 18 of 429/30/2015

OREGON BUSINESS DEVELOPMENT DEPARTMENT II. KEY MEASURE ANALYSIS
Additionally, but not included in the KPM 4 calculation, Business Oregon continues to work closely with the Export- Import Bank of the USA (Exim Bank). Business
Oregon is an official state partner to Exim Bank. Business Oregon helps with recruiting and promoting Exim Bank?s export financing services to Oregon SMEs.
Throughout the year Business Oregon staff visit companies across the state together with Exim Bank representatives to introduce services to potential Oregon
customers. Services such as export finance insurance and working capital help Oregon companies make foreign sales they may have otherwise forgone due to concerns
of not getting paid, or not being able to finance an order. For FY 15, Exim Bank reported export sales exceeding $50 million in value by Oregon companies as a result of
their programs paired with Business Oregon assistance. While Business Oregon does not claim credit for direct assistance leading to export sales for companies using
Exim Bank programs, the department provides the outreach, introductions, referrals and connections that make these resources available to many Oregon companies
4. HOW WE COMPARE
According to Wiser Trade data Oregon had $20.9 billion in export sales in 2014. This figure represents an impressive increase of 12% compared to 2013. The growth
in Oregon exports can be attributed to a 21% increase in exports of computer and electronics, a 50% increase in exports of transportation equipment (the Port of
Portland is now utilized as an export hub of US-made cars to Asian markets), and increases of exports of various other commodities. Generally speaking, 2014 was
a banner year for Oregon exports ? which helps explain the amount of immediate and expected export sales reported by grantees of the two export promotion grants
the department offers. There is no comparable figure obtainable from a third-party, and comparisons to other states cannot be made because of the unique
methodologies that are applied by peer organizations relative to sales reporting, industry definitions, and types of direct service and partner programs provided.
5. FACTORS AFFECTING RESULTS
Over the last few years, demand for the department?s services, connections, trade promotion opportunities, and export grants continue to
increase. The entire scope of the department?s activities serves to demonstrate the important economic value of these services and
relationships to Oregon businesses. It should be noted that direct assistance to those companies seeking to grow their exports may not
always lead to immediate sales or sales opportunities. Often, attendance at an international trade event is only the first step that will only
eventually lead to export sales.
6. WHAT NEEDS TO BE DONE
We are making continuous improvements in how we track and report on the assistance provided , and the resulting sales generated. FY 2015 continued the
implementation of more detailed reporting requirement by companies receiving trade promotion grants, such as reporting the amount of sales immediately generated
vs. the amount of sales expected; as well as the number of sales leads, potential agents, distributors and licensees met as a result of participating in a Business
Oregon subsidized trade event or of having received technical assistance. Business Oregon staff follows up with companies 6 and 12 months after a supported export
promotion activity to inquire about additional, and not previously reported, immediate and expected export sales. In the future, it will be worth considering adding the
number of companies supported with export grants, technical assistance or otherwise as one of the additional measures of the department?s delivery of export
services to Oregon?s SMEs.
Page 19 of 429/30/2015

OREGON BUSINESS DEVELOPMENT DEPARTMENT II. KEY MEASURE ANALYSIS
7. ABOUT THE DATA
The data is based on the reported sales of businesses receiving assistance from our programs during the fiscal year. Ex-Im Bank sales figures are reported directly
by the Ex-Im Bank staff – San Francisco office – once a finance package has been finalized .
Page 20 of 429/30/2015

OREGON BUSINESS DEVELOPMENT DEPARTMENT II. KEY MEASURE ANALYSIS
Number of federal contracts awarded to Oregon businesses receiving Government Contract Assistance Program assistance .KPM #5a 2015
Goal
Oregon Context
Data Source
Owner
0
40
80
120
160
200
2016 2017
Bar is actual, line is target
Total Amount of Federal Contracts Awarded through
services provided by GCAP
Data is represented by currency
1. OUR STRATEGY
Page 21 of 429/30/2015

OREGON BUSINESS DEVELOPMENT DEPARTMENT II. KEY MEASURE ANALYSIS
2. ABOUT THE TARGETS
3. HOW WE ARE DOING
4. HOW WE COMPARE
5. FACTORS AFFECTING RESULTS
6. WHAT NEEDS TO BE DONE
7. ABOUT THE DATA
An E-Board action in September of 2014 approved a change in this Key Performance Measure. The change takes effect in fiscal year 2016.
Page 22 of 429/30/2015

OREGON BUSINESS DEVELOPMENT DEPARTMENT II. KEY MEASURE ANALYSIS
Total dollar amount of federal contracts awarded to Oregon Businesses receiving Government Contract Assistance Program
assistance.
KPM #5b 2008
Goal
Oregon Context
Data Source
Owner
-6
-4
-2
0
2
4
6
2016 2017
Bar is actual, line is target
Percentage still in business four years after assistance
Data is represented by percent
1. OUR STRATEGY
Page 23 of 429/30/2015

OREGON BUSINESS DEVELOPMENT DEPARTMENT II. KEY MEASURE ANALYSIS
2. ABOUT THE TARGETS
3. HOW WE ARE DOING
4. HOW WE COMPARE
5. FACTORS AFFECTING RESULTS
6. WHAT NEEDS TO BE DONE
7. ABOUT THE DATA
An E-Board action in September of 2014 approved a change in this Key Performance Measure. The change takes effect in fiscal year 2016.
Page 24 of 429/30/2015

OREGON BUSINESS DEVELOPMENT DEPARTMENT II. KEY MEASURE ANALYSIS
Number of new industrial sites/acres certified "project ready."KPM #6 2004
Assist Oregon communities to build capacity to retain, expand and attract businesses.Goal
Oregon Context Oregon Benchmarks: 1, 2, 3, 4, 6, 10, 11, & 15; most applicable are 3 - New Employers; 4 Net Job Growth; 6 - Economic Diversification.
Business Oregon maintains data demonstrating that each certified site is ready for development within 180 days.Data Source
Business Oregon, Sierra Gardiner (503) 689-0119 Owner
0
2
4
6
8
10
12
14
2008 2009 2010 2011 2012 2013 2014 2015 2016 2017
14
5
1
5
2 2
9
6
Bar is actual, line is target
Number of new industrial sites certified
Data is represented by number
1. OUR STRATEGY
Industrial site certification prepares industrial land for swift development into employment uses, helping communities attract new employers, retain or expand existing
Oregon businesses, generate property and income tax revenue, and revitalize dilapidated or underutilized industrial areas. Industrial site certification has benefited
Oregon in two major areas: 1) as a proven recruitment tool for business development; and 2) as an effective program that assists communities to plan for future
Page 25 of 429/30/2015

OREGON BUSINESS DEVELOPMENT DEPARTMENT II. KEY MEASURE ANALYSIS
development and growth.
Site certification is attractive to companies or site developers that are looking to develop quickly on sites with minimal, or at least well-documented barriers to
development. Site certification helps inform participants about the rigorous demands of land entitlement and development and serves as a planning tool, helping
communities better understand the quantity and the quality of their current stock of industrial/employment land.
While the industrial site certification program is administered by Business Oregon, readying industrial sites for "project ready" certification is a collaborative multi-agency
process with various state and local contributors. The department' s state partners include Oregon Department of Transportation (ODOT), State Historic Preservation
Office (SHPO), Department of Land Conservation and Development (DLCD), and Department of Environmental Quality (DEQ), to name a few. These partnering agencies
provide important policy guidance by participating in the certification processes as well as gain insight into how current policies impact the state's economic
development efforts. Private property owners, local tribes, and local non-profit organizations are also key partners in the department' s certification efforts.
2. ABOUT THE TARGETS
Industrial site development in the state of Oregon is largely predicated on the state of the global economy and real estate trends. Therefore, owner interest in the site
certification has varied over the years; varying from three to nine new applications for certification per year. Since the inception of this program over 190 sites have
started the certification process (86 of which are certified). Many of the sites not certified require additional time and money to meet minimum qualification standards
for the certification program. Most of the sites in Oregon that were easier to certify have already been certified and many sites were sold. Sites remaining in the
process of certification require more staff time, community support, and additional funds for remediation or engineering reports.
3. HOW WE ARE DOING
·6 new certifications with a total acreage of 788
· 18 decision-ready sites approved
·6 re-certifications completed
·Regional Solutions Centers (RSCs) have agreed to prioritize sites for certification through an Action Plan template
·The site certification program was completely modernized to better serve both our external and interagency customers
·The decision ready program has been replaced by the pre-certification program to streamline the intake process
·The pool of third-party verifiers was expanded and will be expanded again
· A new marketing campaign has been launched to serve the presently certified sites
· ? This year, staff will focus on migrating the sites from the old program to the new program by January 2016
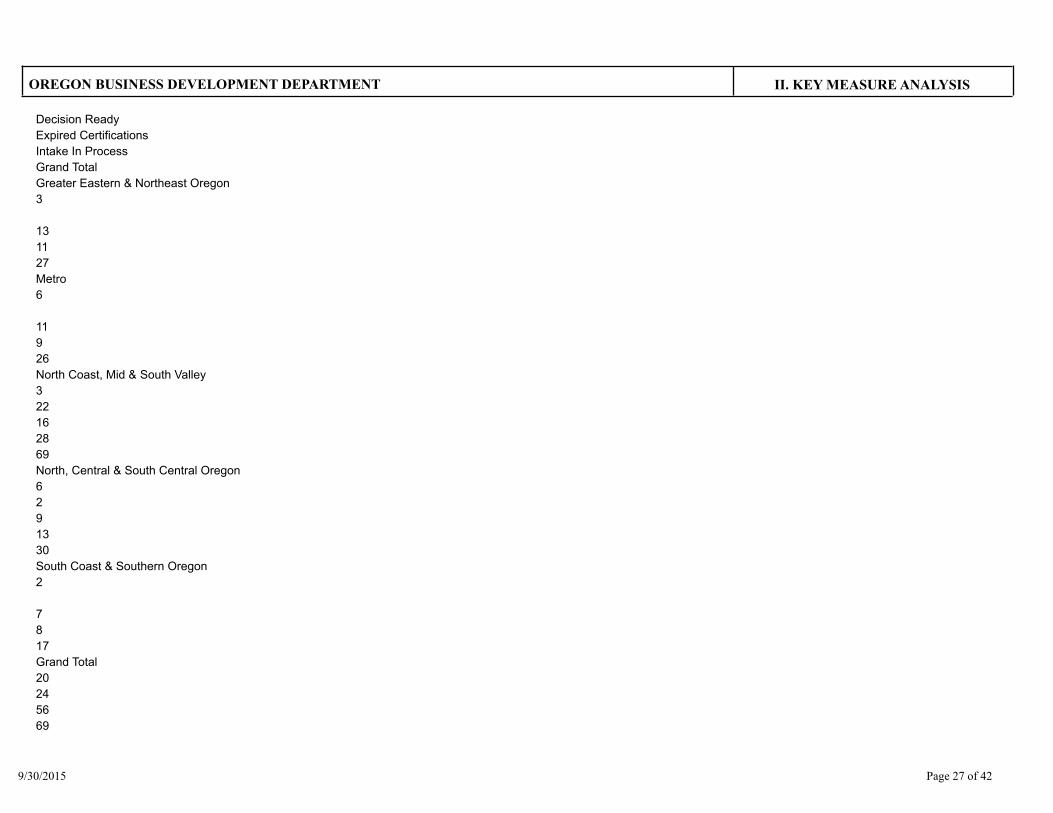
RST Region
Active Certifications
Page 26 of 429/30/2015
OREGON BUSINESS DEVELOPMENT DEPARTMENT II. KEY MEASURE ANALYSIS
Decision Ready
Expired Certifications
Intake In Process
Grand Total
Greater Eastern & Northeast Oregon
3
13
11
27
Metro
6
11
9
26
North Coast, Mid & South Valley
3
22
16
28
69
North, Central & South Central Oregon
6
2
9
13
30
South Coast & Southern Oregon
2
7
8
17
Grand Total
20
24
56
69
Page 27 of 429/30/2015

OREGON BUSINESS DEVELOPMENT DEPARTMENT II. KEY MEASURE ANALYSIS
169
4. HOW WE COMPARE
The Oregon Industrial Site Certification program is one of more than twenty such programs nationwide that has some level of state involvement. Program
requirements and state involvement vary widely by state. Many of these state programs were sponsored by electric utilities and focused on niche categories (i.e.
mega-sites). Oregon has the highest certification standards in the country, giving the program a greater amount of credibility in comparison to others. Industry
standards for developable industrial land are very high, with many companies demanding "shovel-ready" sites where they can break ground within 90 days or less. In
Oregon, sites are certified as "project-ready," meaning they can be developed within 180 days of lease or purchase.
5. FACTORS AFFECTING RESULTS
The current sites in the certification process are more constrained by physical, transportation, land use and market factors making them more difficult to meet
certification requirements. Limited options for funding and financing public infrastructure improvements remains a challenge for many of these sites and has delayed
certification.
6. WHAT NEEDS TO BE DONE
Business Oregon has dedicated more staff time to ensuring that the site that have entered the program are marketed global to their highest potential . In the following
year, staff will ensure that fliers and proper listings can be easily accessed for each site by both prospect employers and economic developers .
7. ABOUT THE DATA
Results represent sites certified within the fiscal year and since the program’s inception . The date of certification corresponds to the date on the certification letter
under the director's signature. For certification, each site needs to document that it is ready for development within 180 days of lease or purchase. Business Oregon
maintains notebooks in digital form for all the documentation and also works toward periodic recertification of the sites. Documentation and the sites are reviewed by
an independent consultant who recommends certification. Decision-ready sites are worked on with regional partners to identify and prepare sites for the certification
process.
Page 28 of 429/30/2015

OREGON BUSINESS DEVELOPMENT DEPARTMENT II. KEY MEASURE ANALYSIS
Number of community capital projects assisted for planning (infrastructure, community and organizational).KPM #7 2004
Assist Oregon coAssi.
Assist Oregon communities to build infrastructure capacity to address community facility, public health, safety and environmental compliance
issues as well as support communities’ ability to attract , retain, and expand businesses.
Goal
Oregon Context Oregon Benchmarks: 1 - Employment in Rural Oregon; 3 - New Employers; 10b - On Time Permits-Wastewater Discharge; 32 - Feeling of
Community; 69 - Drinking Water.
Each infrastructure project at the start is categorized by investment/activity type, including funding sources, by Business, Innovation and
Trade/Infrastructure Finance Authority staff and tracked in our database (Portfol).Data Source
Infrastructure Finance Authority, Lynn Schoessler (503 986-0158) Owner
0
10
20
30
40
50
2008 2009 2010 2011 2012 2013 2014 2015 2016 2017
4346
4137
24
33
26
33
Bar is actual, line is target
Number of community capital projects assisted for planning
Data is represented by number
Page 29 of 429/30/2015

OREGON BUSINESS DEVELOPMENT DEPARTMENT II. KEY MEASURE ANALYSIS
1. OUR STRATEGY
Assist communities with planning activities to build capacity to attract, retain and expand businesses; address public safety and environmental compliance issues;
develop community facilities; provide public infrastructure on a timely basis for community partners. Examples of partners in these infrastructure projects are: cities,
counties, ports, tribes, and special districts.
2. ABOUT THE TARGETS
Business Oregon proposed a target increase from 25 project awards to 30 project awards for FY 14. The increase was based upon increased funding for the program
and high FY 2013 demands for planning funds. The increased target was approved and remained at 30 for FY 15.
3. HOW WE ARE DOING
The department awarded 33 projects and exceeded its goal. This measure includes all Infrastructure Finance Authority funded planning projects . Examples of
planning projects would be plans for industrial lands for development and capital projects supporting community infrastructure and facilities such as wastewater
treatment, safe drinking water and community facilities. Publicly-owned industrial sites receive additional planning assistance for development to become certified as
"project-ready" and suitable for development within 180 days.
4. HOW WE COMPARE
The number of planning projects increased by 27%from 2014 levels. Project commitments remain stable at levels experienced before the municipal economic
downturn occurred. In 2010, 41 projects were awarded; 2011, 37 projects; 2012, 24 projects; 2013, 33 projects; 2014, 26 projects; and 2015, 33 projects. There is
limited data by which the department can evaluate its performance against other states conducting similar infrastructure-related activities. The department has a
unique set of resources and priorities, thereby making it difficult to prepare meaningful comparative analysis .
5. FACTORS AFFECTING RESULTS
The slight increase in planning projects could be interpreted as communities transitioning back to planning activities following the surge of health and safety
construction projects in 2014. It remains clear community apprehension over committing to necessary community projects during the economic downturn has
passed. Communities have acknowledged that their existing utility master plans are outdated and do not reflect the growth and development in communities which
occurred over the past 10 years. The steady demand for planning projects is complimented by the steady level of commitments for health and safety capital
Page 30 of 429/30/2015

OREGON BUSINESS DEVELOPMENT DEPARTMENT II. KEY MEASURE ANALYSIS
construction projects (KPM 8) and steady performance in economic/community development projects (KPM 9). Significant planning has occurred in the past few
years and communities are transitioning to capital projects that can no longer wait to be implemented. Prior delays in the very necessary updates to water and
wastewater plans are being addressed. Planning activity remains steady for many communities that still must address community infrastructure needs. These cities
recognize that in today?s competitive market for job creation, they need updated facilities with adequate capacity to respond to economic development opportunities.
6. WHAT NEEDS TO BE DONE
In March 2013, the League of Oregon Cities presented its survey of Oregon cities? infrastructure needs. Water and wastewater projects represented the greatest
infrastructure need, as 314 of these projects were pinpointed by city respondents. The total cost of those projects is more than $938 million. For this reason, the
department continues to pursue budget Policy Option Packages (POP) each biennium to recapitalize the Special Public Works Fund and the Water /Wastewater
Fund ? the chief sources of agency funding for infrastructure. Future agency budget POPs will continue to request that the legislature recapitalize these programs at
a $50 million level. The current budget provides $18 million toward SPWF recapitalization. A strong demand for water and wastewater infrastructure improvements is
expected to continue.
7. ABOUT THE DATA
Data is for the fiscal year. Projects are entered into the database upon funding commitment. Staff Regional Coordinators conduct final monitoring when projects are
complete and record results in the database.
Page 31 of 429/30/2015

OREGON BUSINESS DEVELOPMENT DEPARTMENT II. KEY MEASURE ANALYSIS
Number of community capital construction financing projects that address public health and safety issues.KPM #8 2009
Assist Oregon communities to build infrastructure capacity to address community facility, public health, safety and environmental compliance
issues as well as support communities’ ability to attract, retain, and expand businesses.
Goal
Oregon Context Oregon Benchmarks: 1 - Employment in Rural Oregon; 3 - New Employers; 10b- On Time Permits- Wastewater Discharge; 69 - Drinking
Water.
Each infrastructure project at the start is categorized by investment/activity type, including funding sources, by Oregon Business Development
Department/Infrastructure Finance Authority staff and tracked in our database (Portfol).
Data Source
Infrastructure Finance Authority, Lynn Schoessler (503) 986-0158 Owner
0
10
20
30
40
50
2010 2011 2012 2013 2014 2015 2016 2017
48
10
1722
2621
Bar is actual, line is target
Number of community capital projects that address water
quality and environmental health issues
Data is represented by number
1. OUR STRATEGY
Page 32 of 429/30/2015

OREGON BUSINESS DEVELOPMENT DEPARTMENT II. KEY MEASURE ANALYSIS
Assist communities to build capacity to address public safety and compliance related issues for water and wastewater infrastructure. Examples of partners in
these infrastructure projects are: cities, counties, ports, tribes and special districts.
2. ABOUT THE TARGETS
The targets address the Infrastructure Finance Division's progress in providing public infrastructure to address public health, safety and environmental compliance
issues and as a secondary benefit - economic growth. Business Oregon proposed a target increase from 15 project awards to 20 project awards due to the general
increase in program funding provided by the legislature. The increased target was approved and remained at 20 for FY 15.
3. HOW WE ARE DOING
The department met and exceeded its target having funded 21 projects, 1 more projects than the set target. The delays in critical upgrades to water and wastewater
infrastructure improvements brought on by the slow economy seem to have passed. The demand for project financing has been steady. Many communities have vital
health and safety improvement projects they are beginning to address having recognized that the economy has improved and they can wait no longer to make
system improvements.
4. HOW WE COMPARE
The department funded 48 projects in 2010; 10 projects in 2011; 17 in 2012; 20 in 2013; 26 in 2014; and 21 in 2015. This year?s 21 projects indicates project
commitments are holding steady at a level experienced before municipalities were hesitant to make investments in the economic downturn. Generally, the
department would compare its activities in this field with data from other states. However, there has been limited data by which the department can evaluate its
performance against other states. The agency utilizes its resources in ways different from other state 's thereby making comparison difficult for meaningful analysis .
The department will continue to evaluate the activities of other states to find those areas of commonality with those that administer similar programs with related
missions and outcomes.
5. FACTORS AFFECTING RESULTS
The need for municipal infrastructure construction remains high and the demand for financing is returning although funding commitments were only half the previous
fiscal year. The department invested over $50 million in construction projects for the purposes of public health, safety, or environmental compliance. The cost of each
project varies considerably but the size and scope of projects is lower this year and is a continuing reflection of the economic conditions. Delayed work on dated
infrastructure will result in increased project costs in the future.
6. WHAT NEEDS TO BE DONE
Page 33 of 429/30/2015

OREGON BUSINESS DEVELOPMENT DEPARTMENT II. KEY MEASURE ANALYSIS
The department has adopted a multi-biennium strategy to achieve a predictable and substantial loan pool for the next 20 years. The strategy responds to the
department?s goal of achieving a funded loan pool over the next six years. The annual resource goal for the IFA?s Infrastructure Funding Programs is to have
$85 million available each year for project financing. The revolving funds combined with the $20 million from two federal programs create the total funds the
department can offer to local communities. It should be noted that 65% of the federal funds are in the form of grants and do not contribute to the revolving
funds.
At present, $45 million is annually targeted from loan repayments based upon the current revolving loan pools and $65 million is committed to communities as $20
million in grants and $45 million in loans.
7. ABOUT THE DATA
Data is for the fiscal year. Projects are entered into the database upon funding commitment. Coordinators conduct final monitoring when projects are complete
and record results in the database.
Page 34 of 429/30/2015

OREGON BUSINESS DEVELOPMENT DEPARTMENT II. KEY MEASURE ANALYSIS
Number of community capital construction financing projects that assist with future economic and community development.KPM #9 2010
Assist Oregon communities to build infrastructure capacity to address community facility, public health, safety and environmental compliance
issues as well as support communities’ ability to attract, retain, and expand businesses.
Goal
Oregon Context Oregon Benchmarks: 1 - Employment in Rural Oregon; 3 - New Employers; 32 - Feeling of Community.
Each infrastructure project at the start is categorized by investment/activity type, including funding sources, by Oregon Business Development
Department/Infrastructure Finance Authority staff and tracked in our database (Portfol).
Data Source
Infrastructure Finance Authority, Lynn Schoessler (503) 986-0158 Owner
0
5
10
15
20
25
30
35
2011 2012 2013 2014 2015 2016 2017
15
32
2017 16
Bar is actual, line is target
Number of community capital projects that assist with
future economic and community development
Data is represented by number
1. OUR STRATEGY
Assist communities to build capacity to attract, retain and expand businesses; provide utilities and/or infrastructure improvements to industrial lands; advance
Page 35 of 429/30/2015

OREGON BUSINESS DEVELOPMENT DEPARTMENT II. KEY MEASURE ANALYSIS
ports' efforts to support economic development activities; improve community quality and attractiveness for business by providing community facilities; address
public safety and environmental compliance related issues; promote essential infrastructure capacity building. Examples of partners in these infrastructure
projects are: cities, counties, ports, tribes and special districts.
2. ABOUT THE TARGETS
Business Oregon proposed a target increase from 15 project awards to 25 project awards due to the general increase in program funding provided by the legislature.
The increased target was approved and remained at 25 for FY ?15. The target of 25 project awards addresses the department's progress in providing public
infrastructure (industrial land utilities, publicly owned structures for lease to business, public improvements that support business, roads, community buildings,
telecommunication, etc.) to help communities build public facilities and to support economic growth.
3. HOW WE ARE DOING
The department missed its target of 25 projects by committing funding to 16 projects. The demand for project funds seems to be shifting to health and safety projects
from economic development. This may be because during the economic downturn, the community focus was on creating facilities that increased jobs. Now attention
has returned to addressing health and safety needs (KPM 8).
4. HOW WE COMPARE
The 16 projects awarded in FY 2015 are less than the 17 projects awarded in FY 2014 and also less than the 22 awarded in 2013. Community focus on creating jobs
in the worst times of the municipal economic downturn seems to have spurred the past years? program interest. Generally, the department would compare its
activities in this field with data from other states. However, there has been limited data by which the department can evaluate its performance against other states.
The agency utilizes its resources in ways different from other state 's thereby making comparison difficult for meaningful analysis . The department will continue to
evaluate the activities of other states to find those areas of commonality with those that administer similar programs with related missions and outcomes.
5. FACTORS AFFECTING RESULTS
In general, the need for municipal infrastructure construction remains high and the demand for financing is rising due to the municipal demand to support business
opportunities. Most of the interest is for water and wastewater infrastructure projects for municipal capacity or service to industrial lands. The IFA increased its limit
on CDBG grants this past year because the lack of local funds for the balance of project costs has made it difficult for communities to begin moving projects to
construction.
6. WHAT NEEDS TO BE DONE
Page 36 of 429/30/2015
OREGON BUSINESS DEVELOPMENT DEPARTMENT II. KEY MEASURE ANALYSIS
The department has adopted a multi-biennium strategy to achieve a predictable and substantial loan pool for the next 20 years. The strategy responds to the
department?s goal of achieving a funded loan pool over the next six years. The annual resource goal for the IFA?s Infrastructure Funding Program is to have available
$85 million each year for project financing. The revolving funds combined with the $20 million from two federal programs to create the total funds the department can
offer to local communities. It should be noted that 65% of the federal funds are in the form of grants and do not contribute to the revolving funds.
At present, $45 million is annually targeted from loan repayments based up on the current revolving loan pool. $65 million is committed to communities as $20 million in
grants and $45 million in loans.
7. ABOUT THE DATA
Data is for the fiscal year. Projects are entered into the database upon funding commitment. Coordinators conduct final monitoring when projects are complete and
record results in the database.
Page 37 of 429/30/2015

OREGON BUSINESS DEVELOPMENT DEPARTMENT II. KEY MEASURE ANALYSIS
Percent of customers rating their satisfaction with the agency's customer service as "good" or "excellent": overall, timeliness, accuracy,
helpfulness, expertise, availability of information.
KPM #10 2006
To improve the delivery of services to the department's customersGoal
Oregon Context Oregon Benchmarks: 35 - Public Management Quality
Result of an on-line survey done every 2 yearsData Source
Strategic Services Section, Lisa Marie Ansell (503) 986-0039 Owner
0
20
40
60
80
100
Accuracy Availability ofInformation
Expertise Helpfulness Overall Timeliness
90
83 9
0
90
86
79
91
90 92
92 93
89
89 90 93
92
89
839
0
86 90 92
89
8590
90
90
90
90
90
2008
20102012
20132014
Target
Percent rating service good or excellent
1. OUR STRATEGY
Business Oregon seeks to improve the delivery of services to the customers. The services provided help businesses retain jobs while growing and attracting
sustainable businesses in Oregon. Additionally, the department’s services assist Oregon businesses to access global markets and build infrastructure capacity.
Three separate surveys are sent out on behalf of the three divisions: Business, Innovation and Trade (BITD), Infrastructure Finance Authority (IFA) and the
Page 38 of 429/30/2015

OREGON BUSINESS DEVELOPMENT DEPARTMENT II. KEY MEASURE ANALYSIS
Oregon Arts Commission/Cultural Trust (Arts). This enables each division to individually see customer satisfaction results in order to respond to their customer
needs.
2. ABOUT THE TARGETS
All state agencies share this KPM and the target of 90 percent of respondents who rank the department at “good” or “excellent” in the categories: overall satisfaction,
timeliness, accuracy, availability of information, expertise and helpfulness. Business Oregon provided its customers with an online questionnaire for their response in
FY 2014.
3. HOW WE ARE DOING
Collectively, the Customer Satisfaction Survey was emailed to more than 5,300 customers, using an online survey tool. On average all divisions received an excellent
or good rating for each question by the customers who completed the survey. BITD increased customer satisfaction in all categories, IFA decreased customer
satisfaction in all categories and Arts increased customer satisfaction in two categories . Overall customer satisfaction increased for BITD by 9%, decreased for IFA
by 9% and increased for Arts by 1%. Although participation in the surveys fall within acceptable ranges, participation was low overall.
The survey included questions, ranking Business Oregon on timeliness, helpfulness, expertise, availability of information, information accuracy and overall
satisfaction. The survey had a 9 percent response rate, which is a little lower than the typical response rate of 10 to 15 percent for external customer satisfaction
surveys done online without incentives. Customers were asked to rank their satisfaction on a 1 to 5 scale, 1 ranking as excellent.
The number of respondents who ranked OBDD as “good” or “excellent” in the target categories are as follows:
· Timeliness - 85%
· Helpfulness - 92%
· Expertise - 90%
· Availability of information - 86%
· Information accuracy - 90%
· Overall satisfaction with department services - 89%
The department met or exceeded the set targets in three of the categories: helpfulness, expertise and information accuracy. Business Oregon nearly met the target in
the category of overall satisfaction with department services. In the categories of timeliness and availability of information the department was five and four percent,
Page 39 of 429/30/2015

OREGON BUSINESS DEVELOPMENT DEPARTMENT II. KEY MEASURE ANALYSIS
respectively, below the target.
4. HOW WE COMPARE
The customer’s ranked the department the same or higher by two percent in four of the set target categories: overall satisfaction with department services, accuracy, helpfulness
and timeliness, in 2014 than in 2012. In the remaining two categories the department dropped by three to four percent from 2012 results. O verall, the department received more
ratings of excellent than good in the FY 2014 survey.
5. FACTORS AFFECTING RESULTS
Looking back over the last two years a number of factors could have resulted in the decrease of customer satisfaction for IFA in both timeliness and availability of
information. First, vacancies that resulted in staff turnover and a shift in Region responsibilities . Second, the Infrastructure Finance Authority broadened the eligibility
of activities for infrastructure program funds, which resulted in modified policies and quite possibly contributed to customer confusion. Third, Regional Solutions staff
time demands increased, which resulted in less time interacting directly with customers. And lastly, about the time of the survey several communities lost eligibility
for the Community Development Block Grant due to revised income eligibility figures being distributed; this action by HUD soured communities statewide on the IFA.
6. WHAT NEEDS TO BE DONE
The department will circulate the results internally and share the results with staff. Managers and employees will implement changes to increase customer
satisfaction, especially in the area of timeliness and availability of information. In addition, the department may want to eliminate the surveying of Cultural Trust
donors to get a better picture of how services are delivered.
To increase the response rate of the survey, managers will explore an alternative “real-time” survey, whereby surveys can be sent to customers’ right after having
an experience with the department. The results could be collected throughout the year and reported each fiscal year rather than biennially.
7. ABOUT THE DATA
The data used to measure this KPM was exported from an online survey tool into an excel spreadsheet. Customers who interacted with department employees within
the last two years were e-mailed and asked to participate in the online survey. The actual percentages of set target categories were calculated by taking the total
number of respondents divided by the number of respondents who answered “good” or “excellent.”
Page 40 of 429/30/2015
III. USING PERFORMANCE DATA
Agency Mission: Business Oregon works to create, retain, expand and attract businesses that provide sustainable, living-wage jobs for Oregonians through
public-private partnerships, leveraged funding and support of economic opportunities for Oregon companies and entrepreneurs.
OREGON BUSINESS DEVELOPMENT DEPARTMENT
503-986-0036Alternate Phone:Alternate: Mindee Sublette
Lisa Ansell, Project Manager/Tribal RelationsContact: 503-986-0039Contact Phone:
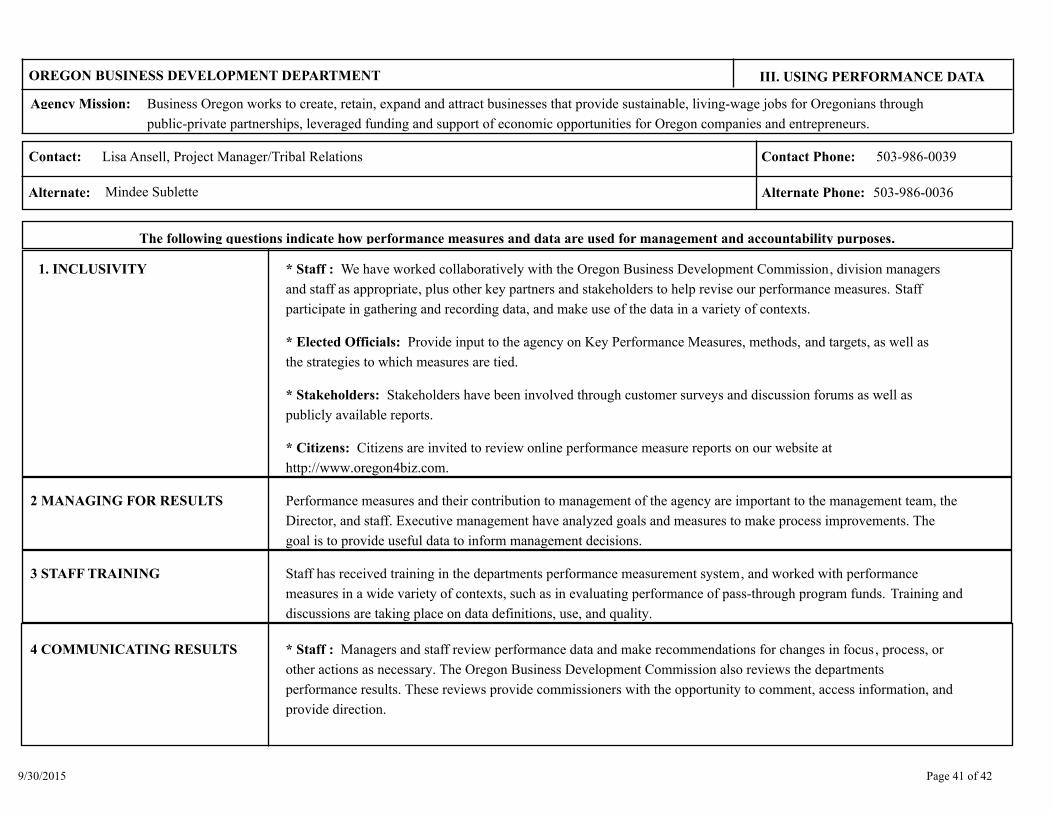
The following questions indicate how performance measures and data are used for management and accountability purposes.
* Staff : We have worked collaboratively with the Oregon Business Development Commission, division managers
and staff as appropriate, plus other key partners and stakeholders to help revise our performance measures. Staff
participate in gathering and recording data, and make use of the data in a variety of contexts.
1. INCLUSIVITY
* Elected Officials: Provide input to the agency on Key Performance Measures, methods, and targets, as well as
the strategies to which measures are tied.
* Stakeholders: Stakeholders have been involved through customer surveys and discussion forums as well as
publicly available reports.
* Citizens: Citizens are invited to review online performance measure reports on our website at
http://www.oregon4biz.com.
2 MANAGING FOR RESULTS Performance measures and their contribution to management of the agency are important to the management team, the
Director, and staff. Executive management have analyzed goals and measures to make process improvements. The
goal is to provide useful data to inform management decisions.
3 STAFF TRAINING Staff has received training in the departments performance measurement system, and worked with performance
measures in a wide variety of contexts, such as in evaluating performance of pass-through program funds. Training and
discussions are taking place on data definitions, use, and quality.
4 COMMUNICATING RESULTS * Staff : Managers and staff review performance data and make recommendations for changes in focus, process, or
other actions as necessary. The Oregon Business Development Commission also reviews the departments
performance results. These reviews provide commissioners with the opportunity to comment, access information, and
provide direction.
Page 41 of 429/30/2015

* Elected Officials: Results are posted online and are included in the agency request document for purposes of
accountability and informing the budget development process.
* Stakeholders: Results are posted online and used for information sharing.
* Citizens: Results are posted online and used for information sharing.
Page 42 of 429/30/2015


![[DE] Digital... Business, Transformation, Confusion & Chaos | Dr. Ulrich Kampffmeyer | Stuttgart 30.09.2015 | DOK.live-Session @ IT & Business](https://img.pdfslide.us/doc/110x75/563db8a6550346aa9a95a008/de-digital-business-transformation-confusion-chaos-dr-ulrich-kampffmeyer.jpg)