Embed Size (px)
Citation preview
Ordering of block copolymers and smectic elastomers
Citation for published version (APA):Lambreva, D. M. (2005). Ordering of block copolymers and smectic elastomers. Eindhoven: TechnischeUniversiteit Eindhoven. https://doi.org/10.6100/IR590417
DOI:10.6100/IR590417
Document status and date:Published: 01/01/2005
Document Version:Publisher’s PDF, also known as Version of Record (includes final page, issue and volume numbers)
Please check the document version of this publication:
• A submitted manuscript is the version of the article upon submission and before peer-review. There can beimportant differences between the submitted version and the official published version of record. Peopleinterested in the research are advised to contact the author for the final version of the publication, or visit theDOI to the publisher's website.• The final author version and the galley proof are versions of the publication after peer review.• The final published version features the final layout of the paper including the volume, issue and pagenumbers.Link to publication
General rightsCopyright and moral rights for the publications made accessible in the public portal are retained by the authors and/or other copyright ownersand it is a condition of accessing publications that users recognise and abide by the legal requirements associated with these rights.
• Users may download and print one copy of any publication from the public portal for the purpose of private study or research. • You may not further distribute the material or use it for any profit-making activity or commercial gain • You may freely distribute the URL identifying the publication in the public portal.
If the publication is distributed under the terms of Article 25fa of the Dutch Copyright Act, indicated by the “Taverne” license above, pleasefollow below link for the End User Agreement:www.tue.nl/taverne
Take down policyIf you believe that this document breaches copyright please contact us at:[email protected] details and we will investigate your claim.
Download date: 26. May. 2020

ORDERING OF BLOCK COPOLYMERS AND SMECTIC ELASTOMERS

ORDERING OF BLOCK COPOLYMERS AND SMECTIC ELASTOMERS
PROEFSCHRIFT
ter verkrijging van de graad van doctor aan de
Technische Universiteit Eindhoven, op gezag van de
Rector Magnificus, prof.dr.ir. C. J. van Duijn, voor een
commissie aangewezen door het College voor
Promoties in het openbaar te verdedigen
op dinsdag 7 juni 2005 om 17.00 uur
door
Denitza Mihailova Lambreva
geboren te Sofia, Bulgarije
Dit proefschrift is goedgekeurd door de promotoren: prof.dr.ir. W.H. de Jeu en prof.dr. M.A.J. Michels CIP-DATA LIBRARY TECHNISCHE UNIVERSITEIT EINDHOVEN Lambreva, Denitza M. Ordering of block copolymers and smectic elastomers/by Denitza M. Lambreva. – Eindhoven : Technische Universiteit Eindhoven, 2005. Proefschrift. – ISBN 90-386-3056-5 NUR 913 Subject headings: polymer morphology/self-assembly/block copolymers/polymeric liquid crystals; smectic elastomers/fluorinated alkanes/x-ray scattering Trefwoorden: polymeermorfologie/zelforganisatie/blokcopolymeren/vloeibare kristallen; smectische elastomeren/gefluorideerde alkanen/röntgenverstrooiing
Printed by Febodruk – www.febodruk.nl
The work described in this thesis was performed at the FOM-Institute for Atomic and
Molecular Physics (AMOLF), Kruislaan 407, 1098 SJ Amsterdam. This work is part of the
research program of the “Stichting voor Fundamenteel Onderzoek der Materie (FOM)”,
which is financially supported by the “Nederlandse Organisatie voor Wetenschappelijk
Onderzoek (NWO)”.
To my family
This thesis is based on the following articles:
Chapter 3
D.M. Lambreva, R. Opitz, G. Reiter, P.M. Frederik and W.H. de Jeu,
Morphology of an asymmetric ethyleneoxide-butadiene di-block copolymer in bulk and
thin films,
Polymer (in press), 2005.
R. Opitz, D. M. Lambreva, and W. H. de Jeu,
Confined crystallization of ethyleneoxide-butadiene di-block copolymers in lamellar films,
Macromolecules 35, 6930, 2002.
L. Li, D. M. Lambreva and W. H. de Jeu,
Lamellar ordering and crystallization in a symmetric block copolymer,
J. Macromol. Sci. B Physics 43, 59, 2004.
Chapter 4
A. Mourran, B. Tartsch, M. Gallyamov, S. Magonov, D.M. Lambreva, B.I. Ostrovskii, I.P.
Dolbnya, W. H. de Jeu, M. Moeller,
Self-assembly of the perfluorinated-alkane F14H20 in utrathin films,
Langmuir 21, 2308, 2005.
Chapter 5
D.M. Lambreva, B.I. Ostrovskii, W.H. de Jeu,
Disorder by random crosslinking in smectic elastomers,
Phys. Rev. Lett. 93, 185702, 2004.
i
Contents Chapter 1 General introduction ...................................................................................... 1
1.1 Ordering in condensed soft-matter systems ........................................................... 2 1.2 Block copolymers .................................................................................................. 4 1.3 Semi-fluorinated alkanes ....................................................................................... 7 1.4 Smectic liquid crystal ordering .............................................................................. 8 1.5 Goals and organisation of this thesis ..................................................................... 9
Chapter 2 Experimental................................................................................................ 13 2.1 X-ray scattering ................................................................................................... 14 2.2 Bulk x-ray methods.............................................................................................. 17 2.3 Surface x-ray methods ......................................................................................... 19 2.4 Direct methods..................................................................................................... 25 2.5 Film preparation by spin-coating ......................................................................... 26
Chapter 3 Microphase separation and crystallisation in bulk and thin films of diblock
copolymers ..................................................................................................................... 29 3.1 Introduction.......................................................................................................... 30 3.2 Block copolymer microphase separation ............................................................. 32 3.3 Experimental........................................................................................................ 36 3.4 Symmetric PBh-b-PEO systems........................................................................... 39 3.5 Asymmetric PBh-PEO system.............................................................................. 51 3.6 Concluding remarks............................................................................................. 62
Chapter 4 Nano-structures in thin films of semifluorinated alkanes ............................ 67 4.1 Introduction.......................................................................................................... 68 4.2 Experimental........................................................................................................ 70 4.3 Results and discussion ......................................................................................... 72 4.4 Conclusions.......................................................................................................... 81
ii
Chapter 5 Order and disorder in smectic elastomers .................................................... 85 5.1 Order and disorder in smectic systems ................................................................ 86 5.2 The structure factor in the smectic phase............................................................. 89 5.3 Smectic elastomers .............................................................................................. 95 5.4 Experimental........................................................................................................ 96 5.5 Results and discussion ......................................................................................... 99 5.6 Conclusions........................................................................................................ 106
Chapter 6 Concluding remarks and outlook ............................................................... 111
Summary............................................................................................................................ 115
Samenvatting ..................................................................................................................... 119
Acknowledgements ........................................................................................................... 123
Curriculum Vitae ............................................................................................................... 125
1
Chapter 1 General introduction
2 Chapter 1 General introduction
1.1 Ordering in condensed soft-matter systems
Soft materials like surfactants, block copolymers and liquid crystals can display in their
condensed state ordering effects on a mesoscopic scale (typically 5-100 nm). This is due to
the intrinsic incompatibilities in the structure of the constituting molecules that can be
brought to expression by changing thermodynamic variables like temperature and pressure.
Alternatively external fields can be applied, including surface fields from interfaces. Due to
this potential to order at a mesoscopic scale, soft condensed matter is easily perturbed by
external stimuli. The relaxation times involved are typically of the order of seconds, much
longer than the time scale for reorientation of individual (macro)molecules. Hence quite
modest fields are sufficient to cause a quite massive reorganisation, often leading to the
formation of complex patterns at intermediate length scales. To understand the attendant
rich physics, insight is needed in the different types of ordering at various length scales.
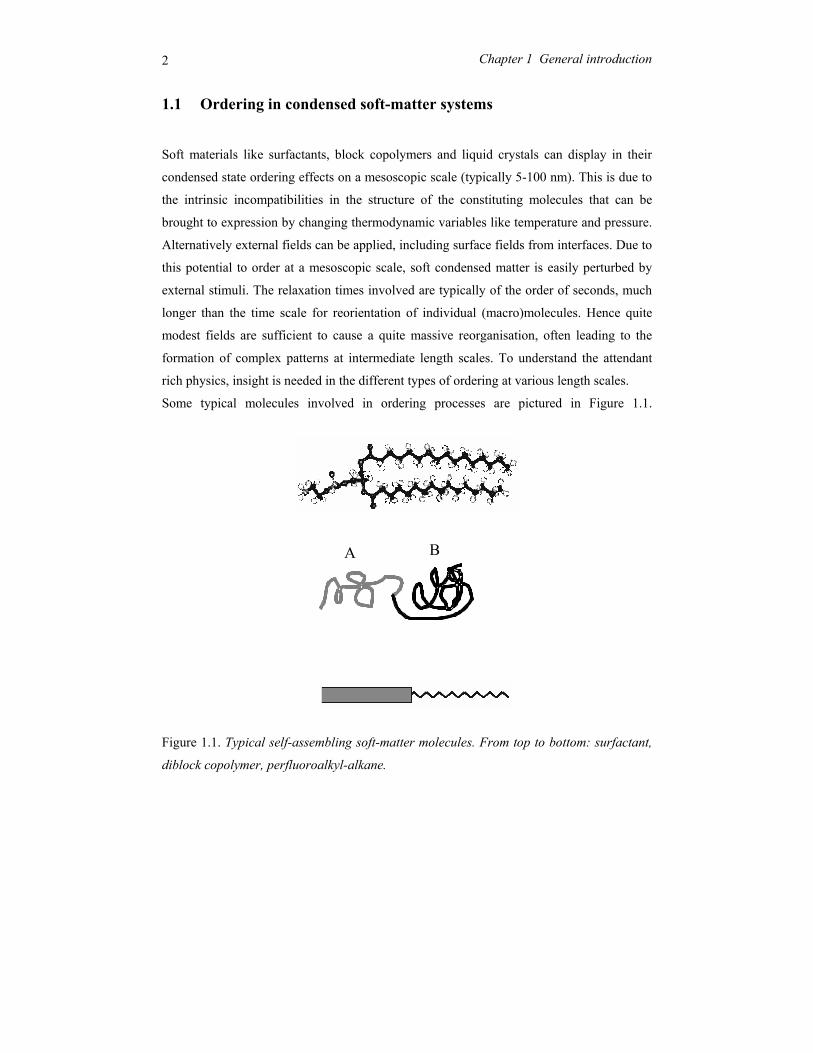
Some typical molecules involved in ordering processes are pictured in Figure 1.1.
Figure 1.1. Typical self-assembling soft-matter molecules. From top to bottom: surfactant,
diblock copolymer, perfluoroalkyl-alkane.
A B
3 1.1 Ordering in condensed soft-matter systems
On top a conventional surfactant is shown, consisting of a polar head and aliphatic tail(s).
Due this difference the polar part of the molecule is soluble in water and the aliphatic part
in hydrocarbons (oils). In a single solvent, the molecules self-assemble in a rich variety of
so-called lyotropic liquid-crystal phases such that the insoluble part of the molecule is
minimally exposed to the solvent. Though these systems do not play a role in this thesis,
they are relevant in connection with the second example: block copolymers. These form the
macromolecular equivalent of low-molar-mass surfactants. In block copolymers the
chemically different blocks are in general immiscible, but because of their chemical linkage
they can only phase separate on a microscopic scale. Finally Figure 1.1 shows a model of a
perfluoroalkyl-alkane. Here the intrinsic incompatibility between the hydrogenated and the
fluorinated part is limited (‘primitive surfactant’). However, the difference in Van der
Waals diameter of the two parts now adds to the complex behaviour.
Liquid crystals form a somewhat different class of materials. In the first place the
elongated molecules are – on average – aligned with their long axis parallel to each other
leading to a preferred direction. When only this orientational ordering is present (nematic
phase) the centres of mass of the molecules still have full translational symmetry (liquid
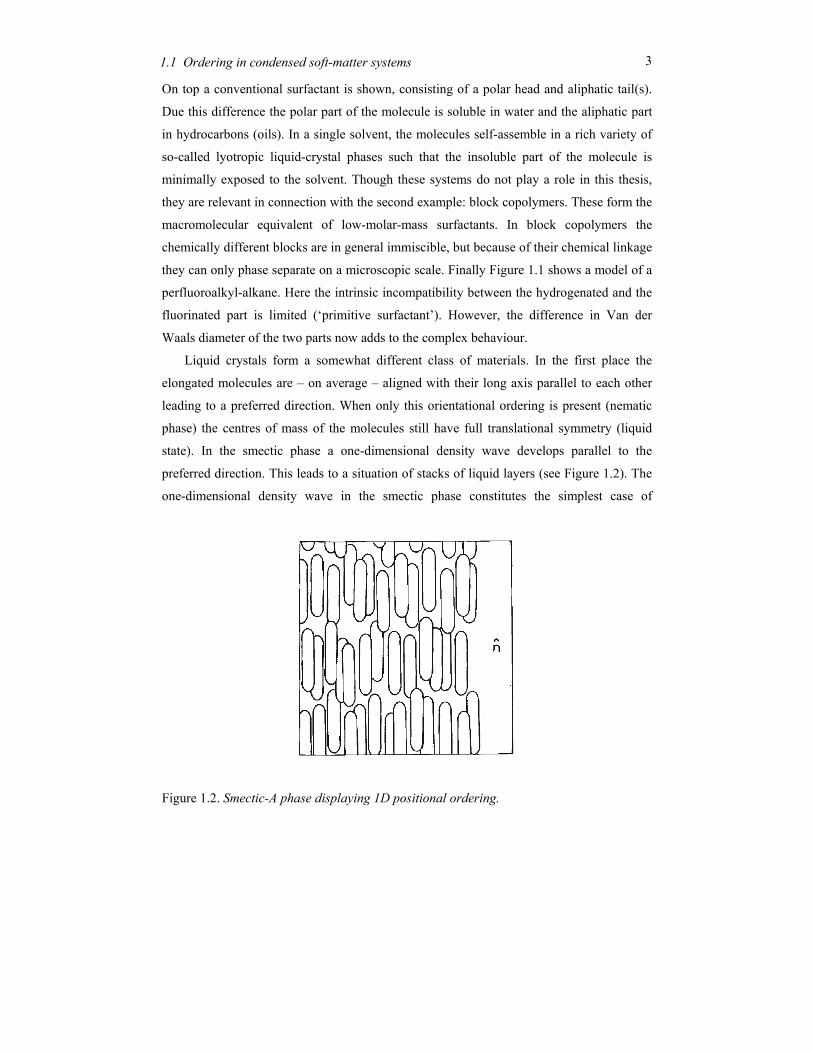
state). In the smectic phase a one-dimensional density wave develops parallel to the
preferred direction. This leads to a situation of stacks of liquid layers (see Figure 1.2). The
one-dimensional density wave in the smectic phase constitutes the simplest case of
Figure 1.2. Smectic-A phase displaying 1D positional ordering.
4 Chapter 1 General introduction
positional ordering. As a result the smectic-nematic phase transition is the simplest form of
melting. The relation with the previous examples lies in the intrinsic density variation in the
constituting molecules that is a prerequisite of the smectic density modulation. Hence not
surprisingly surfactant and block copolymers can form lamellar phases with properties very
similar to the smectic phase. In the following sections we shall introduce the systems
relevant to the work in this thesis in some more detail.
1.2 Block copolymers
The simplest case of a block copolymer is a diblock consisting of two covalently bonded
polymers with chemically distinct repeat units A and B. If A and B are incompatible, below
the order-disorder transition at TODT microphase separation is obtained into, for example, a
spherical, a cylindrical or a lamellar phase. The phase behaviour depends on the relative
volume fraction of A and B and on the magnitude of the product χABN, where χAB is the
Flory-Huggins interaction parameter between the two polymers, and N the total degree of
polymerisation.1 We can write
, (1.1)
in which ε is the interaction energy and Z the number of relevant nearest neighbours. Note
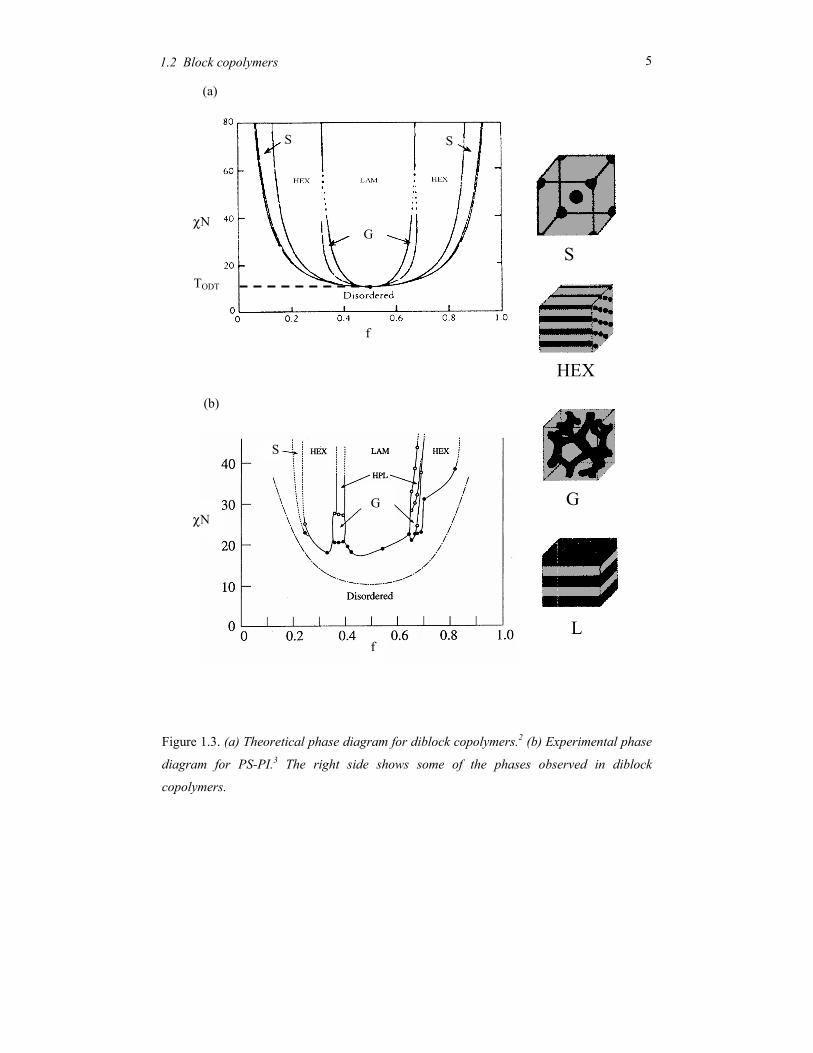
that χ ~ 1/T. In Figure 1.3 both a theoretical2 and an experimental3 phase diagram is
displayed as function of the block volume fraction f. In case of about equal blocks sizes, the
block copolymer microphase separates in a lamellar phase. This result stems from the
balance between the enthalpic gain of demixing A and B (Eq. 1.1) and the entropic cost of
chain confinement within the layers.1,4,5 Note that the experimental phase behaviour, as
picture in Figure 1.3b, is somewhat more complicated than the simple theoretical diagram
of Figure 1.3a. Additional phases like the gyroid phase (G) with cubic symmetry and a
hexagonal perforated lamellar phase (HPL) can intervene.
In thin films the morphology near interfaces can be dramatically affected by the
difference in wetting properties of the various blocks at the substrate and at the air
)]([ BBAA21
ABB
AB εεεχ +−=Tk
Z
5 1.2 Block copolymers
Figure 1.3. (a) Theoretical phase diagram for diblock copolymers.2 (b) Experimental phase
diagram for PS-PI.3 The right side shows some of the phases observed in diblock
copolymers.
S S
χN
TODT
G
f
(a)
S
HEX
G
L
(b)
G
S
f
χN
6 Chapter 1 General introduction
interface. As a result the randomly oriented lamellar microdomains become macroscopic
lamellae. For example, as we shall see in Chapter 3, in the case of thin block copolymer
films of poly-ethylene/butylene (PBh) and poly-ethyleneoxide (PEO) we find that PEO wets
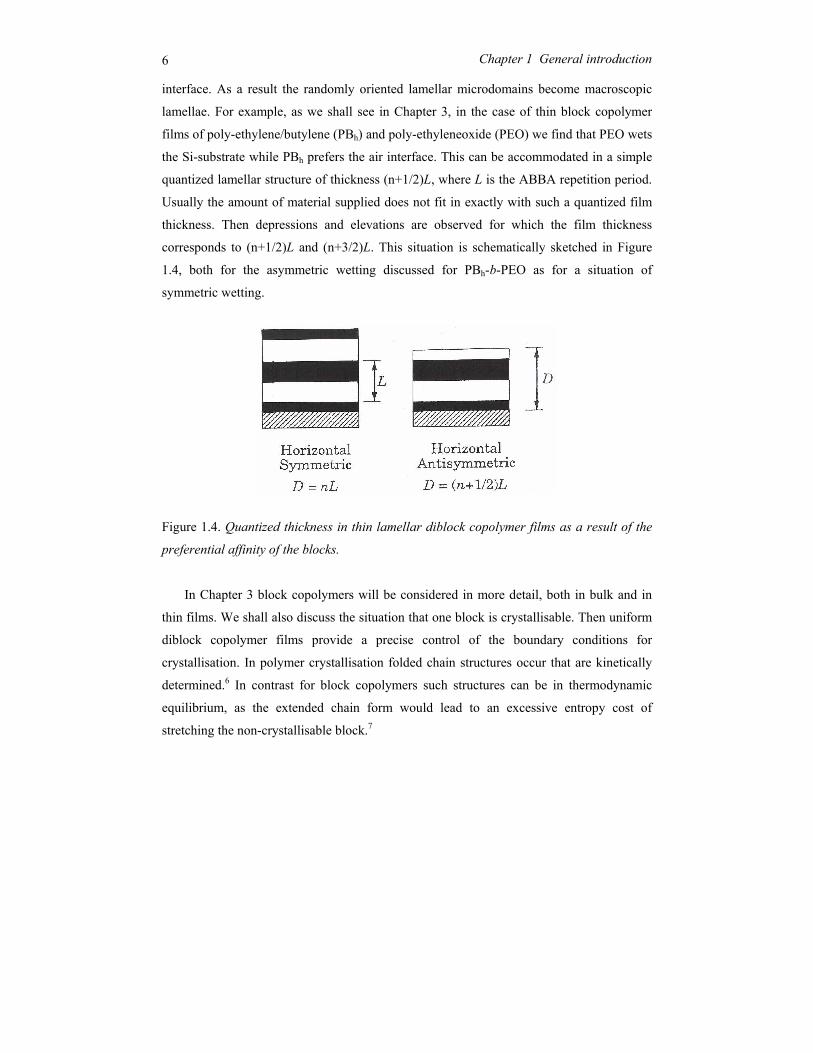
the Si-substrate while PBh prefers the air interface. This can be accommodated in a simple
quantized lamellar structure of thickness (n+1/2)L, where L is the ABBA repetition period.
Usually the amount of material supplied does not fit in exactly with such a quantized film
thickness. Then depressions and elevations are observed for which the film thickness
corresponds to (n+1/2)L and (n+3/2)L. This situation is schematically sketched in Figure
1.4, both for the asymmetric wetting discussed for PBh-b-PEO as for a situation of
symmetric wetting.
Figure 1.4. Quantized thickness in thin lamellar diblock copolymer films as a result of the
preferential affinity of the blocks.
In Chapter 3 block copolymers will be considered in more detail, both in bulk and in
thin films. We shall also discuss the situation that one block is crystallisable. Then uniform
diblock copolymer films provide a precise control of the boundary conditions for
crystallisation. In polymer crystallisation folded chain structures occur that are kinetically
determined.6 In contrast for block copolymers such structures can be in thermodynamic
equilibrium, as the extended chain form would lead to an excessive entropy cost of
stretching the non-crystallisable block.7
71.3 Semi-fluorinated alkanes
1.3 Semi-fluorinated alkanes
Semi-fluorinated alkanes of the general structure F-(CF2)m-(CH2)n-H (in short FmHn)
self-assemble in a wide number of different smectic and crystalline phases due to the
incompatibility between the fluorinated and the alkylated part. The incompatibility arises
from the presence of the two ‘mutually phobic’ blocks, a fluorinated and a hydrogenated
chain, linked by a covalent bond. Though both segments dislike water, the atomic
properties of fluorinated part are very different from those of the hydrogenated tail. The
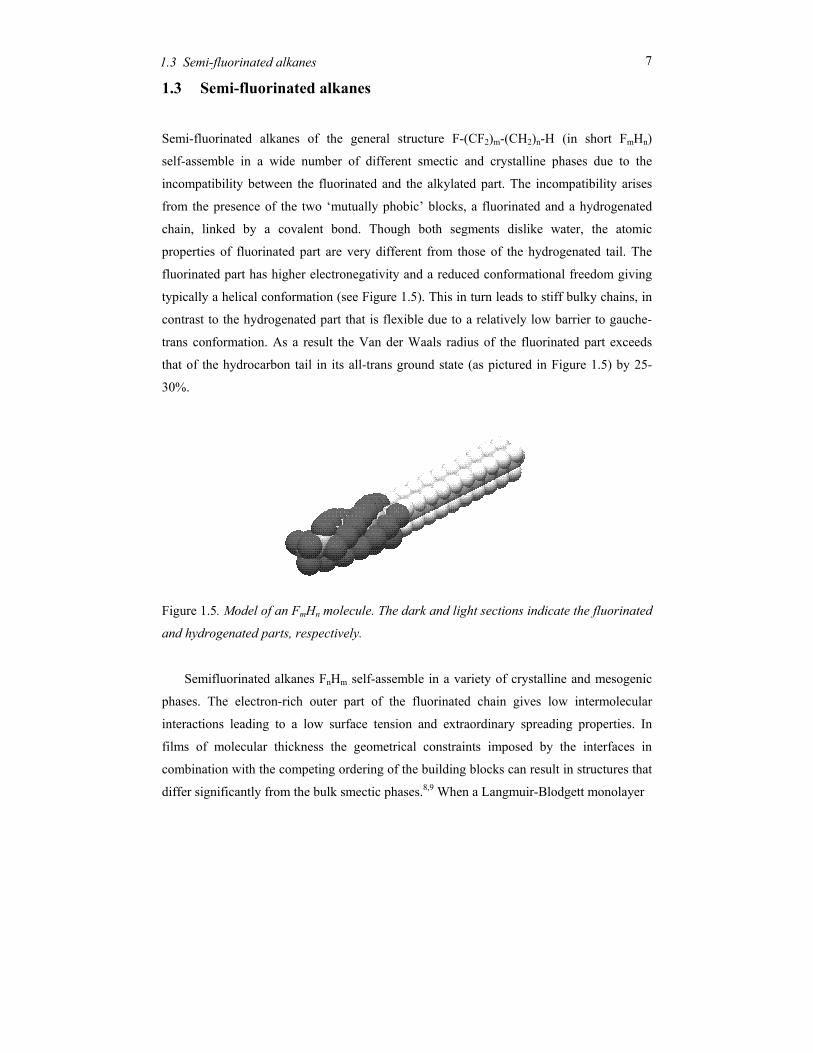
fluorinated part has higher electronegativity and a reduced conformational freedom giving
typically a helical conformation (see Figure 1.5). This in turn leads to stiff bulky chains, in
contrast to the hydrogenated part that is flexible due to a relatively low barrier to gauche-
trans conformation. As a result the Van der Waals radius of the fluorinated part exceeds
that of the hydrocarbon tail in its all-trans ground state (as pictured in Figure 1.5) by 25-
30%.
Figure 1.5. Model of an FmHn molecule. The dark and light sections indicate the fluorinated
and hydrogenated parts, respectively.
Semifluorinated alkanes FnHm self-assemble in a variety of crystalline and mesogenic
phases. The electron-rich outer part of the fluorinated chain gives low intermolecular
interactions leading to a low surface tension and extraordinary spreading properties. In
films of molecular thickness the geometrical constraints imposed by the interfaces in
combination with the competing ordering of the building blocks can result in structures that
differ significantly from the bulk smectic phases.8,9 When a Langmuir-Blodgett monolayer
8 Chapter 1 General introduction
of F8H16 is transferred onto a silicon oxide surface, scanning force microscopy
investigations shows that the layer consists of monodisperse discrete aggregates. The
formation of such structures has been explained by surface induced aggregation, i.e., as
‘surface micelles’, whose size is controlled by the density mismatch between the
fluorinated and hydrogenated segments in dependence of their relative length.10,11 The
interactions between the fluorinated segments dominate the ordering while the hydrocarbon
blocks form a liquid-like layer.12,13 In Chapter 4 we shall discuss monolayers of F14H20
deposited on a silicon substrate, for which these properties play an essential role in the
formation of self-assembled nanostructures.
1.4 Smectic liquid crystal ordering
Long-range translational order is a defining quality of three-dimensional (3D) crystals; it
leads to the existence of Bragg reflections in x-ray scattering. In a 3D crystal the particles
vibrate around well-defined lattice positions with amplitudes small compared to the lattice
spacing. As the dimensionality is decreased, fluctuations become increasingly important.
As a result long-range translational order cannot exist below 3D; it would be destroyed by
thermal fluctuations.14 For example, for a 2D solid the positional correlation decays
algebraically as a function of distance. The 1D layer correlations in a smectic-A phase show
a similar behaviour. This property lies at the basis of the fundamental interest in smectic
phases as model systems of low-dimensional order. The correlation function describing the
smectic layer periodicity decays as r−η, in which the exponent η is small and positive. It can
be studied by high-resolution x-ray scattering. The delta-function type Bragg peaks with
diffuse tails characteristic of a 3D crystal periodicity change into Caillé lineshapes with an
asymptotic power-law form.15
A combination of liquid crystalline (LC) ordering and macromolecular properties can
be obtained on a macroscopic scale in LC polymers. For example LC or mesogenic units
can be built into a polymer as side groups attached to the polymer backbone: comb-shaped
LC polymers. Various types of LC phase (nematic, smectic) can be found, just as in the
corresponding monomers. In the case of a smectic phase the 1D quasi-long-range layer
ordering can be combined with polymer properties. The backbone polymer, in turn, can be
9 1.4 Smectic liquid crystal ordering
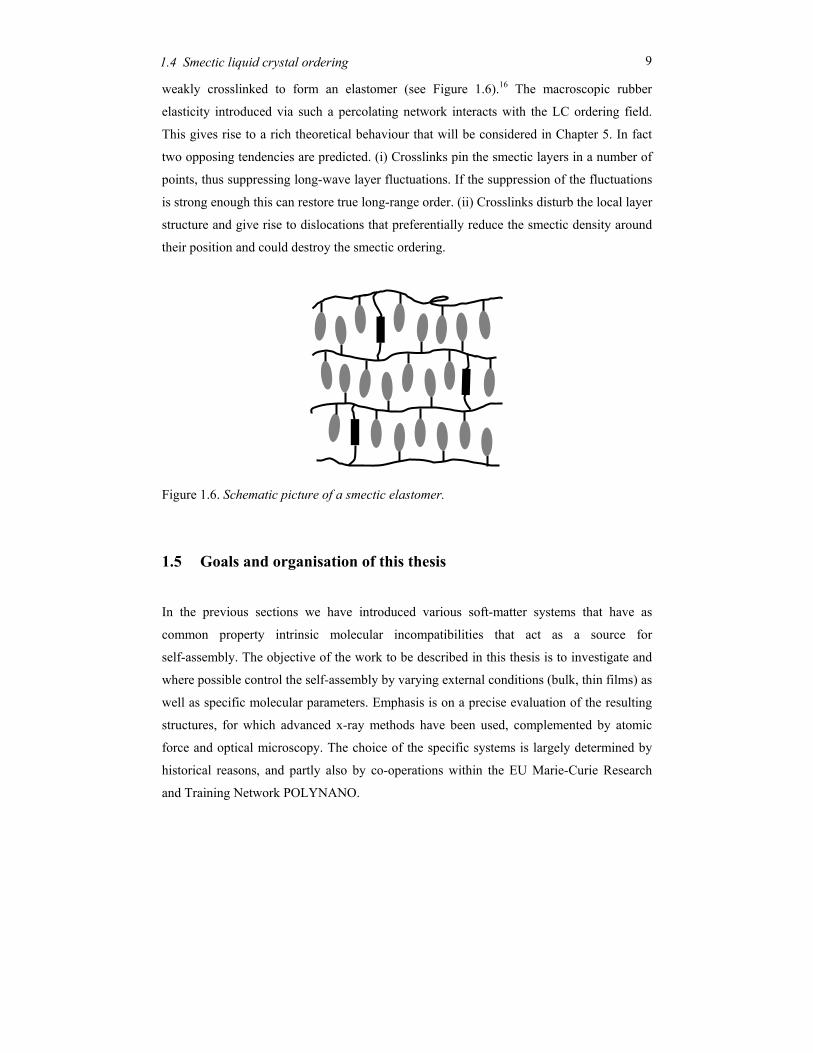
weakly crosslinked to form an elastomer (see Figure 1.6).16 The macroscopic rubber
elasticity introduced via such a percolating network interacts with the LC ordering field.
This gives rise to a rich theoretical behaviour that will be considered in Chapter 5. In fact
two opposing tendencies are predicted. (i) Crosslinks pin the smectic layers in a number of
points, thus suppressing long-wave layer fluctuations. If the suppression of the fluctuations
is strong enough this can restore true long-range order. (ii) Crosslinks disturb the local layer
structure and give rise to dislocations that preferentially reduce the smectic density around
their position and could destroy the smectic ordering.
Figure 1.6. Schematic picture of a smectic elastomer.
1.5 Goals and organisation of this thesis
In the previous sections we have introduced various soft-matter systems that have as
common property intrinsic molecular incompatibilities that act as a source for
self-assembly. The objective of the work to be described in this thesis is to investigate and
where possible control the self-assembly by varying external conditions (bulk, thin films) as
well as specific molecular parameters. Emphasis is on a precise evaluation of the resulting
structures, for which advanced x-ray methods have been used, complemented by atomic
force and optical microscopy. The choice of the specific systems is largely determined by
historical reasons, and partly also by co-operations within the EU Marie-Curie Research
and Training Network POLYNANO.
10 Chapter 1 General introduction
The structure of the thesis is as follows. After this general introduction in Chapter 2 the
various experimental methods – in the first place x-ray scattering, but also optical and
atomic force microscopy – will be discussed. Chapter 3, 4 and 5 form the core of the thesis
and can be read to a large extend independently. Chapter 3 is concerned with ordering and
crystallisation in block copolymers, both in the bulk and in thin films. In Chapter 4
nanostructures formed by monolayers of the semifluorinated alkane F14H20 are discussed.
Finally in Chapter 5 ordering and disordering effects are investigated due to random
crosslinking smectic elastomers.
11
References
[1] Bates, F. S., Frederickson, G. H., Annu. Rev. Phys. Chem. 41, 525, 1990.
[2] Matsen, M. W., Schick, M., Phys. Rev. Lett. 72, 2660,1994.
[3] Khandpur, A. K., Forster, S., Bates, F. S., Hamley, I. W., Ryan, A. J., Bras, W.,
Almdal, K., Mortensen, K., Macromolecules 28, 8796, 1995.
[4] Bates, F. S., Frederickson, G. H., Physics Today, February 52(2), 32, 1999.
[5] Hamley, I. W., The Physics of Block Copolymers (Oxford University Press, New
York), 1998.
[6] Keller, A., Goldbeck-Wood, G., p. 241 in Comprehensive Polymer Science, 2nd
Supplement, S.L. Aggarval and S. Russo, eds., Elsevier, Ocxord, 1996.
[7] M.D. Whitmore, J. Noolandi, Macromolecules 21, 1482, 1988.
[8] Marczuk, P., Lang, P., Findenegg, G. H., Mehta, S. K., Moeller, M., Langmuir 18,
6830, 2002.
[9] Gang, O., Ellmann, J., Moeller, M., Kraack, H., Sirota, E. B., Ocko, B. M., Deutsch,
M., Europhys. Lett. 48, 761, 2000.
[10] Maaloum, M., Muller, P., Krafft, M.-P. Angew. Chem., Int. Ed. 41, 4331, 2002.
[11] Krafft, M. P., Giulieri, F., Fontaine, P., Goldmann, M., Langmuir 17, 6577, 2001.
[12] Huang, Z., Acero, A. A., Lei, N., Rice, S. A., Zhang, Z., Schlossman, M. L. J.,
Chem. Soc., Faraday Trans. 92, 545, 1996.
[13] Krafft, M.-P., Curr. Opin. Colloid Interface Sci. 8, 243, 2003.
[14] Chaikin, P. M., Lubensky, T. C., Principles of Condensed Matter Physics
(Cambridge University Press), 1995.
[15] Als-Nielsen, J., Litster, J. D., Birgeneau, R. J., Kaplan, M., Safinya, C. R.,
Lindegaard-Andersen, A., Mathiesen, S., Phys. Rev. B 22, 312, 1980.
[16] M. Warner and E. M. Terentjev, Liquid Crystal Elastomers (Clarendon Press,
Oxford), 2003.

13
Chapter 2 Experimental
In this chapter we discuss the various experimental methods that play a role in the work to
be presented in this thesis. A variety of x-ray methods have been applied to probe bulk
structures (small- and wide-angle x-ray scattering) and surface ordering (x-ray reflectivity
and grazing-incidence x-ray diffraction). In several cases the x-ray results were
complemented with direct images from atomic force microscopy and optical microscopy. In
this chapter we summarize the basic principles of these methods and the main experimental
features. In addition some aspects of sample preparation will be described.
14 Chapter 2 Experimental
2.1 X-ray scattering
As introduction for the x-ray methods described in the subsequent sections, we give in this
part the basic quantities and definitions regarding x-ray scattering. A complete overview on
the subject is given in Ref. 1 and 2. When an x-ray beam impinges on a medium, it induces
secondary radiating sources by the interaction with the individual electrons that constitute
the material. Classically, the wavelength λ of the outgoing wave is the same as that of the
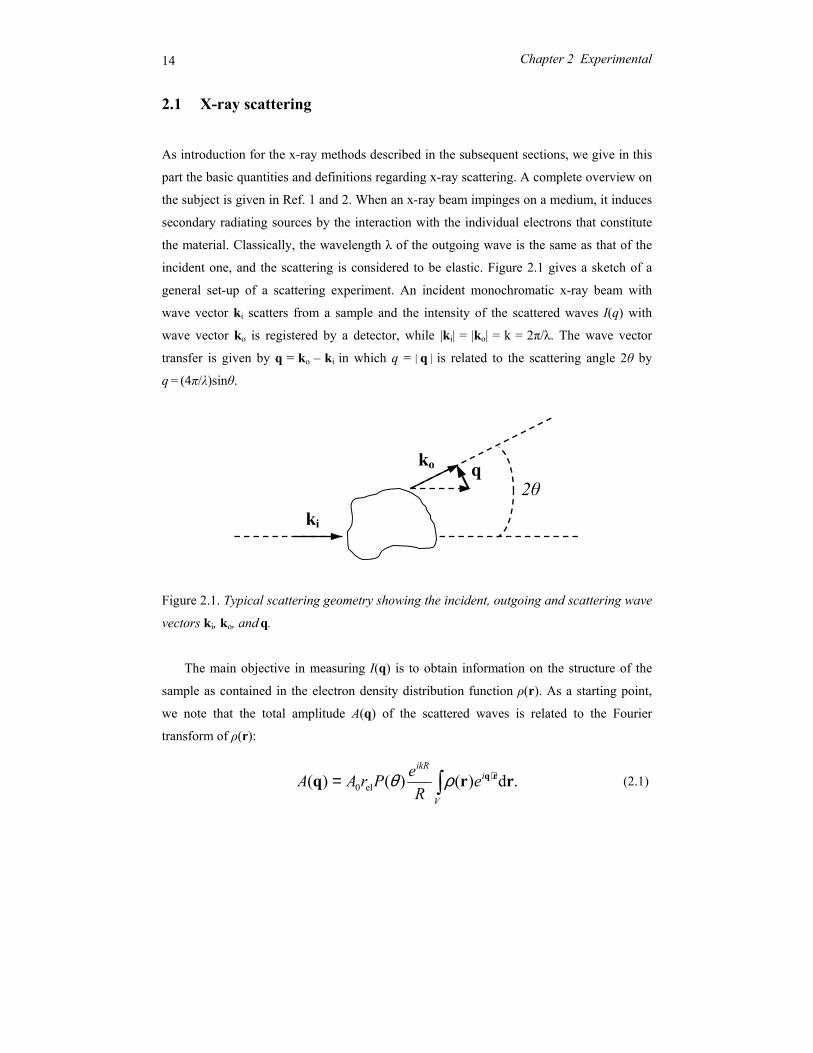
incident one, and the scattering is considered to be elastic. Figure 2.1 gives a sketch of a
general set-up of a scattering experiment. An incident monochromatic x-ray beam with
wave vector ki scatters from a sample and the intensity of the scattered waves I(q) with
wave vector ko is registered by a detector, while |ki| = |ko| = k = 2π/λ. The wave vector
transfer is given by q = ko – ki in which q = q is related to the scattering angle 2θ by
q = (4π/λ)sinθ.
Figure 2.1. Typical scattering geometry showing the incident, outgoing and scattering wave
vectors ki, ko, and q.
The main objective in measuring I(q) is to obtain information on the structure of the
sample as contained in the electron density distribution function ρ(r). As a starting point,
we note that the total amplitude A(q) of the scattered waves is related to the Fourier
transform of ρ(r):
(2.1)
ki
ko q 2θ
.d)()()( el0 ∫ ⋅=V
iikR
eR
ePrAA rrq rqρθ
152.1 X-ray scattering
In this equation A0 is the amplitude of the incident wave, rel is the classical electron radius,
P(θ) is a constant factor related to the polarization of the incident wave, ρ(r)dr is the
number of electrons at position r in a volume element dr and R is the distance from the
scattering volume V to the observation point (detector). During measurement the positions
of the scattering elements change and therefore the intensity is averaged over time I(q) =
⟨A(q) A*(q)⟩. The ⟨…⟩ denotes ensemble average, which is equivalent to time average if the
scattering medium is ergodic. The intensity of the scattered beam I(q) is defined by the
structure factor S(q), given by:
(2.2)
where G(r) is defined as
. (2.3)
G(r) is the density-density autocorrelation function and specifies how, on average, the
densities in neighbouring regions separated by a distance r = u′– u are correlated to each
other. As a result a reconstruction of G(r) from S(q) yields information on the nature of the
translational order of the system, as will be discussed in more detail in Chapter 5. Note that
ρ(r) can be converted to G(r) and S(q), however there is no way to perform the reverse
operation. Consequently, given that the scattered amplitude is a complex quantity,
information on the phase is lost. The alternative practice is to assume a model structure and
check whether the derived intensity pattern I(q) agrees with the experimentally determined
one. Hence the question whether the chosen model represents the unique solution to the
problem always remains.
Two major theoretical approaches are in use for treating the scattering process.
Kinematical scattering theory (or first Born approximation) is based on the assumption that
for a given incident x-ray beam, the scattering process in the sample occurs at most once.
This assumption is correct if the scattering represents a weak disturbance of the transmitted
wave, in which case the probability of a scattered wave to be scattered again is small.
Alternatively, dynamic scattering theory is needed that takes multiple scattering processes
into account. Yet, under some broad assumptions concerning the type of structure, some
,)(d)( ∫ ⋅= rqrrq ieGS
∫ += uruur dG )()()( ρρ
16 Chapter 2 Experimental
basic information can be directly extracted from I(q). For the scattering from a material
with a density variation that is periodic in space, Bragg’s law holds:
(2.4)
where m is an integer. This condition refers to constructive interference of waves from a set
of lattice planes at a distance d apart. The position of the Bragg peaks in the spectrum of
I(θ) allows determination of the periodicities related to the specific unit cell.
Long-range translational order in ideal three-dimensional (3D) crystals results in delta-
function type diffraction peaks. However, in reality various types of complication arise. At
finite temperatures thermal vibrations reduce the intensity of Bragg peaks by a Debye-
Waller factor, ])(exp[ 22 ⟩⟨− ruqn , where u(r) is the displacement from the time-averaged
mean position of lattice site. In addition this also introduces diffuse tails. Furthermore, for
finite-size samples (small crystals) the width of the diffraction peaks increases due to the
truncation of the periodicity. It can be expressed in terms of the crystallite size; more details
will be given in Chapter 5. In systems with a dimensionality lower than three, thermal
fluctuations destroy any long-range translational order. In 2D crystals the ordering decays
algebraically, leading to power-law singularities instead of delta function peaks. These are
referred to as quasi-Bragg peaks and differ from true Bragg behaviour by a slow fall-off of
the diffuse tails. Hence, the lineshape associated with an x-ray peak carries information
about the nature of ordering. In conventional liquid the positional correlations decay
exponentially with distance, giving a Lorentzian scattering profile with a width inversely
proportional to the correlation length ξ.
. (2.5)
In practice, the overall intensity observed in a scattering experiment is expressed as a
convolution of the structure factor S(q), the form factor F(q) (scattering from the basic unit)
and the instrumental resolution function R(q):
. (2.6)
,sin2 θλ dm =
1)(1)( 2
0 +−∝
qqS
ξq
)()()()( qqqq RFSI ⊗⊗=
172.1 X-ray scattering
The resolution function describes the dispersions ∆qj (j = x, y, z) relative to ki and ko due to
the random deviations in the various angles involved in the scattering geometry. For most
practical purposes these deviations are small and statistically independent and thus can be
described by a Gaussian distribution. As a result R(q) can written as3
(2.7)
As the Fourier transform of a Gaussian is again a Gaussian, this result is convenient for
analysis purposes. It allows a straightforward deconvolution of the experimental data –
often also described by a Gaussian lineshape – as the convolution of two Gaussians of
width σ1 and σ2 is another Gaussian of width (σ12+σ2
2)1/2.
2.2 Bulk x-ray methods
2.2.1 Fundamentals
Small-angle x-ray scattering (SAXS) probes length scales of 1-100 nm. This range covers
typically microstructures of block copolymers as well as the ‘long period’ (lamellar
thickness) occurring in polymer crystallisation. Of course, a prerequisite is always that
sufficient electron density contrast is needed between the scattering elements that form the
periodic structure. In general a number of Bragg reflections dhkl will be observed that
depend on the symmetry of the lattice and which are related to the unit cell parameters hkl
(Miller indexes). As a relevant example for this thesis, the reflections dhkl associated with a
hexagonal lattice can be written as
(2.8)
In this equation a, b and c are the lattice parameters that define the unit cell, for the
hexagonal case a = b with α = β = 90° and γ = 120°. In the case of block copolymers, the
.21exp
21exp
21exp)2()( 2
2
2
2
2
23/2
∆
−
∆−
∆
−∆∆∆
=−
z
z
y
y
x
x
zyx qq
qqqR πq
. 341
2
2
2
22
cl
akhkh
dhkl
+
++=
18 Chapter 2 Experimental
relative positions of the x-ray reflections corresponding to a set of dhkl - values usually allow
an unambiguous identification of the morphology. Some typical ratios of q-values relative
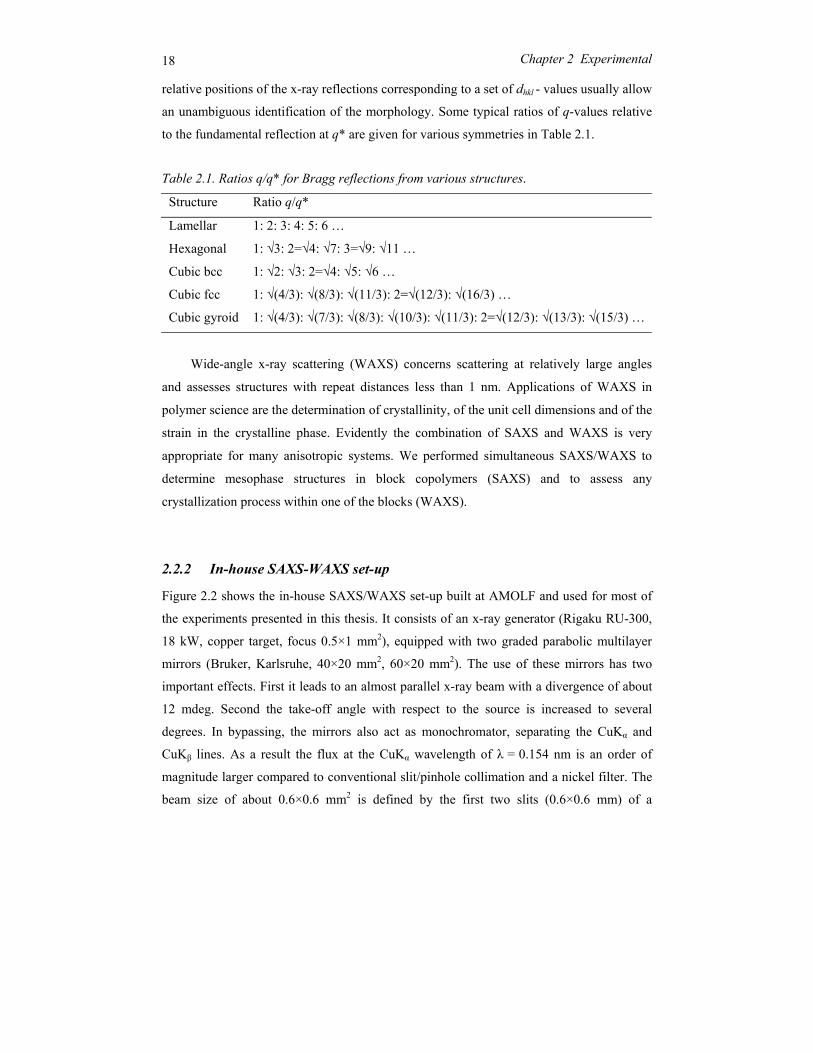
to the fundamental reflection at q* are given for various symmetries in Table 2.1. Table 2.1. Ratios q/q* for Bragg reflections from various structures.
Structure Ratio q/q*
Lamellar 1: 2: 3: 4: 5: 6 …
Hexagonal 1: √3: 2=√4: √7: 3=√9: √11 …
Cubic bcc 1: √2: √3: 2=√4: √5: √6 …
Cubic fcc 1: √(4/3): √(8/3): √(11/3): 2=√(12/3): √(16/3) …
Cubic gyroid 1: √(4/3): √(7/3): √(8/3): √(10/3): √(11/3): 2=√(12/3): √(13/3): √(15/3) …
Wide-angle x-ray scattering (WAXS) concerns scattering at relatively large angles
and assesses structures with repeat distances less than 1 nm. Applications of WAXS in
polymer science are the determination of crystallinity, of the unit cell dimensions and of the
strain in the crystalline phase. Evidently the combination of SAXS and WAXS is very
appropriate for many anisotropic systems. We performed simultaneous SAXS/WAXS to
determine mesophase structures in block copolymers (SAXS) and to assess any
crystallization process within one of the blocks (WAXS).
2.2.2 In-house SAXS-WAXS set-up
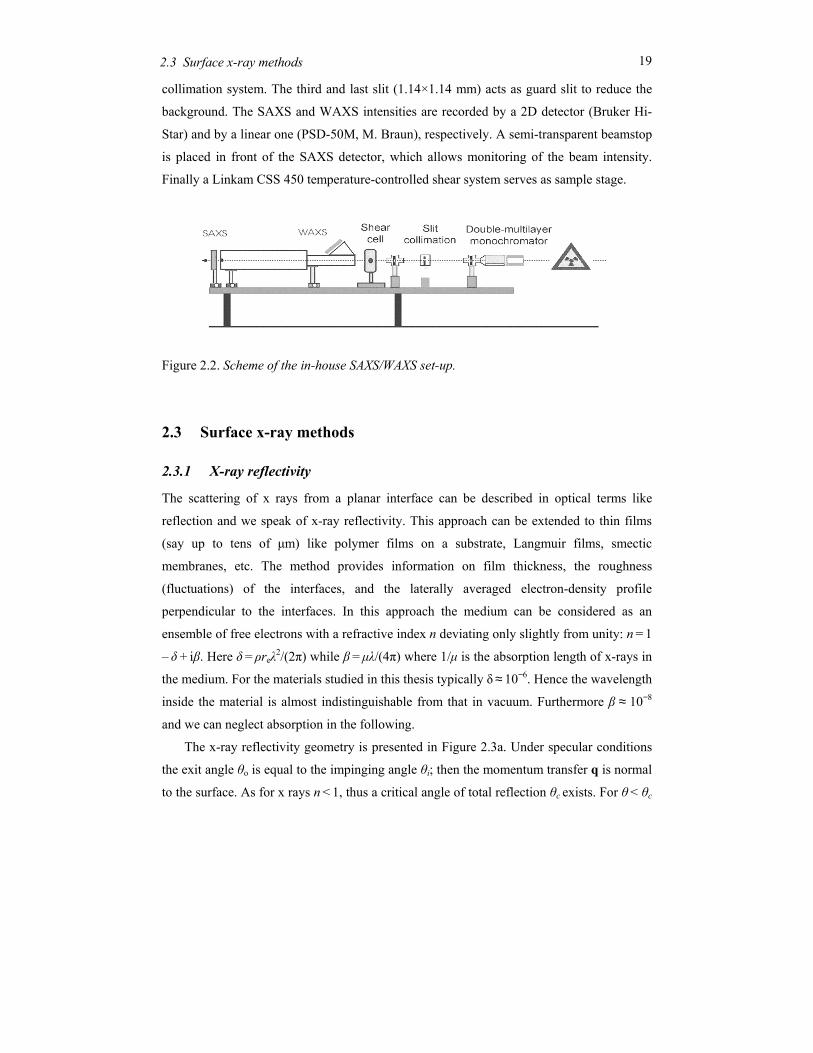
Figure 2.2 shows the in-house SAXS/WAXS set-up built at AMOLF and used for most of
the experiments presented in this thesis. It consists of an x-ray generator (Rigaku RU-300,
18 kW, copper target, focus 0.5×1 mm2), equipped with two graded parabolic multilayer
mirrors (Bruker, Karlsruhe, 40×20 mm2, 60×20 mm2). The use of these mirrors has two
important effects. First it leads to an almost parallel x-ray beam with a divergence of about
12 mdeg. Second the take-off angle with respect to the source is increased to several
degrees. In bypassing, the mirrors also act as monochromator, separating the CuKα and
CuKβ lines. As a result the flux at the CuKα wavelength of λ = 0.154 nm is an order of
magnitude larger compared to conventional slit/pinhole collimation and a nickel filter. The
beam size of about 0.6×0.6 mm2 is defined by the first two slits (0.6×0.6 mm) of a
192.3 Surface x-ray methods
collimation system. The third and last slit (1.14×1.14 mm) acts as guard slit to reduce the
background. The SAXS and WAXS intensities are recorded by a 2D detector (Bruker Hi-
Star) and by a linear one (PSD-50M, M. Braun), respectively. A semi-transparent beamstop
is placed in front of the SAXS detector, which allows monitoring of the beam intensity.
Finally a Linkam CSS 450 temperature-controlled shear system serves as sample stage.
Figure 2.2. Scheme of the in-house SAXS/WAXS set-up.
2.3 Surface x-ray methods
2.3.1 X-ray reflectivity
The scattering of x rays from a planar interface can be described in optical terms like
reflection and we speak of x-ray reflectivity. This approach can be extended to thin films
(say up to tens of µm) like polymer films on a substrate, Langmuir films, smectic
membranes, etc. The method provides information on film thickness, the roughness
(fluctuations) of the interfaces, and the laterally averaged electron-density profile
perpendicular to the interfaces. In this approach the medium can be considered as an
ensemble of free electrons with a refractive index n deviating only slightly from unity: n = 1
– δ + iβ. Here δ = ρreλ2/(2π) while β = µλ/(4π) where 1/µ is the absorption length of x-rays in
the medium. For the materials studied in this thesis typically δ ≈ 10−6. Hence the wavelength
inside the material is almost indistinguishable from that in vacuum. Furthermore β ≈ 10−8
and we can neglect absorption in the following.
The x-ray reflectivity geometry is presented in Figure 2.3a. Under specular conditions
the exit angle θo is equal to the impinging angle θi; then the momentum transfer q is normal
to the surface. As for x rays n < 1, thus a critical angle of total reflection θc exists. For θ < θc
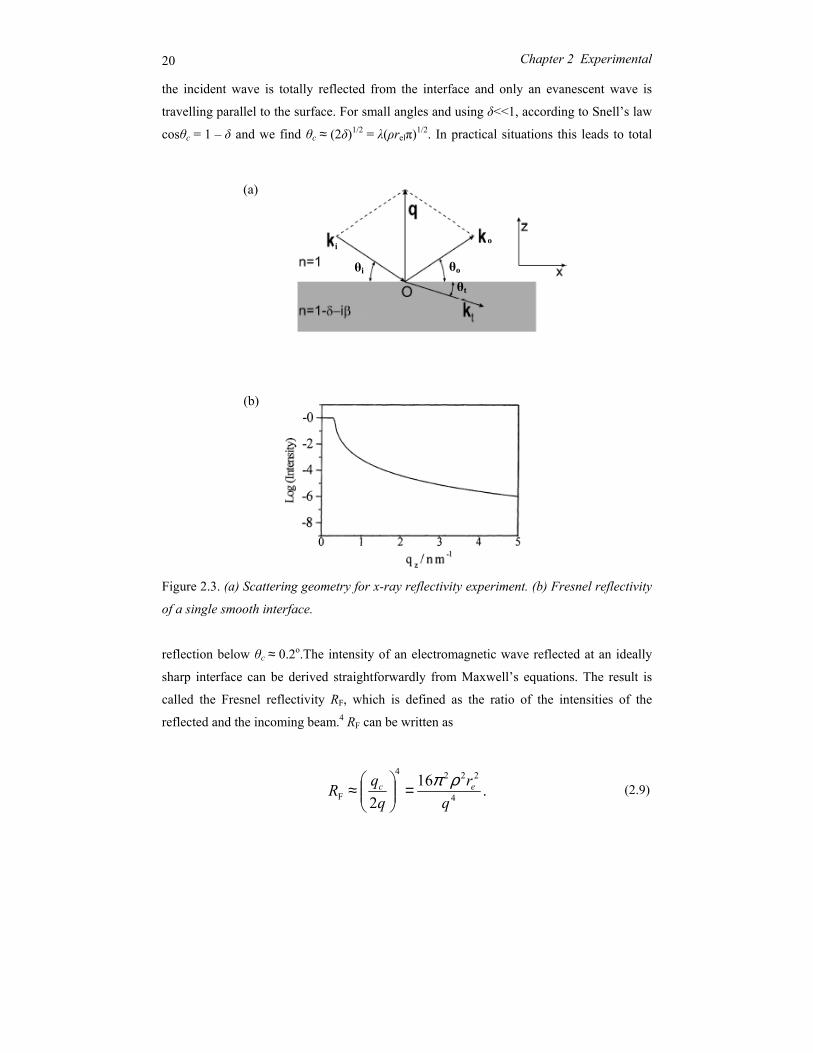
20 Chapter 2 Experimental
the incident wave is totally reflected from the interface and only an evanescent wave is
travelling parallel to the surface. For small angles and using δ<<1, according to Snell’s law
cosθc = 1 – δ and we find θc ≈ (2δ)1/2 = λ(ρrelπ)1/2. In practical situations this leads to total
Figure 2.3. (а) Scattering geometry for x-ray reflectivity experiment. (b) Fresnel reflectivity
of a single smooth interface.
reflection below θc ≈ 0.2o.The intensity of an electromagnetic wave reflected at an ideally
sharp interface can be derived straightforwardly from Maxwell’s equations. The result is
called the Fresnel reflectivity RF, which is defined as the ratio of the intensities of the
reflected and the incoming beam.4 RF can be written as
(2.9)
(a)
(b)
.162 4
2224
F qr
qqR ec ρπ=
≈
θi θo
θt
i o
212.3 Surface x-ray methods
At large angles the reflected intensity decays as q–4. Owing to the rapid falloff in intensity
with increasing angle, the range of q in reflectivity measurements is small, typically
qmax ≈ 6 nm–1 (see Figure 2.3b).
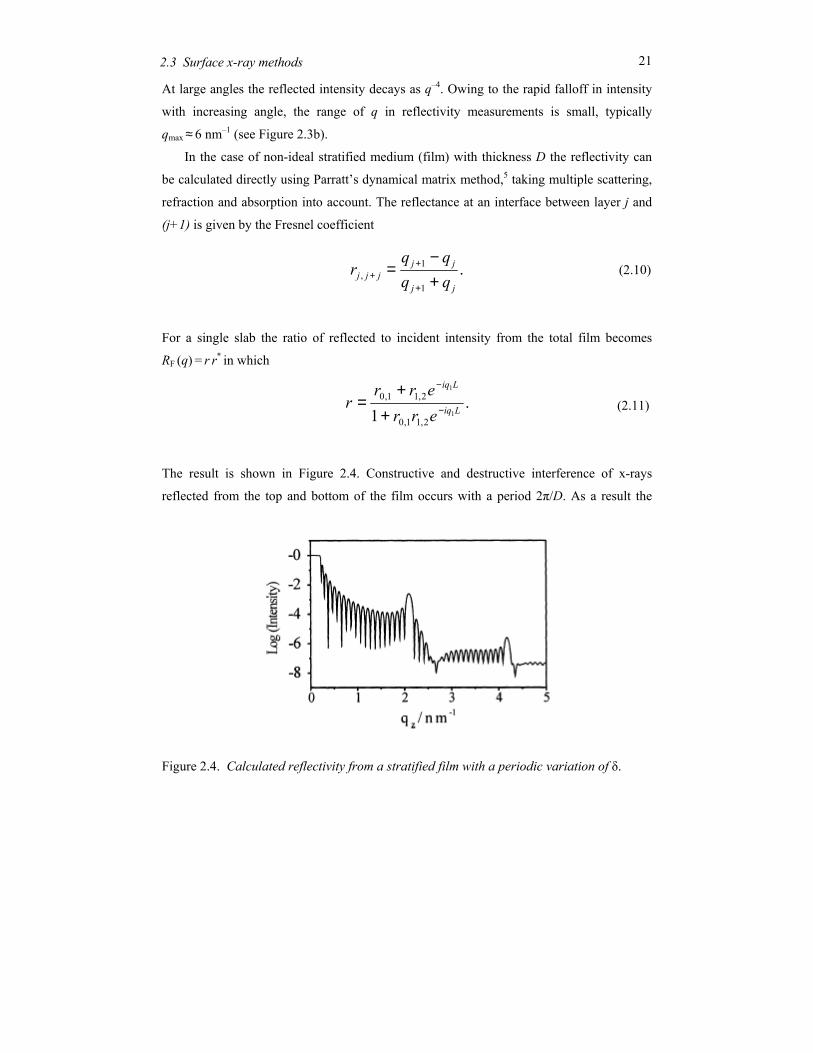
In the case of non-ideal stratified medium (film) with thickness D the reflectivity can
be calculated directly using Parratt’s dynamical matrix method,5 taking multiple scattering,
refraction and absorption into account. The reflectance at an interface between layer j and
(j+1) is given by the Fresnel coefficient
(2.10)
For a single slab the ratio of reflected to incident intensity from the total film becomes
RF (q) = r r* in which
(2.11)
The result is shown in Figure 2.4. Constructive and destructive interference of x-rays
reflected from the top and bottom of the film occurs with a period 2π/D. As a result the
Figure 2.4. Calculated reflectivity from a stratified film with a periodic variation of δ.
.1
1,
jj
jjjjj qq
qqr
+−
=+
++
.1 1
1
2,11,0
2,11,0Liq
Liq
errerr
r −
−
++
=
22 Chapter 2 Experimental
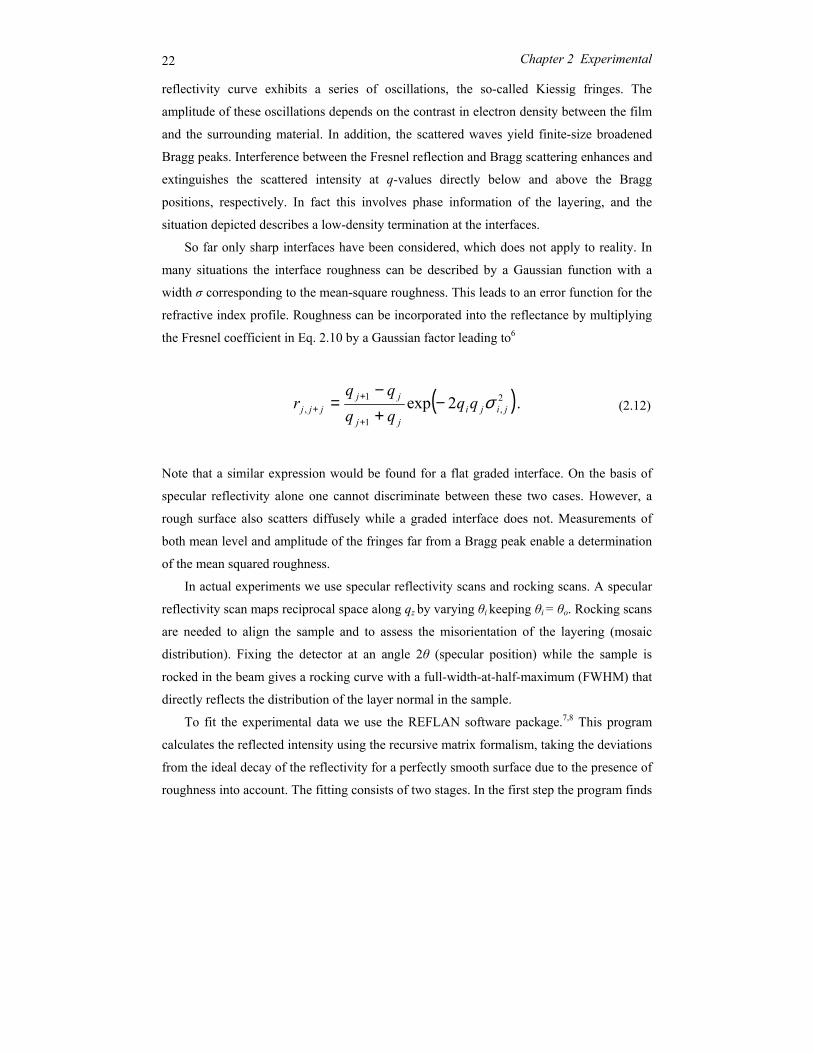
reflectivity curve exhibits a series of oscillations, the so-called Kiessig fringes. The
amplitude of these oscillations depends on the contrast in electron density between the film
and the surrounding material. In addition, the scattered waves yield finite-size broadened
Bragg peaks. Interference between the Fresnel reflection and Bragg scattering enhances and
extinguishes the scattered intensity at q-values directly below and above the Bragg
positions, respectively. In fact this involves phase information of the layering, and the
situation depicted describes a low-density termination at the interfaces.
So far only sharp interfaces have been considered, which does not apply to reality. In
many situations the interface roughness can be described by a Gaussian function with a
width σ corresponding to the mean-square roughness. This leads to an error function for the
refractive index profile. Roughness can be incorporated into the reflectance by multiplying
the Fresnel coefficient in Eq. 2.10 by a Gaussian factor leading to6
(2.12)
Note that a similar expression would be found for a flat graded interface. On the basis of
specular reflectivity alone one cannot discriminate between these two cases. However, a
rough surface also scatters diffusely while a graded interface does not. Measurements of
both mean level and amplitude of the fringes far from a Bragg peak enable a determination
of the mean squared roughness.
In actual experiments we use specular reflectivity scans and rocking scans. A specular
reflectivity scan maps reciprocal space along qz by varying θi keeping θi = θo. Rocking scans
are needed to align the sample and to assess the misorientation of the layering (mosaic
distribution). Fixing the detector at an angle 2θ (specular position) while the sample is
rocked in the beam gives a rocking curve with a full-width-at-half-maximum (FWHM) that
directly reflects the distribution of the layer normal in the sample.
To fit the experimental data we use the REFLAN software package.7,8 This program
calculates the reflected intensity using the recursive matrix formalism, taking the deviations
from the ideal decay of the reflectivity for a perfectly smooth surface due to the presence of
roughness into account. The fitting consists of two stages. In the first step the program finds
( ). 2exp 2,
1
1, jiji
jj
jjjjj qq
qqqq
r σ−+−
=+
++
232.3 Surface x-ray methods
the local minimum difference corresponding to the initial trail structure. During the second
stage this structure is progressively distorted exploring the whole parameter space and
eventually finding the global minimum. The method is also known as successive descent
from local minima. Constraining the parameters makes it possible to bias the process
towards relevant solutions. The calculated reflectivity profiles were convoluted with the
experimental resolution. During the minimization process the experimental errors are taken
into account by weighting the data accordingly.
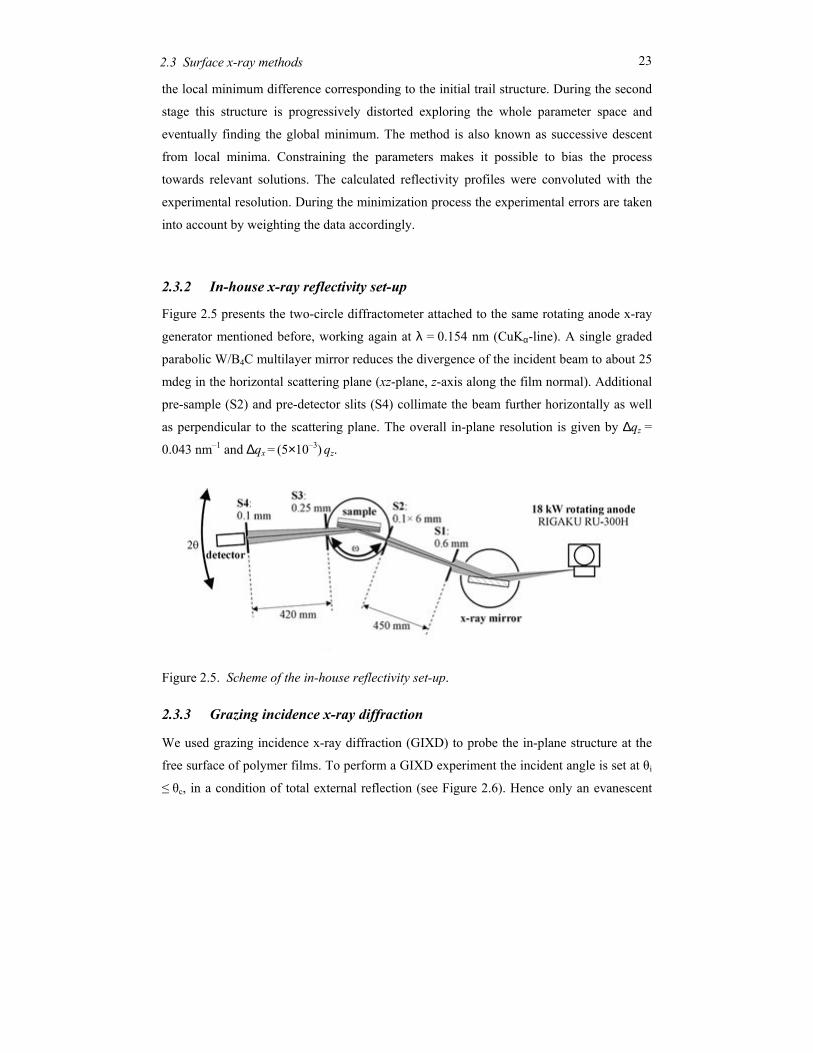
2.3.2 In-house x-ray reflectivity set-up
Figure 2.5 presents the two-circle diffractometer attached to the same rotating anode x-ray
generator mentioned before, working again at λ = 0.154 nm (CuKα-line). A single graded
parabolic W/B4C multilayer mirror reduces the divergence of the incident beam to about 25
mdeg in the horizontal scattering plane (xz-plane, z-axis along the film normal). Additional
pre-sample (S2) and pre-detector slits (S4) collimate the beam further horizontally as well
as perpendicular to the scattering plane. The overall in-plane resolution is given by ∆qz =
0.043 nm–1 and ∆qx = (5×10⁻³) qz.
Figure 2.5. Scheme of the in-house reflectivity set-up.
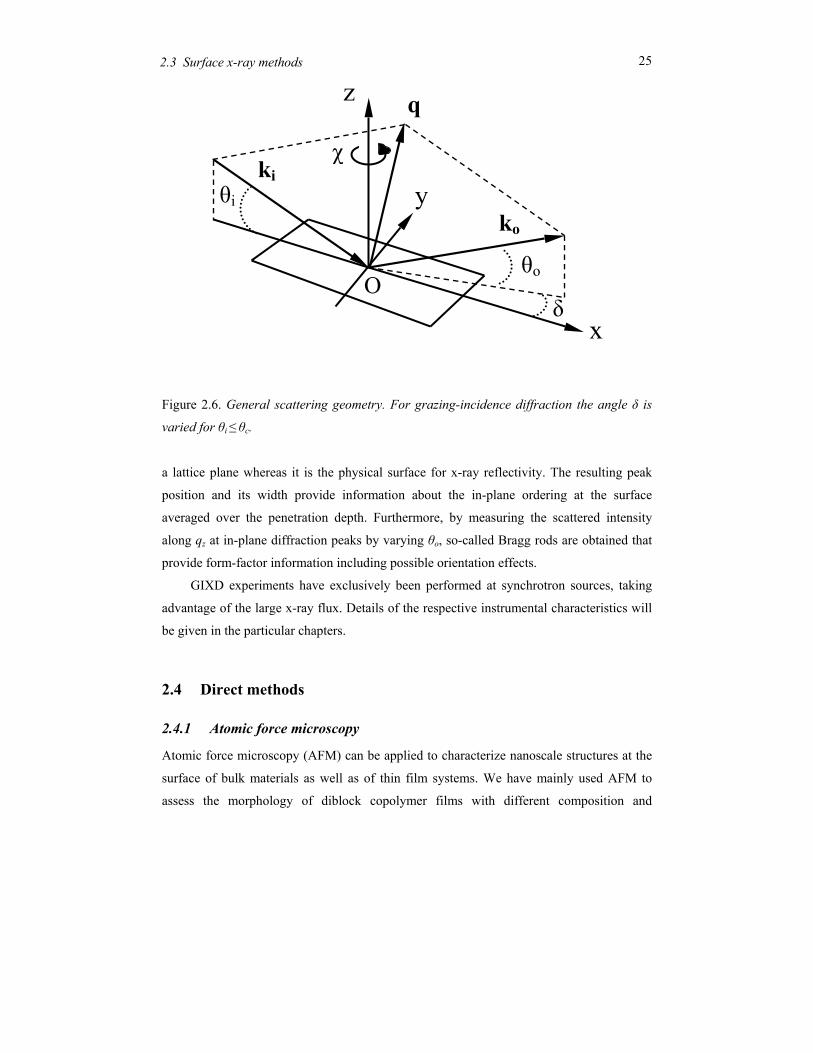
2.3.3 Grazing incidence x-ray diffraction
We used grazing incidence x-ray diffraction (GIXD) to probe the in-plane structure at the
free surface of polymer films. To perform a GIXD experiment the incident angle is set at θi
≤ θc, in a condition of total external reflection (see Figure 2.6). Hence only an evanescent
24 Chapter 2 Experimental
wave penetrates the sample below the surface. The amplitude of the evanescent wave
decays exponentially with the penetration depth Λ (1/e value), given by6
. (2.13)
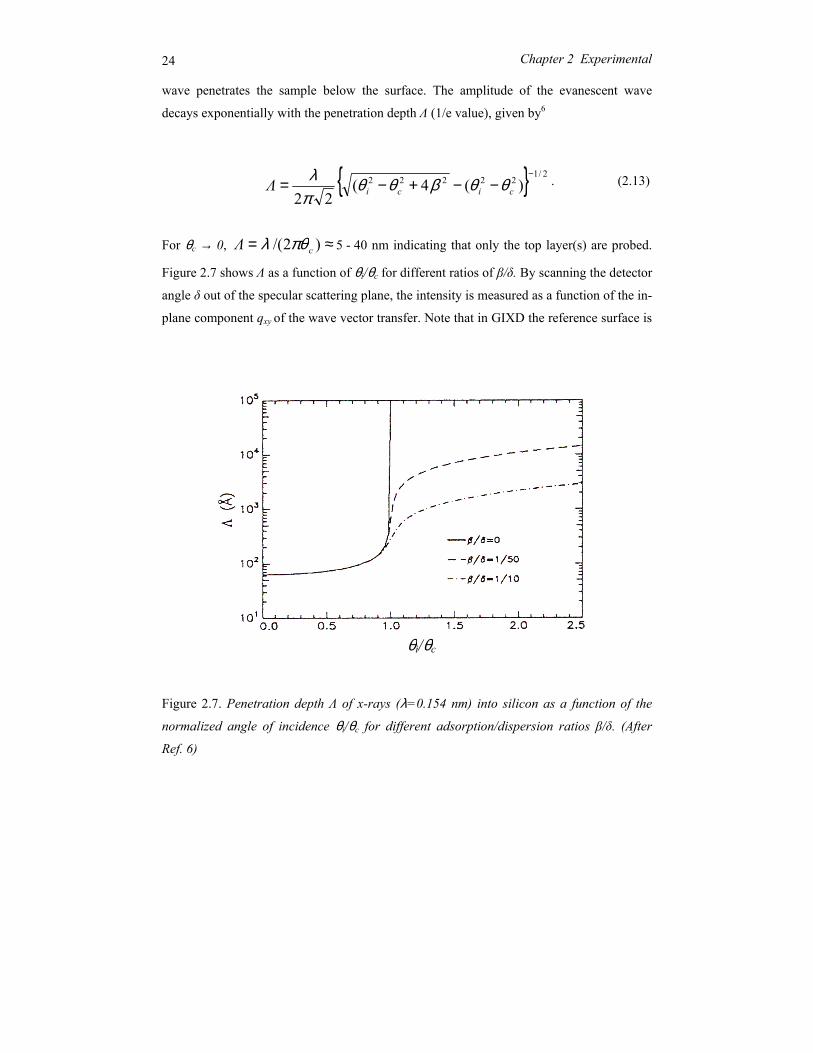
For θc → 0, ≈= )2/( cΛ πθλ 5 - 40 nm indicating that only the top layer(s) are probed.
Figure 2.7 shows Λ as a function of θi/θc for different ratios of β/δ. By scanning the detector
angle δ out of the specular scattering plane, the intensity is measured as a function of the in-
plane component qxy of the wave vector transfer. Note that in GIXD the reference surface is
Figure 2.7. Penetration depth Λ of x-rays (λ=0.154 nm) into silicon as a function of the
normalized angle of incidence θi/θc for different adsorption/dispersion ratios β/δ. (After
Ref. 6)
θi/θc
{ } 2/122222 )(4(
22
−−−+−= ciciΛ θθβθθ
πλ
252.3 Surface x-ray methods
Figure 2.6. General scattering geometry. For grazing-incidence diffraction the angle δ is
varied for θi ≤ θc.
a lattice plane whereas it is the physical surface for x-ray reflectivity. The resulting peak
position and its width provide information about the in-plane ordering at the surface
averaged over the penetration depth. Furthermore, by measuring the scattered intensity
along qz at in-plane diffraction peaks by varying θo, so-called Bragg rods are obtained that
provide form-factor information including possible orientation effects.
GIXD experiments have exclusively been performed at synchrotron sources, taking
advantage of the large x-ray flux. Details of the respective instrumental characteristics will
be given in the particular chapters.
2.4 Direct methods
2.4.1 Atomic force microscopy
Atomic force microscopy (AFM) can be applied to characterize nanoscale structures at the
surface of bulk materials as well as of thin film systems. We have mainly used AFM to
assess the morphology of diblock copolymer films with different composition and
O
θi
θо
z
χ
y
q
ki
ko
δx
26 Chapter 2 Experimental
thickness. With AFM the deflection of a cantilever is measured due to the repulsive
interactions of an attached sharp tip with the surface. The microscopic movement of the tip
creates a force with a certain magnitude, which is mapped as a digital image of the surface
structure. In the resonant or tapping mode the tip oscillates with a particular frequency and
amplitude close to the surface. The surface forces in the vicinity of the sample lead to
damping of the vibrating amplitude, which yields information about the surface topography.
In addition the phase shift between the oscillator frequencies of driver and tip is monitored
to obtain a phase image. The latter provides information on the visco-elastic response of the
sample.
The experiments were performed using a Solver AFM from NT-MDT (Zelenograd,
Russian Federation). Typically a vibrating cantilever with a resonant frequency of about
300 kHz and a silicon tip with a radius of curvature less than 10 nm were used.
2.4.2 Optical microscopy
Optical microscopy with visible light reveals details with a resolution of the order of µm,
limited by the objective lens and the wavelength of the light. For block copolymers, it
allows assessment of processes such as melting, crystallization and order-disorder
transitions. We used a Leitz Orthoplan microscope equipped with a Linkam THMS600 hot
stage to examine thin film surfaces. All images were taken in the reflection mode using a
white light source in order to obtain interference colours.
2.5 Film preparation by spin-coating
Spin-coating is the preferred method for preparation of thin, uniform layers on a flat
surface. The process can be separated into two stages. The first one is deposition of an
excess amount of solution on a substrate fixed to a turntable. During the second stage the
substrate is accelerated up to the desired rotation speed (typically 2000-3000 rpm). The
centrifugal force associated with the rotation spreads the fluid while the volatile solvent
evaporates simultaneously. During this process the fluid thins gradually and in general quite
uniformly. Nevertheless edge effects are often observed. As the solution flows uniformly
272.5 Film preparation by spin-coating
outwards, droplets form at the edge of the substrate to be flung off. Thus, depending on
surface tension, viscosity, rotation speed and time, a small difference in the thickness may
be found between the rim and the central part of the final coating.
In the present work the substrate was always a silicon wafer, covered by a natural SiO2
layer. The spin-coating process took place in a class 100 dust-free cabinet. In addition the
polymer solutions were applied through a sub-micron filter to eliminate dust particles from
the solvent that could lead to flaws. After spinning the films were annealed in an inert
atmosphere at 50-60oC to remove the final traces of solvent. Depending on the system,
subsequently the sample was annealed at higher temperatures to reach equilibrium ordering
corresponding to the preferential affinity of its components to the surfaces.
28 Chapter 2 Experimental
References
[1] Warren, B, E., X-ray Diffraction (Dover Publications, New York), 1990.
[2] Hukins, D. W. L., X-ray Diffraction by Disordered and Ordered Systems (Pergamon
Press, Oxford), 1984.
[3] Sentenac, D., Shalaginov, A. N., Fera, A., de Jeu, W. H., J. Appl. Crystallogr. 33,
130, 2000.
[4] Born, M., Wolf, E., Principles of Optics (Pergamon, Oxford), 1959.
[5] Parrat, L. G., Phys. Rev. 95, 359, 1954.
[6] Tolan, M., X-ray Scattering from Soft-Matter Thin Films (Springer, Berlin), 1998.
[7] Samoilenko, I. I., Shchedrin, B. M., Feigin, L, A., Physica B 221, 542, 1996.
[8] Samoilenko, I. I., Konovalov, O. V., Feigin, L, A., Shchedrin, B. M., Yanusova, L.
G., Cryst. Rep. 44, 310, 1999.
29
Chapter 3 Microphase separation and
crystallisation in bulk and thin films of
diblock copolymers
In this chapter we consider microphase separation and crystallisation in a series of
poly(butadiene-b-ethyleneoxide) diblock copolymers. Two approximately symmetric
compounds with different molecular masses form lamellar phases. They are investigated in
bulk and in thin films with respect to the microphase separation and the crystallisation of
the polyethyleneoxide block. In the latter case the amorphous block provides a rubbery
confinement for the crystallisation process. In addition an asymmetric compound is
considered with an hexagonal cylinder morphology in the bulk. In this situation the
crystallisation of the polyethyleneoxide block leads to competition and coupling of the
microphase separation and the crystallisation. .
30 Chapter 3
3.1 Introduction
Semicrystalline-amorphous block copolymers provide unique opportunities to examine the
interplay of various types of phase transitions, resulting in a rich phase behaviour including
molecular ordering over several length scales. Below the order-disorder transition at a
temperature TODT, microphase separation drives the formation of nanoscale lamellae,
cylinders or other structures, depending on the degree of incompatibility and the volume
fractions of the A- and B-blocks.1 However, upon crystallisation of one of the blocks the
development of crystalline lamellae is favoured.2-4 These processes depend strongly on the
particular morphology, the degree of supercooling and the nature of the confinement.5,6 In
particular when TODT and the melting temperature Tm are close, competition and coupling
between the microphase separation and crystallisation can occur.7
In the block copolymer melt mesophases are stabilized by competition between the
interfacial and conformational contributions to the free energy of the chains. The former
arises from the contact interaction between chemically dissimilar segments and drives the
system to minimize the interfacial area of the morphology; the latter is entropic in origin
and drives the blocks to adopt random coil conformations. The degree of segregation is
controlled by χN, where χ is the Flory-Huggins interaction parameter (see Sec. 1.2) and N is
the number of monomers. From the classic work of Leibler,8 the mean-field order-disorder
transition for symmetric diblock copolymers occurs for weak segregation at (χN)ODT = 10.5.
The knowledge of polymer crystallisation and the resulting morphology is a key to
understand many aspects of polymer ordering and self-assembly. The chain folding that
usually accompanies polymer crystallisation9,10 depends strongly on the kinetic pathways of
the process. Recent progress in understanding polymer crystallisation using advanced
techniques indicates pre-ordering occurring in the early stages of the process. Though the
exact nature of these effects is still a matter of considerable debate10-12 some form of
consensus has evolved about the existence of local ordering of the polymer chains as a basis
for the formation of a nucleus. In addition computer simulations have also strongly
challenged some of the accepted textbook ideas about the onset of crystallisation.13,14 In this
context the application of external ‘fields’ exerted by pressure, shear flow or well-defined
boundary conditions, provides a means to influence and possibly to control the pathways to
31 3.1 Introduction
nucleation and chain folding. In the case of diblock copolymers with one semicrystalline
block, a specific situation occurs of confined crystallisation within the microphase-
separated morphology. Interestingly in such a system equilibrium chain folding can be
achieved.2-4 A structure of alternating amorphous and crystalline layers has been predicted,
the latter with regular chain folding with chain stems perpendicular to the interface. The
alternative situation of extended crystallised chains cannot be an equilibrium situation (as is
the case for homopolymers), as it would lead to strongly increased entropy due to the
necessary accompanying stretching of the chains of the amorphous block. In spite of the
extensive bulk work, far less is known about confined crystallisation of a semi-crystalline
block in thin films. Evidently in the lamellar morphology thin block copolymer films
provide a precise control of the boundary conditions over macroscopic areas.
Bulk investigations of diblock copolymer systems with one crystallisable block are
numerous and have been reviewed.15 Depending on TODT, the crystallisation temperature Tcr
of the crystallisable block, and the glass transition temperature Tg of the amorphous block,
the confinement can be hard (Tcr < Tg < TODT) or soft (Tg < Tcr < TODT). The type of
morphology determines whether the confinement is one-, two-, or three-dimensional,
respectively.5,6 However, because of the covalent connection between the amorphous and
the crystalline block, the confinement is not simply geometrical. Both theory and
experiment indicate that the molecular chains are highly stretched in the ordered phase well
below TODT, creating a low-entropy molten state.16.17 This can be expected to influence the
nucleation process and thus the crystallisation kinetics. Furthermore, when Tcr and TODT are
of the same order of magnitude, coupling and competition can occur between the
crystallisation and the microphase separation process.
In the present context recent work involving PEO is of special interest. Crystallisation
in a series of PEO-b-PBO (polybutyleneoxide) and PEO-b-PPO (polypropyleneoxide) was
studied by Ryan and co-workers.18-21 Cheng and co-workers5 investigated the PEO-b-PS
(polystyrene) system. In that case the PEO crystallisation from a microphase separated melt
takes place between hard glassy PS boundaries. Depending on the morphology this can lead
to a ‘breaking out’ of the crystalline structure from the original morphology, which is
destroyed. Lamellar diblock copolymers consisting of an amorphous hydrogenated
polybutadiene block and a crystallisable polyethyleneoxide block, indicated as BE or PBh-
b-PEO, have been studied as model systems for confined crystallisation.22 In thin films of
32 Chapter 3
B3700E4300 with an approximately symmetric composition (E volume fraction 47%) the
lamellae orient parallel to the substrate, which results in many orders of Bragg peaks in x-
ray reflectivity measurements.23 The slightly more asymmetric diblock B3700E2900 (E
volume fraction 37%) revealed a rather different bulk and surface behaviour.24,25 In
particular in thin films for specific supercooling a unique structure of crystalline lamellae
perpendicular to the substrate was found.
In this chapter we focus on the morphology of BE block copolymers with different
volume fractions and molecular weights in the molten and crystalline state. In Sec. 3.4 we
compare – both for bulk and thin films – the approximately symmetric compound B3700E4300
with B1270E1450 that has similar relative volume fraction but a much lower molecular weight.
This brings the ODT relatively close to the melting point of the PEO block. In Sec. 3.5 we
consider the differences with the slightly asymmetric situation of B3700E2900. These results
are preceded by a summary of the background of diblock microphase separation in Sec. 3.2
and of the experimental aspects in Sec. 3.3.
3.2 Block copolymer microphase separation
As preparation for the discussion in the subsequent sections, we give in this part a summary
of the phase behaviour of diblock copolymers, following largely the review of Bates and
Fredrickson.26 Microphase separation in AB diblock copolymers is driven by chemical
incompatibilities between the different A and B blocks. Unlike binary mixtures of low
molecular weight compounds, the entropy of mixing per unit volume of dissimilar polymers
is small and varies inversely with molecular mass. As a result, even small differences
between the two polymers A and B can produce excess free energy contributions leading to
demixing. The crucial element of block copolymers is that the chemical linkage between
the blocks prevents demixing on a macroscopic scale. The non-ideal part of the mixing free
energy is described in terms of the Flory-Huggins interaction parameter χAB, which gives
the free-energy penalty to put monomer A from an A-environment into a B-environment:
. (3.1)
)]([ BBAA2
1AB
BAB εεεχ +−=
TkZ
33 3.2 Block copolymer microphase separation
A positive χAB indicates net repulsion between species A and B, whereas a negative value
indicates a free energy drive towards mixing. Typically, χAB is positive and small compare
to unity. As χAB varies inversely with temperature, mixing is promoted as the temperature
rises. On another hand, in a block copolymer melt the thermodynamic forces driving
microphase separation are counterbalanced by entropy forces (chain elasticity), needed to
retain uniform density in a microphase separated structure. For a block of N monomers
extended to a distance R, in the harmonic approximation the elastic free energy can be
expressed as Felas = 3kBTR2/(2Na2), in which a is a monomer dimension. Overall, the
competing free-energy contributions of interaction energy and elastic energy determine the
phase behaviour of a block copolymer of a given composition and molecular mass.
To illustrate the essential physics of microphase separation, we consider the case of a
symmetric diblock copolymer of about equal volume fractions f of the A and B blocks,
which self-assembles into a lamellar phase. At low temperatures the segregation is strong,
leading to microdomains from nearly pure A and B, separated by interfaces that are much
narrower than the lamellar domain period L. The chains will be stretched up to R = L/2.
Assuming that the stretching is uniform we can write for the free energy of the lamellar
phase:
(3.2)
The first term is the stretching energy; the second term is expressed as a product of the AB
interfacial tension, ( ) 6// AB2
BAB χγ aTk= , and the interfacial area per chain,
σ = 2Na3/L. It describes interactions confined to the narrow interfacial region between A
and B microdomains. Minimization of the expression for Flam with respect to L leads to:
(3.3)
and
(3.4)
Note that the lamellar period scales as N2/3. Using Eq. 3.4 we can locate the order-disorder
phase boundary. In the disordered phase, the A and B blocks are homogeneously mixed.
. 8
3AB2
2B
lam σγ+=NaTLkF
3/26/1AB03.1 NaL χ=
( ) 3/1ABlam 19.1 NF χ=
34 Chapter 3
The free energy per chain can then be approximated by the AB contact
energy alone: ( ) 4/)/( ABBAABBdisorder NNffTkF χχ == . Equating Flam to Fdisorder leads
to (χABN)ODT = 10.4 as the location of the order-disorder transition. This result is remarkably
close to the mean-field value of 10.5 obtained by Leibler.8 Some earlier theoretical work in
this field was done by Helfand and Noolandi.27 More elaborate theories have been
developed by Semenov28 for the strong segregation limit χABN → ∞, and by Matsen and
Schick.29 Thus, symmetric diblock copolymers of high molecular mass or with strongly
incompatible blocks ( 5.10AB >Nχ ) are predicted to be microphase separated into
lamellae, whereas smaller copolymers or more compatible blocks ( 5.10AB <Nχ ) should
show no microphase separation.
So far we have restricted the discussion to a mean-field picture. However, above TODT
nonlinear effects of composition fluctuations appear and a weak stretching of the chains is
observed. Quite generally such thermally induced composition fluctuation can suppress the
critical point and produce a weak first-order transition. Hence as a consequence of the
connectivity of the blocks, symmetric or near-symmetric diblock copolymers are expected
to exhibit a first-order transition rather than critical behaviour. As the ODT is approached
from the high-temperature side, composition fluctuations grow as the respective blocks mix
into the opposite phase, and the junctions between blocks delocalize from the interphase
region. Frederickson and Helfand incorporated this fluctuation behaviour in the theory.30-32
As a result the mean-field prediction for symmetric diblock copolymers is modified to
(χABN)ODT ≈ 10.5 + 41N –1/3.
The theoretical mean-field phase diagram for AB diblock copolymers has been given in
Figure 1.3 together with a comparison to the experimental phase diagram for poly(isoprene-
b-styrene). As illustrated, the volume fraction controls which ordered structures are
accessible at temperatures below the ODT. Depending on the degree of incompatibility
χABN, several regimes have been identified. In the weak segregation limit corresponding to
χABN ≥ 10.5 the composition profile is essentially sinusoidal. In the strong segregation
regime, effectively pure A and B domains are separated by a narrow interphase region.
From Figure 1.3a we note that apart from the disordered melt five thermodynamically
stable microphase separated structures are predicted. The lamellar phase is stable for nearly
symmetric diblocks, while for intermediate levels of compositional asymmetry a
hexagonally packed cylinder phase is found. In this phase the longer A blocks reside on the
35 3.2 Block copolymer microphase separation
convex side of the AB interface, which allows a larger configurational entropy (or reduces
the elastic energy). A further increase of the compositional asymmetry leads to a body-
centered cubic phase, close-packed spheres and a complex periodic bicontinuous (gyroid)
phase. The experimental phase diagram (Figure 1.3b) shows similarity with the overall
topology of the predicted phase diagram, with a few exceptions. In particular an overall
asymmetry is observed that can be attributed to conformational asymmetry (different sizes
and shapes of the monomers) not incorporated in the present theory. Secondly, the
experimental phase diagram contains a small region of a second complex phase, the
perforated lamellae (PL). The PL phase is considered to be thermodynamically not stable,
but to be a rather long-lived transient structure with epitaxial relations to the cylindrical and
lamellar phases.33 However, this is to some extent still a matter of dispute. The
identification of this phase will be discussed in Sec. 3.5. A final discrepancy between
Figures 1.3a and 1.3b concerns the region of the phase diagram near the ODT. In the
experimental diagram clearly direct transitions between the disordered phase and the
various ordered phases are present. In contrast, the theory predicts all order-order lines to
converge to a single critical point at 5.10=NABχ and fA = ½. This discrepancy is due to
composition fluctuations that become important near the weakly first-order ODT,
particularly for symmetric melts.
Finally we come to the nature of the x-ray scattering around the ODT. In the mean-field
approximation the structure factor for the melt of a diblock copolymer AB is given by8
, (3.5)
where x = (qRG)2. According to Eq. 3.1 χ ~ 1/T, but χ is independent of molecular mass and
composition. As F(x, f) does not contain χ it is independent of temperature. Hence plotting
S–1(q) against reciprocal absolute temperature T–1 should give a linear relation. Going
beyond mean-field theory Eq. 3.5 should be expanded to30
, (3.6)
where c is a constant. At the lamellar ODT c ≈ 90. Upon introducing fluctuations the
scattering curve retains its shape and the position of the maximum at q*. As the last term in
NfxFqNS χ2),()(1 −=−
3/11 2),()( −− +−= cNNfxFqNS χ
36 Chapter 3
Eq. 3.6 is independent of q, only the peak height will be affected. At high temperatures in
the disordered phase the inverse intensity determined by S –1(q) decreases linearly with T −1
following the mean field result, Eq. 3.5. As the ODT is approached, composition
fluctuations become more important and show up in a plot of S –1(q) as a function of T –1 as
pronounced deviation from linearity.34
3.3 Experimental
3.3.1 Materials
We used poly(butadiene-b-ethyleneoxide) diblock copolymers differing in molecular mass
and volume fraction, which are summarised in Table 3.1. The samples B3700E4300 and
B3700E2900 were obtained from Goldschmidt AG (Germany) and B1270E1450 from Polymer
Source Inc (Canada). Synthesis was done by sequential anionic polymerization of ethylene
oxide and butadiene (about equal amounts of 1,2 and 1,4 units, statistically distributed). The
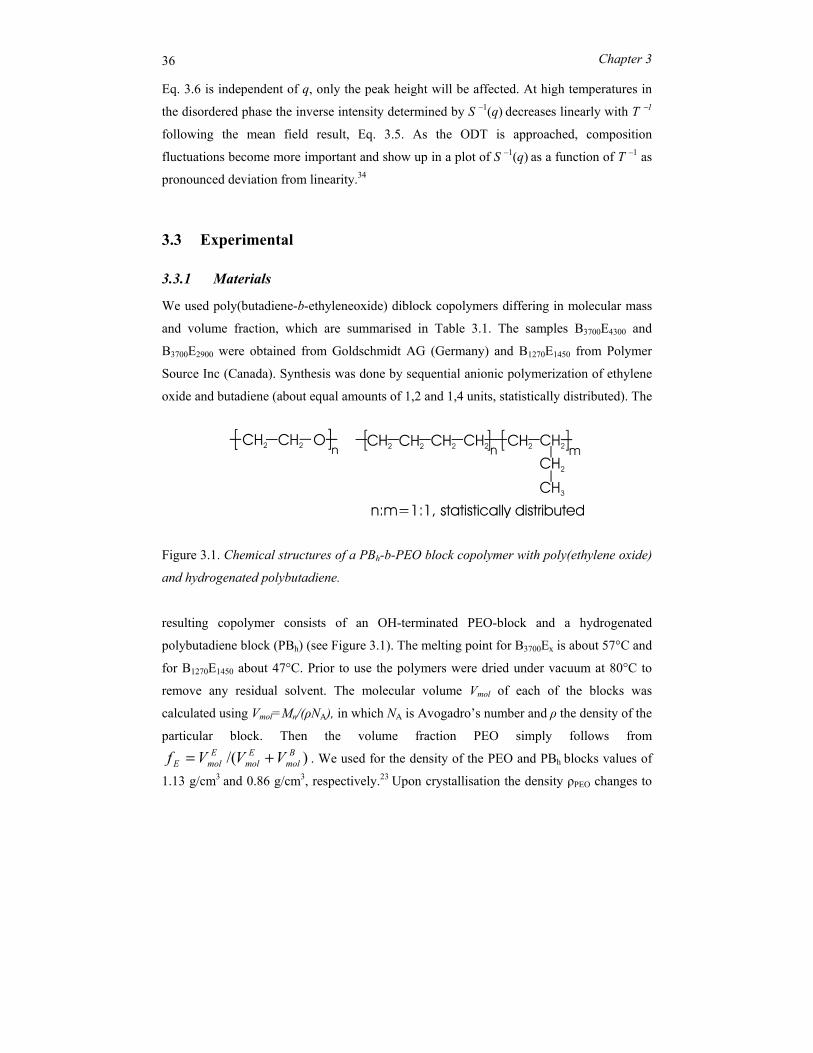
Figure 3.1. Chemical structures of a PBh-b-PEO block copolymer with poly(ethylene oxide)
and hydrogenated polybutadiene.
resulting copolymer consists of an OH-terminated PEO-block and a hydrogenated
polybutadiene block (PBh) (see Figure 3.1). The melting point for B3700Ex is about 57°C and
for B1270E1450 about 47°C. Prior to use the polymers were dried under vacuum at 80°C to
remove any residual solvent. The molecular volume Vmol of each of the blocks was
calculated using Vmol=Mn/(ρNA), in which NA is Avogadro’s number and ρ the density of the
particular block. Then the volume fraction PEO simply follows from
)/( Bmol
Emol
EmolE VVVf += . We used for the density of the PEO and PBh blocks values of
1.13 g/cm3 and 0.86 g/cm3, respectively.23 Upon crystallisation the density ρPEO changes to
37 3.3 Experimental
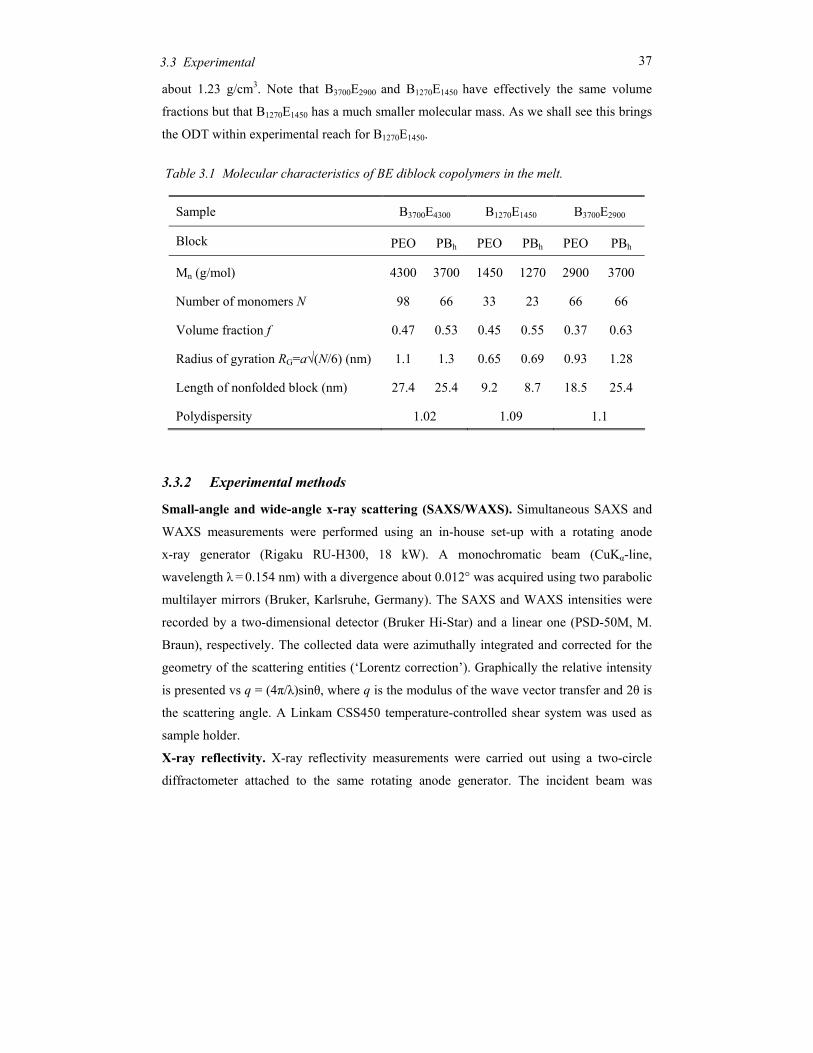
about 1.23 g/cm3. Note that B3700E2900 and B1270E1450 have effectively the same volume
fractions but that B1270E1450 has a much smaller molecular mass. As we shall see this brings
the ODT within experimental reach for B1270E1450.
Table 3.1 Molecular characteristics of BE diblock copolymers in the melt.
3.3.2 Experimental methods
Small-angle and wide-angle x-ray scattering (SAXS/WAXS). Simultaneous SAXS and
WAXS measurements were performed using an in-house set-up with a rotating anode
x-ray generator (Rigaku RU-H300, 18 kW). A monochromatic beam (CuKα-line,
wavelength λ = 0.154 nm) with a divergence about 0.012° was acquired using two parabolic
multilayer mirrors (Bruker, Karlsruhe, Germany). The SAXS and WAXS intensities were
recorded by a two-dimensional detector (Bruker Hi-Star) and a linear one (PSD-50M, M.
Braun), respectively. The collected data were azimuthally integrated and corrected for the
geometry of the scattering entities (‘Lorentz correction’). Graphically the relative intensity
is presented vs q = (4π/λ)sinθ, where q is the modulus of the wave vector transfer and 2θ is
the scattering angle. A Linkam CSS450 temperature-controlled shear system was used as
sample holder.
X-ray reflectivity. X-ray reflectivity measurements were carried out using a two-circle
diffractometer attached to the same rotating anode generator. The incident beam was
Sample B3700E4300 B1270E1450 B3700E2900
Block PEO PBh PEO PBh PEO PBh
Mn (g/mol) 4300 3700 1450 1270 2900 3700
Number of monomers N 98 66 33 23 66 66
Volume fraction f 0.47 0.53 0.45 0.55 0.37 0.63
Radius of gyration RG=a√(N/6) (nm) 1.1 1.3 0.65 0.69 0.93 1.28
Length of nonfolded block (nm) 27.4 25.4 9.2 8.7 18.5 25.4
Polydispersity 1.02 1.09 1.1
38 Chapter 3
monochromatized to λ = 0.154 nm and collimated to a divergence of about 0.025° in the
horizontal scattering plane (xz-plane with the z-axis along the film normal) by a W/B4C
graded parabolic multilayer mirror (Osmic, Auburn Hills, USA). Additional pre-sample and
pre-detector slits lead to an overall in-plane resolution given by ∆qz = 0.043 nm–1 and ∆qx =
5 × 10⁻³qz.
In reciprocal space specular reflectivity scans probe the scattered intensity along qz.
The x-ray intensity was corrected for sample size effects at small incidence angles as well
as for background scattering; the incident intensity was normalized to unity. The data was
analysed by an iterative matrix formalism derived from the Fresnel equations, using the
REFLAN software package (see Sec. 2.3.1) The calculated reflectivity profiles were
convoluted with the experimental resolution, assumed to be of Gaussian statistics
Optical microscopy. A Leitz Orthoplan microscope equipped with a Linkam THMS600
hot stage was used to examine thin film surfaces. All images were taken in the reflection
mode using a white light source in order to obtain interference colours. The samples were
kept in a dry nitrogen atmosphere.
Atomic force microscopy (AFM). Height and phase images of the crystalline morphology
of the diblock copolymers were taken using a Solver AFM from NT-MDT (Zelenograd,
RF) at ambient conditions in the tapping mode. A vibrating cantilever with a resonant
frequency of about 300 kHz and a silicon tip with a radius of curvature less than 10 nm
were used. To examine the bulk crystalline morphology by AFM the crystallized samples
were quenched in liquid nitrogen and cut. As discussed earlier7 in this way surfaces smooth
enough for AFM imaging can be obtained that reflect the bulk morphology.
Transmission electron microscopy (TEM). TEM measurements were carried out by P.M.
Frederik and P.H.H. Bomans at the Department of Pathology, Electron Microscopy,
University of Limburg, Maastricht, using a CM12 microscope (Philips, Eindhoven, The
Netherlands). Cryo-sections were obtained from bulk BE36 and observed at low
temperatures in the electron microscope using low-dose conditions for imaging. A small
part of the sample (less than a cubic mm) was mounted on a silver pin, frozen by dropping
into liquid nitrogen and mounted in a Leica Ultracut S (Vienna, Austria) equipped with an
FCS attachment for low temperature sectioning. At –70oC thin sections were cut on a ‘dry’
diamond knife. Smooth sections were collected with a dry eye-lash probe and pressed by
hand onto the carbon coated formvar supporting film of a specimen grid. The grids were
39 3.3 Experimental
transferred to the cryo-holder (Gatan 626, Pleasanton, Ca USA) of the microscope using the
cryo-transfer station. During observation and imaging the temperature was kept at –170oC
to minimize beam damage.
3.3.3 Samples preparation and measurement procedure
For SAXS the polymer was put between two pieces of a kapton foil separated by a metal
ring fixing the thickness to about 0.5 mm and put in the sample holder. In order to probe the
polymer morphology in the melt we initially kept the sample at 90°C for 10 min and then
cooled it down to 40°C. Subsequently we increased the temperature and took SAXS scans
at various temperatures up to 300°C. To study bulk crystallisation again each sample was
kept at 90°C for 10 min and then cooled to the crystallisation temperature Tcr at about
10°C/min. The SAXS and WAXS signals were monitored simultaneously in order to track
the crystallisation process. The measurements were done in a dry nitrogen atmosphere and
no degradation effects were observed during the annealing at 90oC.
Thin films were prepared by spincoating low-concentration solutions of diblock
copolymer in dichloromethane (DCM) on a silicon wafer at 2000 rpm. The wafers were
first cleaned in chromic acid for about 10 min and then rinsed in ultra-pure water. During x-
ray reflectivity measurements the sample was kept in a two-stage oven regulated within
0.1ºC by a Eurotherm controller and evacuated to ~102 Pa. The films were annealed at
Tann = 90ºC and then cooled down to Tcr at about 10ºC/min.
3.4 Symmetric PBh-b-PEO systems
3.4.1 Microphase separation
First we present experimental results concerning the phase-separated morphology of the
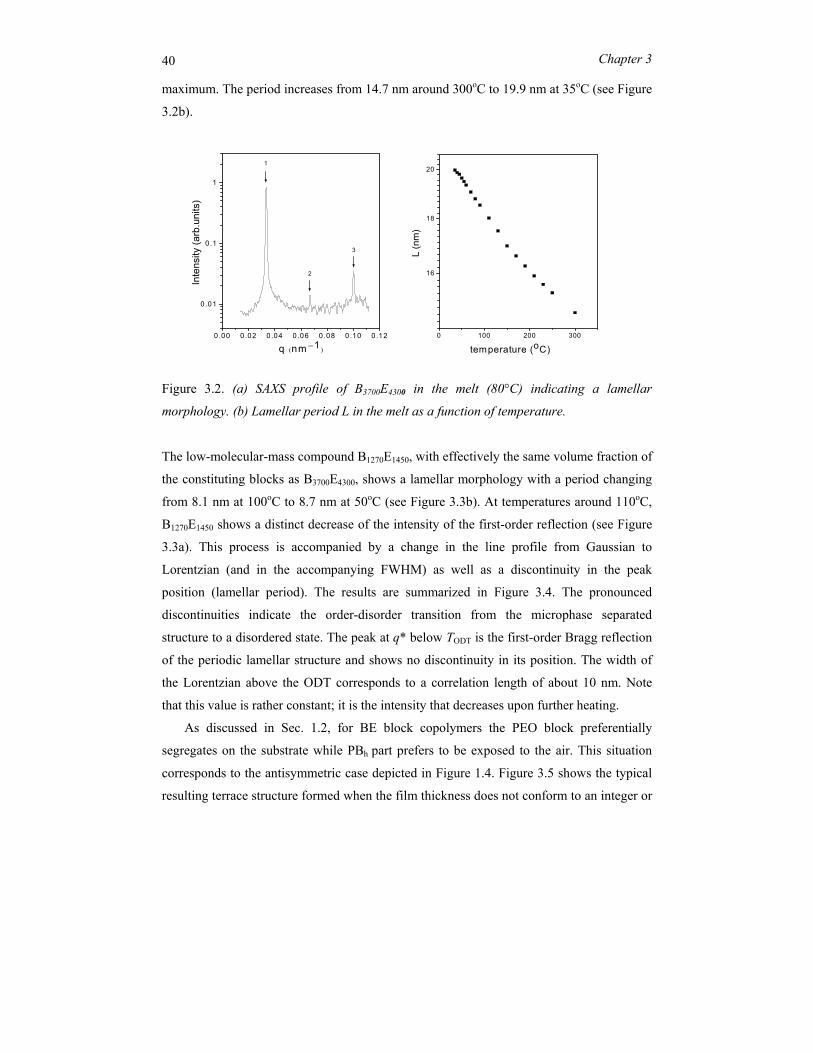
symmetric diblock copolymers B3700E4300 and B1270E1450 in the bulk melt. Figure 3.2a shows
an overview of the SAXS patterns for B3700E4300. For temperatures up to 300 °C the block
copolymer remains phase separated, hence TODT is well above this value. Pronounced
scattering peaks appear at relative positions 1:2:3, which corresponds to a lamellar phase
with long period L = 2π/q* in which q* is the position of the first-order scattering
40 Chapter 3
maximum. The period increases from 14.7 nm around 300oC to 19.9 nm at 35oC (see Figure
3.2b).
Figure 3.2. (a) SAXS profile of B3700E4300 in the melt (80°C) indicating a lamellar
morphology. (b) Lamellar period L in the melt as a function of temperature.
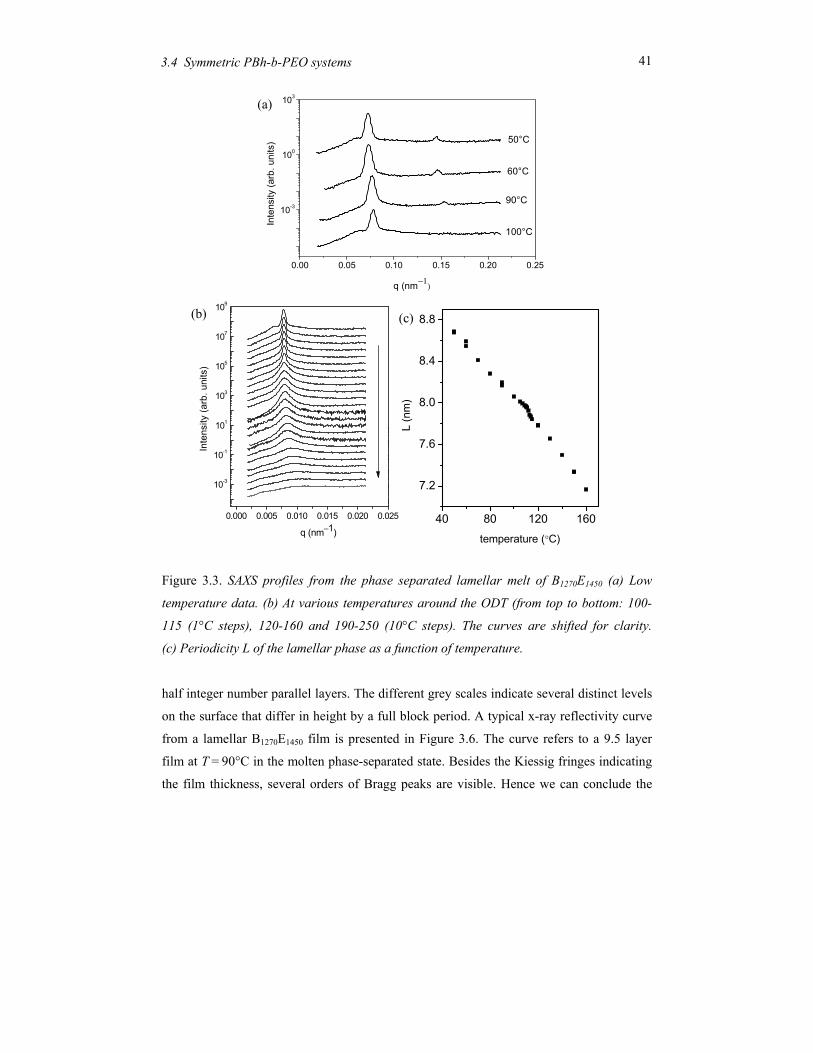
The low-molecular-mass compound B1270E1450, with effectively the same volume fraction of
the constituting blocks as B3700E4300, shows a lamellar morphology with a period changing
from 8.1 nm at 100oC to 8.7 nm at 50oC (see Figure 3.3b). At temperatures around 110oC,
B1270E1450 shows a distinct decrease of the intensity of the first-order reflection (see Figure
3.3a). This process is accompanied by a change in the line profile from Gaussian to
Lorentzian (and in the accompanying FWHM) as well as a discontinuity in the peak
position (lamellar period). The results are summarized in Figure 3.4. The pronounced
discontinuities indicate the order-disorder transition from the microphase separated
structure to a disordered state. The peak at q* below TODT is the first-order Bragg reflection
of the periodic lamellar structure and shows no discontinuity in its position. The width of
the Lorentzian above the ODT corresponds to a correlation length of about 10 nm. Note
that this value is rather constant; it is the intensity that decreases upon further heating.
As discussed in Sec. 1.2, for BE block copolymers the PEO block preferentially
segregates on the substrate while PBh part prefers to be exposed to the air. This situation
corresponds to the antisymmetric case depicted in Figure 1.4. Figure 3.5 shows the typical
resulting terrace structure formed when the film thickness does not conform to an integer or
0.00 0.02 0.04 0.06 0.08 0.10 0.12
0.01
0.1
1
3
2
1
Inte
nsity
(arb
.uni
ts)
q (nm −1 )
0 100 200 300
16
18
20
L (n
m)
temperature (oC)
41 3.4 Symmetric PBh-b-PEO systems
Figure 3.3. SAXS profiles from the phase separated lamellar melt of B1270E1450 (a) Low
temperature data. (b) At various temperatures around the ODT (from top to bottom: 100-
115 (1°C steps), 120-160 and 190-250 (10°C steps). The curves are shifted for clarity.
(c) Periodicity L of the lamellar phase as a function of temperature.
half integer number parallel layers. The different grey scales indicate several distinct levels
on the surface that differ in height by a full block period. A typical x-ray reflectivity curve
from a lamellar B1270E1450 film is presented in Figure 3.6. The curve refers to a 9.5 layer
film at T = 90°C in the molten phase-separated state. Besides the Kiessig fringes indicating
the film thickness, several orders of Bragg peaks are visible. Hence we can conclude the
40 80 120 160
7.2
7.6
8.0
8.4
8.8
L (n
m)
temperature (°C)
0.000 0.005 0.010 0.015 0.020 0.025
10-3
10-1
101
103
105
107
109
Inte
nsity
(arb
. uni
ts)
q (nm−1)
0.00 0.05 0.10 0.15 0.20 0.25
10-3
100
103
50°C
60°C
90°C
Inte
nsity
(arb
. uni
ts)
q (nm−1)
100°C
(а)
(b) (c)
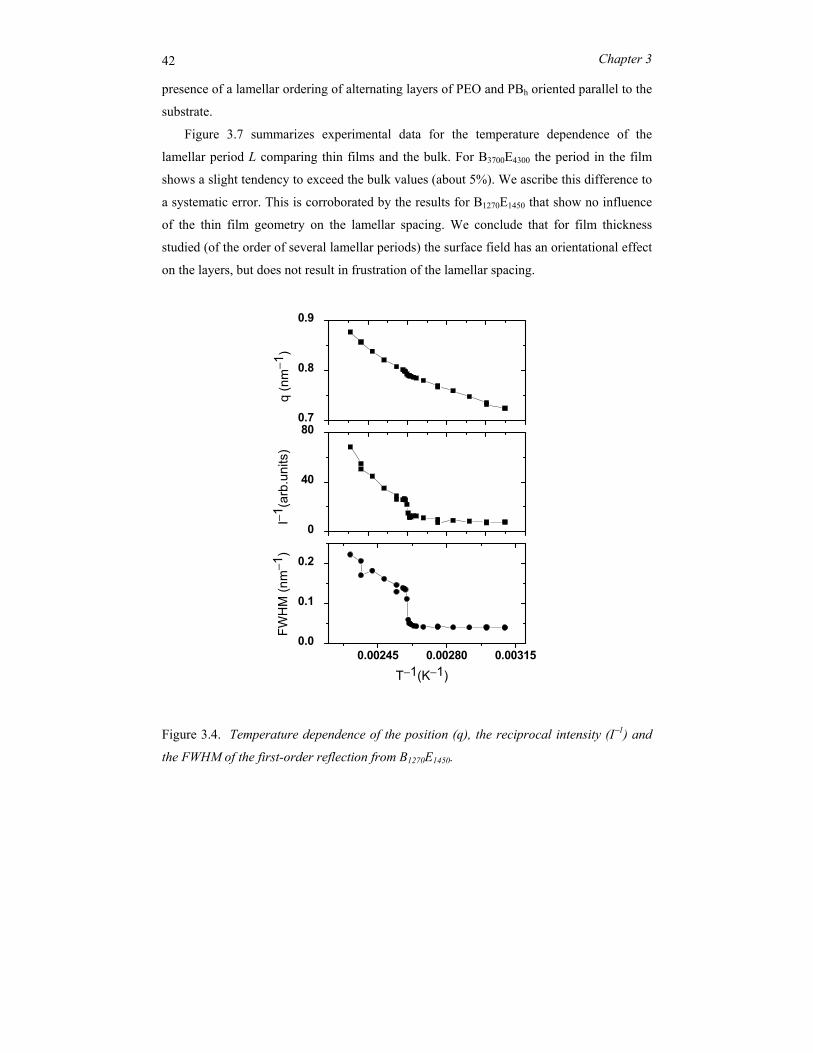
42 Chapter 3
presence of a lamellar ordering of alternating layers of PEO and PBh oriented parallel to the
substrate.
Figure 3.7 summarizes experimental data for the temperature dependence of the
lamellar period L comparing thin films and the bulk. For B3700E4300 the period in the film
shows a slight tendency to exceed the bulk values (about 5%). We ascribe this difference to
a systematic error. This is corroborated by the results for B1270E1450 that show no influence
of the thin film geometry on the lamellar spacing. We conclude that for film thickness
studied (of the order of several lamellar periods) the surface field has an orientational effect
on the layers, but does not result in frustration of the lamellar spacing.
Figure 3.4. Temperature dependence of the position (q), the reciprocal intensity (I−1) and
the FWHM of the first-order reflection from B1270E1450.
0.00245 0.00280 0.003150.0
0.1
0.2
T−1(K−1)
FWH
M (n
m−1
)
0
40
80
I−1(a
rb.u
nits
)
0.7
0.8
0.9
q (n
m−1
)
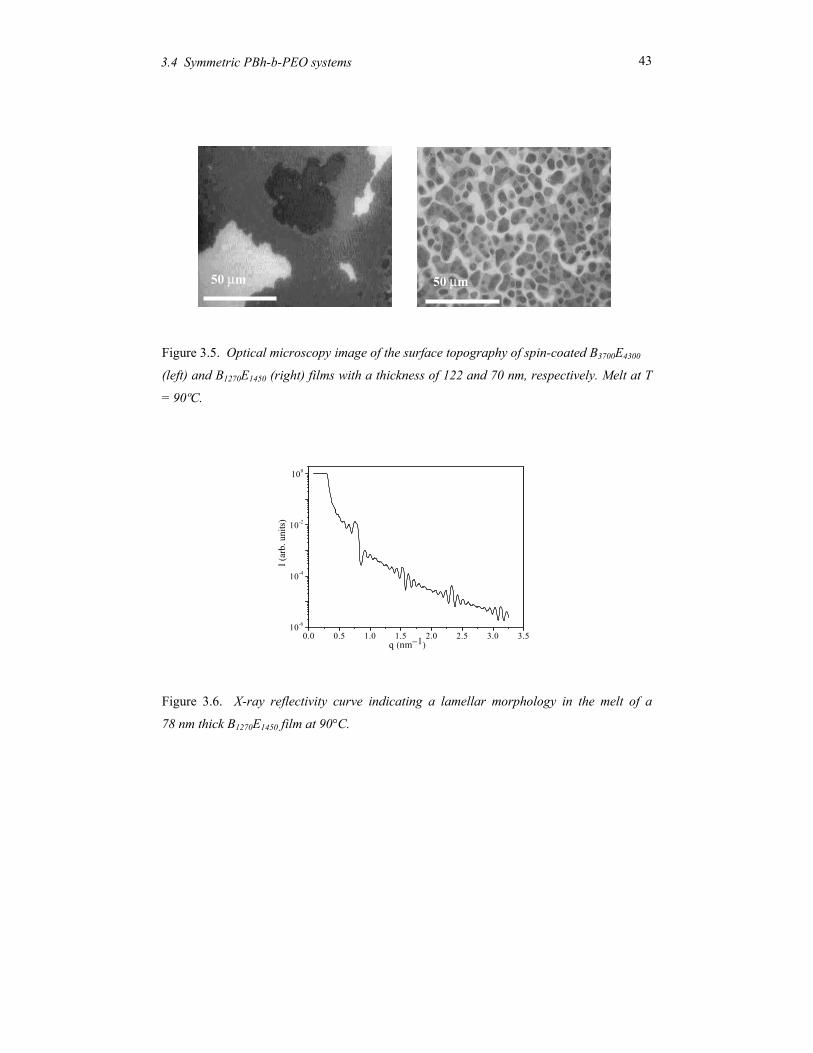
43 3.4 Symmetric PBh-b-PEO systems
Figure 3.5. Optical microscopy image of the surface topography of spin-coated B3700E4300
(left) and B1270E1450 (right) films with a thickness of 122 and 70 nm, respectively. Melt at T
= 90ºC.
Figure 3.6. X-ray reflectivity curve indicating a lamellar morphology in the melt of a
78 nm thick B1270E1450 film at 90°C.
50 µm 50 µm
0.0 0.5 1.0 1.5 2.0 2.5 3.0 3.510-6
10-4
10-2
100
I (ar
b. u
nits
)
q (nm−1)
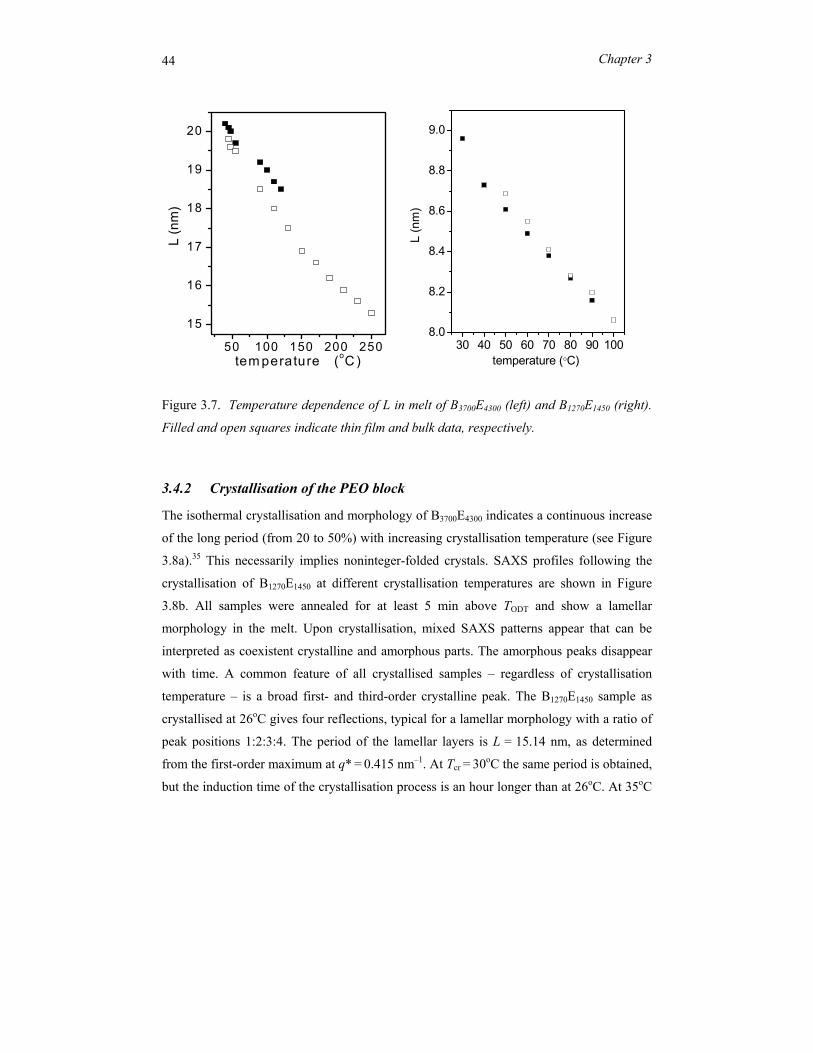
44 Chapter 3
Figure 3.7. Temperature dependence of L in melt of B3700E4300 (left) and B1270E1450 (right).
Filled and open squares indicate thin film and bulk data, respectively.
3.4.2 Crystallisation of the PEO block
The isothermal crystallisation and morphology of B3700E4300 indicates a continuous increase
of the long period (from 20 to 50%) with increasing crystallisation temperature (see Figure
3.8a).35 This necessarily implies noninteger-folded crystals. SAXS profiles following the
crystallisation of B1270E1450 at different crystallisation temperatures are shown in Figure
3.8b. All samples were annealed for at least 5 min above TODT and show a lamellar
morphology in the melt. Upon crystallisation, mixed SAXS patterns appear that can be
interpreted as coexistent crystalline and amorphous parts. The amorphous peaks disappear
with time. A common feature of all crystallised samples – regardless of crystallisation
temperature – is a broad first- and third-order crystalline peak. The B1270E1450 sample as
crystallised at 26oC gives four reflections, typical for a lamellar morphology with a ratio of
peak positions 1:2:3:4. The period of the lamellar layers is L = 15.14 nm, as determined
from the first-order maximum at q* = 0.415 nm–1. At Tcr = 30oC the same period is obtained,
but the induction time of the crystallisation process is an hour longer than at 26oC. At 35oC
50 100 150 200 250
15
16
17
18
19
20
L (n
m)
tem perature (oC )30 40 50 60 70 80 90 100
8.0
8.2
8.4
8.6
8.8
9.0
L (n
m)
temperature (°C)
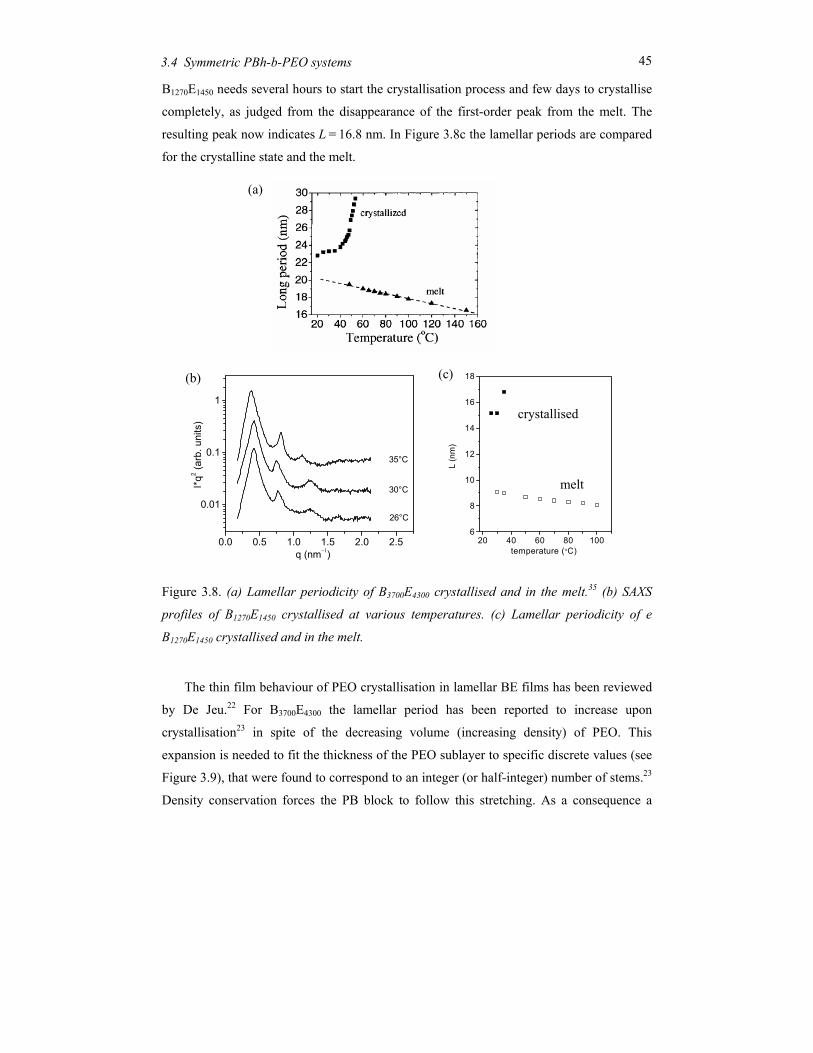
45 3.4 Symmetric PBh-b-PEO systems
B1270E1450 needs several hours to start the crystallisation process and few days to crystallise
completely, as judged from the disappearance of the first-order peak from the melt. The
resulting peak now indicates L = 16.8 nm. In Figure 3.8c the lamellar periods are compared
for the crystalline state and the melt.
Figure 3.8. (a) Lamellar periodicity of B3700E4300 crystallised and in the melt.35 (b) SAXS
profiles of B1270E1450 crystallised at various temperatures. (c) Lamellar periodicity of e
B1270E1450 crystallised and in the melt.
The thin film behaviour of PEO crystallisation in lamellar BE films has been reviewed
by De Jeu.22 For B3700E4300 the lamellar period has been reported to increase upon
crystallisation23 in spite of the decreasing volume (increasing density) of PEO. This
expansion is needed to fit the thickness of the PEO sublayer to specific discrete values (see
Figure 3.9), that were found to correspond to an integer (or half-integer) number of stems.23
Density conservation forces the PB block to follow this stretching. As a consequence a
20 40 60 80 1006
8
10
12
14
16
18
L (n
m)
temperature (°C)
melt
crystallised
(a)
0.0 0.5 1.0 1.5 2.0 2.5
0.01
0.1
1
30°C
35°C
26°C
I*q2 (a
rb. u
nits
)
q (nm−1)
(c) (b)

46 Chapter 3
lateral contraction results through the whole film resulting in macroscopic pits and cracks.
A microscopic picture of this effect is shown in Figure 10a; Figure 10b indicates a similar
behaviour for B1270E1450.
Fig. 3.9. Lamellar period L and sublayer thicknesses at various temperatures as determined
by fitting the x-ray reflectivity of a B3700E4300 film, indicating discrete values LPEO,cr for the
crystallised sublayer.23
Figure 3.10. Optical microscopy image of the surface topography of a crystallised (a)
B3700E4300 and (b) B1270E1450 at T = 30ºC.
25 30 35 40 45 50
10
15
20
25
melt
crystallizedLPBh + LPEO
LPEO_cr
LPBh
temperature (oC)
lam
ella
r per
iod
(n
m)
50 µm
(a) (b)
50 µm
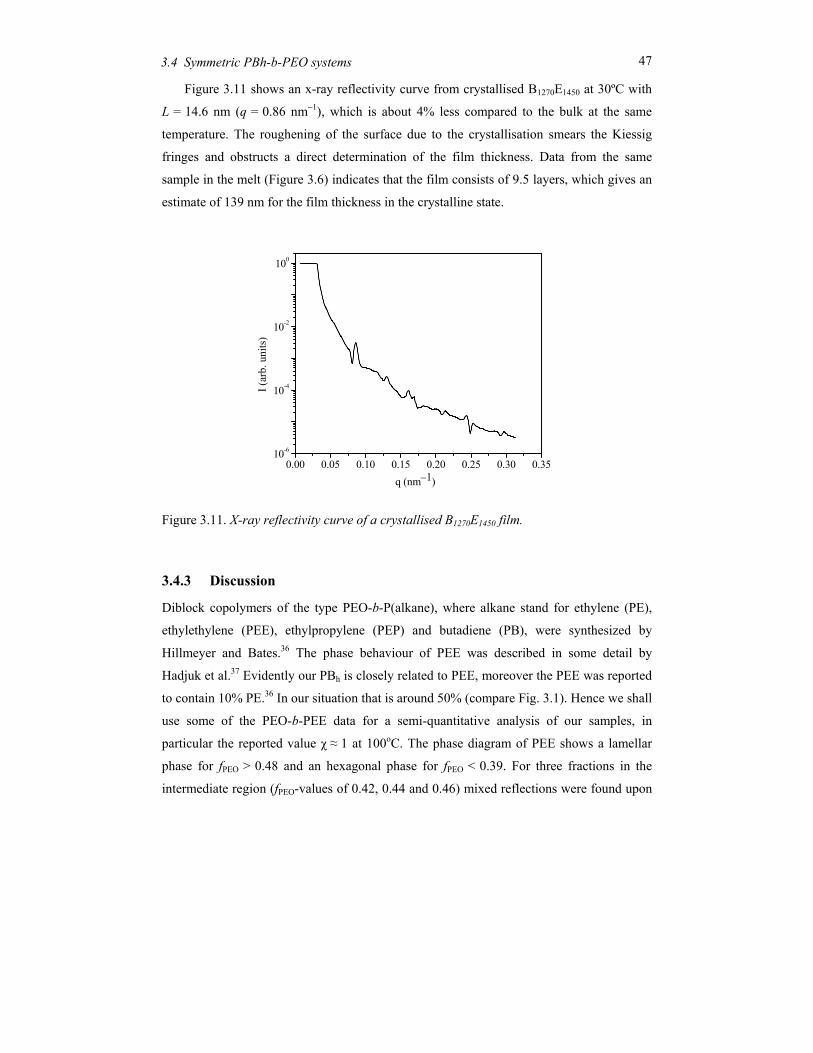
47 3.4 Symmetric PBh-b-PEO systems
Figure 3.11 shows an x-ray reflectivity curve from crystallised B1270E1450 at 30ºC with
L = 14.6 nm (q = 0.86 nm−1), which is about 4% less compared to the bulk at the same
temperature. The roughening of the surface due to the crystallisation smears the Kiessig
fringes and obstructs a direct determination of the film thickness. Data from the same
sample in the melt (Figure 3.6) indicates that the film consists of 9.5 layers, which gives an
estimate of 139 nm for the film thickness in the crystalline state.
Figure 3.11. X-ray reflectivity curve of a crystallised B1270E1450 film.
3.4.3 Discussion
Diblock copolymers of the type PEO-b-P(alkane), where alkane stand for ethylene (PE),
ethylethylene (PEE), ethylpropylene (PEP) and butadiene (PB), were synthesized by
Hillmeyer and Bates.36 The phase behaviour of PEE was described in some detail by
Hadjuk et al.37 Evidently our PBh is closely related to PEE, moreover the PEE was reported
to contain 10% PE.36 In our situation that is around 50% (compare Fig. 3.1). Hence we shall
use some of the PEO-b-PEE data for a semi-quantitative analysis of our samples, in
particular the reported value χ ≈ 1 at 100oC. The phase diagram of PEE shows a lamellar
phase for fPEO > 0.48 and an hexagonal phase for fPEO < 0.39. For three fractions in the
intermediate region (fPEO-values of 0.42, 0.44 and 0.46) mixed reflections were found upon
0.00 0.05 0.10 0.15 0.20 0.25 0.30 0.3510-6
10-4
10-2
100
I (ar
b. u
nits
)
q (nm−1)
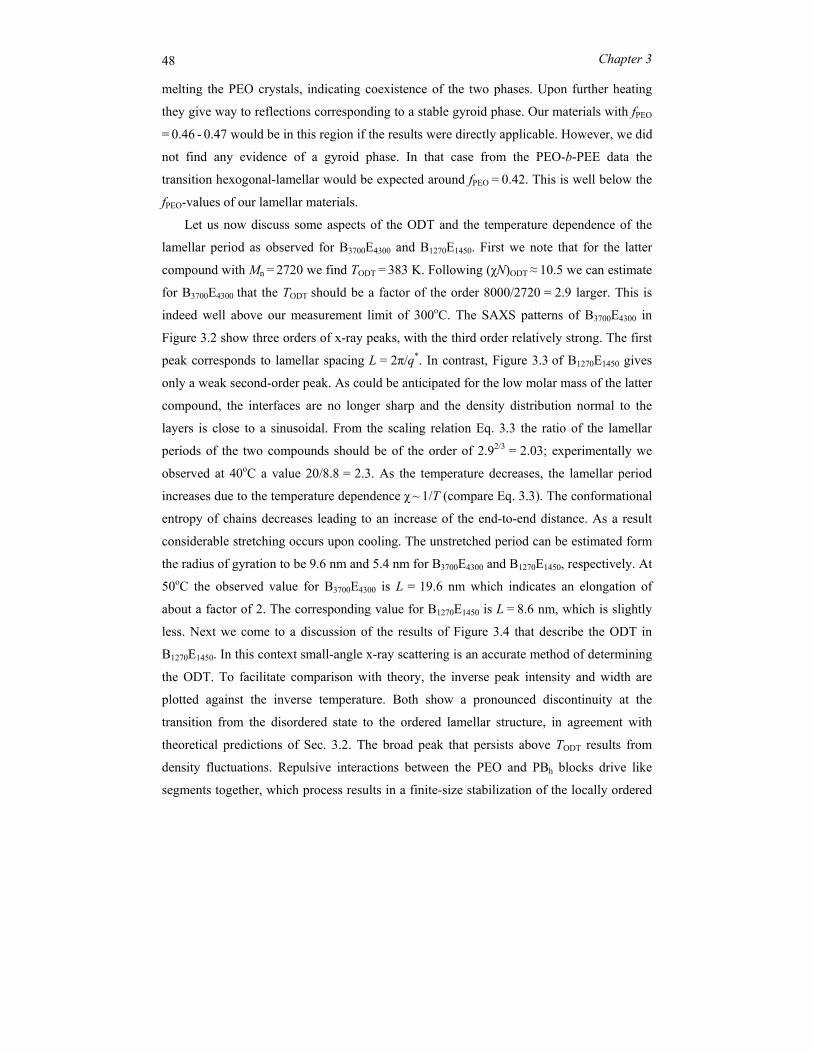
48 Chapter 3
melting the PEO crystals, indicating coexistence of the two phases. Upon further heating
they give way to reflections corresponding to a stable gyroid phase. Our materials with fPEO
= 0.46 - 0.47 would be in this region if the results were directly applicable. However, we did
not find any evidence of a gyroid phase. In that case from the PEO-b-PEE data the
transition hexogonal-lamellar would be expected around fPEO = 0.42. This is well below the
fPEO-values of our lamellar materials.
Let us now discuss some aspects of the ODT and the temperature dependence of the
lamellar period as observed for B3700E4300 and B1270E1450. First we note that for the latter
compound with Mn = 2720 we find TODT = 383 K. Following (χN)ODT ≈ 10.5 we can estimate
for B3700E4300 that the TODT should be a factor of the order 8000/2720 = 2.9 larger. This is
indeed well above our measurement limit of 300oC. The SAXS patterns of B3700E4300 in
Figure 3.2 show three orders of x-ray peaks, with the third order relatively strong. The first
peak corresponds to lamellar spacing L = 2π/q*. In contrast, Figure 3.3 of B1270E1450 gives
only a weak second-order peak. As could be anticipated for the low molar mass of the latter
compound, the interfaces are no longer sharp and the density distribution normal to the
layers is close to a sinusoidal. From the scaling relation Eq. 3.3 the ratio of the lamellar
periods of the two compounds should be of the order of 2.92/3 = 2.03; experimentally we
observed at 40oC a value 20/8.8 = 2.3. As the temperature decreases, the lamellar period
increases due to the temperature dependence χ ~ 1/T (compare Eq. 3.3). The conformational
entropy of chains decreases leading to an increase of the end-to-end distance. As a result
considerable stretching occurs upon cooling. The unstretched period can be estimated form
the radius of gyration to be 9.6 nm and 5.4 nm for B3700E4300 and B1270E1450, respectively. At
50oC the observed value for B3700E4300 is L = 19.6 nm which indicates an elongation of
about a factor of 2. The corresponding value for B1270E1450 is L = 8.6 nm, which is slightly
less. Next we come to a discussion of the results of Figure 3.4 that describe the ODT in
B1270E1450. In this context small-angle x-ray scattering is an accurate method of determining
the ODT. To facilitate comparison with theory, the inverse peak intensity and width are
plotted against the inverse temperature. Both show a pronounced discontinuity at the
transition from the disordered state to the ordered lamellar structure, in agreement with
theoretical predictions of Sec. 3.2. The broad peak that persists above TODT results from
density fluctuations. Repulsive interactions between the PEO and PBh blocks drive like
segments together, which process results in a finite-size stabilization of the locally ordered
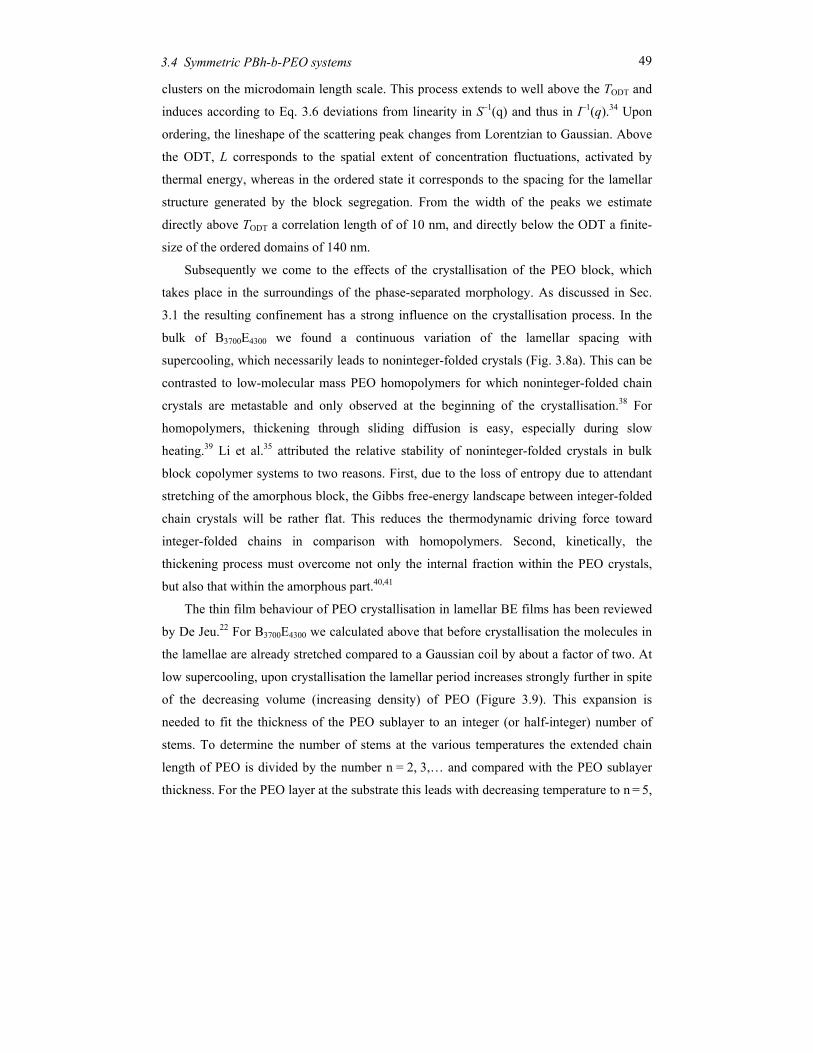
49 3.4 Symmetric PBh-b-PEO systems
clusters on the microdomain length scale. This process extends to well above the TODT and
induces according to Eq. 3.6 deviations from linearity in S–1(q) and thus in I–1(q).34 Upon
ordering, the lineshape of the scattering peak changes from Lorentzian to Gaussian. Above
the ODT, L corresponds to the spatial extent of concentration fluctuations, activated by
thermal energy, whereas in the ordered state it corresponds to the spacing for the lamellar
structure generated by the block segregation. From the width of the peaks we estimate
directly above TODT a correlation length of of 10 nm, and directly below the ODT a finite-
size of the ordered domains of 140 nm.
Subsequently we come to the effects of the crystallisation of the PEO block, which
takes place in the surroundings of the phase-separated morphology. As discussed in Sec.
3.1 the resulting confinement has a strong influence on the crystallisation process. In the
bulk of B3700E4300 we found a continuous variation of the lamellar spacing with
supercooling, which necessarily leads to noninteger-folded crystals (Fig. 3.8a). This can be
contrasted to low-molecular mass PEO homopolymers for which noninteger-folded chain
crystals are metastable and only observed at the beginning of the crystallisation.38 For
homopolymers, thickening through sliding diffusion is easy, especially during slow
heating.39 Li et al.35 attributed the relative stability of noninteger-folded crystals in bulk
block copolymer systems to two reasons. First, due to the loss of entropy due to attendant
stretching of the amorphous block, the Gibbs free-energy landscape between integer-folded
chain crystals will be rather flat. This reduces the thermodynamic driving force toward
integer-folded chains in comparison with homopolymers. Second, kinetically, the
thickening process must overcome not only the internal fraction within the PEO crystals,
but also that within the amorphous part.40,41
The thin film behaviour of PEO crystallisation in lamellar BE films has been reviewed
by De Jeu.22 For B3700E4300 we calculated above that before crystallisation the molecules in
the lamellae are already stretched compared to a Gaussian coil by about a factor of two. At
low supercooling, upon crystallisation the lamellar period increases strongly further in spite
of the decreasing volume (increasing density) of PEO (Figure 3.9). This expansion is
needed to fit the thickness of the PEO sublayer to an integer (or half-integer) number of
stems. To determine the number of stems at the various temperatures the extended chain
length of PEO is divided by the number n = 2, 3,… and compared with the PEO sublayer
thickness. For the PEO layer at the substrate this leads with decreasing temperature to n = 5,
50 Chapter 3
6 and 7 stems, respectively. This situation is sketched in Figure 3.12. Taking for the interior
PEO layers in the film the same number of folds as for the bottom layer would lead to
crystalline double layers. Alternatively a ‘zipper’-model could be assumed in which stems
originating from opposite interfaces pass along each other (co-crystallisation). This would
double the stem length leading to 2.5, 3 and 3.5 stems. Whatever be the case, the number of
folds increases when the crystallisation temperature is lowered. This indicates that for fast
crystallisation, kinetic (non-equilibrium) effects dominate. Conversely one may assume that
at the highest temperatures probably equilibrium chain folding has been reached.
Figure 3.12. Model for the development of the layer structure and the polymer folds during
crystallisation of a B3700E4300 film (from Ref. 23).
Density conservation forces the PB block to follow the stretching. Evidently the loss of
entropy associated with the PBh stretching is more than compensated for by the favourable
packing of the PEO stems. As a consequence a lateral contraction results through the whole
film resulting in macroscopic pits and cracks as shown in Figure 3.10. Implicit in this
interpretation is that the folded PEO chains are perpendicular to the layers. The difference
with the bulk SAXS results of B3700E4300 has tentatively been attributed to the two-
dimensional crystallisation process in thin films, which causes the lateral sliding again to be
important, similarly as in PEO homopolymers.23
D L
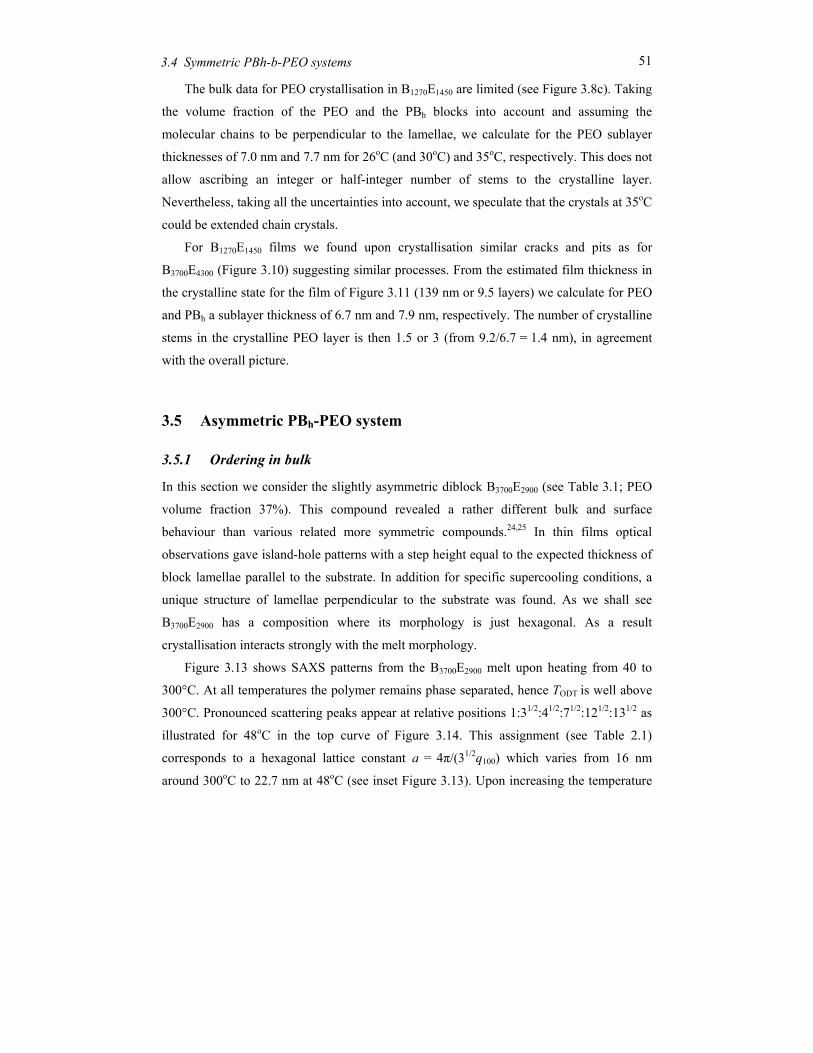
51 3.4 Symmetric PBh-b-PEO systems
The bulk data for PEO crystallisation in B1270E1450 are limited (see Figure 3.8c). Taking
the volume fraction of the PEO and the PBh blocks into account and assuming the
molecular chains to be perpendicular to the lamellae, we calculate for the PEO sublayer
thicknesses of 7.0 nm and 7.7 nm for 26oC (and 30oC) and 35oC, respectively. This does not
allow ascribing an integer or half-integer number of stems to the crystalline layer.
Nevertheless, taking all the uncertainties into account, we speculate that the crystals at 35oC
could be extended chain crystals.
For B1270E1450 films we found upon crystallisation similar cracks and pits as for
B3700E4300 (Figure 3.10) suggesting similar processes. From the estimated film thickness in
the crystalline state for the film of Figure 3.11 (139 nm or 9.5 layers) we calculate for PEO
and PBh a sublayer thickness of 6.7 nm and 7.9 nm, respectively. The number of crystalline
stems in the crystalline PEO layer is then 1.5 or 3 (from 9.2/6.7 = 1.4 nm), in agreement
with the overall picture.
3.5 Asymmetric PBh-PEO system
3.5.1 Ordering in bulk
In this section we consider the slightly asymmetric diblock B3700E2900 (see Table 3.1; PEO
volume fraction 37%). This compound revealed a rather different bulk and surface
behaviour than various related more symmetric compounds.24,25 In thin films optical
observations gave island-hole patterns with a step height equal to the expected thickness of
block lamellae parallel to the substrate. In addition for specific supercooling conditions, a
unique structure of lamellae perpendicular to the substrate was found. As we shall see
B3700E2900 has a composition where its morphology is just hexagonal. As a result
crystallisation interacts strongly with the melt morphology.
Figure 3.13 shows SAXS patterns from the B3700E2900 melt upon heating from 40 to
300°C. At all temperatures the polymer remains phase separated, hence TODT is well above
300°C. Pronounced scattering peaks appear at relative positions 1:31/2:41/2:71/2:121/2:131/2 as
illustrated for 48oC in the top curve of Figure 3.14. This assignment (see Table 2.1)
corresponds to a hexagonal lattice constant a = 4π/(31/2q100) which varies from 16 nm
around 300oC to 22.7 nm at 48oC (see inset Figure 3.13). Upon increasing the temperature
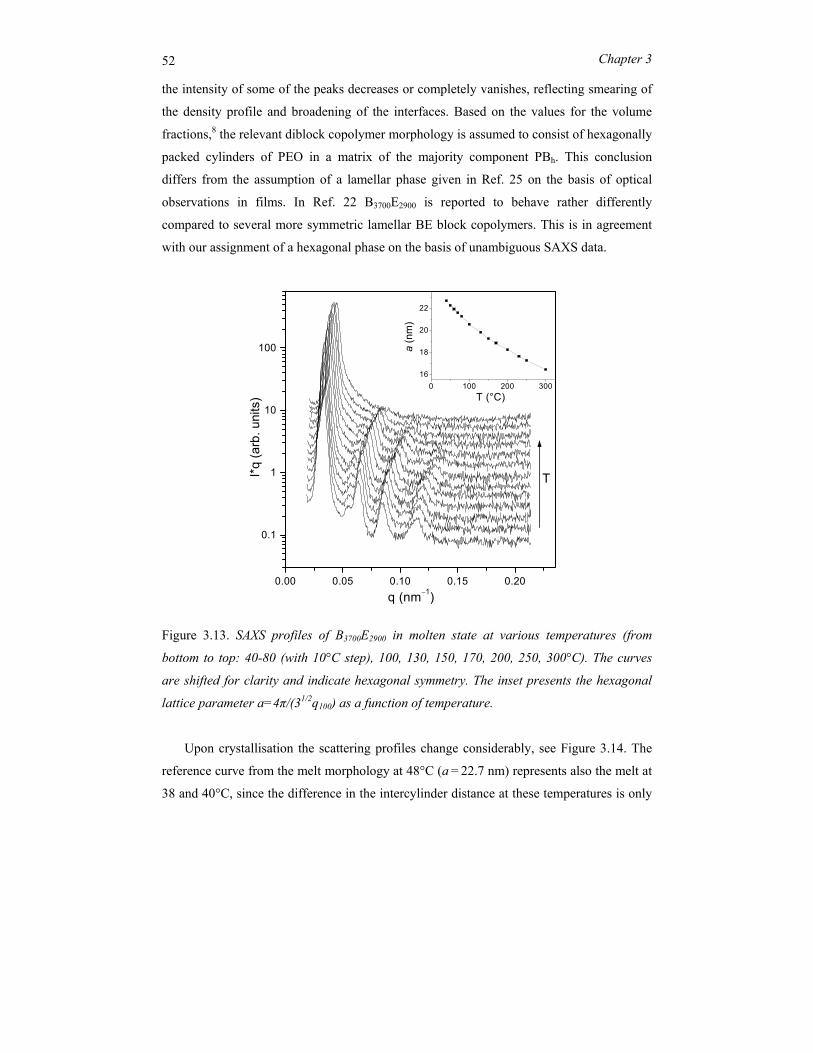
52 Chapter 3
the intensity of some of the peaks decreases or completely vanishes, reflecting smearing of
the density profile and broadening of the interfaces. Based on the values for the volume
fractions,8 the relevant diblock copolymer morphology is assumed to consist of hexagonally
packed cylinders of PEO in a matrix of the majority component PBh. This conclusion
differs from the assumption of a lamellar phase given in Ref. 25 on the basis of optical
observations in films. In Ref. 22 B3700E2900 is reported to behave rather differently
compared to several more symmetric lamellar BE block copolymers. This is in agreement
with our assignment of a hexagonal phase on the basis of unambiguous SAXS data.
Figure 3.13. SAXS profiles of B3700E2900 in molten state at various temperatures (from
bottom to top: 40-80 (with 10°C step), 100, 130, 150, 170, 200, 250, 300°C). The curves
are shifted for clarity and indicate hexagonal symmetry. The inset presents the hexagonal
lattice parameter a=4π/(31/2q100) as a function of temperature.
Upon crystallisation the scattering profiles change considerably, see Figure 3.14. The
reference curve from the melt morphology at 48°C (a = 22.7 nm) represents also the melt at
38 and 40°C, since the difference in the intercylinder distance at these temperatures is only
0.00 0.05 0.10 0.15 0.20
0.1
1
10
100
T
a (n
m)
T (°C)
I*q (a
rb. u
nits
)
q (nm−1)
0 100 200 30016
18
20
22
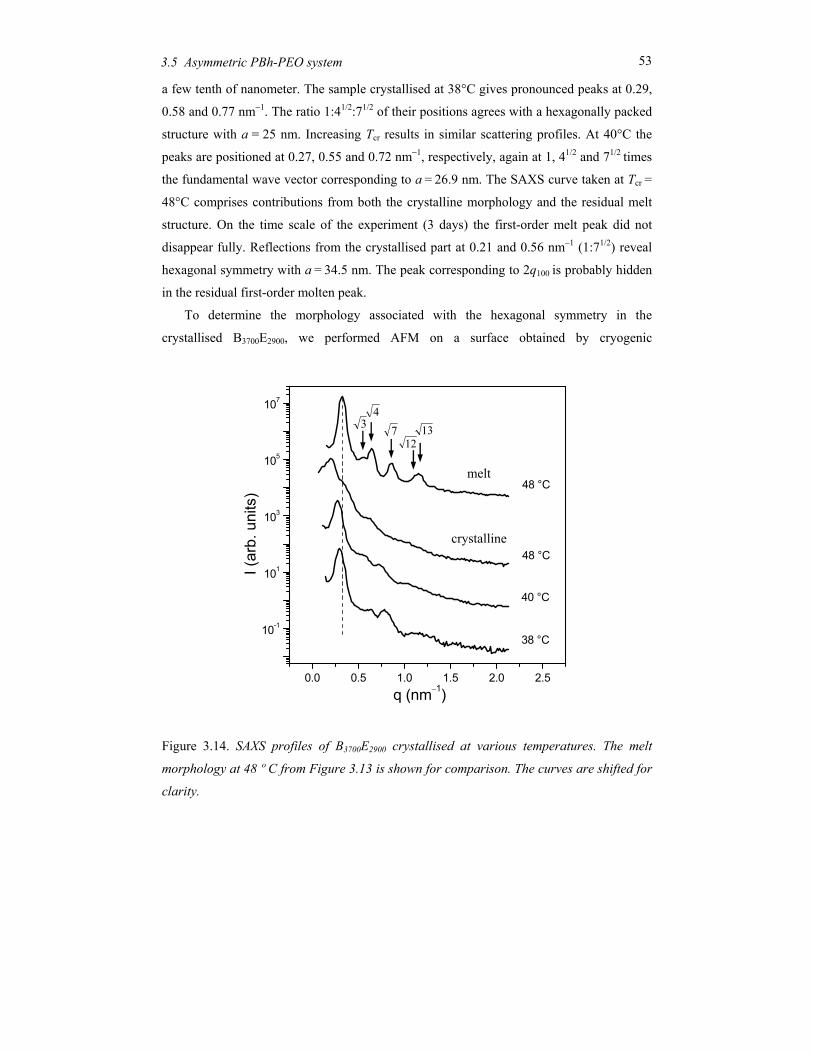
53 3.5 Asymmetric PBh-PEO system
a few tenth of nanometer. The sample crystallised at 38°C gives pronounced peaks at 0.29,
0.58 and 0.77 nm−1. The ratio 1:41/2:71/2 of their positions agrees with a hexagonally packed
structure with a = 25 nm. Increasing Tcr results in similar scattering profiles. At 40°C the
peaks are positioned at 0.27, 0.55 and 0.72 nm−1, respectively, again at 1, 41/2 and 71/2 times
the fundamental wave vector corresponding to a = 26.9 nm. The SAXS curve taken at Tcr =
48°C comprises contributions from both the crystalline morphology and the residual melt
structure. On the time scale of the experiment (3 days) the first-order melt peak did not
disappear fully. Reflections from the crystallised part at 0.21 and 0.56 nm−1 (1:71/2) reveal
hexagonal symmetry with a = 34.5 nm. The peak corresponding to 2q100 is probably hidden
in the residual first-order molten peak.
To determine the morphology associated with the hexagonal symmetry in the
crystallised B3700E2900, we performed AFM on a surface obtained by cryogenic
Figure 3.14. SAXS profiles of B3700E2900 crystallised at various temperatures. The melt
morphology at 48 º C from Figure 3.13 is shown for comparison. The curves are shifted for
clarity.
0.0 0.5 1.0 1.5 2.0 2.5
10-1
101
103
105
107
38 °C
40 °C
48 °C
48 °C
I (ar
b. u
nits
)
q (nm−1)
crystalline
melt
34
7 1312
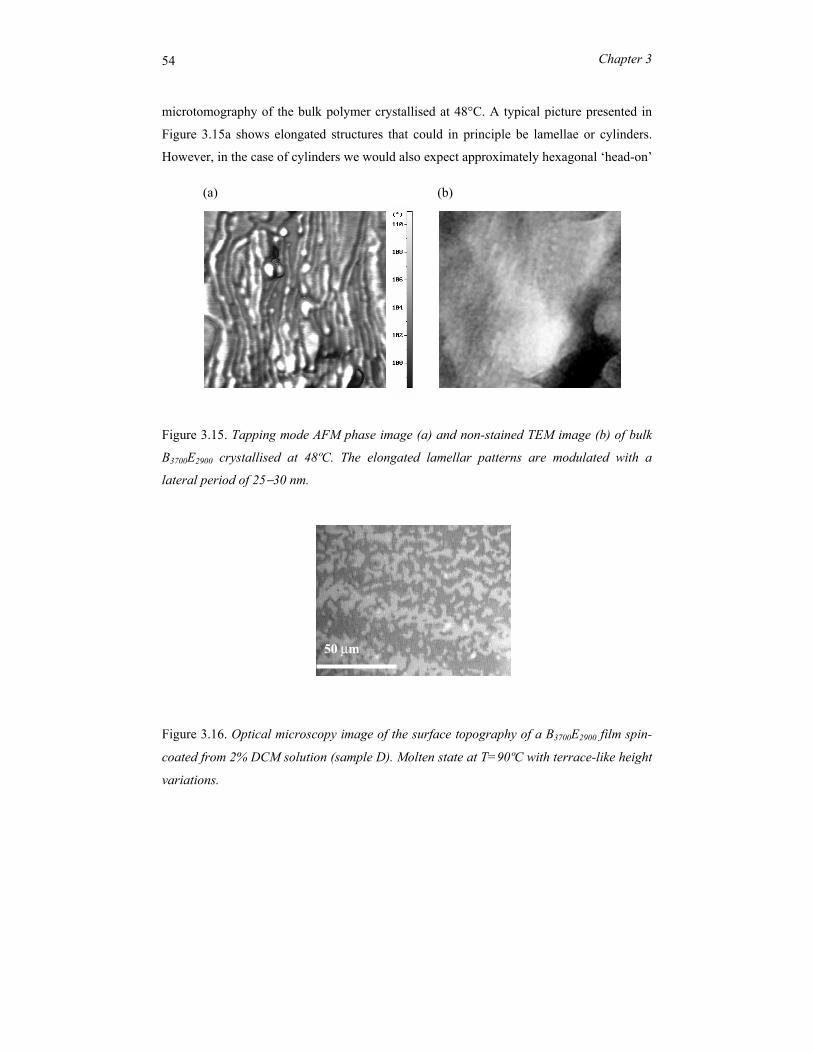
54 Chapter 3
microtomography of the bulk polymer crystallised at 48°C. A typical picture presented in
Figure 3.15a shows elongated structures that could in principle be lamellae or cylinders.
However, in the case of cylinders we would also expect approximately hexagonal ‘head-on’
Figure 3.15. Tapping mode AFM phase image (a) and non-stained TEM image (b) of bulk
B3700E2900 crystallised at 48ºC. The elongated lamellar patterns are modulated with a
lateral period of 25−30 nm.
Figure 3.16. Optical microscopy image of the surface topography of a B3700E2900 film spin-
coated from 2% DCM solution (sample D). Molten state at T=90ºC with terrace-like height
variations.
(a) (b)
50 µm
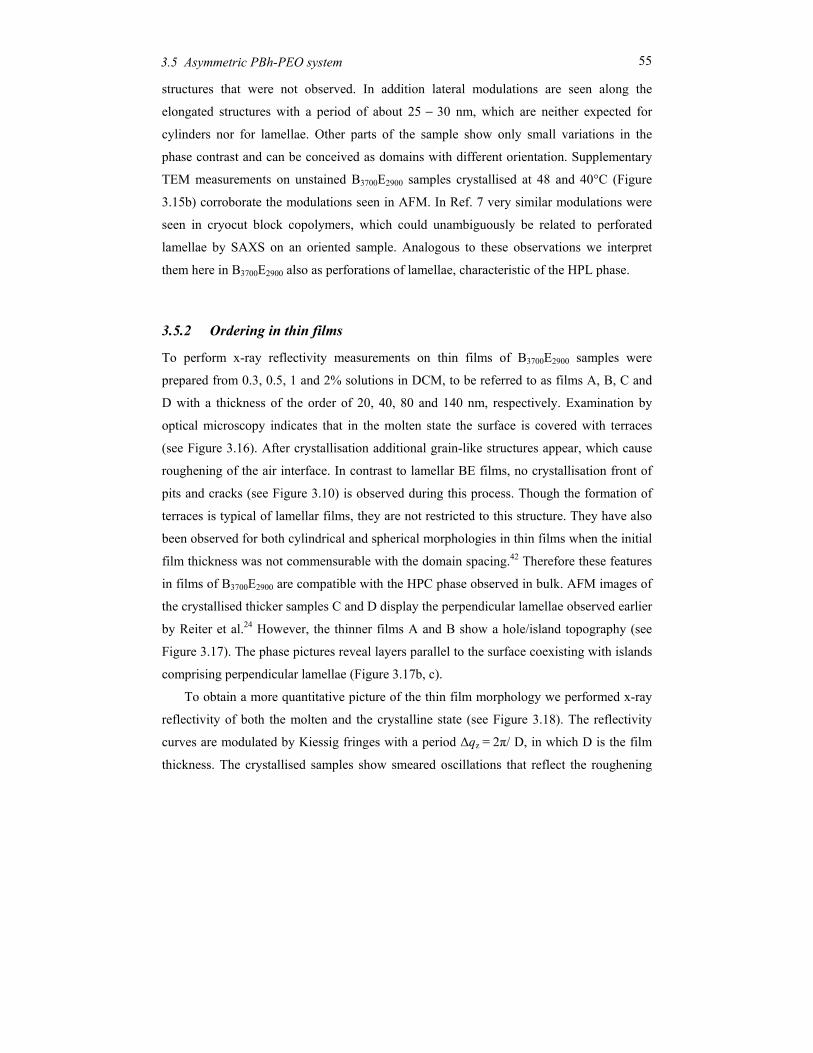
55 3.5 Asymmetric PBh-PEO system
structures that were not observed. In addition lateral modulations are seen along the
elongated structures with a period of about 25 − 30 nm, which are neither expected for
cylinders nor for lamellae. Other parts of the sample show only small variations in the
phase contrast and can be conceived as domains with different orientation. Supplementary
TEM measurements on unstained B3700E2900 samples crystallised at 48 and 40°C (Figure
3.15b) corroborate the modulations seen in AFM. In Ref. 7 very similar modulations were
seen in cryocut block copolymers, which could unambiguously be related to perforated
lamellae by SAXS on an oriented sample. Analogous to these observations we interpret
them here in B3700E2900 also as perforations of lamellae, characteristic of the HPL phase.
3.5.2 Ordering in thin films
To perform x-ray reflectivity measurements on thin films of B3700E2900 samples were
prepared from 0.3, 0.5, 1 and 2% solutions in DCM, to be referred to as films A, B, C and
D with a thickness of the order of 20, 40, 80 and 140 nm, respectively. Examination by
optical microscopy indicates that in the molten state the surface is covered with terraces
(see Figure 3.16). After crystallisation additional grain-like structures appear, which cause
roughening of the air interface. In contrast to lamellar BE films, no crystallisation front of
pits and cracks (see Figure 3.10) is observed during this process. Though the formation of
terraces is typical of lamellar films, they are not restricted to this structure. They have also
been observed for both cylindrical and spherical morphologies in thin films when the initial
film thickness was not commensurable with the domain spacing.42 Therefore these features
in films of B3700E2900 are compatible with the HPC phase observed in bulk. AFM images of
the crystallised thicker samples C and D display the perpendicular lamellae observed earlier
by Reiter et al.24 However, the thinner films A and B show a hole/island topography (see
Figure 3.17). The phase pictures reveal layers parallel to the surface coexisting with islands
comprising perpendicular lamellae (Figure 3.17b, c).
To obtain a more quantitative picture of the thin film morphology we performed x-ray
reflectivity of both the molten and the crystalline state (see Figure 3.18). The reflectivity
curves are modulated by Kiessig fringes with a period ∆qz = 2π/ D, in which D is the film
thickness. The crystallised samples show smeared oscillations that reflect the roughening
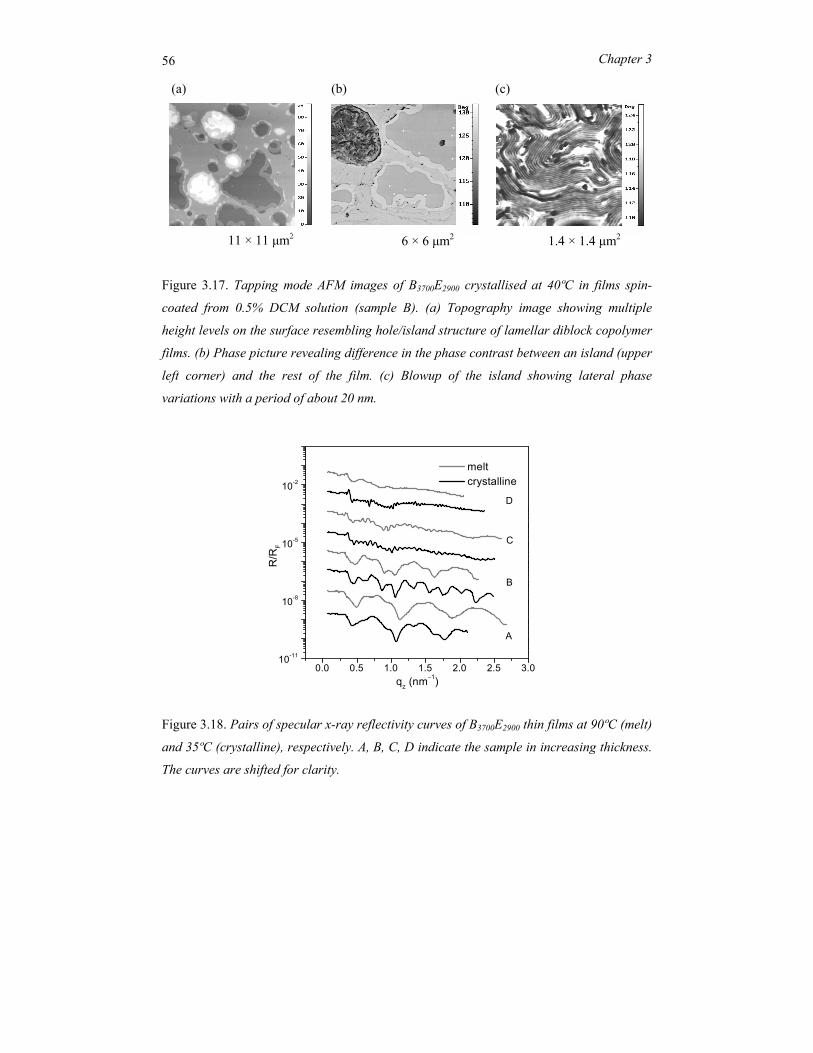
56 Chapter 3
Figure 3.17. Tapping mode AFM images of B3700E2900 crystallised at 40ºC in films spin-
coated from 0.5% DCM solution (sample B). (a) Topography image showing multiple
height levels on the surface resembling hole/island structure of lamellar diblock copolymer
films. (b) Phase picture revealing difference in the phase contrast between an island (upper
left corner) and the rest of the film. (c) Blowup of the island showing lateral phase
variations with a period of about 20 nm.
Figure 3.18. Pairs of specular x-ray reflectivity curves of B3700E2900 thin films at 90ºC (melt)
and 35ºC (crystalline), respectively. A, B, C, D indicate the sample in increasing thickness.
The curves are shifted for clarity.
(a)
11 × 11 µm2
(c)
1.4 × 1.4 µm2
(b)
6 × 6 µm2
0.0 0.5 1.0 1.5 2.0 2.5 3.010-11
10-8
10-5
10-2
melt crystalline
D
C
B
A
R/R
F
qz (nm−1)
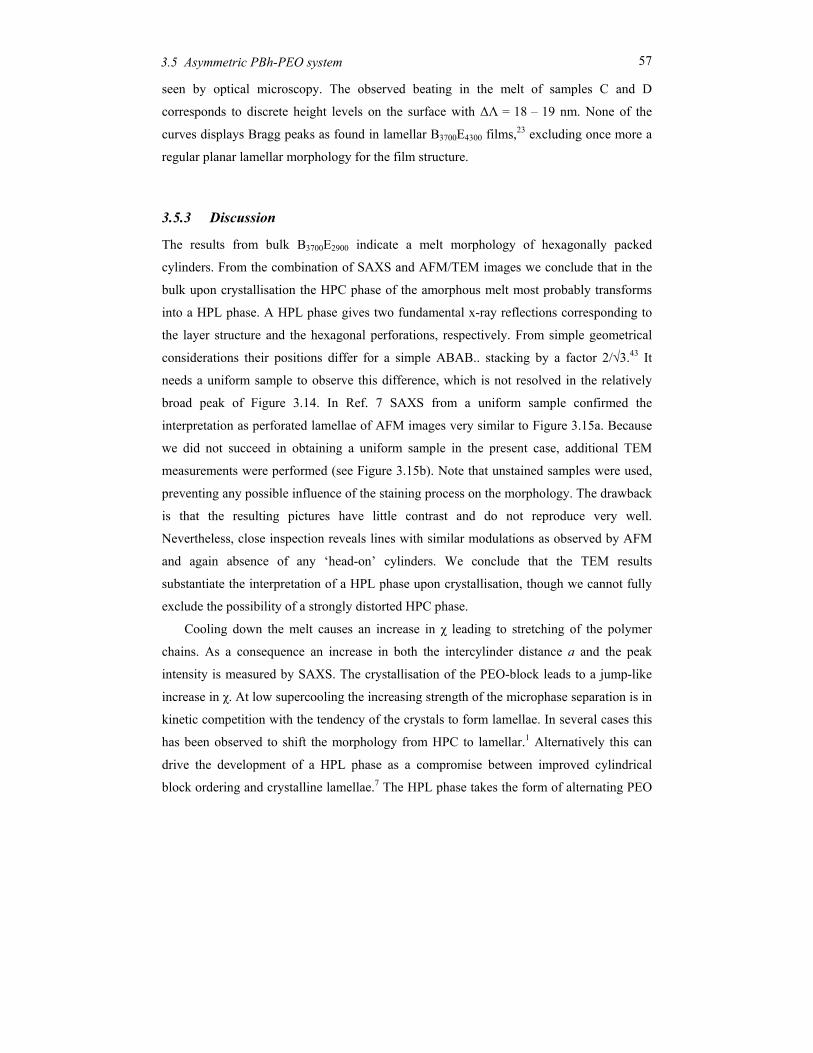
57 3.5 Asymmetric PBh-PEO system
seen by optical microscopy. The observed beating in the melt of samples C and D
corresponds to discrete height levels on the surface with ∆Λ = 18 – 19 nm. None of the
curves displays Bragg peaks as found in lamellar B3700E4300 films,23 excluding once more a
regular planar lamellar morphology for the film structure.
3.5.3 Discussion
The results from bulk B3700E2900 indicate a melt morphology of hexagonally packed
cylinders. From the combination of SAXS and AFM/TEM images we conclude that in the
bulk upon crystallisation the HPC phase of the amorphous melt most probably transforms
into a HPL phase. A HPL phase gives two fundamental x-ray reflections corresponding to
the layer structure and the hexagonal perforations, respectively. From simple geometrical
considerations their positions differ for a simple ABAB.. stacking by a factor 2/√3.43 It
needs a uniform sample to observe this difference, which is not resolved in the relatively
broad peak of Figure 3.14. In Ref. 7 SAXS from a uniform sample confirmed the
interpretation as perforated lamellae of AFM images very similar to Figure 3.15a. Because
we did not succeed in obtaining a uniform sample in the present case, additional TEM
measurements were performed (see Figure 3.15b). Note that unstained samples were used,
preventing any possible influence of the staining process on the morphology. The drawback
is that the resulting pictures have little contrast and do not reproduce very well.
Nevertheless, close inspection reveals lines with similar modulations as observed by AFM
and again absence of any ‘head-on’ cylinders. We conclude that the TEM results
substantiate the interpretation of a HPL phase upon crystallisation, though we cannot fully
exclude the possibility of a strongly distorted HPC phase.
Cooling down the melt causes an increase in χ leading to stretching of the polymer
chains. As a consequence an increase in both the intercylinder distance a and the peak
intensity is measured by SAXS. The crystallisation of the PEO-block leads to a jump-like
increase in χ. At low supercooling the increasing strength of the microphase separation is in
kinetic competition with the tendency of the crystals to form lamellae. In several cases this
has been observed to shift the morphology from HPC to lamellar.1 Alternatively this can
drive the development of a HPL phase as a compromise between improved cylindrical
block ordering and crystalline lamellae.7 The HPL phase takes the form of alternating PEO
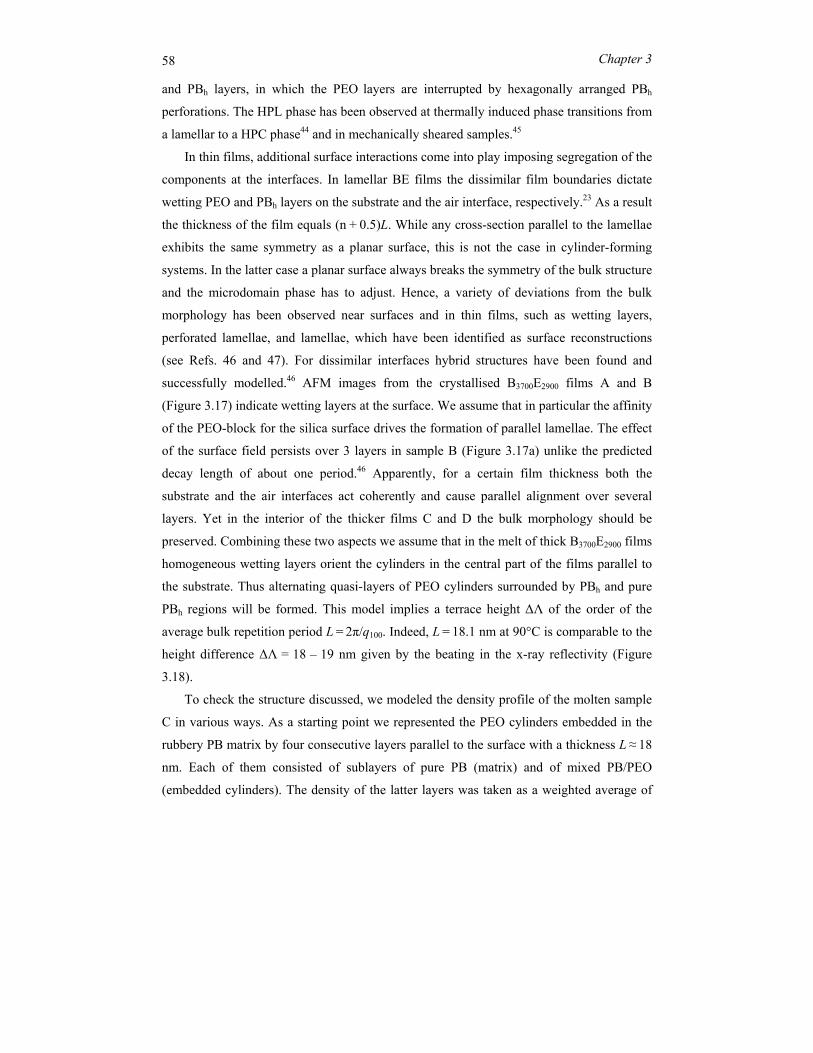
58 Chapter 3
and PBh layers, in which the PEO layers are interrupted by hexagonally arranged PBh
perforations. The HPL phase has been observed at thermally induced phase transitions from
a lamellar to a HPC phase44 and in mechanically sheared samples.45
In thin films, additional surface interactions come into play imposing segregation of the
components at the interfaces. In lamellar BE films the dissimilar film boundaries dictate
wetting PEO and PBh layers on the substrate and the air interface, respectively.23 As a result
the thickness of the film equals (n + 0.5)L. While any cross-section parallel to the lamellae
exhibits the same symmetry as a planar surface, this is not the case in cylinder-forming
systems. In the latter case a planar surface always breaks the symmetry of the bulk structure
and the microdomain phase has to adjust. Hence, a variety of deviations from the bulk
morphology has been observed near surfaces and in thin films, such as wetting layers,
perforated lamellae, and lamellae, which have been identified as surface reconstructions
(see Refs. 46 and 47). For dissimilar interfaces hybrid structures have been found and
successfully modelled.46 AFM images from the crystallised B3700E2900 films A and B
(Figure 3.17) indicate wetting layers at the surface. We assume that in particular the affinity
of the PEO-block for the silica surface drives the formation of parallel lamellae. The effect
of the surface field persists over 3 layers in sample B (Figure 3.17a) unlike the predicted
decay length of about one period.46 Apparently, for a certain film thickness both the
substrate and the air interfaces act coherently and cause parallel alignment over several
layers. Yet in the interior of the thicker films C and D the bulk morphology should be
preserved. Combining these two aspects we assume that in the melt of thick B3700E2900 films
homogeneous wetting layers orient the cylinders in the central part of the films parallel to
the substrate. Thus alternating quasi-layers of PEO cylinders surrounded by PBh and pure
PBh regions will be formed. This model implies a terrace height ∆Λ of the order of the
average bulk repetition period L = 2π/q100. Indeed, L = 18.1 nm at 90°C is comparable to the
height difference ∆Λ = 18 – 19 nm given by the beating in the x-ray reflectivity (Figure
3.18).
To check the structure discussed, we modeled the density profile of the molten sample
C in various ways. As a starting point we represented the PEO cylinders embedded in the
rubbery PB matrix by four consecutive layers parallel to the surface with a thickness L ≈ 18
nm. Each of them consisted of sublayers of pure PB (matrix) and of mixed PB/PEO
(embedded cylinders). The density of the latter layers was taken as a weighted average of
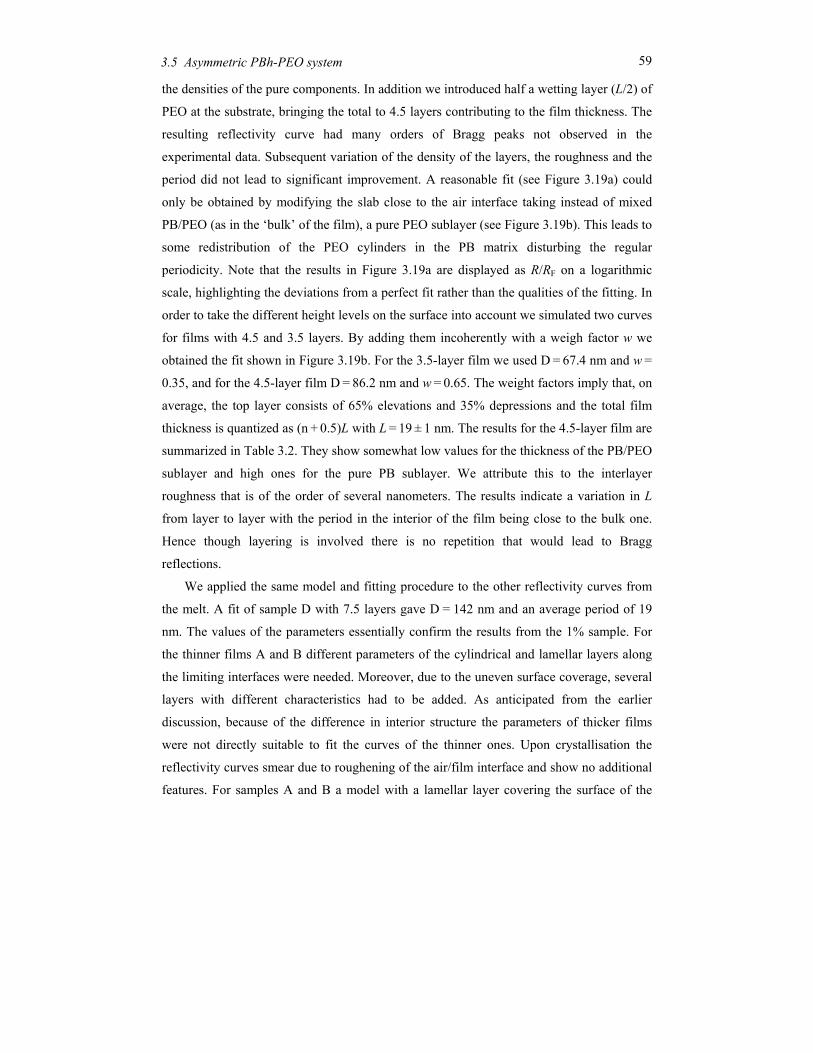
59 3.5 Asymmetric PBh-PEO system
the densities of the pure components. In addition we introduced half a wetting layer (L/2) of
PEO at the substrate, bringing the total to 4.5 layers contributing to the film thickness. The
resulting reflectivity curve had many orders of Bragg peaks not observed in the
experimental data. Subsequent variation of the density of the layers, the roughness and the
period did not lead to significant improvement. A reasonable fit (see Figure 3.19a) could
only be obtained by modifying the slab close to the air interface taking instead of mixed
PB/PEO (as in the ‘bulk’ of the film), a pure PEO sublayer (see Figure 3.19b). This leads to
some redistribution of the PEO cylinders in the PB matrix disturbing the regular
periodicity. Note that the results in Figure 3.19a are displayed as R/RF on a logarithmic
scale, highlighting the deviations from a perfect fit rather than the qualities of the fitting. In
order to take the different height levels on the surface into account we simulated two curves
for films with 4.5 and 3.5 layers. By adding them incoherently with a weigh factor w we
obtained the fit shown in Figure 3.19b. For the 3.5-layer film we used D = 67.4 nm and w =
0.35, and for the 4.5-layer film D = 86.2 nm and w = 0.65. The weight factors imply that, on
average, the top layer consists of 65% elevations and 35% depressions and the total film
thickness is quantized as (n + 0.5)L with L = 19 ± 1 nm. The results for the 4.5-layer film are
summarized in Table 3.2. They show somewhat low values for the thickness of the PB/PEO
sublayer and high ones for the pure PB sublayer. We attribute this to the interlayer
roughness that is of the order of several nanometers. The results indicate a variation in L
from layer to layer with the period in the interior of the film being close to the bulk one.
Hence though layering is involved there is no repetition that would lead to Bragg
reflections.
We applied the same model and fitting procedure to the other reflectivity curves from
the melt. A fit of sample D with 7.5 layers gave D = 142 nm and an average period of 19
nm. The values of the parameters essentially confirm the results from the 1% sample. For
the thinner films A and B different parameters of the cylindrical and lamellar layers along
the limiting interfaces were needed. Moreover, due to the uneven surface coverage, several
layers with different characteristics had to be added. As anticipated from the earlier
discussion, because of the difference in interior structure the parameters of thicker films
were not directly suitable to fit the curves of the thinner ones. Upon crystallisation the
reflectivity curves smear due to roughening of the air/film interface and show no additional
features. For samples A and B a model with a lamellar layer covering the surface of the
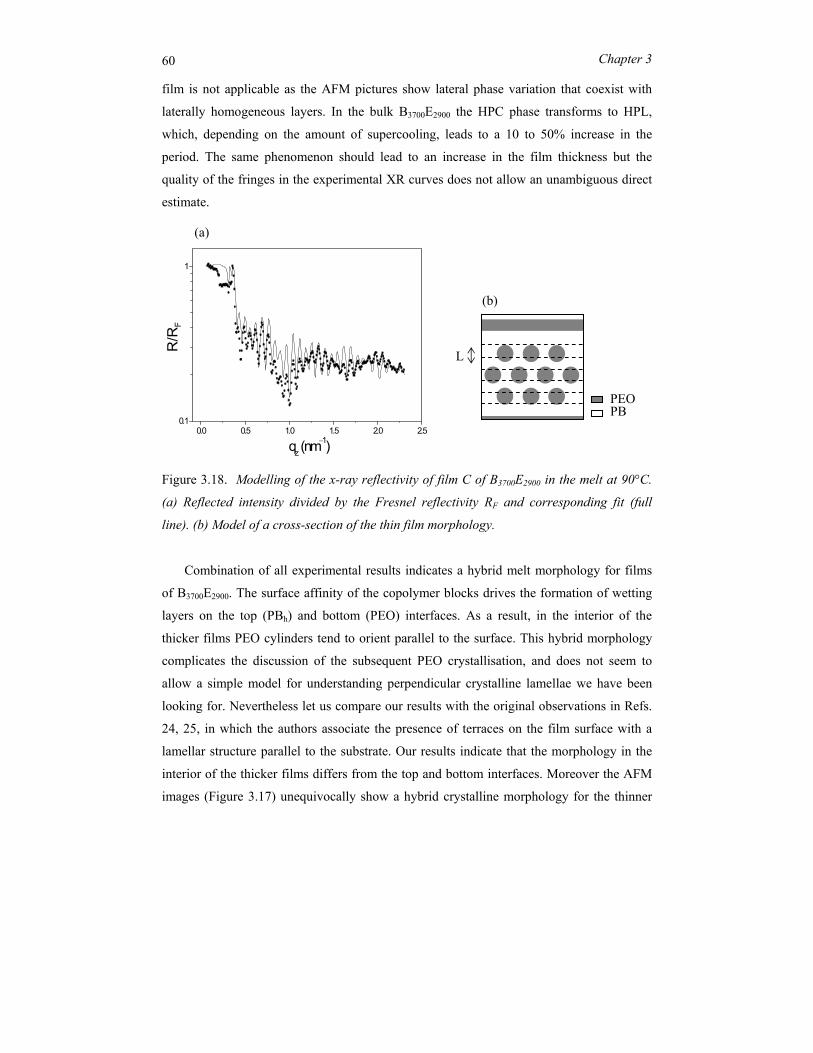
60 Chapter 3
film is not applicable as the AFM pictures show lateral phase variation that coexist with
laterally homogeneous layers. In the bulk B3700E2900 the HPC phase transforms to HPL,
which, depending on the amount of supercooling, leads to a 10 to 50% increase in the
period. The same phenomenon should lead to an increase in the film thickness but the
quality of the fringes in the experimental XR curves does not allow an unambiguous direct
estimate.
Figure 3.18. Modelling of the x-ray reflectivity of film C of B3700E2900 in the melt at 90°C.
(a) Reflected intensity divided by the Fresnel reflectivity RF and corresponding fit (full
line). (b) Model of a cross-section of the thin film morphology.
Combination of all experimental results indicates a hybrid melt morphology for films
of B3700E2900. The surface affinity of the copolymer blocks drives the formation of wetting
layers on the top (PBh) and bottom (PEO) interfaces. As a result, in the interior of the
thicker films PEO cylinders tend to orient parallel to the surface. This hybrid morphology
complicates the discussion of the subsequent PEO crystallisation, and does not seem to
allow a simple model for understanding perpendicular crystalline lamellae we have been
looking for. Nevertheless let us compare our results with the original observations in Refs.
24, 25, in which the authors associate the presence of terraces on the film surface with a
lamellar structure parallel to the substrate. Our results indicate that the morphology in the
interior of the thicker films differs from the top and bottom interfaces. Moreover the AFM
images (Figure 3.17) unequivocally show a hybrid crystalline morphology for the thinner
(a)
0.0 0.5 1.0 1.5 2.0 2.50.1
1
R/R
F
qz (nm−1)
(b)
PB
L
PEO
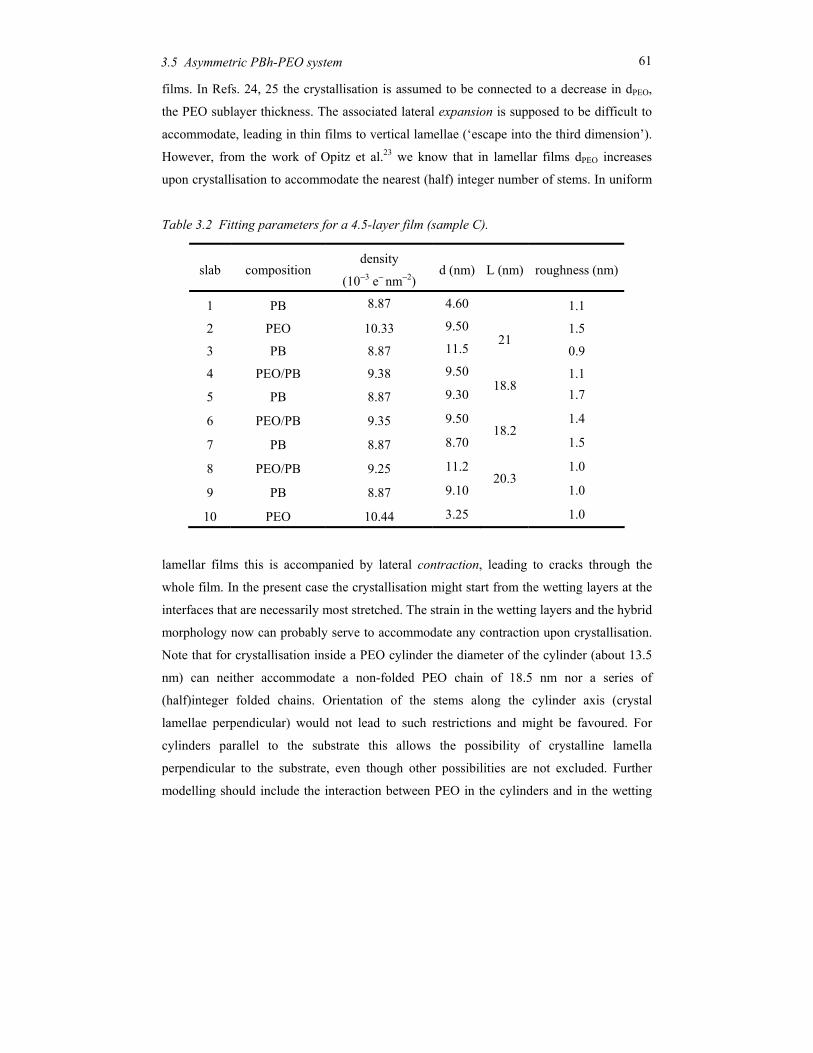
61 3.5 Asymmetric PBh-PEO system
films. In Refs. 24, 25 the crystallisation is assumed to be connected to a decrease in dPEO,
the PEO sublayer thickness. The associated lateral expansion is supposed to be difficult to
accommodate, leading in thin films to vertical lamellae (‘escape into the third dimension’).
However, from the work of Opitz et al.23 we know that in lamellar films dPEO increases
upon crystallisation to accommodate the nearest (half) integer number of stems. In uniform
Table 3.2 Fitting parameters for a 4.5-layer film (sample C).
lamellar films this is accompanied by lateral contraction, leading to cracks through the
whole film. In the present case the crystallisation might start from the wetting layers at the
interfaces that are necessarily most stretched. The strain in the wetting layers and the hybrid
morphology now can probably serve to accommodate any contraction upon crystallisation.
Note that for crystallisation inside a PEO cylinder the diameter of the cylinder (about 13.5
nm) can neither accommodate a non-folded PEO chain of 18.5 nm nor a series of
(half)integer folded chains. Orientation of the stems along the cylinder axis (crystal
lamellae perpendicular) would not lead to such restrictions and might be favoured. For
cylinders parallel to the substrate this allows the possibility of crystalline lamella
perpendicular to the substrate, even though other possibilities are not excluded. Further
modelling should include the interaction between PEO in the cylinders and in the wetting
slab composition density
(10−3 e− nm−2) d (nm) L (nm) roughness (nm)
1 PB 8.87 4.60 1.1
2 PEO 10.33 9.50 1.5
3 PB 8.87 11.5 21
0.9
4 PEO/PB 9.38 9.50 1.1
5 PB 8.87 9.30 18.8
1.7
6 PEO/PB 9.35 9.50 1.4
7 PB 8.87 8.70 18.2
1.5
8 PEO/PB 9.25 11.2 1.0
9 PB 8.87 9.10 20.3
1.0
10 PEO 10.44 3.25 1.0
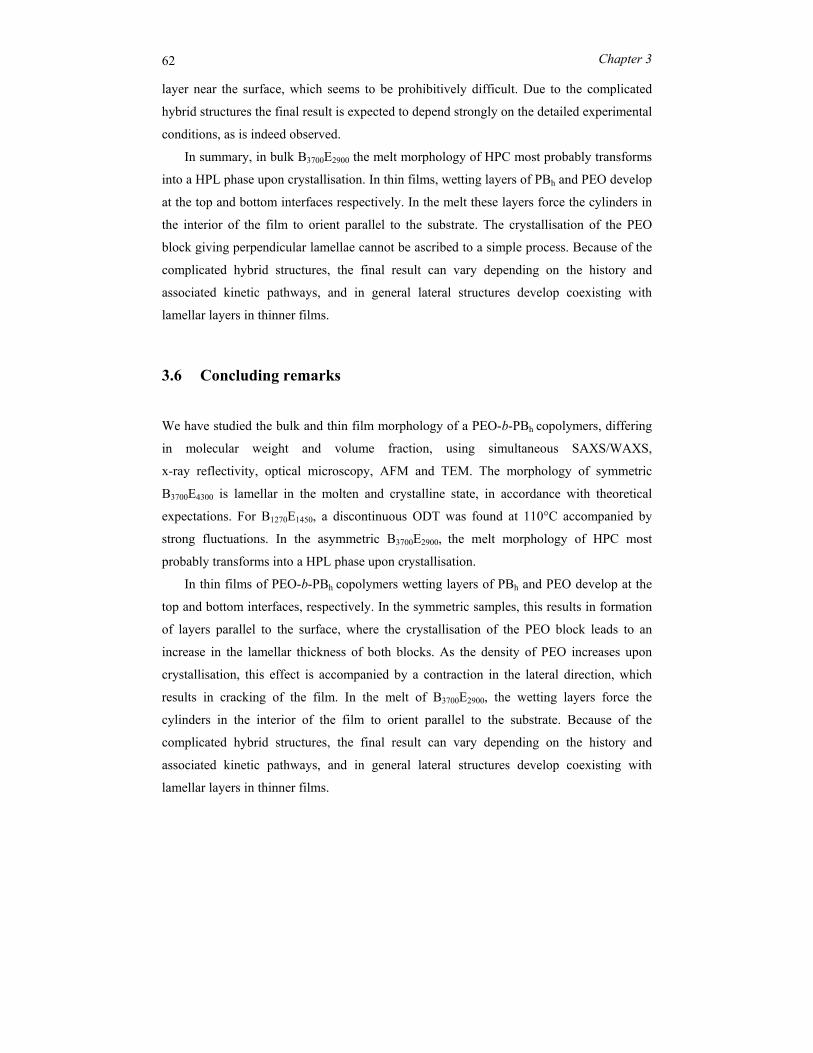
62 Chapter 3
layer near the surface, which seems to be prohibitively difficult. Due to the complicated
hybrid structures the final result is expected to depend strongly on the detailed experimental
conditions, as is indeed observed.
In summary, in bulk B3700E2900 the melt morphology of HPC most probably transforms
into a HPL phase upon crystallisation. In thin films, wetting layers of PBh and PEO develop
at the top and bottom interfaces respectively. In the melt these layers force the cylinders in
the interior of the film to orient parallel to the substrate. The crystallisation of the PEO
block giving perpendicular lamellae cannot be ascribed to a simple process. Because of the
complicated hybrid structures, the final result can vary depending on the history and
associated kinetic pathways, and in general lateral structures develop coexisting with
lamellar layers in thinner films.
3.6 Concluding remarks
We have studied the bulk and thin film morphology of a PEO-b-PBh copolymers, differing
in molecular weight and volume fraction, using simultaneous SAXS/WAXS,
x-ray reflectivity, optical microscopy, AFM and TEM. The morphology of symmetric
B3700E4300 is lamellar in the molten and crystalline state, in accordance with theoretical
expectations. For B1270E1450, a discontinuous ODT was found at 110°C accompanied by
strong fluctuations. In the asymmetric B3700E2900, the melt morphology of HPC most
probably transforms into a HPL phase upon crystallisation.
In thin films of PEO-b-PBh copolymers wetting layers of PBh and PEO develop at the
top and bottom interfaces, respectively. In the symmetric samples, this results in formation
of layers parallel to the surface, where the crystallisation of the PEO block leads to an
increase in the lamellar thickness of both blocks. As the density of PEO increases upon
crystallisation, this effect is accompanied by a contraction in the lateral direction, which
results in cracking of the film. In the melt of B3700E2900, the wetting layers force the
cylinders in the interior of the film to orient parallel to the substrate. Because of the
complicated hybrid structures, the final result can vary depending on the history and
associated kinetic pathways, and in general lateral structures develop coexisting with
lamellar layers in thinner films.
63
References
[1] See for example: Hamley, I.W., The Physics of Block Copolymers (Oxford University
Press, Inc. New York), 1998.
[2] DiMarzio, E.A., Guttmann, C.M., Hoffman, J.D., Macromolecules 13, 1194, 1980.
[3] Whitmore, M.D., Noolandi, J., Macromolecules 21, 1482, 1988.
[4] Vilgis, T., Halperin, A., Macromolecules 24, 2090, 1991.
[5] (a) Zhu, L., Chen, Y., Zhang, A., Calhoun, B.H., Chun, M., Quirk, R.P., Cheng,
S.Z.D., Hsiao, B.S., Yeh, F.J., Hashimoto, T., Phys. Rev. B 60, 10022, 1999; (b) Zhu,
L., Cheng, S.Z.D., Calhoun, B.H., Ge, Q., Quirk, R.P., Thomas, E.L., Hsiao, B.S., Yeh,
F.J., Lotz, B., J. Am. Chem. Soc. 122, 5957, 2000.
[6] (a) Loo, Y.-L., Register, R. A., Ryan, A. J., Macromolecules 35, 2365, 2002; (b) Loo,
Y.-L., Register, R. A., Ryan, A. J., Dee, G. T., Macromolecules 34, 8968, 2001.
[7] Li, L., Serero, Y., Koch, M. H. J., de Jeu, W. H., Macromolecules 36, 529, 2003.
[8] Leibler, L., Macromolecules 13, 1602, 1980.
[9] Keller, A., Faraday Disc. 68, 145, 1979.
[10] Keller, A., Goldbeck-Wood, G., Comprehensive Polymer Science, 2nd Supplement
(Elsevier, Oxford), Aggarval, S. L., Russo, S., 241, 1996.
[11] Strobl, G.R., The Physics of Polymers (Springer, Berlin), 1996.
[12] See the special issue: Polymer 41, 8751-8930, 2000.
[13] Doye, P.K., Frenkel, D., J. Chem Phys. 110, 2692, 1999.
[14] Liu, C., Muthukumar, M., J. Chem Phys. 109, 2536, 1998.
[15] Hamley, I.W., Adv. Polymer Sci. 148, 113, 1999.
[16] Hong, S., MacKnight, W. J., Russell, T. P., Gido, S. P., Macromolecules 34, 2876,
2001.
[17] Helfand, E., Wasserman, Z. R., Chapter 4. In Development in Block Copolymers I
(Applied Science Publishers, London), 99, 1982.
[18] Hamley, I.W., Fairclough, J.P.A., Bates, F.S., Ryan, A.J., Polymer 39, 1429, 1998.
[19] Mai, S., Fairclough, J.P.A., Hamley, I.W., Matsen, M.W., Denny, R.C., Liao, B.,
Booth, C., Ryan, A.J., Macromolecules 30, 8392, 1997.
[20] Hamley, I.W.; Wallwork, M.L.; Smith, D.A.; Fairclough, J.P.A.; Ryan, A.J.; Mai, S.-
M.; Yang, Y.-W.; Booth, C. Polymer 39, 3321, 1998.
64
[21] Mai, S.-M.; Fairclough, J.P.A.; Hamley, I.W.; Matsen, M.W.; Denny, R.C.; Liao, B.;
Y.-W.; Booth, C.; Ryan, A.J. Macromolecules 29, 6612, 1996.
[22] de Jeu W. H., Polymer Crystallization: Observations, Concepts and Interpretations/
edited by Reiter G. and Sommer J.-U., Berlin: Springer, 196-207 (Springer Lecture
Notes in Physics; 606), 2003.
[23] Opitz, R., Lambreva, D. M., de Jeu W. H., Macromolecules 35, 6930, 2002.
[24] Reiter, G., Castelein, G., Hoerner, P., Riess, G., Blumen, A., Sommer, J.-U., Phys. Rev.
Lett. 83, 3844, 1999.
[25] Reiter, G., Castelein, G., Hoerner, P., Riess, G., Sommer, J.-U., Floudas, G., Eur. Phys.
J. E. 2, 319, 2000.
[26] Bates, F. S., Frederickson, G. H., Physics Today, February 52(2), 32, 1999.
[27] Helfand, E., Wasserman, Z. R., Macromolecules 9, 879,1976; 11, 960, 1978; 13, 994,
1980; Noolandi, J., Hong, K. M., Ferroelectrics 30, 117, 1980; Hong, K. M., Noolandi,
J., Macromolecules 14, 727, 1981; Whitmore, M. D., Noolandi, J., J. Chem. Phys. 93,
2946, 1990.
[28] Semenov, A. N., Sov. Phys. JETP 61, 733, 1985.
[29] Matsen, M. W., Schick, M., Phys. Rev. Lett. 72, 2660, 1994; Macromolecules 27,
6761, 1994; 27, 7157, 1994; Matsen, M. W., Bates, F. S., Macromolecules 29, 1091,
1996.
[30] Frederickson, G. H., Helfand, E., J., Chem. Phys. 87, 697, 1987.
[31] Bates, F. S., Rosedale, J. H., Frederickson, G. H., Glinka, C., Phys. Rev. Lett. 61, 2229,
1988.
[32] Barrat. J. L., Fredrickson, G. H. J. Chem. Phys. 95, 1281, 1991.
[33] Hajduk, D. A., Takenouchi, H., Hillmyer, M. A., Bates, F. S., Vigild, M. E., Almdal,
K., Macromolecules 30, 3788, 1997.
[34] Kim, D.-C., Lee, H.-K., Sohn, B.-H., Zin, W.-C., Macromolecules 34, 7767, 2001.
[35] Li, L., Lambreva, D. M., de Jeu, W. H., J. Macromol. Sci. B43, 59, 2004.
[36] Hillmyer, M. A., Bates, F. S., Macromolecules 29, 6994, 1996.
[37] Hajduk, A. D., Kossuth, M. B., Hillmyer, M. A., Bates, F. S. J., Chem. Phys. B 102,
4269, 1998.
[38] Cheng, C. Z. D., Zhang, A. et al., Macromolecules 24, 3937, 1991.
[39] Hu, W., Albrecht, T., Strobl, G., Macromolecules 32, 7548, 1999.
65
[40] Hikosaka, M., Polymer 28, 1257, 1987.
[41] Hikosaka, M., Polymer 31, 458, 1990.
[42] Harrison, C., Park, M., Chaikin, P. M., Register, R. A., Adamson, D. H., Yao, N.,
Polymer 39, 2733, 1998.
[43] Förster, S., Khandpur, A. K., Zhao, J., Bates, F. S., Hamley, I.W., Ryan, A. J., Bras,W.,
Macromolecules 27, 6922,1994.
[44] Hamley, I. W., Koppi, K. A., Rosedale, J. H., Bates, F. S., Almdal, K., Mortensen, K.,
Macromolecules 26, 5959,1993; Hajduk, D. A., Gruner, S. M., Rangarajan, P.,
Register, R. A., Fetters, L. J., Honeker, C., Albalak, R. J. et al., Macromolecules 27,
490, 1994.
[45] Qi, S., Wang, Z. G., Macromolecules 30, 4491,1997; Hajduk, D. A., Takenouchi, H.,
Hillmyer, M. A., Bates, F. S., Vigild, M. E., Almdal, K., Macromolecules 30, 3788,
1997.
[46] Lyakhova, K. S., Sevink, G. J. A., Zvelindovsky, A. V., J. Chem. Phys. 120, 1127,
2004.
[47] Knoll, A., Horvat, A., Lyakhova, K. S., Krausch, G., Sevink, G. J. A., Zvelindovsky,
A. V., Magerle, R., Phys. Rev. Lett. 89, 035501-1, 2002.

67
Chapter 4 Nano-structures in thin films of
semifluorinated alkanes
In this chapter an x-ray study on the structure of supported monolayers of
F(CF2)14(CH2)20H will be presented. Depending on the preparation method these
monolayers self-organize into ‘ribbons’ or ‘spirals’. X-ray reflectivity reveals a layer
thickness less than the extended length of the molecule. Grazing-incidence x-ray diffraction
shows that the fluorinated segments orient normal to the layer and can be crystalline or
amorphous without altering the morphology. We propose a model with tilted hydrocarbon
chains resulting in an ‘easy’ axis that explains qualitatively the ribbon structure
68 Chapter 4 Nano-structures in thin films of semifluorinated alkanes
4.1 Introduction
Semifluorinated alkanes F(CF2)n(CH2)mH (abbreviated as FnHm) received much attention
owing to their potential application as repellent systems in material and biological
science.1,2 These ‘primitive surfactants’ segregate into distinct domains in the melt as well
as in the crystalline state3-7 and self-organize in a variety of crystalline and mesogenic
phases. This behavior originates from the presence of the two ‘mutually phobic’ blocks, a
fluorinated and a hydrogenated chain, linked by a covalent bond. Their reciprocal phobicity
or incompatibility stems from the atomic properties of the fluorocarbon part with its high
electronegativity. Moreover the van der Waals radius exceeds by 25-30% the hydrocarbon
van der Waals radius. Furthermore the reduced conformational freedom produces bulky and
stiff chains, typically arranged in a helical conformation. The dense, electron-rich coating
of the chain’s skeleton results in small intermolecular interactions.8 This is why
fluorocarbons are thermally, chemically and biochemically more stable than hydrocarbons.
The use of semifluorinated n-alkanes as side groups in homopolymers or block copolymers
has been shown to generate polymers with low-surface-energy properties. On the other
hand, semifluorinated n-alkanes have been reported to spread at the air-water interface and
form Langmuir films. Other properties such as a low dielectric constant and refractive
index, a high vapor pressure, compressibility and gas solubility,8 expand the possibilities
for practical use of these rather special chemicals.1,9,10
The antagonistic nature of the two building units and the mismatch in cross section
between the perfluoro and the perhydro alkyl tail result in distinct superstructure formation.
Depending on block length and temperature, the competition between ordering of the
hydrocarbon blocks and fluorocarbon blocks results in a rich polymorphism of these
compounds, not fully understood yet.1 Typically layered smectic structures are formed, in
which interdigitation, tilting and partial disordering of the alkyl chain segments
compensates for the mismatch in the van der Waals diameters of the two blocks.6,7,11,12
In ultrathin layers with a thickness comparable to the molecular length, interactions
with and constraints by the interfaces become important. In combination with competing
ordering of the fluorinated and hydrogenated building blocks, this results in structures that
can differ significantly from the bulk smectic organisation.12,13 This issue has been
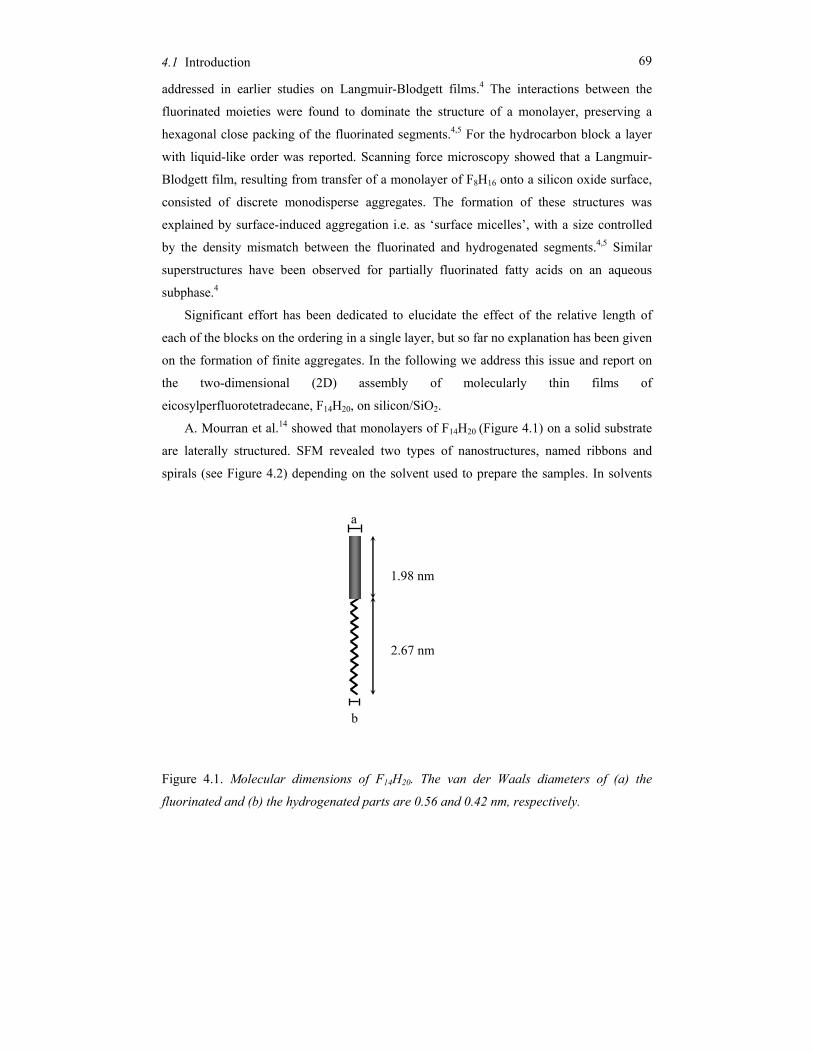
69 4.1 Introduction
addressed in earlier studies on Langmuir-Blodgett films.4 The interactions between the
fluorinated moieties were found to dominate the structure of a monolayer, preserving a
hexagonal close packing of the fluorinated segments.4,5 For the hydrocarbon block a layer
with liquid-like order was reported. Scanning force microscopy showed that a Langmuir-
Blodgett film, resulting from transfer of a monolayer of F8H16 onto a silicon oxide surface,
consisted of discrete monodisperse aggregates. The formation of these structures was
explained by surface-induced aggregation i.e. as ‘surface micelles’, with a size controlled
by the density mismatch between the fluorinated and hydrogenated segments.4,5 Similar
superstructures have been observed for partially fluorinated fatty acids on an aqueous
subphase.4
Significant effort has been dedicated to elucidate the effect of the relative length of
each of the blocks on the ordering in a single layer, but so far no explanation has been given
on the formation of finite aggregates. In the following we address this issue and report on
the two-dimensional (2D) assembly of molecularly thin films of
eicosylperfluorotetradecane, F14H20, on silicon/SiO2.
A. Mourran et al.14 showed that monolayers of F14H20 (Figure 4.1) on a solid substrate
are laterally structured. SFM revealed two types of nanostructures, named ribbons and
spirals (see Figure 4.2) depending on the solvent used to prepare the samples. In solvents
Figure 4.1. Molecular dimensions of F14H20. The van der Waals diameters of (a) the
fluorinated and (b) the hydrogenated parts are 0.56 and 0.42 nm, respectively.
a
b
1.98 nm
2.67 nm
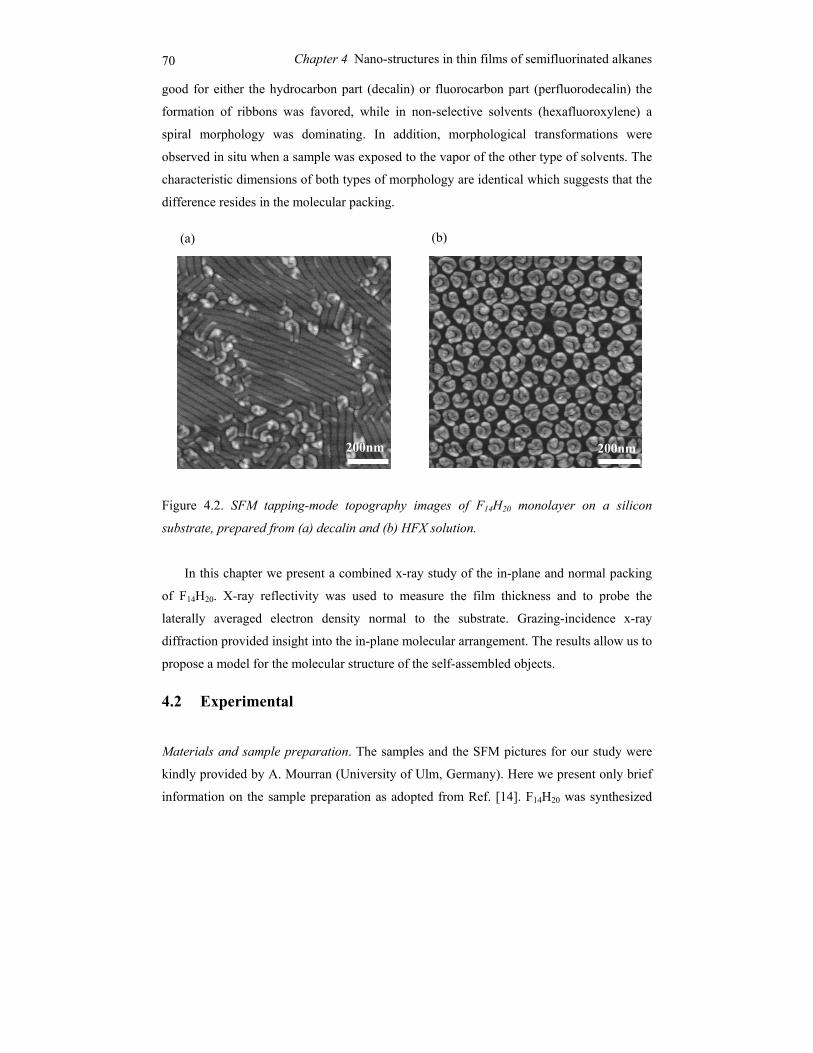
70 Chapter 4 Nano-structures in thin films of semifluorinated alkanes
good for either the hydrocarbon part (decalin) or fluorocarbon part (perfluorodecalin) the
formation of ribbons was favored, while in non-selective solvents (hexafluoroxylene) a
spiral morphology was dominating. In addition, morphological transformations were
observed in situ when a sample was exposed to the vapor of the other type of solvents. The
characteristic dimensions of both types of morphology are identical which suggests that the
difference resides in the molecular packing.
Figure 4.2. SFM tapping-mode topography images of F14H20 monolayer on a silicon
substrate, prepared from (a) decalin and (b) HFX solution.
In this chapter we present a combined x-ray study of the in-plane and normal packing
of F14H20. X-ray reflectivity was used to measure the film thickness and to probe the
laterally averaged electron density normal to the substrate. Grazing-incidence x-ray
diffraction provided insight into the in-plane molecular arrangement. The results allow us to
propose a model for the molecular structure of the self-assembled objects.
4.2 Experimental
Materials and sample preparation. The samples and the SFM pictures for our study were
kindly provided by A. Mourran (University of Ulm, Germany). Here we present only brief
information on the sample preparation as adopted from Ref. [14]. F14H20 was synthesized
200nm
(a)
200nm
(b)
71 4.2 Experimental
according to the procedures reported in Ref. [7]. Thin films were prepared from low-
concentration solutions (0.1 g/L) in three types of solvents: selective solvents for either the
fluorinated block (perfluorodecalin, perfluorohexane) or the hydrocarbon block (decalin,
xylene, iso-octane, chloroform), and a solvent able to dissolve both parts of the molecule
(hexafluoroxylene). Monolayers of F14H20 were transferred to a silicon substrate by the
Langmuir-Blodgett (LB) technique. Starting from a compressed closed film on the LB-
trough optimum coverage of the surface could be ensured. The quality of the transfer was
controlled by SFM and only samples with a coverage >90% were used for the x-ray
investigations.
X-Ray reflectivity. The films were investigated by specular x-ray reflectivity at beamline
BW2 of HASYLAB (DESY, Hamburg) at an energy of 10 keV corresponding to a
wavelength λ = 0.124 nm. The resolution was set at ∆qz = 0.025 nm−1. The density profile
was determined by comparing the calculated and the experimental reflectivity.15
Calculations were based on the Parratt algorithm using a parameterized molecular model in
which two sub-layers were approximated by a box-like function characterized by thickness
and density, convoluted with a Gaussian probability describing the interfacial roughness
(see Sec. 2.3.1). The best-fit curve to the data was determined by a minimization procedure
leading to a density and roughness profile along the film normal. The total thickness was
directly determined by the interference oscillations (Kiessig fringes) between x-rays
reflected from the top and bottom of the film, which is in principle model independent.
Grazing-incidence x-ray diffraction (GIXD). was performed both at beamline BW2 of
HASYLAB (DESY, Hamburg) at 10 keV and at BM26 (DUBBLE) of the ESRF
(Grenoble). In the latter case the energy was 15.9 keV leading to λ = 0.0779 nm. In GIXD
the x-ray beam is incident at the surface of the sample at a small glancing angle below the
critical angle of total reflection. Under these conditions only an evanescent wave is
generated that propagates along the film-air interface and penetrates into the film with an
intensity exponentially decaying with depth. As discussed in Sec. 2.3.3 the evanescent
wave can be considered as an incident beam for 2D x-ray diffraction, giving information
about the 2D structure in the plane of the film. The incident angle was set between the
critical angles of F14H20 monolayer and the substrate, respectively, resulting in 2D
diffraction from the complete monolayer. The overall resolution in the sample plane was set
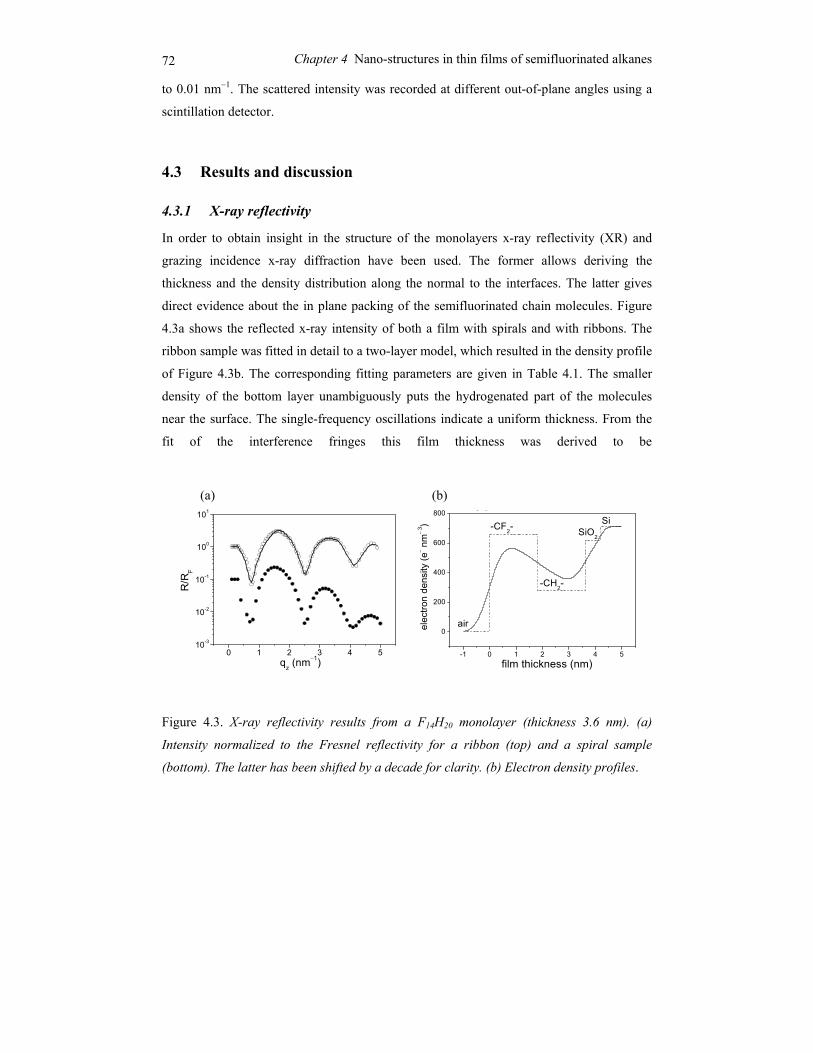
72 Chapter 4 Nano-structures in thin films of semifluorinated alkanes
to 0.01 nm−1. The scattered intensity was recorded at different out-of-plane angles using a
scintillation detector.
4.3 Results and discussion
4.3.1 X-ray reflectivity
In order to obtain insight in the structure of the monolayers x-ray reflectivity (XR) and
grazing incidence x-ray diffraction have been used. The former allows deriving the
thickness and the density distribution along the normal to the interfaces. The latter gives
direct evidence about the in plane packing of the semifluorinated chain molecules. Figure
4.3a shows the reflected x-ray intensity of both a film with spirals and with ribbons. The
ribbon sample was fitted in detail to a two-layer model, which resulted in the density profile
of Figure 4.3b. The corresponding fitting parameters are given in Table 4.1. The smaller
density of the bottom layer unambiguously puts the hydrogenated part of the molecules
near the surface. The single-frequency oscillations indicate a uniform thickness. From the
fit of the interference fringes this film thickness was derived to be
Figure 4.3. X-ray reflectivity results from a F14H20 monolayer (thickness 3.6 nm). (a)
Intensity normalized to the Fresnel reflectivity for a ribbon (top) and a spiral sample
(bottom). The latter has been shifted by a decade for clarity. (b) Electron density profiles.
0 1 2 3 4 510-3
10-2
10-1
100
101(a)
R/R
F
qz (nm−1)-1 0 1 2 3 4 5
0
200
400
600
800(b)
SiSiO2
-CH2-
-CF2-
air
elec
tron
dens
ity (e
− nm
− 3 )
film thickness (nm)
(a) (b)
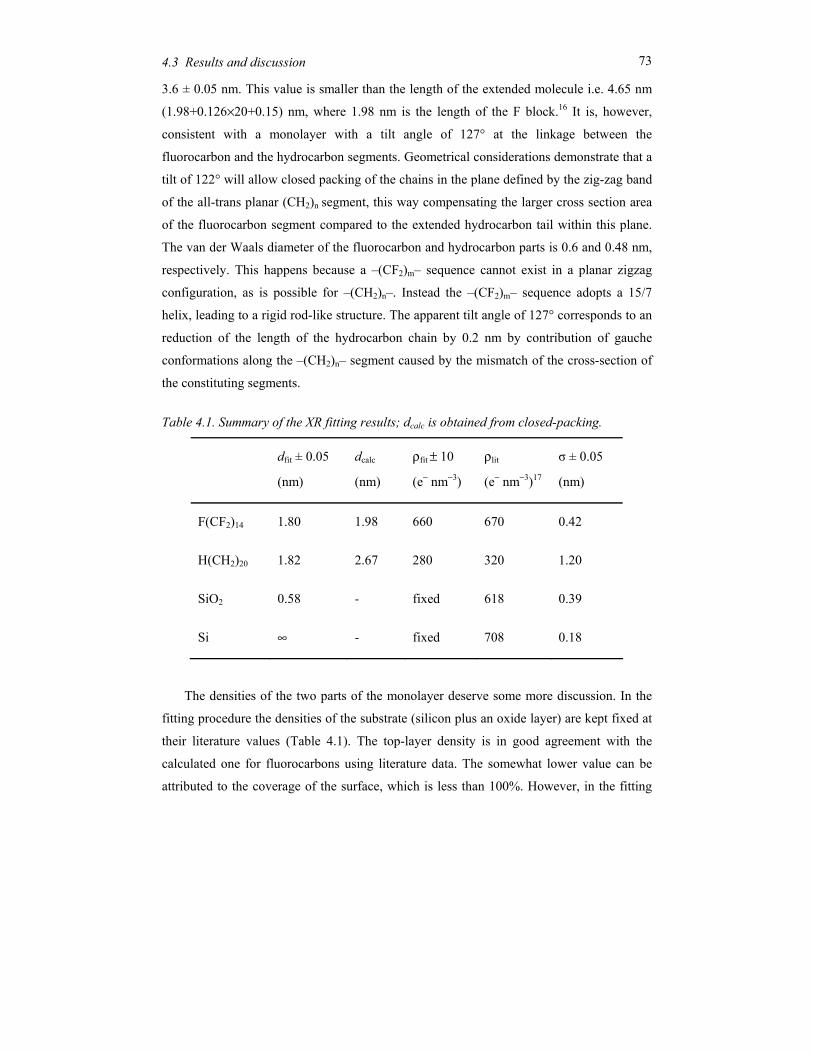
73 4.3 Results and discussion
3.6 ± 0.05 nm. This value is smaller than the length of the extended molecule i.e. 4.65 nm
(1.98+0.126×20+0.15) nm, where 1.98 nm is the length of the F block.16 It is, however,
consistent with a monolayer with a tilt angle of 127° at the linkage between the
fluorocarbon and the hydrocarbon segments. Geometrical considerations demonstrate that a
tilt of 122° will allow closed packing of the chains in the plane defined by the zig-zag band
of the all-trans planar (CH2)n segment, this way compensating the larger cross section area
of the fluorocarbon segment compared to the extended hydrocarbon tail within this plane.
The van der Waals diameter of the fluorocarbon and hydrocarbon parts is 0.6 and 0.48 nm,
respectively. This happens because a –(CF2)m– sequence cannot exist in a planar zigzag
configuration, as is possible for –(CH2)n–. Instead the –(CF2)m– sequence adopts a 15/7
helix, leading to a rigid rod-like structure. The apparent tilt angle of 127° corresponds to an
reduction of the length of the hydrocarbon chain by 0.2 nm by contribution of gauche
conformations along the –(CH2)n– segment caused by the mismatch of the cross-section of
the constituting segments.
Table 4.1. Summary of the XR fitting results; dcalc is obtained from closed-packing.
dfit ± 0.05
(nm)
dcalc
(nm)
ρfit ± 10
(e− nm−3)
ρlit
(e− nm−3)17
σ ± 0.05
(nm)
F(CF2)14 1.80 1.98 660 670 0.42
H(CH2)20 1.82 2.67 280 320 1.20
SiO2 0.58 - fixed 618 0.39
Si ∞ - fixed 708 0.18
The densities of the two parts of the monolayer deserve some more discussion. In the
fitting procedure the densities of the substrate (silicon plus an oxide layer) are kept fixed at
their literature values (Table 4.1). The top-layer density is in good agreement with the
calculated one for fluorocarbons using literature data. The somewhat lower value can be
attributed to the coverage of the surface, which is less than 100%. However, in the fitting
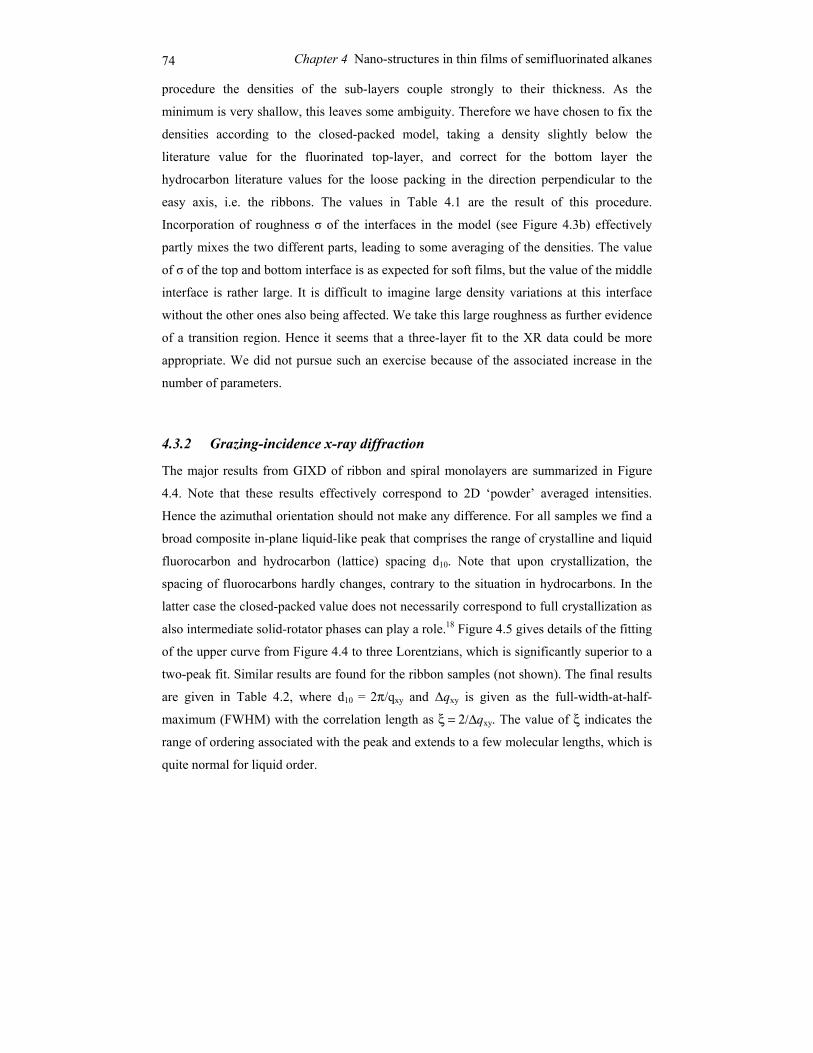
74 Chapter 4 Nano-structures in thin films of semifluorinated alkanes
procedure the densities of the sub-layers couple strongly to their thickness. As the
minimum is very shallow, this leaves some ambiguity. Therefore we have chosen to fix the
densities according to the closed-packed model, taking a density slightly below the
literature value for the fluorinated top-layer, and correct for the bottom layer the
hydrocarbon literature values for the loose packing in the direction perpendicular to the
easy axis, i.e. the ribbons. The values in Table 4.1 are the result of this procedure.
Incorporation of roughness σ of the interfaces in the model (see Figure 4.3b) effectively
partly mixes the two different parts, leading to some averaging of the densities. The value
of σ of the top and bottom interface is as expected for soft films, but the value of the middle
interface is rather large. It is difficult to imagine large density variations at this interface
without the other ones also being affected. We take this large roughness as further evidence
of a transition region. Hence it seems that a three-layer fit to the XR data could be more
appropriate. We did not pursue such an exercise because of the associated increase in the
number of parameters.
4.3.2 Grazing-incidence x-ray diffraction
The major results from GIXD of ribbon and spiral monolayers are summarized in Figure
4.4. Note that these results effectively correspond to 2D ‘powder’ averaged intensities.
Hence the azimuthal orientation should not make any difference. For all samples we find a
broad composite in-plane liquid-like peak that comprises the range of crystalline and liquid
fluorocarbon and hydrocarbon (lattice) spacing d10. Note that upon crystallization, the
spacing of fluorocarbons hardly changes, contrary to the situation in hydrocarbons. In the
latter case the closed-packed value does not necessarily correspond to full crystallization as
also intermediate solid-rotator phases can play a role.18 Figure 4.5 gives details of the fitting
of the upper curve from Figure 4.4 to three Lorentzians, which is significantly superior to a
two-peak fit. Similar results are found for the ribbon samples (not shown). The final results
are given in Table 4.2, where d10 = 2π/qxy and ∆qxy is given as the full-width-at-half-
maximum (FWHM) with the correlation length as ξ = 2/∆qxy. The value of ξ indicates the
range of ordering associated with the peak and extends to a few molecular lengths, which is
quite normal for liquid order.
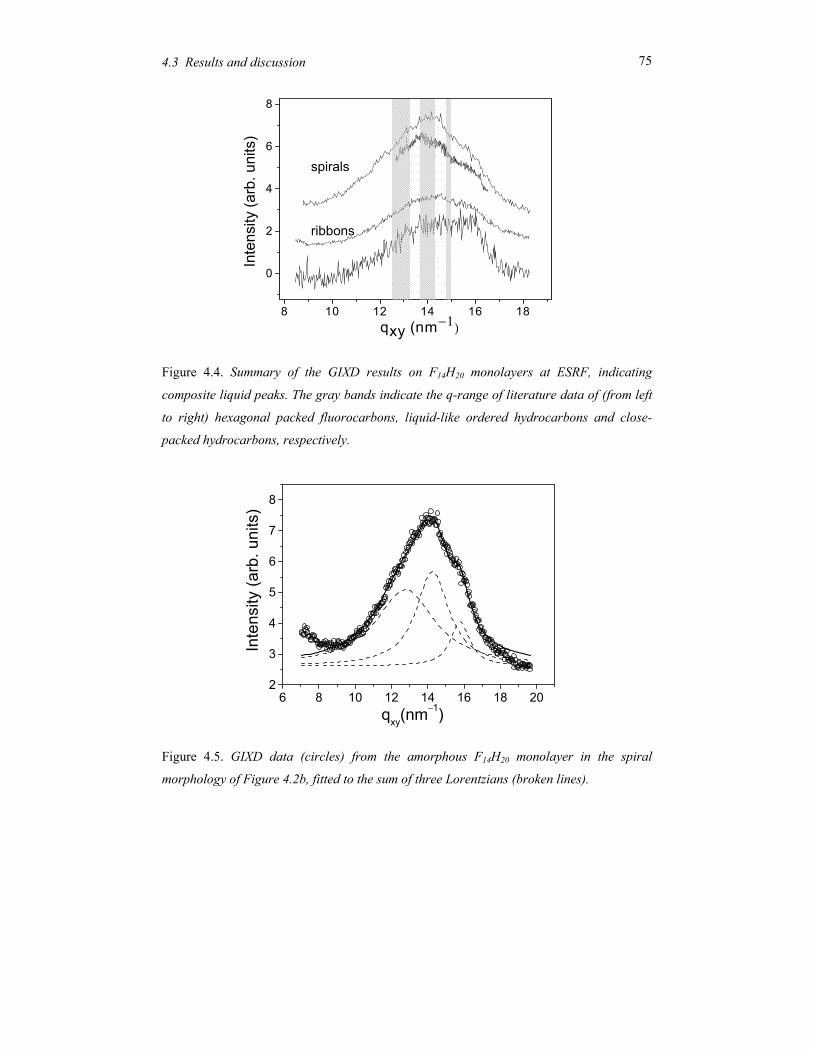
75 4.3 Results and discussion
6 8 10 12 14 16 18 202
3
4
5
6
7
8
Inte
nsity
(arb
. uni
ts)
qxy(nm−1)
Figure 4.4. Summary of the GIXD results on F14H20 monolayers at ESRF, indicating
composite liquid peaks. The gray bands indicate the q-range of literature data of (from left
to right) hexagonal packed fluorocarbons, liquid-like ordered hydrocarbons and close-
packed hydrocarbons, respectively.
Figure 4.5. GIXD data (circles) from the amorphous F14H20 monolayer in the spiral
morphology of Figure 4.2b, fitted to the sum of three Lorentzians (broken lines).
8 10 12 14 16 18
0
2
4
6
8
Inte
nsity
(arb
. uni
ts)
qxy (nm−1)
spirals
ribbons
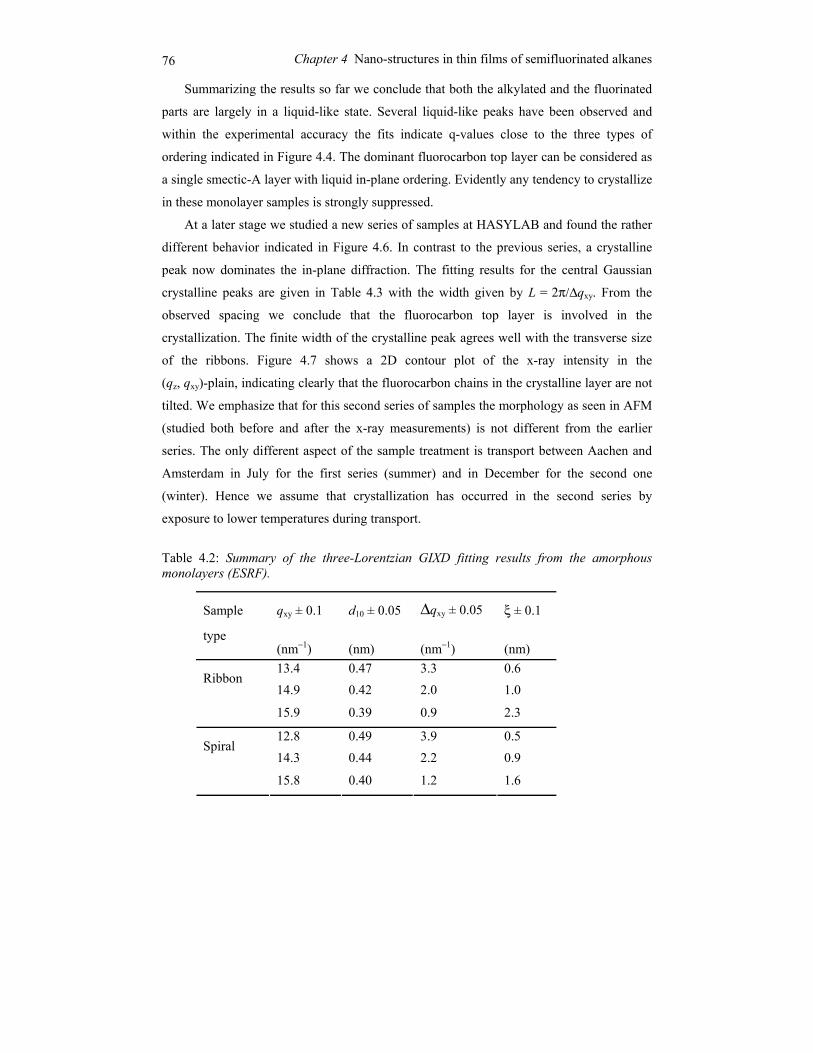
76 Chapter 4 Nano-structures in thin films of semifluorinated alkanes
Summarizing the results so far we conclude that both the alkylated and the fluorinated
parts are largely in a liquid-like state. Several liquid-like peaks have been observed and
within the experimental accuracy the fits indicate q-values close to the three types of
ordering indicated in Figure 4.4. The dominant fluorocarbon top layer can be considered as
a single smectic-A layer with liquid in-plane ordering. Evidently any tendency to crystallize
in these monolayer samples is strongly suppressed.
At a later stage we studied a new series of samples at HASYLAB and found the rather
different behavior indicated in Figure 4.6. In contrast to the previous series, a crystalline
peak now dominates the in-plane diffraction. The fitting results for the central Gaussian
crystalline peaks are given in Table 4.3 with the width given by L = 2π/∆qxy. From the
observed spacing we conclude that the fluorocarbon top layer is involved in the
crystallization. The finite width of the crystalline peak agrees well with the transverse size
of the ribbons. Figure 4.7 shows a 2D contour plot of the x-ray intensity in the
(qz, qxy)-plain, indicating clearly that the fluorocarbon chains in the crystalline layer are not
tilted. We emphasize that for this second series of samples the morphology as seen in AFM
(studied both before and after the x-ray measurements) is not different from the earlier
series. The only different aspect of the sample treatment is transport between Aachen and
Amsterdam in July for the first series (summer) and in December for the second one
(winter). Hence we assume that crystallization has occurred in the second series by
exposure to lower temperatures during transport.
Table 4.2: Summary of the three-Lorentzian GIXD fitting results from the amorphous monolayers (ESRF).
Sample
type
qxy ± 0.1
(nm−1)
d10 ± 0.05
(nm)
∆qxy ± 0.05
(nm−1)
ξ ± 0.1
(nm) 13.4 0.47 3.3 0.6 14.9 0.42 2.0 1.0
Ribbon
15.9 0.39 0.9 2.3
12.8 0.49 3.9 0.5 14.3 0.44 2.2 0.9
Spiral
15.8 0.40 1.2 1.6
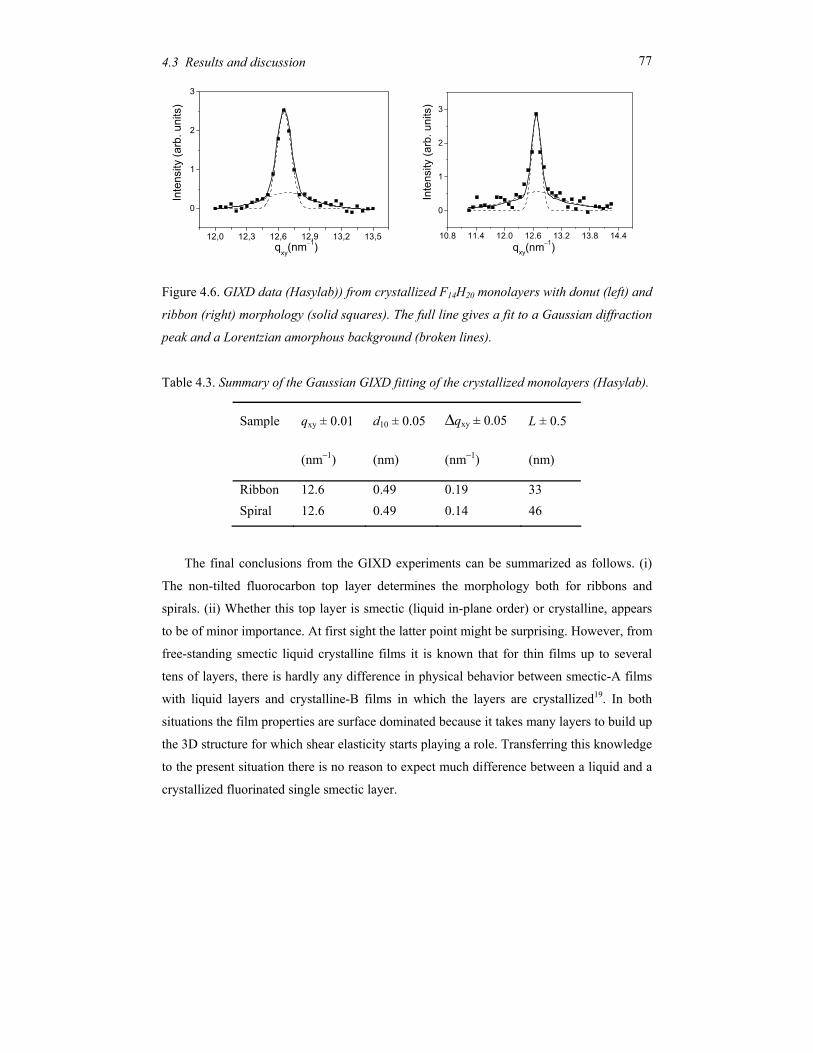
77 4.3 Results and discussion
Figure 4.6. GIXD data (Hasylab)) from crystallized F14H20 monolayers with donut (left) and
ribbon (right) morphology (solid squares). The full line gives a fit to a Gaussian diffraction
peak and a Lorentzian amorphous background (broken lines).
Table 4.3. Summary of the Gaussian GIXD fitting of the crystallized monolayers (Hasylab).
Sample qxy ± 0.01
(nm−1)
d10 ± 0.05
(nm)
∆qxy ± 0.05
(nm−1)
L ± 0.5
(nm)
Ribbon 12.6 0.49 0.19 33 Spiral 12.6 0.49 0.14 46
The final conclusions from the GIXD experiments can be summarized as follows. (i)
The non-tilted fluorocarbon top layer determines the morphology both for ribbons and
spirals. (ii) Whether this top layer is smectic (liquid in-plane order) or crystalline, appears
to be of minor importance. At first sight the latter point might be surprising. However, from
free-standing smectic liquid crystalline films it is known that for thin films up to several
tens of layers, there is hardly any difference in physical behavior between smectic-A films
with liquid layers and crystalline-B films in which the layers are crystallized19. In both
situations the film properties are surface dominated because it takes many layers to build up
the 3D structure for which shear elasticity starts playing a role. Transferring this knowledge
to the present situation there is no reason to expect much difference between a liquid and a
crystallized fluorinated single smectic layer.
12,0 12,3 12,6 12,9 13,2 13,5
0
1
2
3
Inte
nsity
(arb
. uni
ts)
qxy(nm−1)10.8 11.4 12.0 12.6 13.2 13.8 14.4
0
1
2
3
Inte
nsity
(arb
. uni
ts)
qxy(nm−1)
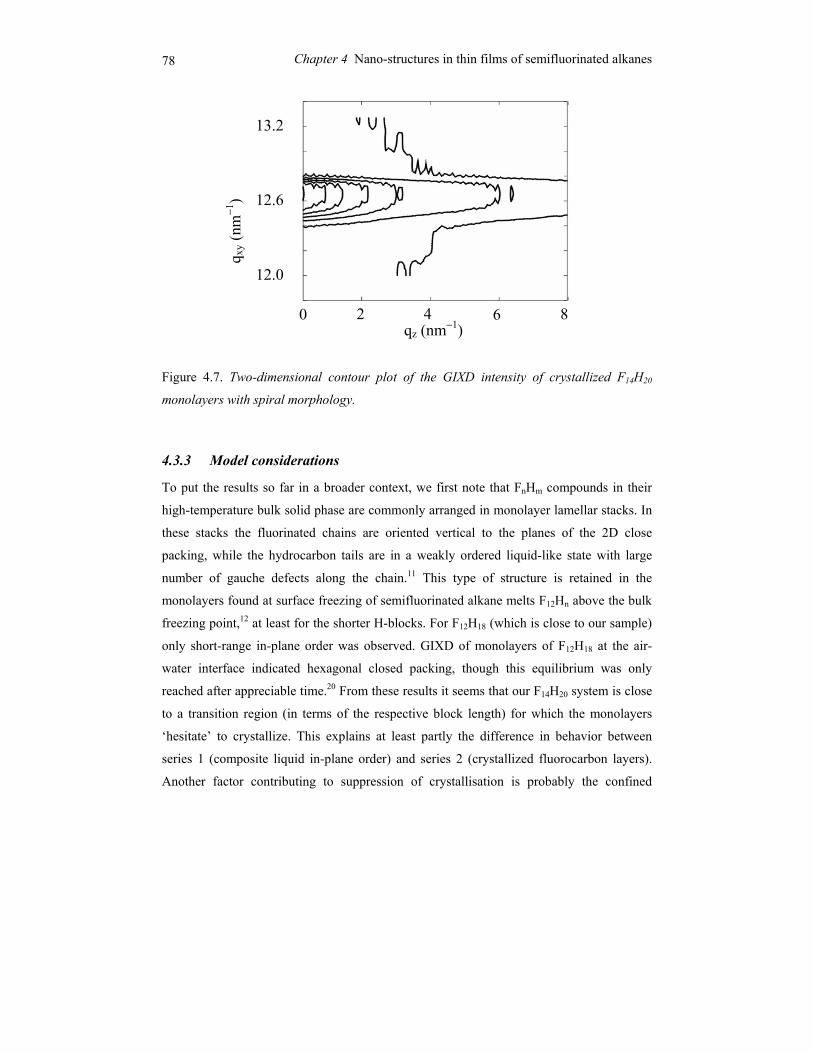
78 Chapter 4 Nano-structures in thin films of semifluorinated alkanes
Figure 4.7. Two-dimensional contour plot of the GIXD intensity of crystallized F14H20
monolayers with spiral morphology.
4.3.3 Model considerations
To put the results so far in a broader context, we first note that FnHm compounds in their
high-temperature bulk solid phase are commonly arranged in monolayer lamellar stacks. In
these stacks the fluorinated chains are oriented vertical to the planes of the 2D close
packing, while the hydrocarbon tails are in a weakly ordered liquid-like state with large
number of gauche defects along the chain.11 This type of structure is retained in the
monolayers found at surface freezing of semifluorinated alkane melts F12Hn above the bulk
freezing point,12 at least for the shorter H-blocks. For F12H18 (which is close to our sample)
only short-range in-plane order was observed. GIXD of monolayers of F12H18 at the air-
water interface indicated hexagonal closed packing, though this equilibrium was only
reached after appreciable time.20 From these results it seems that our F14H20 system is close
to a transition region (in terms of the respective block length) for which the monolayers
‘hesitate’ to crystallize. This explains at least partly the difference in behavior between
series 1 (composite liquid in-plane order) and series 2 (crystallized fluorocarbon layers).
Another factor contributing to suppression of crystallisation is probably the confined
12.0
12.6
13.2
qz (nm−1) 2 4 6 8 0
q xy (
nm−1
)
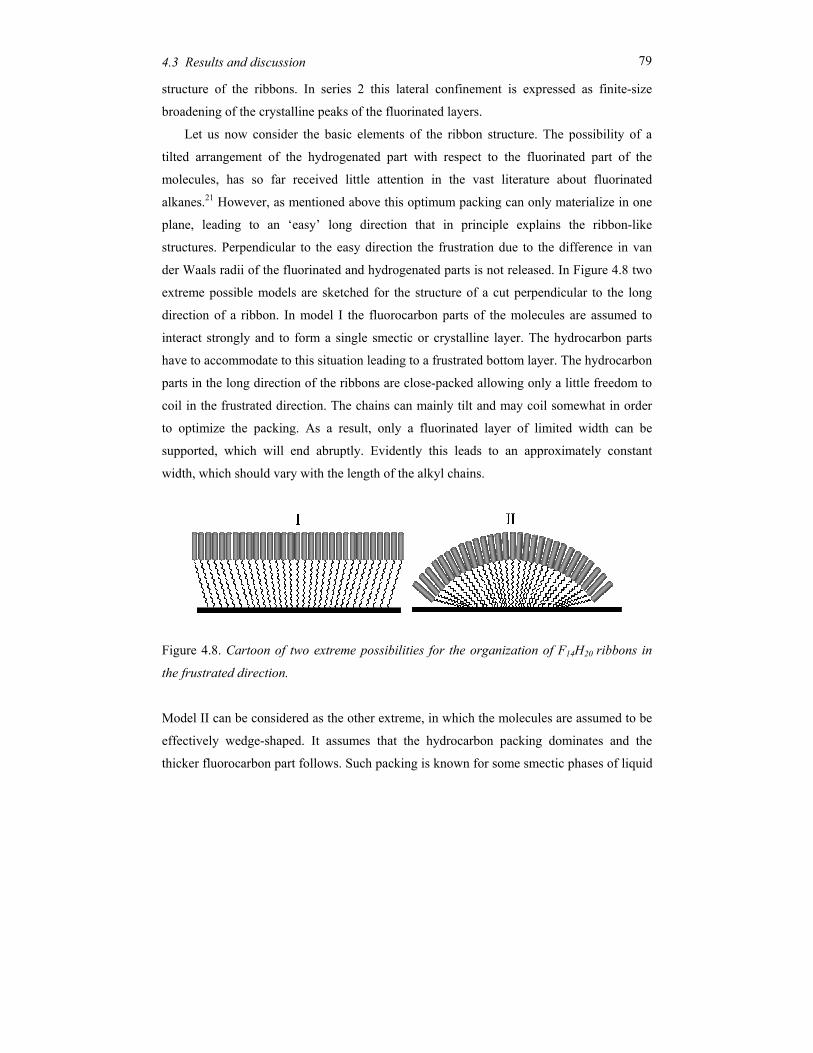
79 4.3 Results and discussion
structure of the ribbons. In series 2 this lateral confinement is expressed as finite-size
broadening of the crystalline peaks of the fluorinated layers.
Let us now consider the basic elements of the ribbon structure. The possibility of a
tilted arrangement of the hydrogenated part with respect to the fluorinated part of the
molecules, has so far received little attention in the vast literature about fluorinated
alkanes.21 However, as mentioned above this optimum packing can only materialize in one
plane, leading to an ‘easy’ long direction that in principle explains the ribbon-like
structures. Perpendicular to the easy direction the frustration due to the difference in van
der Waals radii of the fluorinated and hydrogenated parts is not released. In Figure 4.8 two
extreme possible models are sketched for the structure of a cut perpendicular to the long
direction of a ribbon. In model I the fluorocarbon parts of the molecules are assumed to
interact strongly and to form a single smectic or crystalline layer. The hydrocarbon parts
have to accommodate to this situation leading to a frustrated bottom layer. The hydrocarbon
parts in the long direction of the ribbons are close-packed allowing only a little freedom to
coil in the frustrated direction. The chains can mainly tilt and may coil somewhat in order
to optimize the packing. As a result, only a fluorinated layer of limited width can be
supported, which will end abruptly. Evidently this leads to an approximately constant
width, which should vary with the length of the alkyl chains.
Figure 4.8. Cartoon of two extreme possibilities for the organization of F14H20 ribbons in
the frustrated direction.
Model II can be considered as the other extreme, in which the molecules are assumed to be
effectively wedge-shaped. It assumes that the hydrocarbon packing dominates and the
thicker fluorocarbon part follows. Such packing is known for some smectic phases of liquid
80 Chapter 4 Nano-structures in thin films of semifluorinated alkanes
crystalline molecules.22 It will lead to a continuous curvature of the upper surface, and
consequently to a constant width.
Considering the overall situation there is considerable evidence in favour of model I:
• In x-ray reflectivity relatively pronounced minima are observed, indicating a well-
defined structure of layers. In the case of a strong curvature (model II) a parallel x-ray beam
would experience a broad distribution of incident angles. In that situation there is no well-
defined thickness and no Kiessig fringes would be observed in the x-ray reflectivity. In fact
the minima disappear at an angular spread larger than about 0.1°. Hence this number puts
an upper limit to curved regions that still contribute to the distinguishing features of the
reflectivity curve. Kraft et al. reached a similar conclusion for monolayers of F8H16 for
which a top interface with an ellipsoidal curvature could not fit their data.23
• The densities of the two layers as observed in XR agree well with the calculated values.
This is not expected for model II where an increased density of the bottom layer due to the
bended fluorocarbon parts would result.
• GIXD of F14H20 indicates that the fluorinated parts of the molecules are arranged
perpendicular to the surface in a layered structure. Depending on temperature and history
the –(CF2)n–layer is either crystallized or smectic (liquid-like), which does not make much
of a difference for the present discussion. In agreement with this statement the AFM
morphologies are in both cases very similar.
In model I the constant width in the frustrated direction should depend on the length of
the CH2 parts. Indeed we observed for various choices of CF2-length that the width
increases with nH, the number of CH2 groups. A larger value of nH is expected to allow a
larger variation of CH2-conformations, and thus more possibilities to support the CF2-layer.
We conclude that a model I for the finite width of the ribbons will be close to the cartoon
mode I of Figure 4.8. Of course it should be realized that a realistic model will not be as
extreme as pictured, and can be expected to contain local differences in structure.
Finally we come to a discussion of ribbons versus spirals. From the results so far it
seems that the ribbon pattern is the natural way to accommodate a monolayer of F14H20.
This is conclusively explained by the difference between the closed packing along the
ribbons and the frustrated packing in the transverse direction. The latter leads to a constant
width that is preserved in the spiral structure as well. Note that spiral-like patterns have
been reported earlier in monolayers, but have usually been treated as hemispherical
81 4.3 Results and discussion
micelles.23 In the present case of F14H20, the resolution of the SFM micrographs
unambiguously depicts turning of short ribbons. This observation is quantitatively
supported by the finite width of the crystalline peaks in Figure 4.6 (see also Table 4.3). In
fact both right-handed and left-handed structures are found. Yet, Figure 4.1 is one of many
examples where no change of rotation direction is observed within the spiral. Starting from
the ribbon structure we note that the kinks along the ribbon direction can be directed either
forward or backward. A transition from one direction to the other leads to a defect. The
stresses in packing near such a defect can be released by creating a discrete angular step
along the ribbon leading to a change in the azimuthal tilt angle direction. The ribbon needs
a preference to continue in the same direction after the first turn, to explain the spirals of
Figure 4.2b. Note that the first azimuthal step can be directed either clock-wise or counter-
clockwise, which explains the two types of spirals. At present it is not clear to us why a
certain angular direction is continued and why the nano-spirals can be obtained so easily
with narrow size distributions. We would like to speculate that the spirals grow at the air
solution interface at the outer end and wind to the center where they can grow no further
due to the steric constraint. This might also explain why we find closed toroids only
sometimes and why spirals can be compressed and open again.
4.4 Conclusions
We have presented a surface x-ray scattering (XR and GIXD) study on the structure of
supported monolayers of F(CF2)14(CH2)20H. SFM images have shown lateral structuring
expressed in two morphologies: straight ribbons and nanospirals. Whether the one or the
other formed depended on the solvent from which the sample was prepared. The
characteristic dimensions of both morphologies are identical which suggests that the
difference resides in the molecular packing. XR analysis confirmed that the height of the
structures is less than the extended length of the molecules and revealed the layered
structure of the monolayer. GIXD proves that the fluorinated segments tend to pack with a
chain orientation normal to the layer in an arrangement that would allow large 2D-films.
Thus, the observed peculiarities in the morphology must be caused by ordering of the
hydrocarbon chains. We have proposed a model with tilted hydrocarbon chains resulting in
82 Chapter 4 Nano-structures in thin films of semifluorinated alkanes
an easy axis that explains qualitatively the ribbon structure and the origin of the
nanospirals. In the direction perpendicular to the easy axis the mismatch of dense packing
of CF2 and CH2 groups can be released by partial disordering of the alkyl chains
corresponding to an interlayer. Yet this incommensurability can only be compensated over
a restricted length. These arguments give a first coarse indication for the formation of
stripes or bands of uniform width. In one direction the incommensurability is compensated
by the tilt of the hydrocarbon chain towards the normal of the monofilm, in the other
direction it can be compensated only for a limited length by partial disordering of the
hydrocarbon segment.
83
References
[1] Riess J. G., Tetrahedron 58, 4113, 2002.
[2] Lo Nostro P., Curr. Opin. Colloid Interface Sci, 8, 223, 2003.
[3] Mahler W., Guillon D., Skoulios A., Mol. Cryst. Liq. Cryst. Lett. 2, 111, 1985.
[4] Viney C., Russell T. P., Depero L.E., Liq. Cryst. 5, 1783, 1989.
[5] Rabolt J. F., Russell T. P., Twieg R. J., Macromolecules 17, 2786, 1984.
[6] Russell T. P., Rabolt J. F., Twieg R. J., Siemens R. L., Farmer B. L.,
Macromolecules 19, 1135, 1986.
[7] Höpken J., “Fluorocarbon-Hydrocarbon Molecules, structural Components for Self-
Organizing Materials”, Dissertation, University of Twente, Netherlands, 1991;
Höpken J., Pugh C., Richtering W., Möller M., Makromol. Chem. 189, 911, 1988.
[8] Krafft M. P., Adv. Drug. Deliv. Rev. 47, 209, 2001.
[9] Johns K., Stead G., J. Fluor. Chem. 104, 18, 2000.
[10] Padua A. A. H., J. Phys. Chem. A 106, 116, 2002.
[11] Marczuk P., Lang P., Macromolecules 31, 9013, 1998.
[12] Gang O., Ellmann J., Möller M., Kraack H., Sirota E. B., Ocko B. M. and Deutsch
M., Europhys. Lett. 48, 761, 2000.
[13] Marczuk P., Lang P., Findenegg G. H., Mehta S. K., Moeller M., Langmuir 18,
6830, 2002.
[14] Mourran A., Tartsch B., Gallyamov M., Magonov S., Lambreva D. M., Ostrovskii B.
I., Dolbnya I. P., de Jeu W. H., Moeller M., Langmuir 21, 2308, 2005.
[15] See, for example, M.Tolan, X-ray scattering from Soft Matter Thin Films, (Springer,
Berlin), 1999.
[16] Lo Nostro P. L., Ched S.-H., J. Phys. Chem. 97, 6535, 1993.
[17] Daillant J., Gibaud A., X-ray and neutron reflectivity: principles and applications
(Springer-Verlag), 1999.
[18] Ocko B. M., Wu X. Z., Sirota E. B., Sinha S. K., Gang O., Deutsch M., Phys. Rev. E
55, 3164, 1997.
[19] Fera A., Dolbnya I. P., Opitz R., Ostrovskii B.I., de Jeu W.H., Phys. Rev. E 63,
020601, 2001.
84 Chapter 4 Nano-structures in thin films of semifluorinated alkanes
[20] Huang Z., AceroA. A., Lei N., Rice S. A., Zhang Z., Schlossman M. L., J. Chem.
Soc. Faraday Trans. 92, 545, 1996.
[21] Krafft M-P., Curr. Opin. Coll. Interf. Sci. 8, 243, 2003.
85
Chapter 5 Order and disorder in smectic
elastomers
In this chapter we present a high-resolution x-ray study of the effect of random crosslinking
on the one-dimensional translational ordering in smectic elastomers. At a small crosslink
density of about 5%, the elastomer network stabilizes the smectic structure against layer-
displacement fluctuations, and the algebraically decaying layer ordering extends up to
several micrometers. With increasing concentration of crosslinks, the finite size of these
domains is strongly reduced, indicating that disordering takes over. Finally, at a crosslink
concentration of 20%, the structure factor can be described by a Lorentzian, which signals
extended short-range correlations. The findings are discussed in terms of recent theories of
quenched disorder by random fields.
86 Chapter 5 Order and disorder in smectic elastomers
5.1 Order and disorder in smectic systems
In a three-dimensional crystal the particles vibrate around well-defined lattice positions
with an amplitude which is small compared to the lattice spacing. As the dimensionality is
decreased, fluctuations become increasingly important. As a result, long-range translational
order cannot exist in less than three dimensions, as it would be destroyed by thermal
fluctuations. For example, for a two-dimensional solid positional correlations decay
algebraically with of distance. Similar behavior is found for the layer ordering in smectic-A
liquid crystals.1,2 In this phase the orientationally ordered elongated molecules are arranged
in stacks of fluid layers. The one-dimensional layer correlations do not possess long-range
ordering. This is also the case for surfactant membranes3,4,5 and the melts of lamellar block
copolymers.1,6 In all these systems thermally excited fluctuations cause the mean-squared
layer displacements of the layer positions to diverge logarithmically with the system size
(Landau-Peierls instability). As a result, the correlation function describing the one-
dimensional translational ordering decays with distance r algebraically as r −η, in which the
exponent η is small and positive (quasi-long-range order).
A completely different way of changing positional ordering can occur under the
influence of a random field. One way to apply such a field is by confinement of a smectic
phase in highly porous, chemically bonded silica gels (aerogels). The effect on the smectic
ordering in the vicinity of the smectic-nematic phase transition has been well characterized
by several methods including x-ray diffraction, specific heat, static and dynamic light
scattering measurements.7-10 Even at very low concentrations of the aerogels (about 1-3%)
the ordering of the smectic layers is destroyed, which is consistent with the theoretical
prediction that any quenched disorder, no matter how weak, should cause this effect.12,13
The remaining smectic order persists only locally on a macroscopic length scale
ξ(T) ≈ 100 nm, the ‘x-ray correlation length’ (see Figure 5.1). Thus there is no distinct
smectic-A phase and nematic–smectic-A transition anymore in such a system, in agreement
with theoretical predictions.7,11,13
By attaching liquid-crystalline (mesogenic) molecules to a polymer backbone via
flexible linkages the one-dimensional quasi-long-range layer ordering can be combined
with polymer properties. In the smectic phase the mesogenic units still form ordered stacks
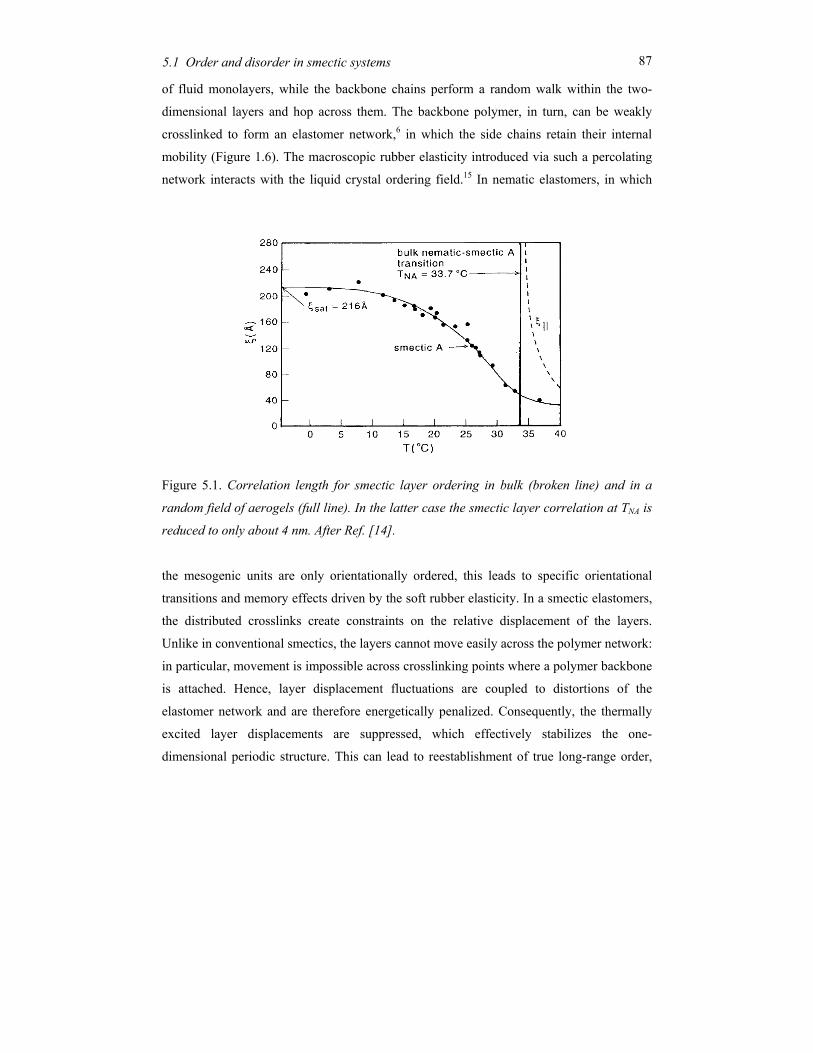
875.1 Order and disorder in smectic systems
of fluid monolayers, while the backbone chains perform a random walk within the two-
dimensional layers and hop across them. The backbone polymer, in turn, can be weakly
crosslinked to form an elastomer network,6 in which the side chains retain their internal
mobility (Figure 1.6). The macroscopic rubber elasticity introduced via such a percolating
network interacts with the liquid crystal ordering field.15 In nematic elastomers, in which
Figure 5.1. Correlation length for smectic layer ordering in bulk (broken line) and in a
random field of aerogels (full line). In the latter case the smectic layer correlation at TNA is
reduced to only about 4 nm. After Ref. [14].
the mesogenic units are only orientationally ordered, this leads to specific orientational
transitions and memory effects driven by the soft rubber elasticity. In a smectic elastomers,
the distributed crosslinks create constraints on the relative displacement of the layers.
Unlike in conventional smectics, the layers cannot move easily across the polymer network:
in particular, movement is impossible across crosslinking points where a polymer backbone
is attached. Hence, layer displacement fluctuations are coupled to distortions of the
elastomer network and are therefore energetically penalized. Consequently, the thermally
excited layer displacements are suppressed, which effectively stabilizes the one-
dimensional periodic structure. This can lead to reestablishment of true long-range order,
88 Chapter 5 Order and disorder in smectic elastomers
even though the translational order is still one-dimensional as in a non-crosslinked smectic
polymer.16-18
On another hand, the random network of crosslinks is a source of disorder in the
system. The effects of randomness and disorder on the properties of condensed matter
systems constitute a source of challenging problems.11 Examples include systems as
different as the pinning of the Abrikosov flux vortex lattice by impurities in
superconductors, disordered Ising magnets, superfluid transitions in helium and the
confined phase transitions in smectic liquid crystals mentioned above. Usually, the effects
of so-called quenched disorder are considered, in which the source of distortion is fixed in
space and time. Smectic elastomers provide a new model system to investigate the effects
of disorder due to a random field. However, the situation is complex, because the
crosslinking defects are flexible chains, which are embedded in the fluctuating elastomer
network and therefore not fixed. We conclude that in smectic elastomers two opposing
tendencies exist that can interfere with each other: the suppression of layer displacement
fluctuations, which enhances the translational order in the system, and the random
dislocation field of the crosslinks, which should lead to a frustrated distorted state with
increased disorder.
In order to probe the effect of the crosslinking on the positional correlations in smectics
we conducted a high-resolution x-ray scattering study of smectic elastomers with different
crosslink densities. High-resolution x-ray diffraction of the (quasi) Bragg peak due to the
smectic layering provides direct information about the asymptotic behavior of the positional
correlation function. In the next section we shall discuss the smectic structure factor in
some detail, while, in Sec. 5.3, the extension to smectic elastomers will be made. After a
description of the experiments in Sec. 5.4, the results are finally presented and discussed in
Sec. 5.5. At a relatively small density of the crosslinks (about 5%), the elastomer network
enhances the stability of the layered structure against layer-displacement fluctuations. The
layer ordering extends to length-scales of several micrometers, yet true long-range
positional order does not develop. With increasing crosslink density up to 15%, the
algebraic decay of the positional correlations is preserved but within smectic domains of
decreasing size, down to values as small as 400 nm. Finally, the smectic ordering is
destroyed at a crosslink concentration of about 20% and is replaced by short-range smectic
correlations with a characteristic correlation length of the order of 100 nm.
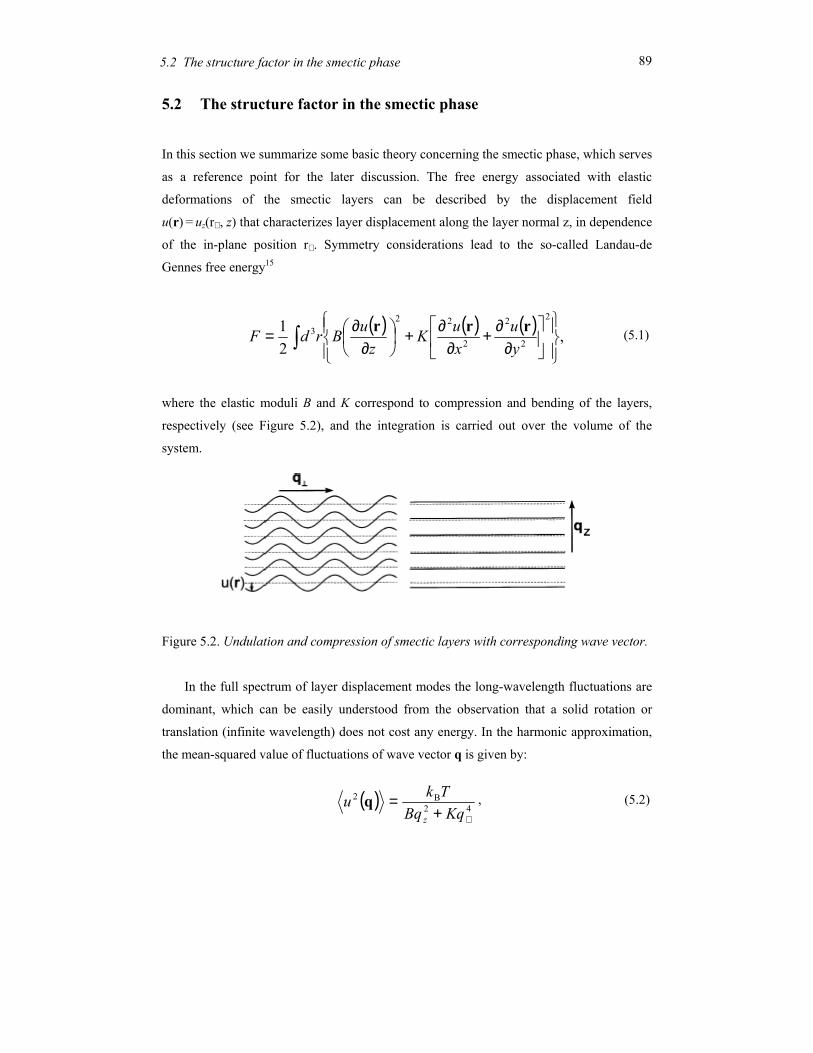
895.2 The structure factor in the smectic phase
( ) 42B2
⊥+=
KqBqTku
z
q
5.2 The structure factor in the smectic phase
In this section we summarize some basic theory concerning the smectic phase, which serves
as a reference point for the later discussion. The free energy associated with elastic
deformations of the smectic layers can be described by the displacement field
u(r) = uz(r⊥ , z) that characterizes layer displacement along the layer normal z, in dependence
of the in-plane position r⊥ . Symmetry considerations lead to the so-called Landau-de
Gennes free energy15
(5.1)
where the elastic moduli B and K correspond to compression and bending of the layers,
respectively (see Figure 5.2), and the integration is carried out over the volume of the
system.
Figure 5.2. Undulation and compression of smectic layers with corresponding wave vector.
In the full spectrum of layer displacement modes the long-wavelength fluctuations are
dominant, which can be easily understood from the observation that a solid rotation or
translation (infinite wavelength) does not cost any energy. In the harmonic approximation,
the mean-squared value of fluctuations of wave vector q is given by:
, (5.2)
( ) ( ) ( ) ,21
2
2
2
2
223∫
∂
∂+∂
∂+
∂∂=
yu
xuK
zuBrdF rrr
90 Chapter 5 Order and disorder in smectic elastomers
where u(q) is the Fourier transform of the layer displacement field u(r), qz and q⊥ are the
wave vector components along and perpendicular to the layer normal, respectively, and kBT
is the thermal energy. The mean-squared layer displacement ⟨u2(r)⟩ is obtained by
integrating over the full spectrum of wave displacement vectors. The integration boundaries
are 2π/L ≤ qz ≤ 2π/d and 2π/W ≤ q⊥ ≤ 2π/a, where L and W are the sample size normal to the
layers and in-plane, respectively, a is the lateral molecular spacing and d the layer spacing.
For many common situations W >> L and a < d, in which case the limits of integration can
be expanded to W → ∞ and a → 0. In that case we obtain:
(5.3)
The logarithmic divergence of ⟨u2(r)⟩ with the sample size is known as Landau-Peierls
instability.19,20 As a consequence, for sufficiently large L, the fluctuations would become of
the order of the layer spacing d and the layered structure would be wiped out. However, for
a typical experimental situation, L is in the mm-range, K ≈ 10 −11 N and B ≈ 10 7 N/m2,
leading to a layer-displacement amplitude σ = ⟨u2(r)⟩1/2 ≈ 0.5 – 0.7 nm. Thus, in terms of the
relative displacement we find σ/d ≈ 0.2 and the smectic layers are still well defined. Note
the difference from common three-dimensional crystals, for which the expression for the
mean-squared layer displacement is given by
. (5.4)
At room temperature this gives for typical values of the elastic modulus C ≈ 1010 N/m2 and
a ≈ 0.5 nm a result σ = ⟨u2(r)⟩1/2 ≈ 0.02 nm, while no dependence on the sample size is
present.
The positional order in a condensed medium can be described by the density-density
correlation function. Thus, the quasi-long-range order in smectic-A systems is distinguished
from true long-range order by its pair-correlation function G(r). In the harmonic
approximation this function can be written as
(5.5)
( ) .ln8
B2
=
dL
KBTku
πr
( ) B2
aCTku
π=r
( ) ( ) ( ) ( ) ( ) ( )[ ]{ } ( )
−=−∝−= rrrrr gquuiqG 2
00 21exp0exp00)( ρρρρ
915.2 The structure factor in the smectic phase
where
(5.6)
is the layer displacement correlation function, ρ(r) is the density distribution and q0 = 2π/d.
In the case of true long-range order, G(r) approaches a constant value for r → ∞. In
contrast, the short-range order of liquids is described by a G(r), which decays
exponentially. Caillé has calculated the pair-correlation function describing the algebraic
decay, typical for the layer structure of a smectic liquid crystal, in the harmonic
approximation, which is given by21,4
where γE is Euler’s constant and E1(x) the exponential integral. The dimensionless exponent
η describing the power-law behavior can be written as
Using the asymptotic expression for the exponential integral in Eq. (5.7) the following
limiting cases can be written explicitly:
. (5.9)
As discussed in Sec. 2.1, in x-ray experiments, the Fourier image of the density-density
correlation function G(r) is determined, which can be expressed as the structure factor:
. (5.10)
( ) ( ) ( )rqrq ⋅= ∫ irGdS exp3
( ) ,,0 η−∝ zzG
( ) η20, −⊥⊥ ∝ rrG
( ) ( ) ( )[ ]20uug −= rr
( ) ( )
−
−∝= ⊥
⊥⊥ BKz
rErdzrGG E /4
exp22exp,)(2
1
2
ηηγη
r (5.7)
KBTkq B
πη
8
20= . (5.8)
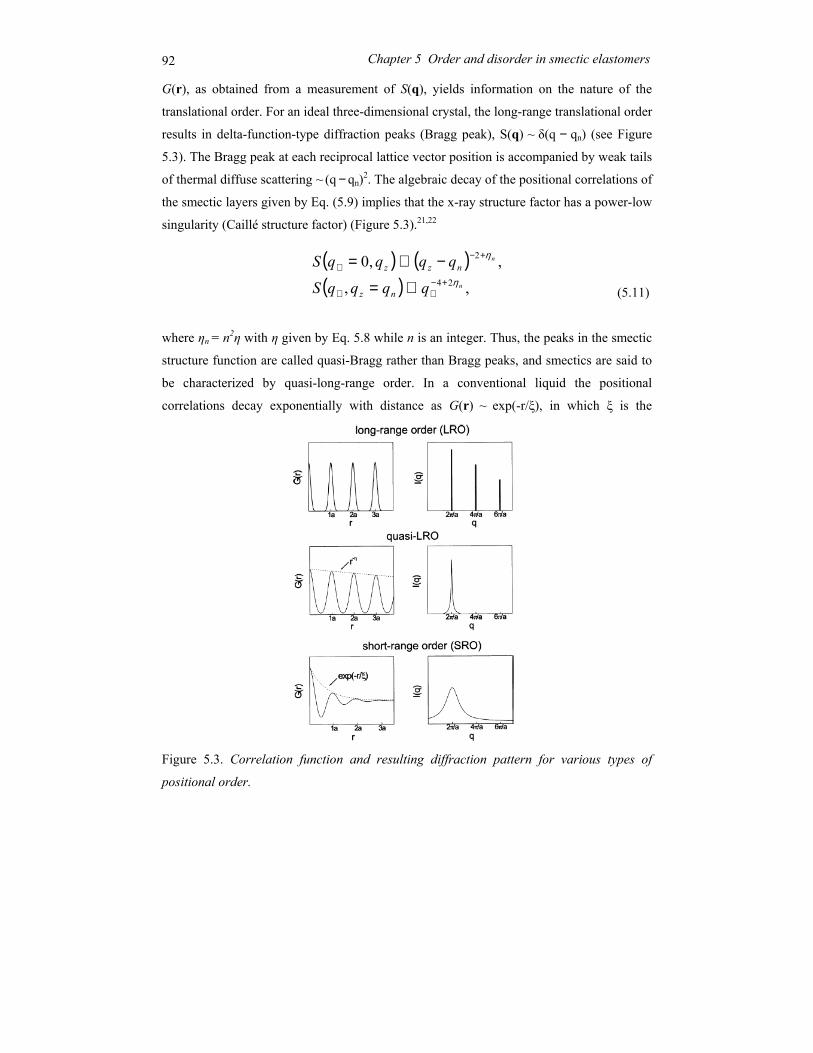
92 Chapter 5 Order and disorder in smectic elastomers
G(r), as obtained from a measurement of S(q), yields information on the nature of the
translational order. For an ideal three-dimensional crystal, the long-range translational order
results in delta-function-type diffraction peaks (Bragg peak), S(q) ~ δ(q − qn) (see Figure
5.3). The Bragg peak at each reciprocal lattice vector position is accompanied by weak tails
of thermal diffuse scattering ~ (q − qn)2. The algebraic decay of the positional correlations of
the smectic layers given by Eq. (5.9) implies that the x-ray structure factor has a power-low
singularity (Caillé structure factor) (Figure 5.3).21,22
(5.11)
where ηn = n2η with η given by Eq. 5.8 while n is an integer. Thus, the peaks in the smectic
structure function are called quasi-Bragg rather than Bragg peaks, and smectics are said to
be characterized by quasi-long-range order. In a conventional liquid the positional
correlations decay exponentially with distance as G(r) ~ exp(-r/ξ), in which ξ is the
Figure 5.3. Correlation function and resulting diffraction pattern for various types of
positional order.
( ) ( )( ) ,,
,,024
2
n
n
qqqqS
qqqqS
nz
nzzη
η
+−⊥⊥
+−⊥
∝=
−∝=
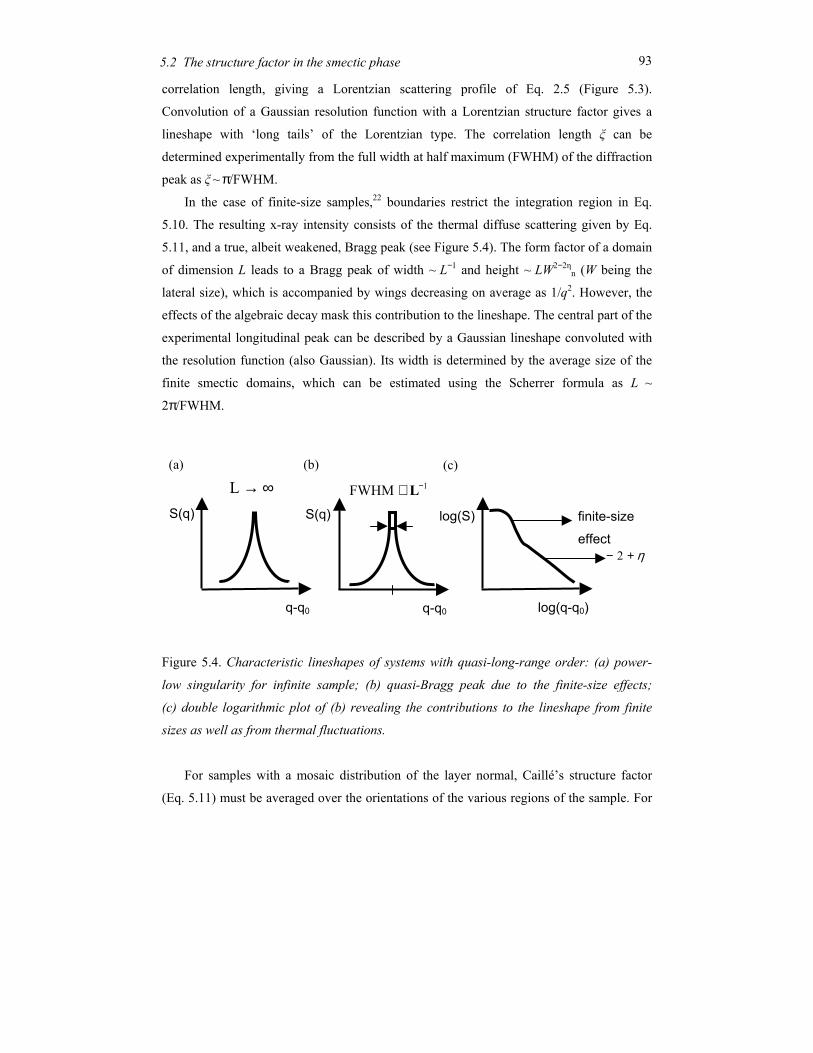
935.2 The structure factor in the smectic phase
correlation length, giving a Lorentzian scattering profile of Eq. 2.5 (Figure 5.3).
Convolution of a Gaussian resolution function with a Lorentzian structure factor gives a
lineshape with ‘long tails’ of the Lorentzian type. The correlation length ξ can be
determined experimentally from the full width at half maximum (FWHM) of the diffraction
peak as ξ ~ π/FWHM.
In the case of finite-size samples,22 boundaries restrict the integration region in Eq.
5.10. The resulting x-ray intensity consists of the thermal diffuse scattering given by Eq.
5.11, and a true, albeit weakened, Bragg peak (see Figure 5.4). The form factor of a domain
of dimension L leads to a Bragg peak of width ~ L−1 and height ~ LW2−2ηn (W being the
lateral size), which is accompanied by wings decreasing on average as 1/q2. However, the
effects of the algebraic decay mask this contribution to the lineshape. The central part of the
experimental longitudinal peak can be described by a Gaussian lineshape convoluted with
the resolution function (also Gaussian). Its width is determined by the average size of the
finite smectic domains, which can be estimated using the Scherrer formula as L ~
2π/FWHM.
Figure 5.4. Characteristic lineshapes of systems with quasi-long-range order: (a) power-
low singularity for infinite sample; (b) quasi-Bragg peak due to the finite-size effects;
(c) double logarithmic plot of (b) revealing the contributions to the lineshape from finite
sizes as well as from thermal fluctuations.
For samples with a mosaic distribution of the layer normal, Caillé’s structure factor
(Eq. 5.11) must be averaged over the orientations of the various regions of the sample. For
log(S) finite-size
effect
log(q-q0)
η+− 2
∞→LS(q)
q-q0
S(q)
q-q0
1FWHM −≅ L
(a) (b) (c)
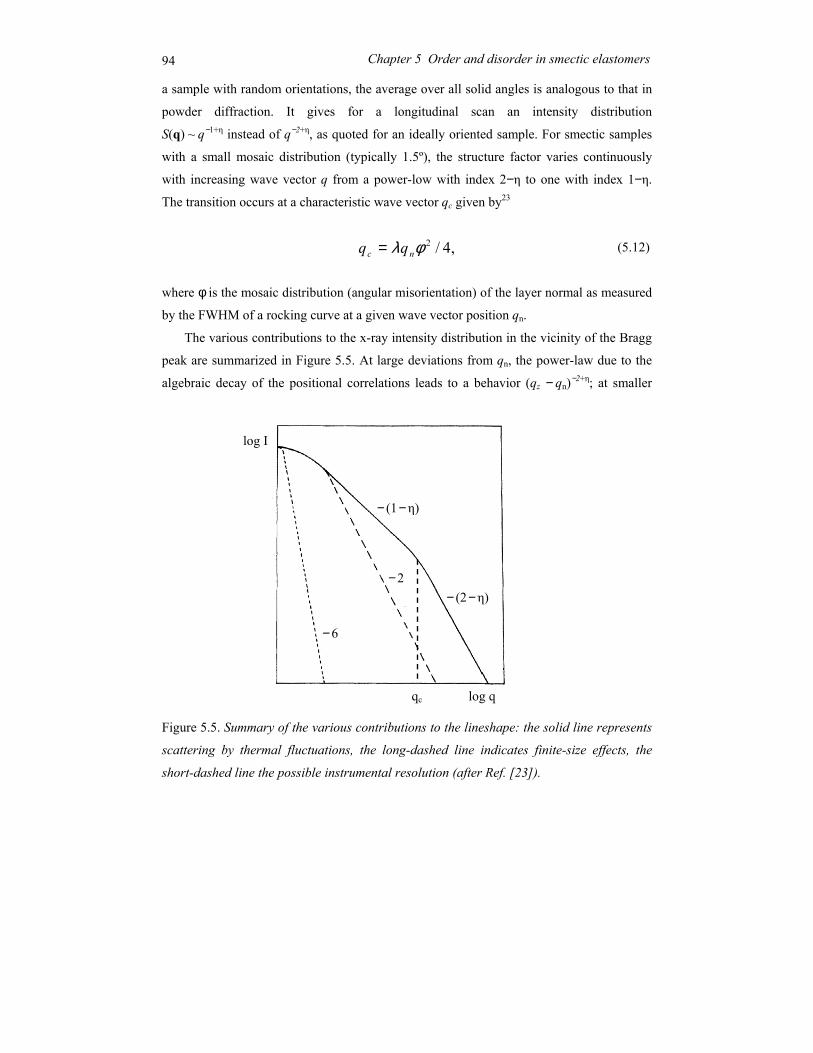
94 Chapter 5 Order and disorder in smectic elastomers
a sample with random orientations, the average over all solid angles is analogous to that in
powder diffraction. It gives for a longitudinal scan an intensity distribution
S(q) ~ q−1+η instead of q−2+η, as quoted for an ideally oriented sample. For smectic samples
with a small mosaic distribution (typically 1.5º), the structure factor varies continuously
with increasing wave vector q from a power-low with index 2−η to one with index 1−η.
The transition occurs at a characteristic wave vector qc given by23
(5.12)
where φ is the mosaic distribution (angular misorientation) of the layer normal as measured
by the FWHM of a rocking curve at a given wave vector position qn.
The various contributions to the x-ray intensity distribution in the vicinity of the Bragg
peak are summarized in Figure 5.5. At large deviations from qn, the power-law due to the
algebraic decay of the positional correlations leads to a behavior (qz − qn)−2+η; at smaller
Figure 5.5. Summary of the various contributions to the lineshape: the solid line represents
scattering by thermal fluctuations, the long-dashed line indicates finite-size effects, the
short-dashed line the possible instrumental resolution (after Ref. [23]).
,4/2φλ nc qq =
− 6
− 2
qc log q
log I
− (2− η)
− (1− η)
955.2 The structure factor in the smectic phase
distances from qn the mosaic effect gradually takes over giving (qz − qn)−1+η; finally the
central part including the FWHM is determined by the finite-size Bragg peak. To obtain
reliable information on the structure factor, a high-resolution x-ray set-up should be used,
capable of measuring length scales on the order of a micrometer. In addition, the tails of the
resolution function should decrease as a function of qz − qn faster than (qz − qn)−2.
5.3 Smectic elastomers
In contrast to conventional smectics, smectic elastomers16-18 have an additional source of
long-wavelength distortions: the elastic deformations determined by the local network
displacements. Hence, the smectic ordering field interacts with the elastomer network
elasticity. On the continuum level, the coupling between the layer fluctuations and the
rubber matrix can be considered as layer pinning by crosslinks, which provides a penalty
for local relative displacements.16-18 This coupling is an addition to the smectic elastic
energy of deformation and to the elastic energy of the anisotropic rubber network as a
whole. As a result the usual smectic degeneracy with respect to uniform layer rotations (no
resistance to shear) is lost. Though the resulting expression for the free energy as a function
of layer displacements is rather complicated, the essential physics can be seen from the
dispersion law for the phonon modes of the elastomers:18
(5.13)
where B* and C5* are renormalized bulk compression and shear moduli, respectively. The
elastic modes now feature a solidlike elastic energy proportional to an overall squared
power q2. This can lead to reestablishment of true long-range order, even though the
translational order is still one-dimensional, as in a noncrosslinked smectic polymer.6
Accordingly, the resultant x-ray diffraction should show an extended range of Bragg peaks
accompanied by diffuse scattering decaying as (q − qn)2. In contrast to the algebraic decay in
smectics, in this case the exponent η can attain the limit η → 0. As typical values of the
( ) ( ),/22 245
25
22
⊥⊥∗∗⊥ ++
=qqCqCqB
Tkuz
effz
Bq
96 Chapter 5 Order and disorder in smectic elastomers
exponent are quite small (η ≈ 0.1), it is difficult to discriminate between Caillé lineshapes
and thermal diffuse scattering. The best way to distinguish between these two cases is to
consider higher-order diffraction peaks for which the lineshape scales in the case of quasi-
long-range order according to ηn = n2η.
So far, the crosslinks – pinning the layers in a number of points – were assumed not to
alter the smectic density. However, the crosslinks are also expected to disturb the layer
structure itself, which effect will become more important with increasing concentration. A
preferential reduction of the smectic density around a crosslink can be modeled by a local
random field that adjusts the phase of the smectic density wave.17 A full theory of such a
system – still to be developed – might require a correlation function that is a product of two
independent terms describing size and strain effects, respectively. Such possibilities have
been discussed for various defect situations by Krivoglaz.24 This problem is also well
known in metal physics, where this type of decoupling is used to describe strain-induced
lineshape broadening, increasing with q and thus with the order of the reflection.25
5.4 Experimental
Materials. We have studied two types of elastomer, based on smectic-A (Sm-A)
polysiloxanes (Figure 5.6), synthesized in the group of Prof. Heino Finkelmann at the
Makromolecular Institute in Freiburg (Germany), as reported elsewhere.26 The average
degree of polymerization is about 250, with a broad distribution typical of a
polycondensation reaction. Both types of elastomer contain as mesogenic groups benzoic
acid phenylesters (R1; R2), and a bifunctional hydroquinone derivative (R3) as the
crosslinking agent. Type II differs from type I by the presence of a second mesogenic group
(R2). We studied elastomer I for volume fractions of crosslinks x=0 (homopolymer) and
x=0.5, and elastomer II for crosslinks fractions of 0, 0.10, 0.15 and 0.20 in the Sm-A phase
at room temperature. The Sm-A phase was identified by sharp (00n) quasi-Bragg peaks
along the layer normal at a wave vector qn, and a broad liquidlike peak from the in-plane
short-range order (see Figure 5.7).
Aligned elastomer samples (typically 40×10 mm2 and 0.5 mm thick) were obtained by
a two-stage process. During a first crosslinking step, the networks were isotropic while
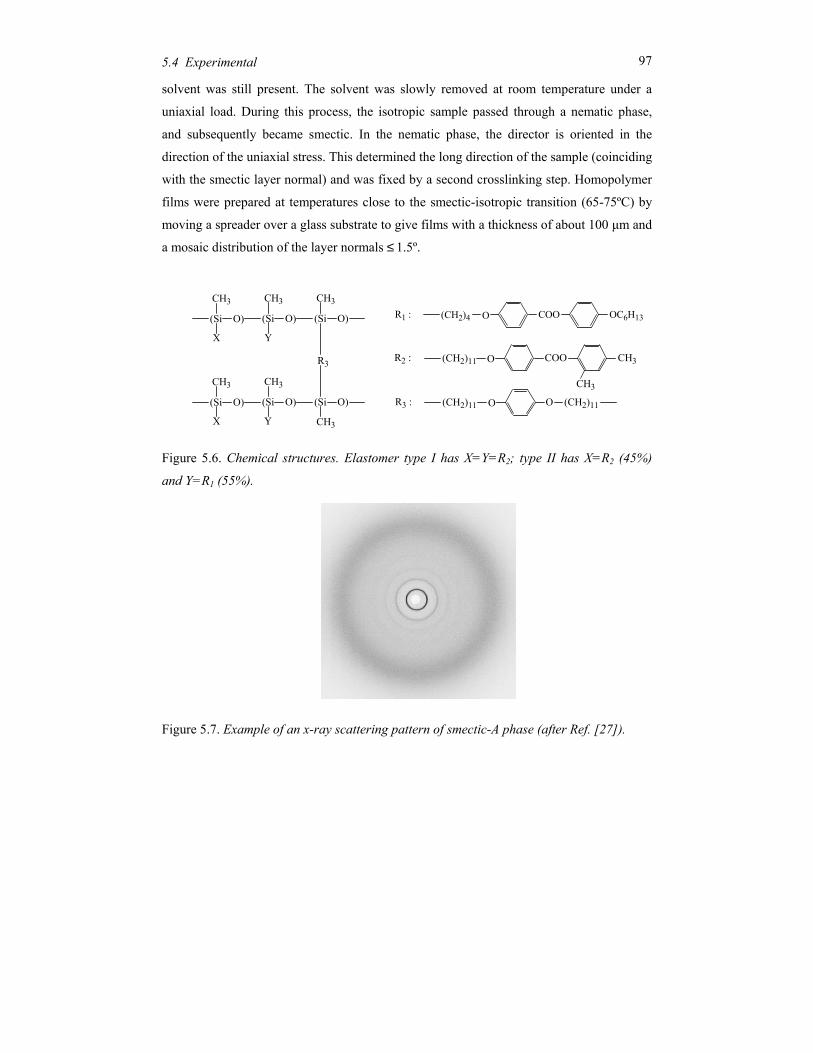
975.4 Experimental
solvent was still present. The solvent was slowly removed at room temperature under a
uniaxial load. During this process, the isotropic sample passed through a nematic phase,
and subsequently became smectic. In the nematic phase, the director is oriented in the
direction of the uniaxial stress. This determined the long direction of the sample (coinciding
with the smectic layer normal) and was fixed by a second crosslinking step. Homopolymer
films were prepared at temperatures close to the smectic-isotropic transition (65-75ºC) by
moving a spreader over a glass substrate to give films with a thickness of about 100 µm and
a mosaic distribution of the layer normals ≤ 1.5º.
Figure 5.6. Chemical structures. Elastomer type I has X=Y=R2; type II has X=R2 (45%)
and Y=R1 (55%).
Figure 5.7. Example of an x-ray scattering pattern of smectic-A phase (after Ref. [27]).
(Si O)
CH3
X
(Si O)
CH3
R3
(Si O)
CH3
Y
(Si O)
CH3
X
(Si O)
CH3
(Si O)
CH3
Y
(CH2)4 O COO OC6H13R1 :
(CH2)11 O COO CH3R2 :
CH3
(CH2)11 O OR3 : (CH2)11
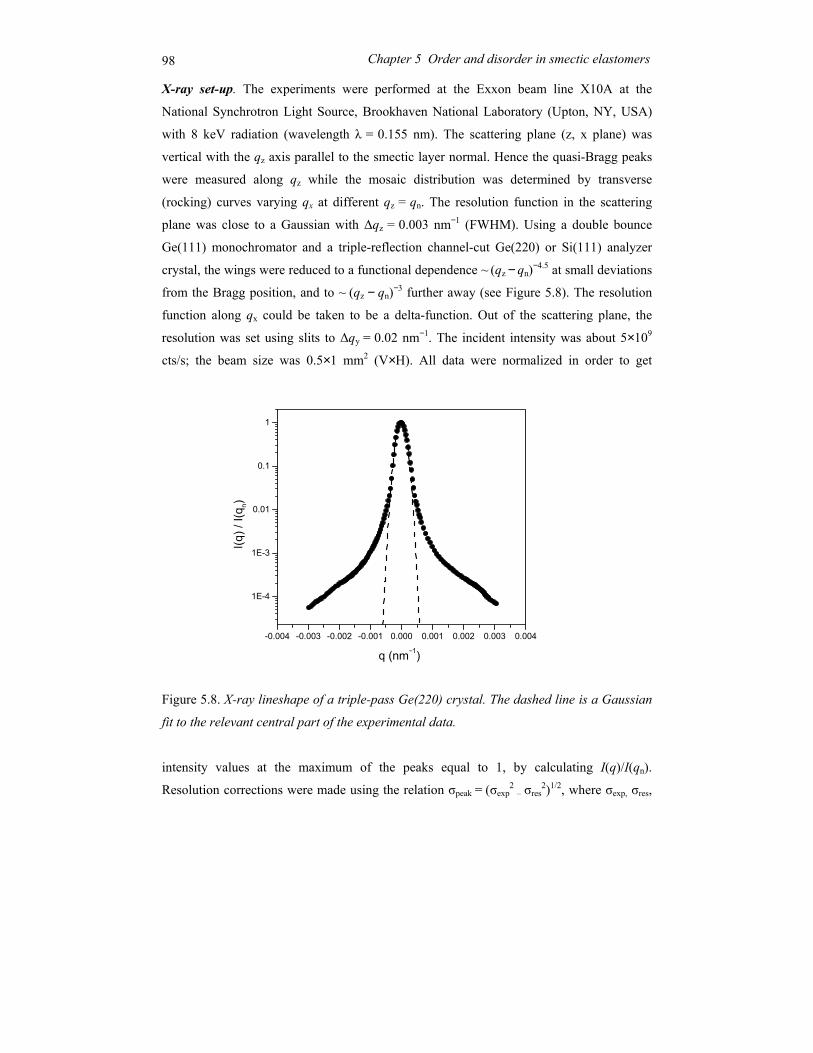
98 Chapter 5 Order and disorder in smectic elastomers
X-ray set-up. The experiments were performed at the Exxon beam line X10A at the
National Synchrotron Light Source, Brookhaven National Laboratory (Upton, NY, USA)
with 8 keV radiation (wavelength λ = 0.155 nm). The scattering plane (z, x plane) was
vertical with the qz axis parallel to the smectic layer normal. Hence the quasi-Bragg peaks
were measured along qz while the mosaic distribution was determined by transverse
(rocking) curves varying qx at different qz = qn. The resolution function in the scattering
plane was close to a Gaussian with ∆qz = 0.003 nm−1 (FWHM). Using a double bounce
Ge(111) monochromator and a triple-reflection channel-cut Ge(220) or Si(111) analyzer
crystal, the wings were reduced to a functional dependence ~ (qz − qn)−4.5 at small deviations
from the Bragg position, and to ~ (qz − qn)−3 further away (see Figure 5.8). The resolution
function along qx could be taken to be a delta-function. Out of the scattering plane, the
resolution was set using slits to ∆qy = 0.02 nm−1. The incident intensity was about 5×10⁹
cts/s; the beam size was 0.5×1 mm2 (V×H). All data were normalized in order to get
Figure 5.8. X-ray lineshape of a triple-pass Ge(220) crystal. The dashed line is a Gaussian
fit to the relevant central part of the experimental data.
intensity values at the maximum of the peaks equal to 1, by calculating I(q)/I(qn).
Resolution corrections were made using the relation σpeak = (σexp2 – σres
2)1/2, where σexp, σres,
-0.004 -0.003 -0.002 -0.001 0.000 0.001 0.002 0.003 0.004
1E-4
1E-3
0.01
0.1
1
I(q) /
I(q n)
q (nm−1)
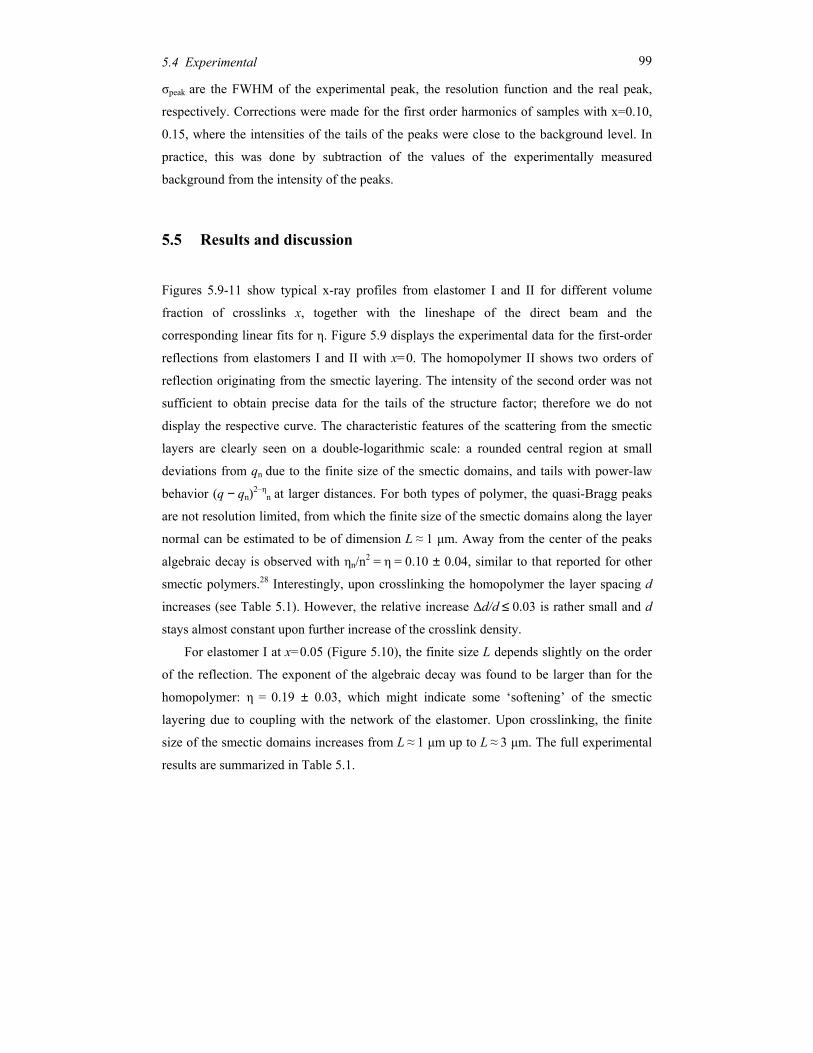
995.4 Experimental
σpeak are the FWHM of the experimental peak, the resolution function and the real peak,
respectively. Corrections were made for the first order harmonics of samples with x=0.10,
0.15, where the intensities of the tails of the peaks were close to the background level. In
practice, this was done by subtraction of the values of the experimentally measured
background from the intensity of the peaks.
5.5 Results and discussion
Figures 5.9-11 show typical x-ray profiles from elastomer I and II for different volume
fraction of crosslinks x, together with the lineshape of the direct beam and the
corresponding linear fits for η. Figure 5.9 displays the experimental data for the first-order
reflections from elastomers I and II with x=0. The homopolymer II shows two orders of
reflection originating from the smectic layering. The intensity of the second order was not
sufficient to obtain precise data for the tails of the structure factor; therefore we do not
display the respective curve. The characteristic features of the scattering from the smectic
layers are clearly seen on a double-logarithmic scale: a rounded central region at small
deviations from qn due to the finite size of the smectic domains, and tails with power-law
behavior (q − qn)2–ηn at larger distances. For both types of polymer, the quasi-Bragg peaks
are not resolution limited, from which the finite size of the smectic domains along the layer
normal can be estimated to be of dimension L ≈ 1 µm. Away from the center of the peaks
algebraic decay is observed with ηn/n2 = η = 0.10 ± 0.04, similar to that reported for other
smectic polymers.28 Interestingly, upon crosslinking the homopolymer the layer spacing d
increases (see Table 5.1). However, the relative increase ∆d/d ≤ 0.03 is rather small and d
stays almost constant upon further increase of the crosslink density.
For elastomer I at x=0.05 (Figure 5.10), the finite size L depends slightly on the order
of the reflection. The exponent of the algebraic decay was found to be larger than for the
homopolymer: η = 0.19 ± 0.03, which might indicate some ‘softening’ of the smectic
layering due to coupling with the network of the elastomer. Upon crosslinking, the finite
size of the smectic domains increases from L ≈ 1 µm up to L ≈ 3 µm. The full experimental
results are summarized in Table 5.1.
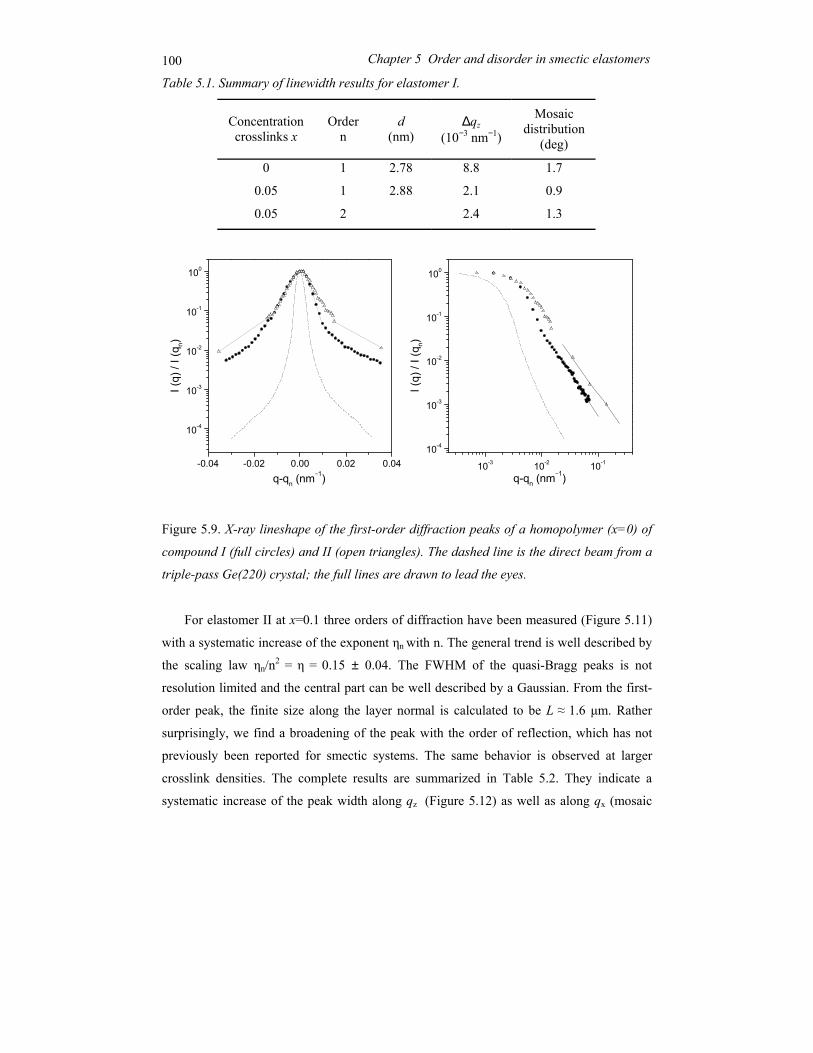
100 Chapter 5 Order and disorder in smectic elastomers
Table 5.1. Summary of linewidth results for elastomer I.
Figure 5.9. X-ray lineshape of the first-order diffraction peaks of a homopolymer (x=0) of
compound I (full circles) and II (open triangles). The dashed line is the direct beam from a
triple-pass Ge(220) crystal; the full lines are drawn to lead the eyes.
For elastomer II at x=0.1 three orders of diffraction have been measured (Figure 5.11)
with a systematic increase of the exponent ηn with n. The general trend is well described by
the scaling law ηn/n2 = η = 0.15 ± 0.04. The FWHM of the quasi-Bragg peaks is not
resolution limited and the central part can be well described by a Gaussian. From the first-
order peak, the finite size along the layer normal is calculated to be L ≈ 1.6 µm. Rather
surprisingly, we find a broadening of the peak with the order of reflection, which has not
previously been reported for smectic systems. The same behavior is observed at larger
crosslink densities. The complete results are summarized in Table 5.2. They indicate a
systematic increase of the peak width along qz (Figure 5.12) as well as along qx (mosaic
Concentration crosslinks x
Order n
d (nm)
∆qz (10−3 nm−1)
Mosaic distribution
(deg)
0 1 2.78 8.8 1.7
0.05 1 2.88 2.1 0.9
0.05 2 2.4 1.3
10-3 10-2 10-1
10-4
10-3
10-2
10-1
100
q-qn (nm−1)
I (q)
/ I (
q n)
-0.04 -0.02 0.00 0.02 0.04
10-4
10-3
10-2
10-1
100
q-qn (nm−1)
I (q)
/ I (
q n)
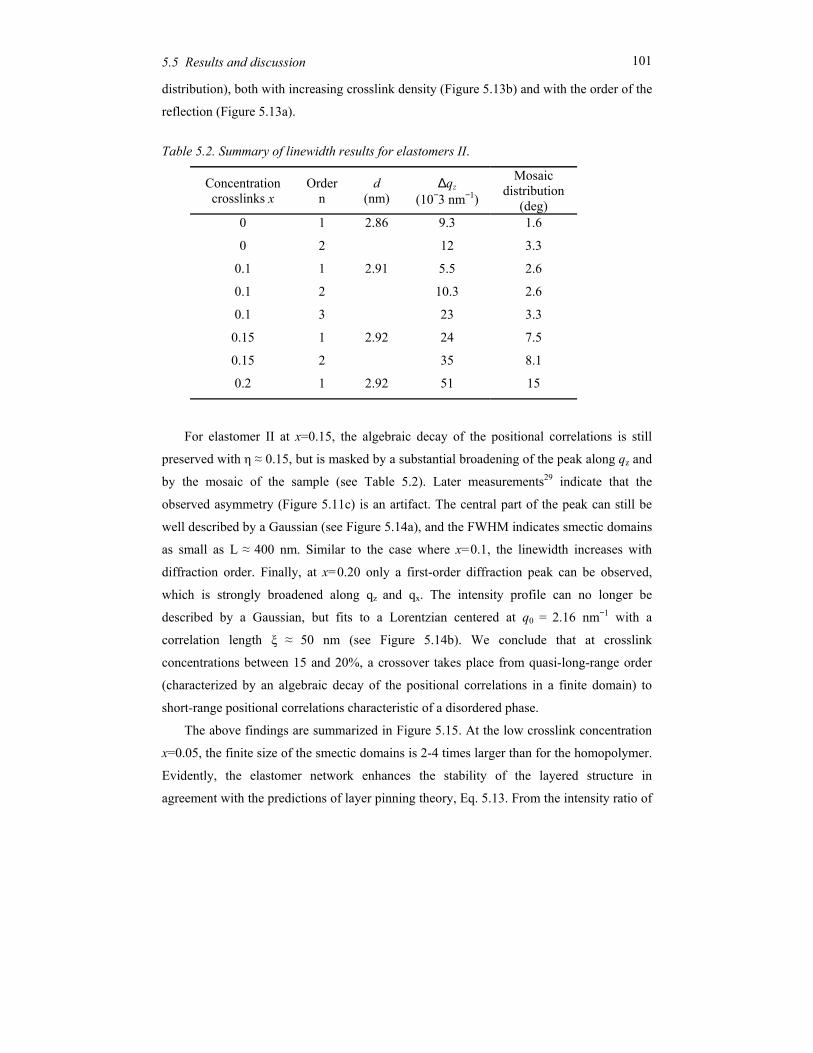
1015.5 Results and discussion
distribution), both with increasing crosslink density (Figure 5.13b) and with the order of the
reflection (Figure 5.13a).
Table 5.2. Summary of linewidth results for elastomers II.
Concentration crosslinks x
Ordern
d (nm)
∆qz (10−3 nm−1)
Mosaic distribution
(deg) 0 1 2.86 9.3 1.6
0 2 12 3.3
0.1 1 2.91 5.5 2.6
0.1 2 10.3 2.6
0.1 3 23 3.3
0.15 1 2.92 24 7.5
0.15 2 35 8.1
0.2 1 2.92 51 15
For elastomer II at x=0.15, the algebraic decay of the positional correlations is still
preserved with η ≈ 0.15, but is masked by a substantial broadening of the peak along qz and
by the mosaic of the sample (see Table 5.2). Later measurements29 indicate that the
observed asymmetry (Figure 5.11c) is an artifact. The central part of the peak can still be
well described by a Gaussian (see Figure 5.14a), and the FWHM indicates smectic domains
as small as L ≈ 400 nm. Similar to the case where x=0.1, the linewidth increases with
diffraction order. Finally, at x=0.20 only a first-order diffraction peak can be observed,
which is strongly broadened along qz and qx. The intensity profile can no longer be
described by a Gaussian, but fits to a Lorentzian centered at q0 = 2.16 nm−1 with a
correlation length ξ ≈ 50 nm (see Figure 5.14b). We conclude that at crosslink
concentrations between 15 and 20%, a crossover takes place from quasi-long-range order
(characterized by an algebraic decay of the positional correlations in a finite domain) to
short-range positional correlations characteristic of a disordered phase.
The above findings are summarized in Figure 5.15. At the low crosslink concentration
x=0.05, the finite size of the smectic domains is 2-4 times larger than for the homopolymer.
Evidently, the elastomer network enhances the stability of the layered structure in
agreement with the predictions of layer pinning theory, Eq. 5.13. From the intensity ratio of
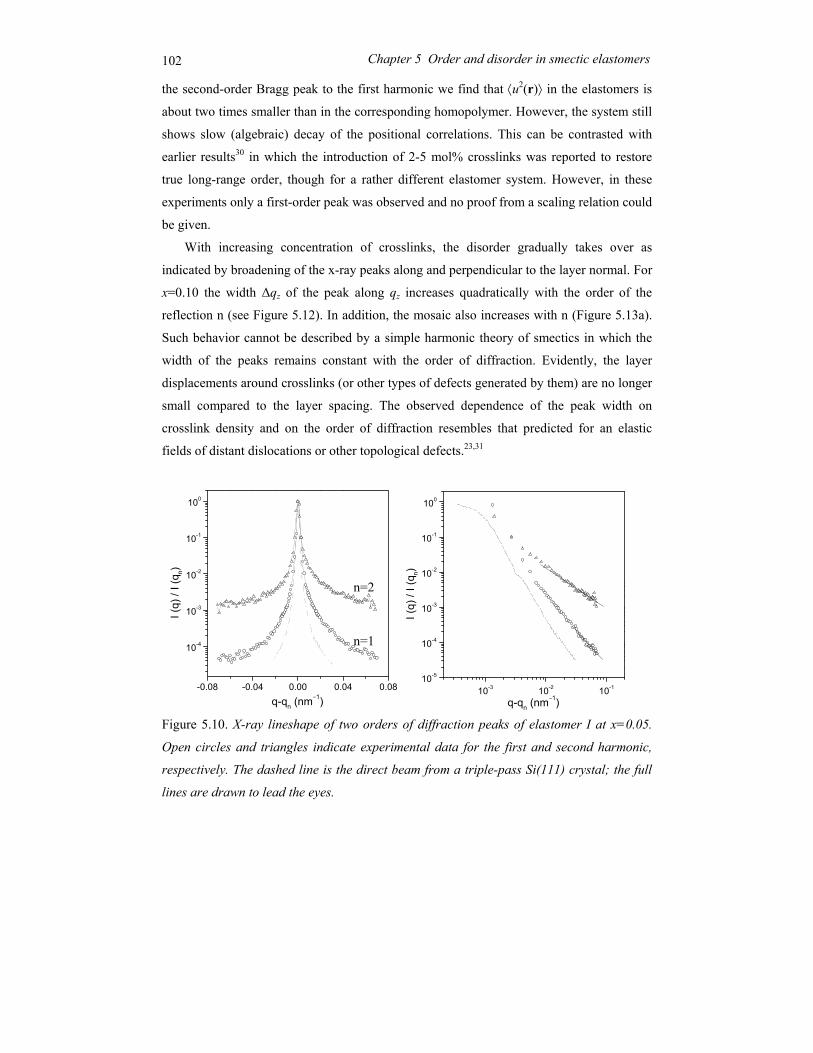
102 Chapter 5 Order and disorder in smectic elastomers
-0.08 -0.04 0.00 0.04 0.08
10-4
10-3
10-2
10-1
100
q-qn (nm−1)
I (q)
/ I (
q n)
10-3 10-2 10-110-5
10-4
10-3
10-2
10-1
100
q-qn (nm−1)
I (q)
/ I (
q n)
n=1
n=2
the second-order Bragg peak to the first harmonic we find that ⟨u2(r)⟩ in the elastomers is
about two times smaller than in the corresponding homopolymer. However, the system still
shows slow (algebraic) decay of the positional correlations. This can be contrasted with
earlier results30 in which the introduction of 2-5 mol% crosslinks was reported to restore
true long-range order, though for a rather different elastomer system. However, in these
experiments only a first-order peak was observed and no proof from a scaling relation could
be given.
With increasing concentration of crosslinks, the disorder gradually takes over as
indicated by broadening of the x-ray peaks along and perpendicular to the layer normal. For
x=0.10 the width ∆qz of the peak along qz increases quadratically with the order of the
reflection n (see Figure 5.12). In addition, the mosaic also increases with n (Figure 5.13a).
Such behavior cannot be described by a simple harmonic theory of smectics in which the
width of the peaks remains constant with the order of diffraction. Evidently, the layer
displacements around crosslinks (or other types of defects generated by them) are no longer
small compared to the layer spacing. The observed dependence of the peak width on
crosslink density and on the order of diffraction resembles that predicted for an elastic
fields of distant dislocations or other topological defects.23,31
Figure 5.10. X-ray lineshape of two orders of diffraction peaks of elastomer I at x=0.05.
Open circles and triangles indicate experimental data for the first and second harmonic,
respectively. The dashed line is the direct beam from a triple-pass Si(111) crystal; the full
lines are drawn to lead the eyes.
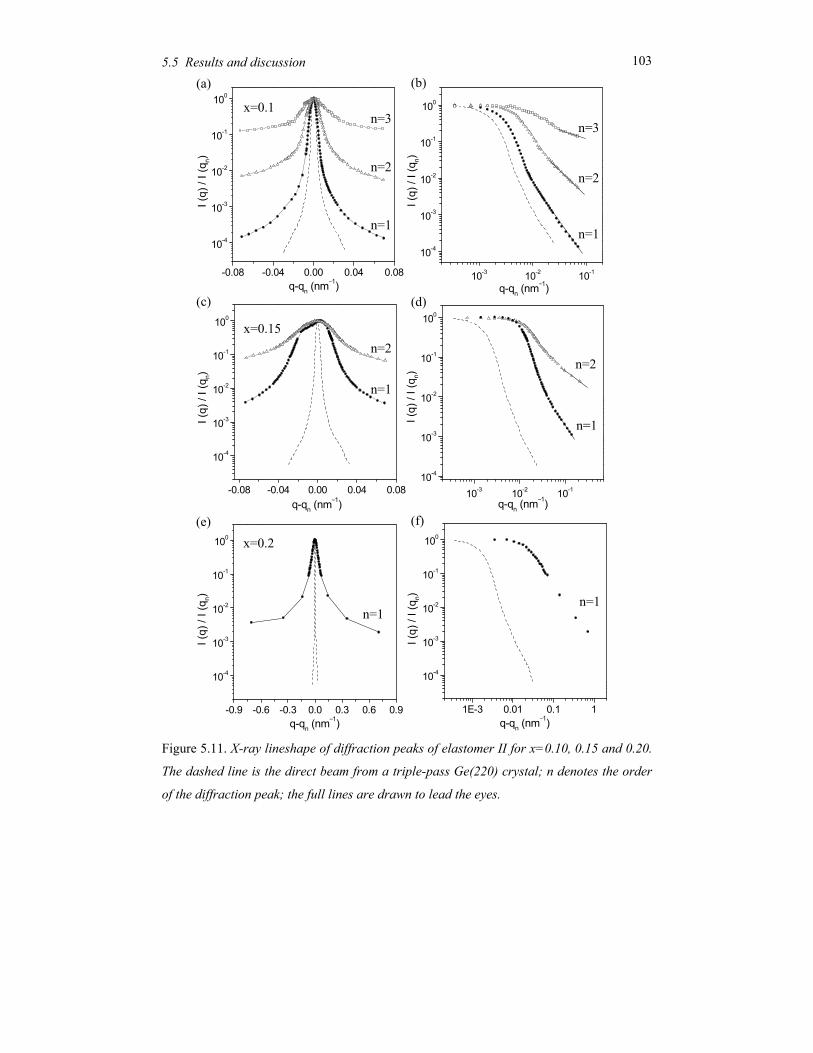
1035.5 Results and discussion
Figure 5.11. X-ray lineshape of diffraction peaks of elastomer II for x=0.10, 0.15 and 0.20.
The dashed line is the direct beam from a triple-pass Ge(220) crystal; n denotes the order
of the diffraction peak; the full lines are drawn to lead the eyes.
-0.08 -0.04 0.00 0.04 0.08
10-4
10-3
10-2
10-1
100
q-qn (nm−1)
I (q)
/ I (
q n)
-0.9 -0.6 -0.3 0.0 0.3 0.6 0.9
10-4
10-3
10-2
10-1
100
q-qn (nm−1)
I (q)
/ I (
q n)
10-3 10-2 10-1
10-4
10-3
10-2
10-1
100
q-qn (nm−1)
I (q)
/ I (
q n)
-0.08 -0.04 0.00 0.04 0.08
10-4
10-3
10-2
10-1
100
q-qn (nm−1)
I (q)
/ I (
q n)
10-3 10-2 10-1
10-4
10-3
10-2
10-1
100
q-qn (nm−1)
I (q)
/ I (
q n)
n=1
x=0.2 (e)
(b)
n=1
n=2
n=3
(a)
n=1
n=2
n=3
(d)
n=1
n=2
(c)
n=1
n=2x=0.15
x=0.1
1E-3 0.01 0.1 1
10-4
10-3
10-2
10-1
100
q-qn (nm−1)
I (q)
/ I (
q n)
n=1
(f)
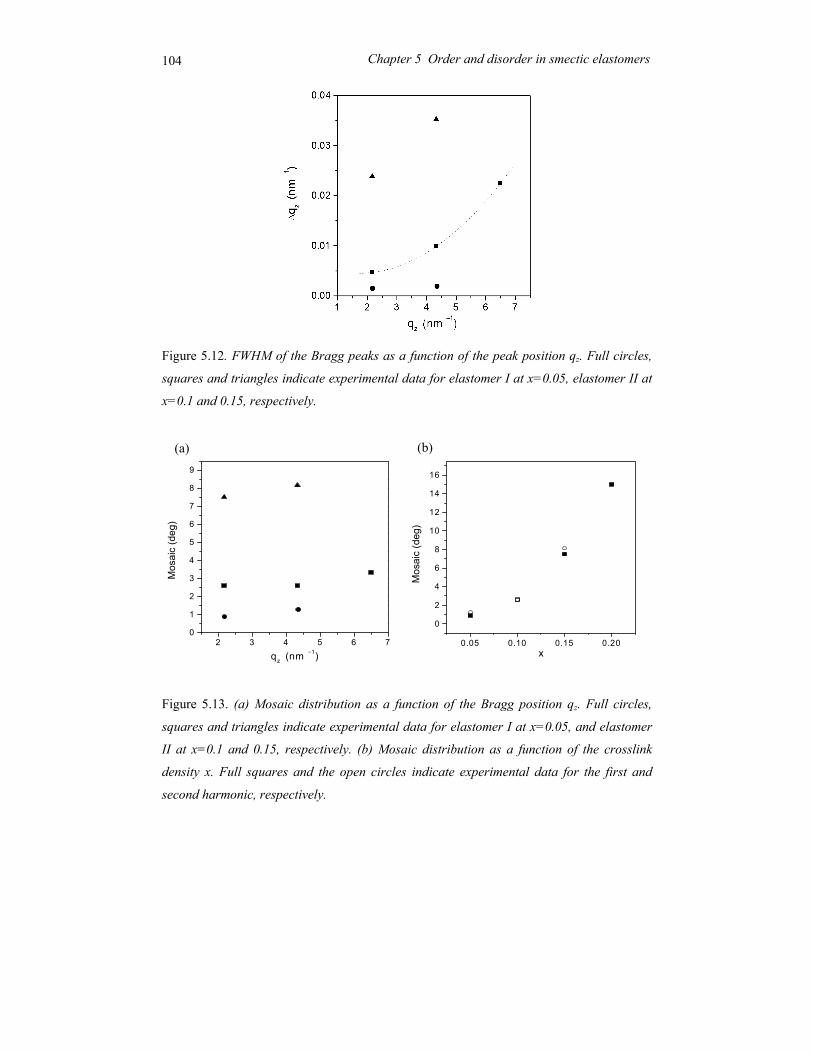
104 Chapter 5 Order and disorder in smectic elastomers
Figure 5.12. FWHM of the Bragg peaks as a function of the peak position qz. Full circles,
squares and triangles indicate experimental data for elastomer I at x=0.05, elastomer II at
x=0.1 and 0.15, respectively.
Figure 5.13. (a) Mosaic distribution as a function of the Bragg position qz. Full circles,
squares and triangles indicate experimental data for elastomer I at x=0.05, and elastomer
II at x=0.1 and 0.15, respectively. (b) Mosaic distribution as a function of the crosslink
density x. Full squares and the open circles indicate experimental data for the first and
second harmonic, respectively.
2 3 4 5 6 70
1
2
3
4
5
6
7
8
9
qz (nm −1)
Mos
aic
(deg
)
0.05 0.10 0.15 0.20
0
2
4
6
8
10
12
14
16
x
Mos
aic
(deg
)
(a) (b)
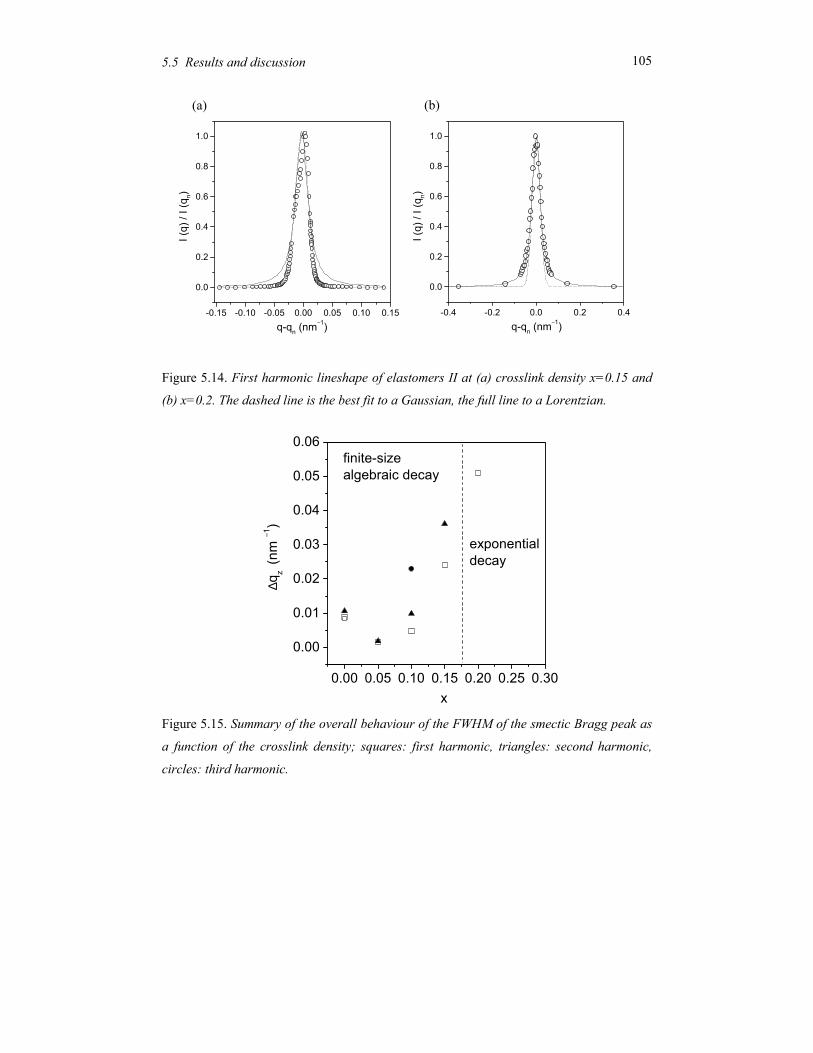
1055.5 Results and discussion
Figure 5.14. First harmonic lineshape of elastomers II at (a) crosslink density x=0.15 and
(b) x=0.2. The dashed line is the best fit to a Gaussian, the full line to a Lorentzian.
Figure 5.15. Summary of the overall behaviour of the FWHM of the smectic Bragg peak as
a function of the crosslink density; squares: first harmonic, triangles: second harmonic,
circles: third harmonic.
-0.15 -0.10 -0.05 0.00 0.05 0.10 0.15
0.0
0.2
0.4
0.6
0.8
1.0
q-qn (nm−1)
I (q)
/ I (
q n)
-0.4 -0.2 0.0 0.2 0.4
0.0
0.2
0.4
0.6
0.8
1.0
q-qn (nm−1)
I (q)
/ I (
q n)
(a) (b)
0.00 0.05 0.10 0.15 0.20 0.25 0.30
0.00
0.01
0.02
0.03
0.04
0.05
0.06
exponentialdecay
finite-sizealgebraic decay
x
∆q
z (n
m −1
)
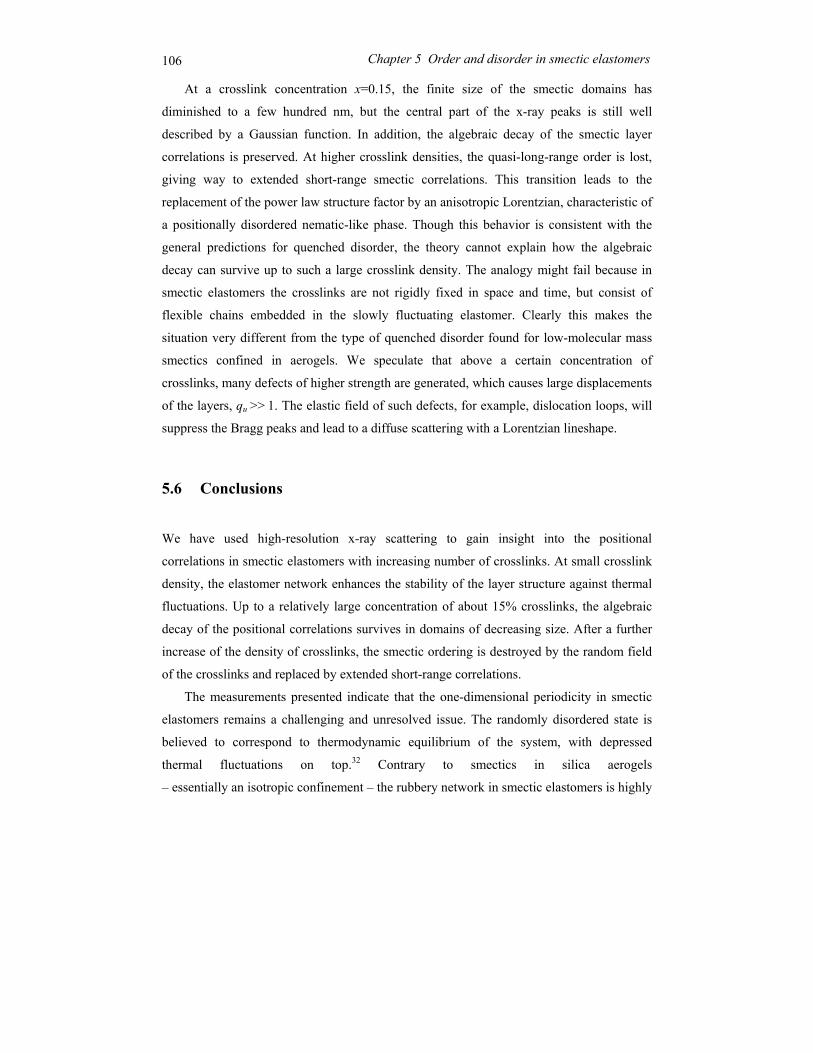
106 Chapter 5 Order and disorder in smectic elastomers
At a crosslink concentration x=0.15, the finite size of the smectic domains has
diminished to a few hundred nm, but the central part of the x-ray peaks is still well
described by a Gaussian function. In addition, the algebraic decay of the smectic layer
correlations is preserved. At higher crosslink densities, the quasi-long-range order is lost,
giving way to extended short-range smectic correlations. This transition leads to the
replacement of the power law structure factor by an anisotropic Lorentzian, characteristic of
a positionally disordered nematic-like phase. Though this behavior is consistent with the
general predictions for quenched disorder, the theory cannot explain how the algebraic
decay can survive up to such a large crosslink density. The analogy might fail because in
smectic elastomers the crosslinks are not rigidly fixed in space and time, but consist of
flexible chains embedded in the slowly fluctuating elastomer. Clearly this makes the
situation very different from the type of quenched disorder found for low-molecular mass
smectics confined in aerogels. We speculate that above a certain concentration of
crosslinks, many defects of higher strength are generated, which causes large displacements
of the layers, qu >> 1. The elastic field of such defects, for example, dislocation loops, will
suppress the Bragg peaks and lead to a diffuse scattering with a Lorentzian lineshape.
5.6 Conclusions
We have used high-resolution x-ray scattering to gain insight into the positional
correlations in smectic elastomers with increasing number of crosslinks. At small crosslink
density, the elastomer network enhances the stability of the layer structure against thermal
fluctuations. Up to a relatively large concentration of about 15% crosslinks, the algebraic
decay of the positional correlations survives in domains of decreasing size. After a further
increase of the density of crosslinks, the smectic ordering is destroyed by the random field
of the crosslinks and replaced by extended short-range correlations.
The measurements presented indicate that the one-dimensional periodicity in smectic
elastomers remains a challenging and unresolved issue. The randomly disordered state is
believed to correspond to thermodynamic equilibrium of the system, with depressed
thermal fluctuations on top.32 Contrary to smectics in silica aerogels
– essentially an isotropic confinement – the rubbery network in smectic elastomers is highly
1075.6 Conclusions
anisotropic. Crosllinking in the nematic phase under uniaxial stress produced the well-
aligned, optically transparent samples studied. Alternatively, random disorder could be
introduced through crosslinking in the isotropic phase, leading to a highly non-uniform
smectic state. Also the nature (rigidity, length) of the crosslinker is expected to play a role.
It remains to be investigated if and how these differences affect the positional correlations
in the system and the lengths scales involved.
108 Chapter 5 Order and disorder in smectic elastomers
References
[1] Chaikin, P. M., Lubensky, T. C., Principles of Condensed Matter Physics
(Cambridge University Press), 1995.
[2] De Gennes, P. G., Prost, J., The Physics of Liquide Crystals (Oxford Science
Publications), 1993.
[3] de Jeu, W. H., Ostrovskii, B. I., Shalaginov, A. N., Rev. Mod. Phys. 75, 181, 2003.
[4] Als-Nielsen, J., Litster, J. D., Birgeneau, R. J., Kaplan, M., Safinya, C. R.,
Lindegaard-Andersen, A., Mathiesen, S., Phys. Rev. B 22, 312, 1980.
[5] Safinya, C. R., D. Roux, G. S. Smith, S. K. Sinha, P. Dimon, N. A. Clark, A. M.
Belloq, Phys. Rev. Lett. 57, 2718, 1986.
[6] M. Warner and E. M. Terentjev, Liquid Crystal Elastomers (Clarendon Press,
Oxford), 2003.
[7] Bellini, T., Radzihovsky, L., Toner, J., Clark, N., Science 294, 1074, 2001.
[8] Park, S., Leheny, R. L., Birgeneau, R. J., Gallani, J. L., Garland, C. W.,
Iannacchione, G. S., Phys. Rev. E 65, 050703, 2002.
[9] Leheny, R. L., Park, S., Birgeneau, R. J., Gallani, J. L., Garland, C. W.,
Iannacchione, G. S., Phys. Rev. E 67, 011708, 2003.
[10] Kutnjak, Z., Kralj, S., Lahajnar, G., Zumer, S., Phys. Rev. E 68, 021705, 2003.
[11] Blatter, G., Feigelman, M., Geshenbain, V., Larkin, A., Vinokur, V., Rev. Mod.
Phys. 66,1125, 1994.
[12] Larkin, A. I., Sov. Phys. JETP 31, 784, 1970; Giamarchi, T., LeDoussal, P., Phys.
Rev. B 52, 1242, 1995.
[13] Radzihovsky, L., Toner, J., Phys. Rev. Lett. 79, 4214, 1997; Radzihovsky, L., Toner,
J., Phys. Rev. Lett. B 60, 206, 1999.
[14] N.A. Clark, T. Bellini, R.M. Malzbender, B.N. Thomas, A.G. Rappaport, C. Muzny,
D.W. Schaefer, L. Hrubesh, Phys. Rev. Lett. 71, 3505, 1993.
[15] Landau, L. D., Lifschitz, E. M., Pitaevskii, L. P., Statistical Physics (Pergamon, New
York), 1980.
[16] Terentjev, E. M., Warner, M., Lubensky, T. C., Europhys. Lett. 30, 343, 1995.
[17] Olmsted, P. D., Terentjev, E. M., Phys. Rev. E 53, 2444, 1996.
[18] Osborne, M. J., Terentjev, E. M., Phys. Rev. E 62, 5101, 2000.
References
109
[19] Landau, L. D., Phys. Z. Sowjet 11, 545, 1937.
[20] Peierls, R. E., Helv. Phys. Acta 7 supplement II, 81, 1934.
[21] Caillé, A., C. R., Acad. Sci. Paris B 274, 891, 1972.
[22] Gunther, L., Imry, Y., Lajzerowicz, J., Phys. Rev. A 22, 1733, 1980.
[23] Kaganer, V. M., Ostrovskii, B. I., de Jeu, W. H., Phys. Rev. A 44, 8158, 1991.
[24] Krivoglaz, M., X-ray and Neutron Diffraction in Non-ideal Crystals (Springer,
Berlin), 1996.
[25] Ungar, T., Borbely, A., Appl. Phys. Lett. 69, 3173, 1996.
[26] Nishikawa, E., Finkelmann, H., Macromol. Chem. Phys. 198, 2531, 1997.
[27] Nishikawa, E., Finkelmann, H., Macromol. Rapid Commun. 19, 181, 1998.
[28] Nachaliel, E., Keller, E. N., Davidov, D., Boeffel, C., Phys. Rev. A 43, 2897,1991.
[29] Muresan, A. and de Jeu, W.H. (unpublished results).
[30] Wong, G., de Jeu, W. H, Shao, H., Liang, K., Zentel, R., Nature 3899, 576, 1997.
[31] Kaganer, V. M., Sov. Phys. Crystallogr. 34, 327, 1989.
[32] Terentjev, E. M., Macromol. Symp. 117, 79, 1997.


111
Chapter 6 Concluding remarks and outlook
112 Chapter 6 Concluding remarks and outlook
The self-assembling materials investigated in this thesis are interesting both from a
scientific and technological perspective. As model systems they bring together fundamental
phenomena such as strive for orientational and positional order, and self-assembly, phase
transitions, and frustration of the order by internal and external constraints. This allowed us
to study the interplay of these aspects and to search for means to control the ordering. On
the other hand the diversity in systems is also considerable and in the course of time
objectives have changed to some extent. Nevertheless, for all soft condensed systems
described, x-ray methods – applied in nonstandard and non-trivial ways – allowed us to
(partially) resolve the phase morphology and the nature of positional order.
The work on semicrystalline-amorphous poly(butadiene-b-ethyleneoxide) diblock
copolymers was initially concerned with studying confined crystallisation. The idea that in
such systems equilibrium chain folding can be achieved should provide a handle on the
crystallisation process itself. To some extend this has been proven to be indeed the case.
The chain folding observed in lamellar films with a (half-)integer number of stems is
remarkable in its consequence of a counterintuitive anisotropic expansion. The theoretical
meaning and the differences with the bulk behaviour are still not completely understood. In
terms of confinement, a film on a substrate gives limited possibilities compared to a film
between two hard surfaces. This applies to homopolymers, but especially to block
copolymers in which also the block ordering would be constrained. We have extensively
investigated this possibility at Hasylab (Hamburg) in cooperation with Dr. Oliver Seeck. To
observe Kiessig fringes from two parallel Si wafers limiting a polymer film of B3700E4300
requires ultimate control of their parallelism. Unfortunately the method of ‘self-settlement’
was not reproducible. Hence no report of these experiments is included in this thesis.
Alternatively some questions about the phase behaviour of asymmetric poly(butadiene-b-
ethyleneoxide) have been investigated. In particular the establishment of non-lamellar
structures for the bulk B3700E2900 clarified discrepancies in the literature about the origin of
the vertical lamellae appearing in thin films.
The semifluorinated alkanes F(CF2)n(CH2)mH have a possible practical importance for
applications as repellent systems. Much work is being devoted to fluorinated systems
attempting to retain these properties using as little fluorine as possible incorporated. In
comparison with the available literature and the complex behaviour as a function of the
length (n, m) of the respective chains, our work on F14H20 has been modest. However, the
113 Chapter 6 Concluding remarks and outlook
discovery in the group of Prof. Martin Moeller (Aachen) of ‘ribbons’ and ‘spirals’ in thin
films and the transition between them is remarkable. We have contributed to the
understanding by establishing that the close-packed tilted structure gives an easy direction,
which allows the system to accommodate the shape mismatch between the fluorinated and
hydrogenated parts. Though no full explanation of the spiralling could be given, this has
brought a much-needed new element into the discussion.
Finally influencing the ordering in smectic elastomers by crosslinking constitutes a
somewhat different topic of more fundamental nature. It can be placed in the much broader
framework of the physics of (dis)ordering by random fields. Over the last years
considerable progress has been made in the group of Prof. Heino Finkelmann (Freiburg)
regarding the preparation of ordered smectic elastomers. This allowed us to perform for the
first time quantitative measurements of the subtle, partially counteracting, effects of
increased crosslinking on the smectic layering. New theory is required to fully understand
these results. More variations are still possible – like changing the nature of the crosslinker
– which are being pursued at the time of this writing.

115
Summary
This thesis describes a series of experiments on the ordering of self-assembling soft
condensed systems. A variety of the different types of material have been considered. These
include block copolymers, semi-fluorinated alkanes and smectic elastomers, which all
consist of incompatible constituting units that give rise to structural order on mesoscopic
length scales. Possible control over the self-assembly can be achieved by varying either
external conditions (bulk, thin films) or molecular parameters. Various
x-ray methods have been applied to probe both bulk structures (small- and wide-angle
x-ray scattering) and surface ordering (x-ray reflectivity and grazing-incidence x-ray
diffraction). In appropriate cases the results were complemented with direct images from
atomic force microscopy and optical microscopy.
Semicrystalline-amorphous block copolymers are central to this work. They provide
unique opportunities to examine the interplay of various types of phase transition, resulting
in a rich phase behaviour including molecular ordering over several length scales. We
report on the microphase separation and crystallization in a series of poly(butadiene-b-
ethyleneoxide) diblock copolymers. In these materials the amorphous polybutadiene blocks
provide a rubbery confinement for the crystallization of the polyethyleneoxide blocks. Two
approximately symmetric compounds with lamellar phases have been investigated, both in
bulk and in uniformly oriented thin films. They differ in molecular mass, the order-disorder
transition being within experimental reach for the low-mass compound. A weakly first-
order phase transition occurs at about 110°C accompanied by strong concentration
fluctuations above this temperature.
Upon crystallization of the polyethyleneoxide block in bulk, the long period of the
crystalline lamellae varies continuously with the crystallisation temperature (degree of
supercooling). In thin films the lamellar period increases upon crystallisation in spite of the
decreasing volume (increasing density) of polyethyleneoxide. The crystalline sublayers
adjust to discrete values corresponding to an integer or half-integer number of folded stems.
The difference with the bulk behaviour has been tentatively attributed to the two-
dimensional crystallization process in thin films, which causes the lateral sliding to become
important.
116 Summary
Upon crystallisation in the bulk of an asymmetric poly(butadiene-b-ethyleneoxide)
diblock copolymer with hexagonal cylinder morphology, a conflict arises between the
crystallisation in lamellae and the microphase separated structure. The resulting coupling
leads to a perforated lamellar phase. In thin films the situation is more complex due to
wetting layers of polybutadiene and polyethyleneoxide that develop at the top and bottom
interface, respectively. These layers force the cylinders in the interior of the film to orient
parallel to the substrate. Because of this hybrid structure, the final result after crystallization
in thin films varies with history and the associated kinetic pathways.
In the next system, semifluorinated alkanes F(CF2)14(CH2)20H, the antagonistic nature
of the two building units and the mismatch in their cross section results in distinct
superstructure formation. We have performed an x-ray analysis of self-assembled
monolayers of F14H20 in the form ‘ribbons’ or ‘spirals’. Analysis of the x-ray reflectivity
puts the hydrogenated part of the molecules near the surface. The films have a uniform
thickness that is consistent with a monolayer with a tilt angle of 127° at the linkage between
the fluorocarbon and the hydrocarbon segments. Geometrical considerations indicate that a
tilt of 122° allows closed packing of all-trans planar alkyl segment in one direction. This
results in an ‘easy axis’ that explains qualitatively the ribbon structure. Perpendicular to this
direction the system is highly frustrated leading to a finite width of the ribbons. Grazing
incidence x-ray diffraction indicates that the fluorinated segments indeed orient normal to
the film interfaces as required in such a model.
Finally the algebraically decaying ordering in smectic liquid crystal systems has been
studied. The quasi-long-range correlations are due to thermal fluctuations of the layers that
diverge logarithmically with the size of the sample. The ordering can be influenced by
application of a random field, which was accomplished by crosslinking a smectic liquid-
crystalline polymer to form an elastomer network. The macroscopic rubber elasticity
introduced via such a percolating network interacts with the liquid-crystalline ordering
field. Insight into the positional correlations was obtained by high-resolution analysis of the
lineshape of the x-ray peak from the smectic layering. At a small crosslink density of about
5%, the elastomers network enhances the stability of the layer structure against thermal
fluctuations. At larger concentration up to about 15% crosslinks, the algebraic decay of the
positional correlations survives in domains of decreasing size. For a larger density of
crosslinks the smectic ordering is destroyed by the random field of the crosslinks and

117 Summary
replaced by extended short-range correlations. Present theory of disordering by a random
field does not account for this behaviour.

119
Samenvatting
Dit proefschrift beschrijft een reeks experimenten met betrekking tot de zelforganisatie van
zachte gecondenseerde systemen. Daarbij komen verschillende soorten materialen aan de
orde, zoals blok copolymeren, gefluorideerde alkanen en smektische elastomeren. Ze
hebben gemeen dat ze opgebouwd zijn uit onderdelen die elkaar slecht verdragen, hetgeen
aanleiding geeft tot struktuurvorming op mesoscopische schaal. Controle over het proces
van zelforganisatie kan verkregen worden door variatie van externe kondities (bulk of
dunne lagen) of van moleculaire parameters. Verschillende röntgen-methoden zijn gebruikt
voor het onderzoek aan bulk strukturen (röntgenverstrooiing bij kleine en grote hoeken) en
aan oppervlakken en dunne lagen lagen (röntgenreflektiviteit en röntgenverstrooiing onder
totale reflektie). In enkele gevallen zijn deze resultaten aangevuld met direkte beelden via
atomaire krachtmicroscopie en optische microscopie.
In de geschetste context nemen blok copolymeren met een half-kristallijn en een amorf
blok een centrale positie in. Ze bieden unieke mogelijkheden om de interakties tussen
verschillende typen fase-overgangen te bestuderen, wat resulteert in een veelvoud van fasen
waarin de moleculen over diverse lengteschalen geordend zijn. Microfasescheiding en
kristallisatie worden behandeld voor een serie diblok co-polymeren van het type
poly(butadieen-b-ethyleenoxide). In deze materialen kristalliseert het polyethyleenoxide in
de rubberachtige omgeving van het amorfe polybutadieen. Twee vergelijkbaar
symmetrische verbindingen, die beiden micorfasescheiding vertonen in een lagenstruktuur,
zijn zowel in bulk als in uniform georiënteerde dunne films onderzocht. Door het verschil
in molekuulgewicht kan voor de laag-molekulaire verbinding de orde-wanorde overgang
experimenteel bereikt worden. Een faseovergang van de eerste orde vindt plaats bij
ongeveer 110°C; boven deze temperatuur treden sterke fluktuaties op in de concentratie van
de twee komponenten.
Bij kristallisatie van polyethyleenoxide in de bulk verandert de dikte van de
kristallijnen lagen op een continue wijze met de kristallisatietemperatuur (de mate van
onderkoeling). In dunne films neemt bij kristallisatie de dikte van de lagen toe, ondanks het
ontstane kleinere volume (grotere dichtheid) van het polyethyleenoxide. De kristallijne
lagen nemen nu echter discrete diktes aan waarin het gevouwen polymeer een geheel aantal
120 Samenvatting
malen past, of de helft daarvan. Het verschil met het continue gedrag in de bulk wordt
toegeschreven aan het tweedimensionale karakter het kristallisatieproces in dunne films
waardoor de laterale diffusie belangrijk wordt.
Bij kristallisatie van een asymmetrisch poly(butadieen-b-ethyleenoxide) blok
copolymeer met een hexagonaal cylindrische morfologie in de bulk, treedt een conflict op
tussen de kristallisatie in lagen en de struktuur van de geordende microfase. De resulterende
interaktie leidt tot een fase met een struktuur van geperforeerde lagen. In dunne films is de
situatie ingewikkelder door het optreden oppervlak-geïnduceerde lagen van polybutadieen
en polyethyleenoxide, respectievelijk aan het luchtoppervlak en aan het substraat. Deze
lagen zorgen ervoor dat de cylinders in het binnenste deel van een film parallel aan het
substraat gaan staan. Door deze hybride struktuur is het eindresultaat na kristallisatie in
dunne films afhankelijk van de voorgeschiedenis en het daardoor bepaalde kinetische
trajekt.
In het tweede systeem, half-gefluorideerde alkanen van het type F(CF2)14(CH2)20H,
ontstaan verschillende superstrukturen door het antagonisme van de twee groepen in
kombinatie met het verschil in hun dwarsdoorsneden. Met behulp van röntgenmethoden
zijn spontaan geordende monolagen van F14H20 op een substraat in de vorm van ‘linten’ of
‘spiralen’ geanalyseerd. De resultaten van röntgenreflektiviteit tonen aan dat de alkylketen
zich aan het substraat bevindt. De strukturen in de films hebben een homogene dikte die
overeenkomt met een monolaag als daarin een hoek van 127° wordt aangenomen bij de
overgang tussen de gefluorideerde en de gealkyleerde segmenten. Geometrische
overwegingen leiden bij een nabij gelegen hoek van 122° tot een dichtste pakking van alkyl
segmenten in één richting. Dit resulteert in een voorkeurrichting die kwalitatief de
langgerekte struktuur van linten verklaart. Loodrecht op deze richting is het systeem
gefrustreerd, wat leidt tot een eindige breedte van de linten. Röntgenverstrooiing onder
totale reflektie toont aan dat de gefluorideerde segmenten loodrecht op her filmoppervkak
staan, zoals vereist in het voorgestelde model.
Als laatste onderdeel is de algebraïsch afnemende ordening in smektisch vloeibare
kristallijne systemen bestudeerd. De daardoor beperkte korrelaties over grote afstanden
worden veroorzaakt door thermische fluktuaties van de lagen, welke logaritmisch toenemen
met de grootte van het preparaat. De manier van ordenen kan beïnvloed worden door
toepassing van een random veld. Dat is gedaan door verknoping van een smektisch
121 Samenvatting
vloeibaar kristallijn polymeer tot een elastomeer. Tussen de zo geïntroduceerde
macroscopische rubber-elasticiteit van het netwerk en het ordende veld van het vloeibaar
kristal treedt koppeling op. Inzicht in de korrelaties tussen de posities van de smektische
lagen is verkregen door analyse van de lijnvorm van de röntgenpiek, waarbij een hoog
oplossend vermogen vereist is. Bij een kleine dichtheid van kruisverbindingen van
ongeveer 5%, versterkt het elastomeer netwerk de stabiliteit van de lagenstruktuur met
betrekking tot thermische fluktuaties. Bij een hogere concentratie kruisverbindingen tot
ongeveer 15% wordt nog steeds een algebraïsche afname van de positiekorrelaties
gevonden, maar over steeds kleinere gebieden. Bij een nog hogere dichtheid van
kruisverbindingen gaat de smektische organisatie verloren en wordt vervangen door
(vloeistfachtige) korrelaties over korte afstanden. De huidige theoriën over wanorde ten
gevolge van een random veld kunnen dit gedrag niet verklaren.

123
Thank you!
Wim H. de Jeu, Boris I. Ostrovskii, M.A.J.Michels (Thijs), Maarten Altelaar, Liam
McDonnell, Rosalind Allen, Omair Ghafur, Paige Shaklee, Ricarda Opitz, Dmytro Byelov,
Tommi Markkula, Irakli Sikharulidze, Igor P. Dolbnya, Adrian Muresan, Ernst Prins, Wim
Barsingerhorn, Anna Tchebotareva, Thea Hoogesteijn, Georgiana Languri, Christian
Buggle, Chinmay Das, Evtim Efremov

125
Curriculum Vitae
Denitza Lambreva was born on March 5, 1976 in Sofia, Bulgaria. In 1998 she obtained a
degree in Chemistry and Physics at the Chemistry Department of University of Sofia. The
topics of her Master research projects were on the new ways of implementation of the
subjects “public waste” and “wave processes” in the Bulgarian educational programs.
Between October 1998 and October 2000 she specialized Chemical Engineering and
worked as a research assistant in the Laboratory of Chemical Physics and Engineering
(Chemistry Department, University of Sofia). The topic of her project was on the
formulation and properties of mixed solid/liquid antifoams. In October 2000 she started
work on a PhD project, investigating the ordering of self-assembling soft condensed
systems, under the supervision of Prof.dr.ir. Wim H. de Jeu in the group “Order/Disorder in
Soft Matter” at the FOM - Institute for Atomic and Molecular Physics (Amsterdam,
Netherlands). The result of this work has been presented in this thesis.


![Chiral smectic-A and smectic-C phases with de Vries ... smectic-A and smectic-C phases with de Vries characteristics. Physical Review E, 95(6), [062704]. DOI: 10.1103/PhysRevE.95.062704](https://img.pdfslide.us/doc/110x75/5b08801c7f8b9a992a8c5b0f/chiral-smectic-a-and-smectic-c-phases-with-de-vries-smectic-a-and-smectic-c.jpg)


![Static and Dynamic Density Functional Theory and ...called copolymers. Here we consider the class of copolymers called \block copolymers" [7] while there are many kinds of copolymers](https://img.pdfslide.us/doc/110x75/5eccfbf97d791301bb64d299/static-and-dynamic-density-functional-theory-and-called-copolymers-here-we.jpg)