Embed Size (px)
Citation preview

Order-dependent structure of highharmonic wavefronts
E. Frumker,1,2,3,∗ G. G. Paulus,3,4 H. Niikura,1,5
A. Naumov,1 D. M. Villeneuve,1 and P. B. Corkum1
1Joint Attosecond Science Laboratory, University of Ottawa and National Research,Council of Canada, 100 Sussex Drive, Ottawa, On, Canada
2Max-Planck-Institut fur Quantenoptik, Hans-Kopfermann-Strasse 1,D-85748 Garching, Germany
3Department of Physics, Texas A&M University, College Station,Texas 77843, USA
4Institute of Optics and Quantum Electronics, Max-Wien-Platz 1,Jena, 07743, Germany
5PRESTO, Japan Science and Technology Agency,5 Sanbancho,Chiyodaku, Tokyo 102-0075, Japan
Abstract: The physics of high harmonics has led to the generation ofattosecond pulses and to trains of attosecond pulses. Measurements thatconfirm the pulse duration are all performed in the far field. All pulseduration measurements tacitly assume that both the beam’s wavefront andintensity profile are independent of frequency. However, if one or bothare frequency dependent, then the retrieved pulse duration depends on thelocation where the measurement is made. We measure that each harmonicis very close to a Gaussian, but we also find that both the intensity profileand the beam wavefront depend significantly on the harmonic order. Thus,our findings mean that the pulse duration will depend on where the pulseis observed. Measurement of spectrally resolved wavefronts along withtemporal characterization at one single point in the beam would enablecomplete space-time reconstruction of attosecond pulses. Future attosecondscience experiments need not be restricted to spatially averaged observables.Our approach paves the way to recovery of the single molecule response tothe strong field.
© 2012 Optical Society of America
OCIS codes: (020.2649) Strong field laser physics; (190.4160) Multiharmonic genera-tion; (120.5050) Phase measurement; (260.1960) Diffraction theory; (260.6048) Soft x-rays;(260.7120) Ultrafast phenomena.
References and links1. M. Bellini, C. Lynga, A. Tozzi, M. B. Gaarde, T. W. Hansch, A. L’Huillier, and C. G. Wahlstrom, “Temporal
coherence of ultrashort high-order harmonic pulses,” Phys. Rev. Lett. 81, 297–300 (1998).2. R. A. Bartels, A. Paul, H. Green, H. C. Kapteyn, M. M. Murnane, S. Backus, I. P. Christov, Y. W. Liu,
D. Attwood, and C. Jacobsen, “Generation of spatially coherent light at extreme ultraviolet wavelengths,” Science297, 376–378 (2002).
3. D. G. Lee, J. J. Park, J. H. Sung, and C. H. Nam, “Wave-front phase measurements of high-order harmonicbeams by use of point-diffraction interferometry,” Opt. Lett. 28, 480–482 (2003).
4. C. Valentin, J. Gautier, J Goddet, C. Hauri, T. Marchenko, E. Papalazarou, G. Rey, S. Sebban, O. Scrick, P.Zeitoun, G. Dovillaire, X. Levecq, S. Bucourt, and M. Fajardo, “High-order harmonic wave fronts generatedwith controlled astigmatic infrared laser,” J. Opt. Soc. Am. B 25, B161–B166 (2008).
#168415 - $15.00 USD Received 11 May 2012; accepted 22 May 2012; published 7 Jun 2012(C) 2012 OSA 18 June 2012 / Vol. 20, No. 13 / OPTICS EXPRESS 13870

5. M. Lewenstein, P. Salieres, and A. L’huillier, “Phase of the atomic polarization in high-order harmonic-generation,” Phys. Rev. A 52, 4747–4754 (1995).
6. M. B. Gaarde, F. Salin, E. Constant, P. Balcou, K. J. Schafer, K. C. Kulander, and A. L’Huillier, “Spatiotemporalseparation of high harmonic radiation into two quantum path components,” Phys. Rev. A 59, 1367–1373 (1999).
7. P. Salieres, A. L’Huillier, and M. Lewenstein, “Coherence control of high-order harmonics,” Phys. Rev. Lett.74, 3776–3779 (1995).
8. E. Frumker, G. G. Paulus, H. Niikura, D. M. Villeneuve, and P. B. Corkum, “Frequency-resolved high-harmonicwavefront characterization,” Opt. Lett. 34, 3026–3028 (2009).
9. D. R. Austin, T. Witting, C. A. Arrell, F. Frank, A. S. Wyatt, J. P. Marangos, J. W. Tisch, and I. A. Walmsley,“Lateral shearing interferometry of high-harmonic wavefronts,” Opt. Lett. 36, 1746–1748 (2011).
10. J. Itatani, J. Levesque, D. Zeidler, H. Niikura, H. Pepin, J. C. Kieffer, P. B. Corkum, and D. M. Villeneuve,“Tomographic imaging of molecular orbitals,” Nature 432, 867–871 (2004).
11. P. M. Paul, E. S. Toma, P. Breger, G. Mullot, F. Auge, P. Balcou, H. G. Muller, and P. Agostini, “Observationof a train of attosecond pulses from high harmonic generation,” Science 292, 1689–1692 (2001).
12. Y. Mairesse and F. Quere, “Frequency-resolved optical gating for complete reconstruction of attosecond bursts,”Phys. Rev. A 71, 011401 (2005).
13. J. W. Goodman, Introduction to Fourier Optics (McGraw-Hill, 2005).14. Y. Mairesse, A. de Bohan, L. J. Frasinski, H. Merdji, L. C. Dinu, P. Monchicourt, P. Breger, M. Kovacev, R.
Taieb, B. Carre, H. G. Muller, P. Agostini, and P. Salieres, “Attosecond synchronization of high-harmonic softx-rays,” Science 302, 1540–1543 (2003).
15. K. T. Kim, C. M. Kim, M. Baik, G. Umesh, and C. H. Nam, “Single sub-50-attosecond pulse generation fromchirp-compensated harmonic radiation using material dispersion,” Phys. Rev. A 69, 051805 (2004).
16. P. B. Corkum, “Plasma perspective on strong-field multiphoton ionization,” Phys. Rev. Lett. 71, 1994–1997(1993).
17. A. T. Le, R. R. Lucchese, S. Tonzani, T. Morishita, and C. D. Lin, “Quantitative rescattering theory forhigh-order harmonic generation from molecules,” Phys. Rev. A 80, 013401 (2009).
18. O. Smirnova, Y. Mairesse, S. Patchkovskii, N. Dudovich, D. M. Villeneuve, P. B. Corkum, and M. Y. Ivanov,“High harmonic interferometry of multi-electron dynamics in molecules,” Nature 460, 972–977 (2009).
19. B. K. McFarland, J. P. Farrell, P. H. Bucksbaum, and M. Guhr, “High harmonic generation from multipleorbitals in N-2,” Science 322, 1232–1235 (2008).
20. W. Li, X. Zhou, R. Lock, S. Patchkovskii, A. Stolow, H. C. Kapteyn, and M. M. Murnane, “Time-resolveddynamics in N2O4 probed using high harmonic generation,” Science 322, 1207–1211 (2008).
21. M. Drescher, M. Hentschel, R. Kienberger, M. Uiberacker, V. Yakovlev, A. Scrinzi, T. Westerwalbesloh,U. Kleineberg, U. Heinzmann, and F. Krausz, “Time-resolved atomic inner-shell spectroscopy,” Nature 419,803–807 (2002).
1. Introduction
High harmonic generation is a highly coherent process in which many photons are convertedinto one, leaving the generating atoms in the nonlinear medium unchanged. High harmonicgeneration is often described with a semiclassical model in which an electron tunnel ionizes,follows a semiclassical trajectory and then recombines by emitting a single photon. In a gasof many atoms a phase matched output results in laser-like coherence of the harmonics, whichhas been confirmed by interfering spectrally resolved replica beams [1] or different spatialregions of the same beam [2]. Several techniques for high-harmonic wavefront measurementswere demonstrated as well [3, 4]. These measurements however, do not address differencesin the amplitude or curvature of wavefronts between harmonics, even though we know thatthe wavefront depends upon the trajectory [5–7]. Such a differences will be important for allattosecond pulse and pulse train applications.
Recently we demonstrated a technique capable of measuring spectrally and spatially resolvedamplitude and phases of high harmonics (or SWORD-Spectral Wavefront Optical Reconstruc-tion by Diffraction) [8]. SWORD is a linear measurement that utilizes direct wavefront recon-struction algorithm (i.e. no iterative computations are required for the reconstruction, eliminat-ing potential ambiguities). Spectrally resolved wavefronts can also be measured by producingtwo sources of harmonics in the generating jet and using lateral shearing interferometry [9].
Our SWORD measurements reveal that the short-trajectory harmonics have an essentiallyGaussian spatial profile and that the root-mean-square deviations from a parabolic wavefront
#168415 - $15.00 USD Received 11 May 2012; accepted 22 May 2012; published 7 Jun 2012(C) 2012 OSA 18 June 2012 / Vol. 20, No. 13 / OPTICS EXPRESS 13871

are only � 0.2 radians. They also reveal that different harmonics have a significantly differentwavefront curvature upon emerging from the generating region. Since we measured both am-plitude and phase of each harmonic, we are able to propagate the fields and determine theirspatial properties anywhere along the direction of propagation. Specifically we determine theirwaist position (position of the flat phase) and size - the virtual origin of the coherent beams. Wefind that this virtual origin of each harmonic is at significantly different position. Particularlyimportant, the distance between the waist positions of some harmonics can be larger than theirrespective Rayleigh ranges. Since the harmonics are generated in the gas jet, this observationmeans that they are produced with different radii-of-curvature, depending on the harmonic or-der. It also means that, if the harmonics are focused to measure their temporal structure, theduration of the pulse will depend on where the measurement is made.
2. Experimental details
In our experiment we measure high harmonics produced by focusing an 800nm, 35fsec, 400μJ,laser beam onto a Nitrogen gas jet. The laser beam from Ti:Sapphire amplifier was spatiallyfiltered by propagating it through hollow-core fiber in vacuum and the beam was then focusedwith an f/#= 80 lens onto the pulsed gas jet. The gas jet in which the harmonics were generatedhas 250μm aperture and was operated with a backing pressure of 2.7atm.
The Rayleigh range of the fundamental beam (ZR � 10mm) was much longer than the in-teraction region of the jet (d � 0.4mm) where harmonics were generated. The intensity of thefundamental beam was kept moderate to prevent excessive ionization and plasma creation. Thisconfiguration is particularly useful when we aim to study single atom/molecular response andhas been widely used in attosecond science [10].
For SWORD [8] a small 20μm wide slit is scanned across the XUV beam. The XUV spec-trometer is built with variable groove spacing flat field Hitachi imaging grating (model 001-0266). The system resolves the spectrum in horizontal direction, and allows essentially free-space field propagation in vertical direction. The harmonic signal was recorded using a 40mmdiameter Burle imaging microchannel plate (MCP) in the imaging plane of the spectrometerand the back-side phosphor screen was imaged onto the cooled CCD camera. Two-dimensionalimages are taken for each position of the scanning slit. Using this diffractogram, we reconstructspectral wavefront phase and amplitudes of each harmonic.
As the fundamental beam size in the interaction region is much smaller than the gas jet size,we can assume a uniform gas density across the beam in the generation region and thereforerotational symmetry of the generated harmonic beam. Figure 1(a) shows examples of the re-construction for harmonics 15 and 21.
The relative vertical position of the diffraction pattern’s centroid is proportional to the wave-front slope of the sampled wavefront slice. We reconstruct the wavefront phase in Fig. 1(a)using the following relation: δ j = δ z · y j−z j
d , where y j - is the relative position of the centroid ofthe diffracted pattern, z j - relative slit position, d - is the distance between the scanning slit andthe imaging plane, δ z - is the scanning slit iteration step, and δ j - is the optical path differenceacross the slit. Then we determine the sampled wavefront phase profile - φ i
Nexp for the har-
monic wavelength - λN across the scanning direction using φ iNexp =
2πλN
∑ij=0 δ j. We determine
the wavefront amplitude Iiexp at each sampling point by integrating intensity of the correspond-
ing diffraction pattern. Further details of SWORD are discussed in Ref. [8].The experimental wavefront phase {φ i
Nexp} sampled at positions {xiexp} was fit with parabolic
function φN(x) = aN(x − x0)2 for each harmonic. The Nonlinear Least Square method was
used for the fit. To minimize the noise contribution, the phase is fit within the range wheremeasured intensity is larger than 5% relative to the peak intensity. The wavefront inten-
#168415 - $15.00 USD Received 11 May 2012; accepted 22 May 2012; published 7 Jun 2012(C) 2012 OSA 18 June 2012 / Vol. 20, No. 13 / OPTICS EXPRESS 13872

sity distribution {Iiexp} measured at the scanning slit was fit to the Gaussian profile I(x) =
I0 exp[−2(x− x0)2/w2
sN ]+ Ib , where I0 is maximum intensity, wsN - Gaussian width at the slitposition, and Ib - background signal. The measured parabola curvature - aN , and the Gaussianwidth - wsN for each harmonic (H13-H25) were used to retrieve the virtual waist position ZN
and waist size w0N . A sensitivity analysis showed that the ZN is highly sensitive to aN and de-pends weakly on wsN (ex.: 10% change in the Gaussian width causes only ∼ 0.1% change inZN). We use the confidence bound of 95% in determination of the error bars for the relativewaist position δZ with respect to the scanning slit as shown in Fig. 2.
We have measured short trajectory harmonics. The divergence of the short trajectories mainlydepends on the position of the jet relative to focal position of the fundamental beam. For all jetpositions we find that the virtual origin of the harmonics differs by more than their confocalparameter across the spectrum.
The intensity distribution that we measure for different harmonics in Fig. 1(a) is Gaussian,within the ∼ 15% error bars caused by fluctuations in the laser power and gas jet density.We extract the Gaussian beam parameters by fitting the measured intensity profile for eachharmonic.
2.6 2.8 3 3.2 3.4 3.6 3.80.1
0.3
0.5
0.7
0.91
Inte
nsity
[a.u
]
0
50
100
150
Phas
e [r
ad.]
H15H21
2.6 2.8 3 3.2 3.4 3.6 3.8−0.6
−0.4
−0.2
0
0.2
0.4
0.6
0.8
Slit Position [mm]
Phas
e er
ror [
rad.
]
H15H21
Slit Position [mm]
(a)
(b)
Fig. 1. (a) Experimentally reconstructed spectral wavefront phase and amplitude at the slitposition for different harmonics. The harmonics H15 (data points plotted as ’x’) and H21(data points plotted as ’�’) are shown in red and blue respectively. The phase data pointsare interpolated by the dashed line, and the measured amplitude data points are showninterpolated by solid line. The background signal arises from stray light. (b) The differencebetween the fitted parabolic phase and the measured phase.
#168415 - $15.00 USD Received 11 May 2012; accepted 22 May 2012; published 7 Jun 2012(C) 2012 OSA 18 June 2012 / Vol. 20, No. 13 / OPTICS EXPRESS 13873
The wavefront phase φN(x,zslit), where zslit is the slit position along the beam propagationand x is the coordinate across the slit, is parabolic for all harmonic orders N (Fig. 1(a)). Becausethe noise in the phase measurements is small, the error bars are not visible on the scale of Fig.1(a). To better estimate the phase error we subtract the fitted parabolic phase from the measuredphase as shown in Fig. 1(b). Across the central part of the beam, containing 95% of the beamenergy, the standard deviation of measured phase from ideal parabolic phase is 0.12rad. (betterthan λ/50) for the 15th harmonic and 0.22rad (better than λ/28) for the 21st harmonic.
13 15 17 19 21 23 254
6
8
10
12
14
16
Harmonic Order Nhhgw 0
N [μ
m]
Z13
δZ
13 15 17 19 21 23 25−10
0
10
20
30
40
Harmonic Order Nhhg
Rel
ativ
e W
aist
Pos
ition
( δZ)
[mm
]
(a) (b)
Fig. 2. (a) Relative waist position (δZ) as a function of harmonic order. The error baris shown within 95% confidence bounds. The insert illustrates that different harmonics“originate” from different positions in space. The meaning of the parameters δZ and Z13 isillustrated in the inset. (b) The beam waist size w0N as a function of harmonic order. Theerror bar is shown within 95% confidence bounds.
Given the amplitude and the phase of the electric field of each harmonic at the scanningslit plane, we propagate the complex electromagnetic field backwards in time. Gaussian beamswith parabolic wavefront phase remain Gaussian as they propagate. They can be characterizedby their beam waist position ZN (relatively to the scanning slit) and their beam waist size w0N.Figure 2(a) shows the reconstructed waist positions as a function of the harmonic order. Thedifferences in the position ZN for different harmonics quantitatively show the different curva-tures for each harmonic. The relative waist position δZ (Fig. 2(a)) varies by more than theirRayleigh range (Z0N) which monotonically decrease from 11.8mm for H13 to 2.7mm for H25
(Z0N =πw2
0NλN
, where λN is the wavelength of Nth harmonic). The corresponding beam (Fig.2(b)) waists vary from 15.2μm for H13 to 5.3μm for H25.
3. Implications
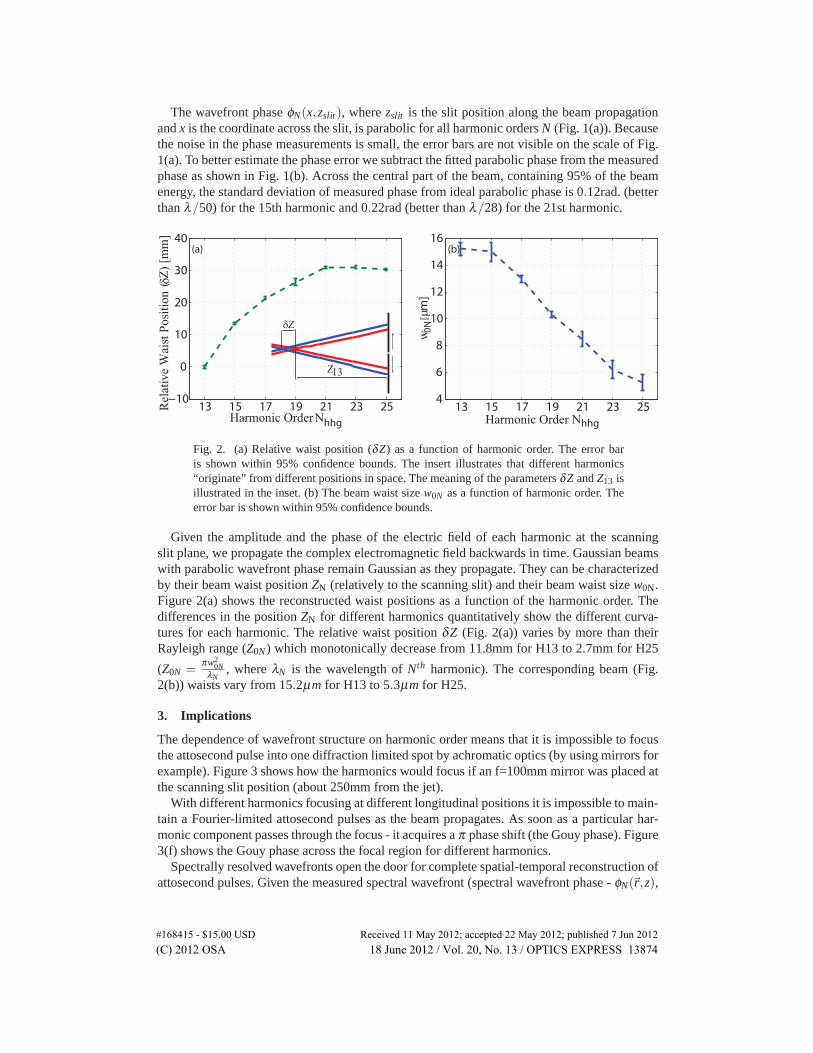
The dependence of wavefront structure on harmonic order means that it is impossible to focusthe attosecond pulse into one diffraction limited spot by achromatic optics (by using mirrors forexample). Figure 3 shows how the harmonics would focus if an f=100mm mirror was placed atthe scanning slit position (about 250mm from the jet).
With different harmonics focusing at different longitudinal positions it is impossible to main-tain a Fourier-limited attosecond pulses as the beam propagates. As soon as a particular har-monic component passes through the focus - it acquires a π phase shift (the Gouy phase). Figure3(f) shows the Gouy phase across the focal region for different harmonics.
Spectrally resolved wavefronts open the door for complete spatial-temporal reconstruction ofattosecond pulses. Given the measured spectral wavefront (spectral wavefront phase - φN(�r,z),
#168415 - $15.00 USD Received 11 May 2012; accepted 22 May 2012; published 7 Jun 2012(C) 2012 OSA 18 June 2012 / Vol. 20, No. 13 / OPTICS EXPRESS 13874
0 0.5 1 1.5 2 2.5−1
−0.5
0
0.5
1
t [fsec]
E [a
rb. u
nits
]
0 0.5 1 1.5 2 2.5−1
−0.5
0
0.5
1
t [fsec]
E [a
rb. u
nits
]
145 155 165 175 185−100
−50
0
50
100
Z [mm]
w(z
) [μ]
145 155 165 175 185−1.5
0
1.5
Z [mm]
Gou
y Ph
ase
[rad
]
0z
−
(a) (b)
(e)
(f )
(c)
(d)
0 0.5 1 1.5 2 2.5−1
−0.5
0
0.5
1
t [fsec]
E [a
rb. u
nits
]
0 0.5 1 1.5 2 2.5−1
−0.5
0
0.5
1
t [fsec]
E [a
rb. u
nits
]
(a) (b)
Fig. 3. Spatial-temporal coupling. Panel (e) shows the selected harmonics near their focalposition assuming a focusing mirror of focal length f=100mm placed a the position ofthe scanning slit. We see that different harmonics focus at different positions and havedifferent divergence. Panel (f) shows the Gouy phase of the same harmonics around thefocus. Assuming transform limited pulse at the center of the focusing mirror (z = 0, R = 0 -panel (d)) we can determine the pulses temporal profile at any position. Panels (a), (b) and(c) show respective pulses at Z = 155mm, R = 0 (panel (a)); Z = 165mm, R = 0 (panel (b))and Z = 0, R = 300μ (panel (c)). In (a)-(d) the field strength is normalized to unity. Red,green and blue colors show the results for 13, 19 and 23 harmonic respectively.
and spectral wavefront amplitude - |E(�r,z,ωN)|, where �r - transverse coordinate across thebeam, z - is the coordinate along the beam propagation) at any plane z = z0 along the beampropagation, it is enough to have temporal information at any single point �r = �r0 across thebeam to determine the temporal structure everywhere.
Since it is sufficient to measure the spectral phase ϕN(�r0,z0) for any (�r0,z0), we could selectthe point, for example, by centering a small aperture on high-harmonic beam and measuring thespectral phase of the transmitted radiation using RABBIT, FROG-CRAB [11, 12] or any othersuitable technique. Then, the complete spatial (3D)+ temporal (1D) field profile of the beamcan be reconstructed -
Ehhg(�r,z, t) = ∑ |E(�r,z,ωN)|exp i[ϕN(�r0,z0)+φN(�r,z)+Nω0t] (1)
where ω0 is the angular frequency of the fundamental beam and the summation is overall emitted harmonic orders. Note, while the spectral wavefronts |E(�r,z,ωN)|exp i[φN(�r,z)] ismeasured across one plane (z= z0), it can be found across any plane along the beam propagation
#168415 - $15.00 USD Received 11 May 2012; accepted 22 May 2012; published 7 Jun 2012(C) 2012 OSA 18 June 2012 / Vol. 20, No. 13 / OPTICS EXPRESS 13875

using Fresnel-Kirchhoff diffraction formula [13] for each harmonic.We apply this principle to our case, when the wavefront structure of each harmonic is taken
from our measurements, but we arbitrary assume that the attosecond pulses within the train aretransform limited at the center of the focusing mirror (Fig. 3(d)) i.e. ϕN = Nω0te, where te isharmonic emission time. As we move along or across the beam, the relative spectral amplitudeand phase of the harmonics changes. Consequently the temporal structure of each attosecondpulse in the pulse train depends on where the pulse is measured. Using the measured spectralwavefronts in our experiment, the temporal profiles is shown for selected points along the beamin Fig. 3(a)–3(c). Even in cases where the atto-chirp [14, 15] has been corrected, it can only becorrected strictly speaking at one point.
There are at least two approaches for bringing the harmonics to a common focus and gener-ating Fourier limited attosecond pulses and pulse trains. (1)The phase of any harmonic dependson both the intensity and the phase of generating beam. Optimizing the spatial profile (bothphases and amplitudes) of the fundamental beam will allow us to minimize the chromatic wave-front variations between different harmonics. (2)The chromatic aberrations that we measure arereproducible. They can, in principle, be corrected with specially designed linear optics.
4. Conclusion
In conclusion, within the signal-to-noise limits of our experiment, we have obtained complete(phase and amplitude) information on wavefront profile of each harmonic. We have shown thatspectrally resolved wavefronts allow the field distribution to be found anywhere. If we knowthe position of the generating medium with sufficient accuracy, this includes the position at thegenerating medium itself. The wave front amplitude and phase in the generating medium isolatean imprint of the underlying single atom or molecule response. This will solve the long standingproblem of intensity and phase focal volume averaging in attosecond science experiments.
Within a 3-step model [16], for a thin, low density gas, the measured wavefront phaseφN(�r,z jet) is given by the sum of four contributions:
φN(�r,z jet) = φt(I(�r,z jet),ωN)−|αN |I(�r,z jet)+φr(ωN ,z jet)+Nφfund(�r,z jet) (2)
Where φfund(�r,z jet) is the wavefront phase of the fundamental beam at the jet position and canbe measured. φr(ωN ,z jet) is the phase contribution of the transition moment [17]. φr(ωN ,z jet)is intensity independent for a single orbital, but intensity dependent for multiple orbitals. Thephase that the electron acquires in the continuum is−|αN |I(�r,z jet). This phase can be calculatedwithin the strong field approximation and its corrections [5, 6]. φt(I(�r,z jet),ωN) is the yet notfully understood tunneling phase [18,19]. It might be intensity dependent. Therefore, wavefrontstructure will serve as a sensitive measurement of the intensity dependence of these parameters.
Once the relative phase of each harmonic is determined and spectrally resolved wavefrontsare measured, then we have shown that we can resolve the temporal profile of an attosecondpulse anywhere in space. No matter what the pulse temporal structure should prove to be,we have already determined that there will be significantly different temporal profile at thecenter and at the edges of a beam and the temporal profile must change as the beam passesthrough the respective foci of the harmonics. Therefore, any spatially extended measurementwith attosecond pulses will be affected and any measurement of the pulse itself is also affected.The result of any experiment will be effectively averaged over the different temporal profiles atdifferent positions in the interaction region of the focal volume.
Finally, attosecond science has been restricted to spatially averaged measurements to im-age orbitals [10], tracing molecular dynamics [20], identify and time resolve tunneling wavepackets [18] and to follow Auger decay [21]. Spectrally resolved wavefronts and the com-plete spatio-temporal characterization of attosecond pulses that they facilitate will allow us
#168415 - $15.00 USD Received 11 May 2012; accepted 22 May 2012; published 7 Jun 2012(C) 2012 OSA 18 June 2012 / Vol. 20, No. 13 / OPTICS EXPRESS 13876

much greater experimental precision in all of these experiments, facilitating access to a singlemolecule response in the strong field.
Acknowledgments
We thank Mike Spanner, Misha Ivanov, Kyung Teac Kim and Eric Constant for stimulating dis-cussions. We acknowledge financial support of Canada’s National Research Council, NationalSciences, Engineering Research Council, the Canada Research Chair Program and MURI grantW911NF-07-1-0475. E.F acknowledges the support of Marie Curie International Outgoing Fel-lowship and H.N acknowledges the support of JST’s Presto program.
#168415 - $15.00 USD Received 11 May 2012; accepted 22 May 2012; published 7 Jun 2012(C) 2012 OSA 18 June 2012 / Vol. 20, No. 13 / OPTICS EXPRESS 13877


![i .] APPROXIMATING HARMONIC FUNCTIONS 499€¦ · APPROXIMATING HARMONIC FUNCTIONS 499 THE APPROXIMATION OF HARMONIC FUNCTIONS BY HARMONIC POLYNOMIALS AND BY HARMONIC RATIONAL FUNCTIONS*](https://img.pdfslide.us/doc/110x75/5f0873ba7e708231d42214c2/i-approximating-harmonic-functions-499-approximating-harmonic-functions-499-the.jpg)