Embed Size (px)
Citation preview

Order and Stochastic Dynamics in Drosophila Planar CellPolarityYoram Burak1,2, Boris I. Shraiman2,3*
1Center for Brain Science, Harvard University, Cambridge, Massachusetts, United States of America, 2 Kavli Institute for Theoretical Physics, University of California, Santa
Barbara, Santa Barbara, California, United States of America, 3Department of Physics, University of California, Santa Barbara, Santa Barbara, California, United States of America
Abstract
Cells in the wing blade of Drosophila melanogaster exhibit an in-plane polarization causing distal orientation of hairs.Establishment of the Planar Cell Polarity (PCP) involves intercellular interactions as well as a global orienting signal. Many ofthe genetic and molecular components underlying this process have been experimentally identified and a recentlyadvanced system-level model has suggested that the observed mutant phenotypes can be understood in terms ofintercellular interactions involving asymmetric localization of membrane bound proteins. Among key open questions inunderstanding the emergence of ordered polarization is the effect of stochasticity and the role of the global orientingsignal. These issues relate closely to our understanding of ferromagnetism in physical systems. Here we pursue this analogyto understand the emergence of PCP order. To this end we develop a semi-phenomenological representation of theunderlying molecular processes and define a ‘‘phase diagram’’ of the model which provides a global view of thedependence of the phenotype on parameters. We show that the dynamics of PCP has two regimes: rapid growth in theamplitude of local polarization followed by a slower process of alignment which progresses from small to large scales. Wediscuss the response of the tissue to various types of orienting signals and show that global PCP order can be achieved witha weak orienting signal provided that it acts during the early phase of the process. Finally we define and discuss some of theexperimental predictions of the model.
Citation: Burak Y, Shraiman BI (2009) Order and Stochastic Dynamics in Drosophila Planar Cell Polarity. PLoS Comput Biol 5(12): e1000628. doi:10.1371/journal.pcbi.1000628
Editor: Anand R. Asthagiri, California Institute of Technology, United States of America
Received June 1, 2009; Accepted November 24, 2009; Published December 24, 2009
Copyright: ! 2009 Burak, Shraiman. This is an open-access article distributed under the terms of the Creative Commons Attribution License, which permitsunrestricted use, distribution, and reproduction in any medium, provided the original author and source are credited.
Funding: This research was supported in part by the National Science Foundation under Grant No. PHY05-51164. The funders had no role in study design, datacollection and analysis, decision to publish, or preparation of the manuscript.
Competing Interests: The authors have declared that no competing interests exist.
* E-mail: [email protected]
Introduction
Epithelia in diverse tissues, in addition to their apico-basalpolarization, acquire a polarization within the two-dimensionallayer of cells – a phenomenon called planar cell polarity (PCP)[1–5]. In the developing wing of Drosophila, PCP determines thegrowth direction of small hairs that extend radially from cellboundaries. In a wild-type wing, where cells are approximatelyhexagonal and form a regular honeycomb lattice, all of these hairspoint to the distal direction.A series of recent experiments show that several key proteins
[6], including the transmembrane proteins Frizzled (Fz) and Van-Gogh (Vang) and the cytosolic proteins Dishevelled (Dsh) andPrickled (Pk), localize asymmetrically on cell boundaries [7–12] -defining a direction in the plane within each cell and forming acharacteristic zig-zag pattern of protein localization on the lattice(Fig. 1A).Other experiments show that local PCP orientation depends on
inter-cellular signaling. First, mutant clones in which fz or Vangactivity is suppressed or amplified, cause characteristic andreproducible inversion of polarity in large patches of cells thatare proximal or distal to the clone [13]. These observations aresummarized in Figs. 1 C,D. Second, in fat mutant clones [14,15]hairs do not all point correctly in the distal direction, yet, theirorientation is strongly correlated between nearby cells and varies
gradually across the tissue creating a characteristic swirlingpattern.Thus the experimental evidence suggests that an interaction
between neighboring cells tends to locally align their polarity[1,3,14]. This local polarity need not point distally unless, inaddition, there is a global orienting signal that picks out the distaldirection throughout the wing (most likely originating with theDpp morphogen gradient which defines the Anterior-Posterioraxis of the wing in the larval stage of development [16]). Yet, asidefrom a clear involvement of protocadherin fat [17,18] themolecular details of this pathway remains for now unknown.The swirling patterns in fat mutants [14] and recent evidence[15,19], suggest that the orienting field is related to the presence ofa ‘‘gradient’’ in the fat, four-jointed, and dachs pathway.These observations evoke an analogy between PCP and the
behavior of ferromagnets, extensively studied in physics and wellunderstood in terms of statistical mechanics of relatively simplemodels [20]. In these models each atomic site is assigned amagnetic dipole – spin – which can assume a different orientation(analogous to the direction of polarization in an epithelial cell).The salient properties of ferromagnets arise from the opposinginfluence of an interaction between neighboring spins, which tendsto co-align their orientation, and the influence of thermalfluctuations, which tend to randomize the spin direction.Ferromagnets typically exhibit two phases of behavior: a high
PLoS Computational Biology | www.ploscompbiol.org 1 December 2009 | Volume 5 | Issue 12 | e1000628

temperature phase, where spins are disordered and a lowtemperature ferromagnetic phase, where the interactions domi-nate over thermal fluctuations – leading to a spontaneous
polarization in an arbitrary direction. In this state even a smallexternal magnetic field has a big effect on magnetic polarization asthe spontaneous polarization aligns itself with the external field,yet the dynamics leading to global alignment can be quite slow.An essential lesson from statistical mechanics is that the ordered
and disordered states exist in a broad class of models and can bediscussed in a general context, focusing on a classification of thedifferent regimes as a function of a few parameters. We follow thislesson by focusing the study on the competition between theintercellular interaction and the disordering influence of thefluctuations introduced by the noisy molecular interactions. As instatistical mechanics we define a phase diagram which identifiesdifferent regimes of behavior in the space of the most relevantparameters. We then address the role of the global directionalsignal in the dynamics of global alignment.A molecular model for PCP formation was recently proposed in
Ref. [21], and was shown to reproduce a number of experimentalfindings. This model involves 38 parameters that were adjusted tosuccessfully reproduce a set of wild-type and mutant phenotypes.Here we pursue an alternative approach and instead of moving onto more and more complex models develop a model with a smallernumber of degrees of freedom and a smaller number of parameters.Instead of fixing a particular set of parameters by fitting the data weexplore the generic behavior of the model as a function ofparameters defining quantitative features characteristic of thedifferent phases. In formulating the model we identify severalessential ingredients, required to obtain the characteristic zig-zagpattern and the non-autonomy of fz and Vang mutant clones. Weexpect our simplified model to capture important properties of PCP,although it does not incorporate all the molecular details.After discussing the essential ingredients of the model, we obtain
a phase diagram describing its steady state properties. We thenconsider the dynamics of local polarization strength andorientation in the absence and in the presence of a globalorienting signal. We show that global alignment can be achievedwith a weak global orienting signal provided it is presentthroughout the tissue at the earliest stage of PCP dynamics.Finally we discuss the experimental predictions coming out of themodel and the tools required to test these predictions.
Results
Model ingredientsThree essential ingredients are included in the model, to
account for the characteristic zig-zag patterns of proteinlocalization and for the non-autonomy of fz and Vang mutantclones.
Two membrane proteins form complexes across theinter-cellular interface. As in Ref. [21] we assume that twomembrane-bound proteins, a and b – standing for Fz and Vang -form complexes across inter-cellular interfaces. This is the sourceof intercellular interaction in the model.Complex formation across cell interfaces accounts in a simple
way for the non-autonomous effect of clones in which either a or bare mutated. However to account for the observed localization ofFz and Vang proteins on the opposite sides of the cell interface theremust be a mechanism which prevents a, b (or Fz and Vang) frommingling with each other on the same side of the interface. Thusthe next two assumptions introduce molecular interactions actinginside each cell, leading to spontaneous segregation of thecomplexes and driving the protein distribution towards a non-uniform state.
Complex formation on a single inter-cellular interface isbistable. We assume that complexes of one polarization (a=b)
Figure 1. Summary of experimental observations. (A) Proteinlocalization pattern in wild-type wing: Fz (green) localizes on the distalmembrane, together with Dsh, while Vang (red) localizes on theproximal membrane, together with Pk. (B) Key PCP proteins localizeapically in the adherens junction area, within a strip of about 1m fromthe top [7,11,12,39]. (C,D) Mutant fz (C) and Vang (D) clones influencethe polarity of wild-type cells bordering the clone such that it pointstowards the clone (fz, C) or away from it (Vang, D). This effect ispropagated to a large patch of wild-type cells that are distal to theclone (fz) or proximal to it (Vang) [40]. Over-expression of fz causes aneffect similar to that of Vang mutant clones, and over-expression ofVang causes an effect similar to fz mutants.doi:10.1371/journal.pcbi.1000628.g001
Author Summary
Epithelial tissues are often polarized in a preferreddirection which determines, for example, the direction ofhair growth on mammalian skin, the orientation of scalesin fish, the alignment of ommatidia in the fly eye and ofsensory hair cells in the vertebrate cochlea. This in-planepolarization, known as planar cell polarity, is one of themorphogenetic fields that play a role in tissue patterningduring development. Here we focus on planar cell polarityin the fly wing, where protein localization and inter-cellularligand-receptor interactions combine with an unknownorienting signal to establish planar cell polarity of the wingepithelium. We demonstrate an analogy between thisprocess and models of ferromagnetism in physical systemsthat have been studied extensively using the tools ofstatistical mechanics. The analogy helps in understandinghow local interactions between cells can lead to globalpolarization order and elucidate the role of globalorienting signals and the dependence of the dynamics ofthe process on parameters. We demonstrate that in theabsence of an external orienting signal swirling patternsshould emerge due to random noise. We propose ways totest this prediction and ways to quantify the magnitudeand spatial variation of the unknown external orientingsignal.
Order and Stochastic Dynamics in Drosophila PCP
PLoS Computational Biology | www.ploscompbiol.org 2 December 2009 | Volume 5 | Issue 12 | e1000628
inhibit formation of complexes of the opposite polarization (b=a),and that this inhibition leads to bistability at the level of a singleinterface between two cells (Fig. 2A). As a simple example,consider the following dynamics of complex binding andunbinding on a single, planar interface (Fig. 2B),
d
dtu1~K(u2; u1)a1b2{K ’u1 !1"
d
dtu2~K(u1; u2)a2b1{K ’u2 !2"
where u1 and u2 represent concentrations of interfacial complexeswith two possible polarizations (respectively a1b2 and a2b1) anda1,2, b1,2 are concentrations of free (unbound) proteins on the twosides of the interface.The positive and negative feedback on complex formation is
represented through the dependence of the rate coefficients K onu1,2 (see Methods). E.g., enhancement of K(u2; u1) in Eq. (1) withincreasing u1 or suppression with increasing u2. If this dependenceis sufficiently non-linear, the dynamics lead to two stable steadystates: one with u1wu2, the other with u1vu2, as illustrated inFig. 2C. Feedback effects could be equally well modeled by anopposite modulation of K ’ and in reality quite likely involvemodulation of both K and K ’. As an example, consider the casewhere there is only negative feedback through the dependence of
K or K ’ on u2. If the free a and b diffuse sufficiently rapidly,a1,2~at{u1,2 and b1,2~bt{u2,1, where at and bt are the totalavailable concentrations of a and b proteins. It is then easy to seethat for bistability K ’ or 1=K must be a convex increasing functionof u2.
Inhibition acts non-locally within each cell. Whilebistability of the complex formation would suffice to explainlocalization of Fz and Vang on the opposite sides of each interfacebetween cells, in order to explain segregation of Fz and Vang tothe opposite sides of each cell we assume that the mutual inhibitionof u1 and u2 complexes acts non-locally within a cell. Henceinstead of making K in Eqs. (1–2) be a local function of u1 and u2we assume that K is a function of c#, the concentration of amessenger molecule which is itself a non-local function of the u1and u2 distribution over the surface of a given cell. The messengermolecule thus mediates an interaction between u1 and u2complexes, i.e., c# diffuses within each cell creating an effectiverepulsion between u1 and u2 complexes on adjacent interfaces.The non-local repulsion will for a broad range of parameters resultin a dipole-like distribution of a and b (and hence of the u1 and u2complexes) over the surface of each cell.A plausible and quite general mechanism for generating such a
non-local inhibitory signal involves the modification of a diffusibleprotein, as illustrated in Figs. 2 D,E where we denote theunmodified and modified protein by c and c#, respectively. Therate of modification c?c# at a given point on the membranedepends on the local density of u2 complexes and information istransmitted within the cell by diffusion of the modified protein.Many variations on this general theme are possible and arediscussed in detail in the supporting analysis (Text S1, Part I).Below we follow the scheme shown in Fig. 2E, where themembrane-bound protein a serves the role of the messengerprotein c. Modification of a corresponds to the binding of acytoplasmic protein, and this process is inhibited by u2 complexes.The fraction x of unmodified proteins then obeys the equation
{+2zk2! "
x(r)~k2au2(r) 1{x(r)$ % !3"
where r is the location on the membrane. The parameters k2 anda, related to the rate constants for modification of a are discussedin the supporting analysis (Text S1, part I). Note that increase of u2increases x and that the influence of u2 is non-local, with a
characteristic range set by k{1. Finally, we assume that onlymodified a proteins can form complexes, hence the rate coefficientK is proportional to 1{x (Eq. 7). Other details of the non-localinhibition mechanism are described in Methods. Interestingly, wefind that to maintain a non-local signal in a steady state an energyflux is necessary (Text S1, part I).
Stochastic dynamicsThere are several reasons why the dynamic equations are not
deterministic. Even in the steady state, interfacial complexes notonly bind and unbind due to thermal fluctuations, but like nearlyeverything else inside the cell are being constantly recycled andreassembled. Stochastic fluctuations arise from the molecular noiseof reactions and the variability in the state of the cell defining the‘‘intrinsic’’ and ‘‘extrinsic’’ noise [22]. It will suffice however todescribe stochasticity of complex binding and unbinding as if itwere a Poisson process. Equation (1) is thus replaced by astochastic equation,
d
dtu1~Ka1b2{K ’u1zj !4"
Figure 2. Key model ingredients. (A) Bistability on an interface. (B)Notation used for a2b complex binding and unbinding, Eqs. (1)–(2). (C)Nullclines for u1 and u2 (red and black lines), exhibiting an unstablefixed point with u1~u2 and two symmetry-breaking stable fixed points.(D)–(E) Possible mechanisms for the generation of a non-local field,based on the modification of a diffusible protein: (D) A cytoplasmicmessenger protein is modified when it meets the b side of an a2bcomplex. It then continues to diffuse and, when it meets the a side of acomplex it promotes its unbinding. (E) Instead of modifying a separatemessenger protein, the a protein is directly modified by binding acytoplasmic protein; u2 complexes locally affect the fraction of modifieda proteins and this, in turn, affects their affinity for forming complexeswith b-s on the opposite side of the interface.doi:10.1371/journal.pcbi.1000628.g002
Order and Stochastic Dynamics in Drosophila PCP
PLoS Computational Biology | www.ploscompbiol.org 3 December 2009 | Volume 5 | Issue 12 | e1000628
[and a similar modification applies to Eq. (2)] where the noise jcan be approximated as white Gaussian noise if the number ofmolecules per cell is not too small. Assuming that the dominantcontribution comes from the finite number of moleculesparticipating in the binding/unbinding dynamics, the varianceof j is inversely proportional to N0 (see Methods), where N0 isdefined as the number of a molecules per interface: N0~atAwhere at is the total concentration of a molecules (bound andunbound) and A is the area of an interface (about 5m|1m – seeFig. 1B). Since the variance of j decreases with increase of N0,1=N0 plays a role similar to temperature in a ferromagnet. If there
are*103 Fz molecules per cell [23], N0 is of order*103 resultingin the root-mean-square fluctuations of the order of 3% (i.e.
1=######N0
p) of the mean.
Other sources of intrinsic noise, in addition to the stochasticityof binding and unbinding events, may increase the noise variancebeyond the above estimate. These additional noise sources include,for example, stochasticity in the signaling pathway that generatesthe non-local inhibition within each cell, or fluctuations in at andbt. Such sources of intrinsic noise, acting upstream of u1 and u2,are propagated to the PCP signaling dynamics through thedynamics of complex formation, and can thus be describedqualitatively by the noise term in Eq. (4), with an effective value ofN0 that is possibly smaller than predicted from the number of aand b molecules alone.
Phase diagramWhat are the consequences of the model defined above when
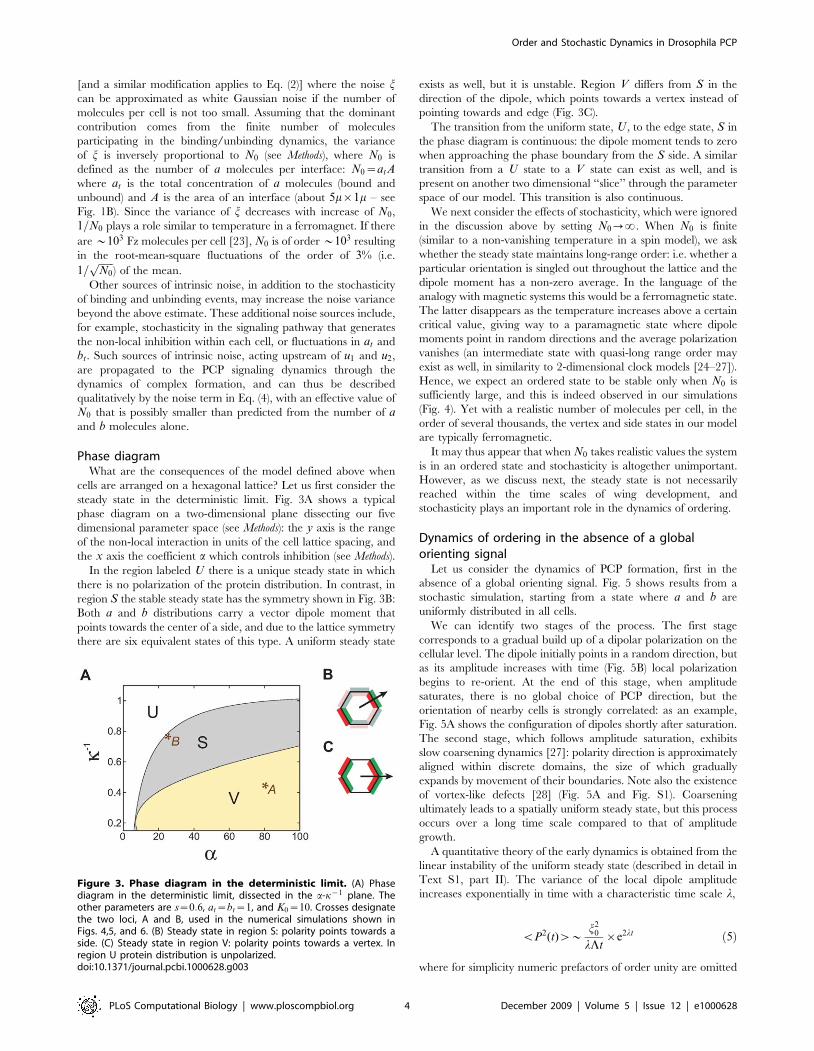
cells are arranged on a hexagonal lattice? Let us first consider thesteady state in the deterministic limit. Fig. 3A shows a typicalphase diagram on a two-dimensional plane dissecting our fivedimensional parameter space (see Methods): the y axis is the rangeof the non-local interaction in units of the cell lattice spacing, andthe x axis the coefficient a which controls inhibition (see Methods).In the region labeled U there is a unique steady state in which
there is no polarization of the protein distribution. In contrast, inregion S the stable steady state has the symmetry shown in Fig. 3B:Both a and b distributions carry a vector dipole moment thatpoints towards the center of a side, and due to the lattice symmetrythere are six equivalent states of this type. A uniform steady state
exists as well, but it is unstable. Region V differs from S in thedirection of the dipole, which points towards a vertex instead ofpointing towards and edge (Fig. 3C).The transition from the uniform state, U , to the edge state, S in
the phase diagram is continuous: the dipole moment tends to zerowhen approaching the phase boundary from the S side. A similartransition from a U state to a V state can exist as well, and ispresent on another two dimensional ‘‘slice’’ through the parameterspace of our model. This transition is also continuous.We next consider the effects of stochasticity, which were ignored
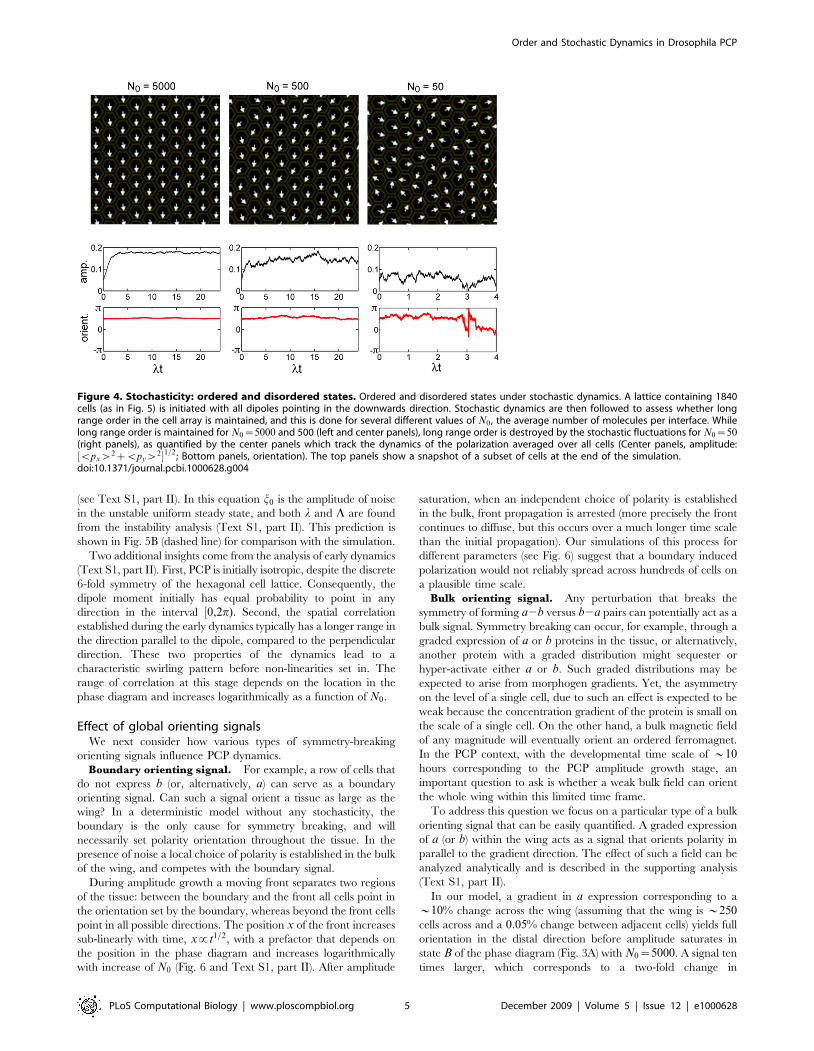
in the discussion above by setting N0??. When N0 is finite(similar to a non-vanishing temperature in a spin model), we askwhether the steady state maintains long-range order: i.e. whether aparticular orientation is singled out throughout the lattice and thedipole moment has a non-zero average. In the language of theanalogy with magnetic systems this would be a ferromagnetic state.The latter disappears as the temperature increases above a certaincritical value, giving way to a paramagnetic state where dipolemoments point in random directions and the average polarizationvanishes (an intermediate state with quasi-long range order mayexist as well, in similarity to 2-dimensional clock models [24–27]).Hence, we expect an ordered state to be stable only when N0 issufficiently large, and this is indeed observed in our simulations(Fig. 4). Yet with a realistic number of molecules per cell, in theorder of several thousands, the vertex and side states in our modelare typically ferromagnetic.It may thus appear that when N0 takes realistic values the system
is in an ordered state and stochasticity is altogether unimportant.However, as we discuss next, the steady state is not necessarilyreached within the time scales of wing development, andstochasticity plays an important role in the dynamics of ordering.
Dynamics of ordering in the absence of a globalorienting signalLet us consider the dynamics of PCP formation, first in the
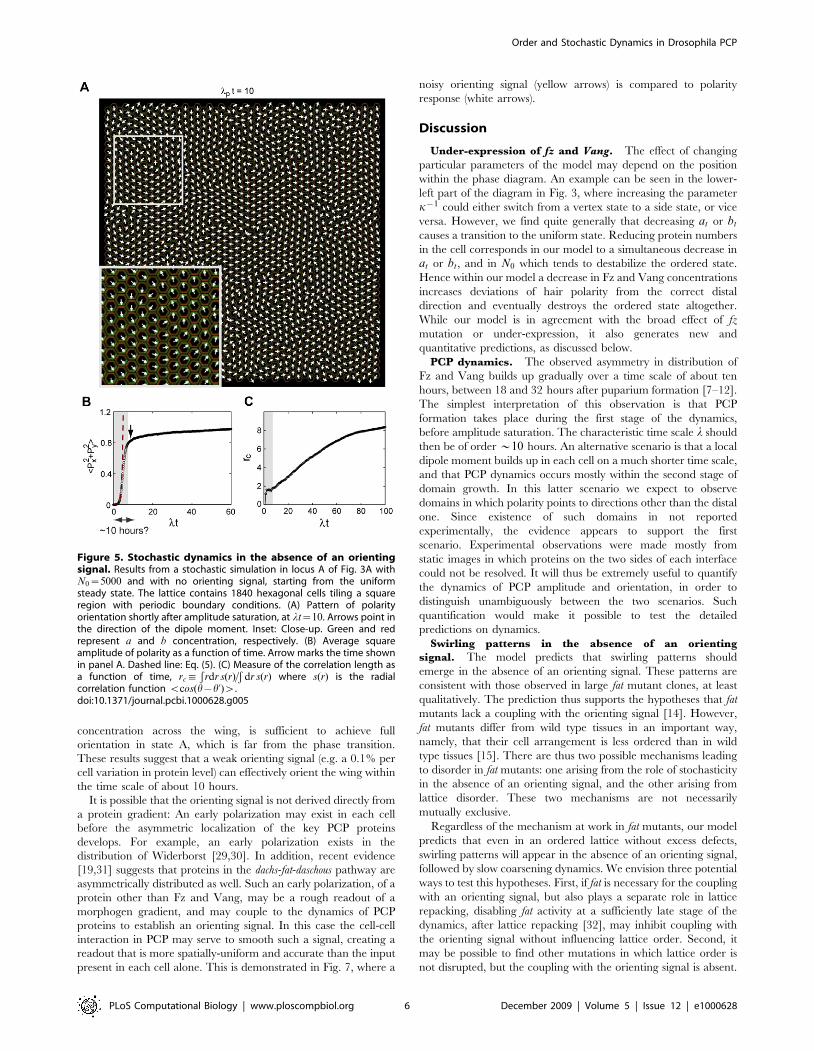
absence of a global orienting signal. Fig. 5 shows results from astochastic simulation, starting from a state where a and b areuniformly distributed in all cells.We can identify two stages of the process. The first stage
corresponds to a gradual build up of a dipolar polarization on thecellular level. The dipole initially points in a random direction, butas its amplitude increases with time (Fig. 5B) local polarizationbegins to re-orient. At the end of this stage, when amplitudesaturates, there is no global choice of PCP direction, but theorientation of nearby cells is strongly correlated: as an example,Fig. 5A shows the configuration of dipoles shortly after saturation.The second stage, which follows amplitude saturation, exhibitsslow coarsening dynamics [27]: polarity direction is approximatelyaligned within discrete domains, the size of which graduallyexpands by movement of their boundaries. Note also the existenceof vortex-like defects [28] (Fig. 5A and Fig. S1). Coarseningultimately leads to a spatially uniform steady state, but this processoccurs over a long time scale compared to that of amplitudegrowth.A quantitative theory of the early dynamics is obtained from the
linear instability of the uniform steady state (described in detail inText S1, part II). The variance of the local dipole amplitudeincreases exponentially in time with a characteristic time scale l,
vP2(t)w*j20lLt
|e2lt !5"
where for simplicity numeric prefactors of order unity are omitted
Figure 3. Phase diagram in the deterministic limit. (A) Phasediagram in the deterministic limit, dissected in the a-k{1 plane. Theother parameters are s~0:6, at~bt~1, and K0~10. Crosses designatethe two loci, A and B, used in the numerical simulations shown inFigs. 4,5, and 6. (B) Steady state in region S: polarity points towards aside. (C) Steady state in region V: polarity points towards a vertex. Inregion U protein distribution is unpolarized.doi:10.1371/journal.pcbi.1000628.g003
Order and Stochastic Dynamics in Drosophila PCP
PLoS Computational Biology | www.ploscompbiol.org 4 December 2009 | Volume 5 | Issue 12 | e1000628
(see Text S1, part II). In this equation j0 is the amplitude of noisein the unstable uniform steady state, and both l and L are foundfrom the instability analysis (Text S1, part II). This prediction isshown in Fig. 5B (dashed line) for comparison with the simulation.Two additional insights come from the analysis of early dynamics
(Text S1, part II). First, PCP is initially isotropic, despite the discrete6-fold symmetry of the hexagonal cell lattice. Consequently, thedipole moment initially has equal probability to point in anydirection in the interval $0,2p). Second, the spatial correlationestablished during the early dynamics typically has a longer range inthe direction parallel to the dipole, compared to the perpendiculardirection. These two properties of the dynamics lead to acharacteristic swirling pattern before non-linearities set in. Therange of correlation at this stage depends on the location in thephase diagram and increases logarithmically as a function of N0.
Effect of global orienting signalsWe next consider how various types of symmetry-breaking
orienting signals influence PCP dynamics.Boundary orienting signal. For example, a row of cells that
do not express b (or, alternatively, a) can serve as a boundaryorienting signal. Can such a signal orient a tissue as large as thewing? In a deterministic model without any stochasticity, theboundary is the only cause for symmetry breaking, and willnecessarily set polarity orientation throughout the tissue. In thepresence of noise a local choice of polarity is established in the bulkof the wing, and competes with the boundary signal.During amplitude growth a moving front separates two regions
of the tissue: between the boundary and the front all cells point inthe orientation set by the boundary, whereas beyond the front cellspoint in all possible directions. The position x of the front increasessub-linearly with time, x!t1=2, with a prefactor that depends onthe position in the phase diagram and increases logarithmicallywith increase of N0 (Fig. 6 and Text S1, part II). After amplitude
saturation, when an independent choice of polarity is establishedin the bulk, front propagation is arrested (more precisely the frontcontinues to diffuse, but this occurs over a much longer time scalethan the initial propagation). Our simulations of this process fordifferent parameters (see Fig. 6) suggest that a boundary inducedpolarization would not reliably spread across hundreds of cells ona plausible time scale.
Bulk orienting signal. Any perturbation that breaks thesymmetry of forming a2b versus b2a pairs can potentially act as abulk signal. Symmetry breaking can occur, for example, through agraded expression of a or b proteins in the tissue, or alternatively,another protein with a graded distribution might sequester orhyper-activate either a or b. Such graded distributions may beexpected to arise from morphogen gradients. Yet, the asymmetryon the level of a single cell, due to such an effect is expected to beweak because the concentration gradient of the protein is small onthe scale of a single cell. On the other hand, a bulk magnetic fieldof any magnitude will eventually orient an ordered ferromagnet.In the PCP context, with the developmental time scale of *10hours corresponding to the PCP amplitude growth stage, animportant question to ask is whether a weak bulk field can orientthe whole wing within this limited time frame.To address this question we focus on a particular type of a bulk
orienting signal that can be easily quantified. A graded expressionof a (or b) within the wing acts as a signal that orients polarity inparallel to the gradient direction. The effect of such a field can beanalyzed analytically and is described in the supporting analysis(Text S1, part II).In our model, a gradient in a expression corresponding to a
*10% change across the wing (assuming that the wing is *250cells across and a 0:05% change between adjacent cells) yields fullorientation in the distal direction before amplitude saturates instate B of the phase diagram (Fig. 3A) with N0~5000. A signal tentimes larger, which corresponds to a two-fold change in
Figure 4. Stochasticity: ordered and disordered states. Ordered and disordered states under stochastic dynamics. A lattice containing 1840cells (as in Fig. 5) is initiated with all dipoles pointing in the downwards direction. Stochastic dynamics are then followed to assess whether longrange order in the cell array is maintained, and this is done for several different values of N0 , the average number of molecules per interface. Whilelong range order is maintained for N0~5000 and 500 (left and center panels), long range order is destroyed by the stochastic fluctuations for N0~50(right panels), as quantified by the center panels which track the dynamics of the polarization averaged over all cells (Center panels, amplitude:$vpxw2zvpyw2%1=2 ; Bottom panels, orientation). The top panels show a snapshot of a subset of cells at the end of the simulation.doi:10.1371/journal.pcbi.1000628.g004
Order and Stochastic Dynamics in Drosophila PCP
PLoS Computational Biology | www.ploscompbiol.org 5 December 2009 | Volume 5 | Issue 12 | e1000628
concentration across the wing, is sufficient to achieve fullorientation in state A, which is far from the phase transition.These results suggest that a weak orienting signal (e.g. a 0.1% percell variation in protein level) can effectively orient the wing withinthe time scale of about 10 hours.It is possible that the orienting signal is not derived directly from
a protein gradient: An early polarization may exist in each cellbefore the asymmetric localization of the key PCP proteinsdevelops. For example, an early polarization exists in thedistribution of Widerborst [29,30]. In addition, recent evidence[19,31] suggests that proteins in the dachs-fat-daschous pathway areasymmetrically distributed as well. Such an early polarization, of aprotein other than Fz and Vang, may be a rough readout of amorphogen gradient, and may couple to the dynamics of PCPproteins to establish an orienting signal. In this case the cell-cellinteraction in PCP may serve to smooth such a signal, creating areadout that is more spatially-uniform and accurate than the inputpresent in each cell alone. This is demonstrated in Fig. 7, where a
noisy orienting signal (yellow arrows) is compared to polarityresponse (white arrows).
Discussion
Under-expression of fz and Vang. The effect of changingparticular parameters of the model may depend on the positionwithin the phase diagram. An example can be seen in the lower-left part of the diagram in Fig. 3, where increasing the parameterk{1 could either switch from a vertex state to a side state, or viceversa. However, we find quite generally that decreasing at or btcauses a transition to the uniform state. Reducing protein numbersin the cell corresponds in our model to a simultaneous decrease inat or bt, and in N0 which tends to destabilize the ordered state.Hence within our model a decrease in Fz and Vang concentrationsincreases deviations of hair polarity from the correct distaldirection and eventually destroys the ordered state altogether.While our model is in agreement with the broad effect of fzmutation or under-expression, it also generates new andquantitative predictions, as discussed below.
PCP dynamics. The observed asymmetry in distribution ofFz and Vang builds up gradually over a time scale of about tenhours, between 18 and 32 hours after puparium formation [7–12].The simplest interpretation of this observation is that PCPformation takes place during the first stage of the dynamics,before amplitude saturation. The characteristic time scale l shouldthen be of order *10 hours. An alternative scenario is that a localdipole moment builds up in each cell on a much shorter time scale,and that PCP dynamics occurs mostly within the second stage ofdomain growth. In this latter scenario we expect to observedomains in which polarity points to directions other than the distalone. Since existence of such domains in not reportedexperimentally, the evidence appears to support the firstscenario. Experimental observations were made mostly fromstatic images in which proteins on the two sides of each interfacecould not be resolved. It will thus be extremely useful to quantifythe dynamics of PCP amplitude and orientation, in order todistinguish unambiguously between the two scenarios. Suchquantification would make it possible to test the detailedpredictions on dynamics.
Swirling patterns in the absence of an orientingsignal. The model predicts that swirling patterns shouldemerge in the absence of an orienting signal. These patterns areconsistent with those observed in large fat mutant clones, at leastqualitatively. The prediction thus supports the hypotheses that fatmutants lack a coupling with the orienting signal [14]. However,fat mutants differ from wild type tissues in an important way,namely, that their cell arrangement is less ordered than in wildtype tissues [15]. There are thus two possible mechanisms leadingto disorder in fat mutants: one arising from the role of stochasticityin the absence of an orienting signal, and the other arising fromlattice disorder. These two mechanisms are not necessarilymutually exclusive.Regardless of the mechanism at work in fat mutants, our model
predicts that even in an ordered lattice without excess defects,swirling patterns will appear in the absence of an orienting signal,followed by slow coarsening dynamics. We envision three potentialways to test this hypotheses. First, if fat is necessary for the couplingwith an orienting signal, but also plays a separate role in latticerepacking, disabling fat activity at a sufficiently late stage of thedynamics, after lattice repacking [32], may inhibit coupling withthe orienting signal without influencing lattice order. Second, itmay be possible to find other mutations in which lattice order isnot disrupted, but the coupling with the orienting signal is absent.
Figure 5. Stochastic dynamics in the absence of an orientingsignal. Results from a stochastic simulation in locus A of Fig. 3A withN0~5000 and with no orienting signal, starting from the uniformsteady state. The lattice contains 1840 hexagonal cells tiling a squareregion with periodic boundary conditions. (A) Pattern of polarityorientation shortly after amplitude saturation, at lt~10. Arrows point inthe direction of the dipole moment. Inset: Close-up. Green and redrepresent a and b concentration, respectively. (B) Average squareamplitude of polarity as a function of time. Arrow marks the time shownin panel A. Dashed line: Eq. (5). (C) Measure of the correlation length asa function of time, rc:
$rdr s(r)=
$dr s(r) where s(r) is the radial
correlation function vcos(h{h’)w.doi:10.1371/journal.pcbi.1000628.g005
Order and Stochastic Dynamics in Drosophila PCP
PLoS Computational Biology | www.ploscompbiol.org 6 December 2009 | Volume 5 | Issue 12 | e1000628
Third, it may be possible to negate the effect of the endogenousdistally orienting signal by inducing an orienting signal in theproximal direction.
An artificial bulk orienting signal. We predict that gradedexpression of a or b will act as an orienting signal. This predictionis consistent with experiments in which a gradient in expression offz was induced using heat-shock promoters, causing inversion ofhair-growth direction [33]. A similar effect is expected with agraded expression of Vang.Inducing a gradient of Fz or Vang protein concentration may
provide a way to cancel the endogenous signal in order to test thepredictions discussed above. Further, inducing such a gradient in atunable, quantifiable manner could be a realistic experimentalobjective, e.g., using light-switchable promoter systems that allow
precise spatio-temporal control of gene expression [34]. Inaddition to testing the prediction that a and b gradients can actas an orienting signal, measuring the magnitude of gradients thatinduce a significant perturbation in the PCP pattern can provide away to quantify the magnitude of the endogenous orienting signaland its spatial variation within the wing. Another prediction thatcould potentially be tested along these lines is that applying anorienting signal only at a late stage of the ordering dynamics willhave only weak influence on polarity (see Fig. S2). Finally,inducing an orienting signal in fat mutants could help distinguishbetween the role of lattice disorder and the role of uncouplingfrom the orienting signal.While gradients in fz or Vang expression could be used as a tool
to perturb PCP in a controlled manner, experimental evidencesuggests that the endogenous orienting signal is not due to agradient in fz expression [23,33,35,36]: First, a graded expressionhas not been observed experimentally (although our modelsuggests that very weak gradients may be sufficient to select thedistal orientation). Second, uniform expression of a fz transgenewith a heat-shock promoter is sufficient to rescue a null fzgenotype.
Bulk vs. boundary signals. Our results demonstrate that aweak concentration gradient within the tissue can produce areliable response, although the concentration change on the scaleof individual cells is very small. The reliable response is achievedby the collective dynamics of the network, which effectivelyintegrates the orienting signal over a region of the tissue largerthan the size of an individual cell. Hence our results suggest that inthe PCP pathway inter-cellular interactions within the network ofcells serve to increase the fidelity of response to a morphogeneticfield.In contrast to the precise readout of a weak bulk signal, a
boundary signal cannot effectively propagate in our model over alarge number of cells. This result is expected to hold in any modelthat shares a fundamental aspect with our model, namely, that theuniform state is unstable and gives rise spontaneously to apatterned state driven by noise even in the absence of a global
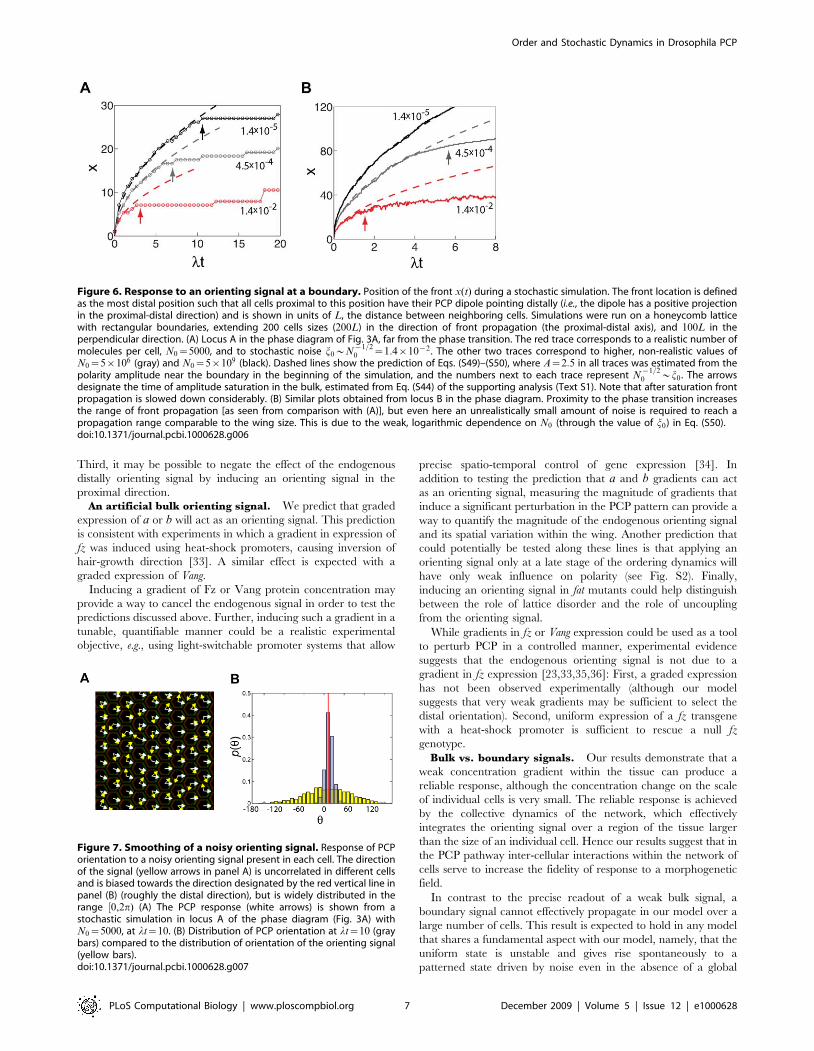
Figure 6. Response to an orienting signal at a boundary. Position of the front x(t) during a stochastic simulation. The front location is definedas the most distal position such that all cells proximal to this position have their PCP dipole pointing distally (i.e., the dipole has a positive projectionin the proximal-distal direction) and is shown in units of L, the distance between neighboring cells. Simulations were run on a honeycomb latticewith rectangular boundaries, extending 200 cells sizes (200L) in the direction of front propagation (the proximal-distal axis), and 100L in theperpendicular direction. (A) Locus A in the phase diagram of Fig. 3A, far from the phase transition. The red trace corresponds to a realistic number ofmolecules per cell, N0~5000, and to stochastic noise j0*N
{1=20 ~1:4|10{2 . The other two traces correspond to higher, non-realistic values of
N0~5|106 (gray) and N0~5|109 (black). Dashed lines show the prediction of Eqs. (S49)–(S50), where A~2:5 in all traces was estimated from thepolarity amplitude near the boundary in the beginning of the simulation, and the numbers next to each trace represent N{1=2
0 *j0 . The arrowsdesignate the time of amplitude saturation in the bulk, estimated from Eq. (S44) of the supporting analysis (Text S1). Note that after saturation frontpropagation is slowed down considerably. (B) Similar plots obtained from locus B in the phase diagram. Proximity to the phase transition increasesthe range of front propagation [as seen from comparison with (A)], but even here an unrealistically small amount of noise is required to reach apropagation range comparable to the wing size. This is due to the weak, logarithmic dependence on N0 (through the value of j0) in Eq. (S50).doi:10.1371/journal.pcbi.1000628.g006
Figure 7. Smoothing of a noisy orienting signal. Response of PCPorientation to a noisy orienting signal present in each cell. The directionof the signal (yellow arrows in panel A) is uncorrelated in different cellsand is biased towards the direction designated by the red vertical line inpanel (B) (roughly the distal direction), but is widely distributed in therange $0,2p) (A) The PCP response (white arrows) is shown from astochastic simulation in locus A of the phase diagram (Fig. 3A) withN0~5000, at lt~10. (B) Distribution of PCP orientation at lt~10 (graybars) compared to the distribution of orientation of the orienting signal(yellow bars).doi:10.1371/journal.pcbi.1000628.g007
Order and Stochastic Dynamics in Drosophila PCP
PLoS Computational Biology | www.ploscompbiol.org 7 December 2009 | Volume 5 | Issue 12 | e1000628
ordering field. In contrast, in an excitable system where theuniform state is stable, it may be possible to achieve patterning bya propagating front – as observed, for example, in themorphogenetic furrow during drosophila eye development [37].
Phenomenological models in Biology. Modeling inBiology tends to emphasize molecular detail. Yet in biologicalnetworks that involve more than a few components the typicalsituation is that many details are unknown, and it is imperative todevise an approach that can be insightful and predictive even inthe absence of complete knowledge. Our strategy was based onbuilding a semi-phenomenological model which attempts toidentify the key microscopic aspects (e.g. formation of trans-cellular heterodimer complexes), build a simple model whichparameterizes the many unknowns and systematically identifydifferent regimes of behavior as a function of parameters (e.g. via aphase diagram). We then focus on identifying the observableeffects that can help to discriminate between different regimes ofthe model. For example, the dynamics of intracellular polarizationand the ‘‘coarsening’’ dynamics that extends local correlations intoa global order, are identified as informative quantitativephenotypes deserving careful experimental study. The study isobviously incomplete, as it does not explicitly identify all relevantgenes and molecules, but it provides a useful framework allowingto classify phenotypes and accordingly group observed geneticperturbations, and eventually refine the model at an increasedlevel of molecular precision.
Methods
Model. We considered two mechanisms for establishing anon-local inhibitor field in each cell, and results were similar in thetwo. The examples used in the manuscript use one realization ofthe model which is summarized below, while a full description ofboth mechanisms is provided in the supporting analysis (Text S1,part I).
Fast diffusion. We assume that protein diffusion is fast. Therelevant time-scale in this context is the typical time for diffusion ofa membrane protein from one side of a cell to the opposite side,which (assuming a diffusion coefficient D^0:5m2=sec) is of theorder of 10 minutes. In comparison, the asymmetric patternof protein localization arises on a time scale of several hours,so that separation of time scales appears to be a reasonableapproximation. Assuming fast diffusion, free a and b con-centrations are uniform in each cell. Similarly, diffusion ofbound a/b complexes equilibrates their concentration on anygiven interface. Complexes, however, cannot diffuse from oneinterface to another without unbinding first, and reforming withnew constituents – processes that we assume are slow. Hencecomplex concentrations can vary between interfaces belonging tothe same cell and the dynamics do not necessarily lead to auniform steady state. For a regular hexagonal array of cells onethen needs to keep track of six variables per cell representing thetotal numbers of interfacial complexes uai (with i labeling the sidesof cell a).
Dynamic equations. The dynamics of complexconcentration u1 at the interface between two cells (Fig. 2B) aredescribed by Eq. (4). The concentrations of unbound a and b are
a1~at{X5
i~0
u1,i=6 , b2~bt{X5
i~0
u’2,i=6 !6"
where u1,i are concentrations of complexes on the six sides of cell1, having an a within that cell and u’2,i are concentration ofcomplexes in cell 2 with a b in that cell, and where u1,0~u’2,0~u1
(Fig. S3). The rate K9 is a constant that we set to unity by rescalingtime, and K is given by
K~K0(1{vxw)(1zsu1) !7"
where the term su1 describes self-excitation, and vxw is theaverage on the interface of the non-local field x, which representsthe fraction of unmodified a proteins. This field obeys Eq. (3), inwhich rs is a one-dimensional coordinate ranging from 0 to 6S,
S~L=###3
pis the length of a cell side, and u2(rs) is a step-wise
uniform function equal to u2,i on each of the sides of cell 1.All the parameters in this equation are dimensionless: we re-
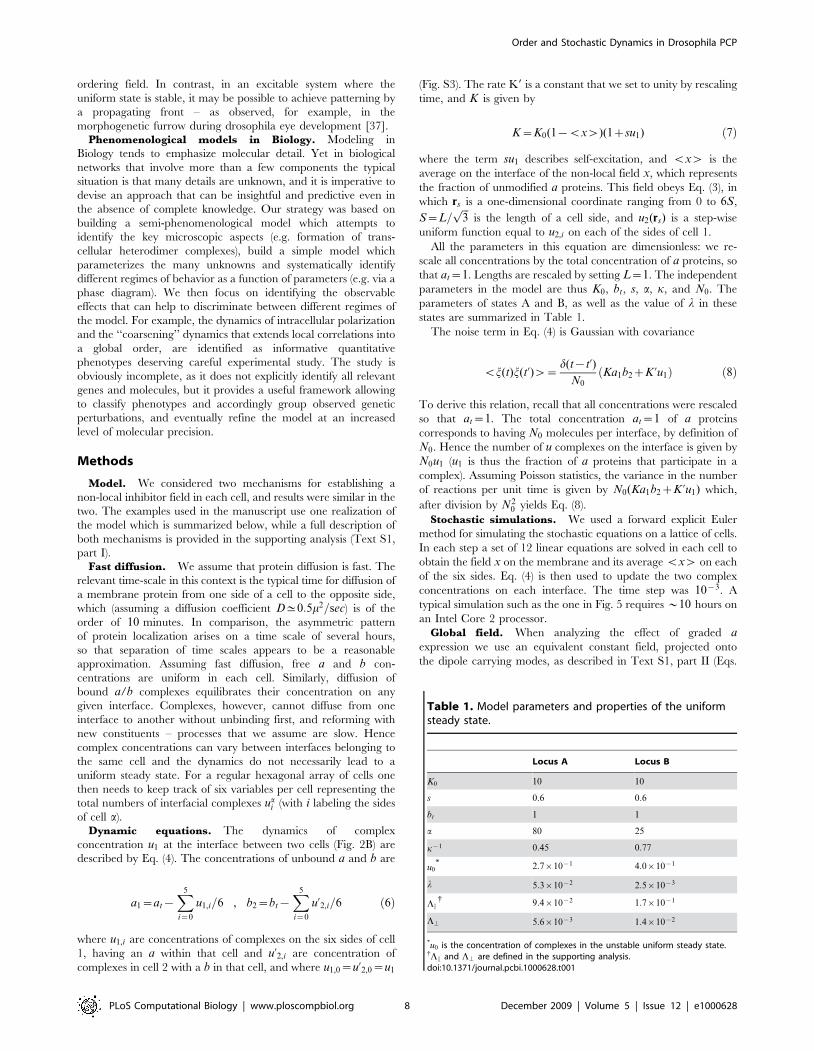
scale all concentrations by the total concentration of a proteins, sothat at~1. Lengths are rescaled by setting L~1. The independentparameters in the model are thus K0, bt, s, a, k, and N0. Theparameters of states A and B, as well as the value of l in thesestates are summarized in Table 1.The noise term in Eq. (4) is Gaussian with covariance
vj(t)j(t’)w~d(t{t’)N0
Ka1b2zK ’u1! " !8"
To derive this relation, recall that all concentrations were rescaledso that at~1. The total concentration at~1 of a proteinscorresponds to having N0 molecules per interface, by definition ofN0. Hence the number of u complexes on the interface is given byN0u1 (u1 is thus the fraction of a proteins that participate in acomplex). Assuming Poisson statistics, the variance in the numberof reactions per unit time is given by N0(Ka1b2zK ’u1) which,
after division by N20 yields Eq. (8).
Stochastic simulations. We used a forward explicit Eulermethod for simulating the stochastic equations on a lattice of cells.In each step a set of 12 linear equations are solved in each cell toobtain the field x on the membrane and its average vxw on eachof the six sides. Eq. (4) is then used to update the two complexconcentrations on each interface. The time step was 10{3. Atypical simulation such as the one in Fig. 5 requires *10 hours onan Intel Core 2 processor.
Global field. When analyzing the effect of graded aexpression we use an equivalent constant field, projected ontothe dipole carrying modes, as described in Text S1, part II (Eqs.
Table 1. Model parameters and properties of the uniformsteady state.
Locus A Locus B
K0 10 10
s 0:6 0:6
bt 1 1
a 80 25
k{1 0:45 0:77
u0* 2:7|10{1 4:0|10{1
l 5:3|10{2 2:5|10{3
LE{ 9:4|10{2 1:7|10{1
L\ 5:6|10{3 1:4|10{2
*u0 is the concentration of complexes in the unstable uniform steady state.{LE and L\ are defined in the supporting analysis.doi:10.1371/journal.pcbi.1000628.t001
Order and Stochastic Dynamics in Drosophila PCP
PLoS Computational Biology | www.ploscompbiol.org 8 December 2009 | Volume 5 | Issue 12 | e1000628
S54–S55), rather than include explicitly a graded expression of a,in order to avoid boundary effects. However, we also ransimulations on large lattices with direct gradients of a to verifythe applicability of Eq. (S55). In Fig. 7 a local field was associatedwith each cell. The dynamic equations at each interface involved alocal field taken as the average of the fields on the two cellsseparated by the interface.
Dipole moment. We define the magnitude of the PCP dipolein each cell as P~(Ma=at{Mb=bt)=2L where Ma,b is the dipolemoment of a/b protein distribution, Ma~
Pi ai(ri{rcm) and the
sum is over all sides of the cell, ai is the a concentration on side i, riis side i’s center, and rcm is the cell’s center. A similar equationholds for Mb. The only contribution to M comes from thecomplexed proteins because the free proteins are uniformlydistributed in the cell.
Fig 2A. For illustration purposes we set heredu1=dt~Ka1b2{K ’u1 where K~105, a1~b2~1{u1,K ’~ au2=(1zau2)$ %2 and a~0:025.
Phase diagram. The phase diagram (Fig. 3) was obtained asfollows. In the deterministic limit the steady states of the system arespatially uniform. Hence the problem reduces to that of finding thesteady states of a six-dimensional dynamical system. The phasespace was first sampled at 50|50 discrete loci to obtain a low-resolution representation of the phase diagram. At each point allsteady states (stable and unstable) were found using amultidimensional secant root-finding algorithm as described in[38], initialized with 500 different random states. For each stablestate found in this way, the stability and symmetry properties werethen determined. In all cases there was a unique stable steady stateup to the symmetry: Either a single stable uniform state, or sixequivalent stable vertex states, or six equivalent stable side states.After obtaining the low-resolution representation of the phase
diagram, we used the continuity of the phase transitions in order toobtain precise phase boundary curves, by solving numerically forloci where an eigenvalue of the Jacobian matrix vanishes.
Supporting Information
Figure S1 Coarsening dynamics. Coarsening dynamics in astochastic simulation without an orienting signal, at several timepoints: lt=2.5 (A) - before amplitude saturation, lt=10 (B), 50(C), and 100 (D). Parameters are the same as in Fig.,5.Found at: doi:10.1371/journal.pcbi.1000628.s001 (8.34 MB TIF)
Figure S2 Effect of delayed application of the orienting field.Dashed lines show the average polarization in the distal directionwhen a bulk orienting signal is applied only from lt=5, comparedto the dynamics when the field is applied from the simulation onset(full lines). Black, red, and gray traces correspond to three differentmagnitudes of the applied field. These correspond, respectively, togradients in a concentration that amount to an increase of 0.5%,0.2%, and 0.1% from each cell to its proximal neighbor.Found at: doi:10.1371/journal.pcbi.1000628.s002 (0.32 MB EPS)
Figure S3 Notation used in the dynamic equation for u1. Notethat u1,0 = u92,0;u1 and u2,0 = u91,0;u2.Found at: doi:10.1371/journal.pcbi.1000628.s003 (0.44 MB EPS)
Text S1 Supporting text.Found at: doi:10.1371/journal.pcbi.1000628.s004 (0.25 MB PDF)
Author Contributions
Wrote the paper: YB BIS. Performed the simulations: YB. Developed themodel and the theory: YB BIS.
References
1. Adler PN (2002) Planar signaling and morphogenesis in drosophila. Dev Cell 2:525–535.
2. Mlodzik M (2002) Planar cell polarization: do the same mechanisms regulatedrosophila tissue polarity and vertebrate gastrulation? Trends Genet 18:564–571.
3. Tree DRP, Ma D, Axelrod JD (2002) A three-tiered mechanism for regulation ofplanar cell polarity. Semin Cell Dev Biol 13: 217–224.
4. Eaton S (2003) Cell biology of planar polarity transmission in the drosophilawing. Mech Dev 120: 1257–1264.
5. Jones C, Chen P (2007) Planar cell polarity signaling in vertebrates. BioEssays29: 120–132.
6. Wong LL, Adler PN (1993) Tissue polarity genes of drosophila regulate the subcellularlocation for prehair initiation in pupal wing cells. J Cell Biol 123: 209–220.
7. Strutt DI (2002) Asymmetric localization of frizzled and the establishment of cellpolarity in the drosophila wing. Mol Cell 7: 367–375.
8. Axelrod JD (2001) Unipolar membrane association of dishevelled mediatesfrizzled planar cell polarity signaling. Gene Dev 15: 1182–1187.
9. Feiguin F, Hannus M, Moldzik M, Eaton S (2001) The ankyrin repeat proteindiego mediates frizzled-dependent planar polarization. Dev Cell 1: 93–101.
10. Tree DR, Shulman JM, Rousset R, Scott MP, Gubb D, et al. (2002) Pricklemediates feedback amplification to generate asymmetric planar cell polaritysignaling. Cell 109: 371–381.
11. Shimada Y, Usui T, Yanagawa S, Takeichi M, Uemura T (2001) Asymmetriccolocalization of flamingo, a seven-pass transmembrane cadherin, anddishevelled in planar cell polarization. Curr Biol 11: 859–863.
12. Bastock R, Strutt H, Strutt D (2003) Strabismus is asymmetrically localised andbinds to prickle and dishevelled during drosophila planar polarity patterning.Development 130: 3007–3014.
13. Vinson CR, Adler PN (1987) Directional non-cell autonomy and thetransmission of polarity information by the frizzled gene of drosophila. Nature329: 549–551.
14. Ma D, Yang CH, McNeill H, Simon MA, Axelrod JD (2003) Fidelity in planarcell polarity signaling. Nature 421: 543–547.
15. Ma D, Amonlirdviman K, Raffard RL, Abate A, Tomlin CJ, et al. (2008) Cellpacking influences planar cell polarity signaling. Proc Natl Acad Sci USA 105:18800–18805.
16. Affolter M, Basler K (2007) The decapentaplegic morphogen gradient: frompattern formation to growth regulation. Nat Rev Genet 8: 663–674.
17. Saburi S, McNeill H (2005) Organising cells into tissues: new roles for celladhesion molecules in planar cell polarity. Curr Opin Cell Biol 17: 482–488.
18. Lawrence PA, Struhl G, Casal J (2008) Do the protocadherins fat and dachsouslink up to determine both planar cell polarity and the dimensions of organs? NatCell Biol 10: 1379–1382.
19. Irvine K (2008) Private communication.20. Pathria RK (1996) Statistical Mechanics. Oxford, UK: Elsevier, second edition.21. Amonlirdviman K, Khare NA, Tree DRP, Chen WS, Axelrod JD, et al. (2005)
Mathematical modeling of planar cell polarity to understand domineeringnonautonomy. Science 307: 423–426.
22. Swain PS, Elowitz MB, Siggia ED (2003) Intrinsic and extrinsic contributions tostochasticity in gene expression. Proc Natl Acad Sci USA 99: 12795–12800.
23. Park WJ, Liu J, Adler PN (1994) Frizzled gene expression and development oftissue polarity in the drosophila wing. Dev Gen 15: 383–389.
24. Elitzur S, Pearson RB, Shigemitsu J (1979) Phase structure of discrete abelianspin and gauge systems. Phys Rev D 19: 3698–3714.
25. Cardy J (1980) General discrete planar models in two dimensions: Dualityproperties and phase diagrams. J Phys A 13: 1507–1515.
26. Einhorn MB, Savit R, Rabinovici E (1980) A physical picture for the phasetransitions in zn symmetric models. Nucl Phys B 170: 16–31.
27. Kaski K, Gunton JD (1983) Universal dynamical scaling in the clock model.Phys Rev B 28: 5371–5373.
28. Chaikin PM, Lubensky TC (1995) Principles of condensed matter physics.Cambridge, UK: Cambridge.
29. Hannus M, Feiguin F, Heisenberg CP, Eaton S (2002) Planar cell polarizationrequires widerborst, a b’ regulatory subunit of protein phosphate 2a.Development 129: 3493–3503.
30. Shimada Y, Yonemura S, Ohkura H, Strutt D, Uemura T (2006) Polarizedtransport of frizzled along the planar microtubule arrays in drosophila wingepithelium. Dev Cell 10: 209–222.
31. Axelrod J (2008) Private communication.32. Classen AK, Anderson KI, Marois E, Eaton S (2005) Hexagonal packing of
drosophila wing epithelial cells by the planar cell polarity pathway. Dev Cell 9:805–817.
33. Adler PN, Krasnow RE, Liu J (1997) Tissue polarity points from cells that havehigher frizzled levels towards cells that have lower frizzled levels. Curr Biol 7:940–949.
34. Simizu-Sato S, Huq E, Tepperman JM, Quail PH (2002) A light-switchablepromoter system. Nature Biotech 20: 1041–1044.
Order and Stochastic Dynamics in Drosophila PCP
PLoS Computational Biology | www.ploscompbiol.org 9 December 2009 | Volume 5 | Issue 12 | e1000628
35. Park WJ, Liu J, Adler PN (1994) The frizzled gene of drosophila encodes amembrane protein with an odd number of transmembrane domains. Mech Dev45: 127–137.
36. Krasnow RE, Adler PN (1994) A single frizzled protein has a dual function intissue polarity. Development 120: 1883–1893.
37. Tomlinson A, Ready DF (1987) Neuronal differentiation in drosophilaommatidium. Dev Biol 120: 366–376.
38. Press WH, Teukolsky SA, Vetterling WT, Flannery BP (1992) NumericalRecipes in C. Cambridge: Cambridge, second edition. pp 389–392.
39. Usui T, Shima Y, Shimada Y, Hirano S, Burgess RW, et al. (1999) Flamingo, aseven-pass transmembrane cadherin, regulates planar cell polarity under thecontrol of frizzled. Cell 98: 585–595.
40. Adler PN, Taylor J, Charlton J (2000) The domineering non-autonomy offrizzled and van gogh clones in the drosophila wing is a consequence of adisruption in local signaling. Mech Dev 96: 197–207.
Order and Stochastic Dynamics in Drosophila PCP
PLoS Computational Biology | www.ploscompbiol.org 10 December 2009 | Volume 5 | Issue 12 | e1000628
![Planar stochastic hyperbolic in nite triangulations · Planar stochastic hyperbolic in nite triangulations Nicolas Curien Abstract Pursuing the approach of [7] we introduce and study](https://img.pdfslide.us/doc/110x75/5e850d7943de4f246f5e034b/planar-stochastic-hyperbolic-in-nite-triangulations-planar-stochastic-hyperbolic.jpg)