Embed Size (px)
Citation preview

1
Orange County Secondary 2017-2019
Main Report

This report was prepared by WestEd, a research, development, and service agency, in collaboration with Duerr Evaluation Resources, under contract from the California Department of Education Coordinated School Health and Safety Office. For contract information, contact:
Hilva Chan California Department of Education Coordinated School Health and Safety Office 1430 N Street Sacramento, CA 95814 [email protected]
Recommended citation: Orange County. California Healthy Kids Survey, 2017-2019: Main Report. San Francisco: WestEd Health and Justice Program for the California Department of Education.
Date prepared: 26 Jun 2020

Contents
Page
List of Tables . . . . . . . . . . . . . . . . . . . . . . . . . . . . . . . . . . . . . . . . . . . . . II
PREFACE . . . . . . . . . . . . . . . . . . . . . . . . . . . . . . . . . . . . . . . . . . . . . . V
Survey Module Administration . . . . . . . . . . . . . . . . . . . . . . . . . . . . . . . . . . . 1
A. Core Module Results . . . . . . . . . . . . . . . . . . . . . . . . . . . . . . . . . . . . . . . 2 1. Survey Sample . . . . . . . . . . . . . . . . . . . . . . . . . . . . . . . . . . . . . . . . . 2 2. Summary of Key Indicators . . . . . . . . . . . . . . . . . . . . . . . . . . . . . . . . . . 3 3. Demographics . . . . . . . . . . . . . . . . . . . . . . . . . . . . . . . . . . . . . . . . . 4 4. School Performance, Supports, and Engagement . . . . . . . . . . . . . . . . . . . . . . . 11 5. School Violence, Victimization, and Safety . . . . . . . . . . . . . . . . . . . . . . . . . . 22 6. Alcohol and Other Drug Use . . . . . . . . . . . . . . . . . . . . . . . . . . . . . . . . . . 29 7. Tobacco Use . . . . . . . . . . . . . . . . . . . . . . . . . . . . . . . . . . . . . . . . . . 42 8. Other Physical and Mental Health Risks . . . . . . . . . . . . . . . . . . . . . . . . . . . . 49 9. Race/Ethnic Breakdowns . . . . . . . . . . . . . . . . . . . . . . . . . . . . . . . . . . . . 51 10. Gender Breakdowns . . . . . . . . . . . . . . . . . . . . . . . . . . . . . . . . . . . . . . 57
Appendix I . . . . . . . . . . . . . . . . . . . . . . . . . . . . . . . . . . . . . . . . . . . . . . 59
Appendix II . . . . . . . . . . . . . . . . . . . . . . . . . . . . . . . . . . . . . . . . . . . . . . 60
Appendix III . . . . . . . . . . . . . . . . . . . . . . . . . . . . . . . . . . . . . . . . . . . . . 61
I

List of Tables
Page
Survey Module Administration . . . . . . . . . . . . . . . . . . . . . . . . . . . . . . . . . . . 1 1 CHKS Survey Modules Administered . . . . . . . . . . . . . . . . . . . . . . . . . 1
A. Core Module Results . . . . . . . . . . . . . . . . . . . . . . . . . . . . . . . . . . . . . . . 2
1. Survey Sample . . . . . . . . . . . . . . . . . . . . . . . . . . . . . . . . . . . . . . . . . . . 2 A1.1 Student Sample for Core Module . . . . . . . . . . . . . . . . . . . . . . . . . . . . 2
2. Summary of Key Indicators . . . . . . . . . . . . . . . . . . . . . . . . . . . . . . . . . . . . 3 A2.1 Key Indicators of School Climate and Student Well-Being . . . . . . . . . . . . . . . 3
3. Demographics . . . . . . . . . . . . . . . . . . . . . . . . . . . . . . . . . . . . . . . . . . . 4 A3.1 Gender of Sample . . . . . . . . . . . . . . . . . . . . . . . . . . . . . . . . . . . . 4 A3.2 Hispanic or Latino . . . . . . . . . . . . . . . . . . . . . . . . . . . . . . . . . . . . 4 A3.3 Race . . . . . . . . . . . . . . . . . . . . . . . . . . . . . . . . . . . . . . . . . . . 4 A3.4 Living Situation . . . . . . . . . . . . . . . . . . . . . . . . . . . . . . . . . . . . . 5 A3.5 Highest Education of Parents . . . . . . . . . . . . . . . . . . . . . . . . . . . . . . 5 A3.6 Free or Reduced Price Meals Eligibility . . . . . . . . . . . . . . . . . . . . . . . . 6 A3.7 Participation in Migrant Education Program, Past 3 Years . . . . . . . . . . . . . . . 6 A3.8 Language Spoken at Home . . . . . . . . . . . . . . . . . . . . . . . . . . . . . . . 6 A3.9 English Language Proficiency – All Students . . . . . . . . . . . . . . . . . . . . . . 7 A3.10 English Language Proficiency – Home Language Other Than English . . . . . . . . 8 A3.11 Number of Days Attending Afterschool Program . . . . . . . . . . . . . . . . . . . 9 A3.12 Military Connections . . . . . . . . . . . . . . . . . . . . . . . . . . . . . . . . . . 9 A3.13 Sexual Orientation . . . . . . . . . . . . . . . . . . . . . . . . . . . . . . . . . . . . 10 A3.14 Gender Identity . . . . . . . . . . . . . . . . . . . . . . . . . . . . . . . . . . . . . 10
4. School Performance, Supports, and Engagement . . . . . . . . . . . . . . . . . . . . . . . . . 11 A4.1 Grades, Past 12 Months . . . . . . . . . . . . . . . . . . . . . . . . . . . . . . . . . 11 A4.2 Truancy, Past 12 Months . . . . . . . . . . . . . . . . . . . . . . . . . . . . . . . . 11 A4.3 Absences, Past 30 Days . . . . . . . . . . . . . . . . . . . . . . . . . . . . . . . . . 12 A4.4 Reasons for Absence, Past 30 Days . . . . . . . . . . . . . . . . . . . . . . . . . . . 12 A4.5 School Environment Scales (Developmental Supports) . . . . . . . . . . . . . . . . 13 A4.6 School Connectedness, Academic Motivation, and Parent Involvement Scales . . . . 14 A4.7 Caring Relationships Scale Questions . . . . . . . . . . . . . . . . . . . . . . . . . 15 A4.8 High Expectations Scale Questions . . . . . . . . . . . . . . . . . . . . . . . . . . . 16 A4.9 Meaningful Participation Scale Questions . . . . . . . . . . . . . . . . . . . . . . . 17 A4.10 School Connectedness Scale Questions . . . . . . . . . . . . . . . . . . . . . . . . . 18 A4.11 Academic Motivation Scale Questions . . . . . . . . . . . . . . . . . . . . . . . . . 19 A4.12 Parent Involvement Scale Questions . . . . . . . . . . . . . . . . . . . . . . . . . . 20 A4.13 Quality of School Physical Environment . . . . . . . . . . . . . . . . . . . . . . . . 21
5. School Violence, Victimization, and Safety . . . . . . . . . . . . . . . . . . . . . . . . . . . . 22 A5.1 Perceived Safety at School . . . . . . . . . . . . . . . . . . . . . . . . . . . . . . . 22 A5.2 Reasons for Harassment on School Property, Past 12 Months . . . . . . . . . . . . . 23
II

A5.2 Reasons for Harassment on School Property, Past 12 Months – Continued . . . . . . 24 A5.3 Verbal Harassment at School, Past 12 Months . . . . . . . . . . . . . . . . . . . . . 25 A5.4 Violence and Victimization on School Property, Past 12 Months . . . . . . . . . . . 26 A5.5 Property Damage on School Property, Past 12 Months . . . . . . . . . . . . . . . . . 27 A5.6 Weapons Possession on School Property, Past 12 Months . . . . . . . . . . . . . . . 27 A5.7 Cyber Bullying, Past 12 Months . . . . . . . . . . . . . . . . . . . . . . . . . . . . 28
6. Alcohol and Other Drug Use . . . . . . . . . . . . . . . . . . . . . . . . . . . . . . . . . . . . 29 A6.1 Summary Measures of Level of AOD Use and Perceptions . . . . . . . . . . . . . . 29 A6.2 Summary of AOD Lifetime Use . . . . . . . . . . . . . . . . . . . . . . . . . . . . 30 A6.3 Lifetime AOD Use . . . . . . . . . . . . . . . . . . . . . . . . . . . . . . . . . . . 31 A6.3 Lifetime AOD Use – Continued . . . . . . . . . . . . . . . . . . . . . . . . . . . . . 32 A6.4 Lifetime Marijuana Consumption . . . . . . . . . . . . . . . . . . . . . . . . . . . . 33 A6.5 Current AOD Use, Past 30 Days . . . . . . . . . . . . . . . . . . . . . . . . . . . . 34 A6.6 Frequency of Current AOD Use, Past 30 Days . . . . . . . . . . . . . . . . . . . . . 35 A6.7 Lifetime Drunk or “High” . . . . . . . . . . . . . . . . . . . . . . . . . . . . . . . . 36 A6.8 Current AOD Use on School Property, Past 30 Days . . . . . . . . . . . . . . . . . . 37 A6.9 Lifetime Drunk or “High” on School Property . . . . . . . . . . . . . . . . . . . . . 37 A6.10 Cessation Attempts . . . . . . . . . . . . . . . . . . . . . . . . . . . . . . . . . . . 38 A6.11 Drinking While Driving, Lifetime . . . . . . . . . . . . . . . . . . . . . . . . . . . 39 A6.12 Perceived Harm of AOD Use . . . . . . . . . . . . . . . . . . . . . . . . . . . . . . 40 A6.13 Perceived Difficulty of Obtaining Alcohol and Marijuana . . . . . . . . . . . . . . . 41
7. Tobacco Use . . . . . . . . . . . . . . . . . . . . . . . . . . . . . . . . . . . . . . . . . . . . 42 A7.1 Summary of Key CHKS Tobacco Indicators . . . . . . . . . . . . . . . . . . . . . . 42 A7.2 Lifetime Tobacco Use . . . . . . . . . . . . . . . . . . . . . . . . . . . . . . . . . . 43 A7.3 Any Current Use and Daily Use . . . . . . . . . . . . . . . . . . . . . . . . . . . . 44 A7.4 Current Smoking on School Property, Past 30 Days . . . . . . . . . . . . . . . . . . 45 A7.5 Cigarette Smoking Cessation Attempts . . . . . . . . . . . . . . . . . . . . . . . . . 46 A7.6 Perceived Harm of Cigarette Smoking . . . . . . . . . . . . . . . . . . . . . . . . . 46 A7.7 Perceived Harm of E-Cigarette Use . . . . . . . . . . . . . . . . . . . . . . . . . . . 47 A7.8 Perceived Difficulty of Obtaining Cigarettes and E-Cigarettes . . . . . . . . . . . . . 48
8. Other Physical and Mental Health Risks . . . . . . . . . . . . . . . . . . . . . . . . . . . . . . 49 A8.1 Alone After School . . . . . . . . . . . . . . . . . . . . . . . . . . . . . . . . . . . 49 A8.2 Hours of Sleep . . . . . . . . . . . . . . . . . . . . . . . . . . . . . . . . . . . . . . 49 A8.3 Eating of Breakfast . . . . . . . . . . . . . . . . . . . . . . . . . . . . . . . . . . . 50 A8.4 Chronic Sad or Hopeless Feelings, Past 12 Months . . . . . . . . . . . . . . . . . . 50 A8.5 Seriously Considered Attempting Suicide, Past 12 Months . . . . . . . . . . . . . . 50 A8.6 Gang Involvement . . . . . . . . . . . . . . . . . . . . . . . . . . . . . . . . . . . . 50
9. Race/Ethnic Breakdowns . . . . . . . . . . . . . . . . . . . . . . . . . . . . . . . . . . . . . . 51 A9.1 School Supports and Engagement by Race/Ethnicity - 7th Grade . . . . . . . . . . . 51 A9.2 School Supports and Engagement by Race/Ethnicity - 9th Grade . . . . . . . . . . . 51 A9.3 School Supports and Engagement by Race/Ethnicity - 11th Grade . . . . . . . . . . . 52 A9.4 School Supports and Engagement by Race/Ethnicity - Non-Traditional . . . . . . . . 52 A9.5 Feeling Safe or Very Safe at School by Race/Ethnicity . . . . . . . . . . . . . . . . . 53 A9.6 Harassment Due to Six Reasons at School in the Past 12 Months by Race/Ethnicity . 53
III
A9.7 Any Harassment or Bullying at School in the Past 12 Months by Race/Ethnicity . . . 54 A9.8 Any Alcohol Use at School in the Past 30 Days by Race/Ethnicity . . . . . . . . . . 54 A9.9 Cigarette Smoking in the Past 30 Days by Race/Ethnicity . . . . . . . . . . . . . . . 55 A9.10 Any Alcohol Use in the Past 30 Days by Race/Ethnicity . . . . . . . . . . . . . . . . 55 A9.11 Any Marijuana Use in the Past 30 Days by Race/Ethnicity . . . . . . . . . . . . . . . 56 A9.12 Chronic Sad or Hopeless Feelings in the Past 12 Months by Race/Ethnicity . . . . . . 56
10. Gender Breakdowns . . . . . . . . . . . . . . . . . . . . . . . . . . . . . . . . . . . . . . . . 57 A10.1 School Supports and Engagement by Gender . . . . . . . . . . . . . . . . . . . . . . 57 A10.2 Perceived Safety, Harassment, AOD Use, and Mental Health Measures by Gender . . 58
Appendix I . . . . . . . . . . . . . . . . . . . . . . . . . . . . . . . . . . . . . . . . . . . . . . 59
Appendix II . . . . . . . . . . . . . . . . . . . . . . . . . . . . . . . . . . . . . . . . . . . . . . 60
Appendix III . . . . . . . . . . . . . . . . . . . . . . . . . . . . . . . . . . . . . . . . . . . . . 61
IV
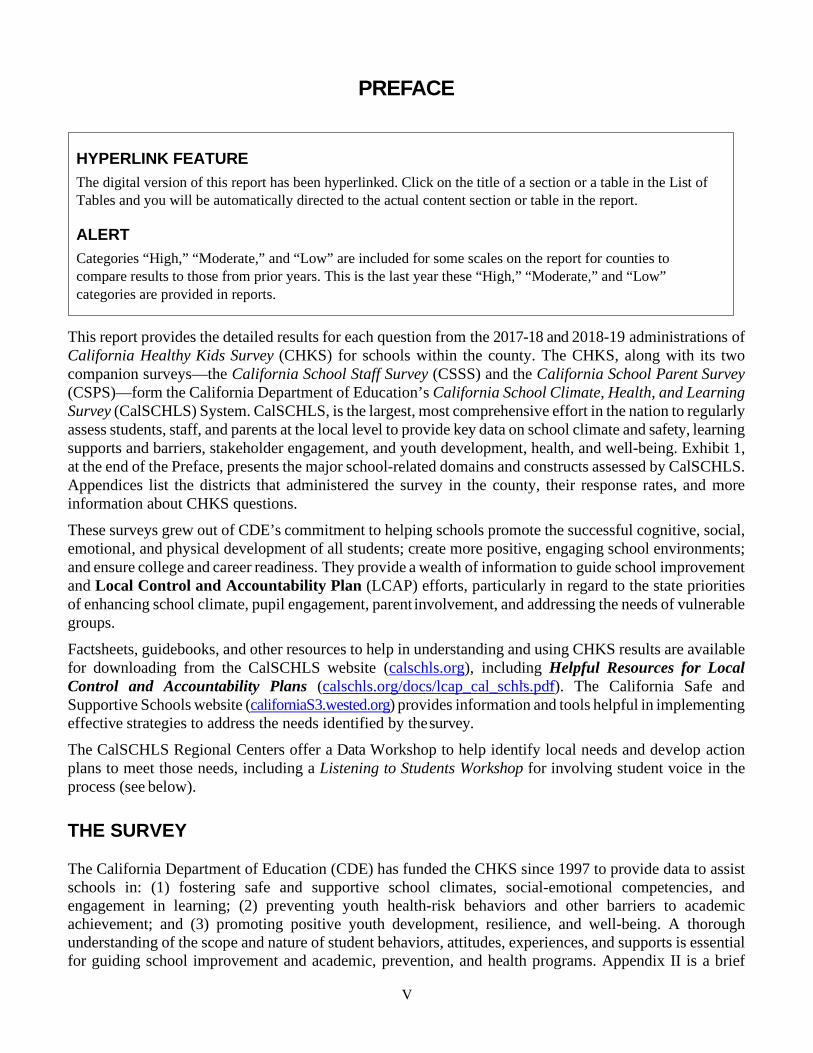
PREFACE
This report provides the detailed results for each question from the 2017-18 and 2018-19 administrations of California Healthy Kids Survey (CHKS) for schools within the county. The CHKS, along with its two companion surveys—the California School Staff Survey (CSSS) and the California School Parent Survey (CSPS)—form the California Department of Education’s California School Climate, Health, and Learning Survey (CalSCHLS) System. CalSCHLS, is the largest, most comprehensive effort in the nation to regularly assess students, staff, and parents at the local level to provide key data on school climate and safety, learning supports and barriers, stakeholder engagement, and youth development, health, and well-being. Exhibit 1, at the end of the Preface, presents the major school-related domains and constructs assessed by CalSCHLS. Appendices list the districts that administered the survey in the county, their response rates, and more information about CHKS questions.
These surveys grew out of CDE’s commitment to helping schools promote the successful cognitive, social, emotional, and physical development of all students; create more positive, engaging school environments; and ensure college and career readiness. They provide a wealth of information to guide school improvement and Local Control and Accountability Plan (LCAP) efforts, particularly in regard to the state priorities of enhancing school climate, pupil engagement, parent involvement, and addressing the needs of vulnerable groups.
Factsheets, guidebooks, and other resources to help in understanding and using CHKS results are available for downloading from the CalSCHLS website (calschls.org), including Helpful Resources for Local Control and Accountability Plans (calschls.org/docs/lcap_cal_schls.pdf). The California Safe and Supportive Schools website (californiaS3.wested.org) provides information and tools helpful in implementing effective strategies to address the needs identified by the survey.
The CalSCHLS Regional Centers offer a Data Workshop to help identify local needs and develop action plans to meet those needs, including a Listening to Students Workshop for involving student voice in the process (see below).
THE SURVEY The California Department of Education (CDE) has funded the CHKS since 1997 to provide data to assist schools in: (1) fostering safe and supportive school climates, social-emotional competencies, and engagement in learning; (2) preventing youth health-risk behaviors and other barriers to academic achievement; and (3) promoting positive youth development, resilience, and well-being. A thorough understanding of the scope and nature of student behaviors, attitudes, experiences, and supports is essential for guiding school improvement and academic, prevention, and health programs. Appendix II is a brief
HYPERLINK FEATURE The digital version of this report has been hyperlinked. Click on the title of a section or a table in the List of Tables and you will be automatically directed to the actual content section or table in the report.
ALERT Categories “High,” “Moderate,” and “Low” are included for some scales on the report for counties to compare results to those from prior years. This is the last year these “High,” “Moderate,” and “Low” categories are provided in reports.
V

guide to key CHKS Core Module indicators designed to help survey users more easily understand and interpret their findings. The CHKS is not just a standalone instrument but a data collection system that districts can customize to meet local needs and interests. The secondary-school CHKS consists of a required general Core Module and a series of optional, supplementary topic-focused modules that districts can elect to administer. Districts may also add their own questions of local interest in a custom module. Table 1 indicates the modules administered by districts in the county.
Core Module
As summarized in Appendix II, the Core Module consists of key questions, identified by an expert advisory committee, that are considered most important for schools to guide improvement of academic, health, and prevention programs and promote student achievement, college and career readiness, positive development, and well-being. The majority of the questions are school-specific, including the following indicators:
• student grades, truancy, attendance, academic motivation, and school connectedness, as indicators of engagement;
• developmental supports (protective factors) that promote positive academic, social, and emotional outcomes: experiences of caring adult relationships, high expectations, and opportunities for meaningful participation at school;
• perceived school safety, bullying, and victimization; and • violence perpetration, substance use, and crime-related behavior (e.g., weapons possession).
The Core Module also assesses the scope and nature of substance use and includes two key indicators of mental health: chronic sadness and contemplation of suicide. These questions provide insights into important barriers to learning and development.
A wide range of demographic questions help districts identify and address the needs of significant and vulnerable student subgroups, including those required to be included in LCAP efforts. These subgroups include race/ethnicity, gender, and socioeconomic status; homeless, migrant, and foster status; and English language proficiency.
What’s New? For 2018-19, the following improvements were made to the Core Module:
• Added a sleep duration question to help assess nighttime sleep quality • Added the high school suicide ideation to the middle school survey • Modified wording of two e-cigarette questions about perceived harm from use • Added “Juul” as an example on the e-cigarette use items
School Climate Module (Supplementary)
To further support school improvement efforts and the LCAP process, a supplementary School Climate Module is available. It provides additional data on student academic mindset, school academic supports, discipline/order, supports for social-emotional learning, bullying prevention, peer relationships, respect for diversity, and the quality of the physical environment (calschls.org/survey-administration/downloads/#ssm_sc). These questions are also included in the staff survey to provide a more comprehensive picture of stakeholder perceptions and how the perceptions of students and staff differ from each other.
Social Emotional Health Module (Supplementary)
The SEHM greatly enhances the value of the CHKS as a strength-based assessment of positive emotions,
VI

engagement, ability to build and maintain relationships, and other social-emotional capacities linked to student mental health and well-being, academic success, and college and career readiness. It includes 56 items that capture the totality of core adolescent psychological assets. The combination of the SEHM and Core Module yields a comprehensive set of data to inform decisions about mental health and social-emotional learning programs.
SURVEY ADMINISTRATION AND SAMPLE School staff administered the survey, following detailed instructions provided by CDE that were designed to assure the protection of all student and parental rights to privacy and to maintain confidentiality. Students were surveyed only with the consent of parents or guardians. Each student’s participation was voluntary, anonymous, and confidential.
• Table A1.1 reports numbers of districts, schools, and total responses for students who completed the survey.
• Appendices include: 1) all the districts serving secondary grades in the county that were eligible to participate in
the survey and the percentage of their enrolled students that completed the survey (included in the district report); and
2) a Survey Content Overview.
THE REPORT The report tables, organized by topic, provide the percentages responding to each question response option by grade level. Because it is just as important to identify the positive behaviors of youth as it is to identify the risks they face, the tables reporting risk-behavior data include the percentages of youth who responded negatively (did not engage in the behavior).
Racial/Ethnic and Gender Results
In this report, summary tables provide key findings (e.g., safety, harassment, developmental supports, school connectedness) disaggregated by race/ethnic categories and gender. Schools can request supplementary reports disaggregating all their CHKS results by the race/ethnicity or gender of students or by other demographic categories.
UNDERSTANDING THE DATA
Care must be taken to understand the factors that can impact the quality, validity, and generalizability of the results. These include changes that occur in survey content, administration, and/or sample characteristics between administrations. The following are a few of the key issues that should be kept in mind. A more detailed discussion of these topics can be found in the CHKS Guidebook to Data Use and Dissemination (data.calschls.org/resources/chks_guidebook_3_datause.pdf).
Representativeness
Among the most important factors affecting the quality of survey results is the level and type of student participation. The validity and representativeness of the results will be adversely affected if the student response rate is lower than 70 percent. One indication of the survey’s representativeness is how accurately the sample reflects the gender and ethnic composition of the student enrollment. Even if the response rate is low, the results provide an indication of what those students who did respond felt about the school and
VII

their experiences and behavior.
Changes Between Survey Administrations
Many factors besides real changes in behavior, attitudes, or experiences among students may account for changes in results from administration to administration. Changes may be due to differences over time in the characteristics or size of the sample of students who completed the survey, changes in the questions themselves, or differences between time periods in which the survey was administered (e.g., some risk behaviors tend to increase as students age, or may increase during holidays or social events).
RESOURCES CalSCHLS.org contains numerous guidebooks and other resources for using and understanding survey results.
• CHKS Guidebook to Data Use and Dissemination provides step-by-step instructions on how to interpret survey results and effectively disseminate them (data.calschls.org/resources/chks_guidebook_3_datause.pdf).
• CHKS factsheets analyze key topics at the state level, show how data variables are related, and offer suggestions for how data can be analyzed at the local level (calschls.org/resources/factsheets/).
• Assessing School Climate describes the value of the CalSCHLS student, staff, and parent surveys for assessing school climate, listing constructs and individual indicators (data.calschls.org/resources/Cal-SCHLS_AssessingClimate2013-14.pdf).
• Making Sense of School Climate provides a discussion of CalSCHLS survey items that relate to school climate (data.calschls.org/resources/S3_schoolclimateguidebook_final.pdf).
• Using CalSCHLS to Assess Social-Emotional Learning and Health describes how the CHKS Core and Social Emotional Health Module (SEHM) provide a comprehensive profile of student social-emotional competency (learning) and health, and the related supports schools provide, including questions aligned with the framework developed by the Collaborative for Academic, Social, and Emotional Learning (CASEL) (data.calschls.org/resources/CalSCHLS_AssessSELH.pdf). The staff survey provides data on the perception of adults in the school on social-emotional service needs and provision.
• Helpful Resources for Local Control and Accountability Plans describes how survey items align with LCAP priorities and indicators (calschls.org/docs/lcap_cal_schls.pdf). Also available is an LCAP-related PowerPoint presentation (calschls.org/site/assets/files/1036/cal-schls-lcap_schoolclimatev6-1.pptx).
• The School Climate Connection Newsletter provides monthly announcements of resources, tools, webinars and workshops, and research. Sign up on calschls.org/about.
• CDE’s California Safe and Supportive Schools website (CaliforniaS3.wested.org) contains a wealth of information and tools related to school climate improvement and social-emotional learning. It includes factsheets analyzing CalSCHLS data and What Works Briefs that provide guidance on strategies to implement.
• The CalSCHLS Item Crosswalk (calschls.org/resources/#survey_resources_and_tools) is a handy table listing all the constructs and questions that are on two or more of the CalSCHLS
VIII

surveys, along with the report table number where results can be found, to assist in the comparison of findings among students, staff, and parents.
NEXT STEPS Receiving this report is just a beginning step in a data-driven decision-making process of continuous improvement. The following describes some additional steps you should take and some custom services (additional fees apply) available from the CalSCHLS Regional Centers. These will help in fostering effective use of the results and provide additional information to support school and program improvement efforts and the LCAP process.
Engage Students, Staff, and Parents in Reviewing the Results and Action Planning
Engage students, parents, and school/community stakeholders in reviewing and exploring the meaning of the results. Obtain their input into how the school might better meet the identified needs. Engage them in developing a detailed action plan to guide school/community collaborative efforts. This communicates to stakeholders that you value their input into how to improve the school/community and gives them an opportunity for meaningful participation.
As part of this process, it is highly recommended that you conduct a structured Listening to Students Workshop designed to explore with students—as staff observe—the meaning of survey results and obtain student input on how to address the needs identified by the survey. WestEd staff also can conduct a Data Use Action Planning Workshop designed to identify local needs based on the survey results and engage adult stakeholders in developing a detailed plan and timetable for meeting those needs using evidence-based strategies. For more information, contact your CalSCHLS Regional Center 888.841.7536 or email [email protected].
Compare Results with Other Data
The value of your CHKS results will be greatly enhanced if examined in the context of the following sources of related data.
• Elementary CHKS Results. Examine how the results from 9th and 11th graders compare with those from 5th and 7th graders if your districts also administered the CHKS at these school levels. The elementary, middle, and high school surveys contain common indicators that will enable you to gain a sense of the developmental trajectory in these indicators and explore what programs at the elementary and middle-school levels might help mitigate problems that are evident among older students.
• Other Data. Examine how the results compare with other youth data collected within the county that relate to the variables assessed. Other relevant school-related data include discipline referrals, school demographic information, school vandalism costs, and behavioral observations in classrooms.
• Similar County and Statewide Results. The results from the biennial state administration of the CHKS, which provide representative state norms, can be downloaded from the CalSCHLS website (data.calschls.org/resources/Biennial_State_1517.pdf) or examined on the CalSCHLS Data Dashboard (calschls.org/reports-data/dashboard/). County comparisons can be made by downloading county reports from the CalSCHLS website (calschls.org/reports-data/search-lea-reports/) if a report is available.
IX

Data Workshop
To assist in your review of the survey results, you can request your CalSCHLS Regional Center to conduct a structured, customized Data Workshop. In this workshop, a survey specialist works with stakeholders to promote better understanding of the results and to identify local needs that need to be addressed. The workshops can also include engaging stakeholders in developing a detailed Action Plan and timetable for meeting those needs using evidence-based strategies. For more information, contact your CalSCHLS TA Center (888.841.7536) or email [email protected].
Request Additional Reports and Data
As you review your data with stakeholders, you may find that additional data needs emerge. The following custom services are available through the CalSCHLS Regional Centers to help delve more deeply into your survey results and foster more effective use of the results in support of school and program improvement efforts and the LCAP process.
Disaggregated Reports
The staff of the CalSCHLS Regional Centers can produce full reports that look at how results vary by demographic subgroups (e.g., race/ethnicity), or by other characteristics of youth, such as those who are low in academic motivation compared those who are high. This can be valuable for identifying what subgroups need to be targeted with what resources and programs. Given the LCAP requirement that districts identify and address the needs of underserved subgroups, doing this would be a natural next step for addressing subgroup disparities.
Additional Analysis of Data
The complete dataset is available electronically for additional analysis (CalSCHLS.org/reports-data). The dataset enables analyses of patterns in the results, how they are interrelated, and how they vary by different subgroups of students and across districts within a county. You can also request an analysis by WestEd staff of any topic of interest.
For more information about survey planning or technical assistance in understanding survey results and developing effective action plans to address identified needs, call the CalSCHLS helpline (888.841.7536) or email [email protected].
X
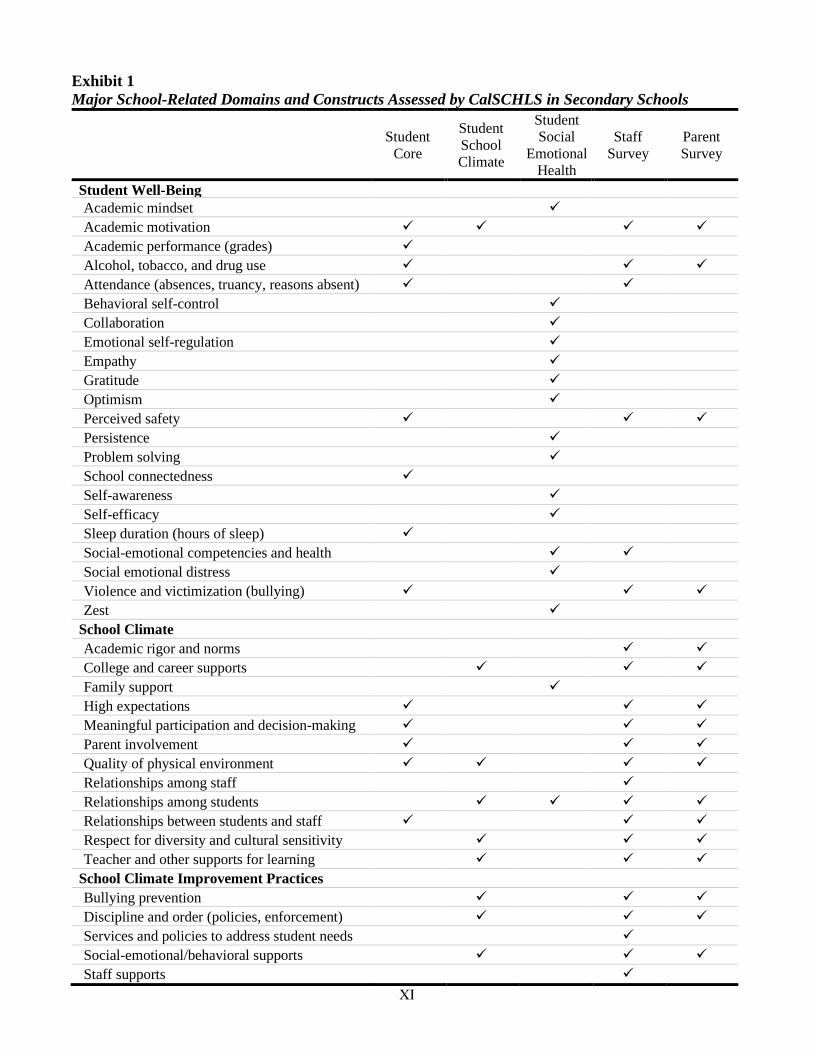
Exhibit 1 Major School-Related Domains and Constructs Assessed by CalSCHLS in Secondary Schools
Student Core
Student School Climate
Student Social
Emotional Health
Staff Survey
Parent Survey
Student Well-Being Academic mindset Academic motivation Academic performance (grades) Alcohol, tobacco, and drug use Attendance (absences, truancy, reasons absent) Behavioral self-control Collaboration Emotional self-regulation Empathy Gratitude Optimism Perceived safety Persistence Problem solving School connectedness Self-awareness Self-efficacy Sleep duration (hours of sleep) Social-emotional competencies and health Social emotional distress Violence and victimization (bullying) Zest
School Climate Academic rigor and norms College and career supports Family support High expectations Meaningful participation and decision-making Parent involvement Quality of physical environment Relationships among staff Relationships among students Relationships between students and staff Respect for diversity and cultural sensitivity Teacher and other supports for learning
School Climate Improvement Practices Bullying prevention Discipline and order (policies, enforcement) Services and policies to address student needs Social-emotional/behavioral supports Staff supports
XI
ACKNOWLEDGMENTS The CHKS and this report were developed by WestEd, in collaboration with Duerr Evaluation Resources, under contract from the California Department of Education, Coordinated School Health and Safety Office. Special recognition to Cindy Zheng, at WestEd, who oversees the generation of CalSCHLS reports and data quality assurance.
Gregory Austin, Ph.D.
Thomas Hanson, Ph.D. CalSCHLS Co-Directors, WestEd
Tom Herman Administrator, Coordinated School Health and Safety Office
California Department of Education
XII

Survey Module Administration
Table 1 CHKS Survey Modules Administered Survey Module Administered
A. Core (Required) X
B. Alcohol and Other Drugs (AOD) Module
C. Building Healthy Communities (BHC) Module
D. Cal-Well Module
E. Closing the Achievement Gap (CTAG) Module
F. District Afterschool Module (DASM)
G. Drug Free Communities (DFC) Module
H. Gang Risk Awareness Module (GRAM)
I. Gender Identity & Sexual Orientation-Based Harassment Module
J. Military-Connected School Module
K. Physical Health & Nutrition Module
L. Resilience & Youth Development Module
M. Safety & Violence Module
N. School Climate Module
O. Sexual Behavior Module
P. Social Emotional Health Module (SEHM)
Q. Tobacco Module
Z. Custom Questions
Orange County Page 1 2017-19 Main Report – Module A: Core

Core Module Results
1. Survey Sample
Table A1.1 Student Sample for Core Module
Number of districts Number of schools Number of students
Grade 7
18 94
38,593
Grade 9
13 64
39,008
Grade 11
13 66
34,958
NTA
11 15
2,276
Note: ANT includes continuation, community day, and other alternative school types.
Orange County Page 2 2017-19 Main Report – Module A: Core

2. Summary of Key Indicators
Table A2.1 Key Indicators of School Climate and Student Well-Being
Grade 7 Grade 9 Grade 11 NT Table % % % %
School Engagement and Supports School connectedness† 67 62 58 49 A4.6
Academic motivation† 78 73 70 61 A4.6
Chronic truancy (twice a month or more often)§ 2 3 6 26 A4.2
Caring adult relationships‡ 63 60 63 63 A4.5
High expectations‡ 76 71 71 66 A4.5
Meaningful participation‡ 32 28 28 26 A4.5
Facilities upkeep† 52 55 50 61 A4.13
Parent involvement in school† 62 52 46 49 A4.6
School Safety School perceived as very safe or safe 67 64 63 56 A5.1
Experienced any harassment or bullying§ 32 28 25 18 A5.2
Had mean rumors or lies spread about you§ 35 29 28 23 A5.3
Been afraid of being beaten up§ 19 12 7 11 A5.4
Been in a physical fight§ 12 8 5 21 A5.4
Seen a weapon on campus§ 11 9 8 19 A5.6
Substance Use and Mental Health Current alcohol or drug use¶ 5 11 19 44 A6.5
Current marijuana use¶ 3 7 12 39 A6.5
Current binge drinking¶ 1 3 7 24 A6.5
Very drunk or “high” 7 or more times, ever 1 4 10 34 A6.7
Been drunk or “high” on drugs at school, ever 2 5 9 33 A6.9
Current cigarette smoking¶ 1 1 2 16 A7.3
Current electronic cigarette use¶ 4 9 13 28 A7.3
Experienced chronic sadness/hopelessness§ 25 30 35 36 A8.4
Considered suicide§ 13 15 15 19 A8.5
Notes: Cells are empty if there are less than 10 respondents. †Average percent of respondents reporting “Agree” or “Strongly agree.” ‡Average percent of respondents reporting “Pretty much true” or “Very much true.” §Past 12 months. ¶Past 30 days.
Orange County Page 3 2017-19 Main Report – Module A: Core

3. Demographics
Table A3.1 Gender of Sample
Grade 7 Grade 9 Grade 11 NT % % % %
Male 51 51 50 63
Female 49 49 50 37
Question HS/MS A.3: What is your sex? Note: Cells are empty if there are less than 10 respondents.
Table A3.2 Hispanic or Latino
Grade 7 Grade 9 Grade 11 NT % % % %
No 49 52 52 28
Yes 51 48 48 72
Question HS/MS A.5: Are you of Hispanic or Latino origin? Note: Cells are empty if there are less than 10 respondents.
Table A3.3 Race
Grade 7 Grade 9 Grade 11 NT % % % %
American Indian or Alaska Native 6 8 8 11
Asian 18 19 19 4
Black or African American 3 2 2 4
Native Hawaiian or Pacific Islander 1 2 2 2
White 35 36 44 31
Mixed (two or more) races 38 33 25 48
Question HS/MS A.6: What is your race? Note: Cells are empty if there are less than 10 respondents.
Orange County Page 4 2017-19 Main Report – Module A: Core

Table A3.4 Living Situation
Grade 7 Grade 9 Grade 11 NT % % % %
A home with one or more parent or guardian 86 91 92 81
Other relative’s home 2 2 1 3
A home with more than one family 6 5 5 10
Friend’s home 0 0 0 1
Foster home, group care, or waiting placement 0 0 0 2
Hotel or motel 0 0 0 0
Shelter, car, campground, or other transitional or temporary housing 0 0 0 1
Other living arrangement 4 2 1 3
Question HS/MS A.8: What best describes where you live? A home includes a house, apartment, trailer, or mobile home. Note: Cells are empty if there are less than 10 respondents.
Table A3.5 Highest Education of Parents
Grade 7 Grade 9 Grade 11 NT % % % %
Did not finish high school 8 13 16 30
Graduated from high school 11 13 15 20
Attended college but did not complete four-year degree 8 10 13 12
Graduated from college 44 48 47 14
Don’t know 28 15 10 24
Question HS/MS A.9: What is the highest level of education your parents or guardians completed? (Mark the educational level of the parent or guardian who went the furthest in school.) Note: Cells are empty if there are less than 10 respondents.
Orange County Page 5 2017-19 Main Report – Module A: Core
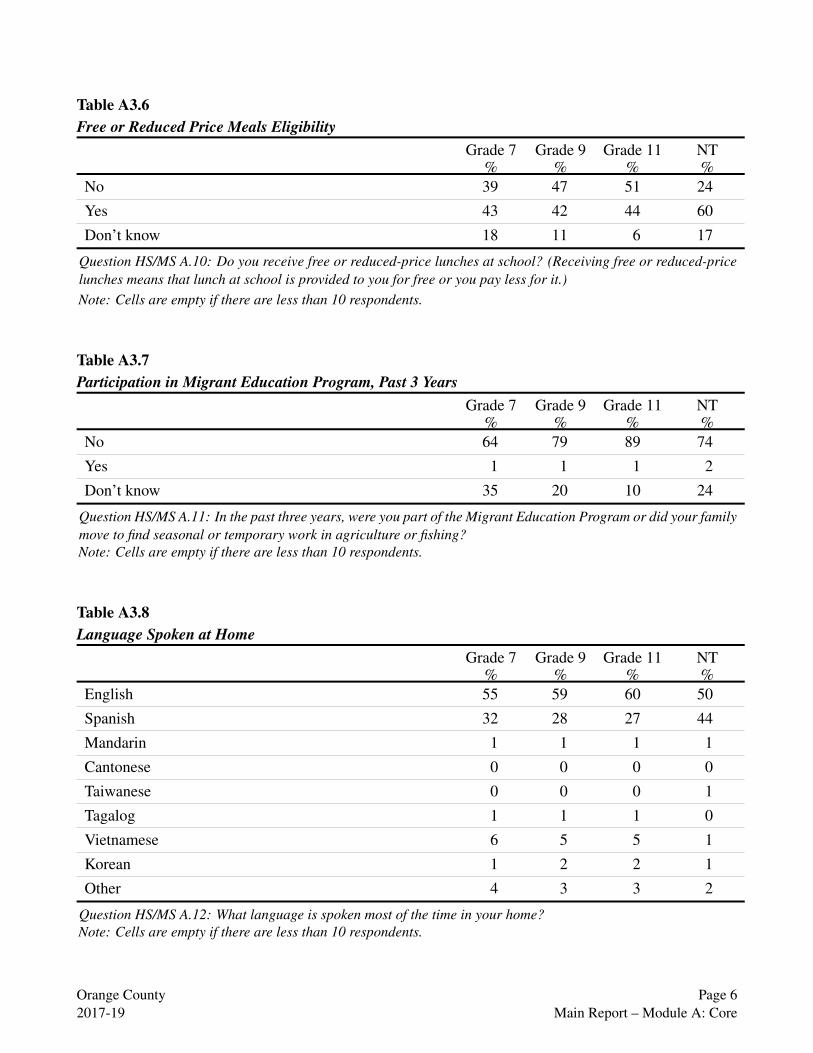
Table A3.6 Free or Reduced Price Meals Eligibility
Grade 7 Grade 9 Grade 11 NT % % % %
No 39 47 51 24
Yes 43 42 44 60
Don’t know 18 11 6 17
Question HS/MS A.10: Do you receive free or reduced-price lunches at school? (Receiving free or reduced-price lunches means that lunch at school is provided to you for free or you pay less for it.) Note: Cells are empty if there are less than 10 respondents.
Table A3.7 Participation in Migrant Education Program, Past 3 Years
Grade 7 Grade 9 Grade 11 NT % % % %
No 64 79 89 74
Yes 1 1 1 2
Don’t know 35 20 10 24
Question HS/MS A.11: In the past three years, were you part of the Migrant Education Program or did your family move to find seasonal or temporary work in agriculture or fishing? Note: Cells are empty if there are less than 10 respondents.
Table A3.8 Language Spoken at Home
Grade 7 Grade 9 Grade 11 NT % % % %
English 55 59 60 50
Spanish 32 28 27 44
Mandarin 1 1 1 1
Cantonese 0 0 0 0
Taiwanese 0 0 0 1
Tagalog 1 1 1 0
Vietnamese 6 5 5 1
Korean 1 2 2 1
Other 4 3 3 2
Question HS/MS A.12: What language is spoken most of the time in your home? Note: Cells are empty if there are less than 10 respondents.
Orange County Page 6 2017-19 Main Report – Module A: Core

Table A3.9 English Language Proficiency – All Students
Grade 7 Grade 9 Grade 11 NT % % % %
How well do you... understand English?
Very well 87 89 91 84
Well 12 10 8 14
Not well 1 1 1 2
Not at all 0 0 0 1
speak English? Very well 80 84 86 75
Well 18 14 12 21
Not well 2 2 1 2
Not at all 0 0 0 1
read English? Very well 78 82 84 72
Well 19 16 14 23
Not well 2 2 2 4
Not at all 0 0 0 1
write English? Very well 73 76 79 69
Well 24 21 18 25
Not well 3 3 2 5
Not at all 0 0 0 1
English Language Proficiency Status Proficient 76 80 83 70
Not proficient 24 20 17 30
Question HS/MS A.13-16: How well do you understand, speak, read, and write English?... Understand English... Speak English... Read English... Write English. Notes: Cells are empty if there are less than 10 respondents. English Language Proficiency was determined by creating a scale score using four survey questions - how well do you understand... speak... read... and write English. Response options are reverse coded so higher values indicate higher English proficiency level (“Not at all” (1); “Not well” (2); “Well” (3); and “Very well” (4)). The scale score was computed by averaging the survey responses. Respondents are categorized as “Proficient” or “Not Proficient” based on the English language proficiency scale. Proficient: students with average item response > 3.5; and Not Proficient: students with average item response < 3.5.
Orange County Page 7 2017-19 Main Report – Module A: Core

Table A3.10 English Language Proficiency – Students Speaking a Language Other Than English at Home
Grade 7 Grade 9 Grade 11 NT % % % %
How well do you... understand English?
Very well 78 81 82 80
Well 20 17 16 17
Not well 1 2 1 3
Not at all 0 0 0 0
speak English? Very well 68 71 74 67
Well 29 25 23 29
Not well 3 3 3 3
Not at all 0 1 0 1
read English? Very well 67 69 72 64
Well 29 27 24 30
Not well 4 3 3 5
Not at all 1 0 0 1
write English? Very well 60 62 65 59
Well 34 32 30 34
Not well 5 5 4 7
Not at all 1 1 1 1
English Language Proficiency Status Proficient 63 66 70 62
Not proficient 37 34 30 38
Question HS/MS A.12-16: What language is spoken most of the time in your home?... How well do you understand, speak, read, and write English?... Understand English... Speak English... Read English... Write English. Notes: Cells are empty if there are less than 10 respondents. English Language Proficiency was determined by creating a scale score using four survey questions - how well do you understand... speak... read... and write English. Response options are reverse coded so higher values indicate higher English proficiency level (“Not at all” (1); “Not well” (2); “Well” (3); and “Very well” (4)). The scale score was computed by averaging the survey responses. Respondents are categorized as “Proficient” or “Not Proficient” based on the English language proficiency scale. Proficient: students with average item response > 3.5; and Not Proficient: students with average item response < 3.5.
Orange County Page 8 2017-19 Main Report – Module A: Core

Table A3.11 Number of Days Attending Afterschool Program
Grade 7 Grade 9 Grade 11 NT % % % %
0 days 76 72 75 84
1 day 5 4 5 3
2 days 5 4 5 2
3 days 3 4 3 2
4 days 2 3 2 2
5 days 10 13 9 7
Question HS/MS A.17: How many days a week do you usually go to your school’s afterschool program? Note: Cells are empty if there are less than 10 respondents.
Table A3.12 Military Connections
Grade 7 Grade 9 Grade 11 NT % % % %
No 91 94 96 91
Yes 4 3 2 4
Don’t know 5 3 1 5
Question HS A.129/MS A.119: Is your father, mother, or guardian currently in the military (Army, Navy, Marines, Air Force, National Guard, or Reserves)? Note: Cells are empty if there are less than 10 respondents.
Orange County Page 9 2017-19 Main Report – Module A: Core

Table A3.13 Sexual Orientation
Grade 7 Grade 9 Grade 11 NT % % % %
Straight (not gay) 82 85 85 79
Gay or Lesbian 1 1 2 3
Bisexual 3 5 5 8
I am not sure yet 6 4 4 3
Something else 2 1 1 3
Decline to respond 7 3 3 4
Question HS A.130/MS A.120: Which of the following best describes you? Notes: Cells are empty if there are less than 10 respondents;
Table A3.14 Gender Identity
Grade 7 Grade 9 Grade 11 NT % % % %
No, I am not transgender 93 95 96 88
Yes, I am transgender 1 1 1 4
I am not sure if I am transgender 2 1 1 2
Decline to respond 4 2 2 5
Question HS A.131/MS A.121: Some people describe themselves as transgender when their sex at birth does not match the way they think or feel about their gender. Are you transgender? Notes: Cells are empty if there are less than 10 respondents;
Orange County Page 10 2017-19 Main Report – Module A: Core

4. School Performance, Supports, and Engagement
Table A4.1 Grades, Past 12 Months
Mostly A’s
A’s and B’s
Grade 7 % 26
38
Grade 9 % 26
34
Grade 11 % 19
35
NT % 8
14
Mostly B’s
B’s and C’s
7
17
7
18
11
21
9
23
Mostly C’s
C’s and D’s
3
6
4
7
6
7
9
21
Mostly D’s
Mostly F’s
1
2
2
2
1
1
7
10
Question HS/MS A.18: During the past 12 months, how would you describe the grades you mostly received in school? Note: Cells are empty if there are less than 10 respondents.
Table A4.2 Truancy, Past 12 Months
Grade 7 Grade 9 Grade 11 NT % % % %
0 times 78 76 67 45
1-2 times 12 12 14 10
A few times 7 8 11 17
Once a month 1 1 2 2
Twice a month 1 1 2 4
Once a week 0 1 1 5
More than once a week 1 1 2 18
Question HS/MS A.21: During the past 12 months, about how many times did you skip school or cut classes? Note: Cells are empty if there are less than 10 respondents.
Orange County Page 11 2017-19 Main Report – Module A: Core
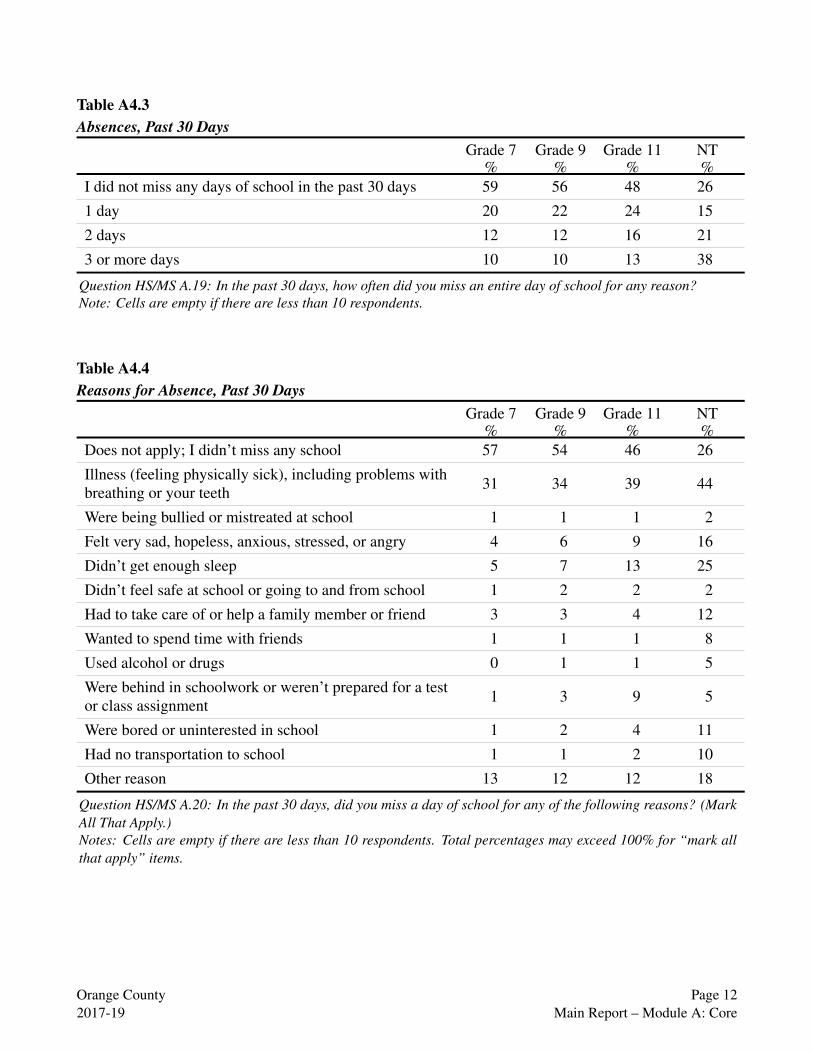
Table A4.3 Absences, Past 30 Days
Grade 7 Grade 9 Grade 11 NT % % % %
I did not miss any days of school in the past 30 days 59 56 48 26
1 day 20 22 24 15
2 days 12 12 16 21
3 or more days 10 10 13 38
Question HS/MS A.19: In the past 30 days, how often did you miss an entire day of school for any reason? Note: Cells are empty if there are less than 10 respondents.
Table A4.4 Reasons for Absence, Past 30 Days
Grade 7 Grade 9 Grade 11 NT % % % %
Does not apply; I didn’t miss any school 57 54 46 26
Illness (feeling physically sick), including problems with breathing or your teeth 31 34 39 44
Were being bullied or mistreated at school 1 1 1 2
Felt very sad, hopeless, anxious, stressed, or angry 4 6 9 16
Didn’t get enough sleep 5 7 13 25
Didn’t feel safe at school or going to and from school 1 2 2 2
Had to take care of or help a family member or friend 3 3 4 12
Wanted to spend time with friends 1 1 1 8
Used alcohol or drugs 0 1 1 5
Were behind in schoolwork or weren’t prepared for a test or class assignment 1 3 9 5
Were bored or uninterested in school 1 2 4 11
Had no transportation to school 1 1 2 10
Other reason 13 12 12 18
Question HS/MS A.20: In the past 30 days, did you miss a day of school for any of the following reasons? (Mark All That Apply.) Notes: Cells are empty if there are less than 10 respondents. Total percentages may exceed 100% for “mark all that apply” items.
Orange County Page 12 2017-19 Main Report – Module A: Core
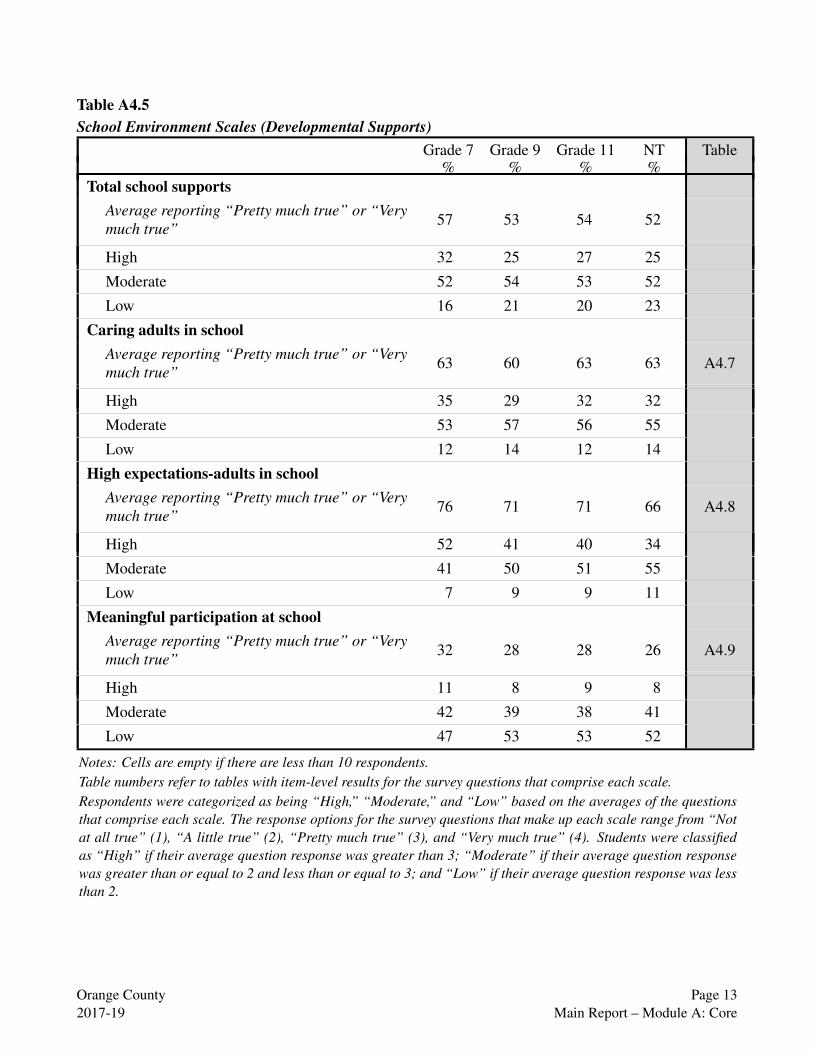
Table A4.5 School Environment Scales (Developmental Supports)
Grade 7 Grade 9 Grade 11 NT Table % % % %
Total school supports Average reporting “Pretty much true” or “Very much true” 57 53 54 52
High 32 25 27 25
Moderate 52 54 53 52
Low 16 21 20 23
Caring adults in school Average reporting “Pretty much true” or “Very much true” 63 60 63 63 A4.7
High 35 29 32 32
Moderate 53 57 56 55
Low 12 14 12 14
High expectations-adults in school Average reporting “Pretty much true” or “Very much true” 76 71 71 66 A4.8
High 52 41 40 34
Moderate 41 50 51 55
Low 7 9 9 11
Meaningful participation at school Average reporting “Pretty much true” or “Very much true” 32 28 28 26 A4.9
High 11 8 9 8
Moderate 42 39 38 41
Low 47 53 53 52
Notes: Cells are empty if there are less than 10 respondents. Table numbers refer to tables with item-level results for the survey questions that comprise each scale. Respondents were categorized as being “High,” “Moderate,” and “Low” based on the averages of the questions that comprise each scale. The response options for the survey questions that make up each scale range from “Not at all true” (1), “A little true” (2), “Pretty much true” (3), and “Very much true” (4). Students were classified as “High” if their average question response was greater than 3; “Moderate” if their average question response was greater than or equal to 2 and less than or equal to 3; and “Low” if their average question response was less than 2.
Orange County Page 13 2017-19 Main Report – Module A: Core

Table A4.6 School Connectedness, Academic Motivation, and Parent Involvement Scales
Grade 7 Grade 9 Grade 11 NT Table % % % %
School connectedness Average reporting “Agree” or “Strongly agree” 67 62 58 49 A4.10
High 59 52 47 36
Moderate 34 40 43 51
Low 7 8 10 13
Academic motivation Average reporting “Agree” or “Strongly agree” 78 73 70 61 A4.11
High 42 33 28 18
Moderate 41 45 47 46
Low 17 22 26 36
Parent involvement in school Average reporting “Agree” or “Strongly agree” 62 52 46 49 A4.12
High 48 36 30 35
Moderate 40 47 47 49
Low 12 17 23 16
Notes: Cells are empty if there are less than 10 respondents. Table numbers refer to tables with item-level results for the survey questions that comprise each scale. Respondents were categorized as being “High,” “Moderate,” and “Low” based on the averages of the questions that comprise each scale. The response options for the survey questions that make up each scale range from “Strongly disagree” (1), “Disagree” (2), “Neither disagree nor agree” (3), “Agree” (4), and “Strongly agree” (5). The following thresholds were used to classify question averages into “High,” “Moderate,” and “Low” categories:
School Connectedness Academic Motivation Parent Involvement in School High > 3.75 > 4.25 ≥ 4 Moderate ≥ 2.5 and ≤ 3.75 > 3.25 and ≤ 4.25 ≥ 3 and < 4 Low < 2.5 ≤ 3.25 < 3
Orange County Page 14 2017-19 Main Report – Module A: Core

Table A4.7 Caring Relationships Scale Questions
Grade 7 Grade 9 Grade 11 NT % % % %
Caring adults in school Average reporting “Pretty much true” or “Very much true” 63 60 63 63
At my school, there is a teacher or some other adult... who really cares about me.
Not at all true 11 12 9 13
A little true 30 32 30 27
Pretty much true 35 35 35 36
Very much true 24 21 26 24
who notices when I’m not there. Not at all true 13 15 13 13
A little true 26 30 29 24
Pretty much true 32 33 34 34
Very much true 28 22 24 29
who listens to me when I have something to say. Not at all true 9 9 7 12
A little true 21 23 22 23
Pretty much true 35 37 39 36
Very much true 36 30 31 30
Question HS/MS A.35, 37, 39: At my school, there is a teacher or some other adult... who really cares about me... who notices when I am not there... who listens to me when I have something to say. Note: Cells are empty if there are less than 10 respondents.
Orange County Page 15 2017-19 Main Report – Module A: Core

Table A4.8 High Expectations Scale Questions
Grade 7 Grade 9 Grade 11 NT % % % %
High expectations-adults in school Average reporting “Pretty much true” or “Very much true” 76 71 71 66
At my school, there is a teacher or some other adult... who tells me when I do a good job.
Not at all true 8 9 9 12
A little true 21 25 25 26
Pretty much true 37 39 39 36
Very much true 34 28 28 27
who always wants me to do my best. Not at all true 4 5 5 9
A little true 13 17 18 20
Pretty much true 30 37 38 37
Very much true 52 41 39 34
who believes that I will be a success. Not at all true 8 9 8 12
A little true 17 21 22 24
Pretty much true 32 36 36 33
Very much true 44 34 33 31
Question HS/MS A.36, 38, 40: At my school, there is a teacher or some other adult... who tells me when I do a good job... who always wants me to do my best... who believes that I will be a success. Note: Cells are empty if there are less than 10 respondents.
Orange County Page 16 2017-19 Main Report – Module A: Core

Table A4.9 Meaningful Participation Scale Questions
Grade 7 Grade 9 Grade 11 NT % % % %
Meaningful participation at school Average reporting “Pretty much true” or “Very much true” 32 28 28 26
At school... I do interesting activities.
Not at all true 15 17 19 29
A little true 30 29 30 38
Pretty much true 32 29 29 22
Very much true 23 25 23 12
I help decide things like class activities or rules. Not at all true 47 52 50 48
A little true 29 28 28 29
Pretty much true 16 14 14 16
Very much true 9 7 8 7
I do things that make a difference. Not at all true 26 32 32 36
A little true 36 37 37 36
Pretty much true 24 21 20 20
Very much true 13 10 11 8
I have a say in how things work. Not at all true 39 45 45 43
A little true 32 31 31 29
Pretty much true 20 17 16 20
Very much true 10 7 8 8
I help decide school activities or rules. Not at all true 64 69 66 56
A little true 21 20 20 25
Pretty much true 9 8 8 12
Very much true 6 4 5 6
Question HS/MS A.41-45: At school... I do interesting activities... I help decide things like class activities or rules... I do things that make a difference... I have a say in how things work... I help decide school activities or rules. Note: Cells are empty if there are less than 10 respondents.
Orange County Page 17 2017-19 Main Report – Module A: Core
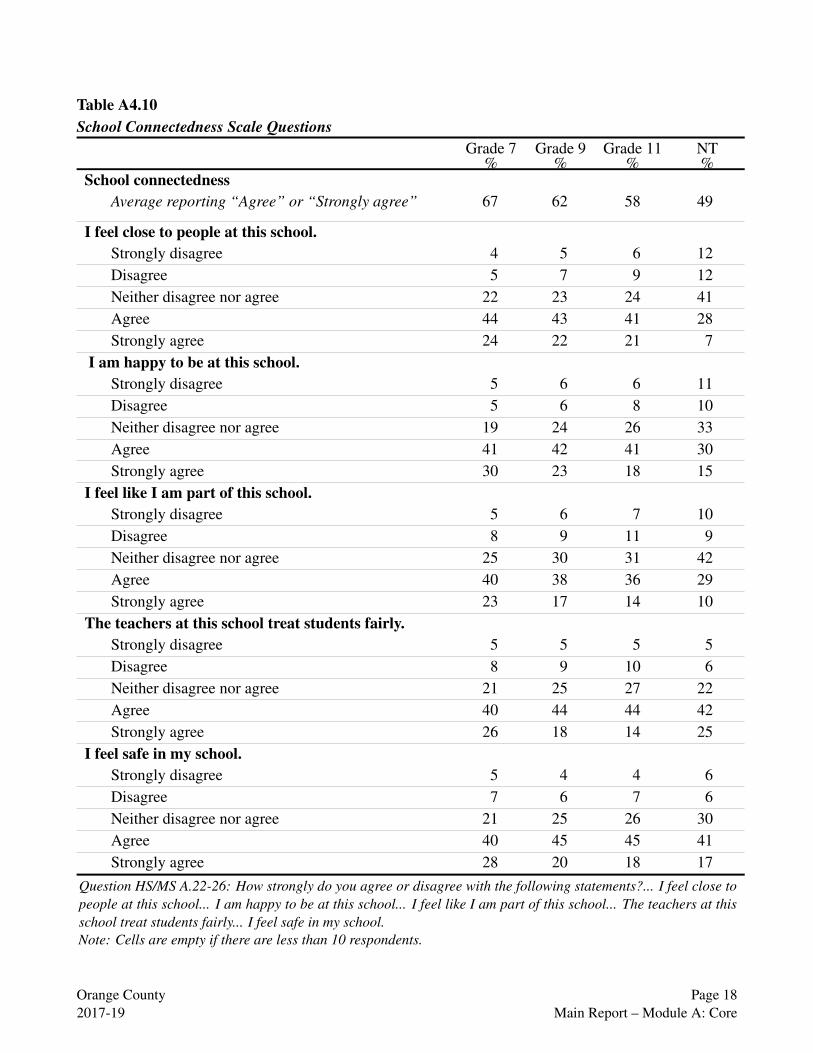
Table A4.10 School Connectedness Scale Questions
Grade 7 Grade 9 Grade 11 NT % % % %
School connectedness Average reporting “Agree” or “Strongly agree” 67 62 58 49
I feel close to people at this school. Strongly disagree 4 5 6 12 Disagree 5 7 9 12 Neither disagree nor agree 22 23 24 41 Agree 44 43 41 28 Strongly agree 24 22 21 7
I am happy to be at this school. Strongly disagree 5 6 6 11 Disagree 5 6 8 10 Neither disagree nor agree 19 24 26 33 Agree 41 42 41 30 Strongly agree 30 23 18 15
I feel like I am part of this school. Strongly disagree 5 6 7 10 Disagree 8 9 11 9 Neither disagree nor agree 25 30 31 42 Agree 40 38 36 29 Strongly agree 23 17 14 10
The teachers at this school treat students fairly. Strongly disagree 5 5 5 5 Disagree 8 9 10 6 Neither disagree nor agree 21 25 27 22 Agree 40 44 44 42 Strongly agree 26 18 14 25
I feel safe in my school. Strongly disagree 5 4 4 6 Disagree 7 6 7 6 Neither disagree nor agree 21 25 26 30 Agree 40 45 45 41 Strongly agree 28 20 18 17
Question HS/MS A.22-26: How strongly do you agree or disagree with the following statements?... I feel close to people at this school... I am happy to be at this school... I feel like I am part of this school... The teachers at this school treat students fairly... I feel safe in my school. Note: Cells are empty if there are less than 10 respondents.
Orange County Page 18 2017-19 Main Report – Module A: Core
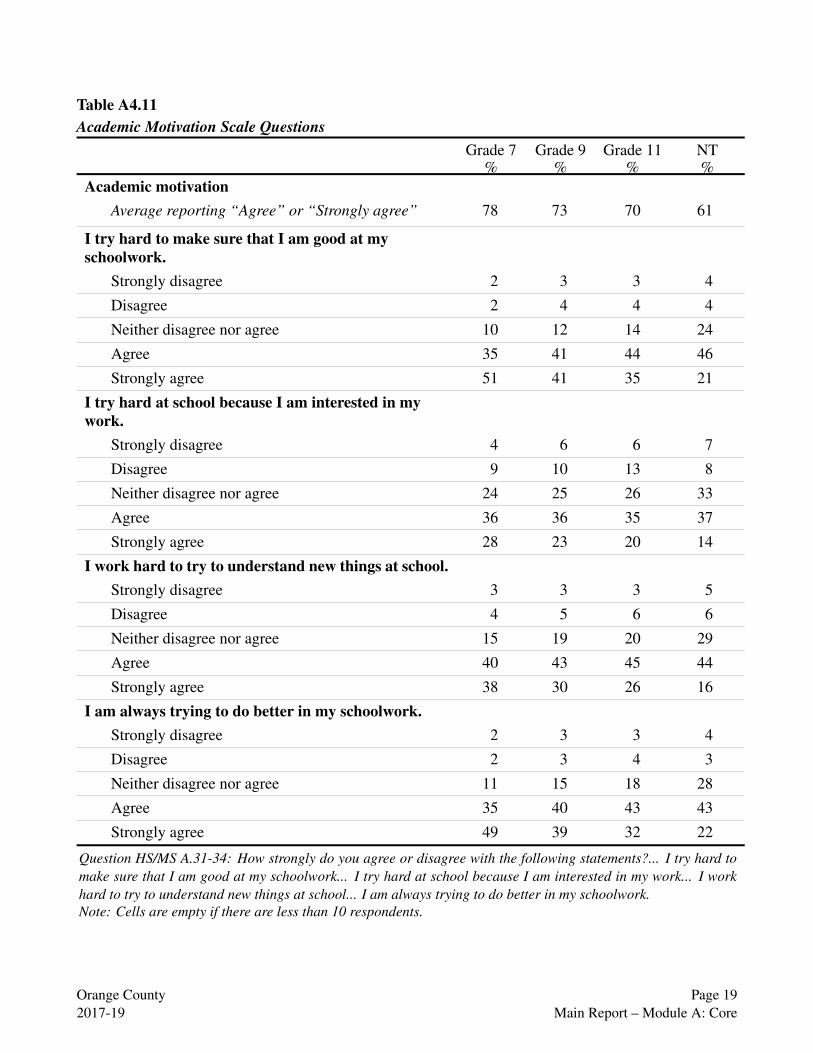
Table A4.11 Academic Motivation Scale Questions
Grade 7 Grade 9 Grade 11 NT % % % %
Academic motivation Average reporting “Agree” or “Strongly agree” 78 73 70 61
I try hard to make sure that I am good at my schoolwork.
Strongly disagree 2 3 3 4
Disagree 2 4 4 4
Neither disagree nor agree 10 12 14 24
Agree 35 41 44 46
Strongly agree 51 41 35 21
I try hard at school because I am interested in my work.
Strongly disagree 4 6 6 7
Disagree 9 10 13 8
Neither disagree nor agree 24 25 26 33
Agree 36 36 35 37
Strongly agree 28 23 20 14
I work hard to try to understand new things at school. Strongly disagree 3 3 3 5
Disagree 4 5 6 6
Neither disagree nor agree 15 19 20 29
Agree 40 43 45 44
Strongly agree 38 30 26 16
I am always trying to do better in my schoolwork. Strongly disagree 2 3 3 4
Disagree 2 3 4 3
Neither disagree nor agree 11 15 18 28
Agree 35 40 43 43
Strongly agree 49 39 32 22
Question HS/MS A.31-34: How strongly do you agree or disagree with the following statements?... I try hard to make sure that I am good at my schoolwork... I try hard at school because I am interested in my work... I work hard to try to understand new things at school... I am always trying to do better in my schoolwork. Note: Cells are empty if there are less than 10 respondents.
Orange County Page 19 2017-19 Main Report – Module A: Core

Table A4.12 Parent Involvement Scale Questions
Grade 7 Grade 9 Grade 11 NT % % % %
Parent involvement in school Average reporting “Agree” or “Strongly agree” 62 52 46 49
Teachers at this school communicate with parents about what students are expected to learn in class.
Strongly disagree 4 5 6 6
Disagree 6 11 14 8
Neither disagree nor agree 23 31 33 34
Agree 41 38 35 35
Strongly agree 26 15 11 17
Parents feel welcome to participate at this school. Strongly disagree 4 4 4 7
Disagree 5 6 8 7
Neither disagree nor agree 31 38 40 44
Agree 39 37 36 30
Strongly agree 22 15 11 12
School staff takes parent concerns seriously. Strongly disagree 4 5 7 5
Disagree 7 9 12 5
Neither disagree nor agree 30 36 36 36
Agree 37 35 34 38
Strongly agree 21 15 11 15
Question HS/MS A.28-30: How strongly do you agree or disagree with the following statements?... Teachers at this school communicate with parents about what students are expected to learn in class... Parents feel welcome to participate at this school... School staff takes parent concerns seriously. Note: Cells are empty if there are less than 10 respondents.
Orange County Page 20 2017-19 Main Report – Module A: Core
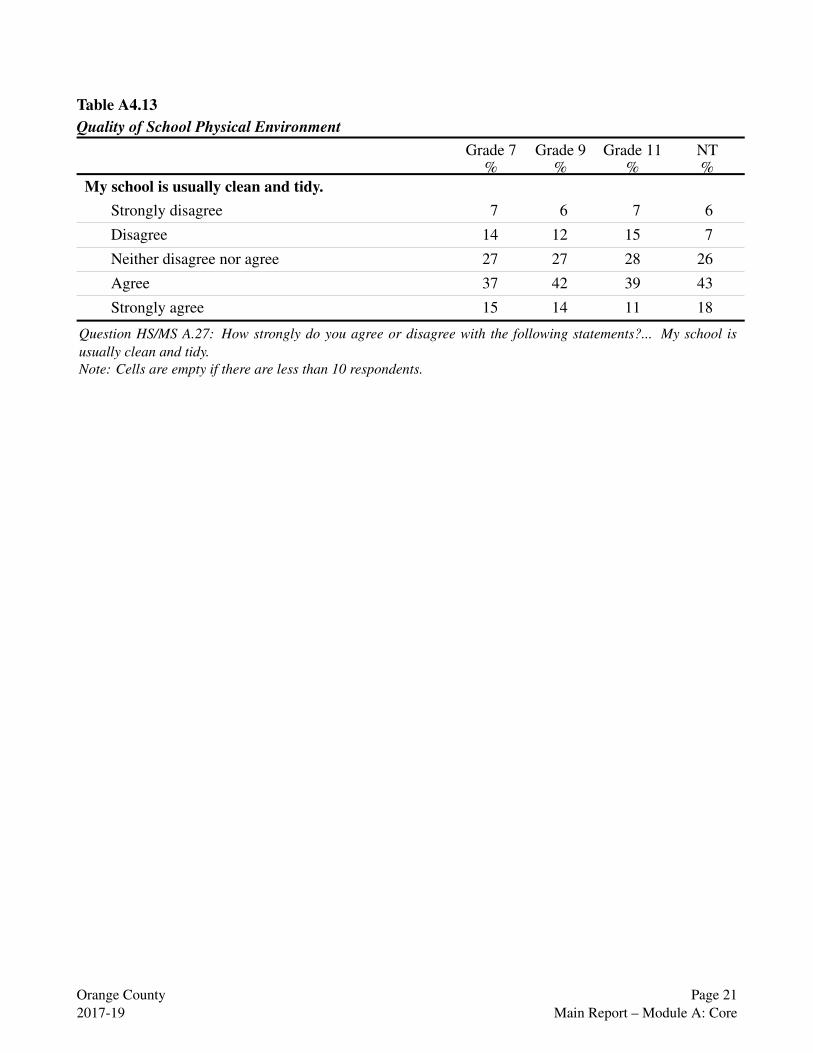
Table A4.13 Quality of School Physical Environment
Grade 7 Grade 9 Grade 11 NT % % % %
My school is usually clean and tidy. Strongly disagree 7 6 7 6
Disagree 14 12 15 7
Neither disagree nor agree 27 27 28 26
Agree 37 42 39 43
Strongly agree 15 14 11 18
Question HS/MS A.27: How strongly do you agree or disagree with the following statements?... My school is usually clean and tidy. Note: Cells are empty if there are less than 10 respondents.
Orange County Page 21 2017-19 Main Report – Module A: Core

5. School Violence, Victimization, and Safety
Table A5.1 Perceived Safety at School
Grade 7 Grade 9 Grade 11 NT % % % %
Very safe 23 17 18 23
Safe 44 47 44 32
Neither safe nor unsafe 26 30 31 37
Unsafe 4 4 4 4
Very unsafe 3 2 2 3
Question HS A.99/MS A.88: How safe do you feel when you are at school? Note: Cells are empty if there are less than 10 respondents.
Orange County Page 22 2017-19 Main Report – Module A: Core

Table A5.2 Reasons for Harassment on School Property, Past 12 Months
Grade 7 Grade 9 Grade 11 NT % % % %
Race, ethnicity, or national origin 0 times 87 87 89 92
1 time 6 5 5 3
2 or more times 7 7 7 5
Religion 0 times 94 94 94 94
1 time 3 3 3 3
2 or more times 3 3 4 3
Gender 0 times 93 94 94 94
1 time 4 3 2 3
2 or more times 3 3 3 3
Because you are gay or lesbian or someone thought you were
0 times 91 93 94 93
1 time 4 3 2 3
2 or more times 5 4 3 4
A physical or mental disability 0 times 96 96 97 94
1 time 2 2 2 4
2 or more times 2 2 2 2
You are an immigrant or someone thought you were 0 times 96 96 95 93
1 time 2 2 2 3
2 or more times 2 2 3 3
Any of the above six reasons 24 22 21 15
Question HS A.115-120/MS A.105-110: During the past 12 months, how many times on school property were you harassed or bullied for any of the following reasons?... Your race, ethnicity, or national origin... Your religion... Your gender... Because you are gay or lesbian or someone thought you were... A physical or mental disability... You are an immigrant or someone thought you were. Note: Cells are empty if there are less than 10 respondents.
Orange County Page 23 2017-19 Main Report – Module A: Core

Table A5.2 Reasons for Harassment on School Property, Past 12 Months – Continued
Grade 7 Grade 9 Grade 11 NT % % % %
Any other reason 0 times 80 84 87 89
1 time 8 6 5 3
2 or more times 12 10 8 8
Any harassment 32 28 25 18
Question HS A.115-121/MS A.105-111: During the past 12 months, how many times on school property were you harassed or bullied for any of the following reasons?... Your race, ethnicity, or national origin... Your religion... Your gender... Because you are gay or lesbian or someone thought you were... A physical or mental disability... You are an immigrant or someone thought you were... Any other reason. Note: Cells are empty if there are less than 10 respondents.
Orange County Page 24 2017-19 Main Report – Module A: Core

Table A5.3 Verbal Harassment at School, Past 12 Months
Grade 7 Grade 9 Grade 11 NT % % % %
During the past 12 months, how many times on school property have you... had mean rumors or lies spread about you?
0 times 65 71 72 77
1 time 17 14 13 9
2 to 3 times 9 8 9 7
4 or more times 9 7 7 7
had sexual jokes, comments, or gestures made to you? 0 times 74 74 75 81
1 time 11 9 8 5
2 to 3 times 6 7 7 7
4 or more times 9 10 9 7
been made fun of because of your looks or the way you talk?
0 times 69 72 76 83
1 time 13 11 10 7
2 to 3 times 7 7 7 4
4 or more times 10 9 8 6
been made fun of, insulted, or called names? 0 times 64 72 77 80
1 time 14 10 8 8
2 to 3 times 9 7 7 4
4 or more times 14 11 9 8
Question HS A.103-105, 114/MS A.93-95, 104: During the past 12 months, how many times on school property have you... had mean rumors or lies spread about you... had sexual jokes, comments, or gestures made to you... been made fun of because of your looks or the way you talk... been made fun of, insulted, or called names? Note: Cells are empty if there are less than 10 respondents.
Orange County Page 25 2017-19 Main Report – Module A: Core

Table A5.4 Violence and Victimization on School Property, Past 12 Months
Grade 7 Grade 9 Grade 11 NT % % % %
During the past 12 months, how many times on school property have you... been pushed, shoved, slapped, hit, or kicked by someone who wasn’t just kidding around?
0 times 73 84 90 87 1 time 13 9 6 6 2 to 3 times 7 4 3 3 4 or more times 7 4 2 4
been afraid of being beaten up? 0 times 81 88 93 89 1 time 10 7 4 4 2 to 3 times 4 3 1 4 4 or more times 4 2 1 3
been threatened with harm or injury? 0 times 91 94 95 89 1 time 5 3 2 4 2 to 3 times 2 2 1 4 4 or more times 2 1 1 3
been in a physical fight? 0 times 88 92 95 79 1 time 7 5 3 8 2 to 3 times 3 2 1 6 4 or more times 2 1 1 7
been threatened or injured with a weapon (gun, knife, club, etc.)?
0 times 97 97 98 90 1 time 2 2 1 4 2 to 3 times 1 1 0 3 4 or more times 0 0 0 3
been offered, sold, or given an illegal drug? 0 times 92 83 81 74 1 time 4 8 7 7 2 to 3 times 2 5 5 9 4 or more times 2 5 6 11
Question HS A.100-102, 107, 111, 113/MS A.90-92, 97, 101, 103: During the past 12 months, how many times on school property have you... been pushed, shoved, slapped, hit, or kicked by someone who wasn’t just kidding around... been afraid of being beaten up... been in a physical fight... been offered, sold, or given an illegal drug... been threatened or injured with a weapon (gun, knife, club, etc.) ... been threatened with harm or injury? Note: Cells are empty if there are less than 10 respondents.
Orange County Page 26 2017-19 Main Report – Module A: Core
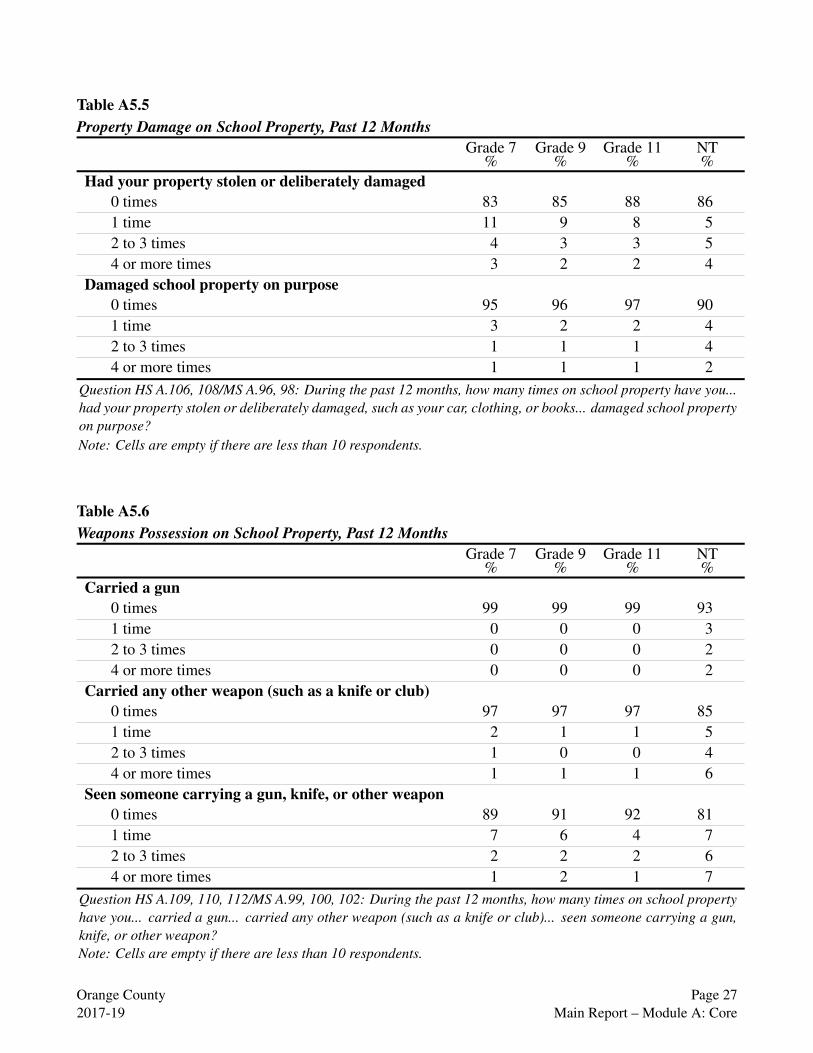
Table A5.5 Property Damage on School Property, Past 12 Months
Grade 7 Grade 9 Grade 11 NT % % % %
Had your property stolen or deliberately damaged 0 times 83 85 88 86 1 time 11 9 8 5 2 to 3 times 4 3 3 5 4 or more times 3 2 2 4
Damaged school property on purpose 0 times 95 96 97 90 1 time 3 2 2 4 2 to 3 times 1 1 1 4 4 or more times 1 1 1 2
Question HS A.106, 108/MS A.96, 98: During the past 12 months, how many times on school property have you... had your property stolen or deliberately damaged, such as your car, clothing, or books... damaged school property on purpose? Note: Cells are empty if there are less than 10 respondents.
Table A5.6 Weapons Possession on School Property, Past 12 Months
Grade 7 Grade 9 Grade 11 NT % % % %
Carried a gun 0 times 99 99 99 93 1 time 0 0 0 3 2 to 3 times 0 0 0 2 4 or more times 0 0 0 2
Carried any other weapon (such as a knife or club) 0 times 97 97 97 85 1 time 2 1 1 5 2 to 3 times 1 0 0 4 4 or more times 1 1 1 6
Seen someone carrying a gun, knife, or other weapon 0 times 89 91 92 81 1 time 7 6 4 7 2 to 3 times 2 2 2 6 4 or more times 1 2 1 7
Question HS A.109, 110, 112/MS A.99, 100, 102: During the past 12 months, how many times on school property have you... carried a gun... carried any other weapon (such as a knife or club)... seen someone carrying a gun, knife, or other weapon? Note: Cells are empty if there are less than 10 respondents.
Orange County Page 27 2017-19 Main Report – Module A: Core

Table A5.7 Cyber Bullying, Past 12 Months
Grade 7 Grade 9 Grade 11 NT % % % %
0 times (never) 75 78 79 80
1 time 12 11 10 8
2 to 3 times 7 7 7 6
4 or more times 6 5 5 6
Question HS A.122/MS A.112: During the past 12 months, how many times did other students spread mean rumors or lies, or hurtful pictures, about you online, on social media, or on a cell phone?
Note: Cells are empty if there are less than 10 respondents.
Orange County Page 28 2017-19 Main Report – Module A: Core
6. Alcohol and Other Drug Use
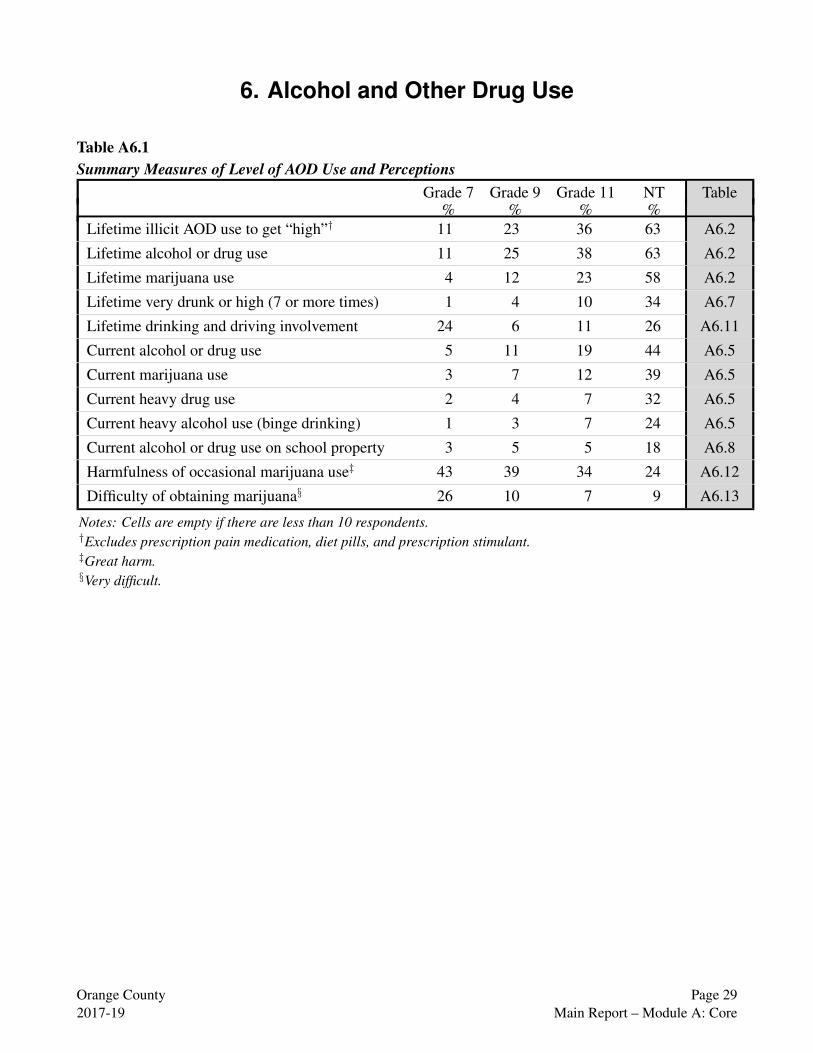
Table A6.1 Summary Measures of Level of AOD Use and Perceptions
Grade 7 Grade 9 Grade 11 NT Table % % % %
Lifetime illicit AOD use to get “high”† 11 23 36 63 A6.2
Lifetime alcohol or drug use 11 25 38 63 A6.2
Lifetime marijuana use 4 12 23 58 A6.2
Lifetime very drunk or high (7 or more times) 1 4 10 34 A6.7
Lifetime drinking and driving involvement 24 6 11 26 A6.11
Current alcohol or drug use 5 11 19 44 A6.5
Current marijuana use 3 7 12 39 A6.5
Current heavy drug use 2 4 7 32 A6.5
Current heavy alcohol use (binge drinking) 1 3 7 24 A6.5
Current alcohol or drug use on school property 3 5 5 18 A6.8
Harmfulness of occasional marijuana use‡ 43 39 34 24 A6.12
Difficulty of obtaining marijuana§ 26 10 7 9 A6.13
Notes: Cells are empty if there are less than 10 respondents. †Excludes prescription pain medication, diet pills, and prescription stimulant. ‡Great harm. §Very difficult.
Orange County Page 29 2017-19 Main Report – Module A: Core

Table A6.2 Summary of AOD Lifetime Use
Grade 7 Grade 9 Grade 11 NT % % % %
Alcohol 7 17 31 53
Marijuana 4 12 23 58
Inhalants 3 3 3 16
Cocaine, methamphetamine, or any amphetamines na 1 2 18
Heroin na 1 1 5
Ecstasy, LSD, or other psychedelics na 2 4 19
Prescription pain medication, opioids, tranquilizers, sedatives, diet pills, or other prescription stimulant na 8 10 30
Cold/cough medicines or other over-the-counter medicines to get “high” na 5 6 23
Any other drug, pill, or medicine to get “high” 2 3 3 17
Any of the above AOD use 11 25 38 63
Any illicit AOD use to get “high”† 11 23 36 63
Notes: Cells are empty if there are less than 10 respondents. †Excludes prescription pain medication, diet pills, and prescription stimulant. na—Not asked of middle school students.
Orange County Page 30 2017-19 Main Report – Module A: Core
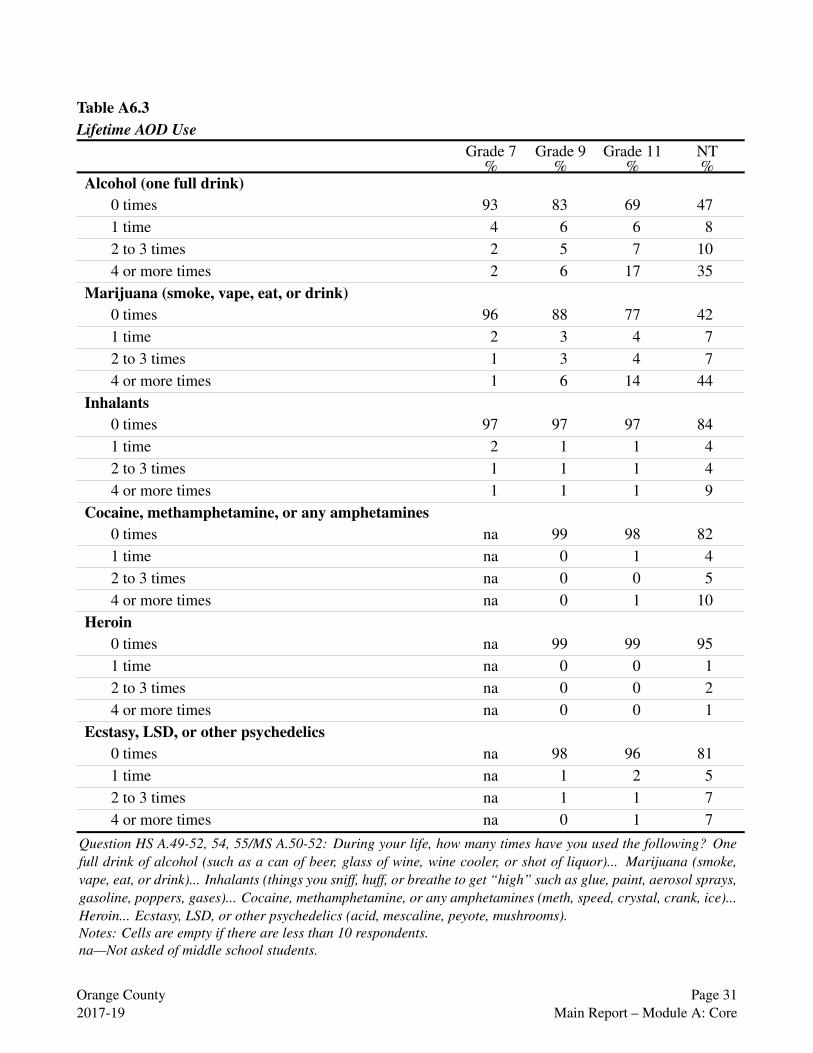
Table A6.3 Lifetime AOD Use
Grade 7 Grade 9 Grade 11 NT % % % %
Alcohol (one full drink) 0 times 93 83 69 47 1 time 4 6 6 8 2 to 3 times 2 5 7 10 4 or more times 2 6 17 35
Marijuana (smoke, vape, eat, or drink) 0 times 96 88 77 42 1 time 2 3 4 7 2 to 3 times 1 3 4 7 4 or more times 1 6 14 44
Inhalants 0 times 97 97 97 84 1 time 2 1 1 4 2 to 3 times 1 1 1 4 4 or more times 1 1 1 9
Cocaine, methamphetamine, or any amphetamines 0 times na 99 98 82 1 time na 0 1 4 2 to 3 times na 0 0 5 4 or more times na 0 1 10
Heroin 0 times na 99 99 95 1 time na 0 0 1 2 to 3 times na 0 0 2 4 or more times na 0 0 1
Ecstasy, LSD, or other psychedelics 0 times na 98 96 81 1 time na 1 2 5 2 to 3 times na 1 1 7 4 or more times na 0 1 7
Question HS A.49-52, 54, 55/MS A.50-52: During your life, how many times have you used the following? One full drink of alcohol (such as a can of beer, glass of wine, wine cooler, or shot of liquor)... Marijuana (smoke, vape, eat, or drink)... Inhalants (things you sniff, huff, or breathe to get “high” such as glue, paint, aerosol sprays, gasoline, poppers, gases)... Cocaine, methamphetamine, or any amphetamines (meth, speed, crystal, crank, ice)... Heroin... Ecstasy, LSD, or other psychedelics (acid, mescaline, peyote, mushrooms). Notes: Cells are empty if there are less than 10 respondents. na—Not asked of middle school students.
Orange County Page 31 2017-19 Main Report – Module A: Core

Table A6.3 Lifetime AOD Use – Continued
Grade 7 Grade 9 Grade 11 NT % % % %
Prescription pain medication or opioids, tranquilizers, or sedatives
0 times na 95 94 74 1 time na 2 2 5 2 to 3 times na 1 2 7 4 or more times na 1 2 14
Diet pills 0 times na 97 97 93 1 time na 1 1 1 2 to 3 times na 1 1 3 4 or more times na 2 2 3
RitalinTM or AdderallTM or other prescription stimulant
0 times na 97 96 87 1 time na 1 1 3 2 to 3 times na 1 1 5 4 or more times na 1 2 5
Cold/cough medicines or other over-the-counter medicines to get “high”
0 times na 95 94 77 1 time na 2 2 5 2 to 3 times na 2 2 9 4 or more times na 2 2 9
Any other drug, pill, or medicine to get “high” or for reasons other than medical
0 times 98 97 97 83 1 time 1 1 1 3 2 to 3 times 1 1 1 4 4 or more times 1 1 1 10
Question HS A.56-60/MS A.54: During your life, how many times have you used the following?... Prescription pain medication or opioids (VicodinTM, OxyContinTM, PercodanTM, LortabTM), tranquilizers, or sedatives (XanaxTM, AtivanTM)... Diet pills (Didrex ®R , Dexedrine ®R , Xenadrine R RitalinTM®, Skittles, M&M’s)... or AdderallTM or other prescription stimulant... Cold/cough medicines or other over-the-counter medicines to get “high”... Any other drug, pill, or medicine to get “high” or for reasons other than medical. Notes: Cells are empty if there are less than 10 respondents. na—Not asked of middle school students.
Orange County Page 32 2017-19 Main Report – Module A: Core

Table A6.4 Lifetime Marijuana Consumption
Grade 7 Grade 9 Grade 11 NT % % % %
During your life, how many times have you used marijuana in any of the following ways... Smoke it?
0 times 97 90 80 44
1 time 1 2 4 6
2 to 3 times 1 2 4 6
4 or more times 1 5 12 43
In an electronic or e-cigarette or other vaping device? 0 times 96 89 80 52
1 time 2 3 4 6
2 to 3 times 1 3 4 7
4 or more times 1 5 12 35
Eat or drink it in products made with marijuana? 0 times 98 93 86 53
1 time 1 3 5 9
2 to 3 times 1 2 4 11
4 or more times 1 2 5 27
Question HS A.64-66/MS A.58-60: During your life, how many times have you used marijuana in any of the following ways... Smoke it?... In an electronic or e-cigarette or other vaping device?... Eat or drink it in products made with marijuana? Note: Cells are empty if there are less than 10 respondents.
Orange County Page 33 2017-19 Main Report – Module A: Core

Table A6.5 Current AOD Use, Past 30 Days
Grade 7 Grade 9 Grade 11 NT % % % %
Alcohol (one or more drinks of alcohol) 3 7 14 32
Binge drinking (5 or more drinks in a row) 1 3 7 24
Marijuana (smoke, vape, eat, or drink) 3 7 12 39
Inhalants 1 1 1 9
Prescription drugs to get “high” or for reasons other than prescribed na 1 1 12
Other drug, pill, or medicine to get “high” or for reasons other than medical 1 2 1 10
Any drug use 4 8 12 40
Heavy drug use 2 4 7 32
Any AOD Use 5 11 19 44
Two or more substances at the same time na 2 4 18
Question HS A.70-76/MS A.64-68: During the past 30 days, on how many days did you use... one or more drinks of alcohol... five or more drinks of alcohol in a row, that is, within a couple of hours... marijuana (smoke, vape, eat, or drink)... inhalants (things you sniff, huff, or breathe to get “high”)... prescription drugs to get “high” or for reasons other than prescribed ... any other drug, pill, or medicine to get “high” or for reasons other than medical... two or more substances at the same time (for example, alcohol with marijuana, ecstasy with mushrooms)? Notes: Cells are empty if there are less than 10 respondents. Heavy drug use was calculated based on pattern of combined current drug use on three or more days (marijuana, inhalants, prescription pain medicine to get “high” (high school only), or any other illegal drug/pill to get “high”). na—Not asked of middle school students.
Orange County Page 34 2017-19 Main Report – Module A: Core
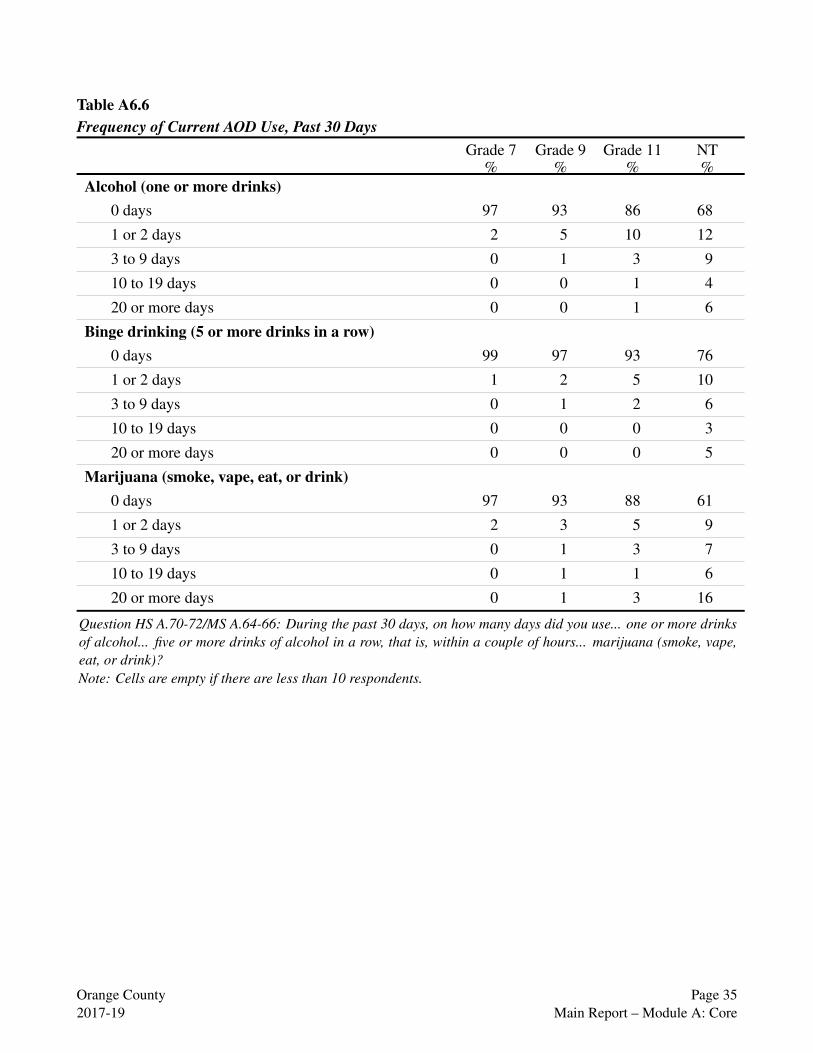
Table A6.6 Frequency of Current AOD Use, Past 30 Days
Grade 7 Grade 9 Grade 11 NT % % % %
Alcohol (one or more drinks) 0 days 97 93 86 68
1 or 2 days 2 5 10 12
3 to 9 days 0 1 3 9
10 to 19 days 0 0 1 4
20 or more days 0 0 1 6
Binge drinking (5 or more drinks in a row) 0 days 99 97 93 76
1 or 2 days 1 2 5 10
3 to 9 days 0 1 2 6
10 to 19 days 0 0 0 3
20 or more days 0 0 0 5
Marijuana (smoke, vape, eat, or drink) 0 days 97 93 88 61
1 or 2 days 2 3 5 9
3 to 9 days 0 1 3 7
10 to 19 days 0 1 1 6
20 or more days 0 1 3 16
Question HS A.70-72/MS A.64-66: During the past 30 days, on how many days did you use... one or more drinks of alcohol... five or more drinks of alcohol in a row, that is, within a couple of hours... marijuana (smoke, vape, eat, or drink)? Note: Cells are empty if there are less than 10 respondents.
Orange County Page 35 2017-19 Main Report – Module A: Core
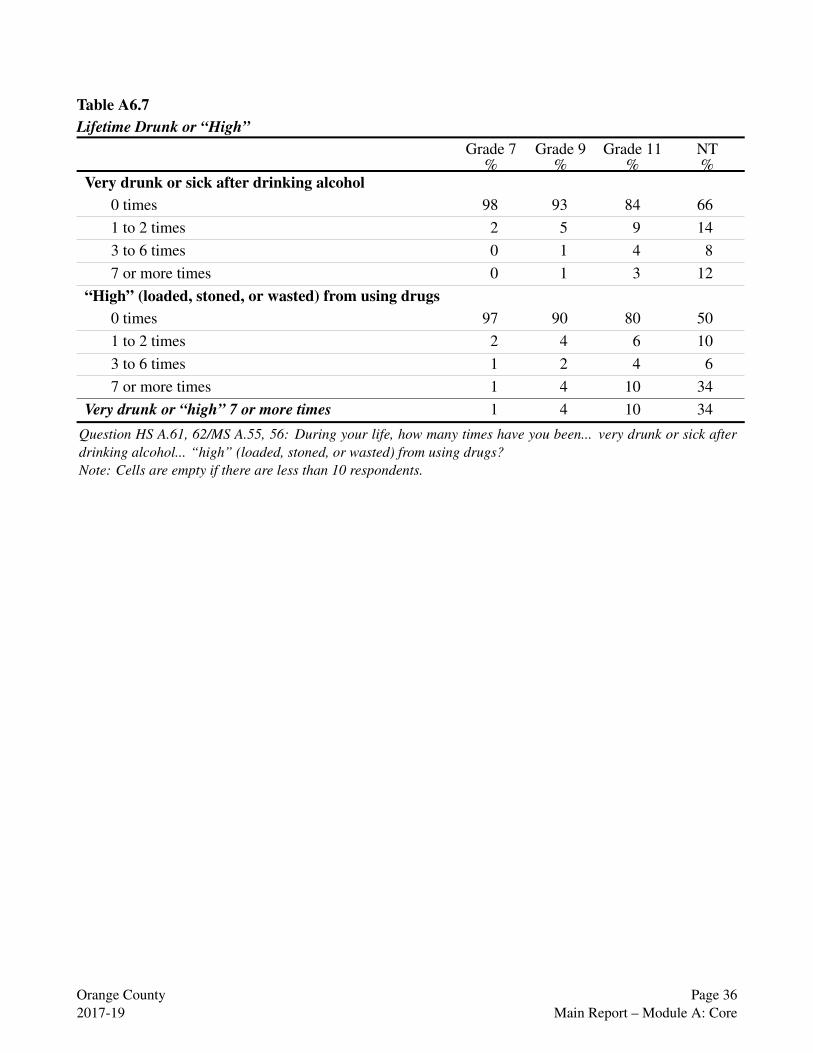
Table A6.7 Lifetime Drunk or “High”
Grade 7 Grade 9 Grade 11 NT % % % %
Very drunk or sick after drinking alcohol 0 times 98 93 84 66 1 to 2 times 2 5 9 14 3 to 6 times 0 1 4 8 7 or more times 0 1 3 12
“High” (loaded, stoned, or wasted) from using drugs 0 times 97 90 80 50 1 to 2 times 2 4 6 10 3 to 6 times 1 2 4 6 7 or more times 1 4 10 34
Very drunk or “high” 7 or more times 1 4 10 34
Question HS A.61, 62/MS A.55, 56: During your life, how many times have you been... very drunk or sick after drinking alcohol... “high” (loaded, stoned, or wasted) from using drugs? Note: Cells are empty if there are less than 10 respondents.
Orange County Page 36 2017-19 Main Report – Module A: Core

Table A6.8 Current AOD Use on School Property, Past 30 Days
Grade 7 Grade 9 Grade 11 NT % % % %
Alcohol 0 days 99 98 98 90
1 to 2 days 1 2 1 5
3 or more days 0 1 1 5
Marijuana (smoke, vape, eat, or drink) 0 days 99 97 96 84
1 to 2 days 1 2 2 6
3 or more days 0 2 2 10
Any other drug, pill, or medicine to get “high” or for reasons other than medical?
0 days 99 99 99 92
1 to 2 days 1 1 1 4
3 or more days 0 0 0 4
Any of the above 3 5 5 18
Question HS A.80-82/MS A.72-74: During the past 30 days, on how many days on school property did you use... at least one drink of alcohol... marijuana (smoke, vape, eat, or drink)... any other drug, pill, or medicine to get “high” or for reasons other than medical? Note: Cells are empty if there are less than 10 respondents.
Table A6.9 Lifetime Drunk or “High” on School Property
Grade 7 Grade 9 Grade 11 NT % % % %
0 times 98 95 91 67
1 to 2 times 1 3 4 9
3 to 6 times 0 1 2 7
7 or more times 0 2 3 18
Question HS A.63/MS A.57: During your life, how many times have you been... drunk on alcohol or “high” on drugs on school property? Note: Cells are empty if there are less than 10 respondents.
Orange County Page 37 2017-19 Main Report – Module A: Core

Table A6.10 Cessation Attempts
Grade 7 Grade 9 Grade 11 NT % % % %
Alcohol Does not apply, don’t use na 91 84 59 0 times na 6 13 23 1 time na 1 2 8 2 to 3 times na 1 1 5 4 or more times na 1 1 5
Marijuana Does not apply, don’t use na 90 83 48 0 times na 6 10 26 1 time na 2 4 10 2 to 3 times na 1 2 7 4 or more times na 1 1 8
Question HS A.96, 97: How many times have you tried to quit or stop using... alcohol... marijuana? Notes: Cells are empty if there are less than 10 respondents. na—Not asked of middle school students.
Orange County Page 38 2017-19 Main Report – Module A: Core

Table A6.11 Drinking While Driving, Lifetime
Grade 7 Grade 9 Grade 11 NT % % % %
Driven a car when you had been using alcohol or drugs, or been in a car driven by a friend who had been using
Never na 94 89 74
1 time na 2 4 4
2 times na 1 3 4
3 to 6 times na 1 2 5
7 or more times na 1 3 13
Have ridden in a car driven by someone who had been using alcohol or drugs
Never 76 na na na
1 time 9 na na na
2 times 5 na na na
3 to 6 times 4 na na na
7 or more times 7 na na na
Question HS A.98/MS A.87: During your life, how many times have you ever driven a car when you had been using alcohol or drugs, or been in a car driven by a friend when he or she had been using?... In your life, how many times have you ridden in a car driven by someone who had been using alcohol or drugs? Notes: Cells are empty if there are less than 10 respondents. na—Not asked of middle/high school students.
Orange County Page 39 2017-19 Main Report – Module A: Core

Table A6.12 Perceived Harm of AOD Use
Grade 7 Grade 9 Grade 11 NT % % % %
Alcohol - drink occasionally Great 31 32 32 32
Moderate 23 26 26 24
Slight 19 23 25 20
None 27 19 17 24
Alcohol - 5 or more drinks once or twice a week Great 50 56 59 41
Moderate 18 20 22 22
Slight 7 8 8 13
None 26 16 11 24
Marijuana - use occasionally Great 43 39 34 24
Moderate 22 26 24 17
Slight 8 15 20 20
None 26 21 22 39
Marijuana - use daily Great 62 60 53 31
Moderate 8 13 19 16
Slight 4 8 11 16
None 26 19 17 37
Question HS A.87-90/MS A.79-82: How much do people risk harming themselves physically and in other ways when they do the following?... Drink alcohol (beer, wine, liquor ) occasionally... Have five or more drinks of alcohol once or twice a week... Use marijuana occasionally (smoke, vape, eat, or drink) ... Use marijuana daily. Note: Cells are empty if there are less than 10 respondents.
Orange County Page 40 2017-19 Main Report – Module A: Core

Table A6.13 Perceived Difficulty of Obtaining Alcohol and Marijuana
Grade 7 Grade 9 Grade 11 NT % % % %
Alcohol Very difficult 19 9 7 10 Fairly difficult 11 10 8 8 Fairly easy 14 23 25 19 Very easy 12 26 37 35 Don’t know 43 33 23 28
Marijuana Very difficult 26 10 7 9 Fairly difficult 11 10 7 5 Fairly easy 9 20 23 13 Very easy 9 25 39 46 Don’t know 46 35 24 27
Question HS A.93, 94/MS A.85, 86: How difficult is it for students in your grade to get any of the following if they really want them?... Alcohol... Marijuana. Note: Cells are empty if there are less than 10 respondents.
Orange County Page 41 2017-19 Main Report – Module A: Core
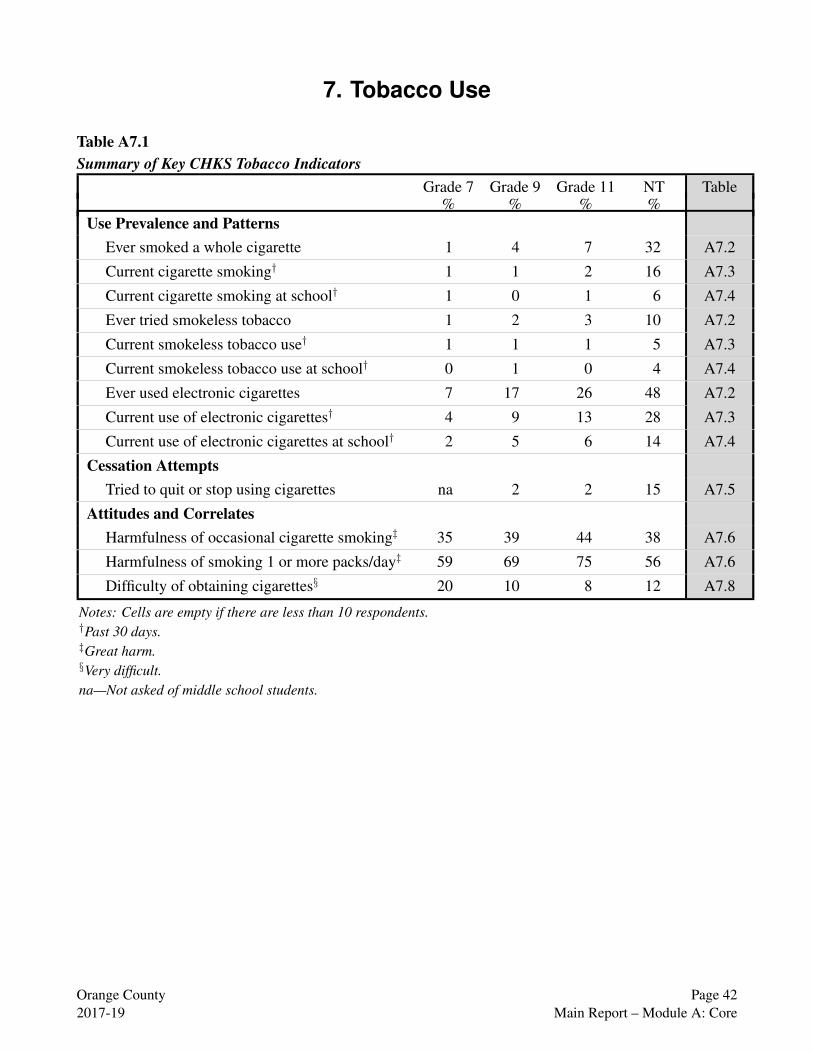
7. Tobacco Use
Table A7.1 Summary of Key CHKS Tobacco Indicators
Grade 7 Grade 9 Grade 11 NT Table % % % %
Use Prevalence and Patterns Ever smoked a whole cigarette 1 4 7 32 A7.2
Current cigarette smoking† 1 1 2 16 A7.3
Current cigarette smoking at school† 1 0 1 6 A7.4
Ever tried smokeless tobacco 1 2 3 10 A7.2
Current smokeless tobacco use† 1 1 1 5 A7.3
Current smokeless tobacco use at school† 0 1 0 4 A7.4
Ever used electronic cigarettes 7 17 26 48 A7.2
Current use of electronic cigarettes† 4 9 13 28 A7.3
Current use of electronic cigarettes at school† 2 5 6 14 A7.4
Cessation Attempts Tried to quit or stop using cigarettes na 2 2 15 A7.5
Attitudes and Correlates Harmfulness of occasional cigarette smoking‡ 35 39 44 38 A7.6
Harmfulness of smoking 1 or more packs/day‡ 59 69 75 56 A7.6
Difficulty of obtaining cigarettes§ 20 10 8 12 A7.8
Notes: Cells are empty if there are less than 10 respondents. †Past 30 days. ‡Great harm. §Very difficult. na—Not asked of middle school students.
Orange County Page 42 2017-19 Main Report – Module A: Core

Table A7.2 Lifetime Tobacco Use
Grade 7 Grade 9 Grade 11 NT % % % %
A cigarette, even one or two puffs 0 times 97 na na na
1 time 2 na na na
2 to 3 times 1 na na na
4 or more times 0 na na na
A whole cigarette 0 times 99 96 93 68
1 time 1 1 2 5
2 to 3 times 0 1 2 7
4 or more times 0 1 3 20
Smokeless tobacco 0 times 99 98 97 90
1 time 1 1 1 4
2 to 3 times 0 0 1 3
4 or more times 0 1 1 3
Electronic cigarettes, e-cigarettes, or other vaping device
0 times 93 83 74 52
1 time 3 5 6 5
2 to 3 times 2 4 5 10
4 or more times 2 8 15 33
Question HS A.46-48/MS A.46-49: During your life, how many times have you used the following? A cigarette, even one or two puffs... A whole cigarette... Smokeless tobacco (dip, chew, or snuff)... Electronic cigarettes, e-cigarettes, or other vaping device such as Juul, e-hookah, hookah pens, or vape pens. Notes: Cells are empty if there are less than 10 respondents. na—Not asked of high school students.
Orange County Page 43 2017-19 Main Report – Module A: Core

Table A7.3 Any Current Use and Daily Use
Grade 7 Grade 9 Grade 11 NT % % % %
Cigarettes Any 1 1 2 16 Daily (20 or more days) 0 0 0 3
Smokeless tobacco Any 1 1 1 5 Daily (20 or more days) 0 0 0 1
Electronic cigarettes/e-cigarettes/other vaping device Any 4 9 13 28 Daily (20 or more days) 0 2 4 9
Question HS A.67-69/MS A.61-63: During the past 30 days, on how many days did you use... cigarettes... smokeless tobacco (dip, chew, or snuff)... electronic cigarettes, e-cigarettes, or other vaping device such as Juul, e-hookah, hookah pens, or vape pens? Note: Cells are empty if there are less than 10 respondents.
Orange County Page 44 2017-19 Main Report – Module A: Core
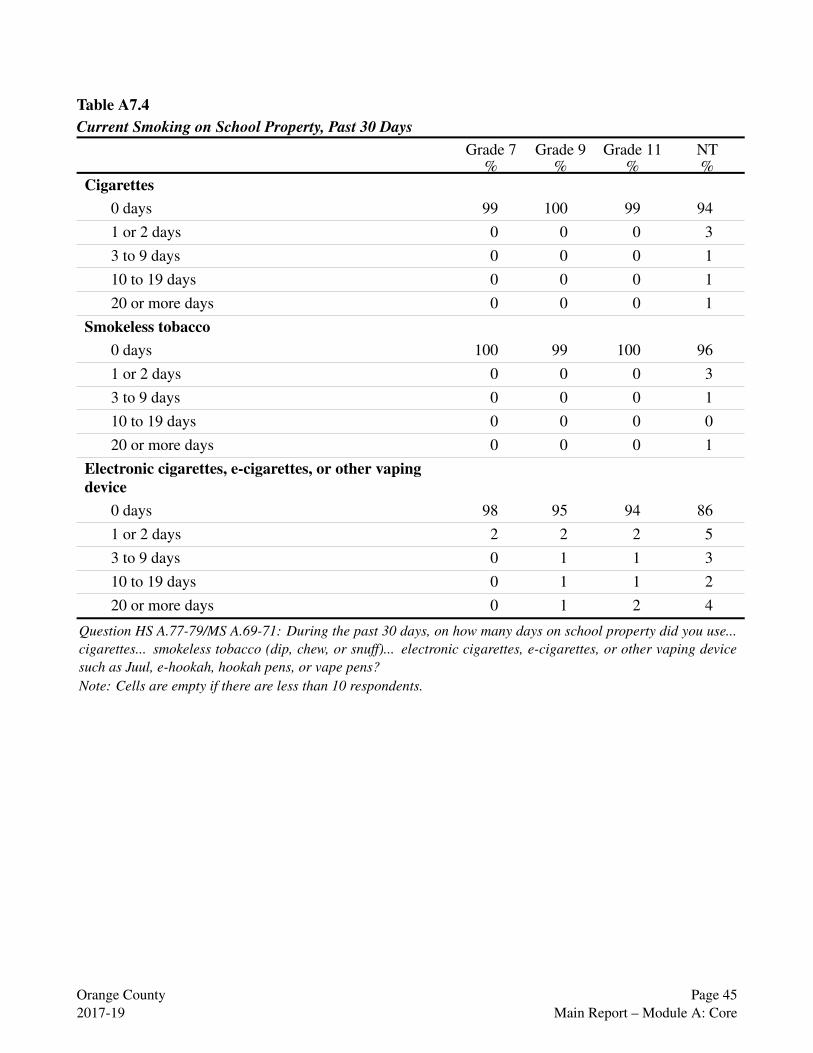
Table A7.4 Current Smoking on School Property, Past 30 Days
Grade 7 Grade 9 Grade 11 NT % % % %
Cigarettes 0 days 99 100 99 94 1 or 2 days 0 0 0 3 3 to 9 days 0 0 0 1 10 to 19 days 0 0 0 1 20 or more days 0 0 0 1
Smokeless tobacco 0 days 100 99 100 96 1 or 2 days 0 0 0 3 3 to 9 days 0 0 0 1 10 to 19 days 0 0 0 0 20 or more days 0 0 0 1
Electronic cigarettes, e-cigarettes, or other vaping device
0 days 98 95 94 86 1 or 2 days 2 2 2 5 3 to 9 days 0 1 1 3 10 to 19 days 0 1 1 2 20 or more days 0 1 2 4
Question HS A.77-79/MS A.69-71: During the past 30 days, on how many days on school property did you use... cigarettes... smokeless tobacco (dip, chew, or snuff)... electronic cigarettes, e-cigarettes, or other vaping device such as Juul, e-hookah, hookah pens, or vape pens? Note: Cells are empty if there are less than 10 respondents.
Orange County Page 45 2017-19 Main Report – Module A: Core

Table A7.5 Cigarette Smoking Cessation Attempts
Grade 7 Grade 9 Grade 11 NT % % % %
Does not apply, don’t use na 95 94 72
0 times na 3 4 13
1 time na 1 1 7
2 to 3 times na 0 1 4
4 or more times na 1 1 4
Question HS A.95: How many times have you tried to quit or stop using cigarettes? Notes: Cells are empty if there are less than 10 respondents. na—Not asked of middle school students.
Table A7.6 Perceived Harm of Cigarette Smoking
Grade 7 Grade 9 Grade 11 NT % % % %
Smoke cigarettes occasionally Great 35 39 44 38
Moderate 27 31 30 23
Slight 13 14 13 13
None 25 17 13 26
Smoke 1 or more packs of cigarettes each day Great 59 69 75 56
Moderate 11 10 9 14
Slight 5 5 4 6
None 25 17 12 25
Question HS A.83, 84/MS A.75, 76: How much do people risk harming themselves physically and in other ways when they do the following?... Smoke cigarettes occasionally... Smoke 1 or more packs of cigarettes each day. Note: Cells are empty if there are less than 10 respondents.
Orange County Page 46 2017-19 Main Report – Module A: Core

Table A7.7 Perceived Harm of E-Cigarette Use
Grade 7 Grade 9 Grade 11 NT % % % %
Use e-cigarettes or vaping device occasionally Great 34 33 33 30
Moderate 27 29 31 21
Slight 14 18 20 15
None 26 20 16 34
Use e-cigarettes or vaping devices several times a day Great 56 58 59 42
Moderate 13 16 20 15
Slight 5 7 7 10
None 26 19 14 33
Question HS A.85, 86/MS A.77, 78: How much do people risk harming themselves physically and in other ways when they do the following?... Use e-cigarettes (electronic) or vaping device occasionally... Use e-cigarettes or vaping devices several times a day (100 puffs or more). Note: Cells are empty if there are less than 10 respondents.
Orange County Page 47 2017-19 Main Report – Module A: Core
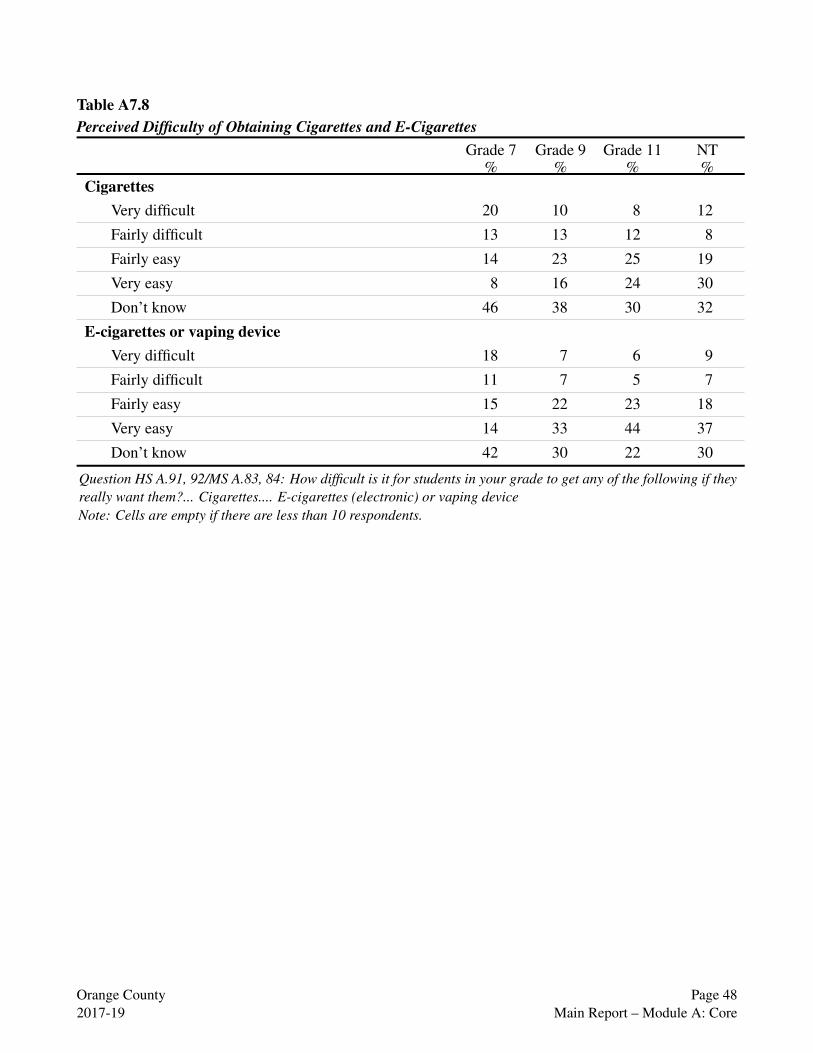
Table A7.8 Perceived Difficulty of Obtaining Cigarettes and E-Cigarettes
Grade 7 Grade 9 Grade 11 NT % % % %
Cigarettes Very difficult 20 10 8 12
Fairly difficult 13 13 12 8
Fairly easy 14 23 25 19
Very easy 8 16 24 30
Don’t know 46 38 30 32
E-cigarettes or vaping device Very difficult 18 7 6 9
Fairly difficult 11 7 5 7
Fairly easy 15 22 23 18
Very easy 14 33 44 37
Don’t know 42 30 22 30
Question HS A.91, 92/MS A.83, 84: How difficult is it for students in your grade to get any of the following if they really want them?... Cigarettes.... E-cigarettes (electronic) or vaping device Note: Cells are empty if there are less than 10 respondents.
Orange County Page 48 2017-19 Main Report – Module A: Core

8. Other Physical and Mental Health Risks
Table A8.1 Alone After School
Never
Grade 7 % 44
Grade 9 % na
Grade 11 % na
NT % na
1 day
2 days
3 days
16
9
6
na
na
na
na
na
na
na
na
na
4 days
5 days
3
21
na
na
na
na
na
na
Question MS A.89: In a normal week, how many days are you home after school for at least one hour without an adult there? Notes: Cells are empty if there are less than 10 respondents. na—Not asked of high school students.
Table A8.2 Hours of Sleep
Grade 7 Grade 9 Grade 11 NT % % % %
4 or less hours 3 5 9 9
5 hours 4 9 17 9
6 hours 9 19 27 22
7 hours 18 28 26 26
8 hours 32 26 16 25
9 hours 23 9 4 7
10 or more hours 10 3 1 2
Question HS A.127/MS A.117: On an average school night, how many hours of sleep do you get? Note: Cells are empty if there are less than 10 respondents.
Orange County Page 49 2017-19 Main Report – Module A: Core

Table A8.3 Eating of Breakfast
Grade 7 Grade 9 Grade 11 NT % % % %
No 28 36 39 58
Yes 72 64 61 42
Question HS A.126/MS A.116: Did you eat breakfast today? Note: Cells are empty if there are less than 10 respondents.
Table A8.4 Chronic Sad or Hopeless Feelings, Past 12 Months
Grade 7 Grade 9 Grade 11 NT % % % %
No 75 70 65 64
Yes 25 30 35 36
Question HS A.124/MS A.114: During the past 12 months, did you ever feel so sad or hopeless almost every day for two weeks or more that you stopped doing some usual activities? Note: Cells are empty if there are less than 10 respondents.
Table A8.5 Seriously Considered Attempting Suicide, Past 12 Months
Grade 7 Grade 9 Grade 11 NT % % % %
No 87 85 85 81
Yes 13 15 15 19
Question HS A.125/MS A.115: During the past 12 months, did you ever seriously consider attempting suicide? Note: Cells are empty if there are less than 10 respondents.
Table A8.6 Gang Involvement
Grade 7 Grade 9 Grade 11 NT % % % %
No 96
Yes 4
Question HS A.123/MS A.113: Do you consider yourself a member of a gang? Note: Cells are empty if there are less than 10 respondents.
97
3
97
3
93
7
Orange County 2017-19
Page 50 Main Report – Module A: Core
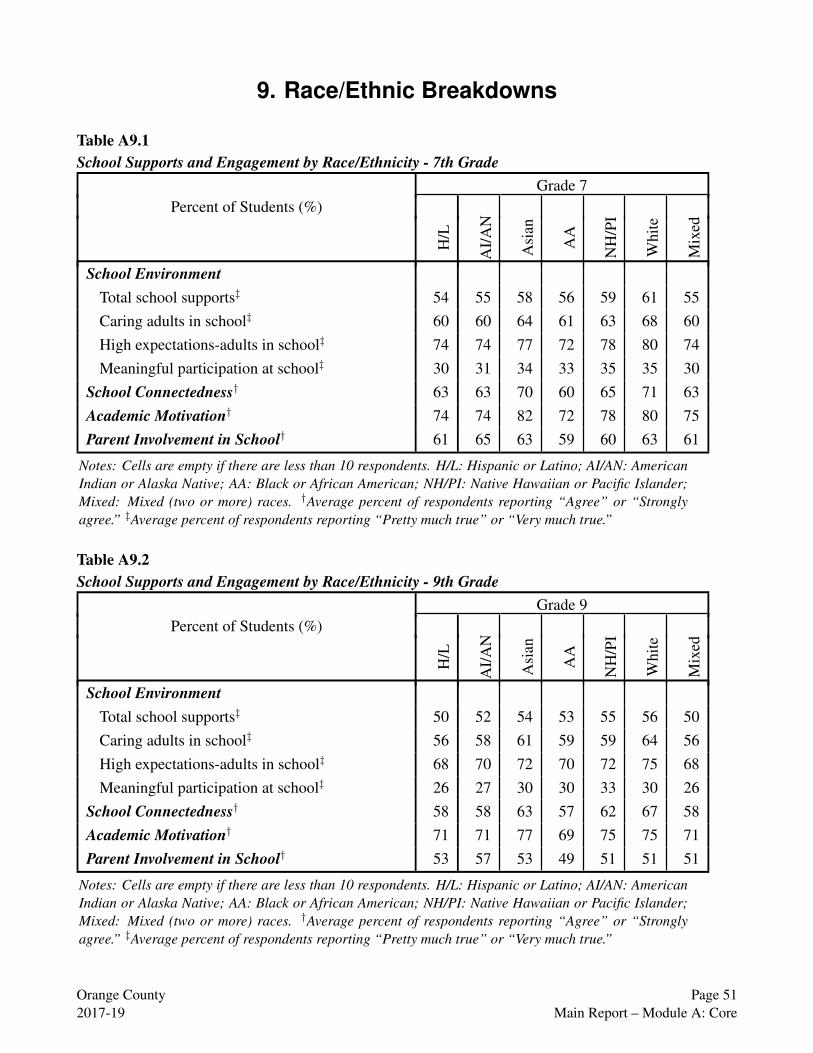
9. Race/Ethnic Breakdowns
Table A9.1 School Supports and Engagement by Race/Ethnicity - 7th Grade
Percent of Students (%) Grade 7
H/L
AI/
AN
Asi
an
AA
NH
/PI
Whi
te
Mix
ed
School Environment Total school supports‡ 54 55 58 56 59 61 55 Caring adults in school‡ 60 60 64 61 63 68 60 High expectations-adults in school‡ 74 74 77 72 78 80 74 Meaningful participation at school‡ 30 31 34 33 35 35 30
School Connectedness† 63 63 70 60 65 71 63 Academic Motivation† 74 74 82 72 78 80 75 Parent Involvement in School† 61 65 63 59 60 63 61
Notes: Cells are empty if there are less than 10 respondents. H/L: Hispanic or Latino; AI/AN: American Indian or Alaska Native; AA: Black or African American; NH/PI: Native Hawaiian or Pacific Islander; Mixed: Mixed (two or more) races. †Average percent of respondents reporting “Agree” or “Strongly agree.” ‡Average percent of respondents reporting “Pretty much true” or “Very much true.”
Table A9.2 School Supports and Engagement by Race/Ethnicity - 9th Grade
Percent of Students (%) Grade 9
H/L
AI/
AN
Asi
an
AA
NH
/PI
Whi
te
Mix
ed
School Environment Total school supports‡ 50 52 54 53 55 56 50 Caring adults in school‡ 56 58 61 59 59 64 56 High expectations-adults in school‡ 68 70 72 70 72 75 68 Meaningful participation at school‡ 26 27 30 30 33 30 26
School Connectedness† 58 58 63 57 62 67 58 Academic Motivation† 71 71 77 69 75 75 71 Parent Involvement in School† 53 57 53 49 51 51 51
Notes: Cells are empty if there are less than 10 respondents. H/L: Hispanic or Latino; AI/AN: American Indian or Alaska Native; AA: Black or African American; NH/PI: Native Hawaiian or Pacific Islander; Mixed: Mixed (two or more) races. †Average percent of respondents reporting “Agree” or “Strongly agree.” ‡Average percent of respondents reporting “Pretty much true” or “Very much true.”
Orange County Page 51 2017-19 Main Report – Module A: Core
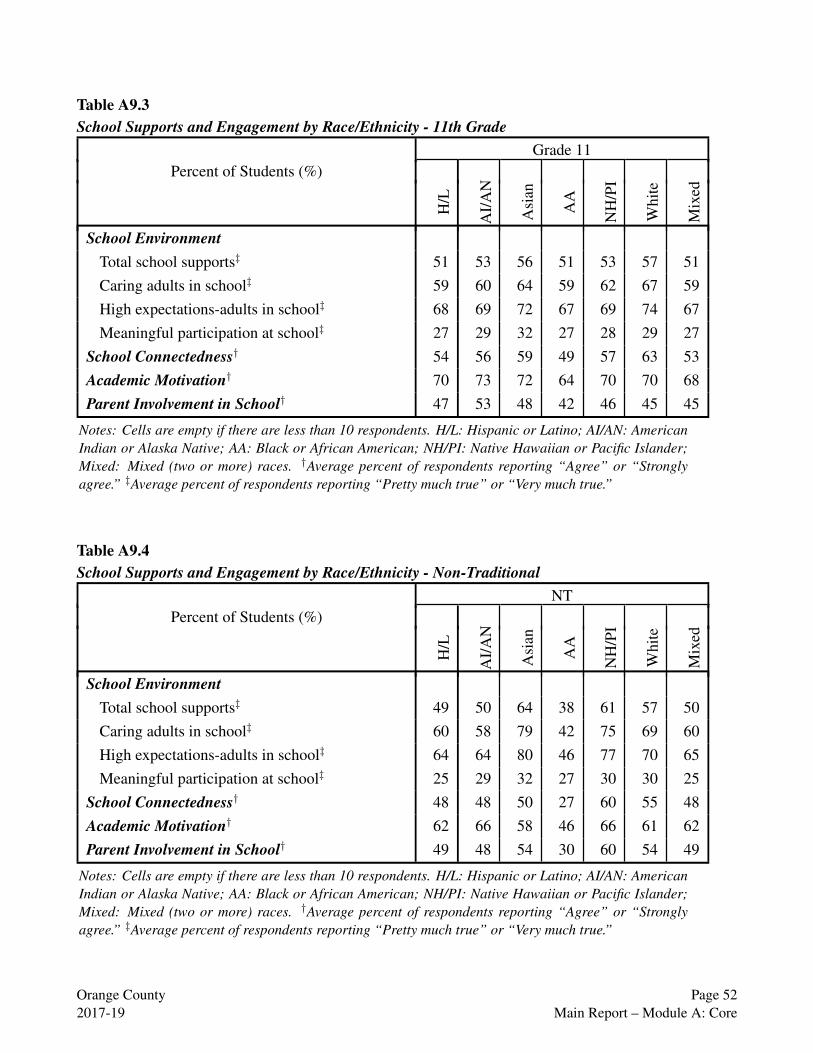
Table A9.3 School Supports and Engagement by Race/Ethnicity - 11th Grade
Percent of Students (%) Grade 11
H/L
AI/
AN
Asi
an
AA
NH
/PI
Whi
te
Mix
ed
School Environment Total school supports‡ 51 53 56 51 53 57 51 Caring adults in school‡ 59 60 64 59 62 67 59 High expectations-adults in school‡ 68 69 72 67 69 74 67 Meaningful participation at school‡ 27 29 32 27 28 29 27
School Connectedness† 54 56 59 49 57 63 53 Academic Motivation† 70 73 72 64 70 70 68 Parent Involvement in School† 47 53 48 42 46 45 45
Notes: Cells are empty if there are less than 10 respondents. H/L: Hispanic or Latino; AI/AN: American Indian or Alaska Native; AA: Black or African American; NH/PI: Native Hawaiian or Pacific Islander; Mixed: Mixed (two or more) races. †Average percent of respondents reporting “Agree” or “Strongly agree.” ‡Average percent of respondents reporting “Pretty much true” or “Very much true.”
Table A9.4 School Supports and Engagement by Race/Ethnicity - Non-Traditional
Percent of Students (%) NT
H/L
AI/
AN
Asi
an
AA
NH
/PI
Whi
te
Mix
ed
School Environment Total school supports‡ 49 50 64 38 61 57 50 Caring adults in school‡ 60 58 79 42 75 69 60 High expectations-adults in school‡ 64 64 80 46 77 70 65 Meaningful participation at school‡ 25 29 32 27 30 30 25
School Connectedness† 48 48 50 27 60 55 48 Academic Motivation† 62 66 58 46 66 61 62 Parent Involvement in School† 49 48 54 30 60 54 49
Notes: Cells are empty if there are less than 10 respondents. H/L: Hispanic or Latino; AI/AN: American Indian or Alaska Native; AA: Black or African American; NH/PI: Native Hawaiian or Pacific Islander; Mixed: Mixed (two or more) races. †Average percent of respondents reporting “Agree” or “Strongly agree.” ‡Average percent of respondents reporting “Pretty much true” or “Very much true.”
Orange County Page 52 2017-19 Main Report – Module A: Core
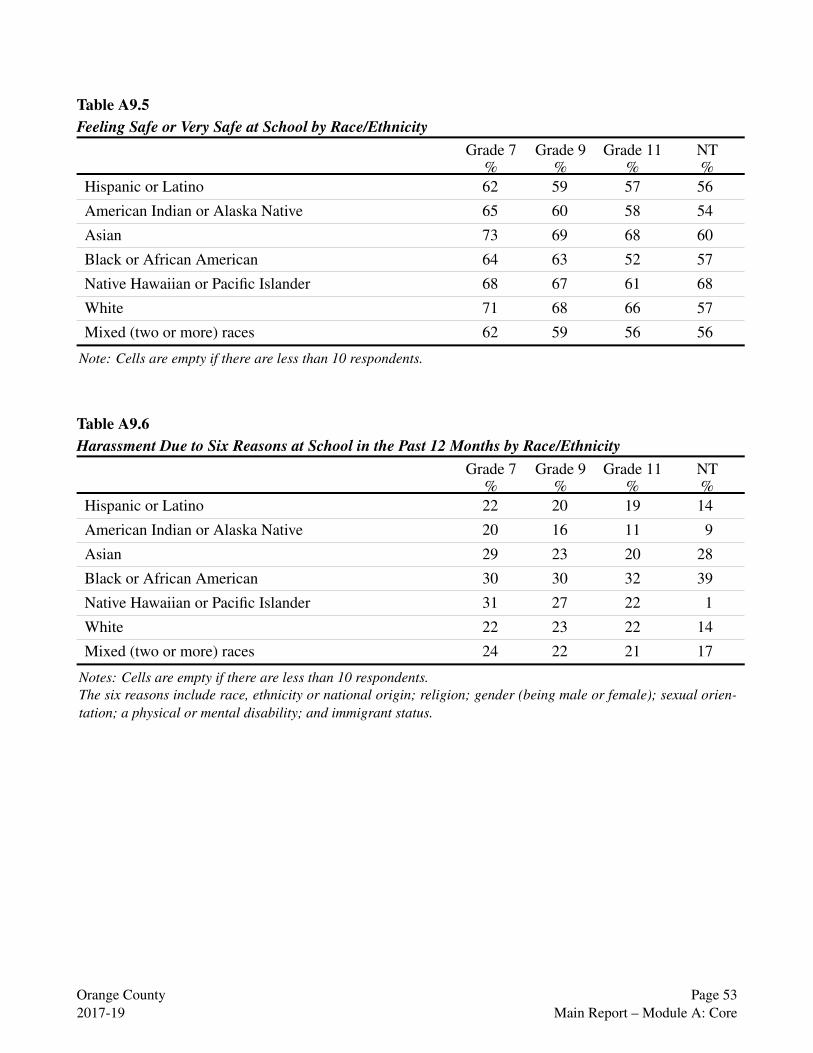
Table A9.5 Feeling Safe or Very Safe at School by Race/Ethnicity
Grade 7 Grade 9 Grade 11 NT % % % %
Hispanic or Latino 62 59 57 56
American Indian or Alaska Native 65 60 58 54
Asian 73 69 68 60
Black or African American 64 63 52 57
Native Hawaiian or Pacific Islander 68 67 61 68
White 71 68 66 57
Mixed (two or more) races 62 59 56 56
Note: Cells are empty if there are less than 10 respondents.
Table A9.6 Harassment Due to Six Reasons at School in the Past 12 Months by Race/Ethnicity
Grade 7 Grade 9 Grade 11 NT % % % %
Hispanic or Latino 22 20 19 14
American Indian or Alaska Native 20 16 11 9
Asian 29 23 20 28
Black or African American 30 30 32 39
Native Hawaiian or Pacific Islander 31 27 22 1
White 22 23 22 14
Mixed (two or more) races 24 22 21 17
Notes: Cells are empty if there are less than 10 respondents. The six reasons include race, ethnicity or national origin; religion; gender (being male or female); sexual orientation; a physical or mental disability; and immigrant status.
Orange County Page 53 2017-19 Main Report – Module A: Core

Table A9.7 Any Harassment or Bullying at School in the Past 12 Months by Race/Ethnicity
Grade 7 Grade 9 Grade 11 NT % % % %
Hispanic or Latino 30 25 23 17
American Indian or Alaska Native 27 20 15 15
Asian 36 28 24 34
Black or African American 33 35 34 39
Native Hawaiian or Pacific Islander 37 35 28 1
White 32 30 27 17
Mixed (two or more) races 32 27 26 19
Note: Cells are empty if there are less than 10 respondents.
Table A9.8 Any Alcohol Use at School in the Past 30 Days by Race/Ethnicity
Grade 7 Grade 9 Grade 11 NT % % % %
Hispanic or Latino 2 3 2 10
American Indian or Alaska Native 2 2 3 7
Asian 0 1 1 6
Black or African American 3 4 3 20
Native Hawaiian or Pacific Islander 1 3 3 23
White 1 2 2 7
Mixed (two or more) races 2 3 2 11
Note: Cells are empty if there are less than 10 respondents.
Orange County Page 54 2017-19 Main Report – Module A: Core

Table A9.9 Cigarette Smoking in the Past 30 Days by Race/Ethnicity
Grade 7 Grade 9 Grade 11 NT % % % %
Hispanic or Latino 1 1 2 13
American Indian or Alaska Native 1 1 1 10
Asian 0 0 1 16
Black or African American 1 3 1 20
Native Hawaiian or Pacific Islander 0 2 4 5
White 1 1 3 23
Mixed (two or more) races 1 1 2 14
Note: Cells are empty if there are less than 10 respondents.
Table A9.10 Any Alcohol Use in the Past 30 Days by Race/Ethnicity
Grade 7 Grade 9 Grade 11 NT % % % %
Hispanic or Latino 4 8 13 31
American Indian or Alaska Native 4 6 8 22
Asian 1 3 7 46
Black or African American 3 9 12 25
Native Hawaiian or Pacific Islander 3 9 15 31
White 2 8 19 31
Mixed (two or more) races 4 9 15 33
Note: Cells are empty if there are less than 10 respondents.
Orange County Page 55 2017-19 Main Report – Module A: Core

Table A9.11 Any Marijuana Use in the Past 30 Days by Race/Ethnicity
Grade 7 Grade 9 Grade 11 NT % % % %
Hispanic or Latino 4 9 12 39
American Indian or Alaska Native 4 7 8 31
Asian 1 2 5 31
Black or African American 3 10 15 33
Native Hawaiian or Pacific Islander 3 7 12 43
White 1 7 14 39
Mixed (two or more) races 4 9 15 40
Note: Cells are empty if there are less than 10 respondents.
Table A9.12 Chronic Sad or Hopeless Feelings in the Past 12 Months by Race/Ethnicity
Grade 7 Grade 9 Grade 11 NT % % % %
Hispanic or Latino 29 32 35 34
American Indian or Alaska Native 25 31 32 32
Asian 24 29 35 48
Black or African American 24 27 32 54
Native Hawaiian or Pacific Islander 23 35 42 45
White 20 28 34 38
Mixed (two or more) races 29 33 37 35
Note: Cells are empty if there are less than 10 respondents.
Orange County Page 56 2017-19 Main Report – Module A: Core
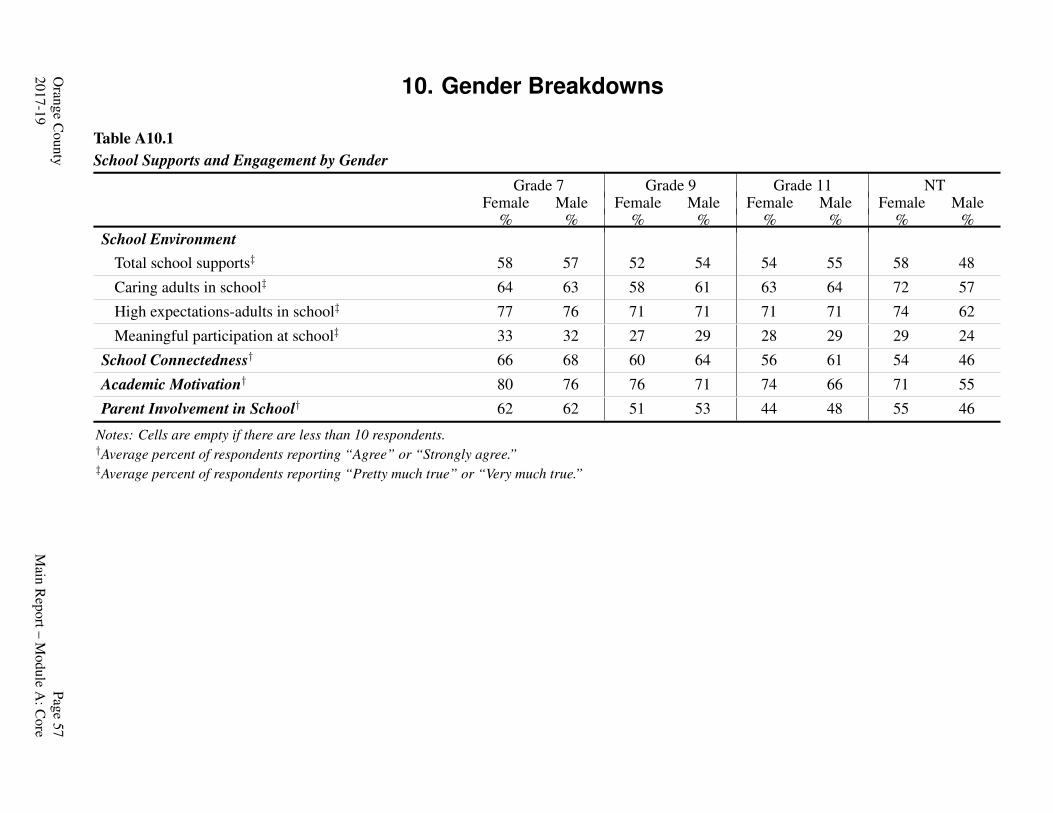
Orange C
ounty Page 57
2017-19 M
ain Report – M
odule A: C
ore
10. Gender Breakdowns
Table A10.1 School Supports and Engagement by Gender
Grade 7 Female Male
% %
Grade 9 Female Male
% %
Grade 11 Female Male
% %
NT Female
% Male
% School Environment
Total school supports‡ 58 57 52 54 54 55 58 48
Caring adults in school‡ 64 63 58 61 63 64 72 57
High expectations-adults in school‡ 77 76 71 71 71 71 74 62
Meaningful participation at school‡ 33 32 27 29 28 29 29 24
School Connectedness† 66 68 60 64 56 61 54 46
Academic Motivation† 80 76 76 71 74 66 71 55
Parent Involvement in School† 62 62 51 53 44 48 55 46
Notes: Cells are empty if there are less than 10 respondents. †Average percent of respondents reporting “Agree” or “Strongly agree.” ‡Average percent of respondents reporting “Pretty much true” or “Very much true.”

Table A10.2 Select Perceived Safety, Harassment, Alcohol and Other Drug Use, and Mental Health Measures by Gender
Grade 7 Female Male
% %
Grade 9 Female Male
% %
Grade 11 Female Male
% %
NT Female
% Male
% Perceived Safety at School Feel safe or very safe at school 65 69 62 67 60 66 61 53
Harassment/Bullying at School During the past 12 months at school, have you been...
harassed/bullied for any of the six reasons 25 23 24 20 23 18 16 14
harassed/bullied for any reasons 34 30 31 26 29 22 20 17
Current ATOD Use During the past 30 days, did you...
have at least one drink of alcohol at school 1 1 2 2 2 2 7 11
use cigarettes 1 1 1 1 2 2 15 16
use electronic cigarettes 4 3 9 8 13 13 30 26
have at least one drink of alcohol 3 2 9 6 15 13 38 27
use marijuana 3 2 7 7 12 12 41 37
Mental Health Chronic sad or hopeless feelings, past 12 months 31 18 38 22 43 26 46 30
Note: Cells are empty if there are less than 10 respondents.
Orange C
ounty Page 58
2017-19 M
ain Report – M
odule A: C
ore

Appendix I 2017-18 CHKS Secondary Survey Response Rates
Eligible Districts
Anaheim Union High
Brea-Olinda Unified
7th % 88
83
9th % 86
90
11th % 85
56
NT % 87
55
Buena Park Elementary
Capistrano Unified
Fountain Valley Elementary
Fullerton Elementary
Fullerton Joint Union High
Garden Grove Unified
81
88
85
87
87
85
83
68
75
74
80
98
65
77
Huntington Beach City Elementary
Huntington Beach Union High
Irvine Unified
82
91
82
87
74
84
77
90
La Habra City Elementary
Laguna Beach Unified
Los Alamitos Unified
82
86
85
81
80
84
60
Newport-Mesa Unified
Ocean View
77
63
82 57 80
Orange County Department of Education
Orange Unified
Placentia-Yorba Linda Unified
100
SBE - Magnolia Science Academy Santa Ana
Saddleback Valley Unified
Santa Ana Unified
87
92
85
88
80
73
84
62
Tustin Unified 85 67 66
Westminster 89
Notes: Response rates are presented by grade level. Eligible districts listed are based on CBEDS 2018-19 public school and enrollment data files.
Orange County Page 59 2017-19 Main Report – Appendix I

Appendix II 2018-19 CHKS Secondary Survey Response Rates
Eligible Districts
Anaheim Union High
Brea-Olinda Unified
Buena Park Elementary
7th %
9th %
11th %
NT %
Capistrano Unified 88 84 75 100
Fountain Valley Elementary
Fullerton Elementary
Fullerton Joint Union High 82 74 62
Garden Grove Unified 84 74 78 81
Huntington Beach City Elementary
Huntington Beach Union High
Irvine Unified
La Habra City Elementary
Laguna Beach Unified
Los Alamitos Unified
Newport-Mesa Unified
Ocean View 86
Orange County Department of Education
Orange Unified
Placentia-Yorba Linda Unified
SBE - Magnolia Science Academy Santa Ana
Saddleback Valley Unified
Santa Ana Unified 91 77 88 20
Tustin Unified
Westminster
Notes: Response rates are presented by grade level. Eligible districts listed are based on CBEDS 2018-19 public school and enrollment data files.
Orange County Page 60 2017-19 Main Report – Appendix II
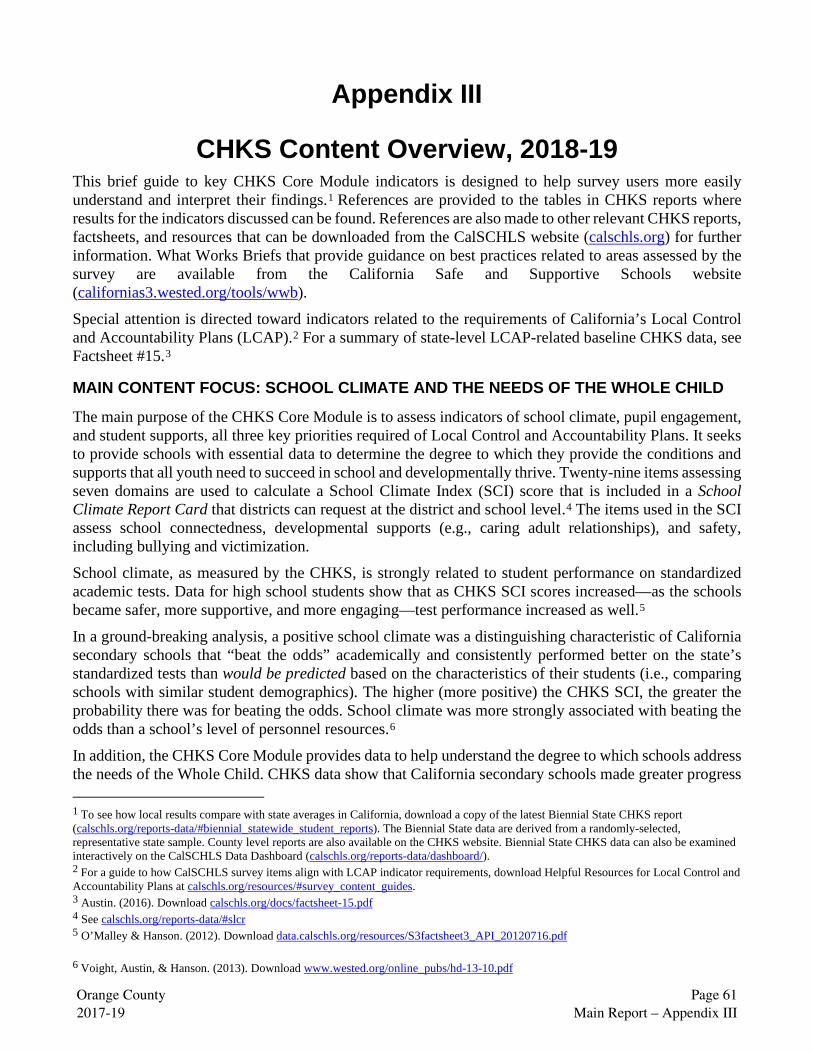
Appendix III
CHKS Content Overview, 2018-19
This brief guide to key CHKS Core Module indicators is designed to help survey users more easily understand and interpret their findings.1 References are provided to the tables in CHKS reports where results for the indicators discussed can be found. References are also made to other relevant CHKS reports, factsheets, and resources that can be downloaded from the CalSCHLS website (calschls.org) for further information. What Works Briefs that provide guidance on best practices related to areas assessed by the survey are available from the California Safe and Supportive Schools website (californias3.wested.org/tools/wwb).
Special attention is directed toward indicators related to the requirements of California’s Local Control and Accountability Plans (LCAP).2 For a summary of state-level LCAP-related baseline CHKS data, see Factsheet #15.3
MAIN CONTENT FOCUS: SCHOOL CLIMATE AND THE NEEDS OF THE WHOLE CHILD
The main purpose of the CHKS Core Module is to assess indicators of school climate, pupil engagement, and student supports, all three key priorities required of Local Control and Accountability Plans. It seeks to provide schools with essential data to determine the degree to which they provide the conditions and supports that all youth need to succeed in school and developmentally thrive. Twenty-nine items assessing seven domains are used to calculate a School Climate Index (SCI) score that is included in a School Climate Report Card that districts can request at the district and school level.4 The items used in the SCI assess school connectedness, developmental supports (e.g., caring adult relationships), and safety, including bullying and victimization.
School climate, as measured by the CHKS, is strongly related to student performance on standardized academic tests. Data for high school students show that as CHKS SCI scores increased—as the schools became safer, more supportive, and more engaging—test performance increased as well.5
In a ground-breaking analysis, a positive school climate was a distinguishing characteristic of California secondary schools that “beat the odds” academically and consistently performed better on the state’s standardized tests than would be predicted based on the characteristics of their students (i.e., comparing schools with similar student demographics). The higher (more positive) the CHKS SCI, the greater the probability there was for beating the odds. School climate was more strongly associated with beating the odds than a school’s level of personnel resources.6
In addition, the CHKS Core Module provides data to help understand the degree to which schools address the needs of the Whole Child. CHKS data show that California secondary schools made greater progress
1 To see how local results compare with state averages in California, download a copy of the latest Biennial State CHKS report (calschls.org/reports-data/#biennial_statewide_student_reports). The Biennial State data are derived from a randomly-selected, representative state sample. County level reports are also available on the CHKS website. Biennial State CHKS data can also be examined interactively on the CalSCHLS Data Dashboard (calschls.org/reports-data/dashboard/). 2 For a guide to how CalSCHLS survey items align with LCAP indicator requirements, download Helpful Resources for Local Control and Accountability Plans at calschls.org/resources/#survey_content_guides. 3 Austin. (2016). Download calschls.org/docs/factsheet-15.pdf 4 See calschls.org/reports-data/#slcr 5 O’Malley & Hanson. (2012). Download data.calschls.org/resources/S3factsheet3_API_20120716.pdf
6 Voight, Austin, & Hanson. (2013). Download www.wested.org/online_pubs/hd-13-10.pdf
Orange County Page 61 2017-19 Main Report – Appendix III
in raising standardized test scores over a one-year period when they had higher percentages of students who: (1) were less engaged in risky behaviors such as substance use and violence; (2) were more likely to eat nutritiously and exercise; and (3) reported experiencing caring adult relationships and high expectations at school.7 These results suggest that addressing the health and developmental needs of youth is a critical component of a comprehensive strategy for meeting accountability demands for improved academic performance.
GRADE-LEVEL PATTERNS
More than twenty years of survey administration has demonstrated that as youth progress through secondary school, they become: (1) less likely to feel connected to school and be academically motivated; and (2) more likely to report truancy, involvement in substance use, and chronic sadness and hopelessness. Here are some additional grade-level patterns in CHKS data:
• Seventh graders report the highest rates of harassment and victimization, as well as participation in a physical fight and seeing a weapon on campus.
• Ninth graders report the lowest rates of developmental support and perceived safety.
• Nontraditional (continuation school) students report risk behavior (e.g., binge drinking, fighting at school) prevalence rates at least twice those of 11th graders in traditional comprehensive high schools. 8 They also exhibit lower perceived school safety, school connectedness, and developmental supports. Continuation school students are a highly vulnerable population in need of a wide range of academic, social, emotional, and behavioral supports and intervention services.9
DEMOGRAPHIC CHARACTERISTICS AND POPULATION SUBGROUP DIFFERENCES (Section 3)
A wide range of indicators of the demographic and background characteristics of the survey respondents help users gain a better sense of how representative the survey sample is compared to the student population overall. They also enable users to analyze how survey results vary by important subgroups in the school and help them to identify, and target programs for, youth most in need. School districts can use these data to meet the LCAP requirement to demonstrate actions across state priorities in regard to socioeconomically disadvantaged students, English learners, and foster youth, as well as other indicators such as race/ethnicity, homeless youth, and LGBT youth.
In the standard CHKS report, breakdowns for selected key indicators are provided by race/ethnicity and gender. For selected key indicators, the CalSCHLS Data Dashboard (calschls.org/reports-data/dashboard/) can be used to display subgroup differences by gender, race/ethnicity, parental education, parent military status, homeless and migrant status, afterschool participation, gender identity, and sexual orientation. Results can also be displayed for English learners, free and reduced-priced meal eligible students, and foster youth–three important LCAP priority subgroups. Districts/schools can also request reports disaggregating all their results by demographic characteristics from their CalSCHLS Regional Center (call 888.841.7536 or email [email protected]).
7 Hanson & Austin. (2003). Download data.calschls.org/resources/FACTSHEET-3.pdf 8 In interpreting the results for 11th graders, note that many youth who are most disengaged and involved in high risk behaviors may have already dropped out of school or did not participate in the survey because of truancy or absenteeism. 9 Austin, Dixon, & Bailey. (2007). Download data.calschls.org/resources/FACTSHEET-7.pdf
Orange County Page 62 2017-19 Main Report – Appendix III
Racial-Ethnic Identification
Respondents self-report their identification with six racial/ethnic groups plus mixed (two or more) race. In one study of CHKS data, both academic performance and school well-being—the degree to which students feel safe at, supported by, and connected to the school—varied consistently and persistently across schools by racial/ethnic groupings.10 They were lowest in schools with large proportions of African American and Hispanic students, as well as in low-income schools. Controlling for socioeconomic status and other school demographic characteristics reduced these racial/ethnic group differences, but they still remained. This suggests that school climate factors related to student well-being may also play a role in the racial-ethnic achievement gap. One strategy to close the gap may be to enhance learning supports that foster caring adult relationships, high expectations, meaningful participation, safety, and connectedness in schools serving large proportions of low-income African American and Hispanic students.
In the majority of cases, with notable exceptions for Asians, the racial/ethnic gaps in performance, engagement, perceived support, and safety are greater within-schools than between-schools.11 African American, Latino, and Asian students feel less safe, engaged, and supported than their White peers within the same school. Inequities in these factors, for the various racial/ethnic groups, can possibly contribute to the achievement gap. Further, these findings suggest that practices designed to ensure equal access to academic resources, opportunities, learning supports, and promotion of common experiences may be effective in ameliorating the gap.
Foster Care Youth
Compared to youth who live with their parents, foster care youth report much higher rates of substance abuse, poor school attendance and grades, more violence-related behaviors, more harassment, and higher depression risk. 12 They were also more likely to be low in caring adult relationships and total developmental support.
Sexual Orientation and Gender Identity
Lesbian, gay, bisexual, and transgender (LGBT) youth are at elevated risk for bullying and violence victimization, mental health problems, drug and alcohol use, and exhibiting poor performance in school.13 For example, analysis of the latest Biennial CHKS data indicate that LGBT youth14 are:
• about 30 percentage points more likely than non-LGBT youth to experience harassment and bullying at school;
• 30-to-40 percentage points more likely to exhibit chronic sadness; • 2-to-3 times more likely to smoke cigarettes, binge drink, and to have been drunk or high at school;
and • receive substantially fewer social supports from teachers and peers at school than their
counterparts who do not identify as LGBT. Because of such disparities, it is important to examine disparities across LGBT and non-LGBT youth to identify needs and support the development of practices that promote the healthy development and safety of all youth.
10 Austin, Hanson, Bono, & Zheng. (2008). Download data.calschls.org/resources/factsheet_8.pdf 11 Hanson, Austin, & Li. (2012). Download data.calschls.org/resources/FACTSHEET-13_20120405.pdf 12 Austin, Jones, & Annon. (2007). Download data.calschls.org/resources/FACTSHEET-6.pdf 13 Russell, S. T., & Fish, J. N. (2016). Mental health in lesbian, gay, bisexual, and transgender (LGBT) youth. Annual Review of Clinical Psychology, 12, 465-487. 14 See calschls.org/reports-data/dashboard/
Orange County Page 63 2017-19 Main Report – Appendix III

SCHOOL PERFORMANCE, SUPPORTS, AND ENGAGEMENT (Section 4)
A major focus of the CHKS is providing data to gauge the level of pupil engagement, an LCAP state priority on which districts are required to show improvement. Enhancing student engagement has been identified as the key to addressing problems of low achievement, high levels of student misbehavior, alienation, and high dropout rates.15 A 2009 Gallup study found that a one-percentage-point uptick in a school's average student engagement was connected to a six-point increase in reading achievement and eight points in math.16 CHKS and other surveys consistently show that as youth progress through the school system, indicators of engagement decline.
It is important to look at engagement from three perspectives: behavioral, emotional, and cognitive. The CHKS provides data on all three types. As discussed below, the Academic Motivation scale and self-reported grades provide insight into cognitive engagement; the School Connectedness scale, into emotional engagement; attendance and truancy data, on behavioral engagement. Other behavioral engagement indicators on the survey include substance use at school and violence perpetration. Research shows that student engagement is malleable and that all three types are influenced by the level to which students perceive the school as having a positive environment.
The CHKS Developmental Supports scales provide insight into whether students experience in their school the three protective factors that characterize a positive school climate and are linked to school connectedness and positive academic, behavioral, and health outcomes. Other school climate factors assessed are the level of parent involvement and the quality of the school physical environment, both also LCAP priorities. The likelihood that students will be motivated and engaged is increased to the extent that their teachers, family, and friends effectively support their purposeful involvement in learning and in school.
Self-Reported Grades
The CHKS asks students to indicate what grades they mostly received in school in the past 12 months. Although self-reports are not as accurate as actual report card data, they provide a general sense of the school performance of the survey respondents from their self-perception. To learn more about the factors that might be causing poor performance, request a CHKS report showing how all the survey results vary by level of performance (call 888.841.7536 or email [email protected]).
Academic Motivation
A four-item scale gauges student academic motivation by asking how strongly they agree that they try hard to do well on schoolwork, try hard because they are interested in the work, work hard to understand new things at school, and always try to do better. On the 2015-17 State CHKS, the percentage of students strongly agreeing with the questions on this scale declined from 45 percent in 7th grade to 28 percent in 11th.17
In order to achieve rigorous academic goals, students need not only a challenging and engaging curriculum, but they need to be emotionally connected to their learning. Student perceptions of the school environment and their degree of school connectedness influence their achievement motivation. But students may be behaviorally and/or emotionally invested in a given activity without actually exerting the
15 Wang, M-T, & Eccles, J. (2013). School context, achievement motivation, and academic engagement: A longitudinal study of school engagement using a multidimensional perspective. Learning and Instruction, 28, 12-23. 16 Gallop. (2014). Download www.gallup.com/services/178769/state-america-schools-report.aspx 17 Austin, Hanson, Polik, & Zheng. (2018). Download data.calschls.org/resources/Biennial_State_1517.pdf
Orange County Page 64 2017-19 Main Report – Appendix III
necessary mental effort to understand and master the knowledge, craft, or skill that the activity promotes. This scale provides insight into the overall level of that mental effort.
In addition, the supplementary School Climate Module includes an Academic Mindset and Learning Engagement scale and a series of questions about supports for learning and academic rigor.
Absenteeism and Truancy
Before good teachers with quality curriculums and engaging activities can improve academic performance, the students have to show up. The CHKS provides data to identify what proportion of respondents are at risk of chronic absenteeism (missed 2 or more days during the past 30 days), what were the reasons for absences, and the level of truancy. Users can request reports looking at the characteristics of youth based on absenteeism and truancy indicators to guide efforts to improve the LCAP pupil engagement priority (call 888.841.7536 or email [email protected]). Poor attendance is a marker of a wider variety of other problems, including low school connectedness and learning engagement. Both the US Department of Education and the California Office of the Attorney General have launched initiatives designed to raise awareness about and combat chronic absenteeism, generally defined as missing 10 percent of school days. According to a report by Attendance Works, the nation’s large and persistent achievement gaps are rooted in a largely hidden crisis of chronic absenteeism, especially among low-income and minority children.18
Biennial State CHKS data indicate that the most important reasons for being absent in secondary school, after illness, are generally not getting enough sleep and anxiety or stress, followed by being behind in school work, and being bored or uninterested in school, another good indicator of disengagement.19
Truancy has been identified as one of the most powerful predictors of both poor achievement and delinquency.20 Truants are also more likely to use drugs and have deviant friends. Among high school staff statewide, truancy is the top-rated of fourteen potential school problems assessed by the California School Staff Survey.
Developmental Supports
Research shows that when schools (or families or communities) provide three developmental supports—caring adult relationships, high expectations, and opportunities for meaningful participation—students are more likely to report more positive academic, social-emotional, and health outcomes, including higher grades, school connectedness, attendance, and perceived safety. CHKS measures these supports using multi-item scales. Results overall suggest that the great majority of students do not receive sufficient levels of support and that the supports received are lower in high school than in middle school, even though student need for them is arguably higher.21 22 23 24 25 26
18 Attendance Works & Everyone Graduates Center. (2017, September). Portraits of Change: Aligning School and Community Resources to Reduce Chronic Absence. Download www.attendanceworks.org/portraits-of-change/ 19 Austin, Hanson, Polik, & Zheng. (2018). Download data.calschls.org/resources/Biennial_State_1517.pdf 20 Robins & Ratcliff. (1978). Long Range Outcomes Associated With School Truancy. Rockville, MD: Public Health Service (DHEW). Garry, E. M., & Department of Justice, Washington, DC. Office of Juvenile Justice and Delinquency Prevention. (1996). Truancy: First Step to a Lifetime of Problems. Cairns, R. B., Cairns, B. D., & Neckerman, H. J. (1989). Early school dropout: Configurations and determinants. Child Dev, 60(6), 1437-52. 21 Hanson & Austin. (2002). Download data.calschls.org/resources/factsheet.pdf 22 Hanson & Austin. (2002). Download data.calschls.org/resources/FACTSHEET-3.pdf 23 Hanson. (2011). Download data.calschls.org/resources/S3factsheet1_caring_20120223.pdf 24 Hanson. (2012). Download data.calschls.org/resources/S3factsheet2_participation_20120224.pdf 25 O’Malley & Amarillas. (2011). Download data.calschls.org/resources/S3_WhatWorksBrief1_CaringRelationships_final.pdf 26 O’Malley & Amarillas. (2011). Download data.calschls.org/resources/S3_WhatWorksBrief2_MeaningfulPart_final.pdf
Orange County Page 65 2017-19 Main Report – Appendix III

School Connectedness
School connectedness is one of the indicators of school climate that a California school district must address in its LCAP. Research shows that school connectedness is associated with multiple positive academic, social-emotional, and health outcomes.27 It also shows that youth who feel safe at school, experience caring adults, and have opportunities for engagement and other developmental supports are more likely to feel connected to the school. The CHKS five-item School Connectedness scale is an important differentiator between low-performing and high-performing high schools and has value as an indicator of school quality. The online Query CalSCHLS system (calschls.org/reports-data/query-calschls/) enables examination of how key survey indicators vary by school connectedness. School connectedness appears to have increased in California in the second half of the last decade, but it still declines markedly after elementary school. A substantial majority of high school students are not highly connected to their schools. On the 2015-17 State CHKS, the average percentage of students strongly agreeing to these scale questions declined from 28 percent in 7th grade to 15 percent in 11th, a decline similar to that found for the Academic Motivation scale.28 This may be related at least in part to their lower levels of developmental support. Prior analyses have indicated that the lowest rates of both connectedness and test scores are in low-income schools.29 30
Parent Involvement
Parent involvement, including promoting parental participation in pupil programs, is one of the LCAP state priorities. A three-item scale assesses student perceptions (level of agreement) of three components of parental involvement: teachers communicating with parents about what students are expected to learn in class, parents feeling welcome to participate at this school, and school staff taking parent concerns seriously. The same questions also are asked on the staff and parent surveys so that perceptions can be compared across all three stakeholder groups. A large and growing body of evidence has linked school success to the manner and degree to which a school communicates with parents, engages them both in school activities and education, and fosters a school climate that parents perceive as warm, inviting, and helpful.31
Facilities and Physical Environment
As an indicator of student perceptions of the school’s physical environment, the CHKS includes a question asking students how much they agree the school “is usually clean and tidy.” Additional questions are included in the supplementary School Climate Module. An analysis of data from the questions on both modules found that a plurality of students report that their school facilities are in good condition, but a non-trivial minority of students were dissatisfied with the condition of their school facilities.32 Between 20 percent and 25 percent of students disagree or strongly disagree on the quality of the physical environment items. Almost one-third of schools serving 11th graders were categorized as having low quality physical environments based on student reports on the clean and tidy item. Student perceptions of the quality of their school’s physical environment were strongly related to student achievement.
27 National Research Council and the Institute of Medicine. (2004). Engaging schools: Fostering high school students’ motivation to learn. Washington, D.C.: The National Academies Press. 28 Austin, Hanson, Polik, & Zheng. (2018). Download data.calschls.org/resources/Biennial_State_1517.pdf 29 Austin, Hanson, & Voight. (2013). Download data.calschls.org/resources/S3factsheet5_connectedness_20130827.pdf 30 O’Malley & Amarillas. (2011). Download data.calschls.org/resources/S3_WhatWorksBrief4_Connectedness_final.pdf 31 Wilder, S. (2014). Effects of parental involvement on academic achievement. A meta-synthesis. Educational Review, 66:3, 377-397. 32 Hanson & Austin. (2017). Download calschls.org/docs/facilities122216.pdf
Orange County Page 66 2017-19 Main Report – Appendix III

SCHOOL VIOLENCE, VICTIMIZATION, AND SAFETY (Section 5)
The CHKS asks students a wide range of questions to ascertain the scope and nature of physical and verbal violence and victimization that occurs on campus, as well as vandalism, and the overall level of school safety.33 Physical violence and weapons on campus have long been a major public concern. Equally disruptive are the uncounted acts of bullying, teasing, and other nonviolent misbehavior among youth, such as substance use and sales on campus.34 These behaviors adversely affect not only students’ ability to learn and willingness to attend school, but also the overall school environment, the ability of teachers to teach, and the willingness of adults to enter the teaching profession.35 36 37
Perceived Safety
Perceived safety is another indicator that districts/schools are required to monitor as part of their LCAP school climate priority. School safety is more than the antithesis of violence. Perceived school safety is psychological as well as physical. Feelings of insecurity can have multiple sources, not all of which correctly reflect the level of danger and violence on a school campus, such as verbal bullying. Both physical and psychological safety are essential for high quality teaching and learning. It is a key factor in students feeling connected to school. Another indicator important for attendance is the percentage of students who report missing school because they didn’t feel safe (Table A4.4).
State CHKS data show that the percentage of students who perceive their school as safe or very safe has consistently dropped markedly between 7th and 9th grades.38 If students report low levels of perceived school safety, pay close attention to all the indicators related to bullying and victimization, as well as mental health. Schools may want to request comparisons of students’ perceptions of their own safety with the actual level of violence and other safety-related indicators self-reported by students. Consider conducting follow-up student voice and feedback sessions such as focus groups or Student Listening Circles and integrating questions on why students do not feel safe.39
Harassment and Victimization
Most of the safety-related questions on the survey assess victimization. Because a relatively small number of students can victimize a large number of their peers, victimization questions provide more insight into the overall school climate. Nonviolent harassment in any form—threats, intimidation, rumors, and ostracism—can instill a sense of vulnerability, isolation, frustration, and fear among its victims, leading to engagement in health risk behaviors or avoidance behaviors such as missing school and social isolation. This type of misbehavior, vastly more common than any other, ruins the school day for many students. In Bruised Inside (2000), the National Association of Attorneys General describes harassment by peers as one of the two causes for kids to express anger using guns, knives, and fists.40 The CHKS asks about the frequency with which students experienced any bullying/harassment related to six bias-related categories (gender, race/ethnicity, disability, sexual identity, religion, immigrant status),
33 The CHKS also includes two violence-related questions that are not school based: the frequency students experienced cyberbullying and whether they are gang members. 34 Juvonen, J., & Graham, S. (2001). Peer harassment in school: The plight of the vulnerable and victimized. New York: Guilford Press. 35 Barton, P. E. (2001). Facing the hard facts in education reform. Princeton, NJ: Educational Testing Service. 36 O’Malley & Amarillas. (2011). Download data.calschls.org/resources/S3_WhatWorksBrief5_ViolencePerpetration_final.pdf 37 O’Malley & Amarillas. (2011). Download data.calschls.org/resources/S3_WhatWorksBrief6_ViolenceVictimization_final.pdf 38 Austin, Hanson, Polik, & Zheng. (2018). Download data.calschls.org/resources/Biennial_State_1517.pdf 39 O’Malley & Amarillas. (2011). Download data.calschls.org/resources/S3_WhatWorksBrief3_Safety_final.pdf 40 Horn, D. M., National Association of Attorneys General., & Washington (State). (2000). Bruised inside: What our children say about youth violence, what causes it, and what we need to do about it: A report of the National Association of Attorneys General (NAAG). Washington, DC: National Association of Attorneys General.
Orange County Page 67 2017-19 Main Report – Appendix III
as well as for any other reason (Table A5.2). About three-in-ten secondary students report experiencing some harassment in the past year on the State CHKS, with the percentages declining between 7th and 11th grades.41 Analyses show that victims of harassment are more likely to not feel safe at, and connected to, school; to have higher truancy; and to experience lower developmental (resilience) supports at school.42 43 They report higher rates of fighting and weapons possession at school, as well as risk of depression. Students who report bias-related harassment, particularly for disability and sexual orientation, have poorer well-being than students who were only harassed for other reasons.
Different forms of verbal harassment at school are assessed: mean rumors or lies; sexual-related jokes, comments, or gestures; being made fun of because of looks or speech; and, more generally, being made fun of, insulted or called names. Physical victimization is assessed by having been pushed/shoved, threatened with harm or injury (without or without weapon), and being afraid of being beaten up. Students are also asked whether they have ever been in a physical fight as a measure of general violence.
The supplementary School Climate Module includes Bullying Prevention and Respect for Diversity scales to provide insight into what the school is doing to reduce the problem.
Vandalism and Weapons
Two other safety-related areas assessed by the survey are school vandalism and weapons possession. Students are asked whether they damaged school property or had their property damaged at school and whether they carried a knife or other weapon to school or observed someone doing it. Overall, weapons possession is not common. Statewide, only about two percent of secondary students report carrying a gun and 4-5 percent report carrying another weapon.44 About 16 percent of 7th and 9th graders reporting seeing someone carrying a weapon, dropping to 13 percent of 11th graders.
SUBSTANCE USE AND MENTAL HEALTH (Sections 6-8)
Two important barriers to learning, positive youth development, and health are assessed: substance use and mental health.
Alcohol and Other Drug Use (Section 6)
The misuse of alcohol and other drugs (AOD) continues to be among the most important issues confronting the nation. For schools, the problem is particularly relevant. Years of research have shown that adolescent substance use is closely connected to academic performance and contributes to raising the level of truancy and absenteeism, special education, disciplinary problems, disengagement and dropout rates, teacher turnover, and property damage.
Reflecting this, on the California School Staff Survey, high school staff statewide are more likely to perceive alcohol and drug use as moderate to severe problems at their schools than all of seven violence-related indicators (49% for both alcohol and drugs in 2004-06), ranking them among the top 3 of 14 problem indicators.45
Alcohol and Other Drug Use at School (Section 6)
AOD use at school is especially troubling. It reflects a level of drug involvement so pervasive that the
41 Austin, Hanson, Polik, & Zheng. (2018). Download data.calschls.org/resources/Biennial_State_1517.pdf 42 Heck, Russell, O’Shaughnessy, Laub, Calhoun, & Austin. (2005). Download data.calschls.org/resources/FACTSHEET-4.pdf 43 Austin, Nakamoto, & Bailey. (2010). Download data.calschls.org/resources/FACTSHEET-10.pdf 44 Austin, Hanson, Polik, & Zheng. (2018). Download data.calschls.org/resources/Biennial_State_1517.pdf 45 Statewide CSSS. (2018). Download data.calschls.org/resources/Statewide_1517_CSSS.pdf
Orange County Page 68 2017-19 Main Report – Appendix III

potential repercussions for violation of school rules are disregarded by these youths. This is behavior that threatens not only the user’s learning ability but also school efforts to educate all youth. It also is an indirect indicator of school disengagement. An analysis of CHKS data found that substance use and intoxication at school, being offered drugs at school, and lifetime intoxication, were significantly related to changes in California achievement test scores one year later.46 Schools with proportionately large numbers of students who reported these behaviors exhibited smaller gains in test scores than other schools.47 48
Cigarette Smoking (Section 7)
Current smokers are significantly more likely than nonsmokers to engage in alcohol and other drug use, be involved in violence and gang membership, and experience school-related problems and disengagement. To a lesser extent, current smokers are also more likely than nonsmokers to be victims of violence and harassment, feel unsafe at school, and experience incapacitating sadness and loneliness. These results suggest that efforts to reduce student smoking may be more successful if embedded in approaches that address a broad range of risk behaviors and problems.49 50
Mental Health (Section 8)
The CHKS Core provides two measures for assessing mental health among students: (1) whether they experience chronic, incapacitating sadness or hopelessness; and (2) whether they ever contemplated suicide. Students who experience chronic sadness, compared to their peers who do not, are at elevated risk of a wide range of educational, health, social, and emotional problems, including lower school attendance, performance, and connectedness. 51 They also report lower levels of the developmental supports in their schools and communities that have been shown to mitigate these problems. Similar findings are found among youth who have contemplated suicide.52
CHKS data also show that students who report bias-related harassment, particularly for disability and sexual orientation, have poorer overall well-being than students who are harassed for other reasons or not harassed. Students who report any harassment are about twice as likely to experience chronic sadness/hopelessness than their non-harassed peers.53 54
See also the percentage of students who report missing school because they “felt very sad, hopeless, anxious, stressed, or angry” (Table A4.4). In addition, the supplementary School Climate Module includes a Social and Emotional Supports scale that provides insight from students on what the school does to help promote mental health and the fostering of social-emotional competencies.
46 Hanson, T. L., Austin, G. A., & Lee-Bayha, J. (2004). Ensuring that No Child is Left Behind: How are Student Health Risks & Resilience Related to the Academic Progress of Schools. San Francisco: WestEd. 47 Hanson & Austin. (2003). Download data.calschls.org/resources/FACTSHEET-3.pdf 48 O’Malley & Amarillas. (2011). Download data.calschls.org/resources/S3_WhatWorksBrief8_AOD_final.pdf 49 Hanson & Zheng. (2006). Download data.calschls.org/resources/factsheet2update.pdf 50 Austin, McCarthy, Slade, & Bailey. (2007). Download data.calschls.org/resources/FACTSHEET-5.pdf 51 Austin, Nakamoto, & Bailey. (2010). Download data.calschls.org/resources/FACTSHEET-11.pdf 52 Austin, Cragle, Delong-Cotty. (2012). Download data.calschls.org/resources/FACTSHEET-12.pdf 53 Heck, Russell, O’Shaughnessy, Laub, Calhoun, & Austin. (2005). Download data.calschls.org/resources/FACTSHEET-4.pdf 54 Austin, Nakamoto, & Bailey. (2010). Download data.calschls.org/resources/FACTSHEET-10.pdf
Orange County Page 69 2017-19 Main Report – Appendix III