Embed Size (px)
Citation preview
2013 – 2014 Target & Norm Charts
TARGET AND NORM CHARTS2013-2014 Version
St. Croix River Education DistrictPlease discard your “green packet” from the 2012-2013
school year, and replace it with this current “blue packet” of targets and norms for our assessments.
October 2013St. Croix River Education District
Rush City, MN 55069
2013 – 2014 Target & Norm Charts
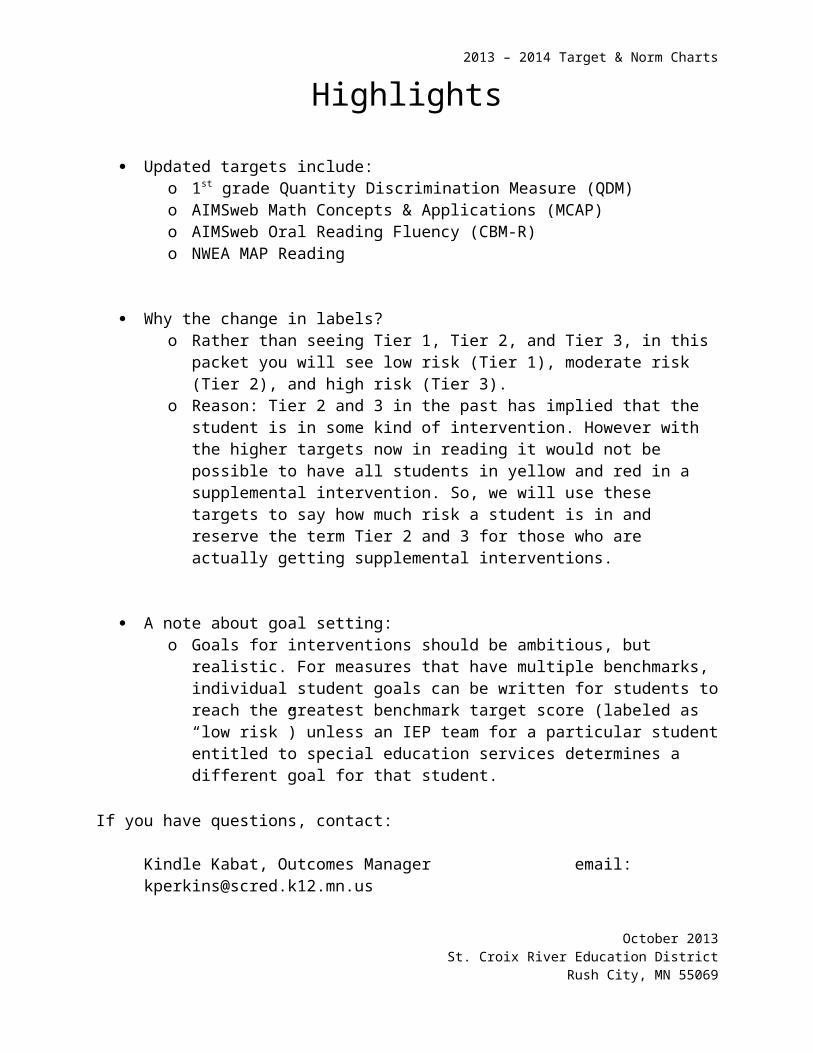
Highlights
Updated targets include:o 1st grade Quantity Discrimination Measure (QDM) o AIMSweb Math Concepts & Applications (MCAP)o AIMSweb Oral Reading Fluency (CBM-R)o NWEA MAP Reading
Why the change in labels? o Rather than seeing Tier 1, Tier 2, and Tier 3, in this packet you will see low risk
(Tier 1), moderate risk (Tier 2), and high risk (Tier 3).o Reason: Tier 2 and 3 in the past has implied that the student is in some kind of
intervention. However with the higher targets now in reading it would not be possible to have all students in yellow and red in a supplemental intervention. So, we will use these targets to say how much risk a student is in and reserve the term Tier 2 and 3 for those who are actually getting supplemental interventions.
A note about goal setting:o Goals for interventions should be ambitious, but realistic. For measures that
have multiple benchmarks, individual student goals can be written for students to reach the greatest benchmark target score (labeled as “low risk”) unless an IEP team for a particular student entitled to special education services determines a different goal for that student.
If you have questions, contact:
Kindle Kabat, Outcomes Manager email: [email protected] Adam Lekwa, Instructional Services Coordinator email: [email protected]
October 2013St. Croix River Education District
Rush City, MN 55069
2013 – 2014 Target & Norm Charts
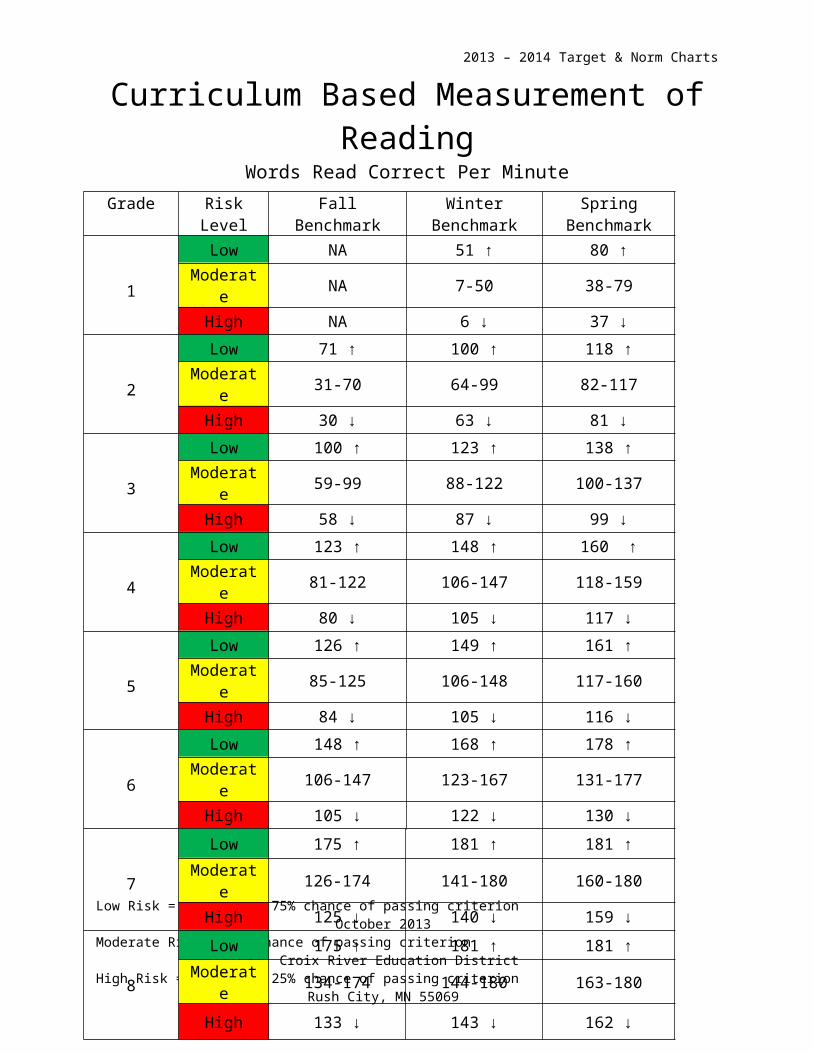
Curriculum Based Measurement of ReadingWords Read Correct Per Minute
Revised in October, 2013
SPED and ADSIS: monitor students once per week using ORF.
Low Risk = at least a 75% chance of passing criterion October 2013Moderate Risk = 50% chance of passing criterion St. Croix River Education DistrictHigh Risk = at best a 25% chance of passing criterion Rush City, MN 55069
Grade Risk Level Fall Benchmark Winter Benchmark Spring Benchmark
1
Low NA 51 ↑ 80 ↑
Moderate NA 7-50 38-79
High NA 6 ↓ 37 ↓
2
Low 71 ↑ 100 ↑ 118 ↑
Moderate 31-70 64-99 82-117
High 30 ↓ 63 ↓ 81 ↓
3
Low 100 ↑ 123 ↑ 138 ↑
Moderate 59-99 88-122 100-137
High 58 ↓ 87 ↓ 99 ↓
4
Low 123 ↑ 148 ↑ 160 ↑
Moderate 81-122 106-147 118-159
High 80 ↓ 105 ↓ 117 ↓
5
Low 126 ↑ 149 ↑ 161 ↑
Moderate 85-125 106-148 117-160
High 84 ↓ 105 ↓ 116 ↓
6
Low 148 ↑ 168 ↑ 178 ↑
Moderate 106-147 123-167 131-177
High 105 ↓ 122 ↓ 130 ↓
7
Low 175 ↑ 181 ↑ 181 ↑
Moderate 126-174 141-180 160-180
High 125 ↓ 140 ↓ 159 ↓
8
Low 175 ↑ 181 ↑ 181 ↑
Moderate 134-174 144-180 163-180
High 133 ↓ 143 ↓ 162 ↓
2013 – 2014 Target & Norm Charts
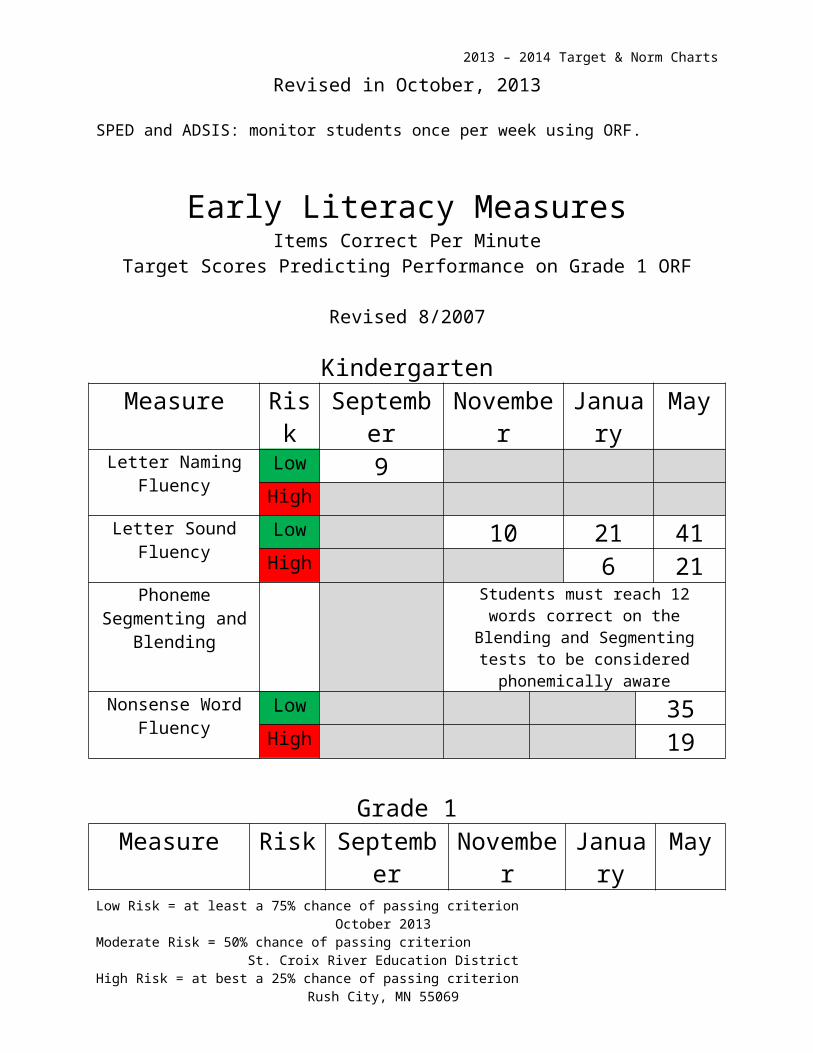
Early Literacy MeasuresItems Correct Per Minute
Target Scores Predicting Performance on Grade 1 ORF
Revised 8/2007
KindergartenMeasure Risk September November January May
Letter Naming Fluency
Low 9High
Letter Sound Fluency Low 10 21 41High 6 21
Phoneme Segmenting and Blending
Students must reach 12 words correct on the Blending and Segmenting tests to be
considered phonemically aware
Nonsense Word Fluency
Low 35High 19
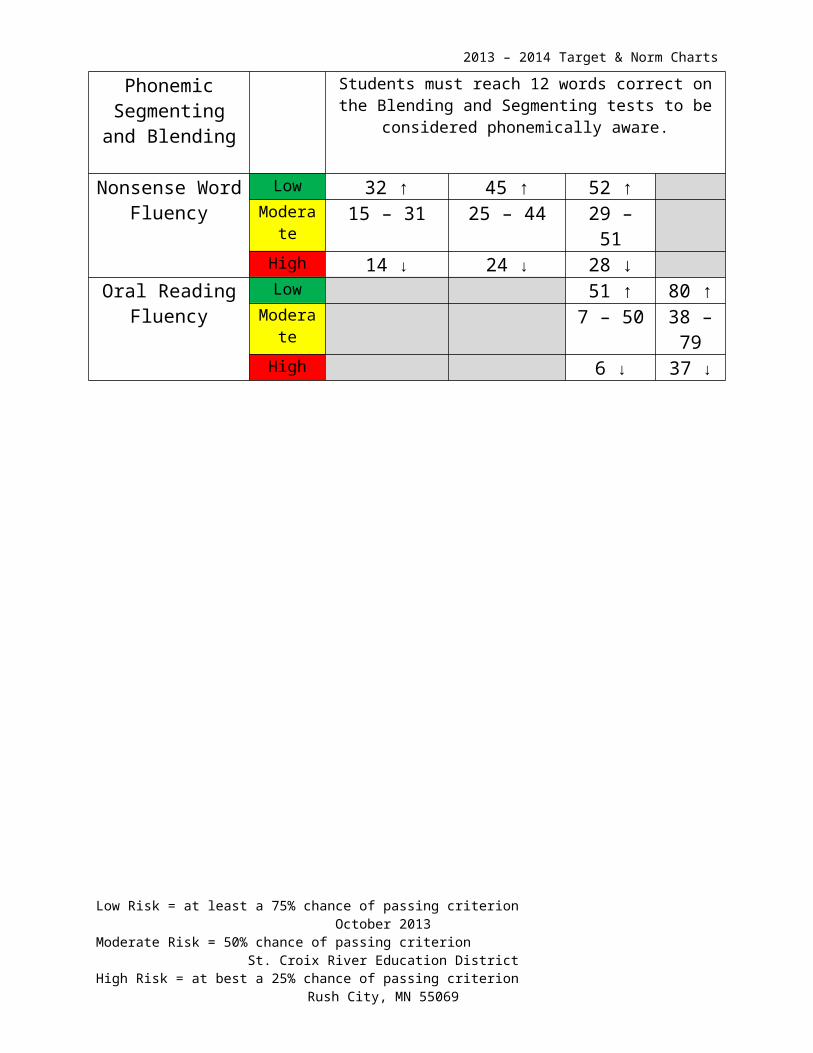
Grade 1Measure Risk September November January MayPhonemic
Segmenting and Blending
Students must reach 12 words correct on the Blending and Segmenting tests to be considered phonemically aware.
Nonsense Word Fluency
Low 32 ↑ 45 ↑ 52 ↑Moderate 15 – 31 25 – 44 29 – 51
High 14 ↓ 24 ↓ 28 ↓Oral Reading
FluencyLow 51 ↑ 80 ↑
Moderate 7 – 50 38 – 79High 6 ↓ 37 ↓
Measures of Academic Progress – ReadingNWEA MAP Reading to MCAIII Reading 2013:
Low Risk = at least a 75% chance of passing criterion October 2013Moderate Risk = 50% chance of passing criterion St. Croix River Education DistrictHigh Risk = at best a 25% chance of passing criterion Rush City, MN 55069
2013 – 2014 Target & Norm Charts
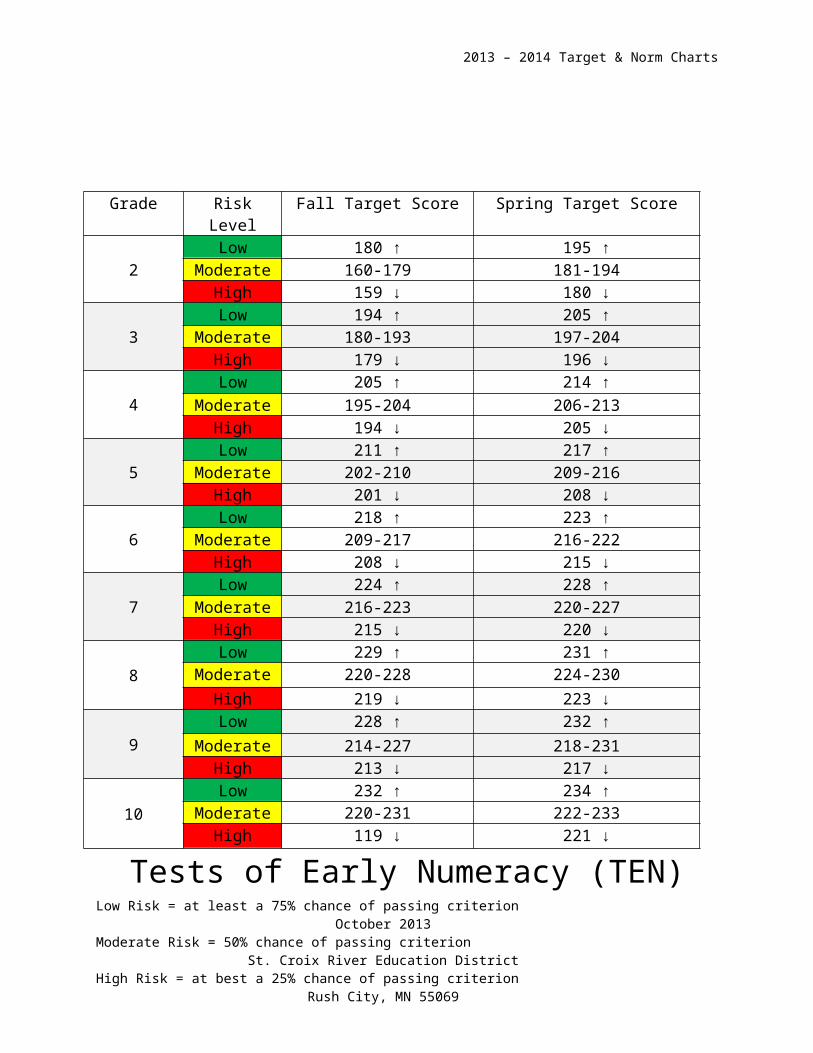
Tests of Early Numeracy (TEN)Items Correct Per Minute
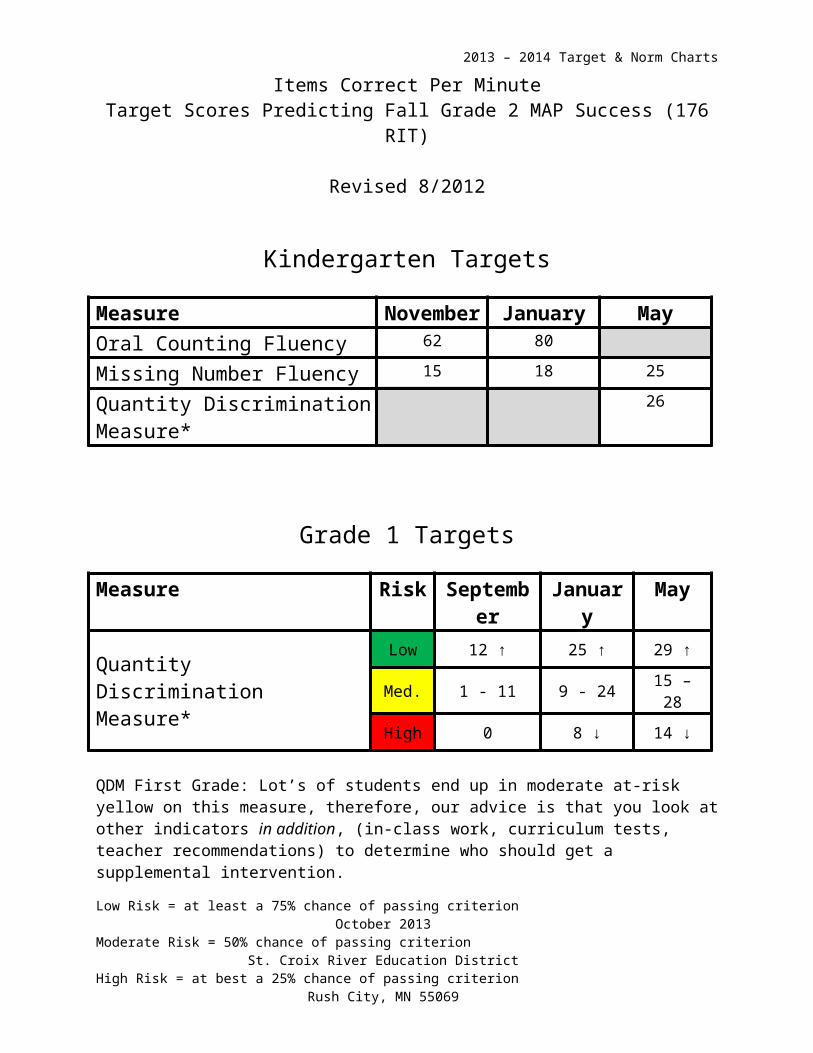
Target Scores Predicting Fall Grade 2 MAP Success (176 RIT)
Revised 8/2012
Low Risk = at least a 75% chance of passing criterion October 2013Moderate Risk = 50% chance of passing criterion St. Croix River Education DistrictHigh Risk = at best a 25% chance of passing criterion Rush City, MN 55069
Grade Risk Level Fall Target Score Spring Target Score
2Low 180 ↑ 195 ↑
Moderate 160-179 181-194High 159 ↓ 180 ↓
3Low 194 ↑ 205 ↑
Moderate 180-193 197-204High 179 ↓ 196 ↓
4Low 205 ↑ 214 ↑
Moderate 195-204 206-213High 194 ↓ 205 ↓
5Low 211 ↑ 217 ↑
Moderate 202-210 209-216High 201 ↓ 208 ↓
6Low 218 ↑ 223 ↑
Moderate 209-217 216-222High 208 ↓ 215 ↓
7Low 224 ↑ 228 ↑
Moderate 216-223 220-227High 215 ↓ 220 ↓
8Low 229 ↑ 231 ↑
Moderate 220-228 224-230High 219 ↓ 223 ↓
9Low 228 ↑ 232 ↑
Moderate 214-227 218-231High 213 ↓ 217 ↓
10Low 232 ↑ 234 ↑
Moderate 220-231 222-233High 119 ↓ 221 ↓
2013 – 2014 Target & Norm Charts
Kindergarten Targets
Measure November January MayOral Counting Fluency 62 80
Missing Number Fluency 15 18 25
Quantity Discrimination Measure* 26
Grade 1 Targets
Measure Risk September
January May
Quantity Discrimination Measure*
Low 12 ↑ 25 ↑ 29 ↑
Med. 1 - 11 9 - 24 15 – 28
High 0 8 ↓ 14 ↓
QDM First Grade: Lot’s of students end up in moderate at-risk yellow on this measure, therefore, our advice is that you look at other indicators in addition, (in-class work, curriculum tests, teacher recommendations) to determine who should get a supplemental intervention.
QDM First Grade: 80% of the students who are at low risk will meet the Fall 2nd Grade MAP target. 66% of the students at high risk will not meet the Fall 2nd Grade MAP target.
*Note: The Oral Counting Fluency and Missing Number Fluency used in this analysis are the same as those available for download on AIMSweb. The Quantity Discrimination Measure used for this analysis was revised to be inclusive of numbers 0-31 in Kindergarten, and 0-100 in Grade 1. Student performance on AIMSweb Quantity Discrimination Fluency probes should not be interpreted relative to the targets provided here.
Low Risk = at least a 75% chance of passing criterion October 2013Moderate Risk = 50% chance of passing criterion St. Croix River Education DistrictHigh Risk = at best a 25% chance of passing criterion Rush City, MN 55069
2013 – 2014 Target & Norm Charts
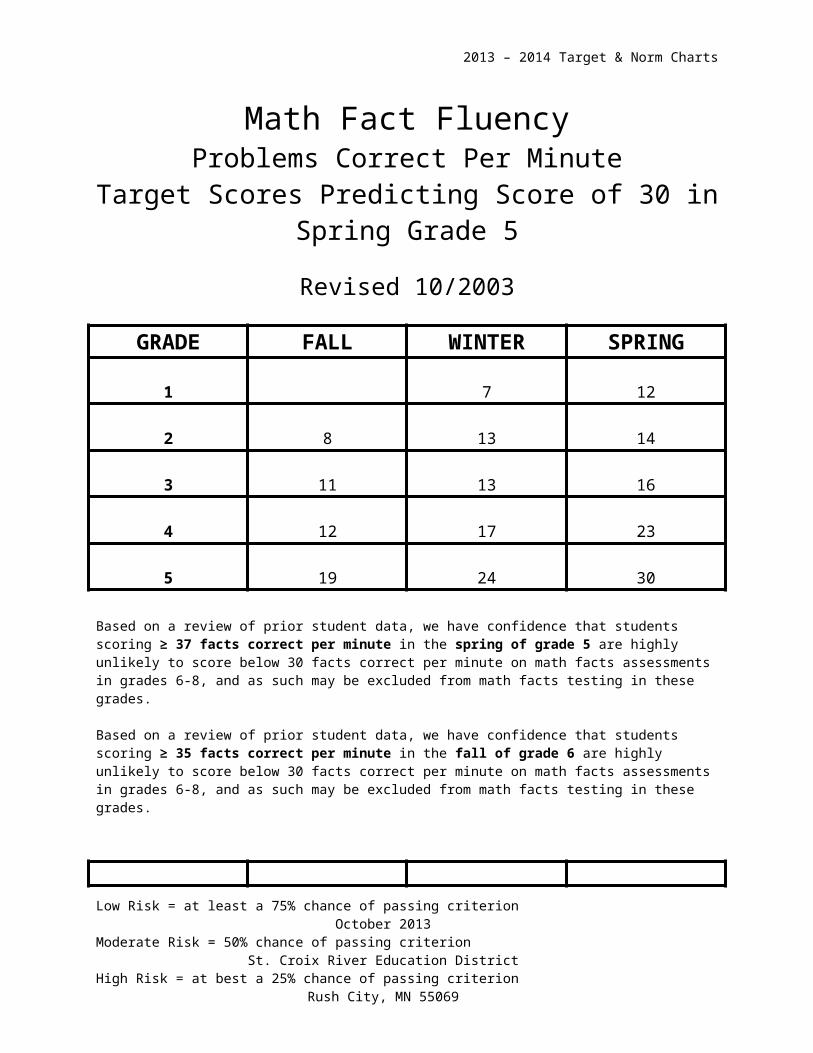
Math Fact FluencyProblems Correct Per Minute
Target Scores Predicting Score of 30 in Spring Grade 5
Revised 10/2003
GRADE FALL WINTER SPRING
1 7 12
2 8 13 14
3 11 13 16
4 12 17 23
5 19 24 30
Based on a review of prior student data, we have confidence that students scoring ≥ 37 facts correct per minute in the spring of grade 5 are highly unlikely to score below 30 facts correct per minute on math facts assessments in grades 6-8, and as such may be excluded from math facts testing in these grades.
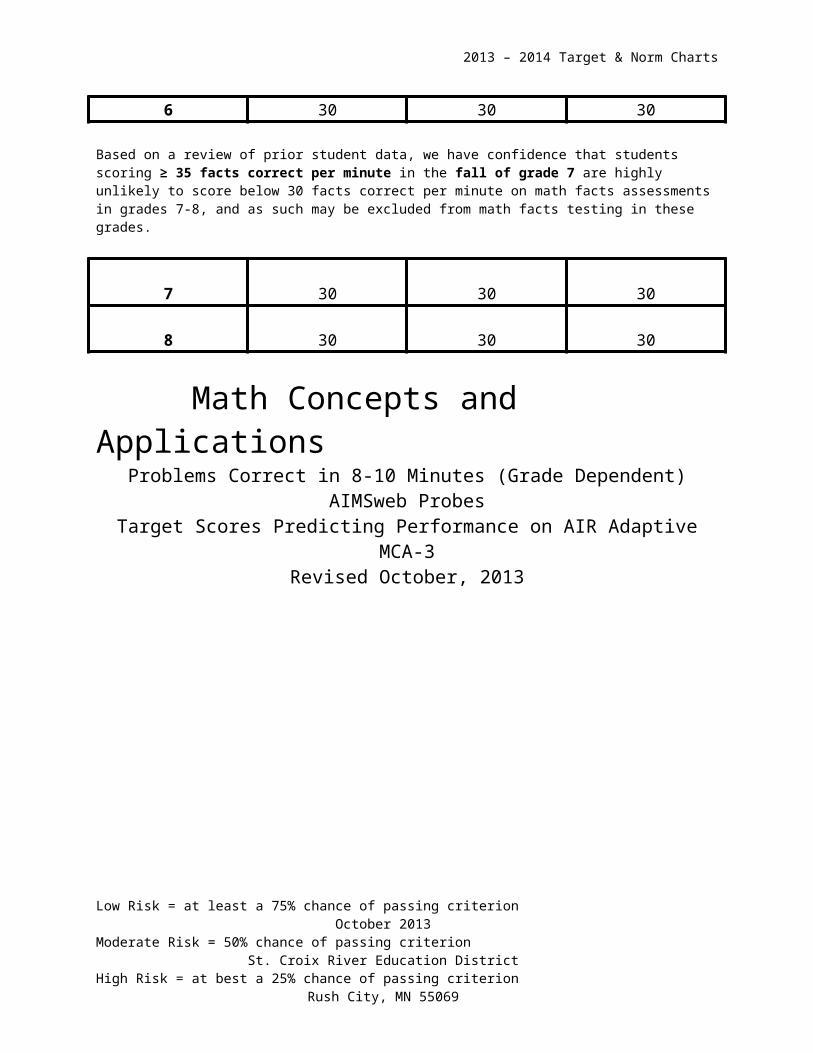
Based on a review of prior student data, we have confidence that students scoring ≥ 35 facts correct per minute in the fall of grade 6 are highly unlikely to score below 30 facts correct per minute on math facts assessments in grades 6-8, and as such may be excluded from math facts testing in these grades.
6 30 30 30
Based on a review of prior student data, we have confidence that students scoring ≥ 35 facts correct per minute in the fall of grade 7 are highly unlikely to score below 30 facts correct per minute on math facts assessments in grades 7-8, and as such may be excluded from math facts testing in these grades.
7 30 30 30
8 30 30 30
Low Risk = at least a 75% chance of passing criterion October 2013Moderate Risk = 50% chance of passing criterion St. Croix River Education DistrictHigh Risk = at best a 25% chance of passing criterion Rush City, MN 55069
2013 – 2014 Target & Norm Charts
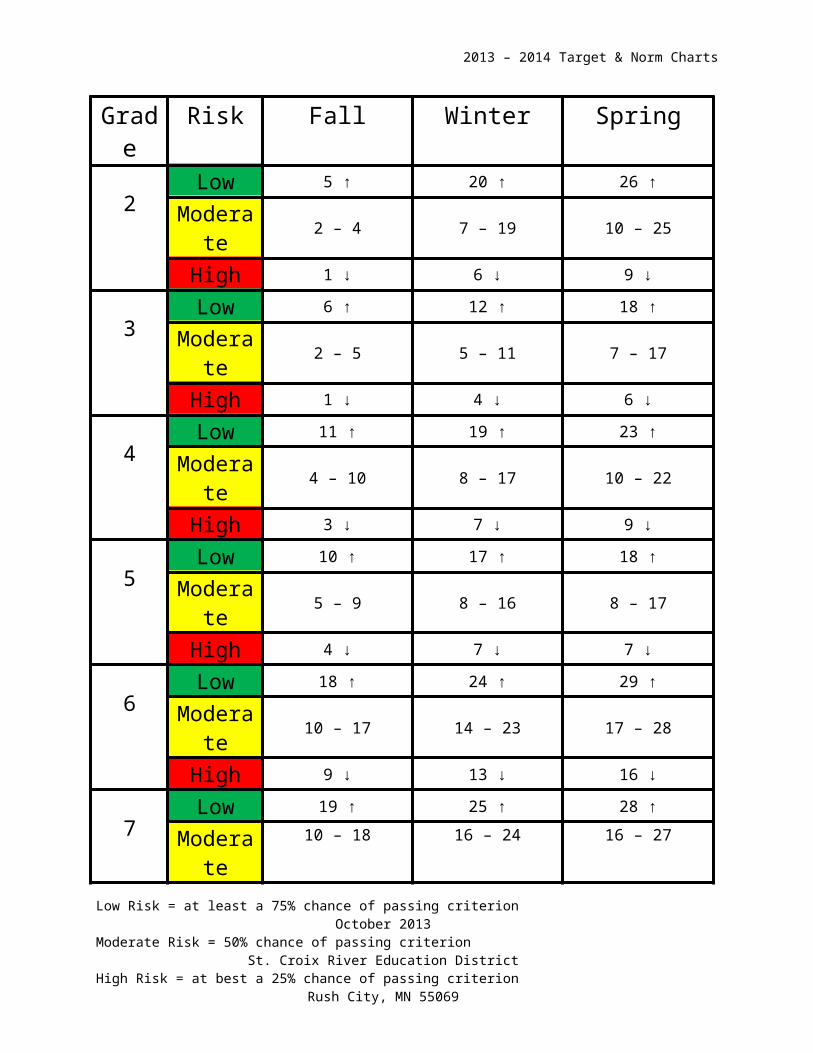
Math Concepts and ApplicationsProblems Correct in 8-10 Minutes (Grade Dependent)
AIMSweb ProbesTarget Scores Predicting Performance on AIR Adaptive MCA-3
Revised October, 2013
Low Risk = at least a 75% chance of passing criterion October 2013Moderate Risk = 50% chance of passing criterion St. Croix River Education DistrictHigh Risk = at best a 25% chance of passing criterion Rush City, MN 55069
2013 – 2014 Target & Norm Charts
Grade Risk Fall Winter Spring
2Low 5 ↑ 20 ↑ 26 ↑
Moderate
2 – 4 7 – 19 10 – 25
High 1 ↓ 6 ↓ 9 ↓
3Low 6 ↑ 12 ↑ 18 ↑
Moderate
2 – 5 5 – 11 7 – 17
High 1 ↓ 4 ↓ 6 ↓
4Low 11 ↑ 19 ↑ 23 ↑
Moderate
4 – 10 8 – 17 10 – 22
High 3 ↓ 7 ↓ 9 ↓
5Low 10 ↑ 17 ↑ 18 ↑
Moderate
5 – 9 8 – 16 8 – 17
High 4 ↓ 7 ↓ 7 ↓
6Low 18 ↑ 24 ↑ 29 ↑
Moderate
10 – 17 14 – 23 17 – 28
High 9 ↓ 13 ↓ 16 ↓
7Low 19 ↑ 25 ↑ 28 ↑
Moderate
10 – 18 16 – 24 16 – 27
High 9 ↓ 15 ↓ 15 ↓
8Low 17 ↑ 20 ↑ 22 ↑
Moderate
9 – 16 11 – 19 12 – 21
High 8 ↓ 10 ↓ 11 ↓
Low Risk = at least a 75% chance of passing criterion October 2013Moderate Risk = 50% chance of passing criterion St. Croix River Education DistrictHigh Risk = at best a 25% chance of passing criterion Rush City, MN 55069
2013 – 2014 Target & Norm Charts
SPED and ADSIS: monitor students with MCAP once every other week. Less risk, measure once per month.
Low Risk = at least a 75% chance of passing criterion October 2013Moderate Risk = 50% chance of passing criterion St. Croix River Education DistrictHigh Risk = at best a 25% chance of passing criterion Rush City, MN 55069
2013 – 2014 Target & Norm Charts
Measures of Academic Progress - MathRIT Scale Scores
TIES-Wide Target Scores Predicting Performance on AIR 2012 MCA-3 (or Grade 11 MCA-2)Revised 10/2012
Grade Risk Level Fall Spring
2Low 174 ↑ 190 ↑
Moderate 162 – 173 181 – 189High 161 ↓ 180 ↓
3Low 188 ↑ 201 ↑
Moderate 177 – 187 194 – 200High 176 ↓ 193 ↓
4Low 201 ↑ 214 ↑
Moderate 192 – 200 205 – 213High 191 ↓ 204 ↓
5Low 216 ↑ 229 ↑
Moderate 207 – 215 221 – 228High 206 ↓ 220 ↓
6Low 226 ↑ 234 ↑
Moderate 218 – 225 228 – 233High 217 ↓ 227 ↓
7Low 232 ↑ 239 ↑
Moderate 224 – 231 232 – 238High 223 ↓ 231 ↓
8Low 238 ↑ 242 ↑
Moderate 228 – 237 234 – 241High 227 ↓ 233 ↓
9*Low 247 ↑ 252 ↑
Moderate 237 – 246 242 – 251High 236 ↓ 241 ↓
10*Low 252 ↑ 256 ↑
Moderate 242 – 251 246 – 255High 241 ↓ 245 ↓
*Please use caution in interpreting grade 9 and 10 results. Samples are more limited and many districts only assess lower-performing students at these grades, which may have affected the sample.
Low Risk = at least a 75% chance of passing criterion October 2013Moderate Risk = 50% chance of passing criterion St. Croix River Education DistrictHigh Risk = at best a 25% chance of passing criterion Rush City, MN 55069
2013 – 2014 Target & Norm Charts
Curriculum Based Measurement – Written ExpressionCorrect Word Sequences Written in 3 Minutes SCRED-Wide Norms Revised 2012-13 Sch Yr
Grade PercentileFall Winter Spring
CWS TWW CWS TWW CWS TWW
1
90th NA NA 13 26 19 3175th NA NA 8 21 15 2650th NA NA 6 15 11 1825th NA NA 2 11 5 1310th NA NA 1 8 2 95th NA NA 1 6 1 8
2
90th 16 29 29 44 34 4975th 13 24 25 37 25 4250th 8 18 16 31 19 3125th 5 13 10 22 12 2410th 1 9 5 14 5 195th 0 3 3 13 4 16
3
90th 36 46 38 49 50 6575th 29 38 34 44 43 5650th 20 28 26 37 32 4325th 11 20 19 30 23 3310th 4 14 13 24 15 265th 2 3 8 20 11 21
4
90th 44 50 64 63 58 6575th 33 41 48 57 45 5250th 27 35 36 42 35 4125th 16 26 24 34 23 3310th 12 20 19 27 14 215th 9 16 8 19 11 17
5
90th 52 62 55 60 77 8075th 42 50 45 56 63 7250th 32 39 38 46 48 5925th 24 29 30 37 39 4810th 17 23 20 29 24 385th 14 20 17 21 13 29
6
90th 60 65 66 68 78 7975th 50 56 52 56 65 7050th 41 45 41 48 53 6025th 27 37 30 37 44 5210th 20 26 21 28 38 435th 14 21 17 22 33 39
7
90th 68 73 74 77 83 8475th 56 62 63 65 67 7150th 47 55 52 57 55 6225th 38 44 38 44 46 5310th 29 38 32 37 34 405th 22 33 27 34 28 34
8
90th 79 84 77 87 89 9175th 65 73 70 74 78 8250th 53 61 58 65 63 7225th 44 50 47 54 53 6110th 33 44 34 41 42 525th 25 33 32 37 37 50
SPED and ADSIS: monitor students once every other week with CWS. Less risk, can monitor once per month.Low Risk = at least a 75% chance of passing criterion October 2013Moderate Risk = 50% chance of passing criterion St. Croix River Education DistrictHigh Risk = at best a 25% chance of passing criterion Rush City, MN 55069
2013 – 2014 Target & Norm Charts
Individual Growth and Development Indicators (IGDIs)Items Correct in Allotted Time
Target Scores for Spring Prior to Kindergarten Eligibility
Revised 1/2013
Low Risk Higher RiskAlliteration 8 5*
Rhyming 12 7*Picture Naming 26 16*
* Higher Risk benchmarks are based on professional judgment distinguishing between students who are near target from those far from target.
These targets are for Spring prior to entering Kindergarten, however, these same targets will be loaded into TIES for each benchmark season (Fall, Winter, and Spring) so that teachers can see how many students are achieving the spring target as the year progresses.
Early Literacy IndicatorsItems Correct in 1 Minute
Target scores for Fall, Winter, and Spring of year prior to Kindergarten enrollment predict success on same measure in September (LNF) / November (LSF) of Kindergarten Year
Revised 1/2013
Letter Naming Fluency Fall Winter SpringLow Risk 6 9 14
Higher Risk 8*
Letter Sound Fluency Fall Winter SpringLow Risk 1 4 8
Higher Risk 5*
* Higher Risk benchmarks are based on professional judgment distinguishing between students who are near target from those far from target.
Low Risk = at least a 75% chance of passing criterion October 2013Moderate Risk = 50% chance of passing criterion St. Croix River Education DistrictHigh Risk = at best a 25% chance of passing criterion Rush City, MN 55069