Embed Size (px)
Citation preview

ORAL HEALTH IN NEW YORK STATEDECEMBER 11, 2012
Jayanth Kumar, DDS, MPHBureau of Dental Health

Learning Objectives
Understand the functions, infrastructure and capacity of a state oral health program
Discuss the strategies used for promoting interventions
Describe the evaluation efforts related to the fluoridation program

Vision & Mission
The Bureau of Dental Health will provide an environment to encourage all New Yorkers to develop an awareness of the importance of oral health, and to assure it’s inclusion in public health programs targeted toward the building of healthier communities.
Our mission is to improve the oral health of all New Yorkers.

IMPACT
• Reduction in : Caries, Periodontal disease, Oral cancer
• Reduced Disparities in Oral Health Outcomes
• Reduced transmission of infection
• Enhanced Quality of life
• State Health Department
• State Partners
• CDC technical assistance and funding
• Other resources
• CDC
• HRSA
ASSESS
DEVELOP
POLICY
ASSURE
OUTCOMES
Increased Program
-Quality
-Magnitude
-Sustainability
-Cultivation
Burden document
Conduct surveillance
Maintain a state oral health plan
Support statewide coalition & partnerships
Develop leadership
Promote systems & policy change
Promote & Manage programs
Institutionalize strong evaluation
Resources-Activities-Outcome-Impact

Technical Support
BUREAU OF DENTAL HEALTH
Indian Health
Migrant Health
School Health
Community Health Centers Dental Care for
persons with HIV
Investigation of disease transmission
Local Health
Medicaid
Child Health Plus
Office of Children and Families
Rural Health
Managed care
Primary Care
Chronic disease programs

Public Health Action
Surveillance & Epidemiology Children, Adults & Elderly
Community based interventions Fluoridation School-based interventions
Health system interventions Guidelines and Training Programs Infection Control Practice
Community clinical linkages Care Coordination, School Certificate Program

Prevalence Trends, Third Grade SurveyUpstate New York
All child
ren
High inco
me
Low inco
me
All child
ren
High inco
me
Low inco
me0
10
20
30
40
50
60
70
53.848.6
65.8
29.6
23
41.845.4
31.1
62.3
24
14.3
35.2
42
20
2002-04 2009-11 SOHP
Caries Prevalence Untreated Caries

Prevalence of Sealants, Third Grade Survey, Upstate New York
All child
ren
High inco
me
Low inco
me0
10
20
30
40
50
60
38.142.5
28.9
4244.9
38.4
502002-04 2009-11 SOHP

Perecent of Medicaid enrollees (ages 2-20 years) who had at least one dental visit within the last year.NYS Medicaid Data, 2005-2010
02
Years
04
Years
06
Years
08
Years
10
Years
12
Years
14
Years
16
Years
18
Years
20
Years
0.0
10.0
20.0
30.0
40.0
50.0
60.0
2005 2010
All ages ( 2-20 years)
2010 - 42.3%
2005 – 35.3%
Target – 56% HP2010

<12 years12 years
>12 yearsMale Female
< 25K>= 25K
White, N-H
Others
TOTAL Education SEX INCOME RACE
0
10
20
30
40
50
60
70
80
90
100
37.61
15.5
25
44.4
34.839.3
21.3
42 40.8
28.5
Pe
rce
nt
wit
h 9
5%
Co
nfi
de
nc
e I
nte
rva
l
Percent of persons (aged 45 to 64) who have never had a permanent tooth extracted due to dental caries or periodontal disease. New York State BRFSS, 2010.

Trends in tooth loss. Percent of persons (ages 65 and older) who have lost all natural permanent teeth. New York State BRFSS, 1999 to 2010.
1999 2002 2004 2006 2008 20100
5
10
15
20
25
%

Oral cancer cases diagnosed at early stage by gender, race and year. New York State Cancer Registry, 1976-2008.
1976
1978
1980
1982
1984
1986
1988
1990
1992
1994
1996
1998
2000
2002
2004
2006
2008
0
10
20
30
40
50
60
Male Blacks Female Blacks Male_Whites Female_Whites

Percent of people who visited a dentist or a dental clinic within the past year. BRFSS, 2010.
18-4445-64
>65 <12 years12 years
>12 yearsMaleFemale
<15K>=15KWhite
Others
TOTAL AGE Education SEX INCOME RACE
0
10
20
30
40
50
60
70
80
90
100
Pe
rce
nt
wit
h 9
5%
Co
nfi
de
nc
e I
nte
rva
l

Dental visit during pregnancy by race, age, years of education, marital status and participation in Medicaid. PRAMS 2008.
TOTAL AGE (years) EDUCATION (years) RACE MARITAL STATUS
MEDICAID STATUS
0
10
20
30
40
50
60
70
80
90
100
Pe
rce
nt
Wit
h 9
5%
Co
nfi
de
nc
e I
nte
rva
l

Framework for ComprehensiveState Oral Health Plan
Knowledge forEvidence-BasedDecision Making
What should be done?Setting Optimal National
and State Objectives:(data-driven)
What can be done?Planning Feasible Strategies
(capacity-driven)
What is achieved?Implementing
Effective Strategies(outcome-driven)
What could be done?Determining
Possible Strategies(science-driven)
Data: societal influences,current capacity,
environmental analysis
SurveillanceData: unmet
needs, serviceand data gaps
Data: provenprevention andbest processes
Data: process,outcome, impact
evaluations
Data: diseaseburden, target
populations, andimplementation
barriers

Example: A blueprint for action

Counseling pregnant women and parents; Health education and social marketing campaigns;Training
Promote dental sealant, fluoride varnish & annual dental visits, and practice guidelines
School-based dental sealant & fluoride rinse programs;
Fluoridation; Require dental examinations; Healthy school lunch; Prohibit vending machines and soda pouring rights in schools;
Address oral health literacy
Public Health Action Framework
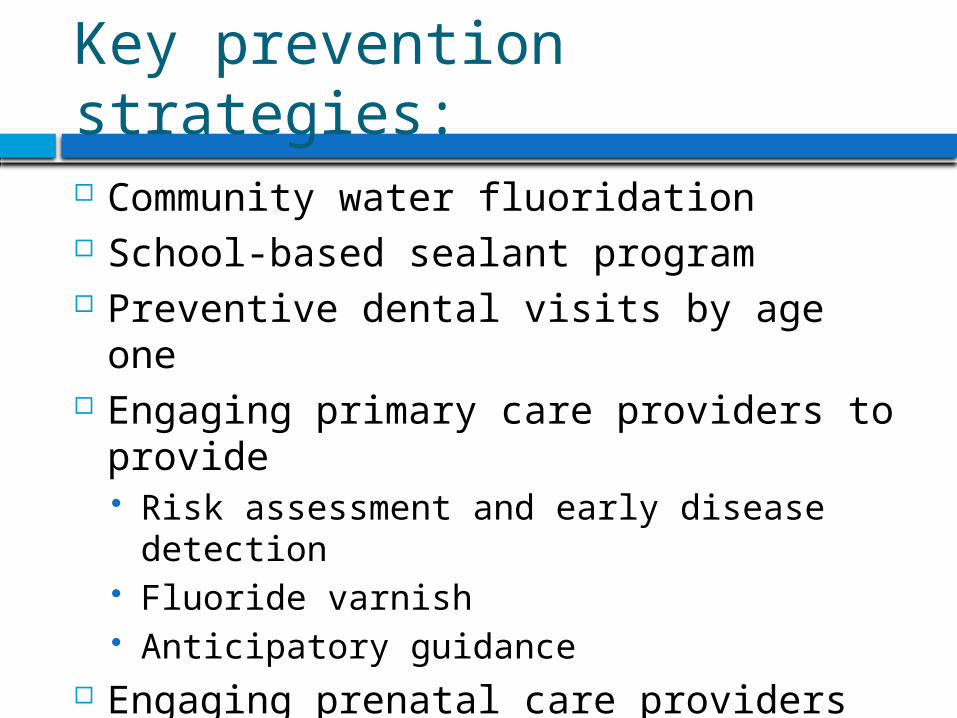
Key prevention strategies:
Community water fluoridation School-based sealant program Preventive dental visits by age one Engaging primary care providers to provide
Risk assessment and early disease detection Fluoride varnish Anticipatory guidance
Engaging prenatal care providers and perinatal networks to promote oral health
Increasing the capacity to treat disease

Fluoridation
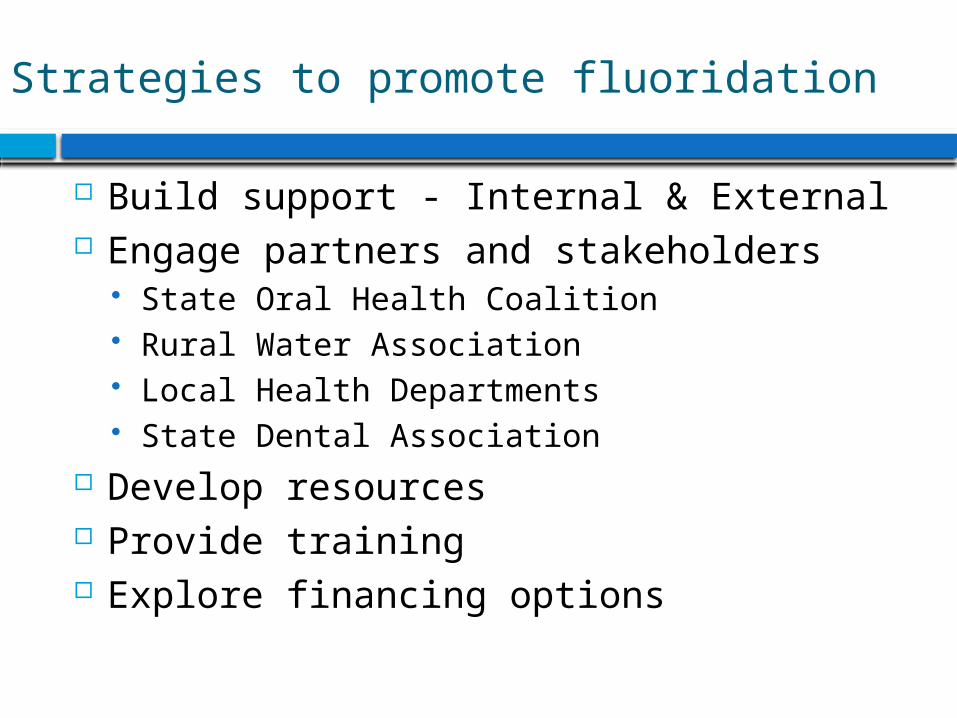
Strategies to promote fluoridation
Build support - Internal & External Engage partners and stakeholders
State Oral Health Coalition Rural Water Association Local Health Departments State Dental Association
Develop resources Provide training Explore financing options


Mean claim per recipient for caries related procedures was correlated with county fluoridation status
Spearman Correlation Coefficient -0.53 (p < 0.01).Each bubble denotes the size of the Medicaid population.
1.66 1.33 1.23

Fluoridation status of the county was not correlated with other non-caries related procedures
Spearman Correlation Coefficient was -0.12 (p =0.36). Each bubble denotes the size of the Medicaid population.

Parameter Standard P-valueVariable estimate error
Intercept 1.881 0.328 <0.0001
Fluoridation coverage (percent)a -0.060 0.002 0.003
Children on free or reduced school lunch program (percent) -0.007 0.006 0.271
Population non-white (percent) 0.012 0.009 0.190
Urban population (percent) -0.003 0.004 0.355
Number of providers per 100,000 eligible Medicaid enrollees 0.001 0.001 0.303
Table 3. Regression analysis of claims for restorative, extraction, and endodontic procedures per child, New York State Medicaid Claims Data, 2006a

Medicaid Redesign Team Recommendations
13) Medicaid Coverage of Water Fluoridation:
To address disparities in access to dental services the Workgroup recommends that Medicaid funding be made available to support costs of fluoridation equipment, supplies and staff time for public water systems in population centers (population over 50,000) where the majority of Medicaid eligible children reside.

Is there a link between severe fluorosis and caries?

“Severe enamel fluorosis compromises thathealth-protective function by causing structural damage to the tooth… Moreover, the plausible hypothesis concerning elevated frequency of caries in persons with severe enamel fluorosis has been accepted by some authorities, and the available evidence is mixed but generally supportive.”
- NRC Report 2006 (Page 3)


DOES FLUORIDE IN DRINKING WATER DELAY TOOTH ERUPTION I. Adeyemi Jolaoso et al. Bureau of Dental Health, NYSDOH
Number of erupted permanent teeth (weighted) and number of erupted permanent first molars by Age and Water Fluoride Level

Adjusted mean number of Erupted First Permanent Teeth among 7 year old children
Water Fluoride Level(F mg/L)
Mean Number of Erupted First Molars
<0.3 3.82 (0.06)
0.3 -<0.7 3.67 (0.09)*
0.7 -1.2 3.92 (0.06)*
Other variables included in the model were age, gender, race, metropolitan status and school region.

Adjusted Caries Attack Rate among 5-17 year old children
Water Fluoride Level Attack Rate in First Molars DMFS Per 1000 Surfaces
<0.3 92.8
0.3-<0.7 81.2
0.7 – 1.2 77.7
Other variables included in the model were age, gender, race, metropolitan status and school region.

Resources
New York State Department of Health (NYSDOH) website CDC and ADA
Technical Assistance Center in Rochester ILikeMyTeeth.org - NewYork.ILikeMyTeeth.org Fluoride Science.org
Rural Water Association Local Health Department
Water Fluoridation Manual

Features:
Topic summaries
Critical appraisals
Videos featuring fluoride researchers

Planning School Dental Programs in New York State
Treatment
School-based Dental Sealant
Dental Certificate (Screening & referral)
Dental Home
Fluoride rinseFluoridation
Policy InterventionDental health certificate, School curriculum, Health education, Mouth guards in contact sports, Injury protocol, Healthy nutrition – school
lunch, vending machines and soda pouring rights.
TARGET (IDEAL)Number of Schools
NYC Rest NYS
50 100
200 500
1048 418
0 100
1542 3127

36
Oral health in young children
Prevalence in 2-5 year old is 27.9%
Mean dfs =2.4 Among children under 4 years old
enrolled in the EPSDT, less than 16% received any preventive dental visit.
In New York, approximately 4800 children (<6 years) treated in an OR for dental caries.
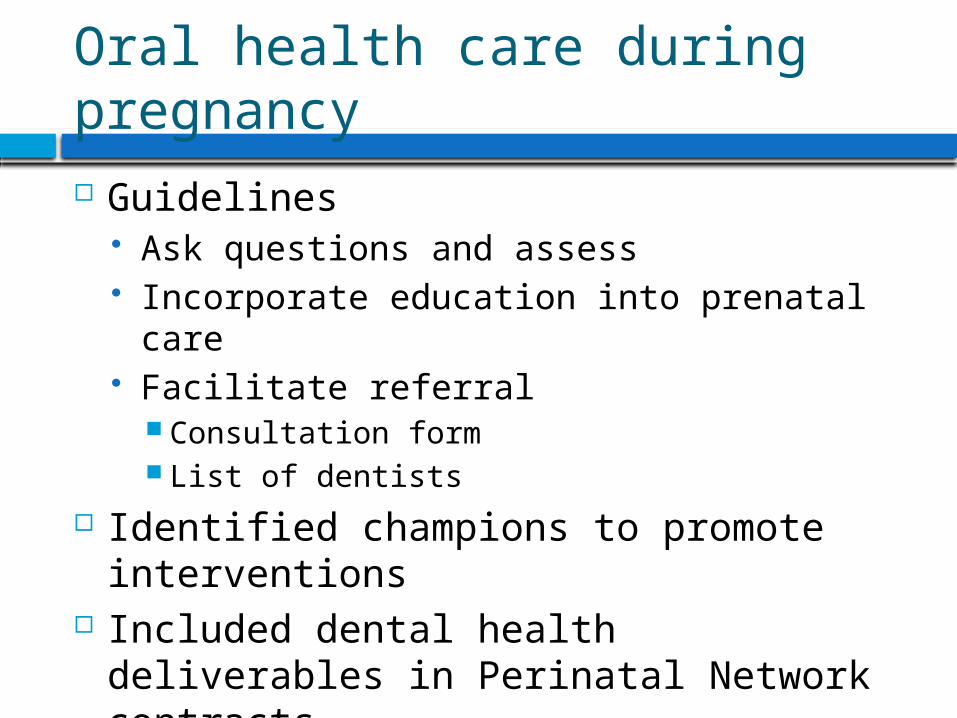
Oral health care during pregnancy
Guidelines Ask questions and assess Incorporate education into prenatal care Facilitate referral
Consultation form List of dentists
Identified champions to promote interventions Included dental health deliverables in Perinatal
Network contracts Dental measures in perinatal standards

Diabetes and Oral Health


New York State Medicaid Program
NY US
19.2 m Population 307.9 m
Medicaid Enrollment as a % of Total Pop
5.2 m (27% in NY) vs 62.7 m (20% Nation)
Essential dental benefits are covered
Effective July 1, all beneficiaries are enrolled in a Managed Care Program

Medicaid Caseloads of New York Dentists

“New York has 79 dentists per 100,000 population, which is well above the national rate of 55 dentists per 100,000 population.”

Dental Licenses Issued during Past Eight Calendar Years


Workforce
Dental practice maps Dental health professional shortage areas Recruitment
Fairs and meetings My Health Career® Website HealthMatch Program New York State Primary Care Service Corps School Dental Certificate Program
Workforce flexibility


Questions?