Embed Size (px)
Citation preview
Oral fatty acid sensitivity and dietary
fat consumption
by
Lisa. P. Newman B. App. Sc. (Food Science and Nutrition) (Hons.)
Submitted in fulfilment of the requirements for the degree of
Doctor of Philosophy
Deakin University
August, 2013


I
A C K N O W L E D G E M E N T S
I would like to begin by giving my very sincerest thanks so all of the amazing people
that made completion of this thesis possible. To my brilliant supervisors; Associate
Professor Russell Keast and Dr Susan Torres. Thank you both for being wonderful
supervisors. I am lucky to have had such a supportive team. Russell, thank you so much
for all of your patience, encouragement and guidance over the journey. And Susan, your
support, dietetics expertise and excellent organisational skills are greatly appreciated.
I would also like to thank the other professionals who have helped me over the past 3
years, in particular Dr Gie Liem, thanks for your impromptu statistics advice and your
delicious apple pie! And to Sandra Godfrey, Andrew Howarth and the lab staff, thank
you for all of your assistance with lab matters, particularly keeping on top of the hygiene
standards! To Garry, Jan and Nich at CSIRO, thank you for allowing me to visit your
facilities up in Sydney and taking me under your wing.
Thank you to all of my awesome PhD friends for all of the fun times we have shared
over the years. To the original office members, Jess Stewart, thank you for being my ‘fat
taste’ buddy and teaching me a thing or two about making milk. Dhoung, I enjoyed our
English classes – I will never be able to use the word ‘ankle’ with the same meaning
again. Lisa (Salty) Lucas, thanks for being the ‘other’ Lisa and for the hilarious times we
had car-pooling to and from uni – I’m pretty sure I still owe you a lift! Sara (Opti)
Cicerale, thanks for all of your positivity and ‘opti’mism and Gunveen Kaur, thank you
for all of your support, even if it was all the way from Geelong. To the cheeky monkeys,
Karen (Kim) Lim and Rivkeh (no last name), I’m still not sure who is who, but I have
II
enjoyed the many laughs we have shared, even if they were mainly at my expense –
especially that infamous book – “Shut up. Stick that in your book!” To Ewa, thanks for
your thorough proof-reading skills, funny stories and I’m very much looking forward to
the arrival of l’Orange! To Holmesy, you were only with us for a short time, but ‘oh my
hat’ those were glorious days! Penny (Pinny), thanks for your support and the all-nighter
in Queenstown. And, to Alison (Boothy), thanks for your support and for being a noise
tolerant neighbour.
I would also like to thank everyone who assisted me with my data collection and data
entry. In particular, Stacey Eyres, those long hours in the lab would not have been
bearable without the many laughs, good times and hot chocolates we had. To the
awesome possums, Gak, Note and Alex, you were always there to lend a generous
helping hand, especially when it came to participating in my studies and writing on
cups! And to Fiona Liong, Kaylee Azzopardi, Belinda Jamieson and Tayla Jarvis, your
help with data entry was greatly appreciated.
Lastly, I would like to thank my wonderful family. Kris, thank you so much for all of
your love and support during this long three and a half year period and putting up with
all my grumpiness after a long day in the lab. To Mum and Dad, thanks for all of the
opportunities you have given me and for the many ‘words of wisdom’ and
encouragement throughout all my years of study – it means a lot to me. And to my
brother, Michael, even though you were in London for most of my PhD, thanks for
participating in my last study and proof-reading for me. I couldn’t have done it without
you all!
III
T A B L E O F C O N T E N T S
Acknowledgements..................................................................................................... I
Abstract......................................................................................................................X
List of Tables .......................................................................................................... XV
List of Figures....................................................................................................... XVI
List of Appendices ...............................................................................................XVII
List of Abbreviations ........................................................................................ XVIII
CHAPTER ONE – Background ...............................................................................1
CHAPTER TWO – Literature review .....................................................................4
2.1 Introduction ........................................................................................................4
2.2 Overweight/ obesity ...........................................................................................5
2.3 Health effects of excess fat consumption ...........................................................6
2.4 Factors affecting fat consumption and susceptibility to weight gain .................8
2.4.1 Dietary factors........................................................................................8
2.4.2 Appetite and preference .........................................................................9
2.4.3 Genetic factors .....................................................................................12
2.5 The sense of taste and its function....................................................................14
2.6 Possibility of oral fatty acid chemoreception: but fat taste?.............................17
2.6.1 Animal evidence for oral fatty acid detection ......................................18
2.6.2 Human evidence for oral fatty acid detection ......................................19
2.7 Putative mechanisms for fatty acid chemoreception ........................................22
2.7.1 CD36 transporter and FAT...................................................................24
2.7.2 GPCRs..................................................................................................25

IV
2.7.3 DRK channels ......................................................................................26
2.7.4 Lingual lipase .......................................................................................26
2.8 Possible functions of fatty acid chemoreception ..............................................28
2.9 Fatty acid sensitivity in the oral cavity and GI tract.........................................31
2.10 Dietary influences on fatty acid chemoreception ...........................................35
2.11 Environmental influences on gene expression ...............................................37
2.12 Conclusions ....................................................................................................39
2.13 Aims ...............................................................................................................41
2.14 Hypotheses .....................................................................................................42
CHAPTER THREE – Materials, methodology and measurements....................43
3.1 Introduction ......................................................................................................43
3.2 Subjects ............................................................................................................43
3.2.1 Subject demographics ..........................................................................44
3.2.2 Reimbursement ....................................................................................44
3.3 Sensory testing .................................................................................................44
3.3.1 Sensory testing .....................................................................................44
3.3.2 Oral fatty acid solutions – materials and methods ...............................45
3.3.3 Oral fatty acid solutions – threshold measurement ..............................46
3.3.4 Primary taste qualities – materials and methods ..................................50
3.3.5 Primary taste qualities – threshold measurement.................................51
3.3.6 6-n-propylthiouracil (PROP) sensitivity – materials and methods ......51
3.3.7 PROP sensitivity – measurement .........................................................52
3.3.8 Fat ranking task – materials and methods ............................................53
3.3.9 Fat ranking task – measurements .........................................................54
V
3.3.10 Hedonic test – materials and methods..................................................55
3.3.11 Hedonic tests – measurements .............................................................56
3.4 Energy intake and habitual diet ........................................................................56
3.4.1 Food records.........................................................................................56
3.4.2 Food Frequency Questionnaire ............................................................57
3.5 Fat pre-load meals ............................................................................................59
3.6 Dietary counselling...........................................................................................60
3.6.1 Low-fat diet ..........................................................................................60
3.6.2 Portion control diet...............................................................................62
3.7 Physical activity ...............................................................................................63
3.8 Tongue papillae ................................................................................................64
3.8.1 Tongue photography ............................................................................64
3.8.2 Counting of tongue papillae .................................................................65
3.9 Statistical analysis ............................................................................................67
3.9.1 Study 1 .................................................................................................67
3.9.2 Study 2 .................................................................................................68
3.9.3 Study 3 .................................................................................................69
CHAPTER FOUR – Study 1: The test-retest reliability of oral fatty acid detection thresholds .................................................................................................70
4.1 Introduction ......................................................................................................70
4.2 Aims and hypotheses........................................................................................76
4.2.1 Aim.......................................................................................................76
4.2.2 Hypotheses ...........................................................................................76
4.3 Subjects, materials and methods ......................................................................76
VI
4.3.1 Subjects ................................................................................................77
4.3.2 Study outline ........................................................................................77
4.3.3 Oral fatty acid solutions .......................................................................77
4.3.4 Oral fatty acid detection thresholds......................................................78
4.3.5 Taste thresholds: sweet, sour, salty, bitter and umami.........................78
4.3.6 Food consumption................................................................................79
4.3.7 Anthropometry .....................................................................................79
4.4 Statistical analysis ............................................................................................79
4.5 Results ..............................................................................................................81
4.5.1 Subjects ................................................................................................81
4.5.2 Oral fatty acid detection thresholds......................................................81
4.5.3 Taste detection thresholds: sweet, sour, salty, bitter and umami .........87
4.5.4 Food consumption................................................................................88
4.5.5 Anthropometry .....................................................................................88
4.6 Discussion ........................................................................................................88
4.7 Conclusions ......................................................................................................94
4.8 Future directions...............................................................................................94
CHAPTER FIVE – Study 2: The influence of a high-fat meal immediately prior to oral fatty acid detection threshold testing .........................................................95
5.1 Introduction ......................................................................................................95
5.2 Aims and hypotheses......................................................................................100
5.2.1 Aims ...................................................................................................100
5.2.2 Hypotheses .........................................................................................101
5.3 Subjects, materials and methods ....................................................................101

VII
5.3.1 Subjects ..............................................................................................101
5.3.2 Study outline ......................................................................................102
5.3.3 C18:1 samples ....................................................................................103
5.3.4 Detection thresholds for C18:1 ..........................................................104
5.3.5 Meals ..................................................................................................104
5.3.6 Fat ranking task ..................................................................................105
5.3.7 Hedonic ratings ..................................................................................106
5.3.8 Habitual food consumption ................................................................106
5.3.9 Anthropometry ...................................................................................106
5.4 Statistical analysis ..........................................................................................107
5.5 Results ............................................................................................................108
5.5.1 Subjects ..............................................................................................108
5.5.2 Detection thresholds for C18:1 ..........................................................109
5.5.3 Fat ranking .........................................................................................110
5.5.4 Preferences .........................................................................................111
5.5.5 Habitual food consumption ................................................................112
5.5.6 Anthropometry ...................................................................................113
5.6 Discussion ......................................................................................................113
5.7 Conclusions ....................................................................................................118
5.8 Future directions.............................................................................................119
CHAPTER SIX – Study 3: The effect of dietary fat consumption and weight loss on oral fatty acid sensitivity ...........................................................................120
6.1 Introduction ....................................................................................................120
6.2 Aim and hypotheses .......................................................................................125
VIII
6.2.1 Aims ...................................................................................................125
6.2.2 Hypotheses .........................................................................................125
6.3 Subjects, materials and methods ....................................................................125
6.3.1 Subjects ..............................................................................................125
6.3.2 Study outline ......................................................................................126
6.3.3 Low-fat diet ........................................................................................127
6.3.4 Portion control diet.............................................................................128
6.3.5 Anthropometry ...................................................................................129
6.3.6 Food consumption and dietary compliance .......................................130
6.3.7 Diet questionnaires.............................................................................130
6.3.8 Physical activity .................................................................................131
6.3.9 C18:1 solutions ..................................................................................132
6.3.10 C18:1 detection thresholds.................................................................132
6.3.11 Sucrose and NaCl solutions and detection thresholds........................133
6.3.12 Fat ranking task ..................................................................................133
6.3.13 Hedonic ratings ..................................................................................133
6.3.14 Tongue papillae photography.............................................................134
6.3.15 6-n-propylthiouracil (PROP) sensitivity ............................................135
6.4 Statistical analysis ..........................................................................................135
6.5 Results ............................................................................................................136
6.5.1 Subjects ..............................................................................................136
6.5.2 Anthropometry ...................................................................................138
6.5.3 Dietary compliance ............................................................................139
6.5.4 Dietary questionnaires........................................................................146
IX
6.5.5 Physical activity .................................................................................146
6.5.6 C18:1 detection thresholds.................................................................147
6.5.7 Sucrose and NaCl detection thresholds..............................................149
6.5.8 Fat ranking task ..................................................................................150
6.5.9 Hedonic ratings ..................................................................................151
6.5.10 PROP sensitivity ................................................................................153
6.5.11 Tongue papillae number.....................................................................153
6.6 Discussion ......................................................................................................154
6.7 Conclusions ....................................................................................................164
6.8 Future directions.............................................................................................164
CHAPTER SEVEN – Summary of major findings and conclusions ................166
7.1 Introduction ....................................................................................................166
7.2 Conclusions ....................................................................................................177
7.2.1 Major findings....................................................................................177
7.3 Future directions.............................................................................................178
REFERENCES.......................................................................................................184

X
A B S T R A C T
Excessive consumption of dietary fat contributes to weight gain due to its high
energy density and palatability. Fat consumption is regulated by many factors, one
which may be the ability to detect fat throughout the alimentary canal during
ingestion and digestion. This notion seems likely as the taste system acts as a
nutrient-toxin detection system, for example, sweet indicates the presence of
carbohydrates, while umami taste indicates the presence of proteins. Emerging
evidence supports the existence of a fat specific oral detection system that is
activated by fatty acids and conveys the presence of fat in foods. Inter-individual
variation in oral fatty acid sensitivity is reported to mirror that of the primary tastes,
and may be attributed to genetic, biological, or environmental factors. It has also
been reported that fat intake may be poorly regulated in obese people due to
attenuated fat detection throughout the alimentary canal, leading to excess
consumption of dietary fat and increased predisposition to weight gain.
Recent work has reported associations between detection thresholds for the fatty
acids and, an individual’s dietary fat intake and body mass index (BMI). Oral
sensitivity to fatty acids was reported to be both increased and decreased dependent
on the amount of dietary fat consumed over a four week period. Fatty acid sensitivity
throughout the gastrointestinal (GI) tract has also been strongly associated with
overweight and obesity, with impaired detection of fats in both the oral cavity and GI
tract reported in obese individuals. This dysfunction may create an excess
consumption of energy, potentially via decreased satiety, although the relationships

XI
and mechanisms are yet to be confirmed. Research in this area relies on taste
threshold testing of individuals, however whether an individual’s sensitivity remains
stable over numerous testing sessions is unknown. Thus, it cannot be undoubtedly
stated that diet has an effect on oral sensitivity until the reproducibility and reliability
of oral fatty acid thresholds are determined. It is also unknown whether a high-fat
meal immediately prior to threshold testing has an effect on oral fatty acid
thresholds, or whether changes are only seen in sensitivity after habitual changes to
diet. Conversely, dietary intake may not be the only factor influencing one’s
sensitivity; other considerations, for example the number of taste receptors or
papillae on the tongue may also play a role.
The overall aim of this thesis was to assess whether oral fatty acid detection
thresholds were reliable, and whether thresholds could be influenced by acute or
chronic diet. The objectives of this thesis were: (i) to measure the test-retest
reliability of oral fatty acid detection thresholds; (ii) to determine the effect of a
high-fat meal immediately prior to threshold testing; and (iii) to assess the effect of a
weight loss low-fat diet (25% total energy from fat) and a weight loss portion control
diet (25% reduction in total energy intake) in an overweight/ obese population, on
oral fatty acid thresholds, fat perception and preferences for regular- and low-fat
foods.
In the first study (Chapter 4), 17 subjects (8 males: age 31 ± 2.3 years, BMI 22.9 ±
0.6 kg/m2, 9 females: age 29 ± 1.8 years, BMI 23.4 ± 0.9 kg/m2) attended 30
laboratory sessions to determine oral detection thresholds for oleic acid (C18:1),
XII
linoleic acid (C18:2) and lauric acid (C12:0). Taste thresholds were also performed
using sucrose (sweet), citric acid (sour), sodium chloride (NaCl) (salty), caffeine
(bitter) and monosodium glutamate (MSG) (umami). Each stimulus was evaluated
on six occasions using ascending forced choice triangle tests over two days. Diet
records were also collected prior to each testing session. Oral fatty acid detection
thresholds were determined for all subjects and strong intra-class correlations (ICC)
were found for within day and across day testing sessions for C18:1, C18:2 and
C12:0. The strongest correlations were found for across day testing for C18:1 (ICC =
0.78, CI = 0.49-0.91), C18:2 (ICC = 0.94, CI = 0.84-0.98) and C12:0 (ICC = 0.80,
CI = 0.54-0.92). Strong correlations were also found for sweet, sour, salty, bitter and
umami tastes (ICC range: 0.7-0.9). This study demonstrated the high test-retest
reliability of oral fatty acid thresholds. It also confirmed the reliability of thresholds
for sweet, sour, salty, bitter and umami. The novel findings of this study provide
evidence supportive of an oral fatty acid specific detection system.
In the second study (Chapter 5), 32 subjects (15 males: age 49.3 ± 4.8 years, BMI
24.7 ± 0.8 kg/m2, 17 females: age 31.5 ± 2.8 years, BMI 21.86 ± 0.9 kg/m2) attended
three laboratory sessions to determine the effect of a high-fat meal immediately prior
to detection threshold testing for C18:1. In each of the three sessions, subjects were
given one of three different types of breakfast; a high-fat frittata (60% fat, 20%
carbohydrate, 20% protein), a low-fat frittata (20% fat, 40% carbohydrate, 40%
protein) or a macronutrient balanced frittata (33% fat, 33% carbohydrate, 33%
protein). Oral fatty acid thresholds were evaluated using ascending forced choice
triangle tests on two occasions each day; once one hour post breakfast and then one
XIII
hour post the completion of the first threshold test. Consumption of a high-fat, low-
fat or balanced breakfast prior to thresholds testing had no significant effect on oral
fatty acid detection thresholds (P = 0.213). This study also validated the results of
study one in that the reliability of oral fatty acid thresholds remained stable both
within and across days. Thus, the present study has provided novel evidence
regarding the effect of the macronutrient composition of the meal immediately
before threshold testing. This study provides preliminary evidence that the
composition of the meal consumed by a subject immediately prior to testing may not
impact the accuracy of oral fatty acid thresholds, and it can be speculated that a
change in habitual consumption is required before differences in sensitivity will be
seen.
In the third study (Chapter 6), subjects (n = 53; age 56.5 ± 1.9 years; BMI 31.0 ±
0.7 kg/m2) completed a randomised dietary intervention whereby they consumed
either a low-fat diet (< 25% dietary fat) or a portion control diet (reduction in energy
intake by 25%) for six weeks. Oral fatty acid sensitivity, anthropometry, ability to
detect the fat content of custard and preference for regular- and low-fat foods were
assessed at baseline and week six. Consumption of both a low-fat diet (n = 26) and
portion control diet (n = 27) significantly increased oral fatty acid detection
thresholds from baseline to week six (P = 0.014), however there were no significant
differences between groups (P = 0.060). Significant increases in subject’s ability to
perceive the fat content of custard were also observed but only in the low-fat diet
group (P = 0.017), however no significant differences between groups were observed
(P = 0.423) with directional changes for increased fat perception also seen in the
XIV
portion control group. Minimal changes in preferences for regular-fat and low-fat
foods were observed in both groups with the only significant change observed for an
increased liking for low-fat cream cheese (P = 0.011). Both diets significantly
reduced weight (P < 0.001) and BMI (P < 0.001). There were no significant
differences in the amount of fat consumed (g) between groups (P = 0.494). This
study found that both the low-fat and portion control diets significantly increased
oral fatty acid sensitivity, suggesting that total fat intake over a period of six weeks,
rather than percentage energy from fat may be a key factor modulating oral fatty acid
sensitivity. Another important finding was that subject’s ability to perceive the fat
content of custard was significantly improved after consumption of the six week
low-fat diet. While sensitivity and perception increased, preference was not changed
and presumably this will be an important next step, as habitual diet is often
determined by preference.
Therefore, this thesis has reported that oral fatty acid detection thresholds remain
stable and reliable over numerous testing sessions and that detection thresholds are
not influenced by acute diet. Additionally, oral fatty acid detection thresholds can be
increased by both a low-fat and portion control diet over a six week period, adding to
the growing body of evidence for this novel area of research.
XV
L I S T O F T A B L E S
Table 3.1: Specification and preparation of test solutions ........................................51
Table 3.2: Scores for the fat ranking task..................................................................55
Table 4.1: Within day, across day, duplicate across day, triplicate across day and day within subject intra-class correlations for C18:1, C18:2, C12:0, sucrose, citric acid, NaCl, caffeine and MSG detection thresholds ..................................................82
Table 5.1: Number of testing days and sessions .....................................................108
Table 5.2: Mean C18:1 detection thresholds after the high-fat, low-fat and macronutrient balanced frittata ................................................................................109
Table 5.3: Acceptance changes using a 9-point hedonic scale in regular- and low-fat foods following consumption of the high-fat, low-fat and macronutrient balanced frittatas......................................................................................................................112
Table 6.1: The intended macronutrient profile of the low-fat and portion control diet groups.......................................................................................................................129
Table 6.2: Comparison of subjects’ demographic, anthropometric and oral detection threshold characteristics at baseline and week six for the total sample and diet group..................................................................................................................................137
Table 6.3: Macronutrient intakes for the low-fat and portion control diet groups at baseline and week six...............................................................................................140
Table 6.4: Acceptance changes using a 9-point hedonic scale in regular- and low-fat foods following consumption of the low-fat diet or portion control diet.................152
XVI
L I S T O F F I G U R E S
Figure 2.1: The relationship between chemical concentration, detection threshold and recognition threshold...........................................................................................16
Figure 2.2: Putative mechanisms in the gustatory response to fatty acids................23
Figure 2.3: A proposed schematic representation of fatty acid chemoreception in the oral cavity and GI tract (alimentary canal) in lean and obese individuals. ................33
Figure 3.1: A flow diagram of the ascending forced choice triangle test procedure.....................................................................................................................................49
Figure 3.2: The position of the subject and the distance between the tongue and camera required for the tongue papillae photograph..................................................65
Figure 3.3: A photograph of the tongue papillae ......................................................66
Figure 4.1: The breakdown of sessions for each day and a description of how data analysis was conducted ..............................................................................................80
Figure 4.2: Detection threshold plots of each individual for oleic acid, linoleic acid and lauric acid ............................................................................................................83
Figure 4.3: Box plots representing distributions of taste detection thresholds. ........84
Figure 4.4: Correlations between oleic acid; C18:1, linoleic acid; C18:2 and lauric acid; C12:0 .................................................................................................................86
Figure 5.1: Overview of the study design for study two.........................................103
Figure 5.2: Differences in scores for the fat ranking task after the high-fat, low-fat and macronutrient balanced breakfasts ....................................................................111
Figure 6.1: BMI and macronutrient intake in the low-fat and portion control diet groups at baseline and week six ...............................................................................144
Figure 6.2: Oral fatty acid detection thresholds at baseline and week six for the low-fat and portion control diet groups ...........................................................................148
Figure 6.3: Fat ranking scores at baseline and week six for the low-fat and portion control diet groups....................................................................................................150
XVII
L I S T O F A P P E N D I C E S
Appendix A Screening form
Appendix B Detection threshold form
Appendix C gLMS used to determine taste sensitivity to PROP
Appendix D Fat ranking task answer sheet
Appendix E Answer sheet for liking of regular-fat and low-fat foods
Appendix F Food record form
Appendix G Food frequency questionnaire
Appendix H Recipes of frittatas baked in study two
Appendix I Diet booklet given to subjects following the low-fat diet in
study three
Appendix J Information given to subjects following the portion control
diet in study three
Appendix K CHAMPS questionnaire
Appendix L Recruitment flyer for study two
Appendix M Recruitment flyer for study three

XVIII
L I S T O F A B B R E V I AT I O N S
3-AFC 3-alternate forced choice methodology
ANOVA Analysis of variance
ATP Adenosine triphosphate
BMI Body mass index
C12:0 Lauric acid
C18:0 Stearic acid
C18:1 Oleic acid
C18:2 Linoleic acid
C18:3 Linolenic acid
C20:4 Arachadonic acid
C20:5 Eicosapentanoic acid
C22:6 Docosahexanoic acid
C6:0 Caproic acid
CCK Cholecystokinin
CD36 Cluster of differentiation 36
CHAMPS Community healthy activities model program for seniors
CVD Cardiovascular disease
DNA Deoxyribonucleic acid
DRK Delayed rectifying potassium channels
EDTA Ethylenediaminetetraacetic acid
FAT Fatty acid transporter
GI Gastrointestinal
XIX
GLAST Glutamate aspartate transporter
gLMS General labelled magnitude scale
GLP-1 Glucagon-like peptide-1
GPCR G-Protein coupled receptor
HF High-fat
ICC Intra-class correlation
ISO International Organisation for Standardisation
K+ Potassium
LF Low-fat
MSG Monosodium glutamate
Na+ Sodium
NaCl Sodium chloride
NEFA Non-esterified fatty acid
NPY Neuropeptide Y
NT Neurotransmitter
NTPDase 2 Ectonucleoside triphosphate diphosphohydrolase 2
OZ-DASH Australian dietary approaches to stop hypertension
PROP 6-n-propylthiouracil
PTC Phenylthiocarbamide
PUFA Polyunsaturated fatty acid
PYY Peptide YY
RF Regular-fat
ROMK Renal outer medullary potassium channel

XX
SNP Single nucleotide polymorphisms
T1R Taste receptor, type 1
T2R Taste receptor, type 2
TRPM5 Transient receptor potential channel, type M
C H A P T E R O N E
Background1The prevalence of obesity is rising in the developed world and this has been
associated with excess consumption of dietary fat (National Health and Medical
Research Council, 2006). Fat is consumed in excess due to environmental factors,
appetite, satiety and hedonic value (Snoek et al., 2004). Energy intake is regulated by
many factors, one of which may be the ability to detect fats and other nutrients
during ingestion and digestion. Emerging evidence indicates fat detection may occur
in the oral cavity via specific receptors, similar to the other oral nutrient receptors
used to detect carbohydrates and proteins (Bachmanov & Beauchamp, 2007) and this
new evidence may potentially explain the overconsumption of energy and fat. It has
also been reported that fat intake may be poorly regulated in obese people due to a
dysfunction in satiety and appetite regulation (Speechly & Buffenstein, 2000),
suggesting possible attenuation of fat detection throughout the alimentary canal and
therefore, excess consumption of dietary fat and in turn predisposition to weight
gain.
The taste system is used to detect the nutritional or toxic quality of foods, for
example, sugars which are sweet indicate the presence of carbohydrates, while
umami taste indicates the presence of proteins (Bachmanov & Beauchamp, 2007). It
seems appropriate that as well as sensing protein and carbohydrate, humans would
have mechanisms for sensing fat in the oral cavity (Bachmanov & Beauchamp,
2007). Animal electrophysiological and behavioural studies and human studies have
provided evidence in support of oral fatty acid chemoreception, likely linked to the
Chapter 1 - Background
2
identification of fats in foods (Chale-Rush, Burgess, & Mattes, 2007a; Gilbertson et
al., 2005; Kamphuis, Saris, & Westerterp-Plantenga, 2003). Oral exposure to fat
(containing fatty acids), but not fat mimetics (no fatty acids) enhances lipid
metabolism (increases in triglycerides (TAG)) after sham feeding, which involves
sample mastication and expectoration (Mattes, 2001a). Results support the
phenomenon of oral fatty acid nutrient detectors because fat specific enzymes and
other digestive mechanisms throughout the gastrointestinal (GI) tract were initiated
when fats were exposed to the oral receptors; however no such physiological
processes were initiated when protein and carbohydrate based fat mimetics were
used (Mattes, 2001a). It was suggested that this may be due to the cephalic phase
response, which involves the release of pre-absorptive enzymes and hormones when
a food is tasted. This mechanism is thought to optimise nutrient digestion, absorption
and metabolism (Crystal & Teff, 2006).
The relationship between oral fatty acid sensitivity and dietary fat consumption has
been investigated in animal studies, whereby it was revealed that rats that were orally
hypersensitive to fatty acids consumed less dietary fat and gained less weight when
exposed to a high-fat diet whereas, orally hyposensitive rats consumed excess fat and
rapidly gained weight when fed a high-fat diet (Gilbertson, 1998; Gilbertson, et al.,
2005). This study suggests that oral sensitivity to fatty acids may play a role or be a
contributing factor to weight gain in animals. More recently in humans, Stewart et al.
(2011) investigated the potential relationship between fatty acid detection thresholds
and GI tract activity. When comparing lean and obese subjects, it was found that
obese subjects had higher detection thresholds and an intra-duodenal infusion of the

Chapter 1 - Background
3
fatty acid, oleic acid (C18:1), was associated with reduced stimulation of pyloric
motility in obese subjects only (Little & Feinle-Bisset). This suggests that the obese
are less able to sense fatty acids in the oral cavity and along the GI tract and are
therefore, unable to induce an appropriate signalling response. In this way, oral fat
exposure may influence appetite responses, food intake, nutritional status and disease
risk (Mattes, 2005). Furthermore, oral fatty acid detectors may act as mediators for
this response and an individual’s oral sensitivity to fatty acids may result in
differences in fatty food consumption. However, the relationship between fatty acid
sensitivity and diet remains contentious as it is unknown whether sensitivity dictates
dietary intake or vice versa and if this is the case, other factors including genetics
could play a role. Many gaps remain in the current body of evidence for oral fatty
acid sensitivity, therefore the purpose of this PhD thesis was to add to the growing
evidence base by investigating the test-retest reliability of the threshold measure and
determine the influence of short-term dietary fat intake and long-term dietary fat
intake on oral fatty acid sensitivity and preferences for fatty foods.
C H A P T E R T W O
Literature review2An abridged version has been published in Nutrients 2013; 5, 1287-1300,
‘Functionality of fatty acid chemoreception: a potential factor in the development of
obesity?’
2.1 Introduction
Obesity is one of the leading causes of preventable disease contributing to negative
health outcomes including cardiovascular disease (CVD), type-2 diabetes and cancer
(Swinburn et al., 2011; Wang et al., 2011). It is thought that one of the main
contributors to overweight and obesity is excess energy consumption, particularly
dietary fat. Dietary fat is consumed in excess due to a number of factors including
preference for fats, high palatability and satiety responses (Snoek, et al., 2004). One
possible mechanism involved in energy intake regulation is the ability to detect fats
and other nutrients during ingestion and digestion. It is thought that the oral cavity
acts as a nutrient-toxin detection system which regulates ingestion of macronutrients
essential for survival and potential toxic substances that may be harmful. Specific
receptors for detection of these macronutrients exist both within the oral cavity and
gastrointestinal (GI) tract (alimentary canal). When fats are consumed, they are
detected by specific receptors in both the mouth and GI tract and induce the release
of specific hormones which slow gastric emptying and suppress energy intake
(Cummings & Overduin, 2007; Feltrin et al., 2004). Detection of nutrients, in
particular fatty acids along the alimentary canal, can directly affect energy intake
which raises the possibility that abnormalities to these nutrient detection mechanisms
Chapter 2 – Literature review
5
may be associated with excess energy intake, and possibly fat intake, conceivably
promoting obesity (Blundell & Macdiarmid, 1997; Rolls et al., 1994; Speechly &
Buffenstein, 2000; Westerterp, 2006).
2.2 Overweight/ obesity
The global rise in overweight and obesity is a worldwide health concern and in some
regions has taken the lead over tobacco as the largest preventable cause of disease
burden (Hoad, Somerford, & Katzenellenbogen, 2010). There have been some
reports that overweight and obesity in children is plateauing in some populations,
while others predict that in the coming decades increases in the prevalence of obesity
will continue, enhancing the burden of obesity-related mortality and morbidity
(Rokholm, Baker, & Sørensen, 2010; Swinburn, et al., 2011).
There are many factors which contribute to weight gain and the consequential
increase in the prevalence of overweight and obesity, including the wide availability
of cheap, energy-dense foods (Swinburn, et al., 2011). These types of foods are
generally high in fat and overconsumption of these foods has been linked to weight
gain (Swinburn, et al., 2011). Although we have a dietary requirement to ingest fat
for many purposes including the ingestion of essential fatty acids and the absorption
of fat soluble vitamins, the modern day food supply, which is abundant in fat, is
different from our hunter gatherer heritage where energy dense foods were scarce
(Cordain et al., 2005). At a population level, an excess consumption of dietary fat is
one of multiple causal factors in the development of overweight and obesity (Bray,
Paeratakul, & Popkin, 2004).

Chapter 2 – Literature review
6
2.3 Health effects of excess fat consumption
Although fats are essential for human functioning, excess fat consumption has been
linked to numerous negative health effects, for example, CVD, obesity, type-2
diabetes, hypertension and many cancers (Eden & Noakes, 2003). Fat consumption
is excessive (greater than 35% total energy from fat) in the overweight and obese
population and this is greatly impacting on the health of many populations
(Australian Bureau of Statistics, 2008; Miller, Lindeman, Wallace, & Niederpruem,
1990). Diet-induced obesity is due to long-term energy imbalance, where energy
intake is greater than energy output (Swinburn, et al., 2011). Excess fat intake is
often associated with the development of obesity and several studies have shown that
fat intake is positively correlated to the fat mass of subjects with overweight and
obese subjects consuming greater than 40% total energy from fat (Dreon et al., 1988;
Miller, et al., 1990; Romieu et al., 1988; Tucker & Kano, 1993). However, for the
overweight and obese population, a decrease of 5-10% body weight via dietary
changes, for example, decreasing total energy intake, specifically energy dense
macronutrients like fat, can have large positive effects on an individual’s health
outcomes suggesting that losing enough weight to return to a healthy body mass
index (BMI) range will have even greater health benefits (Diabetes Prevention
Program Research Group, 2002). In contrast, a recent meta-analysis has provided
novel ideas in that excess weight gain to a certain extent may in fact be protective
against disease (Flegal, Kit, Orpana, & Graubard, 2013). Individuals categorised as
overweight according to BMI categories (BMI > 25 2) had a 6%
lower risk of death than those categorised as no
kg/m2) kg/m2) had a 5%
Chapter 2 – Literature review
7
lower risk of death than normal weight individuals (Flegal, et al., 2013). These are
novel findings which suggest that BMI categories may need revising with regards to
disease risk. Although this study provided new insight into disease risk and BMI
categorisation, it did however agree with previous research in regards to grade 2
kg/m2) finding that they were at a 29% increased risk of
disease than normal weight individuals (Flegal, et al., 2013). Other studies have also
failed to find a link between dietary fat consumption and body mass (Forouhi et al.,
2009; Tucker, Seljaas, & Hager, 1997), therefore BMI remains a contentious issue in
regards to disease risk and prevention.
In 2008, an estimated 1.46 billion adults were overweight (BMI > 25 kg/m2) and 502
million adults were obese (BMI > 30 kg/m2) worldwide (Swinburn, et al., 2011). In
Australia 2007-08, 25% of the adult population were obese, 37% were overweight,
37% were normal weight and 2% were underweight (Australian Bureau of Statistics,
2008). The highest rates of overweight and obesity were in the 65-74 year old age
bracket at 79% (Australian Bureau of Statistics, 2008). It was also reported that more
males (68%) were overweight than obese females (55%) (Australian Bureau of
Statistics, 2008). The financial burden of the obesity epidemic in Australia is
considerable with obesity related disease estimated to have cost $8.283 billion in
2008 alone (Australian Bureau of Statistics, 2008).

Chapter 2 – Literature review
8
2.4 Factors affecting fat consumption and susceptibility to weight
gain
2.4.1 Dietary factors
The environment in which we live can have a major influence on what we eat. High-
fat, high-energy dense products are now more readily available to consumers making
these food choices cheap and convenient (Prentice & Jebb, 2003; Swinburn, et al.,
2011). There have been numerous changes to the food environment over the past 100
years with the introduction of refrigeration and other processing techniques which
have allowed the creation and storage of dairy products, cereals, refined sugars and
fatty meats (Cordain, et al., 2005; O'Sullivan et al., 2011). These products have
changed the diet of humans dramatically from the original hunter gatherer diet which
was low in total fat and high in protein (Cordain, et al., 2005; O'Sullivan, et al.,
2011). The Western diet now contains excessive amounts of saturated fats and trans
fats (above the 10% daily recommendation), putting the population at an increased
risk of disease (World Health Organisation, 2000). The major sources of saturated
fats in the diet are fatty meats, baked goods, cheese, milk, margarine and butter
(Cordain, et al., 2005; O'Sullivan, et al., 2011). In comparison to the Western diet of
today, the hunter gatherer diet would have only contained fatty meats, so the
consumption of baked goods, cheese, milk, margarine and butter has increased the
fat content of diets consumed by those in developed countries (Cordain, et al., 2005).
However, despite the potency of this obesogenic environment, not all of the
population become obese, suggesting that some are susceptible to weight gain, while
others are resistant or protected (Blundell et al., 2005). Susceptibility may be due to
genetic, physiologic and metabolic, behavioural and psychological factors. Reasons
Chapter 2 – Literature review
9
for these differences may be due to variation in the appetite regulating process via
physiological signalling, metabolic processes or physiological responsiveness to an
environmental trigger (Blundell, et al., 2005). The responses to these triggers may be
variable, which reflects inter-individual variation in the biological response and is of
great interest to nutritionists, physiologists and clinicians as these differences may be
an underlying factor for the predisposition of obesity.
2.4.2 Appetite and preference
Chronic overconsumption of food may be due to patterns in eating behaviour, the
sensory or hedonic properties which guide behaviour, or the sensations associated
with consuming food or following consumption (Blundell, et al., 2005). These
factors can be described as behavioural risk factors and may include preference for
fatty foods, weakened satiety response (post-ingestive inhibition of further eating),
strong oro-sensory preferences, for example, sweetness combined with fattiness,
potential for binge eating and a high food induced pleasure response which all may
lead to a risk of overconsumption (Blundell, et al., 2005). Vulnerability to any one of
these factors may result in susceptibility to weight gain through changes in
behaviour. Nonetheless, these factors are unlikely to lead to weight gain alone, but
instead are exacerbated by the modern food environment which promotes excessive
food consumption and in turn nurtures weight gain and obesity. Characterisation of
high-fat and low-fat consumers has been attempted in previous research by dividing
young male subjects into behavioural phenotypes with those who consumed high
proportions of fat classified as the high-fat phenotype and those consuming the
government recommendations for fat intake as the low-fat phenotype (Cooling &
Chapter 2 – Literature review
10
Blundell, 1998). The study highlighted the fact that the males with the high-fat
phenotype consumed more fat, as well as total energy intake and a lower percentage
carbohydrate intake. Interestingly, they consumed more dairy products, meat, fish
and alcohol, but less cereals, bread, fruit and vegetables than the low-fat phenotype
(Cooling & Blundell, 1998). The high-fat phenotype group were also more prone to
overconsumption of fat in a test meal situation compared to the low-fat phenotype,
who did not over consume at the test meal (Cooling & Blundell, 1998). Although the
high-fat phenotype showed behaviours that promoted overconsumption and positive
energy balance, there was no weight gain in this group suggesting that partial
protection to maintain energy balance is occurring. Reasons as to why this is the case
may be due to the high-fat phenotype having a higher basal metabolic rate, a higher
fat oxidation rate as well as higher fasting plasma leptin (Cooling, Barth, & Blundell,
1998). As to why the low-fat phenotype consumed less fat can only be speculated
about with possibilities including behavioural, cognitive or physiological factors
(Cooling & Blundell, 2001). However, it is important to keep in mind that this study
only used young male subjects, therefore, cannot necessarily be applied to the
general population.
Post-ingestive effects of fat including feelings of contentment also promote long-
term preference and positive reinforcement (Abumrad, 2005). In other words, when
fats are consumed, they produce feelings of pleasure and satisfaction, which cause
these feelings to become positively associated with the fatty foods and over a period
of time, these foods become preferred (Abumrad, 2005). These effects are not seen
with equally palatable, but non-digestible fat substitutes, suggesting it is the response
Chapter 2 – Literature review
11
from the feedback mechanisms of the fatty foods and the dopamine produced in the
brain in response to the digestion, that causes the positive associations (Abumrad,
2005; Drewnowski & Bellisle, 2007). This illustrates that the digestion of fats
produces feelings of contentment that cannot be produced by fat substitutes. Added
to this is that high-fat diets are usually more appealing than low-fat diets due to the
high palatability of fat (Drewnowski, Kurth, Holden-Wiltse, & Saari, 1992).
Nonetheless, not all individuals over-consume fat when it is available and variation
in fat preferences and consumption patterns may have genetic foundations (Liang et
al., 2012). Previous reports have indicated that obese subjects have a stronger
preference for high-fat foods compared with leaner subjects (Drewnowski, et al.,
1992; Mela & Sacchetti, 1991; Rissanen et al., 2002; Salbe et al., 2004; Villarino,
Fernandez, Alday, & Cubelo, 2009). However, not all studies agree with this with
other finding no associations (Alexy et al., 2011; Cox et al., 1999; Cox et al., 1998).
Thus, it remains unclear whether a preference for fats is a predisposing factor for
obesity and weight gain.
Fat contributes to the texture, flavour and aroma of a variety of different foods and is
usually found in foods that are highly palatable (Drewnowski, 1997). Highly
preferred foods can drive consumption regardless of energy deficit or perceived
hunger (Sørensen et al., 2003) and can stimulate appetite and eating rate which can
lead to overconsumption (Yeomans, Gray, Mitchell, & True, 1997; Yeomans, Lee,
Gray, & French, 2001; Yeomans, Tovey, Tinley, & Haynes, 2004). Strategies to alter
an individual’s inherent preference for fatty foods are an important factor to consider
in regards to weight management as changing preference may in turn change

Chapter 2 – Literature review
12
consumption. Previous work has highlighted this concept finding that the
consumption of a low-fat diet over 12 weeks can decrease the preference for full-fat
foods over low-fat foods, making the low-fat foods preferable over the previously
preferred full-fat foods (Mattes, 1993). This suggests that changes in dietary fat
consumption over an extended period of time have the potential to alter an
individual’s preference for fatty foods, which may increase an individual’s chance of
compliance to a low-fat diet. Furthermore, studies have found a link between
preference and intakes for high-fat foods amongst obese people (Drewnowski, et al.,
1992; Mela, 1996; Mela & Sacchetti, 1991) suggesting these individuals are or have
become more susceptible to the high-fat environment, and therefore adapted to the
physiological and post-ingestive effects of fat and in turn, increased consumption
and preference for fats which has promoted obesity. Nevertheless, whether or not
habitual fat intake can alter the oro-sensory perception of fats or vice versa is still
unclear.
2.4.3 Genetic factors
Variations in genes can also have an impact on predisposition to overweight and
obesity and dietary fat consumption (Bouchard, 2008). When an environmental
condition permanently changes, selection of genetic traits is directional and the
average population genome is moved to a new set point (Bouchard, 2008; Cordain,
et al., 2005; Swinburn, et al., 2011). For example, as our diets have changed from
hunter gatherer diets with low amounts of fat to consuming modern processed foods
with higher quantities of fats, the genome may slowly adapt to cope with this
change, but these changes would take thousands of years to occur (Cordain, et al.,

Chapter 2 – Literature review
13
2005). Alternatively, epigenetic changes occur when changes in phenotype are not
attributable to changes in DNA sequencing but in fact due to the environment acting
on the phenotype, for example, consumption of a high-fat diet. Examples of such
modifications include DNA methylation, which regulates gene expression without
altering the underlying DNA sequence. This methylation allows non-genetic factors
to cause the individual’s genes to behave differently. For example, DNA methylation
patterns can be altered by maternal diet; these epigenetic changes can persist for
decades (Stein et al., 2007) and possibly be inherited by future generations (Lange &
Schneider, 2010).
Every structure throughout the body is determined and controlled by genetics. The
number of taste buds and tongue papillae an individual has is controlled by genetics
and DNA sequencing. Within these taste buds and papillae are receptors which may
help to control food intake. Inter-individual variation in regards to papillae number
within the oral cavity is large; some individuals have many tongue papillae, while
others have very few (Hayes & Duffy, 2008). Research in mice has found that there
may be specific genes which are responsible for determining tongue size and papillae
number and size (Reiner et al., 2008). The study examined a number of lingual
phenotypes related to ingestion and gustation in a number of genetically-well
characterised mice. It was reported that much variation existed in lingual traits, for
example, tongue length, width, fungiform papillae number and area and that a
significant portion of this variation could be accounted for by gene variants (Reiner,
et al., 2008). At this stage, these variants which determine papillae number have not
been found to be influenced by diet, but are genetically pre-determined. However,
Chapter 2 – Literature review
14
factors including diet and the environment may be able to switch these genes ‘on’ or
‘off’ and therefore, potentially affect the way foods, including fats, are perceived and
in turn may control an individual’s food/ fat consumption.
Emerging evidence now suggests that dietary fat consumption may be partially
regulated by an oral detection mechanism and understanding the functional role of
the taste system may be an important factor in understanding reasons for excess
energy and fat intake.
2.5 The sense of taste and its function
Taste is a sense that utilises chemoreception for the detection of non-volatile
chemicals in potential foods (Bachmanov & Beauchamp, 2007). It is hypothesised
that we evolved oral nutrient-toxin detectors (the taste system) to ensure we consume
essential nutrients (sugars, fats, amino acids and salts) which are required for
functioning and survival, while rejecting foods that may cause harm (Breslin, 2013;
Cordain, et al., 2005). Taste qualities including sweet, salty and umami are
associated with appetitive responses which, from an evolutionary perspective
maximised the chance for consumption of essential nutrients, while aversive
responses to excessive sour and bitter tastants maximised the chance of rejection of
those foods which may have caused harm (Gilbertson, Damak, & Margolskee,
2000). However, humans seem to be able to tolerate low levels of bitterness
(Schifferstein & Verlegh, 1996) and can also learn to enjoy the taste of mildly bitter
foods if paired with positive attributes for example in chocolate, coffee or wine
(Breslin, 2013).
Chapter 2 – Literature review
15
A taste quality is experienced when the concentration in the oral cavity reaches a
level that activates a receptor, which in turn elicits a perception (Keast & Roper,
2007). For example, a compound like sucrose may be in an aqueous solution but at a
concentration that cannot be detected. As the concentration of the sucrose increases,
the aqueous solution can be discriminated from water and a detection threshold is
reached (Keast & Roper, 2007). As the concentration increases further, the
recognition threshold will be reached whereby the quality (sweet) will be identified
(Keast & Roper, 2007) (Figure 2.1). When a solution is at a sub-threshold
concentration, the stimulus is too low to elicit a perception. However, sub-thresholds
can enhance the perception of other tastants, for example, when low concentrations
of fatty acids have been added to sucrose solutions, preference for the sucrose
solution has increased (Gilbertson, et al., 2005; Stratford, Curtis, & Contreras, 2006).
Chapter 2 – Literature review
16
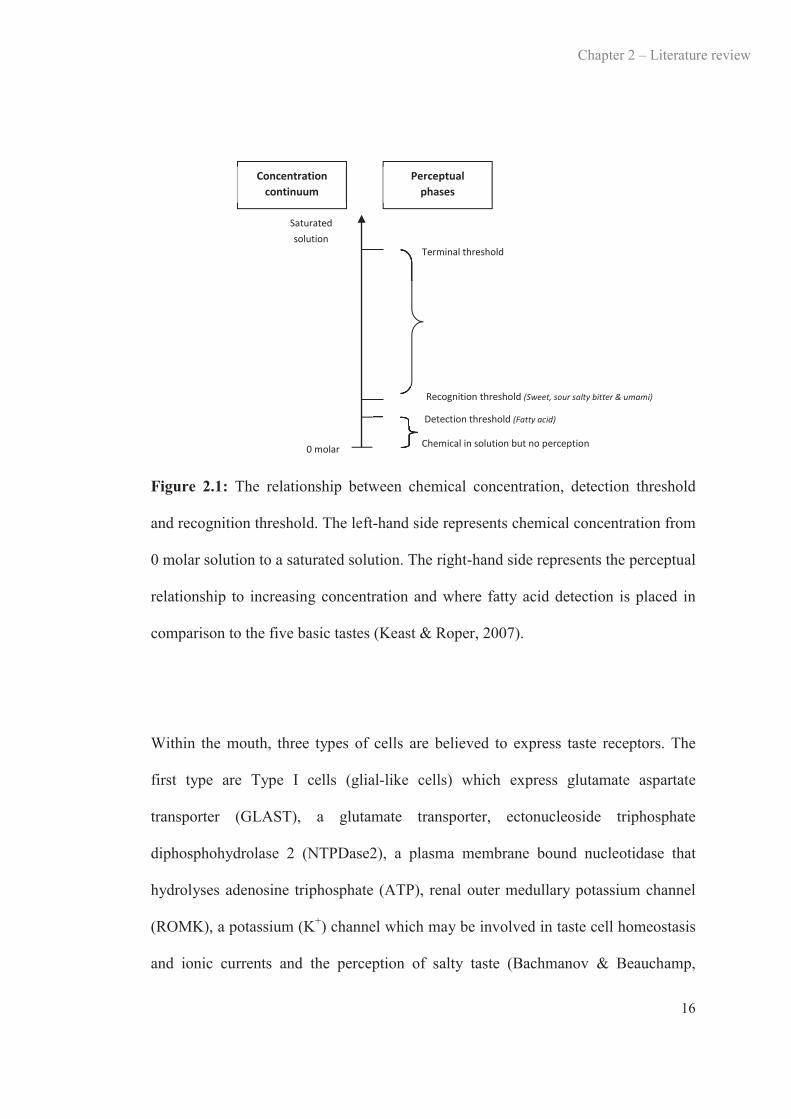
Figure 2.1: The relationship between chemical concentration, detection threshold
and recognition threshold. The left-hand side represents chemical concentration from
0 molar solution to a saturated solution. The right-hand side represents the perceptual
relationship to increasing concentration and where fatty acid detection is placed in
comparison to the five basic tastes (Keast & Roper, 2007).
Within the mouth, three types of cells are believed to express taste receptors. The
first type are Type I cells (glial-like cells) which express glutamate aspartate
transporter (GLAST), a glutamate transporter, ectonucleoside triphosphate
diphosphohydrolase 2 (NTPDase2), a plasma membrane bound nucleotidase that
hydrolyses adenosine triphosphate (ATP), renal outer medullary potassium channel
(ROMK), a potassium (K+) channel which may be involved in taste cell homeostasis
and ionic currents and the perception of salty taste (Bachmanov & Beauchamp,
0 molar
Saturated solution
Terminal threshold
Recognition threshold (Sweet, sour salty bitter & umami)
Detection threshold (Fatty acid)
Chemical in solution but no perception
Concentration continuum
Perceptual phases
Chapter 2 – Literature review
17
2007). The next type are Type II (sensory receptor cells) and these cells house the G-
protein coupled receptors (GPCRs) which mediate sweet (taste receptor, type 1
(T1Rs)), umami (T1Rs), bitter (taste receptor, type 2 (T2Rs)) and the downstream
signall -gustducin, ( )), as well as K+ and
sodium (Na+) channels (Bachmanov & Beauchamp, 2007). Lastly, Type III (pre-
synaptic cells) are suspected to form synaptic junctions with nerve terminals and
express a number of neuronal like genes, some of which are involved in sour taste
perception (Bachmanov & Beauchamp, 2007).
2.6 Possibility of oral fatty acid chemoreception: but fat taste?
Emerging evidence in both animals and humans suggests the existence of oral fatty
acid chemoreception mediated via receptors located on taste cells (Laugerette et al.,
2007). Taste in the traditional sense arguably requires an effective class of stimuli, a
taste cell specific transduction mechanism, activation of gustatory nerves by a
peripheral taste mechanism and be perceptually distinguishable from other taste
stimuli (Mattes, 2011a). Fatty acids most probably satisfy three of the four criteria,
but appear to have no discernible quality (e.g., sweet) associated with them. It may
be that the taste system has receptors for compounds such as fatty acids, yet the
functional response is not a perception, but rather signalling physiologic processes
regarding nutrient uptake or toxin expulsion independent of a perception. In this way
the perceptual taste system may be a subset of a larger oral chemoreception system
that responds to a wider selection of compounds than historically thought. These
affective responses to foods partially drive food consumption and individual
variation in affective response may influence overconsumption of foods and be a

Chapter 2 – Literature review
18
factor in the development of diet-related disease such as obesity. Of importance in
this debate is emerging evidence indicating a sixth taste quality responsive to fats, a
key macronutrient linked with obesity. Viewing the sense of taste as a component of
a larger inter-related system including chemesthesis, has previously been postulated
by Gibson (1967) and later extended upon by Green (2003). What follows below is a
review of evidence for oral fatty acid detection.
2.6.1 Animal evidence for oral fatty acid detection
Animal electrophysiological and behavioral studies have provided evidence in
support of oral detection of fatty acids (Fukuwatari et al., 2003; Gilbertson, et al.,
2005; Gilbertson, Liu, York, & Bray, 1998; Hiraoka, Fukuwatari, Imaizumi, &
Fushiki, 2003; Laugerette et al., 2005; Matsumura et al., 2007; McCormack,
Clyburn, & Pittman, 2006; Mindell, Smith, & Greenberg, 1990; Pittman et al., 2008;
Primeaux, Braymer, & Bray, 2013; Stratford, et al., 2006; Takeda, Sawano,
Imaizumi, & Fushiki, 2001). Gilbertson and Fontenot (1997) investigated the effect
of different polyunsaturated fatty acids (PUFA) on K+ channels directly on the
tongues of rats and found that when exposed to linoleic (C18:2), linolenic (C18:3),
arachadonic (C20:4), eicosapentanoic (C20:5) and docosahexanoic (C22:6) fatty
acids, inhibition of the K+ channel occurred (Gilbertson & Fontenot, 1997).
However, when treated with short-chain fatty acids, no change in K+ channels was
seen, raising the possibility that multiple fatty acid receptor systems may exist in the
oral cavity and that stimulation of the taste cells is selective depending on chain
length and saturation of the fatty acid (Gilbertson, et al., 1998). Supporting the
contention of multiple fatty acid receptors in the oral cavity, recent research in
Chapter 2 – Literature review
19
animals has identified cluster of differentiation 36 (CD36), GPCR120 and GPCR40
on taste tissue (Cartoni et al., 2010; Gotoh et al., 2007; Ichimura et al., 2012; Kawai
& Fushiki, 2003; Laugerette, et al., 2005; Matsumura et al., 2009; Naville et al.,
2012; Simons, Kummer, Luiken, & Boon, 2010; Zhang et al., 2011). Behavioral
studies have been conducted using two-bottle preference tests and have established
that healthy rodents show a preference for long-chain PUFA when compared to
sensory matched oils, even when they are anosmic, sham-fed and potential
confounding factors have been removed including texture, odor and post-ingestive
effects (Fukuwatari, et al., 2003; Mindell, et al., 1990; Takeda, et al., 2001; Tsuruta,
Kawada, Fukuwatari, & Fushiki, 1999). This suggests that there may be an
independent oral mechanism for the detection of fatty acids. In addition, rats that
were classified as orally hypersensitive to fatty acids consumed less dietary fat and
gained less weight when exposed to a high-fat diet, whereas orally hyposensitive rats
consumed excess fat and rapidly gained weight when fed a high-fat diet (Gilbertson,
et al., 2005; Gilbertson, et al., 1998). These studies suggest that oral sensitivity to
fatty acids may play a role or be a contributing factor to weight gain in animals.
2.6.2 Human evidence for oral fatty acid detection
In humans, several well-controlled studies have been conducted investigating oral
detection thresholds for unoxidised fatty acids using sensory matched samples. It
was reported that humans could detect C18:2, stearic acid (C18:0), lauric acid
(C12:0) and caproic acid (C6:0) in the oral cavity in a water emulsion at threshold
concentrations ranging from 0.007% (w/v) to 0.06% (w/v) (Mattes, 2001a, 2009c,
2009d). Similarly, oral detection thresholds have been found for C18:1, C18:2 and
Chapter 2 – Literature review
20
C12:0 when using a stable milk emulsion (Stewart et al., 2010; Stewart, Newman, &
Keast, 2011; Stewart, Seimon, et al., 2011). In both studies, non-taste cues were
controlled for including (1) textural cues, for example, viscosity, which are normally
associated with the mouth feel of fats by the use of mineral oils and gums, (2)
olfactory cues through the use of nose clips and (3) visual cues as all tests were
conducted under red lights (Mattes, 2009c; Newman & Keast, 2013; Stewart, et al.,
2010).
Additional studies have found that oral exposure specifically to fat, but not fat
mimetics (replacers) enhances the cephalic response and post prandial triglyceride
concentrations (Mattes, 2001a). This finding followed sham feeding (sample
mastication with expectoration) of butter and various fat replacers. Furthermore,
physiological responses to oral fat exposure included, gastric lipase secretion, altered
GI transit, pancreatic exocrine secretions, gut hormone release, mobilisation of
stored lipids from enterocytes, pancreatic endocrine secretion and altered lipoprotein
lipase activity (Mattes, 2005). Results support the phenomenon of oral fat detection
as fat specific enzymes and other digestive mechanisms throughout the GI tract were
initiated when fats were exposed to the oral receptors; however no such
physiological changes in circulating triacylglycerol concentrations were seen when
protein and carbohydrate based fat mimetics were used (Mattes, 2001a). It was
believed this was due to the cephalic phase response, which involves the release of
pre-absorptive enzymes and hormones when a food is tasted. This mechanism is
thought to optimise nutrient digestion, absorption and metabolism (Crystal & Teff,
2006).
Chapter 2 – Literature review
21
Recently, oral fatty acid sensitivity has been measured using a novel method
whereby subjects “tasted” edible strips, rather than the previous method of liquid
emulsions (Ebba et al., 2012). Although this method is limited by the solubility of
fatty acids due to their hydrophobic nature, taste strips may be an effective vehicle
for taste recognition due to the low background noise of the strip (Smutzer et al.,
2008). In addition, studies have suggested that somatosensory cues may be minimal
due to the rapid dissolving time of the strips (Smutzer, et al., 2008). However, this
cannot be certain and measures should be put in place to control for texture and
odour cues associated with fats. Ebba et al (2012), do not make mention of
controlling for these attributes and hence, this may be a limitation of this
methodology and its use with fats.
Nonetheless, it is unknown if an individual’s oral fatty acid sensitivity as measured
by oral detection thresholds remains stable over time, or if the threshold changes as
dietary fat intake varies. Studies have confirmed the reliability and reproducibility of
taste thresholds for the five prototypical tastes (Ahne, Erras, Hummel, & Kobal,
2000) and our laboratory recently completed similar testing with oral fatty acid
thresholds and found results comparable to the prototypical tastes (Newman &
Keast, 2013). In contrast, Tucker et al. (2013) compared two types of sensory
methodologies (ascending vs. staircase) for the measurement of oral fatty acid
detection thresholds and found that subject’s thresholds improved after each session
(Tucker & Mattes, 2013). Differences in findings may be due to differences in
testing methodology (triangle tests with ascending forced choice methodology vs. 3-
alternate forced choice (3-AFC) and staircase methodology) and the fact that the
Chapter 2 – Literature review
22
vehicle in which the fatty acids were presented in were different (non-fat milk
samples vs. water samples). Both of these studies, however agree that taste
thresholds need to be measured more than once to gain an accurate portrayal of one’s
sensitivity to fatty acids (Newman & Keast, 2013; Tucker & Mattes, 2013).
2.7 Putative mechanisms for fatty acid chemoreception
It is thought that the ability to detect fatty acids is via oral receptors (CD36, GPCRs),
ion channels (Delayed Rectify Potassium (DRK) channels) and enzymes (lingual
lipase) which have been located in the oral cavity on taste receptor cells within the
circumvallate and fungiform papillae (Laugerette, et al., 2007) (Figure 2.2).
Chapter 2 – Literature review
23
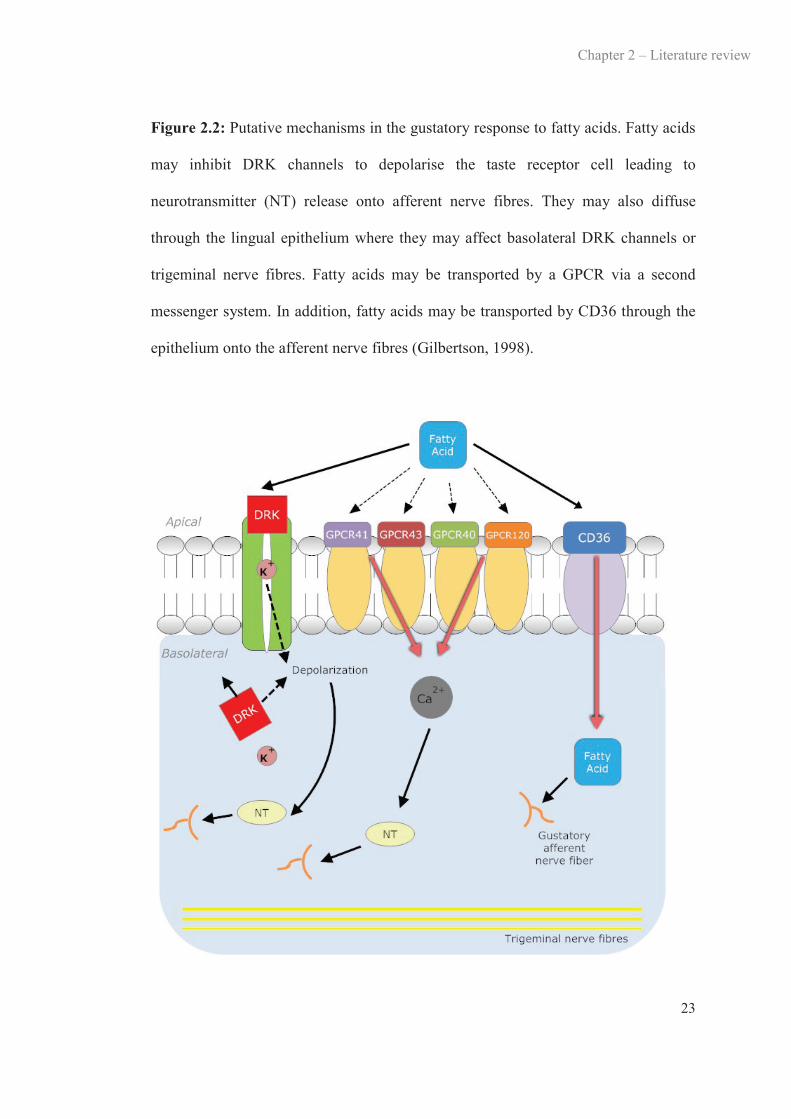
Figure 2.2: Putative mechanisms in the gustatory response to fatty acids. Fatty acids
may inhibit DRK channels to depolarise the taste receptor cell leading to
neurotransmitter (NT) release onto afferent nerve fibres. They may also diffuse
through the lingual epithelium where they may affect basolateral DRK channels or
trigeminal nerve fibres. Fatty acids may be transported by a GPCR via a second
messenger system. In addition, fatty acids may be transported by CD36 through the
epithelium onto the afferent nerve fibres (Gilbertson, 1998).
Chapter 2 – Literature review
24
2.7.1 CD36
One of the proposed mechanisms of oral fatty acid nutrient detection is via CD36
receptors (Abumrad, 2005). CD36 is found in the oral cavity on human taste buds,
specifically circumvallate and foliate papillae (Simons, et al., 2010). Results from a
mouse study have shown that inactivating the CD36 receptor eliminated a preference
for long chain fatty acid (LCFA) enriched solutions and solid foods (Laugerette, et
al., 2005). Furthermore, high-fat diet induced rats showed reduced expression of
CD36 which may be associated with fatty acid taste adaptation (Zhang, et al., 2011).
There is also the possibility that CD36 may be involved with the onset of fat induced
satiety (Naville, et al., 2012). This suggests that the CD36 receptor may play a direct
role in fat perception and possibly food regulation (Laugerette, et al., 2005; Pepino,
Love-Gregory, Klein, & Abumrad, 2012).
A recent study using obese humans investigated whether oral sensitivity to fatty
acids is associated reduced expression of CD36 (Pepino, et al., 2012). Subjects were
grouped based on whether or not they were a carrier of the variant rs 1761667-A
allele of CD36, which has previously been associated with fat metabolism. Subjects
were then assessed for their ability to detect C18:1 in water solutions and those who
had the genetic variant of CD36 had lower detection thresholds than those without
the variant (Pepino, et al., 2012). The same study also investigated thresholds using
both a fatty acid and a triglyceride with and without the addition of orlistat (a lipase
inhibitor) and it was found that the inhibition of lipase meant that the release of fatty
acids from triglyceride was reduced, therefore diminishing oral fatty acid sensitivity
(Pepino, et al., 2012). This study provides strong evidence to suggest CD36 as an

Chapter 2 – Literature review
25
orosensory receptor for dietary fatty acids in humans. Additionally, Keller et al.
(2012) has suggested a possible association between polymorphisms in the CD36
receptor, oral fat perception and fat preference in human subjects (Keller, et al.,
2012). These types of physiological signals which detect fat and control
consumption are plausible and these mechanisms should be explored further.
2.7.2 GPCRs
The possibility that GPCRs may be involved in fatty acid detection within the oral
cavity has been suggested and it is thought that CD36 may work together with other
possible receptors like GPCRs in a signalling cascade to detect fatty acids (Galindo
et al., 2012). GPCR120 and GPCR40 bind to fatty acids which activate G-proteins
leading to the production of the second messenger phospholipase C, and the release
of calcium (Liu, Shah, Croasdell, & Gilbertson, 2011). This rise in calcium activates
the cation channel Transient Receptor Potential channel type M5 (TRPM5) and
allows depolarisation of the receptor potential to occur (Liu, et al., 2011). This
potential opens the fatty acid sensitive DRK channels, which are consequently
blocked by fatty acids, leading to prolonged depolarisation. This depolarisation is the
main driver for the release of neurotransmitters on gustatory afferent fibres
(Montmayeur & le Coutre, 2010). GPCR120 and GPCR40 have been expressed in
the apical portion of type I and II cells from animal taste buds (Cartoni, et al., 2010;
Gotoh, et al., 2007; Matsumura, et al., 2007) and more recently, human taste buds
(Galindo, et al., 2012). GPCR120 has been isolated in rat circumvallate, fungiform
and foliate papillae (Matsumura, et al., 2007), while GPCR40 are expressed
specifically in the circumvallate papillae (Covington, Briscoe, Brown, &
Chapter 2 – Literature review
26
Jayawickreme, 2006). When wild mice were compared to GPCR120 and GPCR40
knock-out mice, the latter showed an attenuated preference for C18:2 and C18:1,
suggesting these receptors play a role in the perception of fatty acids (Cartoni, et al.,
2010). Furthermore, when GPCR120 deficient mice were fed a high-fat diet, they
developed obesity and other side effects of metabolic syndrome indicating a role in
regulation of energy intake (Ichimura, et al., 2012).
2.7.3 DRK channels
DRK channels are known to be implicated in the transduction pathway of a variety
of taste stimuli. A study by Gilbertson et al. (1998) found that PUFA slow down
DRK polarisation on the foliate and circumvallate papillae taste cells and therefore
allow fat to be detected (Gilbertson, et al., 1998). In obesity-prone (O-M) rats,
greater suppression of the potassium current of DRK channels was seen after dose
analysis using C18:2. This suggests prolonged depolarisation of the taste receptors
may occur due to suppression of the channel’s ability to repolarise following an
action potential (Primeaux, et al., 2013).
2.7.4 Lingual lipase
The breakdown products of carbohydrates are sugars and proteins are amino acids
both of which have taste activity (Bachmanov & Beauchamp, 2007). Therefore, it
could be expected that free fatty acids, the breakdown products of triglyceride would
have taste activity too. In animals, lingual lipase is released to cleave triacylglyceride
to component fatty acids (Kawai & Fushiki, 2003). Triacylglycerides are too large to
be detected or pass through the cell membrane, whereas free fatty acids are able to
Chapter 2 – Literature review
27
translocate through a cellular membrane with ease, however the availability of these
in the food matrix is low with fatty foods (including nuts and oils) thought to contain
between 0.01%–0.1% non-esterified fatty acids (NEFA) (Kulkarni & Mattes, 2013;
Laffargue, de Kochko, & Dussert, 2007). Despite this, it is thought only small
quantities of free fatty acids are required to induce a taste response. Consequently,
lipase enzymes are very important as they break the triglyceride down so that free
fatty acids can be transduced by cellular pathways (Kawai & Fushiki, 2003). Kawai
and Fushiki (2003) reported that inhibition of lingual lipase in mice reduces their
preference for lipids greatly (Kawai & Fushiki, 2003). This illustrates that in animal
models, lingual lipase plays a significant role in oral fat transduction and perception
(Kawai & Fushiki, 2003). In humans, however the presence and potential role of
lingual lipase is debatable. Data have suggested lipolytic activity may be present in
humans, however compared to animal models, activity appears to be weak (Stewart,
et al., 2010) and it is yet to be resolved whether sufficient concentrations of lingual
lipase are produced or whether this originates from endogenous sources or otherwise.
Kulkarni and Mattes (2013) have recently observed mastication of fatty foods
(almond butter, almonds, olive oil and shredded coconut) can increase salivary
NEFA concentrations from between 20–60 μM compared to control stimulated
saliva levels, suggesting these concentrations in foods may be enough to initiate
gustatory signalling (Kulkarni & Mattes, 2013). Furthermore, Pepino et al. (2012)
investigated the effect of a lipase inhibitor (orlistat) on fatty acid detection in the oral
cavity and reported that oral sensitivity was diminished (i.e., increased detection
thresholds) when orlistat was present, suggesting that lipase may play a functional
role in fatty acid detection in the oral cavity (Pepino, et al., 2012).
Chapter 2 – Literature review
28
There are multiple putative mechanisms to initiate oral fatty acid detectors including
CD36 transporter, GPCRs, DRK channels and lingual lipase hydrolysis of fats to
fatty acids; however it is yet to be elucidated if/ how these function independently or
together in oral fatty acid detection.
2.8 Possible functions of fatty acid chemoreception
Recent research has implicated oral fatty acid sensitivity in weight gain, with those
less sensitive (higher taste threshold) having a higher BMI, however not all studies
have found the same results (Kamphuis, Saris, et al., 2003; Mattes, 2009d, 2011b;
Stewart, et al., 2010; Stewart & Keast, 2012; Stewart, Newman, et al., 2011). Oral
fatty acid sensitivity refers to an individual’s ability to detect fatty acids in a complex
matrix when tasting a solution. The ability to detect fatty acids differs between
individuals and variance is likely a result of oral peripheral mechanisms responsible
for chemoreception, such as differences in fatty acid receptor functionality or
papillae density (Chale-Rush, Burgess, & Mattes, 2007b). Indeed, a positive
association between sensitivity and number of taste papillae has been reported
(Drayna, 2005; Gilbertson, et al., 2005). Selected studies have found a link between
sensitivity to and liking of, or dislike to certain tastants, however myriad factors
presumably drive this association (Drewnowski & Henderson, 2000; Keller,
Steinmann, Nurse, & Tepper, 2002; Turnbull & Matisoo-Smith, 2002). Thus, further
research is required to elucidate the directionality of relationships between oral
chemoreception (taste sensitivity), food choice, preferences and taste receptor
expression.
Chapter 2 – Literature review
29
Kamphuis et al. (2001) investigated whether there was a link between oral fatty acid
sensitivity and BMI (Kamphuis, et al., 2001). The authors suggested the existence of
‘fat-tasters’ and ‘fat non-tasters’ reporting that ‘fat-tasters’ had a lower BMI than ‘fat
non-tasters’, however there was no link between oral fatty acid sensitivity and fat
consumption (Gilbertson, et al., 1998; Kamphuis, et al., 2001). Nevertheless, given
the low concentration (0.0028% weight/volume (w/v) C18:2) and the fact that only
one type of fat was used to determine fat taster status, the existence of ‘fat non-
tasters’ remains controversial. Conversely, a relationship between fat intake and
obesity may exist as fat intake is high in the obese population.
The relationship between oral fatty acid sensitivity, BMI and dietary fat intake has
recently been investigated and it was reported those who were more sensitive to the
fatty acid C18:1 had lower energy intakes and consumed less total dietary fats and
saturated fats and were also better at detecting the fat content of food (custard) than
less sensitive subjects (Stewart, et al., 2010). This suggests that oral fatty acid
chemoreception may be used for the identification of fats. Additionally, individuals
who were classified as hypersensitive also had lower BMIs than hyposensitive
individuals (Stewart, et al., 2010). Another study by Stewart et al. (2011) extended
these results and also found a relationship in humans between fatty acid sensitivity,
food consumption and dietary behaviours, whereby those who were hyposensitive
consumed more high-fat dairy products, high-fat spreads and fatty red meat (Stewart,
Newman, et al., 2011). Conversely, hypersensitive individuals reported behaviors
including trimming the fat off meat and avoiding saturated fats (Stewart, Newman, et
al., 2011). The exact mechanisms responsible for these differences between hyper-
Chapter 2 – Literature review
30
and hyposensitive groups are not yet understood. In contrast, some studies have
reported no associations between oral fatty acid sensitivity and BMI (Kamphuis,
Saris, et al., 2003; Mattes, 2009d, 2011b; Newman & Keast, 2013; Stewart & Keast,
2012), with these studies testing oral fatty acid sensitivity on more than one occasion
(Mattes, 2009d, 2011b). Reasons as to why there are differences between studies
may be due to the fact that the studies which have found associations have used an
abbreviated screening procedure for testing oral fatty acid sensitivity based on
grouping subjects as hypersensitive and hyposensitive to a specific fatty acid
concentration, while the studies that found no associations used a complete threshold
testing procedure (e.g., staircase, 3-AFC). Thus, grouping the subjects into hyper-
and hyposensitive may be skewing the results. The fact that subject’s sensitivity was
only measured on one occasion may have resulted in misclassification of sensitivity
as it has now been shown that at least two sessions (Newman & Keast, 2013), or
seven as recommended by others (Tucker & Mattes, 2013), are needed to minimise
the chance of misclassification. In addition, the difference in weight status between
the groups in some studies may have not be large enough to detect differences and
associations between BMI and oral sensitivity (Newman & Keast, 2013; Tucker &
Mattes, 2013). Careful consideration of testing methodology should be made based
on the outcomes of the research e.g., using 3-AFC methodology may be more suited
to determining hypersensitive versus hyposensitive individuals. Nevertheless, the
main outcome of these findings was not to investigate the associations between BMI
and oral fatty acid sensitivity, therefore future studies designed specifically to
investigate this relationship with greater contrast in BMI are needed. While fatty acid
sensitivity may drive fat consumption and preference, the reverse may also be true in

Chapter 2 – Literature review
31
that prolonged fat consumption and/ or preference may be a predictor of sensitivity.
In this paradigm, recent research suggests that similarly to the oral cavity, GI
responses are attenuated.
2.9 Fatty acid sensitivity in the oral cavity and GI tract
An important mechanism involved in energy intake regulation is the body’s ability to
detect fat and other nutrients in the oral cavity and GI tract. Evidence now exists that
sweet and umami taste receptors for sugars (carbohydrates) and amino acids
(proteins) respectively, are co-located in the GI tract (Bachmanov & Beauchamp,
2007), which provides foundation evidence for the hypothesis that the taste system is
the first contact for a coordinated alimentary canal nutrient detection system. It is
now thought that the same relationship exists for fats, with fatty acid detection
occurring in both the oral cavity and GI tract (Figure 2.3).
During digestion, fats have potent effects on hormones that regulate food intake, for
example, cholecystokinin (CCK) and glucagon-like peptide-1 (GLP-1) decrease
gastric emptying and secretion of the hunger stimulating hormone ghrelin, while
leptin binds to neuropeptide Y (NPY) to reduce appetite and induce satiety (Feltrin,
et al., 2004; Heini et al., 1998). Studies have also suggested that these hormone
responses are impaired in obese individuals, raising the possibility that fat intake
may be poorly controlled in the obese population due to a dysfunction in appetite
regulation (Figure 2.3). When comparing lean and obese individuals after an intra-
duodenal infusion of C18:1, no stimulation of pyloric motility occurred in obese
individuals, suggesting that they respond differently to the stimulus and that this may
Chapter 2 – Literature review
32
be due to a decreased ability to sense fatty acids along the GI tract (Stewart, Seimon,
et al., 2011). Plasma CCK concentrations were also lower in obese subjects after the
C18:1 infusion than the lean subjects, however this did not quite reach significance
(P = 0.07) and could have been due to the small sample size. Additionally, oral fatty
acid sensitivity was also impaired in the obese suggesting a coordinated alimentary
canal response to fatty acids.
Associations between fatty acid sensitivity status and perceived satiety after a
high-fat meal have also been found (Keast, Azzopardi, Newman, & Haryono,
2013). This study presented subjects with four different breakfasts (high-fat,
high-carbohydrate, high-protein and macronutrient balanced) and then offered
subjects a buffet lunch three hours later. Subjects were grouped as
hypersensitive or hyposensitive based on their ability to detect C18:1 and it
was found that the hyposensitive individuals consumed more at the buffet meal
after the high-fat breakfast than the hypersensitive group. Hypersensitive
individuals consumed significantly less energy at the buffet after the high-fat
breakfast compared to the high-carbohydrate and macronutrient balanced
breakfasts. This suggests that in hyposensitive individuals attenuation of the
putative fat detection mechanism may have occurred which may therefore have
decreased the effectiveness of the feedback response, in particular the satiety
response and in turn, possibly lead to increases energy intake (Keast, et al.,
2013).
Chapter 2 – Literature review
33
Figure 2.3: A proposed schematic representation of fatty acid chemoreception in the
oral cavity and GI tract (alimentary canal) in lean (left) and obese (right) individuals.
(1) Fat is present in foods in the form of triglycerides; free fatty acids are generated
during the breakdown of fats and by lipase enzymes in the oral cavity. (2) Fatty acids
access putative receptors (CD36, GPCR 40, 41, 43, 120 and DRK channels) within
taste cells; lean individuals have greater quantities of these receptors, compared to
obese individuals. The receptors elicit the release of intracellular calcium which in
turn activates neurotransmitters and hormones associated with the cephalic response.
(3) Following fat ingestion, gastric and pancreatic lipase plays a further role in the
hydrolysis of fats enabling access to fatty acid receptors on enteroendocrine cells,
stimulating satiety hormones and uptake of fatty acids. As a consequence, sensitivity
to ghrelin, responsible for hunger stimulation is inhibited, while the satiety inducing
hormone leptin is released as are the hormones CCK, Peptide YY (PYY), GLP-1. (4)
In a lean individual, expression of fatty acid receptors is greater therefore increasing
fat sensing ability through the alimentary canal, thereby decreasing energy intake.
(5) In comparison, obese individuals have decreased expression of fatty acid
receptors, attenuating fat sensing ability and increasing energy intake (Newman,
Haryono, & Keast, 2013).
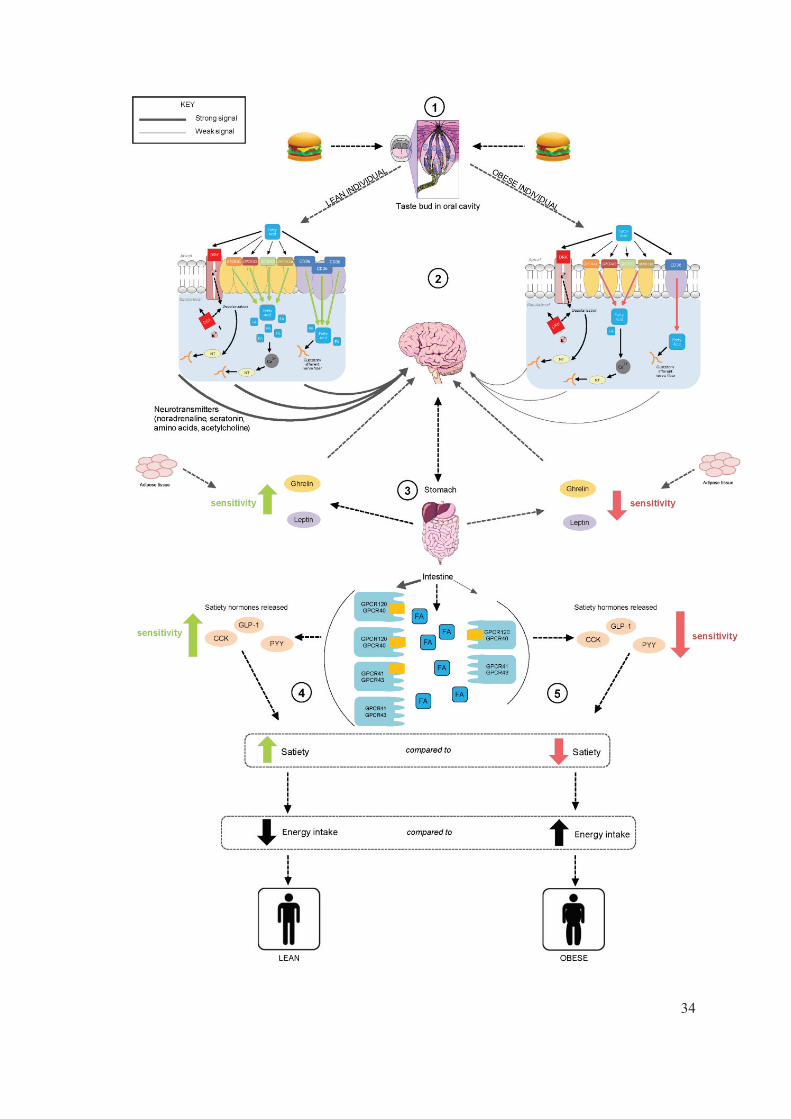
Chapter 2 – Literature review
34
Chapter 2 – Literature review
35
2.10 Dietary influences on fatty acid chemoreception
In developed populations, individuals are consuming excess fat which corresponds in
many cases to weight gain (Swinburn, et al., 2011), suggesting that adaptation to a
high-fat diet may have occurred. Adaptation has been shown to occur with other
nutrients including sodium. Increasing the amount of sodium consumed in the diet
can increase the taste threshold for NaCl, and therefore increase the concentration of
NaCl required to elicit saltiness (Mattes, 1997). This may also be the case for fat
because since the 1920s the population’s fat consumption has been higher (32%)
than the recommended daily levels, peaking in the 1950s with 40-42% of the diet
comprising of fat (Nestle & Woteki, 1999). The percentage of fat is also affected by
total energy intake, for example, an obese individual may consume 15 MJ of energy
per day of which 32% is derived from fat (approximately 130 grams of fat),
compared to a lean individual who may consume 7 MJ per day and also 32% from
fat (approximately 60 grams of fat). Even though the obese individual is consuming
32% dietary fat of their total energy requirement, they are consuming double the
amount of fat than the lean individual, thus as a population we are more obese than
any other time in history, and therefore are consuming more fat. Due to the excess
consumption of fat, it can be suggested that the body may have adapted to a high-fat
environment over the past century, and in turn reduced their sensitivity to fats
throughout the alimentary canal, however, the directionality of this relationship is yet
to be elucidated (Nestle & Woteki, 1999).
Consumption of a high-fat diet has been shown to decrease oral fatty acid sensitivity
(Stewart & Keast, 2012). Dietary influences on the modulation of fatty acid,
Chapter 2 – Literature review
36
specifically C18:1, detection thresholds was investigated whereby subjects were
asked to consume a low-fat diet (< 20% fat) for four weeks and after a two week
wash out period, then followed a high-fat diet for four weeks (> 40% fat). After the
low-fat diet both lean and overweight/ obese subjects’ C18:1 detection thresholds
decreased, in other words their sensitivity increased and after the high-fat diet
thresholds increased, however this only occurred in the lean subjects with no change
in thresholds for the obese population after the high-fat diet (Stewart & Keast, 2012).
This suggests that in the obese population, consumption of a high-fat diet has
occurred that has promoted habituation which therefore decreased the physiological
and psychological effects of fat, and in turn decreased oral sensitivity to fat and
possibly promoted obesity. However, no differences in dietary fat consumption were
seen between the lean and obese group at baseline, therefore, the explanation that the
obese population had adapted to the high-fat environment does not provide an
explanation as to why the lean group’s sensitivity decreased after consumption of the
high-fat diet (Running, Mattes, & Tucker, 2013). Additionally, relationships between
fatty acid sensitivity and food behaviours have been reported whereby hyposensitive
individuals consumed more high-fat dairy products, fatty red meats and fatty spreads
compared to hypersensitive individuals (Stewart, Newman, et al., 2011) suggesting
that hypersensitive individuals are more likely to engage in fat reducing behaviours
than hyposensitive individuals. Associations between dietary fat consumption and
oral fatty acid sensitivity remain contentious with some studies finding a relationship
between the two (Stewart, et al., 2010; Stewart, Newman, et al., 2011), while others
have found no relationship (Mattes, 2009d, 2011b; Stewart & Keast, 2012).
Therefore, the relationship between habitual diet and oral fatty acid sensitivity
Chapter 2 – Literature review
37
remains unresolved, however due to the associations between disease risk and fat
consumption, this is an area that deserves further investigation.
2.11 Environmental influences on gene expression
The concept of taste sensitivity to and dietary consumption of certain nutrients being
genetically predisposed is not novel, for example, it is well established that
sensitivity to the bitter compounds phenylthiocarbamide (PTC) and 6-n-
propylthiouracil (PROP) are genetically determined and influence the liking and
consumption of brassica vegetables (e.g., brussel sprouts and kale) which contain
bitter tasting compounds (e.g., phenols, glucosinolates and terpenes) (Turnbull &
Matisoo-Smith, 2002). Differences in oral sensitivity to certain tastants, as well
dietary consumption of foods containing these tastants may be due to the amount of
receptors present in the oral cavity, or perhaps, the number of taste papillae on the
tongue.
As previously mentioned, fats are thought to be detected by fatty acid specific
receptors in both the oral cavity and GI tract. The role of these receptors in fat
detection is now becoming more apparent with studies highlighting dietary
influences on receptor expression. While there is a paucity of evidence in humans,
emerging evidence in animals is showing promising findings. Following the
consumption of a high-fat diet, CD36 receptor expression on the lingual tissue of rats
was reduced highlighting the potential link between fat consumption and CD36
receptor expression (Zhang, et al., 2011). While suggestive at this stage, it does
appear that over a short period of time, an individual can adapt to a fatty food
Chapter 2 – Literature review
38
environment. Within a few weeks an individual can adapt to a fatty food
environment by becoming less sensitive to the physiological and psychological
effects of fat, thereby retaining the ability to consume foods with higher than optimal
concentrations of fat (Cordain, et al., 2005). For example, when fed a low-fat diet for
12 weeks, subjects were found to have a decreased preference for high-fat foods,
suggesting that adaptation to a low-fat diet had occurred (Mattes, 1993).
Consequently, many humans can quickly adapt to the new environment by
consuming more fats, but in doing so, the prevalence of obesity is increasing as we
have not yet developed a way to deal with the excess fat being consumed. Whether
this is a result of changes in gene expression, or perhaps reduced receptor sensitivity
remains unresolved.
Similarly, single nucleotide polymorphisms (SNP) (FTO rs9939609) have been
identified and labelled as important considerations when determining an individual’s
susceptibility to obesity, with suggestion that impaired satiety, greater food intake
and frequent loss of eating control in individuals with at least one risk allele may
account for the observed increase in obesity risk (Haupt, 2009; Speakman, Rance, &
Johnstone, 2008; Tanofsky-Kraff et al., 2009). Interactions between genetic and
dietary factors, in particular dietary fat, may also contribute to the increased
susceptibility to obesity (Phillips et al., 2012). Recent research backed up these
findings reporting that the gene variant rs9939609 was associated with BMI in the
overweight/ obese category and that this may be modulated by saturated fat intake
(Phillips, et al., 2012). This highlights how closely associated environmental and
genetic factors may be in relation to the development of obesity. However, reported
Chapter 2 – Literature review
39
proportions of BMI variation associated with SNPs have been minimal with less
than 10% of variance (difference of ~0.5 kg in the standard deviation of weight)
attributed to nucleotide polymorphisms (Gaunt et al., 2001; Yang et al., 2012). Thus,
it cannot be undoubtedly stated that there is a direct link between environmental and
genetic factors with regards to the predisposition and development of obesity.
2.12 Conclusions
In summary, excess fat consumption is a major cause of obesity as well as other
diseases including CVD and type-2 diabetes. Fat intake can be influenced by many
factors including habituation and satiety mechanisms and an individual’s ability to
detect fatty acids in the oral cavity and GI tract via fat specific receptors. There is
substantive emerging evidence that an oral nutrient detection system for fatty acids
exists in humans. Similar to the five basic tastes, the ability to detect fatty acids in
the oral cavity varies amongst the population. This variance may be a factor in
influencing one’s consumption of high-fat foods, with those who are hypersensitive
consuming less fat and preferring low-fat foods than hyposensitive individuals who
consume more fat and prefer high-fat foods. It is unknown what the main drivers of
this association are, or if in fact reduced fatty acid sensitivity is a predictor of dietary
fat consumption, or vice versa. Knowing the reproducibility and stability of an
individual’s oral fatty acid sensitivity is important and needs to be verified. Oral fatty
acid sensitivity and its potential links to obesity is a controversial area of research
with more investigation needed from a variety of scientific disciplines, but emerging
evidence linking oral fatty acid sensitivity with development of obesity is promising.
Currently the exact mechanisms associating oral fatty acid sensitivity, fat

Chapter 2 – Literature review
40
consumption and weight gain remain largely elusive. Dietary intake may not be the
only factor influencing one’s sensitivity; other considerations, for example, the
expression of taste receptors in the oral cavity are likely to play an influential role.
Investigating oral fatty acid sensitivity and its potential links with dietary fat intake,
sensory responses and its potential links with putative fatty acid taste receptor
expression will build upon present knowledge; if indeed sensory responses and/or
receptor expression can be modulated in response to a high-fat diet, or if oral
sensitivity and expression are drivers of fat preference and consequent consumption
may provide more of an insight into reasons for excess fat consumption. These ideas
are conjectural, but may identify strategies to reduce obesity and related pathologies.
This thesis comprises of seven chapters which are structured as follows:
Chapter One provides an introduction to the topic of this thesis and highlights the
key points of focus. Chapter Two contains an up-to-date review of the literature in
this area including background information on overweight and obesity; fat
consumption; the sense of taste; the possibility of oral fatty acid sensitivity;
mechanisms of oral fatty acid sensitivity; possible functions of oral fatty acid
sensitivity; the link between the oral cavity and GI tract with regards to fatty acid
sensing; dietary influences; and environmental influences on gene expression.
Chapter Three outlines all methodology used in this research which comprised of
two sensory evaluation studies and one dietary intervention. Chapters Four to Six
detail the three studies and includes rationale, methods, results, discussion and
conclusion for each. Study 1 (Chapter Four) is a comprehensive investigation of the
Chapter 2 – Literature review
41
test-retest reliability of oral fatty acid detection thresholds. Study 2 (Chapter Five)
investigated the influence of a high-fat meal prior to oral fatty acid detection
threshold testing. Study 3 (Chapter Six) was a large dietary intervention that
compared the effect of a low-fat diet (25% total energy from fat) and a portion
control diet on oral fatty acid sensitivity, fat preference and fat perception in an
overweight/ obese population. Finally, Chapter Seven summarises the findings of
the three studies conducted, their limitations and future directions for research.
2.13 Aims
The overall aim of this thesis was to determine the extent to which dietary fat plays a
role in determining oral fatty acid sensitivity. The objectives that were critical in
addressing the aim were:
To determine the test-retest reliability of oral fatty acid detection thresholds;
To measure the effect that a high-fat meal immediately prior to detection
threshold testing has on oral fatty acid thresholds;
To measure the effect that consumption of a low-fat diet (25% total fat) for
six weeks has on oral fatty acid detection thresholds in an overweight/ obese
population;
To measure the effect that consumption of a portion control diet for six
weeks has on oral fatty acid detection thresholds in an overweight/ obese
population.
Chapter 2 – Literature review
42
2.14 Hypotheses
This thesis will test the following hypotheses:
There will be large inter-individual variation in oral fatty acid detection
thresholds;
There will be minimal intra-individual variation in oral fatty acid detection
thresholds, therefore, high test-retest reliability;
The consumption of a high-fat meal immediately prior to detection threshold
testing will not have an effect on oral fatty acid thresholds;
Consumption of a low-fat diet for six weeks will, significantly increase oral
fatty acid sensitivity to C18:1, whereas, consumption of a portion control diet
for six weeks may increase oral fatty acid sensitivity, but not to the same
extent as those following the low-fat diet.

C H A P T E R T H R E E
Materials, methodology and measurements
3
3.1 Introduction
This PhD used quantitative methodology to achieve the aims and test the hypotheses
described in Chapter Two. This Chapter describes all of the methodology employed
including sensory evaluation and dietary intervention methods. The methodology is
also briefly outlined within each respective chapter. All methods and techniques used
to complete this thesis were well established within the Sensory Laboratory at
Deakin University, Burwood, Australia.
3.2 Subjects
Power calculations were performed prior to commencement of all studies to
determine suitable sample sizes to achieve statistical power. These calculations are
detailed within each chapter. All participants for each study were between the ages
of 18-75 years and were non-smokers. For studies one and two, subjects were in
good health and for study three, all subjects were overweight or obese at the time of
testing. All studies were conducted according to the guidelines laid down by the
Declaration of Helsinki and all procedures involving human subjects were approved
by the Deakin University Human Research Ethics Committee prior to study
commencement. All studies were also registered at www.actr.org.au as clinical trials.
Written informed consent was obtained from all subjects prior to participation and
participants were free to withdraw from all studies at any stage throughout the
experiment.
Chapter 3 – Materials, methodology and measurements
44
3.2.1 Subject demographics
Prior to each study, subjects were screened for eligibility in which demographic
information including weight, height, age, gender and smoking status were collected
(Appendix A). In study three, other information collected prior to commencement of
the study included food intolerances, medical conditions and use of prescription and
non-prescription medications.
3.2.2 Reimbursement
Subjects were reimbursed for their time by means of vouchers/ gift cards from the
Coles Group and Myer (department store). Values for gift cards were calculated on
an hourly basis: $10 per day of sensory testing during study one, and $16 per week
for study three (this was a six week dietary intervention). Subjects who participated
in study two were not reimbursed via vouchers/ gift cards.
3.3 Sensory testing
3.3.1 Sensory testing
All sensory testing was performed in individual sensory booths in the sensory
laboratory at the School of Exercise and Nutrition Sciences, Deakin University,
Melbourne, Australia. Participants were asked to refrain from eating, drinking or
chewing gum for at least one hour prior to testing. The individual dietary counselling
sessions (study three) took place in a private room at Deakin University under the
supervision of the coordinating dietitian of the study (S.T.).
Chapter 3 – Materials, methodology and measurements
45
3.3.2 Oral fatty acid solutions – materials and methods
Subjects were examined for their ability to detect low concentrations of fatty acids
including oleic acid (C18:1), linoleic acid (C18:2) and lauric acid (C12:0) during
study one, which explored the test-retest reliability of oral fatty acid detection
thresholds. Detection thresholds for C18:1 were also determined for studies two and
three. In doing so, subjects were required to distinguish differences in taste between
samples containing fatty acids and samples without fatty acids (control). To prepare
the fatty acid solutions, food grade fatty acids; C18:1 and C12:0 (Sigma Aldrich,
Missouri, USA) and C18:2 (Larodan Fine Chemicals, Malmö, Sweden) were added
to long-life non-fat milk (Devondale, Cobram, Victoria, Australia) at varying
concentrations. To minimise textural differences that the fatty acids may have
created, all samples were mixed with gum acacia (Deltagen Australia, Boronia,
Victoria, Australia) and liquid paraffin (Faulding Remedies, Virginia, Queensland,
Australia). To prevent oxidation of fatty acids, ethylenediaminetetraacetic acid
(EDTA) (Merck, Darmstadt, Germany) was added to all samples.
Non-fat milk was used as the vehicle for fatty acid solutions as it has been used in
prior research conducted in the Deakin University Sensory Laboratory (Stewart, et
al., 2010; Stewart, Newman, et al., 2011). For all solutions, oil in water emulsions
were created, with the addition of 5% (w/v) gum acacia and 5% (w/v) mineral oil to
reduce potential non-taste cues, for example, viscosity or other textural attributes
(Chale-Rush, et al., 2007a). The textural attributes, odour and appearance of fats are
easily distinguishable and are responsible for the perception of fat within a food.
Therefore, as this thesis is focusing on taste only, it was important to ensure that
Chapter 3 – Materials, methodology and measurements
46
these attributes were controlled for between fatty acid solutions and control solutions
by the use of mineral oils, gum acacia, nose clips and red lighting. Fatty acids are
also vulnerable to oxidation, therefore it was vital to add EDTA to the fatty acid
solutions to prevent oxidation. Previous studies have shown that addition of 0.01%
(w/v) EDTA can delay oxidation of polyunsaturated fatty acids for up to 24 hours
(Chale-Rush, et al., 2007a; Stewart, et al., 2010). A stable emulsion was created by
combining 100 ml non-fat milk with 5 g gum acacia and 0.01 g of EDTA, then
homogenising on a Silverson L4RT homogeniser (Longmeadow, Massachusetts,
USA) for 30 seconds/ 100 ml. In a separate beaker, 5 ml of paraffin oil and the set
concentrations of fatty acid were combined; 0.02, 0.06, 1.0, 1.4, 2.0, 2.8, 3.8, 5.0,
6.4, 8.0, 9.8, 12.0, 20.0 mM. The concentrations of fatty acids were based on those
used in previous research and in the Deakin University Laboratory (Chale-Rush, et
al., 2007a; Stewart, et al., 2010). The non-fat milk and gum mixture was then added
to the paraffin and fatty acid mixture. Samples were then re-homogenised at 12 000
rpm for 30 seconds/ 100 ml. All samples were freshly prepared on each day of
testing and C18:1 and C18:2 were served at room temperature, while C12:0 was
heated to 50°C to ensure it was in a liquid state. Control samples were prepared in
the same way, without the fatty acids.
3.3.3 Oral fatty acid solutions – threshold measurement
All sensory testing was conducted in a quiet specialised sensory testing facility
comprising of seven individual booths. Each participant was separated by vertical
dividers and there was no interaction between individuals. Participants were
navigated through the procedure by both written and verbal instructions from the

Chapter 3 – Materials, methodology and measurements
47
researcher. All subjects were asked to refrain from eating, drinking or chewing gum
for at least one hour prior to each testing session.
Oral fatty acid sensitivity was determined via detection thresholds, which are the
lowest concentration of stimulus needed to elicit a sensation, using ascending forced
choice triangle test sensory methodology (Figure 3.1). During this testing procedure,
subjects were presented with three 15 ml samples on a tray; two control samples and
one sample containing a certain concentration of fatty acid. The order in which
samples were presented was randomised throughout the procedure, for example, if
the control samples were labelled A and the fatty acid samples as B, samples could
be presented as AAB, BAA or ABA. Samples containing fatty acids were presented
in ascending order starting from the lowest concentration (0.02 mM) to the highest
(20 mM) (Stewart, et al., 2010). Each sampling cup was labelled with a random 3-
digit blinding code which was used by the researcher to ascertain the different
samples. Subjects were required to rinse their mouth out with water before beginning
the test and between each set of samples. Subjects were then asked to complete the
test and were told to place a small amount of solution in their mouth, swish the
sample around in their mouth making sure it reached the sides and back of their
tongue and then expectorate. Whilst the sample was in their mouth, subjects were
asked to focus on the specific taste of that sample and after expectoration, wait 20-30
seconds before tasting the next sample. Subjects were advised to start with the
sample on the left and move through to the right of the tray until all samples had
been tasted. Once each sample had been tried, subjects were able go back through
the samples, repeating the tasting procedure, until they thought they could identify
Chapter 3 – Materials, methodology and measurements
48
the sample that was different. If subjects could not perceive a difference between
samples, they were asked to pick one out of the three before the next set of samples
could be presented. Once a decision was made by the subject, the tray was then
returned to the researcher who then determined whether or not the subject had
correctly identified the odd sample out of the three. A new set of samples was then
presented to the subject dependent of which sample they had chosen as the different
one. If they had correctly identified the odd sample out, they were given a second
tray which contained the same concentration of fatty acid as the first tray. If they
again chose correctly, a third tray was presented with the same concentration of fatty
acid on it. However, if they incorrectly identified the odd sample, they were given
another tray with the next highest concentration on it. This procedure continued in an
ascending manner until the subject could correctly pick the odd sample out in three
consecutive sample sets. The chance of correctly guessing the sample with the added
fatty acid three consecutive times is 3.7%. Subjects were not aware of the outcome
of each test, for example, if they correctly identified the odd sample, they were not
made aware of this. Each subject was tested in a separate sensory booth and answers
were collected by the researcher (Appendix B). To minimise confounding factors
from non-taste sensory inputs, all testing was performed under red lighting and nose
clips were worn at all times.
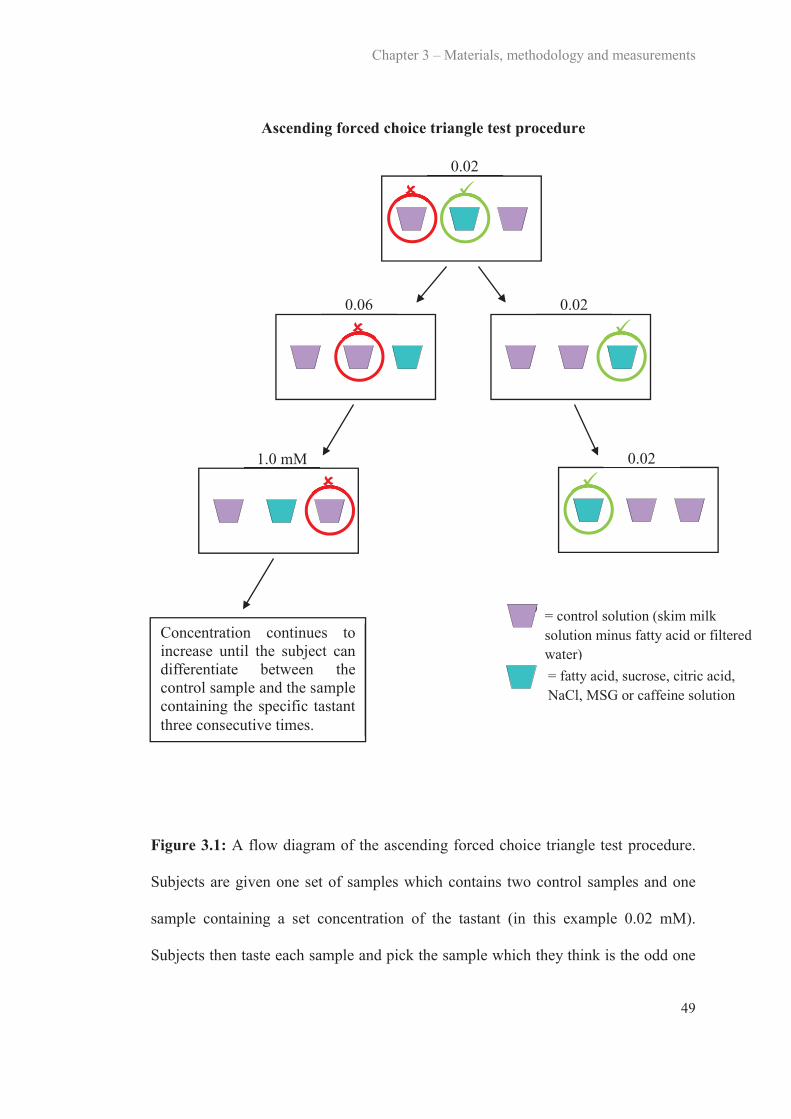
Chapter 3 – Materials, methodology and measurements
49
Ascending forced choice triangle test procedure
Figure 3.1: A flow diagram of the ascending forced choice triangle test procedure.
Subjects are given one set of samples which contains two control samples and one
sample containing a set concentration of the tastant (in this example 0.02 mM).
Subjects then taste each sample and pick the sample which they think is the odd one
Concentration continues to increase until the subject can differentiate between the control sample and the samplecontaining the specific tastantthree consecutive times.
0.02
0.06 0.02
0.021.0 mM
= control solution (skim milk solution minus fatty acid or filtered water)= fatty acid, sucrose, citric acid, NaCl, MSG or caffeine solution
Chapter 3 – Materials, methodology and measurements
50
out. If the subject correctly identifies the odd sample, they are given a second tray at
the same concentration and if they correctly identify the odd sample again, they are
given a third tray at the same concentration. If they again correctly identify the odd
sample, this concentration is deemed their oral detection threshold (in this case 0.02
mM). However, if the subject does not correctly identify the odd sample, they are
given a second tray with the next highest concentration of tastant (0.06 mM) and
again if they identify the incorrect sample the concentration increases. This continues
until the subject can identify the odd sample correctly three consecutive times.
3.3.4 Primary taste qualities – materials and methods
To further investigate taste sensitivity to the five primary taste qualities, sample
solutions for sweet (sucrose), sour (citric acid), salty (sodium chloride (NaCl)), bitter
(caffeine) and umami (monosodium glutamate (MSG)) were prepared for study one
and three. Solution concentrations for sucrose, citric acid, NaCl, caffeine and MSG
were prepared in accordance with the International Organisation for Standardisation
(ISO), ISO 3972:1991- Sensory analysis- Methodology- Method of investigating
sensitivity of taste (Table 3.1). For this, stock solutions of each tastant were made
using 24 g sucrose (CSR White Sugar, Mackay, Queensland, Australia), 1.2 g citric
acid anhydrous (Swiftco Ltd, Mulgrave, Victoria, Australia), 4 g NaCl (SAXA table
salt, Cerebos Foods, Seven Hills, New South Wales, Australia), 0.54 g caffeine
(SAFC Supply Solutions, St Louis, Missouri, USA) and 2 g MSG (Foodstuffs Co.
Ltd, Lay Brothers, Dandenong, Victoria, Australia) and combining it with 1 L of
filtered water.

Chapter 3 – Materials, methodology and measurements
51
Table 3.1: Specification and preparation of test solutions
NaCl, sodium chloride; MSG, monosodium glutamate
3.3.5 Primary taste qualities – threshold measurement
Detection thresholds for sucrose, citric acid, NaCl, MSG and caffeine were
determined using ascending forced choice triangle tests, using the same methodology
as oral fatty acid detection thresholds. Filtered water was used as the control. All
testing was performed under red lighting and nose clips were worn at all times.
3.3.6 6-n-propylthiouracil (PROP) sensitivity – materials and methods
The chemical compound 6-n-propylthiouracyl (PROP) is often used in taste research
as a marker of global oral sensitivity. For example, an individual who experiences
extreme bitterness from PROP will be classified as a ‘supertaster’, while another
individual who experiences no bitterness from PROP will be classified as a
‘nontaster’ (Bartoshuk, Duffy, & Miller, 1994). The relevance to oral fatty acid
sensitivity has not been determined; however some previous studies have suggested
PROP tasters are more sensitive to orally delivered fats (Nasser et al., 2001). A 50
Chemical Concentrations (mM)
Sucrose 35.05 21.03 12.62 7.56 4.55 2.75 1.61 0.99
Citric acid 3.12 2.50 1.98 1.61 1.30 1.04 0.83 0.68
NaCl 34.22 23.96 16.77 11.81 8.21 5.82 4.11 2.74
Caffeine 1.39 1.13 0.88 0.72 0.57 0.46 0.36 0.31
MSG 5.91 4.13 2.89 2.01 1.42 1.01 0.71 0.47

Chapter 3 – Materials, methodology and measurements
52
mmol/L PROP solution was prepared by dissolving 8.5 g of the PROP powder in
boiling water (100ºC) on a stirring hotplate. Filter paper discs were cut to 1.5 cm in
diameter and were dipped in the PROP solution for 30 seconds and then removed.
Excess PROP solution was lightly shaken off and the discs were then laid out on an
oven tray and placed in an oven heated at a temperature of 120ºC until dry
(approximately 30 minutes). Dried samples were then cooled to room temperature,
individually wrapped and stored in a plastic air-tight container at room temperature.
The amount of PROP per filter paper has previously been measured as 0.28 mg/
filter paper (Zhao, Kirkmeyer, & Tepper, 2003).
3.3.7 PROP sensitivity – measurement
Subjects were presented with a piece of filter paper which contained the PROP
solution and asked to place it on the centre of their tongue until it was soaked with
saliva. Following this, subjects removed the paper from their tongue and were asked
to rate the perceived intensity of the bitterness of the PROP using a general Labelled
Magnitude Scale (gLMS). A gLMS is a scale which is used to not only rate the
intensity of taste, but also all other senses, for example, pain, chemesthesis etc. It is
the current gold standard for taste intensity rating and in this case it was used to rate
the intensity of the bitterness of PROP. The gLMS has descriptors placed at varying
positions which range from ‘strongest imaginable’ to ‘barely detectable’.
Considering this scale was 100 units, descriptors were placed at the following points;
0; neutral; 1.4; barely detectable; 6; weak; 17; moderate; 35; strong; 54; very strong
and 100; strongest imaginable (Appendix C). Subjects were briefly trained in the
use of this scale and told that ‘strongest imaginable’ sensation was the pain caused if
Chapter 3 – Materials, methodology and measurements
53
a dentist drilled a hole in your tooth without any anaesthetic, and ‘barely detectable’
was tastes like paper.
3.3.8 Fat ranking task – materials and methods
An individual’s ability to detect fatty acids in food may have no influence on their
ability to detect a concentration of fat in foods; therefore a ranking task was
developed to assess the subject’s ability to identify fats within a common food
(custard) (Stewart, et al., 2010; Stewart, Newman, et al., 2011). For this task,
subjects were provided with custard made with (0%, 2%, 6% & 10%) canola oil.
Custard was made from 20 g custard powder (Foster Clark’s, Cerebos Foods, Seven
Hills, New South Wales, Australia), 12 g sugar (CSR, Yarraville, Victoria, Australia)
and 500 ml skim milk (Devondale, Cobram, Victoria, Australia). The ingredients
were combined and heated in a conventional microwave oven until thickened. The
custard was then removed from the microwave and set aside to cool to room
temperature. The cooled custard was separated into four batches (100 g/ batch) and 2
ml, 6 ml or 10 ml of canola oil (You’ll Love Coles, Coles, Springvale, Victoria,
Australia) was added to three of the batches to create fat contents of 2%, 6% and
10% oil, respectively. No oil was added to one custard batch to create the 0%
sample. All batches of the custard from 0% to 10% were sensory matched to contain
10% ‘oil’, which was added to the 0%, 2%, and 6% batches as paraffin, for example,
the custard made with 10% oil, had 0 ml of paraffin added, for the 6%, 4 ml was
added, for the 2%, 8 ml was added and for the 0%, 10 ml of paraffin was added.
Chapter 3 – Materials, methodology and measurements
54
3.3.9 Fat ranking task – measurements
Subjects were presented with the four 20 g custard samples (0%, 2%, 6% and 10%)
in a randomised order and asked to rank them according to perceived fattiness.
Subjects were instructed to taste each of the custard samples, starting from the left
and moving through to the right. Subjects were advised to focus on the taste of each
sample before swallowing it. Subjects were also told that they could go back and
forth between the samples several times to determine the rank order. Custard
samples were labelled with random 3-digit blinding codes. Subjects were asked to
complete a specialised answer sheet in which they filled out the blinding codes
according to the perceived fattiness of the samples, ranging from 1 = ‘least fatty’ to 4
= ‘most fatty’ (Appendix D). All subjects received a score out of five for this task.
The scores were calculated according to the combinations described in previous
research (Stewart & Keast, 2012) (Table 3.2). The chance of subjects guessing the
correct order of custard is 2%. This task was completed on the same day as the
threshold testing, but was always completed after the threshold testing.
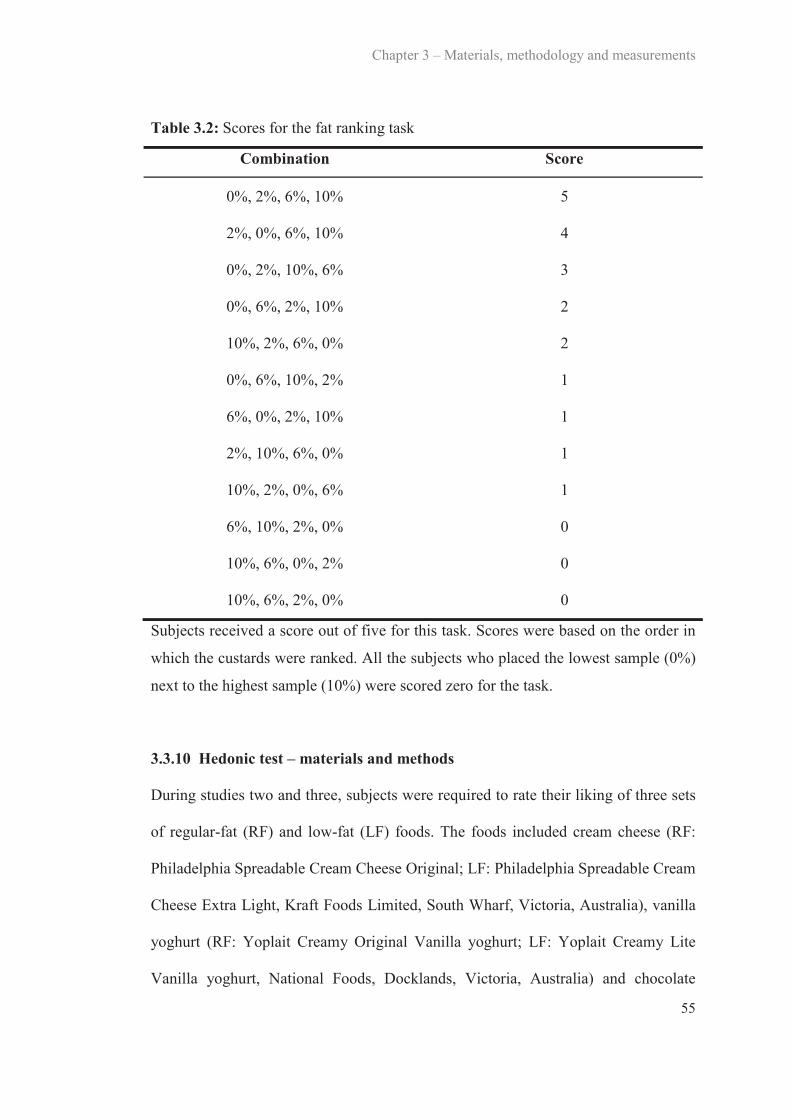
Chapter 3 – Materials, methodology and measurements
55
Table 3.2: Scores for the fat ranking task
Combination Score
0%, 2%, 6%, 10% 5
2%, 0%, 6%, 10% 4
0%, 2%, 10%, 6% 3
0%, 6%, 2%, 10% 2
10%, 2%, 6%, 0% 2
0%, 6%, 10%, 2% 1
6%, 0%, 2%, 10% 1
2%, 10%, 6%, 0% 1
10%, 2%, 0%, 6% 1
6%, 10%, 2%, 0% 0
10%, 6%, 0%, 2% 0
10%, 6%, 2%, 0% 0
Subjects received a score out of five for this task. Scores were based on the order in
which the custards were ranked. All the subjects who placed the lowest sample (0%)
next to the highest sample (10%) were scored zero for the task.
3.3.10 Hedonic test – materials and methods
During studies two and three, subjects were required to rate their liking of three sets
of regular-fat (RF) and low-fat (LF) foods. The foods included cream cheese (RF:
Philadelphia Spreadable Cream Cheese Original; LF: Philadelphia Spreadable Cream
Cheese Extra Light, Kraft Foods Limited, South Wharf, Victoria, Australia), vanilla
yoghurt (RF: Yoplait Creamy Original Vanilla yoghurt; LF: Yoplait Creamy Lite
Vanilla yoghurt, National Foods, Docklands, Victoria, Australia) and chocolate
Chapter 3 – Materials, methodology and measurements
56
mousse (RF: Nestle Chocolate Mousse; LF: Nestle Diet Chocolate Mousse, Nestle,
Fonterra Brands, Auckland, New Zealand). Twenty gram samples of each food, both
regular-fat and low-fat, were presented to subjects during testing. Cream cheese,
yoghurt and mousse were served at 4°C as they were stored under refrigeration.
Tests were conducted without nose clips and after threshold tests and the fat ranking
task.
3.3.11 Hedonic tests – measurements
Subjects were informed that they were to taste and rate their liking of the three sets
of foods, however they were not informed that the samples differed in fat content.
Subjects were given one set of samples at a time which were labelled with random 3-
digit blinding codes. Subjects were asked to rate their liking of each sample using a
9-point hedonic scale (Appendix E), which ranged from 1 = ‘dislike extremely’ to 9
= ‘like extremely’.
3.4 Energy intake and habitual diet
3.4.1 Food records
Procedure
One-day food records in household measures were used to establish habitual diet and
nutrient intake of each subject (Appendix F). For studies one, two and three, which
involved dietary information collection, subjects were thoroughly explained and
shown how to complete a food record. Subjects were asked to complete the one-day
food record in household measures in which they reported all foods and drinks
consumed. Subjects were asked to, where possible, weigh the foods they consumed
Chapter 3 – Materials, methodology and measurements
57
(subjects used their own scales), or use standard metric measuring cups, or common
serving sizes, for example one cup of cereal. They were also asked to report the
brand of food consumed, type of food (e.g., white or wholemeal bread), whether fat
was added (e.g., butter) and the method of cooking (e.g., frying, steaming, baking). If
food was consumed from a recipe, subjects were asked to include the recipe and state
how much of the recipe was consumed (e.g., quarter, whole).
During studies one and two, subjects completed a food record within the week prior
to sensory testing. During study three, subjects completed five food records (once a
week); one at baseline and one during week two, three, four and six.
Analysis
The one-day food records were analysed using FoodWorks 2009 (Xyris software,
Highgate Hill, Queensland, Australia) using the AUSNUT 2007 database for foods,
brands and supplements. From these data, the mean energy intake (kJ) and
macronutrient distribution (percentage energy from fat, protein and carbohydrate,
and grams of fat, protein and carbohydrate) and the type of fat (grams and
percentage of monounsaturated, polyunsaturated or saturated), salt (mg), and alcohol
(g) was determined.
3.4.2 Food Frequency Questionnaire
Procedure
During study three, subjects were required to complete a food frequency
questionnaire, which was adapted from the 1995 National Nutrition Survey
Chapter 3 – Materials, methodology and measurements
58
(Australian Bureau of Statistics, 1995) (Appendix G). This was used to evaluate the
types of foods that were consumed during the month prior to the commencement of
each study (Australian Bureau of Statistics, 1995). In total, ten categories of food
were assessed including dairy products; breads and cereals; meat, fish and eggs;
other offal; sweets, baked goods and snacks; dressings; non-dairy beverages;
vegetables; fruits; and vitamin and mineral supplements and specifically 120 food
items were assessed in section one of the questionnaire. The frequency they could be
consumed ranged from ‘never or less than once a month’ to ‘six or more times per
day’. In section two, questions identifying dietary behaviours were asked including
‘what type of milk do you usually consume?’, ‘how often is the meat you eat
trimmed of fat either before or after cooking?’, ‘how often do you add salt to your
food after it is cooked?’ or ‘how many serves or fruits or vegetables do you usually
eat each day?’ etc.
Analysis
Each question of section one of the food frequency questionnaire inquired about the
frequency of consumption of specific types of foods, for example, ‘white bread, toast
or rolls’. Each frequency category was converted into a daily equivalent value, for
example, ‘never, or less than once a month’ = 0.02, ‘one to three times per month’ =
0.07, ‘once per week’ = 0.1, ‘two to four times per week’ = 0.4, ‘five to six times per
week’ = 0.8, ‘once per day’ = 1.0, ‘two to three times per day’ = 2.5, ‘four to five
times per day’ = 4.5 and ‘six plus times per day’ = 6. The foods were then
categorised according to specific food groups, for example, red meat; poultry;
processed meat; organ meat; fish; seafood; refined grains; whole grains; eggs; high-

Chapter 3 – Materials, methodology and measurements
59
fat dairy; low-fat dairy; soy; liquor spirits; wine; beer; hot drinks; fruit; leafy
vegetables; cruciferous vegetables; other vegetables; tomatoes; peas and legumes;
nuts; potatoes; high-fat take away foods; fried foods; snacks; desserts and biscuits;
chocolate and sweets; sugar sweetened beverages; low-energy beverages;
condiments; and salad dressing. For section two, each answer option was coded
ranging from 1 to 6, for example, for the question what type of milk do you
consume, 1 = ‘whole milk’, 2 = ‘low/ reduced fat milk’, 3 = ‘skim milk’, 4 =
‘evaporated or sweetened condensed milk’, 5 = ‘none of the above’ and 6 = ‘don’t
know’. Each subject received a numerical score for each question.
3.5 Fat pre-load meals
For study two, subjects were required to consume three different breakfast frittatas
(high-fat, low-fat and macronutrient balanced) on three separate occasions. Subjects
were provided with and asked to consume a standardised dinner (Lean Cuisine Beef
Lasagne, Simplot, Mentone, Victoria, Australia) on the evening prior to each testing
session and were asked not to consume any other foods (water was allowed) until
attending the sensory laboratory the next morning for breakfast. A breakfast frittata
was chosen as the breakfast food as it could be easily manipulated to contain
different percentages of macronutrients and all frittatas were made in the Deakin
University Sensory Laboratory by the researcher and cooked freshly each day. On
the morning of testing, subjects were given one of three different frittatas which
varied in macronutrient content (high-fat: 60% fat, 20% protein, 20% carbohydrate;
low-fat: 20% fat, 40% protein, 40% carbohydrate; macronutrient balanced: 33% fat,
33% protein and 33% carbohydrate) (Appendix H). The breakfasts were matched
Chapter 3 – Materials, methodology and measurements
60
for energy and the kilojoule content for each frittata was 1500 kJ. To compensate for
variation in the volume of each breakfast, breakfasts were equated with a measured
amount of drinking water. Subjects were advised that they were to consume the
whole breakfast. Once the frittata had been completely finished by the subject, they
were asked to come back to the laboratory twice to measure their oral fatty acid
sensitivity; once one hour after completion of the breakfast and the other one hour
after completion of the first detection threshold test. Between each testing session
subjects were asked to refrain from eating, drinking or chewing gum.
3.6 Dietary counselling
For study three, subjects participated in a six week randomised dietary intervention
study. Subjects were randomised to one of two diets; a low-fat diet (25% total energy
from fat) or a portion control diet (33% total energy from fat, reduction in energy
intake by 25%) for a six-week period.
3.6.1 Low-fat diet
This 25% fat diet was based on the OZDASH diet and was designed to reduce the
consumption of full fat dairy products, fatty red meats, baked products, high-fat
spreads and overall kilojoule intake (Margerison et al., 2003). Dietary counselling
was overseen by the coordinating dietitian (S.T.) and provided by trained research
staff. Subjects were given a face-to-face counselling session at baseline, which took
between 30-45 minutes and a booklet which contained all of the information needed
to follow the diet, specifically how many portions of particular foods they should
aim to eat and what constituted a portion (Appendix I). One portion of dairy = milk
Chapter 3 – Materials, methodology and measurements
61
(200 ml), yoghurt (200 g) or cheese (40 g); one portion of fruit = 1 medium piece of
fruit (100 g) or fruit juice (200 ml); one portion of vegetables = ½ cup cooked
vegetables (50 g), potato (90 g), 1 cup leafy green vegetables; one portion of meat
and fish = cooked meat or chicken (100 g), fish (80-100 g), one portion of fats and
oils = 1 teaspoon monounsaturated or polyunsaturated oils, 1 teaspoon of regular-fat
margarine, 2 teaspoons reduced-fat margarine, 2 teaspoons avocado; and one portion
of breads and cereals = 2 slices of bread, 1 cup cooked rice or pasta, 1 cup porridge
or breakfast cereal, ½ cup muesli. Subjects were instructed to consume at least five
portions of vegetables and two portions of fruit per day, as well as three portions of
low-fat dairy per day, one to two portions of meat and fish per day, a maximum of
three portions of fats per day and a maximum of five portions of breads and cereals
per day. The booklet also contained a list of snack food ideas, tips on how to reduce
kilojoule intake from day to day, as well as recommendations when dining outside of
the home, a section on how to read food labels, and an example meal plan. To assist
with compliance, subjects were given a low-fat margarine (Flora Ultra-Light,
Unilever, Epping, New South Wales, Australia), four packets of low-fat crackers
(Sakata Rice Snacks Australia, Laverton North, Victoria, Australia), and one packet
of popcorn kernels (Popping Corn, Riviana Foods, Scoresby, Victoria, Australia) as
alternatives to high-fat spreads and snack foods. Subjects were also contacted by
phone on a weekly basis throughout the six-week period to answer any questions that
may have arisen and to keep subjects motivated and accountable.
Chapter 3 – Materials, methodology and measurements
62
3.6.2 Portion control diet
The portion control diet was designed to decrease subjects’ energy intake by 25%.
This diet was based on the Australian government campaign, ‘Swap it, don’t stop it,’
(2012). Subjects were instructed to reduce the consumption of their usual diet.
Subjects from this group also had a one-on-one session with trained research staff,
which took between 20-40 minutes, for dietary counselling to reduce their energy
intake by 25%, for example, reducing the amount of food on their plate at dinner
time, but keeping the same proportion of each food component. Subjects were also
given a list of instructions to help reduce meals sizes and this provided the following
four key concepts (Appendix J); 1) use a smaller plate as this makes a little food
seem a lot, 2) eat mindfully by taking time to chew your food properly and eat
slowly (Smit, Kemsley, Tapp, & Henry, 2011), 3) avoid distractions such as
watching television or reading as this can distract you from noticing when you are
full, 4) follow the 80 percent rule which was to stop eating before you are completely
full, which ties in with concept two ("Sizing up food portions," 2010). Subjects were
also given some ideas on how to reduce meal size when eating out of the home, for
example, order an appetiser or two as opposed to an appetiser and main meal. To aid
in compliance, subjects were given a small, appetiser sized plate (23 cm) for all
meals, as studies have found by using a smaller plate, subjects are more likely to eat
less (Laddu et al., 2011; Pedersen, Kang, & Kline, 2007; "Sizing up food portions,"
2010). Weekly calls were made to those following the portion control diet to answer
any underlying questions and to keep subjects motivated.
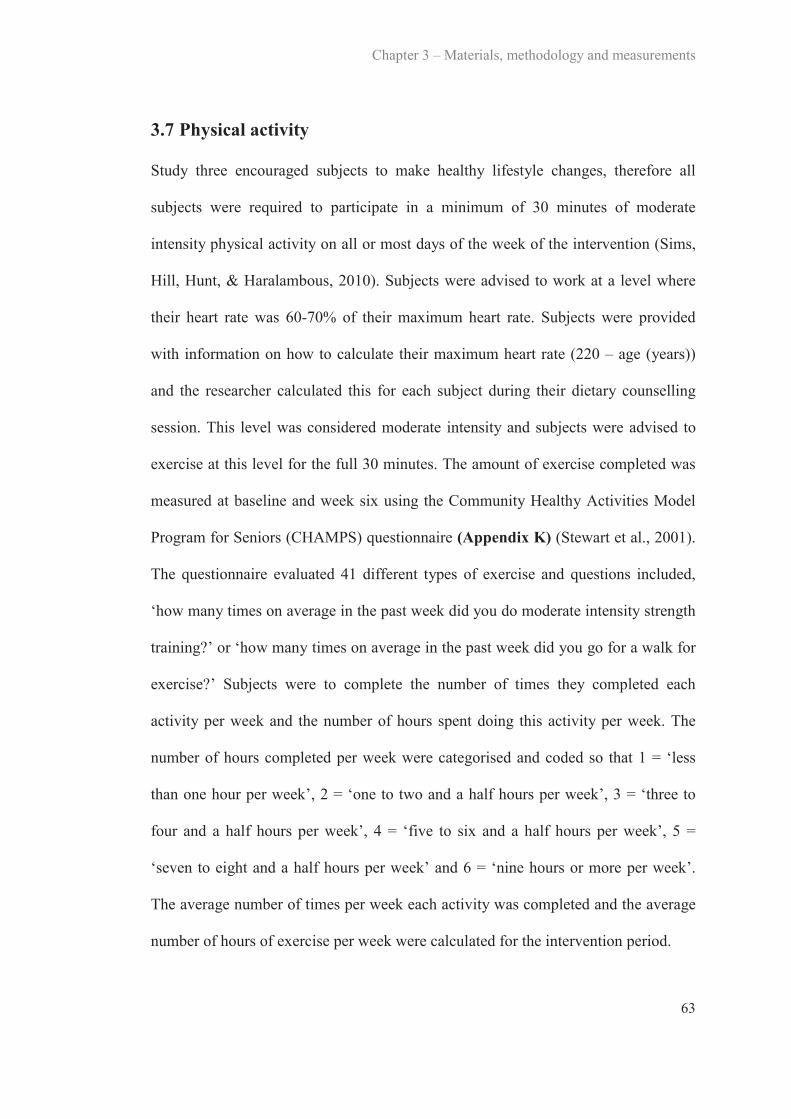
Chapter 3 – Materials, methodology and measurements
63
3.7 Physical activity
Study three encouraged subjects to make healthy lifestyle changes, therefore all
subjects were required to participate in a minimum of 30 minutes of moderate
intensity physical activity on all or most days of the week of the intervention (Sims,
Hill, Hunt, & Haralambous, 2010). Subjects were advised to work at a level where
their heart rate was 60-70% of their maximum heart rate. Subjects were provided
with information on how to calculate their maximum heart rate (220 – age (years))
and the researcher calculated this for each subject during their dietary counselling
session. This level was considered moderate intensity and subjects were advised to
exercise at this level for the full 30 minutes. The amount of exercise completed was
measured at baseline and week six using the Community Healthy Activities Model
Program for Seniors (CHAMPS) questionnaire (Appendix K) (Stewart et al., 2001).
The questionnaire evaluated 41 different types of exercise and questions included,
‘how many times on average in the past week did you do moderate intensity strength
training?’ or ‘how many times on average in the past week did you go for a walk for
exercise?’ Subjects were to complete the number of times they completed each
activity per week and the number of hours spent doing this activity per week. The
number of hours completed per week were categorised and coded so that 1 = ‘less
than one hour per week’, 2 = ‘one to two and a half hours per week’, 3 = ‘three to
four and a half hours per week’, 4 = ‘five to six and a half hours per week’, 5 =
‘seven to eight and a half hours per week’ and 6 = ‘nine hours or more per week’.
The average number of times per week each activity was completed and the average
number of hours of exercise per week were calculated for the intervention period.

Chapter 3 – Materials, methodology and measurements
64
3.8 Tongue papillae
3.8.1 Tongue photography
Subject’s tongues were photographed in study three to determine the number of
tongue papillae, specifically fungiform papillae. Before the photograph was taken,
subjects were asked to rinse their mouths thoroughly with deionised water. They
were then asked to sit at the photography bench with their elbows on the bench and
their hands held together in a ‘V’ formation supporting their chin and keeping their
head still (Figure 3.2). Subjects were then asked to protrude their tongue and use
their lips to keep it steady in order to produce a clear photograph for accurate
counting of fungiform papillae. Once subjects were set up in this position, the
camera (Nikon D90 Digital Camera, Nikon, AF-S Micro Nikkor 105 mm lense,
Nikon Australia Pty. Ltd, Rhodes, New South Wales, Australia) was set up on the
tripod (SLIK Corporation, SBH100DQ tripod, Hidaka City, Saitama, Japan) and
precisely lined up with the participants tongue. The tongue was then dried using a 50
mm x 20 mm strip of filter paper. Using a cotton bud (Swisspers, McPhersons
Consumer Products, Kingsgrove, New South Wales, Australia), diluted blue food
dye (Queen Fine Foods, Alderley, Queensland, Australia) (1 x drop dye : 20 x drop
deionised water) was then applied to the left of the midline of the tongue on the tip,
as this area shows a high correlation to the total number of papillae on the tongue
(Shahbake, Hutchinson, Laing, & Jinks, 2005). The tongue was then dried with a
strip of filter paper again to remove excess dye. A square piece of filter paper (10
mm x 10 mm) with a 6 mm hole in the centre and labelled with the subject’s
identification code, was then place on the tip of the tongue over the area that had
been dyed with the blue food dye. Three macro photographs were then taken of the

Chapter 3 – Materials, methodology and measurements
65
subject’s tongue (Figure 3.3). Subjects were required to have their tongue protruded
throughout the whole procedure, from dying the tongue until the final three
photographs had been taken.
Figure 3.2: The position of the subject and the distance between the tongue and
camera required for the tongue papillae photograph
3.8.2 Counting of tongue papillae
The photos were loaded onto the computer and were analysed using the Adobe
Photoshop version CS5.1 (Adobe Systems Inc., San Jose, CA, USA). Each subject’s
photo was coded with the subject’s identification code in order to avoid any bias
when collating results. Fungiform papillae are generally mushroom shaped, elevated
structures, however some can be flat with little elevation or double papillae
(Shahbake, et al., 2005). The fungiform papillae were identified as the structures that
were stained in a very light shade of blue. The dark shades were the filiform papillae
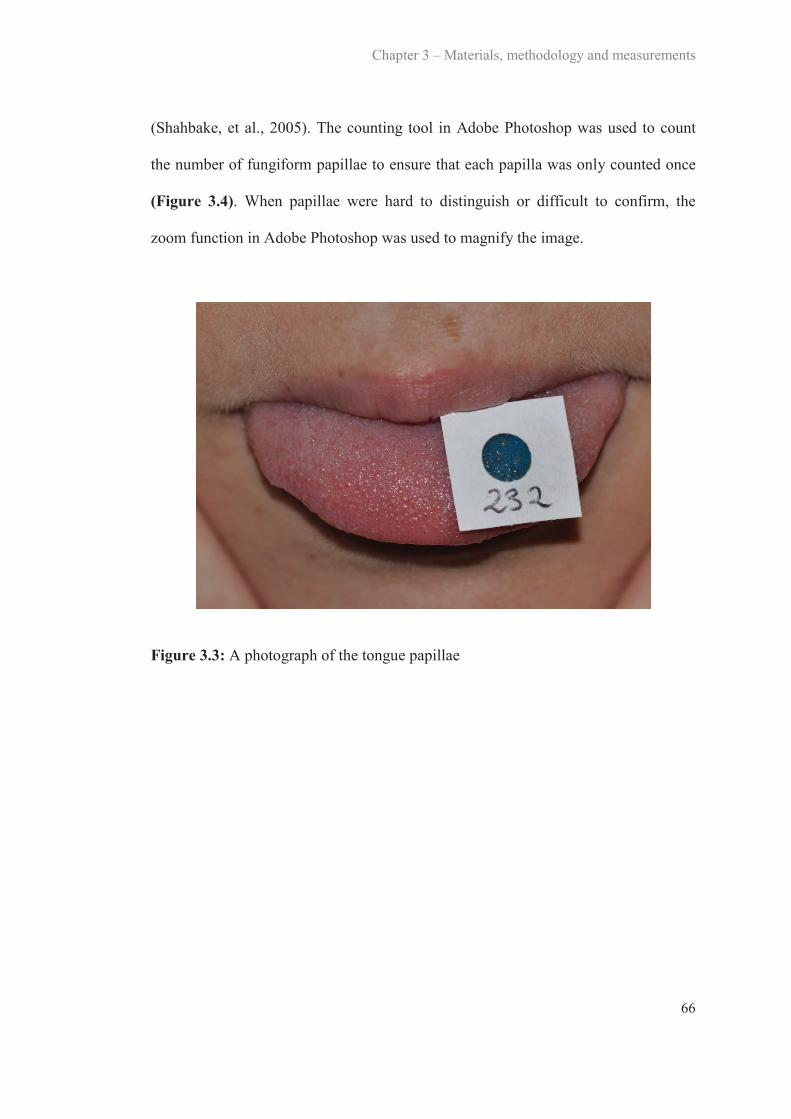
Chapter 3 – Materials, methodology and measurements
66
(Shahbake, et al., 2005). The counting tool in Adobe Photoshop was used to count
the number of fungiform papillae to ensure that each papilla was only counted once
(Figure 3.4). When papillae were hard to distinguish or difficult to confirm, the
zoom function in Adobe Photoshop was used to magnify the image.
Figure 3.3: A photograph of the tongue papillae
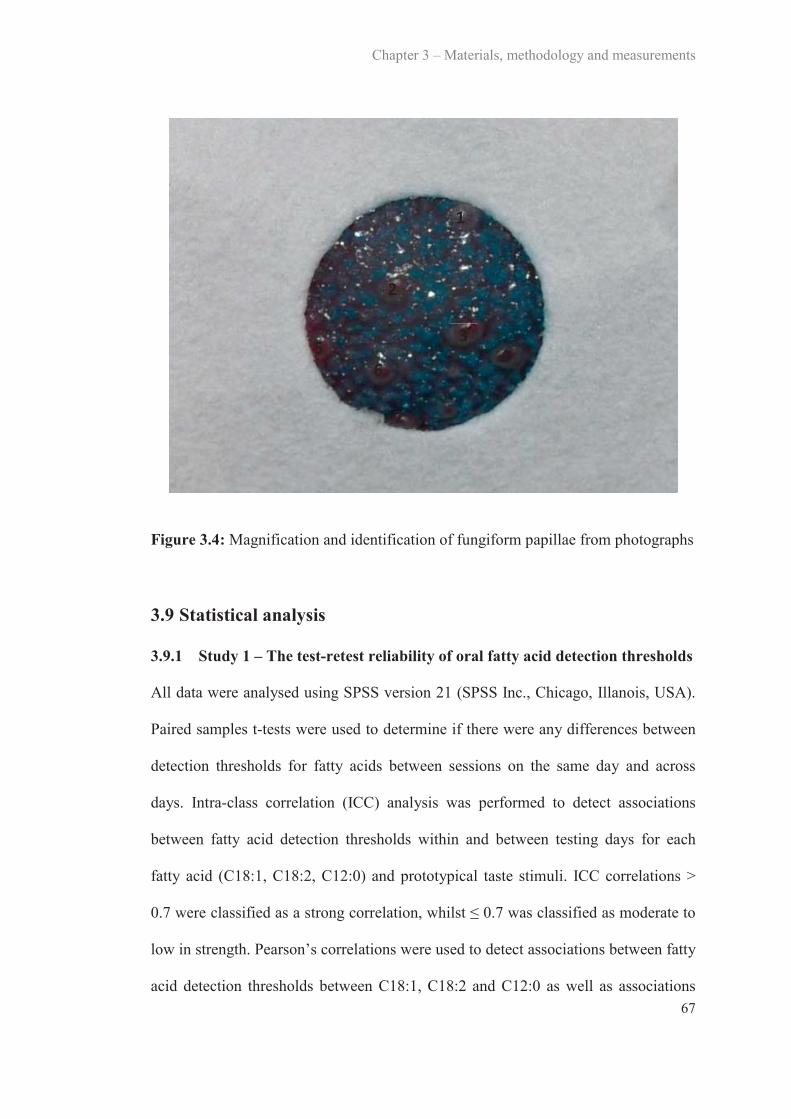
Chapter 3 – Materials, methodology and measurements
67
Figure 3.4: Magnification and identification of fungiform papillae from photographs
3.9 Statistical analysis
3.9.1 Study 1 – The test-retest reliability of oral fatty acid detection thresholds
All data were analysed using SPSS version 21 (SPSS Inc., Chicago, Illanois, USA).
Paired samples t-tests were used to determine if there were any differences between
detection thresholds for fatty acids between sessions on the same day and across
days. Intra-class correlation (ICC) analysis was performed to detect associations
between fatty acid detection thresholds within and between testing days for each
fatty acid (C18:1, C18:2, C12:0) and prototypical taste stimuli. ICC correlations >
0.7 were classified as a strong correlation, whilst was classified as moderate to
low in strength. Pearson’s correlations were used to detect associations between fatty
acid detection thresholds between C18:1, C18:2 and C12:0 as well as associations
1
4 3
2
6 5
7
Chapter 3 – Materials, methodology and measurements
68
between detection thresholds for fatty acids and total fat, saturated fat,
polyunsaturated fat and monounsaturated fat intakes, carbohydrate, protein intake
and energy intake. A correlation > 0.7 was classified as strong, whilst was
classified as moderate to low (Pallant, 2011). Fatty acid thresholds were calculated
as the mean of all six values when assessing correlations with macronutrient and
energy intakes. Significance was accepted at P < 0.05.
3.9.2 Study 2 – The influence of a high-fat meal immediately prior to oral fatty
acid detection threshold testing
Differences in oral fatty acid sensitivity after each breakfast were compared using
one-way repeated measures analysis of variance (ANOVA). Within day differences
in oral fatty acid sensitivity were determined using paired samples t-tests. Reliability
analysis was conducted using ICC to detect associations between C18:1 detection
thresholds within and between testing days. ICC > 0.7 were classified as strong
correlations, whilst was classified as moderate to low in strength (Pallant,
2011). One-way repeated measures ANOVA was also used to detect differences
between preferences for regular- and low-fat foods after each breakfast and
Friedman tests were used to detect differences between fat ranking scores after each
breakfast. Independent samples t-tests were used to detect differences in oral fatty
acid sensitivity, gender and healthy weight category as well as differences in energy
and macronutrient intake between lean and obese subjects. Pearson’s correlations
were used to detect associations between C18:1 detection thresholds and total
energy, fat, carbohydrate and protein intake, as well as percentage energy from fat,
Chapter 3 – Materials, methodology and measurements
69
carbohydrates and proteins. A correlation > 0.7 was classified as strong, whilst
was classified as moderate to weak. Significance was accepted as P < 0.05.
3.9.3 Study 3 – The effect of dietary fat consumption and weight loss on oral
fatty acid sensitivity
Repeated-measures ANOVA was used to analyse changes in C18:1, sucrose and
NaCl oral detection thresholds, hedonic ratings for regular-fat and low-fat foods,
anthropometric measurements, tongue papillae numbers and dietary intake from
baseline to week six with time-point as within-subject and dietary intervention (low-
fat or portion control) as between-subject factors. To detect differences in fat ranking
scores from baseline to week six, Wilcoxon Signed-Rank test was used and between
group analysis was conducted using Mann-Whitney U test. Significance was
accepted at P < 0.05. Paired t-tests with Bonferroni correction were used to establish
differences in answers to dietary questionnaires from baseline to week six.
Significance was accepted as P < 0.05.
C H A P T E R F O U R
Study 1
The test-retest reliability of oral fatty acid detectionthresholds
4An abridged version has been published in Chemosensory Perception 2013; 6, 70-77
4.1 Introduction
It is widely acknowledged that humans perceive five taste qualities which include
sweet, sour, salty, bitter and umami. The taste system most likely evolved so that
animals chose foods that were appropriate for their body’s needs and it is for this
reason that the sense of taste can also be referred to as an oral nutrient detection
system; as the oral cavity contains specific receptors for certain nutrients, for
example, sugars (carbohydrate, sweet) and amino acids (protein, umami)
(Bachmanov & Beauchamp, 2007). From an evolutionary point of view, this nutrient
detection system was used to detect the nutritional or toxic quality of foods whereby
sweet, salty and umami are associated with positive appetite responses to increase
the chance of consumption of essential nutrients, whereas, excessive bitter and sour
elicit an aversive response to reduce the consumption of these foods (Bachmanov &
Beauchamp, 2007; Breslin, 2013). However, humans seem to be able to tolerate low
levels of bitterness and often learn to enjoy the taste of mildly bitter foods when
paired with more liked attributes or positive metabolic and pharmacological
outcomes such as in chocolate, coffee or wine (Breslin, 2013). It seems logical that
as well as sensing carbohydrates and proteins we may also have a mechanism for
sensing fat as it is an essential macronutrient for humans. However, it is unknown

Chapter 4 – Study 1
71
whether this detection results in an appetitive or aversive response due to the acidic
nature of fatty acids. A dose response effect for taste perception is common among
tastants, for example low levels of a salt provide little or no perception for humans,
therefore neither an appetitive nor aversive response, moderate levels of salt provide
an appetitive response and high levels produce an aversive response (Breslin, 2013).
Emerging evidence now indicates the existence of an oral fat specific detection
system which is activated by the breakdown products of fat, fatty acids, to convey
the presence of fat in foods.
A taste quality is perceived when the concentration in the oral cavity reaches a
particular level that activates a specific receptor, which in turn elicits a perception
(Keast & Roper, 2007). For example, an aqueous solution may contain a compound
such as sodium chloride (NaCl), but at a concentration that cannot be detected. As
the concentration of the NaCl increases, the aqueous solution can be discriminated
from water and a detection threshold is reached (Keast & Roper, 2007). As the
concentration increases further, the recognition threshold will be reached whereby
the quality (salty) can be identified (Keast & Roper, 2007). What constitutes a taste
quality has been debated for many years (Delwiche, 1996). Arguably it must have
four criteria; 1) a defined class of effective stimuli, 2) a unique transduction
mechanism as part of taste cells, 3) peripheral taste mechanisms conveyed by
gustatory nerves and 4) be distinguishable from other taste stimuli (Mattes, 2011a).
For example, sweet taste in humans, 1) sucrose and other sugars are the stimuli in
which humans can detect in the oral cavity, 2) sugars are transduced via G-protein
coupled receptors (T1R2-T1R3 dimer) on tongue papillae, 3) the signal from the

Chapter 4 – Study 1
72
receptor is carried by both the chorda tympani nerve and glossopharyngeal nerve to
the brain and 4) sweet taste can be perceptually distinguished from the other four
taste qualities (Gilbertson, et al., 2000). In addition, it is thought that fats can be
perceived across multiple modalities including olfaction, vision, texture, audition and
chemesthesis (Tucker & Mattes, 2012). Emerging evidence also indicates the
components of fats, fatty acids, can be orally identified at detection threshold levels
in humans when non-taste cues are minimised (Chale-Rush, et al., 2007a; Mattes,
2009d; Stewart, et al., 2010; Stewart, Newman, et al., 2011). However, although the
results from studies investigating oral fatty acid detection thresholds seem to imitate
results found for the primary tastes, challenges arise due to the unique nature of the
fatty acid stimuli, for example, there is no established lexicon for fatty acid detection
making testing difficult for participants who have not experienced the sensation
before (Running, et al., 2013).
Recently, studies have identified fatty acid receptors cluster of differentiation 36
(CD36) and G-protein coupled receptor (GPCR120, GPCR40) on taste cells in
humans for the identification of fatty acids in the oral cavity (Ichimura, et al., 2012;
Simons, et al., 2010). Results from a study involving mice found that when the
CD36 receptor on taste cells was inactivated, a reduction in preference for long chain
fatty acid enriched solutions and solid foods was seen (Laugerette, et al., 2005).
Similarly, GPCR120 and GPCR40 knock-out mice showed an attenuated preference
for oleic acid (C18:1) and linoleic acid (C18:2), suggesting that these two GPCRs
contribute to preference for fatty acids through the gustatory system (Cartoni, et al.,
2010). It is important to note that these receptors are influential over the transduction
Chapter 4 – Study 1
73
mechanisms involved in the detection of fatty acids within the oral cavity and the
differences seen in preference may be due to differences in transduction mechanisms
and receptor expression.
Recent evidence in humans now suggests that during mastication of a high-fat food,
a sufficient concentration of non-esterified fatty acids (NEFA) are released in the
oral cavity to initiate gustatory signalling (Kulkarni & Mattes, 2013). Previous
research has also reported that humans can detect a taste quality at a faster rate than
they can identify the intensity of the quality (Halpern 1983). However, the aversive
quality of fatty acids is only apparent at concentrations when an actual quality is
perceived and the quality is most likely associated with aroma and oro-nasal
irritation, rather than taste. We speculate that an appetitive response associated with
fatty acids come via subconscious feedback mechanisms within both the oral cavity
and the gastrointestinal (GI) tract. This may be a coordinated response whereby the
oral cavity sends signals to the brain and which are associated with changes in the GI
tract and thus a satiety cascade (Newman, et al., 2013). Furthermore, in previous
research and this study, oral thresholds for C18:1, C18:2 and lauric acid (C12:0) did
not correlate with thresholds for the other prototypical tastants, which suggests that
oral fatty acid transduction mechanisms are independent from oral mechanisms for
other tastants (Mattes, 2009d; Stewart, et al., 2010). These findings suggest the
existence of an independent oral transduction system for fatty acids.
Numerous animal and human studies have found that individuals can have varying
taste sensitivities to fatty acids and that their taste sensitivity to fatty acids may be
Chapter 4 – Study 1
74
associated with the dietary consumption of fat. Gilbertson (1998) investigated this
relationship in rats, whereby it was found that fat insensitive (Osborne-Mendel (O-
M)) rats showed a preference for high-fat chow and rapidly gained weight when
exposed to a high-fat diet, whereas fat sensitive (S5B/PI) rats preferred high-
carbohydrate chow and resisted weight gain when exposed to a high-fat diet
(Gilbertson, et al., 1998). In addition, a recent study in humans has reported an
association between C18:1 detection thresholds and an individual’s dietary fat intake
and body mass index (BMI), whereby those who were insensitive to C18:1
consumed more dietary fat and had higher BMIs than those who were sensitive
(Stewart, et al., 2010). A separate study confirmed the previous findings and also
found that those who were insensitive to C18:1 consumed more high-fat dairy
products as well as high-fat spreads and fatty red meats, which are some of the major
contributors to fat intake in the Western diet (Stewart, Newman, et al., 2011). Links
between the GI tract, BMI and oral fatty acid sensitivity have also been made,
whereby obese individuals were less orally sensitive to fatty acids and consumed
more energy at a buffet meal post intra-duodenal C18:1 infusion than lean
individuals (Stewart, Seimon, et al., 2011). However, not all studies have found links
between oral fatty acid sensitivity and BMI (Kamphuis, Saris, et al., 2003; Mattes,
2009d, 2011b; Stewart & Keast, 2012), with some authors hypothesising that this
may be due to subjects being classified as hyper- and hyposensitive (Running, et al.,
2013). Research has also demonstrated the elasticity of oral fatty acid thresholds
whereby an individual’s oral sensitivity to C18:1 could be either increased or
decreased depending on the amount of dietary fat consumed (Stewart & Keast,
2012). Conversely, other studies investigating possible links between oral fatty acid

Chapter 4 – Study 1
75
sensitivity, fat intake and chronic disease have failed to find any links (Kamphuis,
Saris, et al., 2003; Mattes, 2009d, 2011b; Stewart & Keast, 2012). Due to the
potential plasticity/ elasticity of oral fatty acid sensitivity when the environment is
altered, an essential and to date missing step in furthering evidence for oral fatty acid
detection is to establish reliability and reproducibility of the oral fatty acid threshold
method.
Research dating back to the 1950s has investigated the reproducibility of the primary
tastes over numerous sessions with much debate over the stability of measurement.
Cicerale et al. (2009) determined that the reliability of sucrose intensity over six
sessions and found that each session was highly correlated (r = 0.98) (Cicerale, et al.,
2009). The test-retest reliability of sucrose, citric acid, NaCl and caffeine were
examined using tasting tablets and the three-drop method with high reproducibility
being found for both methods (taste tablet: r = 0.69; three-drop method: r = 0.71)
(Ahne, et al., 2000). Similar findings were also reported by Mueller et al. (2011)
with high between session correlations found (r = 0.77). In contrast, Pangborn et al.
(1959) examined the reliability of sucrose, NaCl, citric acid and caffeine using the
‘choice method’ and reported that in one session, young subjects (below the age of
27 years) could be the most sensitive in the cohort to a tastant, but in the next session
they could be the least sensitive to the same tastant (Pangborn, 1959). Stevens et al.
(1995) investigated age and reliability of taste thresholds for sucrose using a forced
choice version of up-down tracking and reproducibility was very low (Stevens, et al.,
1995). These studies all used different methodology which may be the cause of such
variation in findings. Therefore, this study investigated the test-retest reliability of

Chapter 4 – Study 1
76
oral fatty acid detection thresholds, as well as those for sucrose, citric acid, NaCl,
caffeine and monosodium glutamate (MSG) using triangle tests with ascending
forced choice triangle test methodology.
4.2 Aims and hypotheses
4.2.1 Aim
To investigate the reliability and reproducibility of oral fatty acid detection
thresholds for saturated, monounsaturated and polyunsaturated fatty acids.
4.2.2 Hypotheses
There will be large inter-individual variability in oral fatty acid detection thresholds
and there will be minimal intra-individual variation in oral fatty acid thresholds,
therefore high test-retest reliability.
4.3 Subjects, materials and methods
This study was approved by the Deakin University Human Research Ethics
Committee and was initiated on September 1, 2010. All testing involving human
subjects was in compliance with the principles laid down in the Declaration of
Helsinki and all subjects provided informed, written consent prior to participation.
Chapter 4 – Study 1
77
4.3.1 Subjects
Subjects were recruited from Deakin University and surrounding suburbs. All
subjects were over 18 years of age, were non-smokers and were in good health at the
time of investigation. A total of 20 subjects gave written consent to complete the
study and complete data were obtained from 17 subjects.
4.3.2 Study outline
Subjects were required to attend 30 laboratory sessions; three sessions per day, for
ten days (not consecutive) to determine oral detection thresholds for C18:1, C18:2
and C12:0. Each stimulus was evaluated on six separate occasions, over two days.
The three sessions on each day were at least two hours apart and each subject came
at the same time on each testing day. Taste thresholds for the five prototypical tastes
were performed using sucrose (sweet), citric acid (sour), NaCl (salty), caffeine
(bitter) and MSG (umami). At the start of each testing day, subjects recorded their
food consumption from that morning. At each session, subjects had their oral
sensitivity assessed using ascending forced choice triangle tests, which has been used
previously for this purpose (Stewart, et al., 2010). Each day, subjects were tested for
a different taste quality. Height and weight of subjects were measured on day ten.
4.3.3 Oral fatty acid solutions
Food grade fatty acids (C18:1, C18:2 and C12:0) were added to long-life non-fat
milk (Devondale, Cobram, Victoria, Australia) at varying concentrations (0.02, 0.06,
1, 1.4, 2, 2.8, 3.8, 5, 6.4, 8, 9.8 and 12 mM). As per the methodology outlined in
Chapter 3, all samples were mixed with gum acacia, liquid paraffin and
Chapter 4 – Study 1
78
ethylenediaminetetraacetic acid (EDTA). A stable emulsion was created by mixing
the milk and gum together first and then this mixture was added to the paraffin and
fatty acid mixture. Samples were homogenised at 12 000 rpm for 30 seconds/ 100
ml. All samples were freshly prepared each day of testing and C18:1 and C18:2 were
served at room temperature, while C12:0 was heated to 50°C to ensure it was in a
liquid state. Control samples were prepared in the same way, without the fatty acids.
4.3.4 Oral fatty acid detection thresholds
Oral fatty acid sensitivity was determined via detection thresholds, using ascending
forced choice triangle tests (Chapter 3, Figure 3.1), whereby subjects were
presented with three samples, two control and one containing a certain concentration
of fatty acid in an ascending order from the lowest concentration (0.02 mM) to the
highest (12 mM) (Stewart, et al., 2010). Detection thresholds for each fatty acid were
defined as the lowest concentration at which the subject correctly picked the odd
sample out in three consecutive sample sets. All testing was performed under red
lighting and nose clips were worn at all times.
4.3.5 Taste thresholds: sweet, sour, salty, bitter and umami
Solution concentrations for sucrose, citric acid, NaCl, caffeine and MSG were
prepared in accordance with the International Organisation for Standardisation
(ISO), ISO 3972:1991- Sensory analysis- Methodology- Method of investigating
sensitivity of taste as detailed in Chapter 3 (Table 3.1). Distilled water was used as
the control sample in threshold determinations. All procedures were the same as
those for oral fatty acid detection thresholds.
Chapter 4 – Study 1
79
4.3.6 Food consumption
For each testing day, subjects recorded everything they consumed from the time they
awoke in the morning (Appendix F). Subjects were asked to estimate the amount of
foods they consumed by using standard metric measuring cups, approximate weights
or common serving sizes (outlined in Chapter 3). Food consumption was analysed
using FoodWorks 2007 (Xyris software, Highgate Hill, Queensland, Australia) to
ensure that subjects were consuming a typical diet. From this, the mean energy
intake (kJ), macronutrient distribution (% energy from fat, protein and carbohydrate,
and grams of fat, protein and carbohydrate) and the type of fat (grams and % of
monounsaturated, polyunsaturated or saturated) were calculated.
4.3.7 Anthropometry
Weight and height were collected for all subjects without shoes and in light clothing
using scales (Tanita Body Scan Composition Monitor Scales, Cloverdale, Western
Australia, Australia) and a stadiometer (Seca, MedShop Australia, Fairfield,
Victoria, Australia), respectively. BMI was calculated from these measurements
(BMI = weight (kg)/ height (m2) (Harris et al., 2008).
4.4 Statistical analysis
All data were analysed using SPSS version 21 (SPSS Inc., Chicago, Illanois, USA).
Paired samples t-tests were used to determine if there were any differences between
detection thresholds for fatty acids between sessions on the same day and across
days. The data were analysed according to Figure 4.1. Intra-class correlation (ICC)
analysis was performed to detect associations between fatty acid detection thresholds
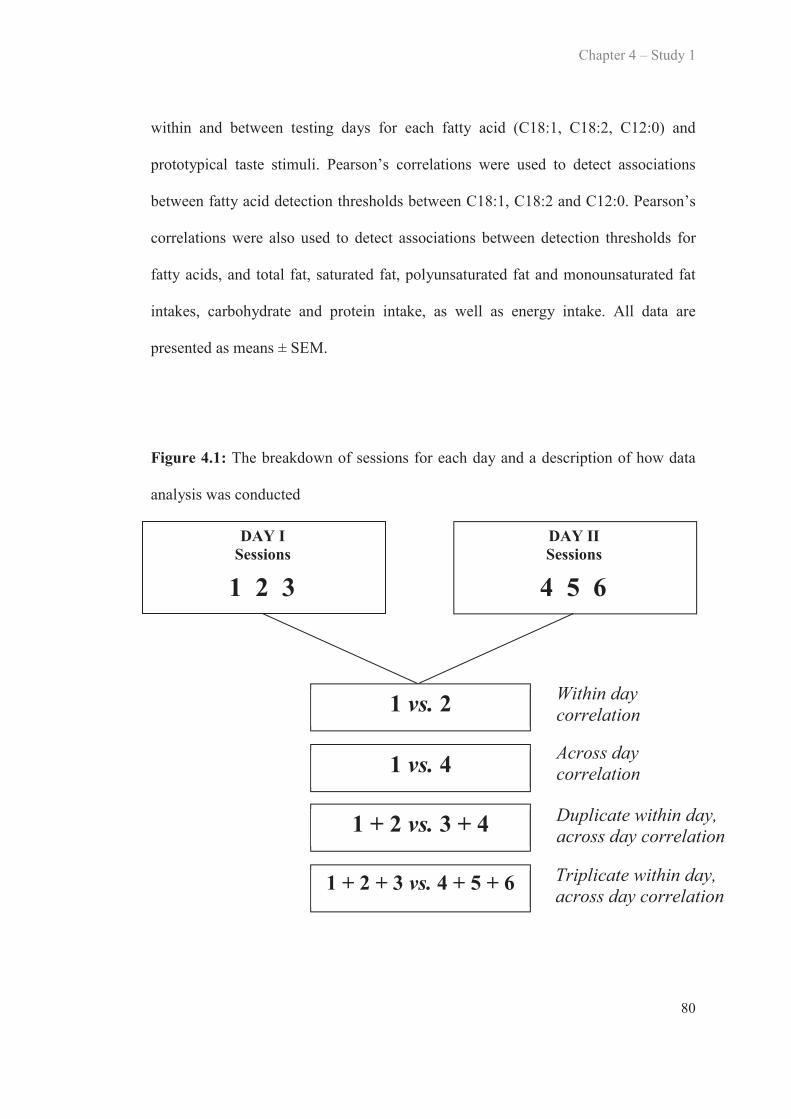
Chapter 4 – Study 1
80
within and between testing days for each fatty acid (C18:1, C18:2, C12:0) and
prototypical taste stimuli. Pearson’s correlations were used to detect associations
between fatty acid detection thresholds between C18:1, C18:2 and C12:0. Pearson’s
correlations were also used to detect associations between detection thresholds for
fatty acids, and total fat, saturated fat, polyunsaturated fat and monounsaturated fat
intakes, carbohydrate and protein intake, as well as energy intake. All data are
presented as means ± SEM.
Figure 4.1: The breakdown of sessions for each day and a description of how data
analysis was conducted
1 vs. 2
1 vs. 4
1 + 2 vs. 3 + 4
1 + 2 + 3 vs. 4 + 5 + 6
Within day correlation
Across day correlation
Duplicate within day,across day correlation
Triplicate within day,across day correlation
DAY I Sessions
1 2 3
DAY IISessions
4 5 6
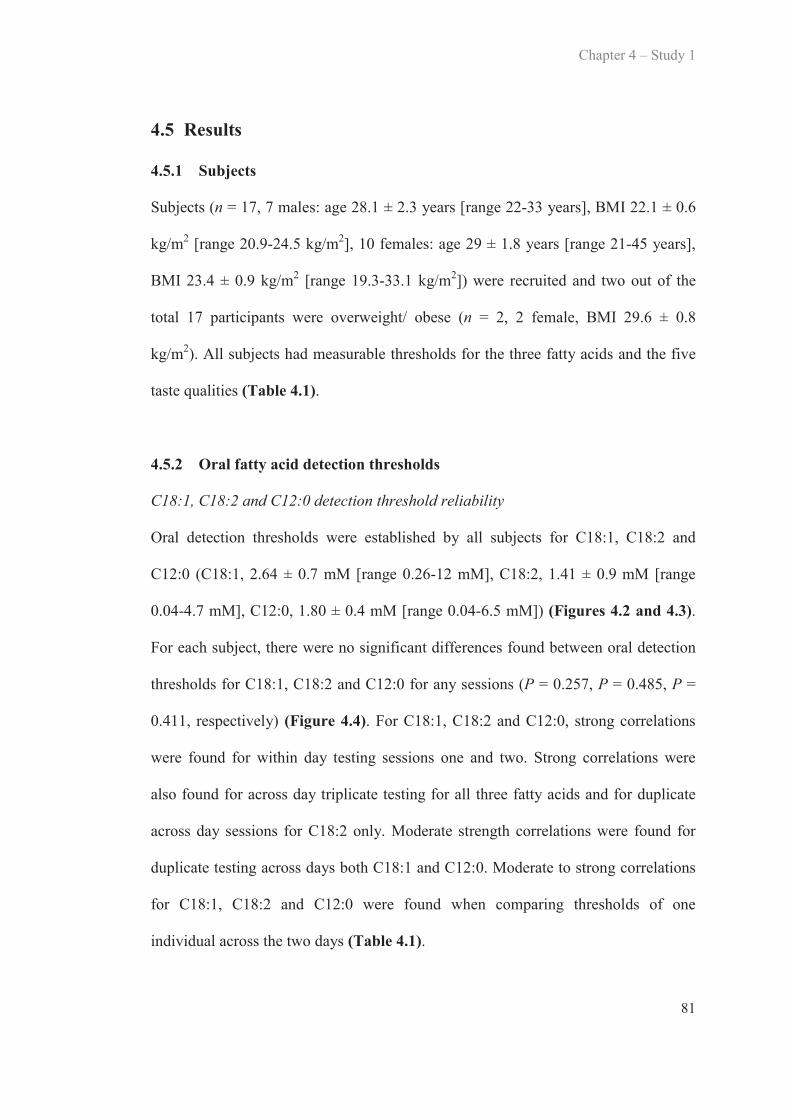
Chapter 4 – Study 1
81
4.5 Results
4.5.1 Subjects
Subjects (n = 17, 7 males: age 28.1 ± 2.3 years [range 22-33 years], BMI 22.1 ± 0.6
kg/m2 [range 20.9-24.5 kg/m2], 10 females: age 29 ± 1.8 years [range 21-45 years],
BMI 23.4 ± 0.9 kg/m2 [range 19.3-33.1 kg/m2]) were recruited and two out of the
total 17 participants were overweight/ obese (n = 2, 2 female, BMI 29.6 ± 0.8
kg/m2). All subjects had measurable thresholds for the three fatty acids and the five
taste qualities (Table 4.1).
4.5.2 Oral fatty acid detection thresholds
C18:1, C18:2 and C12:0 detection threshold reliability
Oral detection thresholds were established by all subjects for C18:1, C18:2 and
C12:0 (C18:1, 2.64 ± 0.7 mM [range 0.26-12 mM], C18:2, 1.41 ± 0.9 mM [range
0.04-4.7 mM], C12:0, 1.80 ± 0.4 mM [range 0.04-6.5 mM]) (Figures 4.2 and 4.3).
For each subject, there were no significant differences found between oral detection
thresholds for C18:1, C18:2 and C12:0 for any sessions (P = 0.257, P = 0.485, P =
0.411, respectively) (Figure 4.4). For C18:1, C18:2 and C12:0, strong correlations
were found for within day testing sessions one and two. Strong correlations were
also found for across day triplicate testing for all three fatty acids and for duplicate
across day sessions for C18:2 only. Moderate strength correlations were found for
duplicate testing across days both C18:1 and C12:0. Moderate to strong correlations
for C18:1, C18:2 and C12:0 were found when comparing thresholds of one
individual across the two days (Table 4.1).
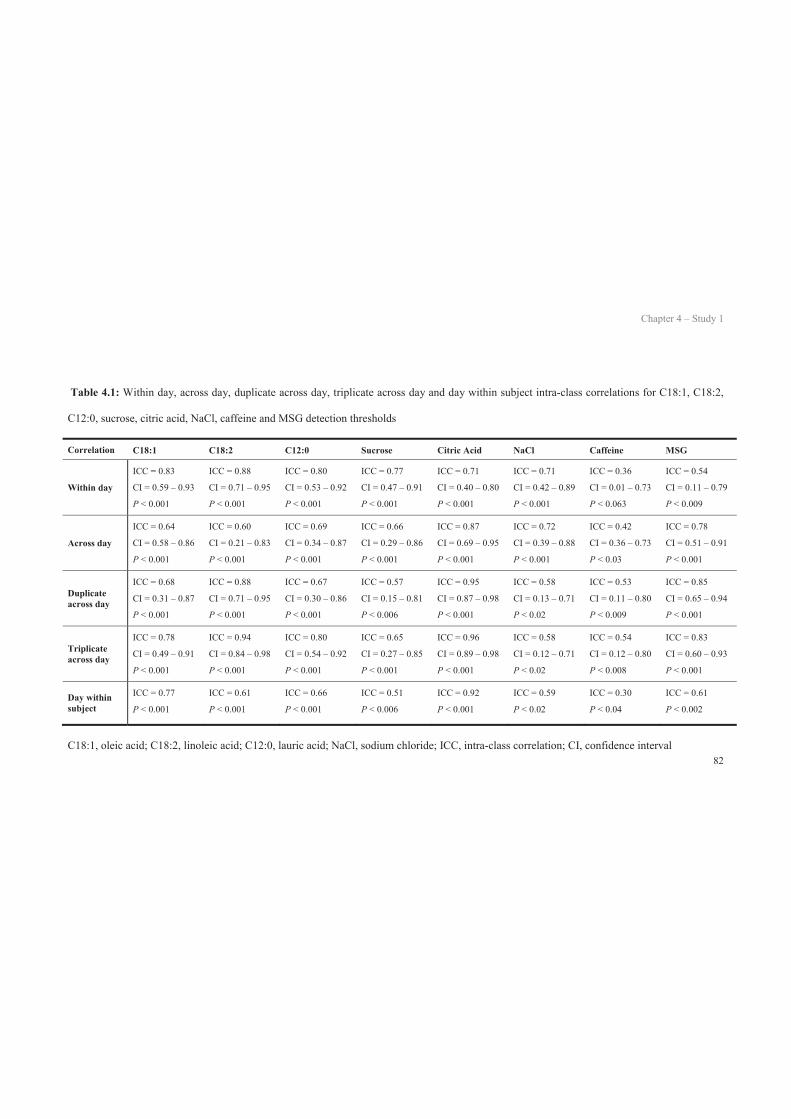
Chapter 4 – Study 1
82
Table 4.1: Within day, across day, duplicate across day, triplicate across day and day within subject intra-class correlations for C18:1, C18:2,
C12:0, sucrose, citric acid, NaCl, caffeine and MSG detection thresholds
C18:1, oleic acid; C18:2, linoleic acid; C12:0, lauric acid; NaCl, sodium chloride; ICC, intra-class correlation; CI, confidence interval
Correlation C18:1 C18:2 C12:0 Sucrose Citric Acid NaCl Caffeine MSG
Within day
ICC = 0.83
CI = 0.59 – 0.93
P < 0.001
ICC = 0.88
CI = 0.71 – 0.95
P < 0.001
ICC = 0.80
CI = 0.53 – 0.92
P < 0.001
ICC = 0.77
CI = 0.47 – 0.91
P < 0.001
ICC = 0.71
CI = 0.40 – 0.80
P < 0.001
ICC = 0.71
CI = 0.42 – 0.89
P < 0.001
ICC = 0.36
CI = 0.01 – 0.73
P < 0.063
ICC = 0.54
CI = 0.11 – 0.79
P < 0.009
Across day
ICC = 0.64
CI = 0.58 – 0.86
P < 0.001
ICC = 0.60
CI = 0.21 – 0.83
P < 0.001
ICC = 0.69
CI = 0.34 – 0.87
P < 0.001
ICC = 0.66
CI = 0.29 – 0.86
P < 0.001
ICC = 0.87
CI = 0.69 – 0.95
P < 0.001
ICC = 0.72
CI = 0.39 – 0.88
P < 0.001
ICC = 0.42
CI = 0.36 – 0.73
P < 0.03
ICC = 0.78
CI = 0.51 – 0.91
P < 0.001
Duplicate across day
ICC = 0.68
CI = 0.31 – 0.87
P < 0.001
ICC = 0.88
CI = 0.71 – 0.95
P < 0.001
ICC = 0.67
CI = 0.30 – 0.86
P < 0.001
ICC = 0.57
CI = 0.15 – 0.81
P < 0.006
ICC = 0.95
CI = 0.87 – 0.98
P < 0.001
ICC = 0.58
CI = 0.13 – 0.71
P < 0.02
ICC = 0.53
CI = 0.11 – 0.80
P < 0.009
ICC = 0.85
CI = 0.65 – 0.94
P < 0.001
Triplicate across day
ICC = 0.78
CI = 0.49 – 0.91
P < 0.001
ICC = 0.94
CI = 0.84 – 0.98
P < 0.001
ICC = 0.80
CI = 0.54 – 0.92
P < 0.001
ICC = 0.65
CI = 0.27 – 0.85
P < 0.001
ICC = 0.96
CI = 0.89 – 0.98
P < 0.001
ICC = 0.58
CI = 0.12 – 0.71
P < 0.02
ICC = 0.54
CI = 0.12 – 0.80
P < 0.008
ICC = 0.83
CI = 0.60 – 0.93
P < 0.001
Day within subject
ICC = 0.77
P < 0.001
ICC = 0.61
P < 0.001
ICC = 0.66
P < 0.001
ICC = 0.51
P < 0.006
ICC = 0.92
P < 0.001
ICC = 0.59
P < 0.02
ICC = 0.30
P < 0.04
ICC = 0.61
P < 0.002
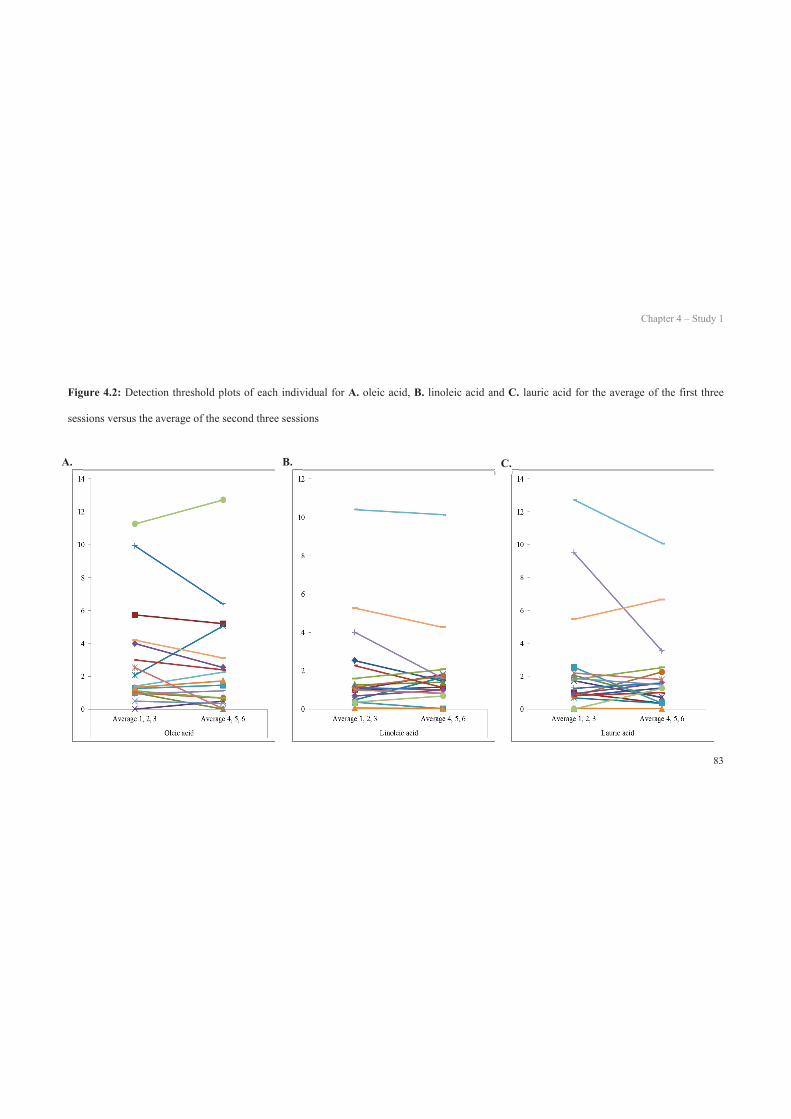
Chapter 4 – Study 1
83
Figure 4.2: Detection threshold plots of each individual for A. oleic acid, B. linoleic acid and C. lauric acid for the average of the first three
sessions versus the average of the second three sessions
A. B. C.

Chapter 4 – Study 1
84
Figure 4.3: Box plots representing distributions of taste detection thresholds. Medians are represented by the line inside the rectangle, the upper
and lower quartiles are represented by the ‘whiskers’ and the dots represent the outliers ( more or less than 1.5 box-lengths from the edge of the
box, * more than 3 box-lengths from the edge of the box). A, Detection threshold distribution of C18:1, C18:2, C12:0. B, Detection threshold
distribution of sucrose. C, Detection threshold distribution of NaCl. D, Detection threshold distribution of citric acid. E, Detection threshold
distribution of MSG. F, Detection threshold distribution of caffeine.
30
25
0
20
15
10
5
20
15
10
Con
cent
ratio
n (m
M)
Sucrose
B
NaCl
8
2
6
4
6
4
Con
cent
ratio
n (m
M)
C
Citric acid
1
0.8
0.2
0.6
0.4
D
0.80
0.6
0.4
Con
cent
ratio
n (m
M)
MSG
4
1
3
2
3
2
Con
cent
ratio
n (m
M)
E1.2
1
0.2
0.8
0.6
0.4
Caffeine
1
0.8
0.6
0.4
Con
cent
ratio
n (m
M)
FC18:1 C18:2 C12:0
AA12
10
0
8
6
4
2
8
6
4
Con
cent
ratio
n (m
M)

Chapter 4 – Study 1
85
Associations between C18:1, C18:2 and C12:0 detection thresholds
Moderate associations between C18:1 and C18:2 were found when the average of
sessions one to six were compared (r = 0.65, P < 0.004). Moderate associations were
found between C18:1 and C12:0 (r = 0.50, P = 0.037) and strong correlations were
found between C18:2 and C12:0 (r = 0.82, P = 0.001) (Figure 4.4).
Chapter 4 – Study 1
86
Figure 4.4: Correlations between oleic acid; C18:1, linoleic acid; C18:2 and lauric acid; C12:0. Significant associations were detected through
Pearson’s correlation analysis
Chapter 4 – Study 1
87
4.5.3 Taste detection thresholds: sweet, sour, salty, bitter and umami
Detection thresholds for all taste qualities were established for each participant
(sucrose, 13.61 ± 1.67 mM [range 1.78-28.04 mM], citric acid, 0.71 ± 0.03 mM
[range 0.4-0.8 mM], NaCl, 5.48 ± 0.41 mM [range 2.74-8.01 mM], caffeine, 0.58 ±
0.05 mM [range 0.31-1.04 mM], MSG, 1.76 ± 0.19 mM [range 0.88-3.60 mM])
(Figure 4.3). For each subject there was no significant differences found between
sucrose, citric acid, NaCl, caffeine and MSG for sessions one, two and three on days
one and two (P = 0.345, P = 0.324, P = 0.340, P = 0.093, P = 0.121, respectively).
For sucrose, strong correlations were found for within day testing sessions one and
two (ICC = 0.77, CI = 0.47-0.91, P < 0.001) and moderate correlations for across
day testing sessions one and four (ICC = 0.66, CI = 0.29-0.86, P < 0.001). Duplicate
testing across days was also moderately correlated, as was across day triplicate
testing. For citric acid, strong correlations were found for within day testing sessions
one and two (ICC = 0.87, CI = 0.69-0.95, P < 0.001) and across day testing sessions
one and four. Duplicate testing across days was also strongly correlated, as was
across day triplicate testing. The relationship between NaCl detection thresholds on
days one and two in session two were strongly correlated (ICC = 0.71, CI = 0.42-
0.89, P < 0.001). Weak to moderate correlations were found for within day testing
sessions one and two for caffeine (ICC = 0.36, CI = 0.10-0.80, P < 0.063), but across
day testing sessions one and four were moderately correlated. Duplicate testing
across days was also strongly correlated, as was across day triplicate testing. Lastly,
for MSG moderate correlations were found within day testing sessions one and two
(ICC = 0.54, CI = 0.11-0.79, P < 0.009), but strong correlations were found between
across day testing sessions one and four. Duplicate testing across days was also
Chapter 4 – Study 1
88
strongly correlated, as was across day triplicate testing. Again, moderate to strong
correlations for sucrose, citric acid, NaCl, caffeine and MSG were found when
comparing thresholds of one individual across the two days (Table 4.1).
4.5.4 Food consumption
From the daily food records, it was found that there were no significant correlations
between C18:1, C18:2 and C12:0 detection thresholds and total energy intake (P =
0.33, P = 0.81, P = 0.62), total fat (P = 0.53, P = 0.65, P = 0.75), saturated fat (P =
0.90, P = 0.77, P = 0.77), polyunsaturated fat (P = 0.21, P = 0.89, P = 0.88) and
monounsaturated fat intake (P = 0.61, P = 0.13, P = 0.78) and total carbohydrate (P
= 0.31, P = 0.79, P = 0.58) and protein intake (P = 0.37, P = 0.67, P = 0.66),
respectively.
4.5.5 Anthropometry
The mean BMI was 22.9 ± 0.75 kg/m2. There was no significant relationship
between fatty acid detection thresholds and BMI for C18:1 (r = -0.14, P = 0.59),
C18:2 (r = -0.06, P = 0.83) or C12:0 (r = -0.19, P = 0.46).
4.6 Discussion
This study investigated the reproducibility of oral fatty acid detection thresholds.
Oral fatty acid detection thresholds were reliable and reproducible both within and
across days for C18:1, C18:2 and C12:0. The test-retest coefficients for fatty acids
were equivalent to sucrose (sweet), citric acid (sour), caffeine (bitter), MSG (umami)
and NaCl (salty) (Ahne, et al., 2000; Pingel et al., 2010). The current study has
Chapter 4 – Study 1
89
shown that an individuals’ oral fatty acid detection thresholds were as consistent and
reproducible over numerous sessions as oral detection thresholds for the sweet, sour,
salty, bitter and umami stimuli (Ahne, et al., 2000; Bachmanov & Beauchamp, 2007;
Cicerale, et al., 2009; Galindo-Cuspinera et al., 2009; Krarup, 1958; Linschoten,
Harvey, Eller, & Jafek, 2001; Mueller, et al., 2011).
An important finding from this study was that the reproducibility of both the
saturated and unsaturated oral fatty acid thresholds measured was moderate to strong
(ICC range = 0.6-0.94), indicating that they remained stable within and across testing
sessions and days of testing. This study showed that duplicate threshold
measurements on the same day may be used to achieve an accurate portrayal of an
individual’s fatty acid sensitivity and that triplicate measures within or across days
did not provide any extra accuracy to the measures. Furthermore, although
correlations for duplicate measures across days for all three fatty acids were
moderate in strength, duplicate measures on the same day appear to provide the most
convenient option for testing oral fatty acid detection thresholds. However, not all
studies agree with this. Running et al. (2013) believe that there is a learning effect
related to fatty acid threshold testing with their study finding that subjects took up to
seven sessions before they could pick the fatty acid sample consistently (Running, et
al., 2013). However, this contradicts what was found in the present study, with a
proposition that duplicate sessions are needed to gain an accurate portrayal of an
individual’s oral fatty acid sensitivity. Reasons for these differences between studies
may be due to differences in the vehicle used to present the fatty acid samples in;
water compared to non-fat milk samples and differences in methodology; ascending

Chapter 4 – Study 1
90
3-alternate forced choice (3-AFC) methodology and staircase method compared to
triangle tests with ascending forced choice methodology used in the present study
(Newman & Keast, 2013; Tucker & Mattes, 2013). Other potential explanations for
differences in results include the fact that subjects completing the staircase method
started testing at a mid-range concentration of 3.2 mM which may have left residual
stimuli, and therefore made it difficult for subjects to detect the fatty acids at lower
concentrations (O'Mahony, 1979). Additionally, after the first threshold measure had
been established using the 3-AFC methodology, subjects began the next testing
session six concentration steps below their previously obtained threshold (Tucker &
Mattes, 2013), whereas the triangle tests in the present study began at the same
concentration (0.02 mM) for each testing session (Newman & Keast, 2013). These
differences in starting position may explain the variability of thresholds obtained
using the staircase and 3-AFC methods compared to the reliability reported using the
triangle tests.
As expected in sensory modalities, oral fatty acid thresholds varied considerably
among individuals tested and this explains the fact that there were outliers for the
three fatty acids. Oral detection thresholds ranged from 0.04 mM to 12 mM across
all fatty acids. Intra-individual variability in oral fatty acid sensitivity has been
observed in prior investigations (Chale-Rush, et al., 2007a; Mattes, 2009c; Stewart,
et al., 2010; Stewart, Newman, et al., 2011; Stewart, Seimon, et al., 2011) and results
from the present study have indicated measurement variation is a minor factor as
thresholds remained stable during testing sessions.
Chapter 4 – Study 1
91
Strong correlations were found between all three fatty acids, meaning that if an
individual was less orally sensitive to C18:1, they were also more likely to be less
orally sensitive to C18:2 and C12:0. Previously, studies have also found strong
correlations between C18 unsaturated fatty acids, suggesting a common oral
transduction mechanism may be at play (Stewart, et al., 2010). Indeed, reports have
located GPCR40 and GPCR120 on taste cells (Ichimura, et al., 2012), which bind
fatty acids upon chain length (Tanaka et al., 2008). Fatty acids that are between 6-12
carbon atoms long are classified as medium-chain fatty acids, whereas those that are
greater than 18 carbon atoms long are long-chain fatty acids (Beermann et al., 2003).
GPCR40 and GPCR120 are activated by medium- and long-chain fatty acids
(Tanaka, et al., 2008), therefore, as all three fatty acids were strongly correlated with
one another, it can be suggested that C18:1, C18:2 and C12:0 may access a similar
transduction mechanism to each other (Keast & Breslin, 2002).
Intra-individual variability in the primary tastes and oral fatty acid sensitivity have
been observed in prior investigations (Bertino, Beauchamp, & Engelman, 1986;
Chale-Rush, et al., 2007a; Delwiche, Buletic, & Breslin, 2001; Eny, Wolever,
Fontaine-Bisson, & El-Sohemy, 2008; Mattes, 2009c; Stewart, et al., 2010), however
the factors responsible for variability remain undisclosed. The current study has
indicated measurement variation is a minor factor as thresholds remained stable
during testing sessions. It is however known that sensitivity to tastants and possibly
fatty acids, may vary due to environmental factors, such as the background diet
(DiNicolantonio, Teow, & Morgan, 1984), or genetic factors, such as differences in
taster status (e.g., supertaster) (Hayes & Keast, 2011; Hayes, Sullivan, & Duffy,
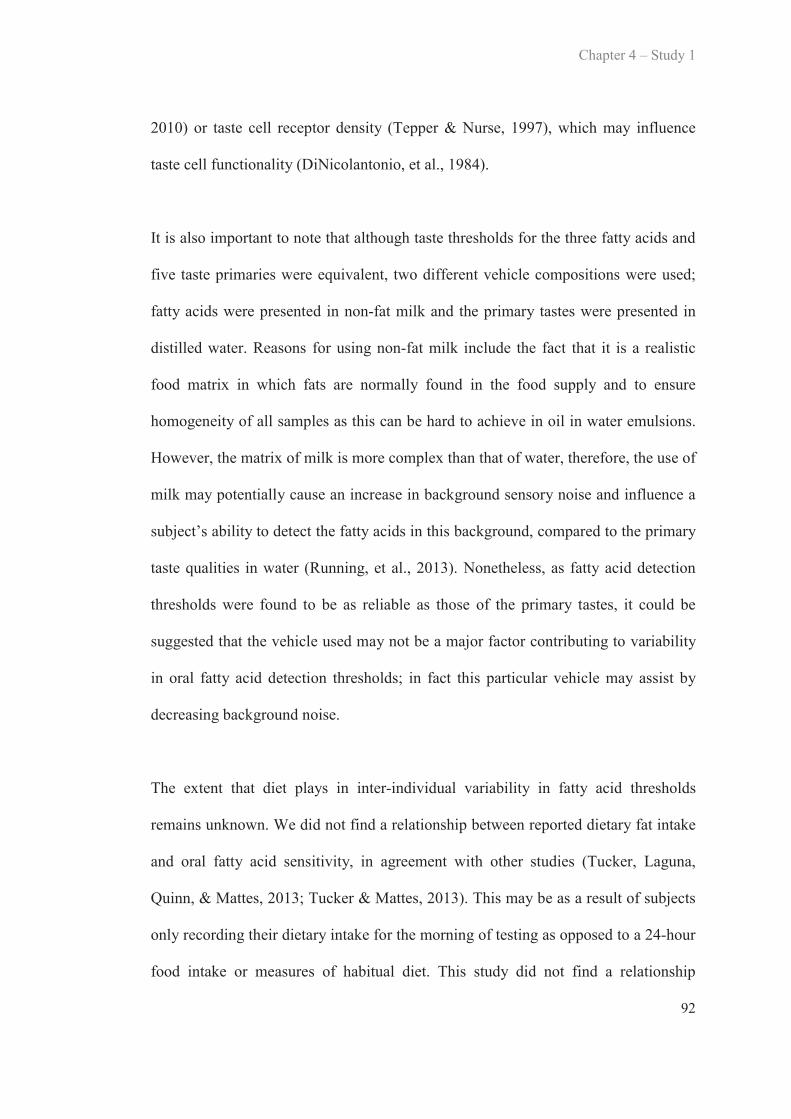
Chapter 4 – Study 1
92
2010) or taste cell receptor density (Tepper & Nurse, 1997), which may influence
taste cell functionality (DiNicolantonio, et al., 1984).
It is also important to note that although taste thresholds for the three fatty acids and
five taste primaries were equivalent, two different vehicle compositions were used;
fatty acids were presented in non-fat milk and the primary tastes were presented in
distilled water. Reasons for using non-fat milk include the fact that it is a realistic
food matrix in which fats are normally found in the food supply and to ensure
homogeneity of all samples as this can be hard to achieve in oil in water emulsions.
However, the matrix of milk is more complex than that of water, therefore, the use of
milk may potentially cause an increase in background sensory noise and influence a
subject’s ability to detect the fatty acids in this background, compared to the primary
taste qualities in water (Running, et al., 2013). Nonetheless, as fatty acid detection
thresholds were found to be as reliable as those of the primary tastes, it could be
suggested that the vehicle used may not be a major factor contributing to variability
in oral fatty acid detection thresholds; in fact this particular vehicle may assist by
decreasing background noise.
The extent that diet plays in inter-individual variability in fatty acid thresholds
remains unknown. We did not find a relationship between reported dietary fat intake
and oral fatty acid sensitivity, in agreement with other studies (Tucker, Laguna,
Quinn, & Mattes, 2013; Tucker & Mattes, 2013). This may be as a result of subjects
only recording their dietary intake for the morning of testing as opposed to a 24-hour
food intake or measures of habitual diet. This study did not find a relationship
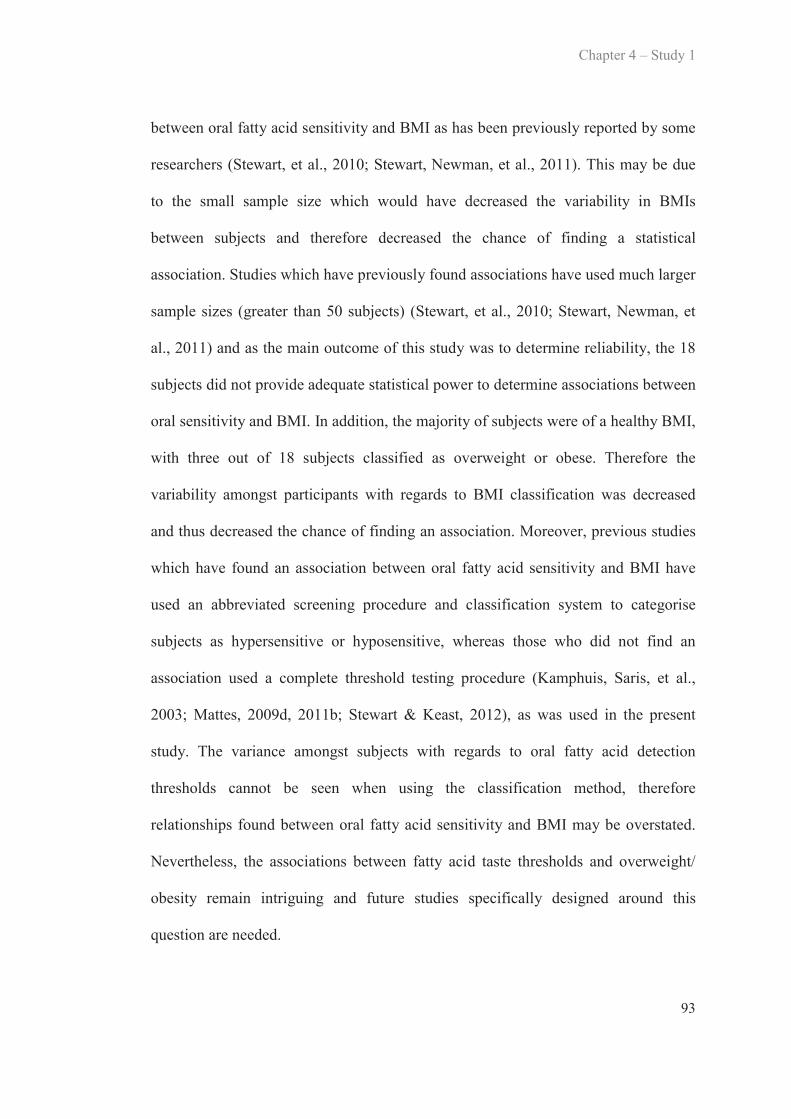
Chapter 4 – Study 1
93
between oral fatty acid sensitivity and BMI as has been previously reported by some
researchers (Stewart, et al., 2010; Stewart, Newman, et al., 2011). This may be due
to the small sample size which would have decreased the variability in BMIs
between subjects and therefore decreased the chance of finding a statistical
association. Studies which have previously found associations have used much larger
sample sizes (greater than 50 subjects) (Stewart, et al., 2010; Stewart, Newman, et
al., 2011) and as the main outcome of this study was to determine reliability, the 18
subjects did not provide adequate statistical power to determine associations between
oral sensitivity and BMI. In addition, the majority of subjects were of a healthy BMI,
with three out of 18 subjects classified as overweight or obese. Therefore the
variability amongst participants with regards to BMI classification was decreased
and thus decreased the chance of finding an association. Moreover, previous studies
which have found an association between oral fatty acid sensitivity and BMI have
used an abbreviated screening procedure and classification system to categorise
subjects as hypersensitive or hyposensitive, whereas those who did not find an
association used a complete threshold testing procedure (Kamphuis, Saris, et al.,
2003; Mattes, 2009d, 2011b; Stewart & Keast, 2012), as was used in the present
study. The variance amongst subjects with regards to oral fatty acid detection
thresholds cannot be seen when using the classification method, therefore
relationships found between oral fatty acid sensitivity and BMI may be overstated.
Nevertheless, the associations between fatty acid taste thresholds and overweight/
obesity remain intriguing and future studies specifically designed around this
question are needed.
Chapter 4 – Study 1
94
4.7 Conclusions
In summary, this study has provided confirmatory evidence in support of the good
test-retest reliability of sweet, sour, salty, bitter and umami thresholds, as well as
novel evidence showing the high reproducibility of oral fatty acid thresholds using
saturated, monounsaturated and polyunsaturated fatty acids. The fact that there were
no correlations between fatty acid thresholds and primary taste thresholds adds to the
growing body of evidence that suggest fatty acids may have an independent taste
transduction mechanism. These findings suggest that the most accurate way to test
an individual’s oral sensitivity to C18:1, C18:2 and C12:0 are to perform the tests in
duplicate on the same day. This method provides a convenient and precise way to
measure an individual’s oral sensitivity to fatty acids.
4.8 Future directions
Due to the paucity of evidence in humans with regards to oral fatty acid sensitivity
and putative receptor expression, future research should focus on this area. Studies
that involve assessing an individual’s oral fatty acid sensitivity over a number of
sessions are required, which also yield a tongue papillae biopsy to investigate
associations with putative receptors and pre-determined oral fatty acid sensitivity.
C H A P T E R F I V E
Study 2
The influence of a high-fat meal immediately prior to
oral fatty acid detection threshold testing5 5
5.1 Introduction
Taste is used as an oral nutrient-toxin detection system which is designed to detect
the nutritional or toxic quality of foods and ensure essential nutrients vital for
survival and functioning are consumed and reject foods that may be harmful
(Gilbertson, et al., 2000). The detection of compounds within the oral cavity can
have an appetitive effect or an aversive effect, for example, sweet taste indicates the
presence of carbohydrates and umami generally indicates proteins, which both evoke
an appetitive response, however sour and bitter may indicate the presence of
potential toxins or poisons, and therefore produce an aversive response (Gilbertson,
et al., 2000). As the oral cavity detects the major macronutrients of the human diet,
e.g., carbohydrates and proteins, research is now suggestive that there may also be
detection of fats within the oral cavity which is activated by the break down product
of fat, fatty acids.
Historically, it was thought that fats could be perceived across multiple modalities
including olfaction, texture, chemesthesis, and vision (Tucker & Mattes, 2012),
however research is now suggesting that when non-taste cues are minimised, fatty
acids can be identified by humans at detection threshold levels within the oral cavity
(Chale-Rush, et al., 2007a; Mattes, 2009c; Stewart, et al., 2010; Stewart, Newman, et
Chapter 5 – Study 2
96
al., 2011). Further to this, specific putative receptors cluster of differentiation 36
(CD36), G-protein coupled receptor (GPCR) 120, 40 and 43 and delayed rectifying
potassium (DRK) channels for fatty acids have been identified in the oral cavity on
taste tissue in animals (Ichimura, et al., 2012; Sclafani, Ackroff, & Abumrad, 2007;
Simons, et al., 2010). However, at this stage, only GPCR 120 and CD36 have been
isolated in human taste tissue (Galindo, et al., 2012). Nonetheless, these findings add
to the accumulating body of evidence for fatty acid detection within the mouth.
Mounting evidence is suggestive of a strong link between dietary fat consumption
and sensitivity to fatty acids. Research has focussed on the potential link between
excess dietary fat consumption and sensitivity to fatty acids throughout the
alimentary canal (Little & Feinle-Bisset, 2011; Stewart, Seimon, et al., 2011). Recent
work has found that when subjects are grouped based on their sensitivity to oleic
acid (C18:1), hypersensitive subjects consumed less total energy and fat and were
more likely to perform behaviours that reduced their fat consumption e.g., trimming
the fat off meat and avoiding saturated fats, than hyposensitive subjects (Stewart, et
al., 2010; Stewart, Newman, et al., 2011). However, the mechanisms responsible for
these differences between hypersensitive and hyposensitive individuals remain
elusive. This work also suggested that oral fatty acid sensitivity was linked to body
mass index (BMI) with hypersensitive individuals having lower BMIs than
hyposensitive individuals. Nevertheless, this link remains contentious with many
other studies finding no link between BMI and oral fatty acid sensitivity (Kamphuis,
Saris, et al., 2003; Mattes, 2009d, 2011b; Stewart & Keast, 2012). Suggestions as to
why this may be the case have been proposed with the thought using an abbreviated
Chapter 5 – Study 2
97
screening procedure for testing oral fatty acid sensitivity i.e., splitting the subjects
into hypersensitive and hyposensitive based on oral sensitivity to a single C18:1
concentration has played some form of role, as all studies that have used a full
screening procedure e.g., 3-alternate forced choice (3-AFC), triangle tests or the
staircase methodology have found no links between oral sensitivity and BMI
(Running, et al., 2013). In addition, studies that have divided subjects into lean and
obese groups have also found mixed results with one study finding a strong
correlation between BMI and oral fatty acid sensitivity (Stewart, Seimon, et al.,
2011) and the other finding no correlations (Stewart & Keast, 2012), which provides
further evidence to suggest that this is a contentious area of research. It is still
speculative at this stage as to what the driving factor of excess fat consumption is;
does sensitivity drive fat consumption, or is fat consumption determining sensitivity.
The modulation of oral fatty acid thresholds was investigated in relation to fat
consumption (Stewart & Keast, 2012). Subjects followed a low-fat diet for four
weeks and then followed a high-fat diet for four weeks. After the low-fat diet, lean
and overweight/ obese subjects’ sensitivity to fatty acids increased and after
consumption of the high-fat diet, the lean subjects’ fatty acid sensitivity decreased
(Stewart & Keast, 2012). These findings highlight the potential link between fat
consumption and oral fatty acid sensitivity. However, interestingly, after
consumption of the high-fat diet, it was reported that oral fatty acid thresholds did
not change in the obese population. Suggestions for this seemingly differential
response included, the proposal that the obese population were consuming a high-fat
diet prior to commencement of the study, and therefore adaptation to this diet had
already occurred, in turn causing no changes in sensitivity. Nevertheless, no
Chapter 5 – Study 2
98
significant differences in sensitivity were seen at baseline between the lean and
obese groups, thus if a reduction in fat consumption could be maintained over the
long-term, adaptive changes to sensitivity may occur whereby subjects will become
more sensitive to the physiological and psychological effects of fat, and in turn
require smaller amounts of fat to elicit the positive post-ingestive effects associated
with fats.
Whilst there is speculation over the reliability of the fatty acid detection
measurement, recent work has established that the method we employ is highly
reproducible over a number of testing sessions (Newman & Keast, 2013). The study
found that the most reliable and highly correlated measurement to ascertain the most
accurate portrayal of a subject’s sensitivity to C18:1, linoleic acid (C18:2), lauric
acid (C12:0), was to perform the threshold test in duplicate. In contrast, recent work
has also reported that taste thresholds are not stable from session to session with an
observed learning effect occurring (Tucker & Mattes, 2013). The authors report that
up to seven sessions would be needed to gain an accurate portrayal of an individual’s
sensitivity, whilst Newman and Keast (2013) recommend sessions to be completed
in duplicate. Reasons for these discrepancies may be due to differences in testing
method used (ascending forced choice triangle tests compared to staircase method
and 3-AFC methodology) and vehicle used to present the fatty acid samples in (non-
fat milk compared to water).
Evidence is now emerging that oral fatty acid sensitivity may be influenced by long-
term fat consumption; however it is unknown whether recent intake could contribute

Chapter 5 – Study 2
99
to intra-individual variation with regards to oral fatty acid detection thresholds. Due
to the regularity of taste cell turnover; approximately every 10-14 days (Farbman,
1980), it could be speculated that a diet high or low in fat would need to be
consumed for at least 10-14 days before changes in peripheral physiology could be
seen. However, to the best of the author’s knowledge, it is unknown if a high-fat
meal immediately prior to threshold testing has any effect on oral fatty acid detection
threshold performance. Some research has been conducted in animals whereby
CD36 mRNA levels decreased in fed mice in comparison to the fasted mice and in
mice who had consumed a high-fat diet compared to those on a non-fat diet (Martin
et al., 2011) suggesting the prior meal may have an influence on taste sensitivity.
This study also suggests that this decrease in CD36 was mediated by lipids as
decreases were only seen when the chow contained long-chain fatty acids (Martin, et
al., 2011). The authors also postulate that these decreases may be due to CD36
degradation, whereby a negative feedback response to persistent exposure to dietary
fats may cause a physiological desensitisation of lingual CD36 (Martin, et al., 2011).
Therefore, it is unknown whether this is the case in humans, but perhaps these acute
decreases in CD36 after fat exposure may influence the ability to detect fatty acids
within the oral cavity. However, there are conflicting results in humans regarding the
effect of a meal on taste thresholds with past research reporting that consumption of
a high-carbohydrate meal influences taste perception of sweet taste in men, but not
women (Suchecka et al., 2011). The same study also reported that salty taste was not
influenced by the high-carbohydrate meal (Suchecka, et al., 2011), suggesting that it
may be a macronutrient specific effect. Similarly, another study reported that there
was a trend for a reduced taste of sucrose after a meal (Moore, Linker, & Purcell,
Chapter 5 – Study 2
100
1965). Other studies have investigated the effect of a test meal on detection and
recognition thresholds for the primary tastes and found no differences in taste
thresholds for sucrose, fructose, sodium chloride (NaCl), 6-n-propylthiouracil
(PROP) and quinine pre- and post-meal (Pasquet et al., 2006). This may be due to
the fact that a once off exposure to the potential tastants or macronutrients within a
single meal is not enough exposure to elicit a change in detection thresholds and
perhaps repeated or long-term exposure is needed to see such changes, as reported in
dietary studies (Mattes, 1997; Stewart & Keast, 2012). In contrast, Zverev (2004)
reported that there were differences in taste thresholds for sucrose, salt and quinine
pre- and post-meal, however the pre-meal threshold was taken after 14 hours of
fasting, whereas generally subjects would be required to refrain from eating or
drinking 1-2 hours prior to testing and perhaps this may account for differences
between studies (Zverev, 2004). The composition of the meals provided to the
subjects in both studies may also impact on the differing results found, with many
studies not providing this information for comparison. Thus, the contradictory
background research in this area and the fact that this has not been investigated in
regards to oral fatty acid sensitivity suggest that it is an area worth exploring.
5.2 Aims and hypotheses
5.2.1 Aims
To measure the effect that a high-fat (60% fat: 20% carbohydrate: 20% protein), a
low-fat (20% fat: 40% carbohydrate: 40% protein) or a macronutrient balanced (33%
fat: 33% carbohydrate: 33% protein) meal immediately prior to detection threshold
testing has on oral fatty acid thresholds.

Chapter 5 – Study 2
101
5.2.2 Hypotheses
The consumption of a high-fat, low-fat or macronutrient balanced meal prior to
threshold testing will have no effect on oral fatty acid detection thresholds as
physiological adaptation is unlikely to occur during a single meal.
5.3 Subjects, materials and methods
5.3.1 Subjects
Power analysis was conducted prior to the study to determine an appropriate sample
size to achieve adequate statistical power. Data were used from a prior study which
evaluated detection thresholds for fatty acids (Stewart, et al., 2010)
required for this study to detect a C18:1 detection threshold difference of 0.65 mM,
using the following equation:
difference required for detection of significant differences. Subjects were recruited
from Deakin University, Burwood, Victoria, Australia and the surrounding suburbs.
Subjects were required to be non-smokers and aged between 18-75 years old. This
(Z + Z )2 2
N = D2
Chapter 5 – Study 2
102
study was approved by the Deakin University Human Ethics Advisory Group
(HEAG-H20_2012) and all subjects provided informed, written consent prior to
participating in the study.
5.3.2 Study outline
This study was a randomised crossover study where subjects were exposed to all
treatments. Subjects were required to attend three laboratory sessions at the Deakin
University sensory laboratory. On the evening prior to each testing session, subjects
were asked to consume a standardised meal (Lean Cuisine Beef Lasagne, Simplot,
Mentone, Victoria, Australia). In each session, subjects attended the laboratory at the
same time (0900hr) where they consumed one of the three breakfasts; a high-fat,
low-fat or equal fat, protein and carbohydrate breakfast (Appendix H). After a one
hour break, they were tested for their oral sensitivity to C18:1 in duplicate (Figure
5.1). Anthropometric measurements were also recorded to calculate BMI and
subjects were required to complete a food frequency questionnaire and a 24-hour
food record.
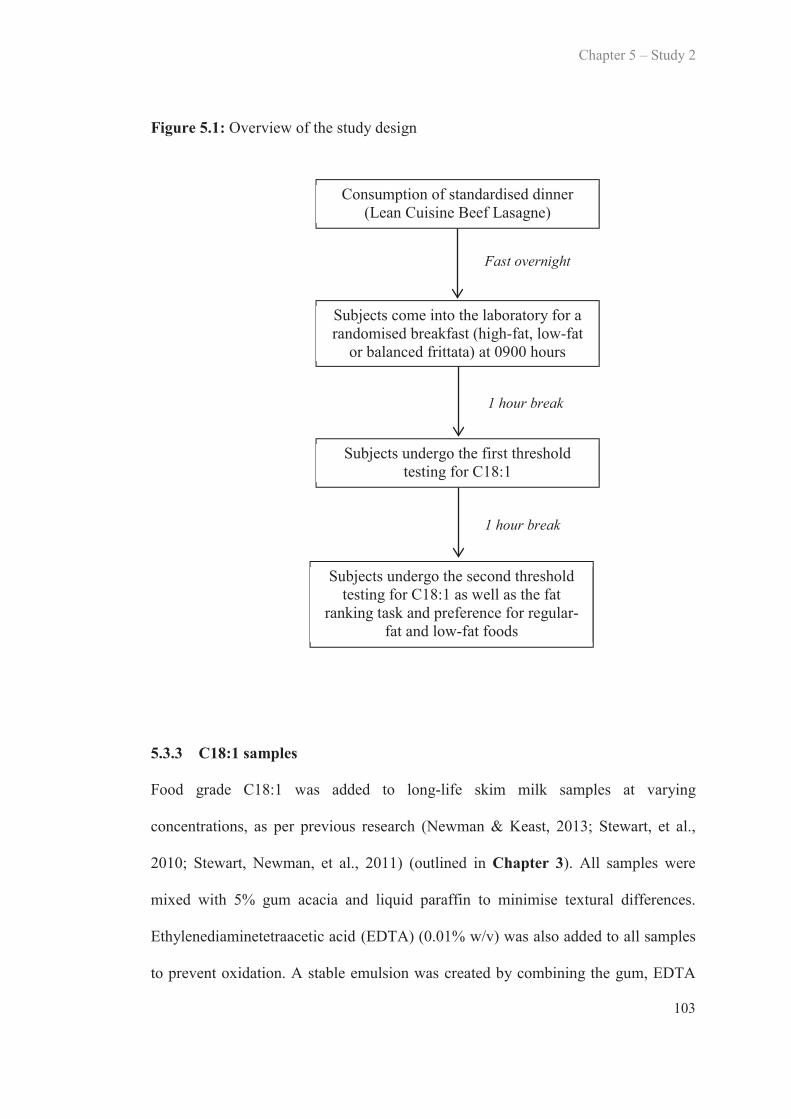
Chapter 5 – Study 2
103
Figure 5.1: Overview of the study design
5.3.3 C18:1 samples
Food grade C18:1 was added to long-life skim milk samples at varying
concentrations, as per previous research (Newman & Keast, 2013; Stewart, et al.,
2010; Stewart, Newman, et al., 2011) (outlined in Chapter 3). All samples were
mixed with 5% gum acacia and liquid paraffin to minimise textural differences.
Ethylenediaminetetraacetic acid (EDTA) (0.01% w/v) was also added to all samples
to prevent oxidation. A stable emulsion was created by combining the gum, EDTA
Consumption of standardised dinner (Lean Cuisine Beef Lasagne)
Subjects come into the laboratory for a randomised breakfast (high-fat, low-fat
or balanced frittata) at 0900 hours
Subjects undergo the first threshold testing for C18:1
Subjects undergo the second threshold testing for C18:1 as well as the fat
ranking task and preference for regular-fat and low-fat foods
Fast overnight
1 hour break
1 hour break

Chapter 5 – Study 2
104
and milk together first and then this was added to the paraffin and fatty acid mixture
(Chapter 3). Control samples were made in the same way as the fatty acid samples,
minus the C18:1. Samples were homogenised at 12 000 rpm for 30 seconds/ 100 ml.
All samples were made freshly on the day of testing.
5.3.4 Detection thresholds for C18:1
Oral fatty acid sensitivity to C18:1 was determined using triangle tests with
ascending forced choice methodology (Chapter 3). Subjects were presented with
three samples on a tray; two were control samples and the other containing a set
concentration of C18:1. Fatty acid samples were presented in ascending order from
the lowest concentration (0.02 mM) to the highest (20 mM) (Newman & Keast,
2013; Stewart, et al., 2010). Detection thresholds for C18:1 were determined when a
subject was able to pick the odd sample out three consecutive times at the same
concentration. Subjects were instructed to taste the samples and then spit them out.
They were also required to wear a nose clip at all times and perform the test under
red lighting to minimise potential confounders from non-sensory inputs. Subjects
were asked to refrain from eating or drinking anything one hour prior to testing
(water was allowed). Detection thresholds were measured in duplicate whereby
subjects were tested one hour after breakfast and then one hour after completion of
the first threshold test.
5.3.5 Test meals
Subjects were provided with and asked to consume a standardised dinner (Lean
Cuisine Beef Lasagne) on the evening prior to testing and were asked not to consume
Chapter 5 – Study 2
105
any other foods (water was allowed) until attending the sensory laboratory the next
day (Chapter 3). During all three sessions, subjects were given one of three different
frittatas on three separate days, which varied in macronutrient content (high-fat, low-
fat, equal amount of fat, protein and carbohydrate) (Appendix H) and were then
asked to come back twice on the same day to measure oral fatty acid sensitivity. The
breakfasts were matched for energy and the kilojoule content for each frittata was
1500kJ. To compensate for variation in the volume of each breakfast, breakfasts
were equated with a measured amount of drinking water. Subjects were asked to
refrain from eating or drinking anything (except for water) between breakfast and the
first oral fatty acid sensitivity test. C18:1 composition of the frittatas was calculated
using FoodWorks 2009 (Xyris software, Highgate Hill, Queensland, Australia),
RMIT Australian Fatty Acids database.
5.3.6 Fat ranking task
At the end of each laboratory session, subjects were asked to complete a fat ranking
task which assessed the subject’s ability to identify fats within a common food
(custard). As per Chapter 3, subjects were presented with custard samples
containing varying amounts of vegetable oil (0, 2, 6 and 10%). Custard was made
from 20 g custard powder, 12 g sugar and 500 ml skim milk. Custard was then
separated into four 100 g batches and 2 ml, 6 ml and 10 ml of vegetable oil was
added to the batches and the 0% batch contained no vegetable oil. All samples were
matched for texture so they contained a total of 10% ‘oil’; therefore paraffin oil was
added to the 0%, 2% and 6% batches. Subjects were given the samples in a
randomised order and asked to taste each sample and rank the samples in order of

Chapter 5 – Study 2
106
perceived fattiness. Subjects received a score out of five for this task. The scores for
this were calculated as per previous research (Table 3.2) (Stewart, Newman, et al.,
2011).
5.3.7 Hedonic ratings
Subjects completed preference tests using a range of regular-fat and low-fat foods
including cream cheese, vanilla yoghurt and chocolate mousse, as per Chapter 3.
Subjects were asked to taste each sample and rate how much they liked it using a 9-
point hedonic scale ranging from ‘dislike extremely’ to ‘like extremely’.
5.3.8 Habitual food consumption
Subjects were required to fill out a food record in which they recorded everything
they consumed in 24 hours (Appendix F). Subjects were asked to, where possible,
weigh the foods they consumed or use standard metric measuring cups, or common
serving sizes, for example, 1 cup. Diet diaries were analysed using FoodWorks 2009
(Xyris software, Highgate Hill, Queensland, Australia). From these data the mean
energy intake (kJ), macronutrient distribution (% energy from fat, protein and
carbohydrate and grams of fat, protein and carbohydrate) and the type of fat (grams
and % of monounsaturated, polyunsaturated or saturated), salt (mg) and alcohol (g)
was calculated.
5.3.9 Anthropometry
Height (m) and weight (kg) measurements were taken for all subjects using a
stadiometer (Seca, MedShop Australia, Fairfield, Victoria, Australia) and scales
Chapter 5 – Study 2
107
(Tanita Body Scan Composition Monitor Scales, Cloverdale, Western Australia,
Australia), respectively. Light loose clothing was worn and shoes were removed
(Chapter 3).
5.4 Statistical analysisDifferences in oral fatty acid sensitivity after each breakfast were compared using
one-way repeated measures analysis of variance (ANOVA). Each session was
numbered according to Table 5.1. Within day differences in oral fatty acid
sensitivity were determined using paired samples t-tests. Reliability analysis was
conducted using intra-class correlations (ICC) to detect associations between C18:1
detection thresholds within and between testing days. One-way repeated measures
ANOVA was also used to detect differences between preferences for regular- and
low-fat foods after each breakfast and Friedman tests were used to detect differences
between fat ranking scores after each breakfast. Independent samples t-tests were
used to detect differences in oral fatty acid sensitivity, gender and healthy weight
category as well as differences in energy and macronutrient intake between lean and
obese subjects. Pearson’s correlations were used to detect associations between
C18:1 detection thresholds and total energy, fat, carbohydrate and protein intake, as
well as percentage energy from fat, carbohydrates and proteins. All data are
presented as means ± SEM.
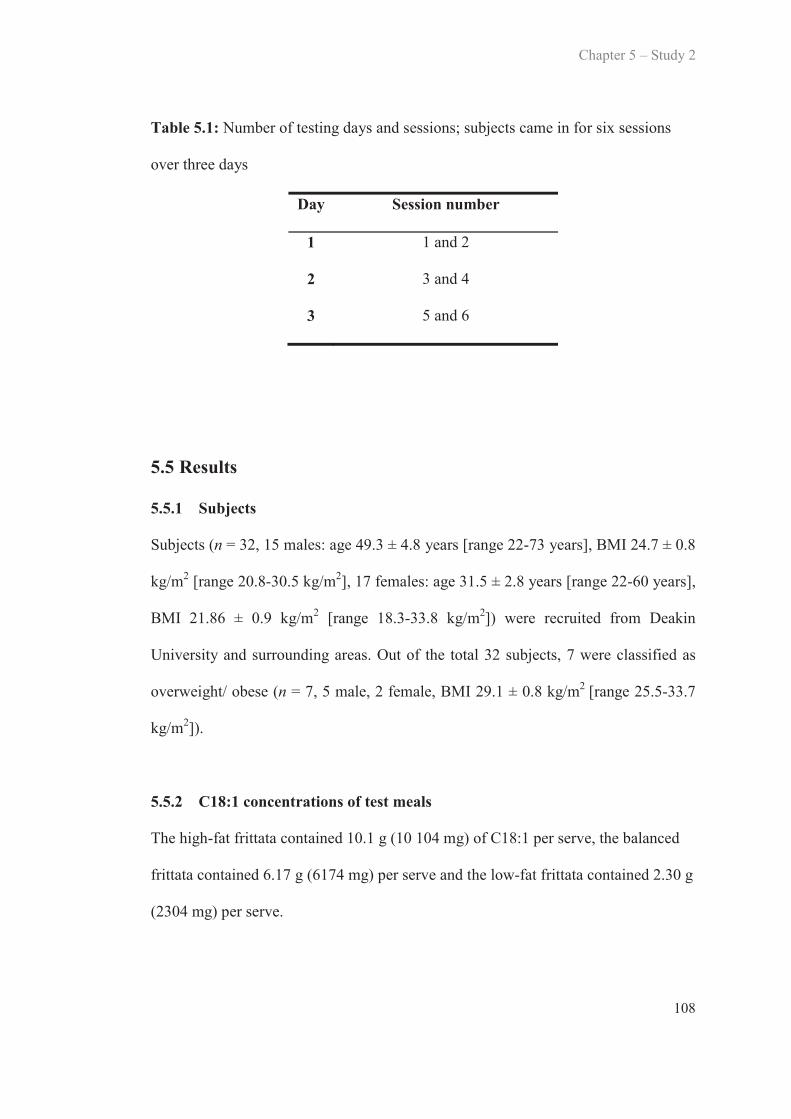
Chapter 5 – Study 2
108
Table 5.1: Number of testing days and sessions; subjects came in for six sessions
over three days
Day Session number
1 1 and 2
2 3 and 4
3 5 and 6
5.5 Results
5.5.1 Subjects
Subjects (n = 32, 15 males: age 49.3 ± 4.8 years [range 22-73 years], BMI 24.7 ± 0.8
kg/m2 [range 20.8-30.5 kg/m2], 17 females: age 31.5 ± 2.8 years [range 22-60 years],
BMI 21.86 ± 0.9 kg/m2 [range 18.3-33.8 kg/m2]) were recruited from Deakin
University and surrounding areas. Out of the total 32 subjects, 7 were classified as
overweight/ obese (n = 7, 5 male, 2 female, BMI 29.1 ± 0.8 kg/m2 [range 25.5-33.7
kg/m2]).
5.5.2 C18:1 concentrations of test meals
The high-fat frittata contained 10.1 g (10 104 mg) of C18:1 per serve, the balanced
frittata contained 6.17 g (6174 mg) per serve and the low-fat frittata contained 2.30 g
(2304 mg) per serve.
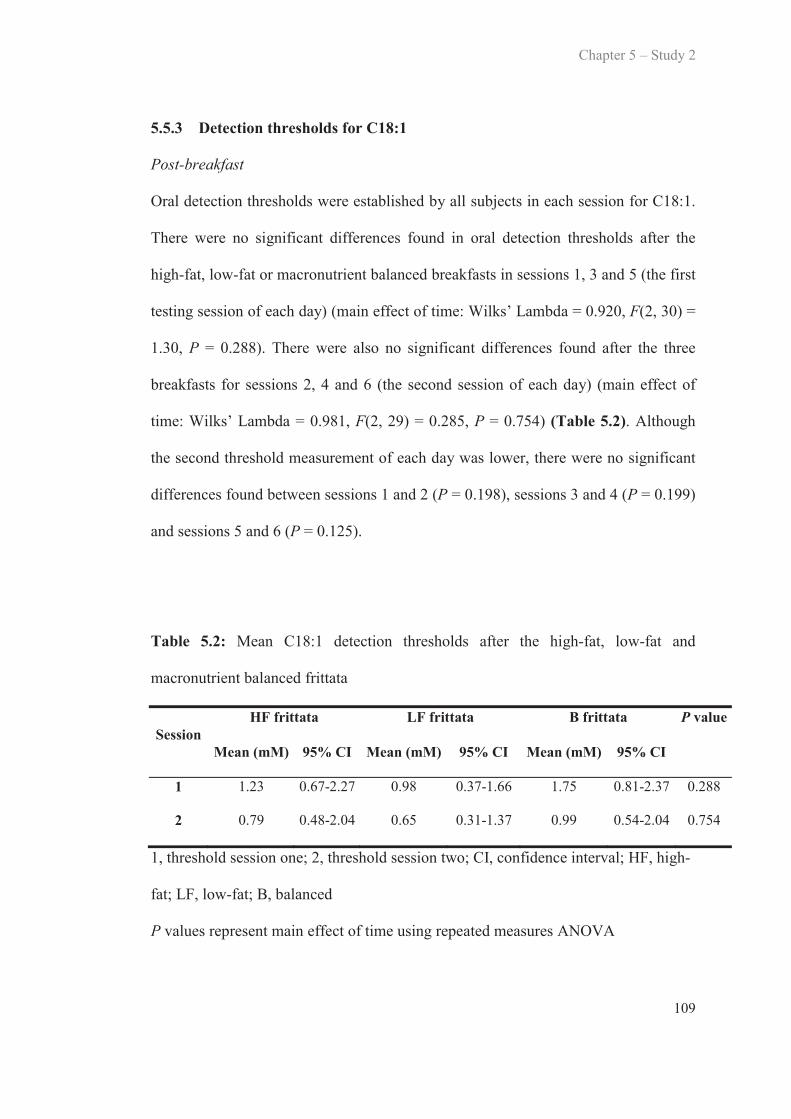
Chapter 5 – Study 2
109
5.5.3 Detection thresholds for C18:1
Post-breakfast
Oral detection thresholds were established by all subjects in each session for C18:1.
There were no significant differences found in oral detection thresholds after the
high-fat, low-fat or macronutrient balanced breakfasts in sessions 1, 3 and 5 (the first
testing session of each day) (main effect of time: Wilks’ Lambda = 0.920, F(2, 30) =
1.30, P = 0.288). There were also no significant differences found after the three
breakfasts for sessions 2, 4 and 6 (the second session of each day) (main effect of
time: Wilks’ Lambda = 0.981, F(2, 29) = 0.285, P = 0.754) (Table 5.2). Although
the second threshold measurement of each day was lower, there were no significant
differences found between sessions 1 and 2 (P = 0.198), sessions 3 and 4 (P = 0.199)
and sessions 5 and 6 (P = 0.125).
Table 5.2: Mean C18:1 detection thresholds after the high-fat, low-fat and
macronutrient balanced frittata
SessionHF frittata LF frittata B frittata P value
Mean (mM) 95% CI Mean (mM) 95% CI Mean (mM) 95% CI
1 1.23 0.67-2.27 0.98 0.37-1.66 1.75 0.81-2.37 0.288
2 0.79 0.48-2.04 0.65 0.31-1.37 0.99 0.54-2.04 0.754
1, threshold session one; 2, threshold session two; CI, confidence interval; HF, high-
fat; LF, low-fat; B, balanced
P values represent main effect of time using repeated measures ANOVA
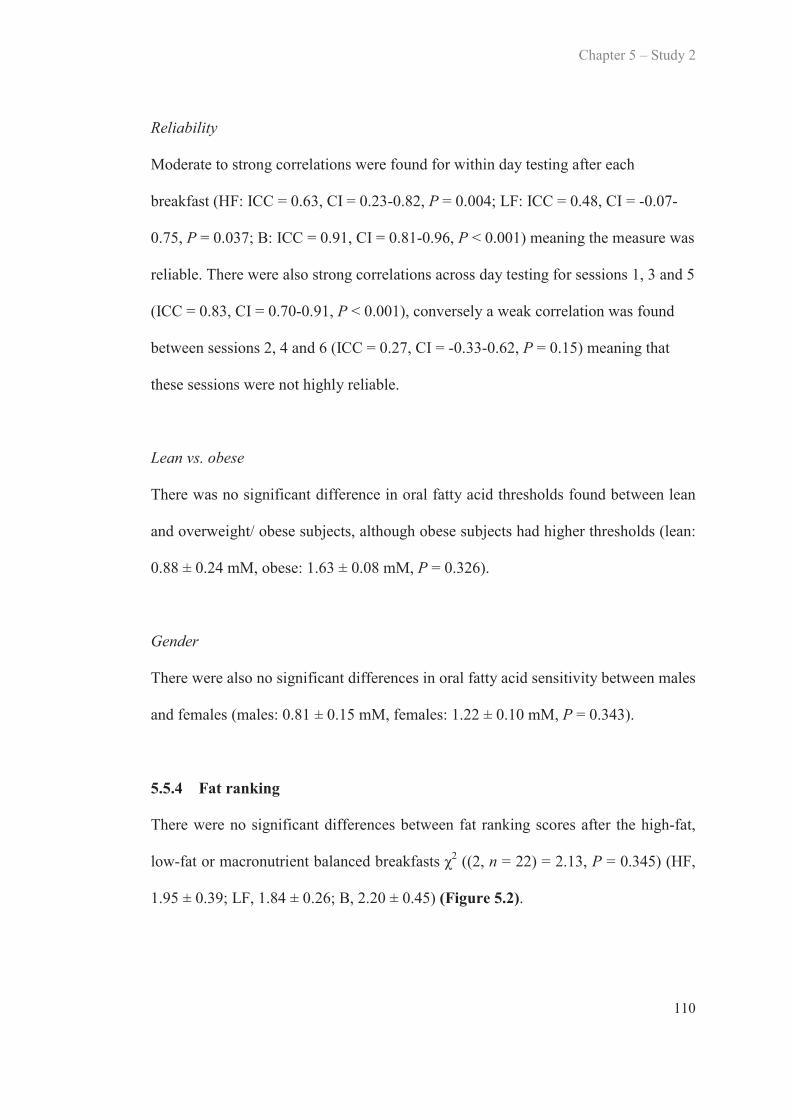
Chapter 5 – Study 2
110
Reliability
Moderate to strong correlations were found for within day testing after each
breakfast (HF: ICC = 0.63, CI = 0.23-0.82, P = 0.004; LF: ICC = 0.48, CI = -0.07-
0.75, P = 0.037; B: ICC = 0.91, CI = 0.81-0.96, P < 0.001) meaning the measure was
reliable. There were also strong correlations across day testing for sessions 1, 3 and 5
(ICC = 0.83, CI = 0.70-0.91, P < 0.001), conversely a weak correlation was found
between sessions 2, 4 and 6 (ICC = 0.27, CI = -0.33-0.62, P = 0.15) meaning that
these sessions were not highly reliable.
Lean vs. obese
There was no significant difference in oral fatty acid thresholds found between lean
and overweight/ obese subjects, although obese subjects had higher thresholds (lean:
0.88 ± 0.24 mM, obese: 1.63 ± 0.08 mM, P = 0.326).
Gender
There were also no significant differences in oral fatty acid sensitivity between males
and females (males: 0.81 ± 0.15 mM, females: 1.22 ± 0.10 mM, P = 0.343).
5.5.4 Fat ranking
There were no significant differences between fat ranking scores after the high-fat,
low-fat or macronutrient balanced breakfasts 2 ((2, n = 22) = 2.13, P = 0.345) (HF,
1.95 ± 0.39; LF, 1.84 ± 0.26; B, 2.20 ± 0.45) (Figure 5.2).
Chapter 5 – Study 2
111
Figure 5.2: Differences in scores for the fat ranking task after the high-fat, low-fat
and macronutrient balanced breakfasts
5.5.5 Preferences
There were no significant differences between liking of the regular-fat and low-fat
cream cheese (RF: Wilks’ Lambda = 0.846, F(2, 20) = 1.83, P = 0.187; LF: Wilks’
Lambda = 0.955, F(2, 20) = 0.469, P = 0.632) yoghurt (RF: Wilks’ Lambda = 0.948,
F(2, 20) = 0.548, P = 0.586; LF: Wilks’ Lambda = 0.905, F(2, 20) = 1.05, P = 0.370)
or mousse (RF: Wilks’ Lambda = 0.986, F(2, 20) = 0.143, P = 0.868; LF: Wilks’
Lambda = 0.942, F(2, 20) = 0.650, P = 0.532) after the three breakfast types (Table
5.3).
00.5
11.5
22.5
33.5
44.5
5
High fat Low fat Macronutrientbalanced
Fat r
anki
ng sc
ore
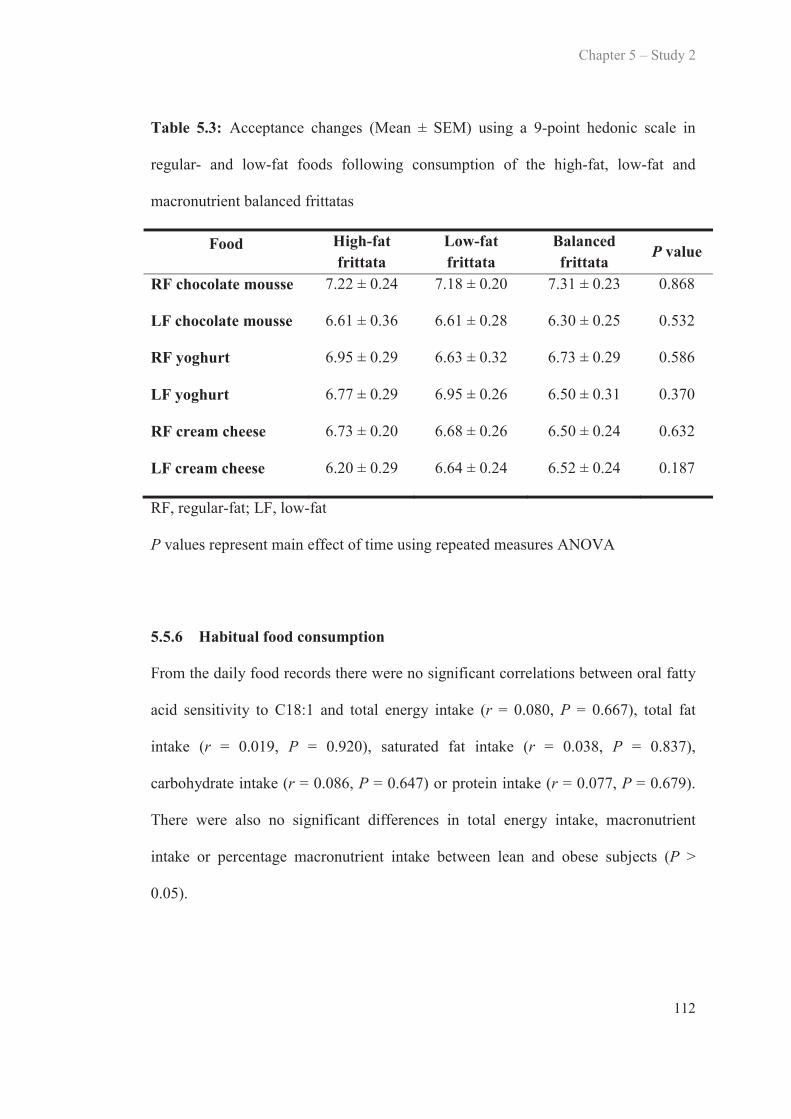
Chapter 5 – Study 2
112
Table 5.3: Acceptance changes (Mean ± SEM) using a 9-point hedonic scale in
regular- and low-fat foods following consumption of the high-fat, low-fat and
macronutrient balanced frittatas
Food High-fat frittata
Low-fat frittata
Balanced frittata
P value
RF chocolate mousse
LF chocolate mousse
RF yoghurt
7.22 ± 0.24
6.61 ± 0.36
6.95 ± 0.29
7.18 ± 0.20
6.61 ± 0.28
6.63 ± 0.32
7.31 ± 0.23
6.30 ± 0.25
6.73 ± 0.29
0.868
0.532
0.586
LF yoghurt 6.77 ± 0.29 6.95 ± 0.26 6.50 ± 0.31 0.370
RF cream cheese 6.73 ± 0.20 6.68 ± 0.26 6.50 ± 0.24 0.632
LF cream cheese 6.20 ± 0.29 6.64 ± 0.24 6.52 ± 0.24 0.187
RF, regular-fat; LF, low-fat
P values represent main effect of time using repeated measures ANOVA
5.5.6 Habitual food consumption
From the daily food records there were no significant correlations between oral fatty
acid sensitivity to C18:1 and total energy intake (r = 0.080, P = 0.667), total fat
intake (r = 0.019, P = 0.920), saturated fat intake (r = 0.038, P = 0.837),
carbohydrate intake (r = 0.086, P = 0.647) or protein intake (r = 0.077, P = 0.679).
There were also no significant differences in total energy intake, macronutrient
intake or percentage macronutrient intake between lean and obese subjects (P >
0.05).
Chapter 5 – Study 2
113
5.5.7 Anthropometry
The mean BMI was 23.2 ± 0.67 kg/m2. There was no significant association between
fatty acid detection thresholds and BMI for C18:1 after any of the breakfasts (HF: r
= 0.303, P = 0.064; LF: r = 0.094, P = 0.611; B: r = 0.288, P = 0.110).
5.6 Discussion
This study demonstrated that there was no significant change to C18:1 detection
thresholds after consumption of a high-fat, low-fat or macronutrient balanced
breakfast. This study also added to the knowledge base of the reliability of the oral
fatty acid threshold measurement with a high test-retest reliability between sessions
and across days found, although a decrease in thresholds from session one to session
two was seen each day. No differences between sessions were found in the ability of
subjects to detect the fat content of custard, or preference for regular- and low-fat
foods.
This study investigated the effect of a high-fat meal immediately prior to C18:1
detection threshold testing. The fact that there were no significant differences found
between testing days and across testing sessions suggests that short-term fat intake
and macronutrient composition does not influence oral fatty acid thresholds.
However, the present study only used one type of food, therefore it cannot be
conclusively stated that there is no effect. How the test food is prepared and the fatty
acid composition may have an effect, thus future research will be needed using
different types of foods prepared in various ways to gain full understanding of this
topic. Whilst unconfirmed at this stage, it may be long-term fat consumption that
Chapter 5 – Study 2
114
modulates oral fatty acid sensitivity. Previous research has shown that a reduction in
dietary fat consumption over as little as a four week period can have significant
positive effects on an individual’s oral sensitivity to fatty acids (Stewart & Keast,
2012). This suggests that prolonged consumption of a low-fat diet may promote
habituation which increases the physiological effects of fat in regards to the
increased release of satiety hormones, and in turn increases sensitivity to fatty acids
and possibly reduces fat intake. However, due to the regular turnover of taste cells
(approximately every 10-14 days) (Farbman, 1980), it could be speculated that for
changes in peripheral physiology to be seen, a low-fat or high-fat diet would need to
be consumed for at least 10-14 days.
Research dating back to the 1950s has investigated the influence of a test meal on
taste thresholds for the primary tastes (Pangborn, 1959). However, there are
conflicting opinions on the matter. Pangborn (1959) reported similar findings to
those found herein in that there were no significant changes in taste thresholds for
sucrose, NaCl, citric acid and caffeine pre- and post-meal (Pangborn, 1959). These
results were found in a subject group of eight and these subjects were trained
panellists. Although the present study did not test oral fatty acid thresholds prior to
the test meal, the fact that there were no significant differences in thresholds after
each test meal suggests that the macronutrient composition of the meal did not affect
oral fatty acid detection thresholds. Similarly, Pasquet et al. (2006) concluded that no
differences were seen in taste thresholds for sucrose, fructose, NaCl, quinine
sulphate, PROP and liquorice after a meal (ad libitum consumption of a standard
dish of sweetened cream) was consumed (Pasquet, et al., 2006), thus backing up the

Chapter 5 – Study 2
115
findings of the present study. In contrast, other studies have found that taste
sensitivity to sweet and salty substances were lower before a meal compared to after
a meal, however no differences were found for bitter substances (Zverev, 2004). The
authors postulate that the differences pre- and post-meal may be due to differential
biological roles of sweet, salty and bitter tastants. Differences between studies may
reflect the design of the studies with some studies testing thresholds before and after
the test meal, while others only testing thresholds after the meal. Differences in the
composition of the meal consumed may explain contrasting results, however this is
difficult to determine as some studies state exactly what subjects consumed (e.g.,
sweetened cream) whilst others describe the meal as a ‘standard lunch in the
university cafeteria’ (Pasquet, et al., 2006; Zverev, 2004). Suchecka et al. (2011)
investigated this hypothesis and measured taste thresholds for sweet, salty and sour
prior to consumption of a high-carbohydrate meal and post-meal (Suchecka, et al.,
2011). It must be noted that while detection thresholds are academically interesting,
some have reported that thresholds have little effect on food sensations and intake,
for example, it has been suggested that thresholds cannot predict intake of salt or
alcohol (Hayes & Keast, 2011; Keast & Roper, 2007). Suchecka et al. (2011) also
reported that there was a sex-dependent effect on taste sensitivity. Sweet taste
perception was not significantly different in females, however a significant decrease
was found for men. Likewise, a significant increase was found for sour taste in
women, but not men. No differences were reported for salty taste pre- and post-meal
(Suchecka, et al., 2011). This study suggests that potentially there is an effect on
taste thresholds when a specific macronutrient rich meal is consumed, nevertheless
these results are not conclusive. These results are different to those reported in the

Chapter 5 – Study 2
116
present study, as no significant changes were found in oral fatty acid sensitivity after
a high-fat meal and there were no differences found between males and females,
however the present study did not test thresholds prior to the test meal. Differences
between studies may be due to differences in study design and perhaps the present
study may have found similar results if thresholds were tested before and after the
test meal. This would seem logical as previous research has found that oral fatty acid
sensitivity can be modulated over a four week period (Stewart & Keast, 2012).
Therefore, it seems that much more research is required in this area to determine a
definitive answer.
Until recently, the reliability of oral fatty acid thresholds was unknown, nevertheless
emerging evidence now exists which shows the test-retest reliability of the fatty acid
threshold measure (Newman & Keast, 2013; Tucker & Mattes, 2013). The present
study contributes further to these findings with strong correlations found both across
testing days for the first threshold measurement and within testing days. However,
the second across day measurements were not strongly correlated. Interestingly,
although there were no significant differences found between sessions one and two
on each testing day, the thresholds for session one were higher than session two
which suggests that perhaps there was a learning effect occurring each day, or a
blunting effect from the meal. This is not a novel finding as Tucker et al. (2013)
found variability in measurement between sessions and proposed that subjects need
to be tested up to seven times over numerous days before a stable threshold measure
can be found (Tucker & Mattes, 2013). However in the present study after the high-
fat meal, 10 out of the 31 subject’s thresholds were higher than their first threshold,

Chapter 5 – Study 2
117
after the low-fat meal, 8 subject’s thresholds were higher and after the balanced meal
10 subject’s thresholds were higher than their first threshold. Therefore, a learning
effect may not have occurred and this is a similar finding to previous work whereby
reliability over numerous sessions was strong (Newman & Keast, 2013). In addition,
this study found high inter-individual variation between subjects and low intra-
individual variability within subjects which is in line with previous findings
(Newman & Keast, 2013; Running, et al., 2013). Fatty acids do not act as a
traditional taste stimuli and there is no apparent lexicon for the taste of fat, therefore
it can be quite difficult for subjects to identify fatty acids as taste stimuli.
Interestingly, some subjects were unable to obtain a threshold measure at
concentrations used in previous research (0.02, 0.06, 1.4, 2.0, 2.8, 3.8, 5.0, 6.4, 8.0,
9.8, 12 mM), thus an additional concentration (20 mM) was used to ensure a
threshold for all subjects was established. Due to the acidic moiety of fatty acids
acting as an irritant, a concentration of 20 mM was chosen as other non-taste cues,
including oral irritation, may impact on detection threshold testing at higher
concentrations and it is not yet clear how to differentiate between irritancy thresholds
and ‘taste’ thresholds (Chale-Rush, et al., 2007b). The addition of this concentration
allowed all subjects to establish an oral fatty acid detection threshold.
The potential relationship between oral fatty acid sensitivity and BMI remains
contentious. The present study found no relationship between oral fatty acid
sensitivity and BMI and no significant differences in thresholds when subjects were
grouped as lean and obese, however there is conflicting evidence with some studies
Chapter 5 – Study 2
118
finding inverse associations (Stewart, et al., 2010; Stewart, Newman, et al., 2011;
Stewart, Seimon, et al., 2011) and others finding no associations at all (Kamphuis,
Saris, et al., 2003; Mattes, 2009d, 2011b; Stewart & Keast, 2012). Studies that found
an association used a brief screening procedure as opposed to a complete detection
threshold procedure which may account for these findings (Stewart, et al., 2010;
Stewart, Newman, et al., 2011). In addition, subjects in these studies were only
measured once and as emerging evidence indicates more than one measure is needed
for accuracy in measurement. The fact that majority of subjects were classified in the
healthy weight range may account for the fact that no associations between oral fatty
acid sensitivity and BMI were found in this study.
5.7 Conclusions
The present study has provided novel data in regards to the effect that a high-fat
meal may have on oral fatty acid sensitivity. This study provides evidence that the
macronutrient composition of the meal immediately prior to threshold testing does
not influence an individual’s oral sensitivity to fatty acids. However, it is important
to note that only one type of food has been tested, thus future research using different
types of foods which have undergone different cooking methods and contain
different ingredients are needed before a definitive statement can be made. In
addition, this study provided confirmatory evidence for the test-retest reliability of
oral fatty acid thresholds. It is suspected that long term changes (a minimum of four
weeks) in dietary behaviour (reduction in fat consumption) would be needed before
changes in oral fatty acid sensitivity would be seen.
Chapter 5 – Study 2
119
5.8 Future directions
In furthering the research into oral fatty acid sensitivity, the next step would be to
examine oral fatty acid thresholds immediately before and after a meal. Exploration
into why the second threshold measure was lower than the first in the present study
is also an area which may warrant further investigation. In addition, evaluation of
environmental and genetic factors which may predispose an individual to attenuated
sensitivity to fatty acids both in the oral cavity and GI tract requires investigation. As
well as determining what time course is needed to see these changes and also
potential changes in preference, as a long-term change in preference will ultimately
lead to long-term changes to dietary consumption.
C H A P T E R S I X
Study 3
The effect of dietary fat consumption and weight loss
on oral fatty acid sensitivity6
6.1 Introduction
Obesity is a worldwide epidemic that causes many deleterious health conditions
including cardiovascular disease, type-2 diabetes, metabolic syndrome and cancer
(World Health Organisation, 2000). Myriad factors are responsible for the obesity
epidemic including environmental, physiological, cultural, socioeconomic and
genetic factors (World Health Organisation, 2000). Environmental influences are of
particular interest as the many changes in food habits and production over the past
century may have aided in the creation of an obesogenic food environment (Cordain,
et al., 2005). Contributing environmental influences directly related to food and
associated with weight gain and obesity include; high energy density, larger portion
size and high appetitive value (Blundell, et al., 2005). Excess fat consumption is a
major cause of excess energy intake and is thus a key contributor to weight gain.
Overconsumption of fat may be due to many factors including preference, appetite,
satiety and availability (Blundell, Lawton, Cotton, & Macdiarmid, 1996). However,
not everyone is susceptible to weight gain and there is a multitude of proposed
explanations (Blundell, et al., 2005). One view suggests that fat intake may be poorly
regulated in the obese population, such that the obese may not be able to control their
consumption of dietary fats and therefore consume excess fat, with evidence now
Chapter 6 – Study 3
121
indicating that dysfunctional detection of fats throughout the alimentary canal may
contribute to this irregularity (Stewart, Seimon, et al., 2011).
Detection of the breakdown products of fats, fatty acids, occurs during ingestion and
digestion in the oral cavity and gastrointestinal (GI) tract by putative fatty acid
receptors including G-protein coupled receptors (GPCR120, GPCR40, GPCR43),
Cluster of Differentiation 36 (CD36) and Delayed Rectifying Potassium (DRK)
channels (Bachmanov & Beauchamp, 2007). Free fatty acids are detected throughout
the alimentary canal, specifically the gustatory system where they contribute to oral
chemoreception and the cephalic response, and the GI system where they influence
gut motility and the hormonal satiety cascade which promotes development of
satiety. In obese individuals, oral and GI detection of fatty acids is attenuated,
possibly predisposing the individual to high intakes of fatty foods, and potentially a
greater energy intake (Stewart, Seimon, et al., 2011).
Oral perception of free fatty acids within the oral cavity has been described by a
wealth of recent evidence (Chale-Rush, et al., 2007a; Gilbertson, 1998; Mattes,
2001b, 2009a, 2009c; Stewart, et al., 2010; Stewart, Newman, et al., 2011). Several
studies that controlled for non-taste cues and olfaction have found that humans can
detect a range of different fatty acids including oleic acid (C18:1), linoleic acid
(C18:2), stearic acid (C18:0), lauric acid (C12:0) and caproic acid (C6:0) (Mattes,
2009a, 2009c, 2009d; Stewart, et al., 2010). The reliability and reproducibility of
fatty acid detection measures has been reported (Newman & Keast, 2013).

Chapter 6 – Study 3
122
Fatty acid sensitivity throughout the oral cavity and GI tract has also been strongly
associated with overweight and obesity (Little & Feinle-Bisset, 2011). During
digestion, fatty acids have a potent effect on the release of satiety hormones
cholecystokinin (CCK), peptide YY (PYY) and glucagon-like peptide-1 (GLP-1).
These hormones act at central and peripheral locations to suppress food intake and
appetite (Feltrin, et al., 2004). The ability to detect fats in the GI tract in obese
individuals has been found to be dysfunctional, suggesting that an attenuated
sensitivity to fats results in a diminished release of satiety hormones, resulting in
excess consumption of energy and increased BMI (Little & Feinle-Bisset, 2011).
Recent research investigating analogous fatty acid sensitivity in the oral cavity and
GI tract, found that following an intra-duodenal infusion of C18:1, obese subjects
experienced an attenuated hormonal response and consumed more energy than lean
individuals (Stewart, Seimon, et al., 2011). In addition, oral fatty acid sensitivity was
lower in obese participants compared to lean participants, highlighting the link
between fat detection in the oral cavity and GI tract (Stewart, Seimon, et al., 2011).
Both animal and human models investigating oral fatty acid sensitivity have found
an inverse relationship between oral sensitivity to fatty acids and fat consumption,
which predisposes insensitive animals to excessive fat consumption and obesity
(Gilbertson, et al., 1998; Stewart, et al., 2010; Stewart & Keast, 2012; Stewart,
Newman, et al., 2011). Similar findings in humans suggest that oral fatty acid
sensitivity could contribute to obesity, with subjects hyposensitive to fatty acids
having higher BMIs than hyposensitive subjects (Kamphuis, Lejeune, Saris, &
Westerterp-Plantenga, 2003). Additionally, Stewart et al. (2011) found a relationship

Chapter 6 – Study 3
123
between fatty acid sensitivity, food intake and food behaviours, with hyposensitive
individuals consuming more high-fat dairy products, fatty red meats and fatty
spreads compared to hypersensitive individuals (Stewart, Newman, et al., 2011).
Hypersensitive subjects also reported more readily engaging in behaviours to reduce
their fat intake including trimming fat from meat and avoiding saturated fats and
were more likely to follow a low-fat and low-sugar diet (Stewart, Newman, et al.,
2011). Importantly, habitual consumption of a high-fat diet may be linked to oral
hyposensitivity to fatty acids, with Stewart el al. (2012) finding that consumption of
a low-fat diet by lean and overweight/ obese individuals increased oral sensitivity to
fatty acids in both groups, however consumption of a high-fat diet decreased oral
sensitivity to fatty acids, but only in the lean group (Stewart & Keast, 2012). These
results suggest habituation to a high-fat diet has occurred in the obese individuals,
potentially causing an adapted reduction in the physiological and psychological
effects of fat that may result in a reduction in oral sensitivity to fats and possibly
promote obesity. Accordingly, individuals who consume less dietary fat and engage
in fat reducing behaviours may be decreasing their susceptibility to adaptation to a
high-fat diet, and therefore these behaviours may influence an individual’s oral
sensitivity to fatty acids or vice versa. However, the direction of this relationship and
the underlying mechanisms are unknown.
To date, there has been no research investigating the potential link between oral fatty
acid sensitivity and weight loss via dietary changes. The current obesity epidemic
reflects an imbalance of energy intake and expenditure. However, not everyone is
susceptible to diet induced weight gain and identifying potential characteristics such
Chapter 6 – Study 3
124
as appetite control and food motivation which may be causal influences, is an
important step in determining how overweight and obesity could be treated and
prevented (Blundell, et al., 2005). Low-fat diets have previously been used as a
successful tool for weight loss in the overweight/ obese group, as have energy
restriction (portion control) diets (Bray, et al., 2004), with weight loss averaging 1.6
g/ day for each 1% decrease in fat intake (Bray, et al., 2004). Hypothetically, lean or
overweight/ obese subjects following a low-fat diet would experience weight loss
and demonstrate increased sensitivity to fatty acids throughout the alimentary canal.
The increased sensitivity to dietary fat may also result in appetitive changes,
whereby smaller amounts of fat would be required to elicit acceptable post-ingestive
effects and satiety responses, which in turn help to maintain long-term fat and energy
intake reduction. Recent unpublished research from our laboratory supports this
proposal, in that fat insensitive subjects were less satiated by a high-fat meal and
consumed more energy at a buffet meal than fat sensitive subjects (Keast, et al.,
2013). These findings further suggest that attenuated fatty acid sensitivity throughout
the alimentary canal is linked to appetitive processes, including satiety, as well as
excess fat consumption and weight gain. Currently, however, it is unclear what
determines or influences sensitivity to fats, the relationship with obesity and whether
it can be affected by weight loss.

Chapter 6 – Study 3
125
6.2 Aim and hypotheses
6.2.1 Aims
To determine the effect of a low-fat weight loss diet (25% total dietary fat) and a
portion control weight loss diet (33% total dietary fat) on oral fatty acid detection
thresholds, the ability to detect the fat content of food and preference for low-fat
foods.
6.2.2 Hypotheses
It is hypothesised that consumption of a low-fat diet for six weeks will decrease an
individual’s fat intake (both grams and percentage), increase oral fatty acid
sensitivity, increase the ability to detect the fat content of foods and increase
preference for low-fat foods compared to consumption of a portion control diet, in
overweight/ obese subjects.
6.3 Subjects, materials and methods
6.3.1 Subjects
A power calculation was conducted to determine an appropriate sample size for the
study. Data were used from a previous Deakin University study (Stewart & Keast,
2012) involving a dietary intervention and measurement of oral fatty acid sensitivity.
In this study, consumption of a low-fat diet for four weeks trended to decrease taste
thresholds for C18:1 (baseline: 4.8 ± 4.4 [range 0.06 – 12] mM; end of intervention:
2.6 ± 2.8 [range: 1 – 12] mM) (Stewart & Keast, 2012). Thus, for the present study
we expected to detect a threshold difference of 2.2 mM C18:1 between the two time
points (baseline and week six). The standard deviation value for fatty acid detection
Chapter 6 – Study 3
126
(2012) -score probability of a Type I error, was set at 1.96 for 95%
-score probability of a Type II error, was set at 1.64 for 90%
confidence. Therefore, 26 people per dietary group were required for the study to
have adequate power. Due to the 15% attrition rate in the Stewart et al. (2012) study,
we conservatively aimed to recruit at least 25% additional participants per dietary
group (resulting in at least 33 participants per group).
Subjects were recruited from the suburbs surrounding Deakin University, Burwood,
Victoria, Australia. To be eligible for the study, subjects had to meet the following
criteria: BMI > 25 kg/m2, non-smoker and 18-75 years of age. Subjects were
excluded if they were pregnant or breast feeding or had a medical condition that
affected their taste or weight loss ability. This study was approved by the Deakin
University Human Research Ethics Committee and registered with the Australian
New Zealand Clinical Trials Registry (ANZCTR trial number:
ACTRN12611000679987) as a clinical trial. Written informed consent was obtained
from all subjects prior to their first testing session.
6.3.2 Study outline
This study was a randomised dietary intervention study involving subjects following
one of two diets: 1) a low-fat diet (< 25% total energy from fat) or 2) a portion
control diet (reduction of energy intake by 25%). All subjects were required to attend
two laboratory sessions throughout the six week period, once at baseline and once at
six weeks. At each session, subjects completed a number of tests which included:
Chapter 6 – Study 3
127
detection threshold tests for C18:1, sucrose and sodium (NaCl) using ascending
forced choice triangle tests; a fat ranking task using custard samples with varying fat
contents; preference ratings for low-fat and regular-fat foods; and anthropometric
measures including height, weight and waist and hip circumference. Subjects were
also required to complete a one-day diet record on a weekly basis to establish
habitual intake and compliance, a food frequency questionnaire to validate habitual
intake, and a Community Healthy Activities Model Program for Seniors (CHAMPS)
physical activity questionnaire at baseline and week six.
6.3.3 Low-fat diet
This diet was designed to reduce the consumption of full fat dairy products, fatty red
meats, baked products, high-fat spreads and overall kilojoule intake and aimed to
have subjects consuming 25% total energy from fat each day (outlined in more detail
in Chapter 3). Dietary counselling was overseen by the coordinating dietitian (S.T.)
and provided by trained research staff. Subjects were given a 30-45 minute face-to-
face counselling session at baseline and a booklet which contained all of the
information needed to follow the diet (Appendix I). Subjects were instructed to
consume at least 5 portions of vegetables and 2 portions of fruit per day, as well as 3
portions of low-fat dairy per day, 1-2 portions of meat and fish per day, a maximum
of 3 portions of fats per day and a maximum of 5 portions of breads and cereals per
day (portion sizes are outlined in Chapter 3). A list of snack food ideas, tips for
reducing kilojoule intake from day to day, tips for dining outside of the home and
how to read food labels were also provided. As alternatives to high-fat spreads and
snack foods, subjects were given low fat margarine, four packets of low fat crackers
Chapter 6 – Study 3
128
and one packet of popcorn kernels to assist with compliance. Subjects were also
contacted by phone on a weekly basis to answer any questions that may have arisen
and to keep subjects motivated and accountable.
6.3.4 Portion control diet
The portion control diet was designed to decrease subjects’ energy intake by 25%,
but consume the same percentage of energy from fat (33% total fat) (Table 6.1) and
was based on the Australian government campaign, ‘Swap it, don’t stop it’ (2012).
Subjects were instructed to reduce their usual food intake (Chapter 3). Subjects also
received a 30-minute one-on-one counselling session with trained research staff to
explain how to reduce their energy intake by 25% (i.e., how to reduce the amount of
food on their plate at dinner time, but keep the same proportion of each food
component). Participants were given a list of instructions to help reduce portions: 1)
use a smaller plate to make small amounts of food seem larger; 2) eat mindfully by
taking time to chew food properly and eat slowly (Smit, et al., 2011); 3) avoid
distractions such as watching television or reading, which can distract you from
noticing when you are full; 4) follow the 80 percent rule to stop eating before you are
completely full ("Sizing up food portions," 2010) (Appendix J). Subjects were given
a small, appetiser sized plate (23 cm) for all meals, as studies indicate subjects are
eat less when using smaller plates (Laddu, et al., 2011; Pedersen, et al., 2007;
"Sizing up food portions," 2010). As with the low-fat diet group, weekly calls were
made to those following the portion control diet to answer any underlying questions
and to keep subjects motivated.

Chapter 6 – Study 3
129
Table 6.1: The intended macronutrient profile of the low-fat and portion control diet
groups
Low-fat group* Portion control group**
Total energy intake (kJ) 6760 kJ 6827 kJ
Percentage energy from fat 25% 33%
Percentage energy from carbohydrates 53% 45%
Percentage energy from proteins 18% 18%
Percentage energy from alcohol 4% 4%
* Based on meal plan developed by researchers
** Based on a 25% reduction of the average Australian intake for adult males and
females aged from 25-64 years (National Health and Medical Research Council,
2006)
6.3.5 Anthropometry
Body weight (kg) was measured at baseline and week six with light, loose clothing
and shoes removed. Height (m) was measured without shoes at baseline and week
six using a portable stadiometer. Body mass index (BMI; weight (kg)/ height (m2))
was then calculated from these values and subjects were
2 2 (Harris, et al., 2008). Each subject’s waist
and hip circumference was also measured at baseline and week six according to the
methods described by Gibson (2005).

Chapter 6 – Study 3
130
6.3.6 Food consumption and dietary compliance
Each subject completed a one-day food record at baseline and weeks two, three, four
and six, reporting all foods and drinks consumed in household measures. Subjects
were asked to, where possible, weigh the foods they consumed (subjects used their
own scales), use standard metric measuring cups, or common serving sizes (Chapter
3). The one-day food records were analysed using the AUSNUT 2007 food
composition database and FoodWorks 2009 software (Xyris software, Highgate Hill,
Queensland, Australia). From these data, the mean energy intake (kJ), macronutrient
distribution (% energy from fat, protein and carbohydrate, and grams of fat, protein
and carbohydrate), type of fat (grams and % of monounsaturated, polyunsaturated or
saturated), amount of sodium (mg), and amount of alcohol (g) consumed were
calculated.
6.3.7 Diet questionnaires
Subjects were also required to complete a food frequency questionnaire (Appendix
G) that recorded how frequently they consumed common foods identified in the
1995 Australian National Nutrition Survey (Australian Bureau of Statistics, 1995). In
total, 120 food items were assessed including foods from these categories: dairy
products; bread and cereals; meat, fish and eggs; other offal; sweets, baked goods
and snacks; dressings; non-dairy beverages; vegetables; fruits; and vitamin and
mineral supplements. Subjects were asked how often they consumed these items and
could answer on a scale ranging from ‘never or less than once a month’ to ‘six or
more times per day’ (more detail can be found in Chapter 3). Each frequency
category was converted into a daily equivalent value, for example, ‘never, or less

Chapter 6 – Study 3
131
than once a month’ = 0.02, ‘one to three times per month’ = 0.07, ‘once per week’ =
0.1, ‘two to four times per week’ = 0.4, ‘five to six times per week’ = 0.8, ‘once per
day’ = 1.0, ‘two to three times per day’ = 2.5, ‘four to five times per day’ = 4.5 and
‘six plus times per day’ = 6. The foods were then categorised into the following
specific food groups red meat; poultry; processed meat; organ meat; fish, seafood;
refined grains; whole grains; eggs; high-fat dairy; low-fat dairy; soy; liquor spirits;
wine; beer; hot drinks; fruit; leafy vegetables; cruciferous vegetables; other
vegetables; tomatoes; peas and legumes; nuts; potatoes; high-fat take away foods;
fried foods; snacks; desserts and biscuits; chocolate and sweets; sugar sweetened
beverages; low-energy beverages; condiments; and salad dressing.
6.3.8 Physical activity
As part of a healthy lifestyle change, all subjects were required to participate in a
minimum of 30 minutes of moderate intensity physical activity on all or most days
of the week (Sims, et al., 2010). Information was provided to subjects on how to
calculate their maximum heart rate (220 – age (years)) and subjects were asked to
workout at a level where their heart rate was 60-70% of their maximum heart rate.
This level was considered moderate intensity and subjects were advised to exercise
at this level for the full 30 minutes. The amount of exercise completed was measured
at baseline and week six using the CHAMPS questionnaire (Stewart, et al., 2001)
and this information was used to calculate the average hours per week of physical
activity across the intervention period for each subject (Appendix K).

Chapter 6 – Study 3
132
6.3.9 C18:1 solutions
Food grade C18:1 was stored in nitrogen below 4°C. C18:1 was added to long-life
non-fat milk at varying concentrations (0.02, 0.06, 1, 1.4, 2, 2.8, 3.8, 5, 6.4, 8, 9.8,
12 and 20 mM) (Chapter 3). To minimise textural differences imparted by C18:1,
all samples were mixed with 5% gum acacia and liquid paraffin. To prevent
oxidation of C18:1, 0.01% w/v ethylenediaminetetraacetic acid (EDTA) was added
to all samples. A stable emulsion was created by first mixing the milk and gum
together, then adding it to the paraffin and fatty acid mixture. Samples were
homogenised at 12 000 rpm for 30 sec/ 100 ml. All samples were freshly prepared
each day of testing. Control samples were prepared in the same way, with the fatty
acid omitted.
6.3.10 C18:1 detection thresholds
Oral fatty acid sensitivity was determined via detection thresholds, using triangle
tests with ascending forced choice methodology. Subjects were presented with three
samples, two control and one containing C18:1 in an ascending concentration order
from the lowest (0.02 mM) to the highest (20 mM) concentration. (Newman &
Keast, 2013; Stewart, et al., 2010). Detection thresholds for each fatty acid were
defined as the concentration at which the subject correctly picked the odd sample in
three consecutive sample sets. To minimise confounding factors from non-taste
sensory inputs, all testing was performed under red lighting and nose clips were
worn at all times. Subjects were also instructed to taste the samples and then spit
them out. Subjects were required to refrain from eating and drinking (water was
allowed) one hour prior to testing.
Chapter 6 – Study 3
133
6.3.11 Sucrose and NaCl solutions and detection thresholds
Solutions were prepared in accordance with the International Organisation for
Standardisation (Chapter 3). The eight different concentrations of each tastant
(sucrose and NaCl) were then prepared according to concentrations in Table 3.1.
Distilled water was used as the control sample in threshold determinations. Testing
for sucrose and NaCl thresholds was conducted in the same way that C18:1
thresholds were measured (triangle tests with ascending forced choice methodology).
6.3.12 Fat ranking task
For this task, subjects were provided with custard samples made with (0, 2, 6 or
10%) canola oil (Chapter 3). Custard was made from 20 g custard powder, 12 g
sugar and 500 ml non-fat milk. The custard was separated into four batches and
canola oil was added to three of the batches to create custards containing 2%, 6% or
10% fat. No oil was added to one custard batch to create the 0% sample. All batches
of the custard were sensory matched with paraffin oil to contain 10% oil. Subjects
were asked to rank the four custard samples in order of perceived fattiness. All
subjects received a score out of five for this task (Table 3.2).
6.3.13 Hedonic ratings
Subjects completed a preference test with three sets of regular-fat (RF) and low-fat
(LF) foods. Subjects were given a variety of different foods including cream cheese
(RF: Philadelphia Spreadable Cream Cheese Original; LF: Philadelphia Spreadable
Cream Cheese Extra Light, Kraft Foods Limited, South Wharf, Victoria, Australia),
vanilla yoghurt (RF: Yoplait Creamy Original Vanilla yoghurt; LF: Yoplait Creamy
Chapter 6 – Study 3
134
Lite Vanilla yoghurt, National Foods, Docklands, Victoria, Australia) and chocolate
mousse (RF: Nestle Chocolate Mousse; LF: Nestle Diet Chocolate Mousse, Nestle,
Fonterra Brands, Auckland, New Zealand) (Chapter 3). Liking was measured on a
9-point hedonic scale ranging from ‘dislike extremely’ to ‘like extremely’. Subjects
were asked to taste both samples and rate their liking of each one.
6.3.14 Tongue papillae photography
Before tongue photographs were taken, subjects were asked to rinse their mouths
thoroughly with deionised water. They were then asked to sit with their elbows on
the photography bench and their hands held together in a ‘V’ formation, supporting
their chin and keeping their head still (Chapter 3). Subjects were asked to protrude
their tongue and use their lips to keep it steady, and the camera was then lined up
with the participant’s tongue. The tongue was dried using filter paper and diluted
blue food dye was applied to the left of the midline of the tongue using a cotton bud.
The tongue was again dried with filter paper to remove excess dye, and a square
piece of filter paper (10 mm x 10 mm) with a 6 mm diameter hole in the centre was
placed on the tip of the tongue over the dyed area. Three macro photographs were
then taken of the subject’s tongue. The photos were analysed using Adobe
Photoshop version CS5.1 (Adobe Systems Inc., San Jose, CA, USA) to count the
fungiform papillae. The fungiform papillae were identified as the structures that were
stained in a very light shade of blue. When papillae were hard to distinguish or
difficult to confirm, the zoom function in Adobe Photoshop was used to magnify the
image (Chapter 3).

Chapter 6 – Study 3
135
6.3.15 6-n-propylthiouracil (PROP) sensitivity
PROP paper strips were prepared according to methods outlined in Chapter 3.
Subjects were presented with a piece of filter paper which contained the PROP
solution and asked to place it on the centre of their tongue until it was soaked with
saliva. Following this, subjects were asked to rate the perceived intensity of the
bitterness of the PROP using a general Labelled Magnitude Scale (gLMS). The
gLMS has descriptors placed at varying positions which range from ‘strongest
imaginable’ to ‘barely detectable’ (Appendix C). Subjects were briefly trained in the
use of this scale and told that ‘strongest imaginable’ sensation was the pain caused if
a dentist drilled a hole in your tooth without any anesthetic, and ‘barely detectable’
was tastes like paper.
6.4 Statistical analysis
Data were analysed using SPSS version 21 (SPSS Inc., Chicago, IL, USA).
Repeated-measures analysis of variance (ANOVA) was used to analyse changes in
C18:1, sucrose and NaCl oral detection thresholds; hedonic ratings for regular-fat
and low-fat foods; anthropometric measurements; tongue papillae numbers and
dietary intake from baseline to week six with time-point as within-subject factors and
dietary intervention (low fat or portion control) as between-subject factors. Wilcoxon
Signed-Rank tests were used to detect differences in fat ranking scores from baseline
to week six, and Mann-Whitney U tests were used for between-group analyses.
Bonferroni corrected paired t-tests were used to establish differences in answers to
dietary questionnaires from baseline to week six. All values are stated as mean ±
SEM.
Chapter 6 – Study 3
136
6.5 Results
6.5.1 Subjects
Of the 105 overweight/ obese men and women who attended a screening visit, 8
were ineligible due to health concerns (5 subjects) or food allergies (3 subjects). Of
the 97 who were eligible for the study, 25 decided not to participate prior to
commencement of testing (6 – work commitments, 6 – health problems, 3 – personal
reasons, 10 – no reason). Seventy-two subjects were randomised into one of the two
dietary interventions (36 in the low-fat (LF) group and 36 in the portion control (PC)
group). After randomisation, a further eight subjects withdrew due to work
commitments and compliance issues (LF – 5, PC – 3). Visual inspection of box plots
identified a further 11 subjects as being three standard deviations away from the
mean for total energy (kJ), total fat (g) and percentage energy from fat, and were
excluded from final analysis. These subjects were removed as their dietary data was
viewed as non-compliant and inaccurate due to the fact that they had consumed far
less kilojoules than required for their basal metabolic rate (BMR). For example,
some subjects had reported consuming 1500 kJ for a whole day, therefore these
subjects were removed, which normal practise in dietary studies. In total, 53 subjects
(LF – 26, PC – 27) completed the study. Participants were on average middle aged
and overweight or 25 kg/m2), with waist-
puts them at a substantially increased risk of metabolic complications (Nishida, Ko,
& Kumanyika, 2010). There were no significant differences between the groups at
baseline for any of the measures (Table 6.2).
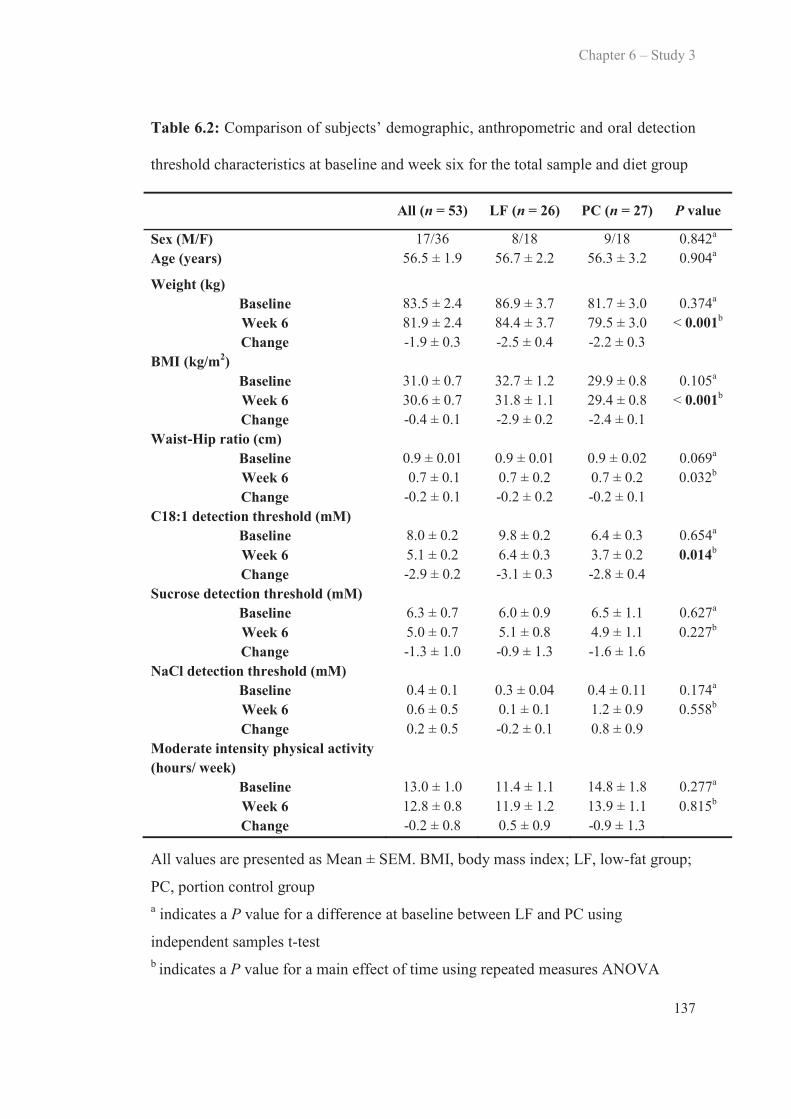
Chapter 6 – Study 3
137
Table 6.2: Comparison of subjects’ demographic, anthropometric and oral detection
threshold characteristics at baseline and week six for the total sample and diet group
All (n = 53) LF (n = 26) PC (n = 27) P value
Sex (M/F)Age (years)
17/3656.5 ± 1.9
8/1856.7 ± 2.2
9/1856.3 ± 3.2
0.842a
0.904a
Weight (kg)BaselineWeek 6Change
83.5 ± 2.481.9 ± 2.4-1.9 ± 0.3
86.9 ± 3.784.4 ± 3.7-2.5 ± 0.4
81.7 ± 3.079.5 ± 3.0-2.2 ± 0.3
0.374a
< 0.001b
BMI (kg/m2)BaselineWeek 6Change
31.0 ± 0.730.6 ± 0.7-0.4 ± 0.1
32.7 ± 1.231.8 ± 1.1-2.9 ± 0.2
29.9 ± 0.829.4 ± 0.8-2.4 ± 0.1
0.105a
< 0.001b
Waist-Hip ratio (cm)BaselineWeek 6Change
C18:1 detection threshold (mM)BaselineWeek 6Change
Sucrose detection threshold (mM)BaselineWeek 6Change
NaCl detection threshold (mM)BaselineWeek 6Change
Moderate intensity physical activity (hours/ week)
BaselineWeek 6Change
0.9 ± 0.010.7 ± 0.1
-0.2 ± 0.1
8.0 ± 0.25.1 ± 0.2-2.9 ± 0.2
6.3 ± 0.75.0 ± 0.7-1.3 ± 1.0
0.4 ± 0.10.6 ± 0.50.2 ± 0.5
13.0 ± 1.012.8 ± 0.8-0.2 ± 0.8
0.9 ± 0.010.7 ± 0.2-0.2 ± 0.2
9.8 ± 0.26.4 ± 0.3-3.1 ± 0.3
6.0 ± 0.95.1 ± 0.8-0.9 ± 1.3
0.3 ± 0.040.1 ± 0.1-0.2 ± 0.1
11.4 ± 1.111.9 ± 1.20.5 ± 0.9
0.9 ± 0.020.7 ± 0.2-0.2 ± 0.1
6.4 ± 0.3 3.7 ± 0.2-2.8 ± 0.4
6.5 ± 1.14.9 ± 1.1-1.6 ± 1.6
0.4 ± 0.111.2 ± 0.90.8 ± 0.9
14.8 ± 1.813.9 ± 1.1-0.9 ± 1.3
0.069a
0.032b
0.654a
0.014b
0.627a
0.227b
0.174a
0.558b
0.277a
0.815b
All values are presented as Mean ± SEM. BMI, body mass index; LF, low-fat group;
PC, portion control groupa indicates a P value for a difference at baseline between LF and PC using
independent samples t-testb indicates a P value for a main effect of time using repeated measures ANOVA
Chapter 6 – Study 3
138
6.5.2 Anthropometry
Weight
Consumption of both the low-fat and portion control diets resulted in a significant
reduction in weight from baseline to week six (main effect of time: Wilks’ Lambda =
0.479, F(1, 47) = 51.2, P < 0.001) and a significant group by time interaction
(time*group interaction: Wilks’ Lambda = 0.900, F(1, 47) = 5.22, P = 0.027). No
significant differences between groups were observed (main effect of group: F(1, 47)
= 1.29, P = 0.262), meaning that there was a mean decrease in weight during the
intervention and there was no difference in weight loss between diets. Nine out of
the 53 subjects did not lose weight, but the amount of weight gained was less than 1
kg. However, the portion control group weighed less at baseline than the low-fat
group, which may explain the significant interaction effect. The weight of the two
groups did not differ at week six (P = 0.391) (Table 6.2).
BMI
Consumption of both diets resulted in a significant decrease in BMI from baseline to
week six (main effect of time: Wilks’ Lambda = 0.528, F(1, 47) = 42.1, P < 0.001)
and a significant group by time interaction was observed (time*group interaction:
Wilks’ Lambda = 0.894, F(1, 47) = 5.58, P = 0.022). However, there were no
between group effects (main effect of group: F(1, 47) = 3.46, P = 0.069) (Figure 6.1
A), meaning that there was a mean reduction in BMI regardless of their allocated
diet.
Chapter 6 – Study 3
139
Waist and hip circumference and waist-hip ratio
Waist circumference was significantly reduced from baseline to week six (main
effect of time: Wilks’ Lambda = 0.566, F(1, 47) = 36.0, P < 0.001), as was hip
circumference in both groups (main effect of time: Wilks’ Lambda = 0.521, F(1, 47)
= 43.3, P < 0.001), however there were no significant changes between groups (main
effect of group: F(1, 47) = 0.304, P = 0.584; F(1, 47) = 1.37, P = 0.247; waist and
hip circumference, respectively) or interactions between time and group (time*group
interaction: Wilks’ Lambda = 1.00, F(1, 47) = 0.014, P = 0.906; Wilks’ Lambda =
0.973, F(1, 47) = 1.29, P = 0.263; waist and hip circumference, respectively). In
comparison to baseline, waist-hip ratio at week six was significantly reduced (main
effect of time: Wilks’ Lambda = 0.913, F(1, 51) = 4.87, P = 0.032), however no
significant changes were seen between groups (main effect of group: F(1, 51) =
0.007, P = 0.934) and there were no interactions between time and group
(time*group interaction: Wilks’ Lambda = 1.00, F(1, 51) = 0.001, P = 0.984) (Table
6.2), meaning that all subjects reduced their waist-hip ratio regardless of what diet
they were following.
6.5.3 Dietary compliance
Average intakes of total energy (kJ), fat, saturated fat, carbohydrate and protein (g),
as well as comparative (%) macronutrient distributions from the one day food
records for both groups are reported in Table 6.3. At baseline, the two dietary groups
did not differ in total energy intake or macronutrient intake (Table 6.3).

Chapter 6 – Study 3
140
Table 6.3: Mean ± SEM macronutrient intakes for the low-fat and portion control
diet groups at baseline and week six
LF (n = 26) PC (n = 27) P valueTotal energy (kJ/ day)
Baseline 7150.8 ± 384.5 7262.3 ± 500.6 0.204a
Week 6 6166.4 ± 209.7 5693.6 ± 250.2 0.001b
Change -984.4 ± 373.9 -1568.6 ± 614.4Total fat (g/ day)
Baseline 64.1 ± 5.2 64.4 ± 5.1 0.895a
Week 6 41.4 ± 2.6 47.5 ± 3.2 < 0.001b
Change -22.7 ± 5.8 -16.8 ± 6.5Total carbohydrates (g/ day)
Baseline 185.8 ± 9.9 171.7 ± 16.2 0.659a
Week 6 182.9 ± 7.1 148.2 ± 7.4 0.190b
Change -2.9 ± 10.5 -23.5 ± 17.3Total protein (g/ day)
Baseline 77.8 ± 5.5 89.0 ± 5.4 0.177a
Week 6 75.3 ± 2.5 72.6 ± 4.1 0.031b
Change -2.54 ± 5.3 -16.4 ± 8.4Percentage energy from fat (%/ day)
Baseline 33.1 ± 1.7 32.9 ± 1.3 0.186a
Week 6 24.9 ± 1.04 29.2 ± 1.0 < 0.001b
Change -8.2 ± 2.0 -3.9 ± 1.5Percentage energy from carbohydrates (%/ day)
Baseline 39.5 ± 1.7 34.9 ± 1.5 0.362a
Week 6 45.6 ± 1.3 41.6 ± 1.4 < 0.001b
Change 6.1 ± 1.9 6.7 ± 1.2Percentage energy from protein (%/ day)
Baseline 18.6 ± 1.0 22.6 ± 0.7 0.444a
Week 6 21.5 ± 0.7 21.7 ± 0.9 0.204b
Change 2.9 ± 1.0 -0.8 ± 1.3
All values are presented as Mean ± SEM. LF, low-fat group; PC, portion control
group; kJ, kilojoule; g, gramsa indicates P value for a difference between groups at baseline using independent
samples t-testsb indicates P value for a main effect of time using repeated measures ANOVA
Chapter 6 – Study 3
141
Total energy (kJ) and fat (g) intake and percentage energy from fat
Between baseline and week six, both groups decreased their total energy intake
(main effect of time: Wilks’ Lambda = 0.762, F(1, 42) = 13.1, P < 0.001), total fat
intake (g) (main effect of time: Wilks’ Lambda = 0.671, F(1, 42) = 20.6, P < 0.001)
and percentage of energy derived from fat (main effect of time: Wilks’ Lambda =
0.676, F(1, 42) = 21.1, P < 0.001) (Table 6.3). Total energy intake, fat intake and fat
percentage did not differ between the two diets (main effect of group: F(1, 42) =
0.18, P = 0.676; F(1, 42) = 0.476, P = 0.494; F(1, 42) = 2.12, P = 0.146; total
energy, fat, fat percentage, respectively) (Figure 6.1 B, C, D). There were no time
by group interactions for these changes (time*group interaction: Wilks’ Lambda =
0.984, F(1, 42) = 0.686, P = 0.412; Wilks’ Lambda = 0.989, F(1, 42) = 0.454, P =
0.504; total energy, fat, respectively), however there was a trend for the groups to
differ in percentage energy from fat (Wilks’ Lambda = 0.921, F(1, 42) = 3.79, P =
0.058).
Total carbohydrate (g) intake and percentage energy from carbohydrate
There were no significant differences between groups, changes over time or group
by time interactions for total carbohydrate intake (main effect of time: Wilks’
Lambda = 0.960, F(1, 42) = 1.77, P = 0.190, main effect of group: F(1, 42) = 3.28, P
= 0.077, time*group interaction: Wilks’ Lambda = 0.975, F(1, 42) = 1.08, P = 0.306)
(Table 6.3), indicating carbohydrate intake remained the same for all subjects
regardless of the assigned diet. Percentage energy from carbohydrates was
significantly increased in both diet groups from baseline to week six (main effect of
time: Wilks’ Lambda = 0.561, F(1, 42) = 32.9, P < 0.001) and this change was also
Chapter 6 – Study 3
142
seen overall between groups (main effect of group: F(1, 42) = 4.79, P = 0.034).
There were no group by time interactions (time*group interaction: Wilks’ Lambda =
0.998, F(1, 42) = 0.078, P = 0.782) (Figure 6.1 E, F), thus all subjects increased the
percentage of carbohydrates consumed and there were no differences depending on
diet type.
Total protein (g) intake and percentage energy from protein
Total protein intake significantly decreased in the low-fat diet and portion control
diet groups (main effect of time: Wilks’ Lambda = 0.894, F(1, 42) = 4.96, P = 0.031)
(Table 6.3). However, these changes did not differ significantly overall between
groups (main effect of group: F(1, 42) = 1.15, P = 0.290) and there was no group by
time interaction (time*group interaction: Wilks’ Lambda = 0.935, F(1, 42) = 2.91, P
= 0.095). Therefore, all subjects reduced their total protein intake and this did not
depend on what diet was consumed. Similarly, for percentage energy from protein,
there was no significant effect of time from baseline to week six (main effect of
time: Wilks’ Lambda = 0.962, F(1, 42) = 1.66, P = 0.204) or overall between group
differences (main effect of group: F(1, 42) = 3.39, P = 0.073), however a significant
interaction between time by group was observed (time*group interaction: Wilks’
Lambda = 0.885, F(1, 42) = 5.44, P = 0.025) (Figure 6.1 G, H). Thus, there were no
differences in percentage of protein consumed between the diets, although an
interaction effect may have occurred as the low-fat group had lower percentage
protein consumption at baseline.

Chapter 6 – Study 3
143
Sugar (g) and sodium (mg) intake
There were no significant differences over time or group by time interactions for
sugar intake (main effect of time: Wilks’ Lambda = 0.988, F(1, 51) = 0.598, P =
0.443, time*group interaction: Wilks’ Lambda = 0.960, F(1, 51) = 2.11, P = 0.152).
However, there was a significant difference between groups (main effect of group:
F(1, 51) = 7.58, P = 0.008). There were no significant differences between groups,
changes over time or group by time interactions for sodium consumption (main
effect of time: Wilks’ Lambda = 0.932, F(1, 51) = 3.73, P = 0.059, main effect of
group: F(1, 51) = 0.290, P = 0.592, time*group interaction: Wilks’ Lambda = 0.997,
F(1, 51) = 0.178, P = 0.674), indicating that sodium intake remained the same for all
subjects regardless of the assigned diet.
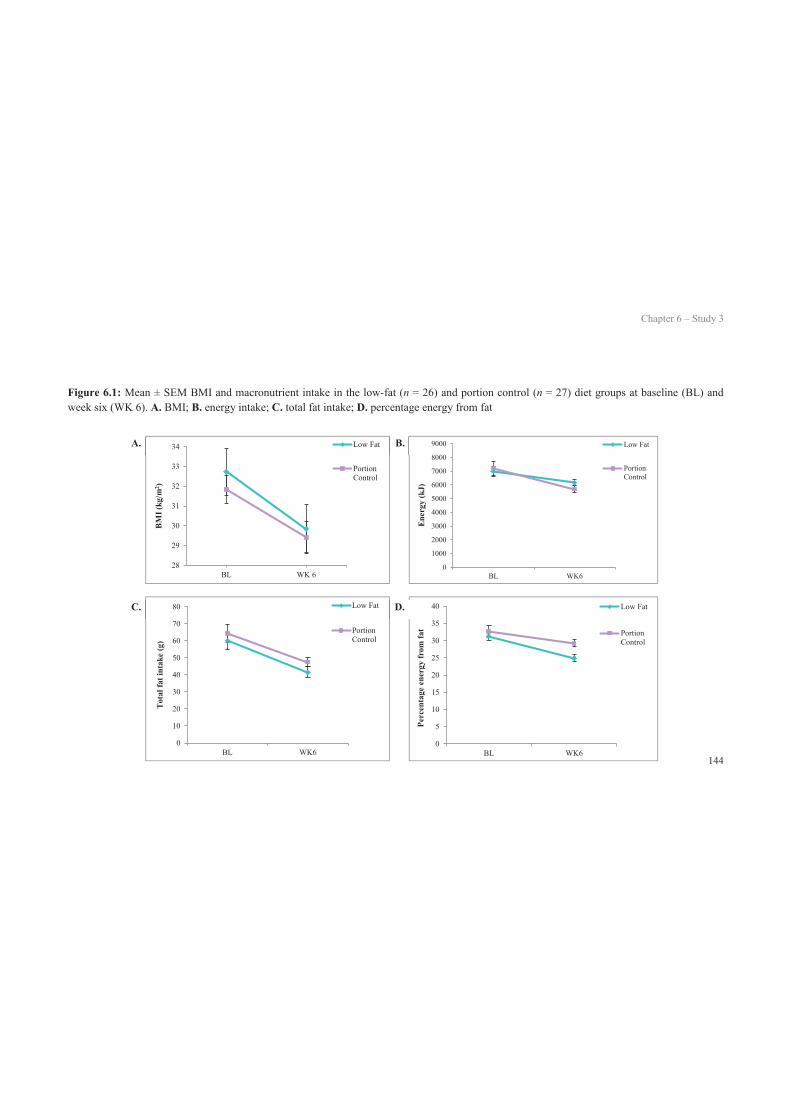
Chapter 6 – Study 3
144
Figure 6.1: Mean ± SEM BMI and macronutrient intake in the low-fat (n = 26) and portion control (n = 27) diet groups at baseline (BL) and week six (WK 6). A. BMI; B. energy intake; C. total fat intake; D. percentage energy from fat
0
1000
2000
3000
4000
5000
6000
7000
8000
9000
BL WK6
Ene
rgy
(kJ)
Low Fat
PortionControl
0
10
20
30
40
50
60
70
80
BL WK6
Tot
al fa
t int
ake
(g)
Low Fat
PortionControl
0
5
10
15
20
25
30
35
40
BL WK6
Perc
enta
ge e
nerg
y fr
om fa
t
Low Fat
PortionControl
28
29
30
31
32
33
34
BL WK 6
BM
I (kg
/m2 )
Low Fat
PortionControl
A. B.
D.C.
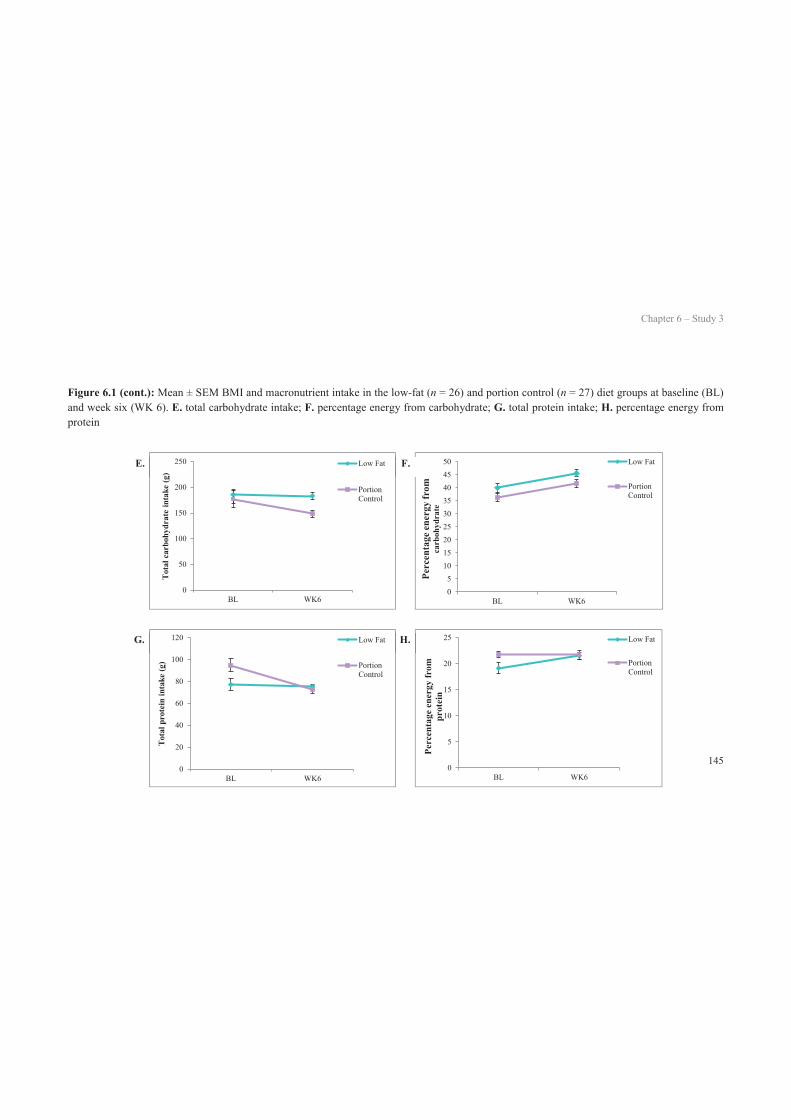
Chapter 6 – Study 3
145
Figure 6.1 (cont.): Mean ± SEM BMI and macronutrient intake in the low-fat (n = 26) and portion control (n = 27) diet groups at baseline (BL) and week six (WK 6). E. total carbohydrate intake; F. percentage energy from carbohydrate; G. total protein intake; H. percentage energy fromprotein
0
50
100
150
200
250
BL WK6
Tot
al c
arbo
hydr
ate
inta
ke (g
)
Low Fat
PortionControl
05
101520253035404550
BL WK6
Perc
enta
ge e
nerg
y fr
om
carb
ohyd
rate
Low Fat
PortionControl
0
20
40
60
80
100
120
BL WK6
Tot
al p
rote
in in
take
(g)
Low Fat
PortionControl
0
5
10
15
20
25
BL WK6
Perc
enta
ge e
nerg
y fr
om
prot
ein
Low Fat
PortionControl
E.
H.G.
F.
Chapter 6 – Study 3
146
6.5.4 Dietary questionnaires
Low-fat diet. During the intervention, the low-fat diet group significantly reduced
their consumption of processed meat (P = 0.044), eggs (P = 0.018), dairy (P =
0.038), fried foods (P = 0.008), desserts (P = 0.052) and condiments (P = 0.030).
Additionally, refined grains (P = 0.038) and leafy vegetables (P < 0.001) were
consumed more frequently compared to at baseline.
Portion control diet. Subjects in the portion control diet group did not change their
consumption of dairy, leafy vegetables, fried foods, desserts or condiments during
the intervention, however there was a significant reduction in the frequency that
processed meat (P = 0.032), eggs (P = 0.021) and chocolate (P = 0.028) were
consumed.
The low-fat and portion control diet groups significantly differed in their
consumption of eggs (P = 0.050), leafy vegetables (P = 0.007), other vegetables (P =
0.011) and fried foods (P = 0.043) during the intervention, with the low-fat diet
group consuming eggs (LF: 0.08 times/ day, PC: 0.16 times/ day) and fried foods
(LF: 0.08 times/ day, PC: 0.14 times/ day) on fewer occasions, and leafy vegetables
(LF: 5.95 times/ day, PC: 4.48 times/ day) and other vegetables (LF: 3.87 times/ day,
PC: 2.49 times/ day) on more occasions than the portion control group.
6.5.5 Physical activity
Physical activity levels did not differ at baseline between the low-fat diet group and
the portion control group (P = 0.227). Subjects on either diet did not change their
Chapter 6 – Study 3
147
physical activity levels during the study (main effect of time: Wilks’ Lambda =
0.999, F(1, 44) = 0.056, P = 0.815). No significant differences were seen between
groups (main effect of group: F(1,47) = 2.26, P = 0.140) and no significant time by
group interaction was observed (time*group interaction: Wilks’ Lambda = 0.984,
F(1, 44) = 0.700, P = 0.407) (LF: BL, 11.41 ± 1.07 hr, WK6, 11.88 ± 1.19 hr; PC:
BL, 14.77 ± 1.78 hr, PC, 13.95 ± 1.14 hr) from baseline to week six.
6.5.6 C18:1 detection thresholds
C18:1 taste thresholds did not differ between the two diet groups at baseline (P =
0.654) (Table 6.2). Consumption of the low-fat and portion control diets over the
six-week period significantly decreased C18:1 thresholds (LF: BL, 9.78 ± 0.24 mM,
WK6, 6.71 ± 0.28 mM; PC: BL, 6.44 ± 0.28 mM, WK6, 3.65 ± 0.22 mM; main
effect of time: Wilks’ Lambda = 0.875, F(1, 46) = 6.58, P = 0.014), and there were
no significant changes between groups (main effect of group: F(1, 46) = 3.71, P =
0.060) or interactions between time and group (time*group interaction: Wilks’
Lambda = 0.999, F(1, 46) = 0.039, P = 0.845) (Figure 6.2). Therefore, oral detection
thresholds for C18:1 decreased in all subjects independent of the allocated diet.
There were no correlations between baseline oral fatty acid sensitivity and energy
intake (BL: r = 0.129, P = 0.363; WK6: r = 0.066, P = 0.636), total fat intake (BL: r
= 0.014, P = 0.922; WK6: r = -0.080, P = 0.604) or percentage energy from fat (BL:
r = -0.135, P = 0.340; WK6: r = -0.068, P = 0.652) at baseline or week six. There
were also no correlations between oral fatty acid sensitivity at week six and energy
intake (BL: r = 0.248, P = 0.089; WK6: r = 0.268, P = 0.065), total fat intake (BL: r
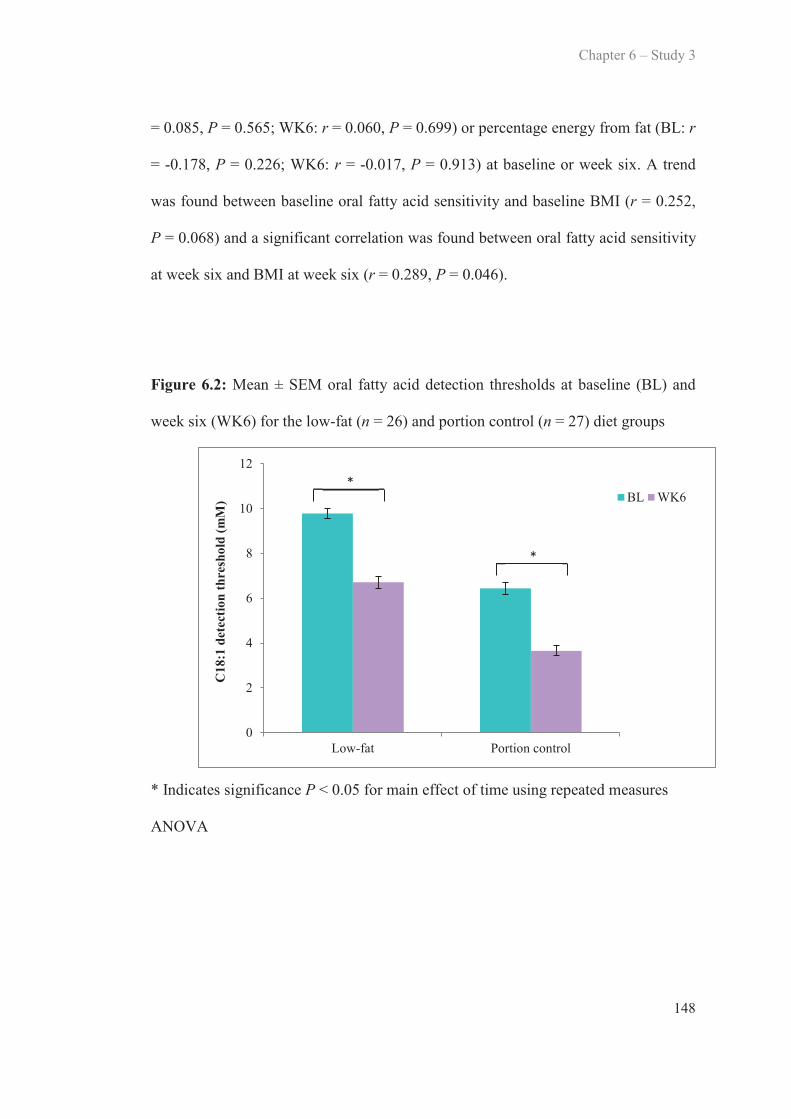
Chapter 6 – Study 3
148
= 0.085, P = 0.565; WK6: r = 0.060, P = 0.699) or percentage energy from fat (BL: r
= -0.178, P = 0.226; WK6: r = -0.017, P = 0.913) at baseline or week six. A trend
was found between baseline oral fatty acid sensitivity and baseline BMI (r = 0.252,
P = 0.068) and a significant correlation was found between oral fatty acid sensitivity
at week six and BMI at week six (r = 0.289, P = 0.046).
Figure 6.2: Mean ± SEM oral fatty acid detection thresholds at baseline (BL) and
week six (WK6) for the low-fat (n = 26) and portion control (n = 27) diet groups
* Indicates significance P < 0.05 for main effect of time using repeated measures
ANOVA
0
2
4
6
8
10
12
Low-fat Portion control
C18
:1 d
etec
tion
thre
shol
d (m
M) BL WK6
*
*

Chapter 6 – Study 3
149
6.5.7 Sucrose and NaCl detection thresholds
There were no significant differences in baseline sucrose taste thresholds between
the groups (P = 0.627). Similarly, there were no significant differences in baseline
NaCl taste thresholds between the groups (P = 0.174) (Table 6.2).
Consumption of the low-fat diet or the portion control diet over the six-week period
had no significant effect on detection thresholds for sucrose (main effect of time:
Wilks’ Lambda = 0.969, F(1, 47) = 1.50, P = 0.227). No significant effect was seen
for sucrose between groups (main effect of group: F(1, 47) = 0.013, P = 0.910) or
time by group interaction (time*group interaction: Wilks’ Lambda = 0.998, F(1, 47)
= 0.113, P = 0.738) (LF: BL, 6.03 ± 0.93 mM; WK6, 5.12 ± 0.80 mM) (PC: BL,
6.50 ± 1.13 mM; WK6, 4.90 ± 1.12 mM). Therefore, detection thresholds for sucrose
for all subjects did not change and this did not depend on what diet was followed.
There was no change in NaCl detection thresholds after consumption of the low-fat
or portion control diet (main effect of time: Wilks’ Lambda = 0.993, F(1, 51) =
0.348, P = 0.558). There were also no significant changes in NaCl detection
thresholds between groups (main effect of group: F(1, 51) = 1.63, P = 0.208) or
interactions between time and group (time*group interaction: Wilks’ Lambda =
0.979, F(1, 51) = 1.08, P = 0.303) (LF: BL, 0.29 ± 0.04 mM; WK6, 0.07 ± 0.12 mM)
(PC: BL, 0.41 ± 0.08 mM; WK6, 1.18 ± 0.93 mM), meaning that detection
thresholds for NaCl remained the same for all subjects independent of diet type.

Chapter 6 – Study 3
150
6.5.8 Fat ranking task
Scores on the fat ranking task at baseline did not differ between dietary groups (P =
0.348). There was a significant increase in the fat ranking task scores following the
consumption of the low-fat diet (z = -2.38, P = 0.017) (BL: 0.50 ± 0.20, WK6: 1.54
± 0.40) (Figure 6.3). In contrast, consumption of the portion control diet had no
effect on fat ranking task scores (z = -1.01, P = 0.314) (BL: 0.74 ± 0.25, WK6: 1.24
± 0.38) (Figure 6.3). A Mann-Whitney U test revealed no significant difference in
the fat ranking task scores between the low-fat (Md = 0.5, n = 24) and portion
control (Md = 0.0, n = 25) groups at week six (U = 264, z = -0.80, P = 0.42, r =
0.11). There were no significant differences between diets for the change in fat
ranking scores from baseline to week six (U = 206, z = -0.62, P = 0.53, r = 0.09).
Figure 6.3: Mean ± SEM fat ranking scores at baseline (BL) and week six (WK6)
for the low-fat (n = 26) and portion control (n = 27) diet groups
* Indicates significance P < 0.05 using Wilcoxon Signed-Rank tests
0
0.2
0.4
0.6
0.8
1
1.2
1.4
1.6
1.8
2
2.2
Low-fat Portion control
Poin
ts sc
ored
BL
WK6
*
Chapter 6 – Study 3
151
6.5.9 Hedonic ratings
The low-fat and portion control diet groups did not differ in liking of regular-fat and
low-fat foods at baseline (Table 6.4). Following the consumption of the low-fat diet,
there were no differences in liking of regular-fat cream cheese, regular- and low-fat
chocolate mousse, or regular- and low-fat yoghurt (main effect of time: Wilks’
Lambda = 0.999, F(1, 47) = 0.038, P = 0.847; Wilks’ Lambda = 0.990, F(1, 47) =
0.465, P = 0.449; Wilks’ Lambda = 0.986, F(1, 48) = 0.683, P = 0.413; Wilks’
Lambda = 0.271, F(1, 47) = 0.271, P = 0.605; Wilks’ Lambda = 0.976, F(1, 47) =
1.14, P = 0.291, respectively), however there was a significant increase in the liking
of low-fat cream cheese (main effect of time: Wilks’ Lambda = 0.870, F(1, 47) =
7.02, P = 0.011). There was also no significant increase in liking of the foods
between groups (main effect of group: F(1, 47) = 1.35, P = 0.251; F(1, 47) = 0.969,
P = 0.330; F(1, 47) = 0.957, P = 0.333; F(1, 47) = 0.060, P = 0.807; F(1, 47) = 3.71,
P = 0.060, regular- and low-fat cream cheese, low-fat chocolate mousse, or regular-
and low-fat yoghurt, respectively) except for regular-fat chocolate mousse (main
effect of group: F(1, 47) = 4.31, P = 0.043). No significant time by group
interactions were observed for liking of the regular- and low-fat cream cheese, the
regular- and low-fat chocolate mousse, or regular-fat yoghurt (time*group
interaction: Wilks’ Lambda = 0.960, F(1, 47) = 1.98, P = 0.166; Wilks’ Lambda =
0.981, F(1, 47) = 0.927, P = 0.341; Wilks’ Lambda = 0.969, F(1, 47) = 1.50, P =
0.227; Wilks’ Lambda = 0.997, F(1, 47) = 0.126, P = 0.725; Wilks’ Lambda =
0.997, F(1, 47) = 0.149, P = 0.702, respectively), however there was a time by group
interaction for liking of the low-fat yoghurt (time*group interaction: Wilks’ Lambda
= 0.913, F(1, 47) = 4.48, P = 0.040). This significant interaction may be due to the

Chapter 6 – Study 3
152
portion control diet group rating the low-fat yoghurt higher than the low-fat diet
group at baseline.
Table 6.4: Acceptance changes (Mean ± SEM) using a 9-point hedonic scale in
regular- and low-fat foods following consumption of the low-fat diet or portion
control diet
LF (n = 26) PC (n = 27) P valueRF chocolate mousse
Baseline 7.2 ± 0.3 6.3 ± 0.4 0.083a
Week 6 7.3 ± 0.3 6.2 ± 0.3 0.449b
Change 0.1 ± 0.3 -0.1 ± 0.3LF chocolate mousse
Baseline 6.0 ± 0.3 5.6 ± 0.4 0.418a
Week 6 6.2 ± 0.4 5.9 ± 0.4 0.413b
Change 0.2 ± 0.5 0.3 ± 0.5RF yoghurt
Baseline 6.4 ± 0.3 6.2 ± 0.4 0.769a
Week 6 6.4 ± 0.4 6.6 ± 0.3 0.605b
Change 0.0 ± 0.4 0.4 ± 0.5LF yoghurt
Baseline 5.6 ± 0.4 6.8 ± 0.3 0.011a
Week 6 5.7 ± 0.4 6.0 ± 0.3 0.291b
Change 0.1 ± 0.4 -0.8 ± 0.3RF cream cheese
Baseline 5.6 ± 0.4 6.5 ± 0.4 0.156a
Week 6 5.8 ± 0.5 6.0 ± 0.4 0.847b
Change 0.2 ± 0.4 -0.5 ± 0.3LF cream cheese
Baseline 5.5 ± 0.4 5.6 ± 0.4 0.923a
Week 6 6.0 ± 0.3 6.8 ± 0.3 0.011b
Change 0.5 ± 0.5 1.2 ± 0.4RF, regular-fat; LF, low-fata indicates P values for the difference between groups in baseline scores using
independent samples t-testsb indicates P values for a main effect of time using repeated measures ANOVA
Chapter 6 – Study 3
153
6.5.10 PROP sensitivity
There was no significant difference in PROP sensitivity between the groups at
baseline (P = 0.242). There was no significant difference in changes in PROP
sensitivity between the low-fat and portion control diet groups from baseline to week
six (main effect of time: Wilks’ Lambda = 1.00, F(1, 47) = 0.001, P = 0.972). There
were also no significant changes between groups (main effect of group: F(1, 47) =
0.121, P = 0.730) or group by time interactions (time*group interaction: Wilks’
Lambda = 0.973, F(1, 47) = 1.32, P = 0.256) (LF: BL, 16.59 ± 3.06, WK6, 18.02 ±
2.96; PC: BL, 19.46 ± 3.15, WK6, 18.12 ± 3.07).
There were no significant correlations between PROP sensitivity and total fat intake
(g) at baseline (r = 0.035, P = 0.807) or week six (r = 0.029, P = 0.853), or
percentage energy from fat at baseline (r = -0.146, P = 0.316) or week six (r = -
0.039, P = 0.793), nor were there any correlations between PROP sensitivity and oral
fatty acid sensitivity (r = -0.048, P = 0.744), or PROP sensitivity and ability to detect
the fat content of custard (r = 0.184, P = 0.206).
6.5.11 Tongue papillae number
There was no significant difference in papillae number between the low-fat diet
group and the portion control diet group at baseline (LF: 1.82 ± 0.41, PC: 2.65 ±
0.54, P = 0.259). There was no correlation between fungiform papillae number and
oral fatty acid sensitivity (BL: r = -0.119, P = 0.447, WK6: r = -0.002, P = 0.990).
No significant correlation was found between fungiform papillae number and
detection thresholds for sucrose (BL: r = -0.173, P = 0.267, WK6: r = -0.149, P =
Chapter 6 – Study 3
154
0.339) or NaCl (BL: r = -0.031, P = 0.846, WK6: r = 0.256, P = 0.097). There was
no correlation between fungiform papillae and ability to perceive fat in the fat
ranking task (BL: r = 0.013, P = 0.934, WK6: r = 0.141, P = 0.369). There was also
no correlation found between fungiform papillae number and sensitivity to PROP
(BL: r = 0.249, P = 0.108, WK6: r = 0.210, P = 0.175).
6.6 Discussion
This study compared the effects of following a six-week low-fat diet versus a six-
week portion control diet on oral detection thresholds for C18:1, sucrose and NaCl;
and fat perception and hedonic ratings for regular-fat and low-fat foods. Oral fatty
acid sensitivity was significantly increased after consumption of both the low-fat diet
and portion control diets and this increase in sensitivity was specific to C18:1;
sensitivity to sucrose and NaCl did not change. Fat perception significantly increased
following a low-fat diet, but the same changes were not seen following the portion
control diet. There were minimal significant changes in hedonic ratings from
baseline to week six for either dietary intervention, and preferences for regular-fat
and low-fat foods were not significantly different between groups at week six.
Oral fatty acid sensitivity increased significantly in both the low-fat and portion
control diet groups from baseline to week six, and no significant differences between
diet groups were found, suggesting that an adaptive change to both diets occurred
during the six-week period. At baseline, all subjects were overweight or obese and
were habitually consuming moderate fat diets (33-34% fat). Both the low-fat diet
group and the portion control diet group reduced the gram value of fat consumed

Chapter 6 – Study 3
155
(LF: -22.7 g, PC: -16.8 g). The present study demonstrates that subjects who reduce
their fat intake by approximately 20 g via consumption of a moderately low-fat diet
or a portion control diet for six weeks will see similar changes in sensitivity with an
improvement in detection thresholds of approximately 2.9 mM concentration of
C18:1. The significant changes to both groups were expected, as the portion control
group were instructed to reduce the amount of all foods they were consuming;
consequently, the amount of fat (g) was reduced. It could be speculated that these
changes were due to a learning effect of the detection threshold method rather than
modulation by fat intake, however a learning effect is unlikely as no differences in
oral sensitivity to sucrose and NaCl were observed from baseline to week six, and
we have previously reported the high test-retest reliability of oral fatty acid detection
thresholds (Newman & Keast, 2013). Previous research has reported similar findings
in that reducing the amount of dietary fat consumed (grams and percentage)
improves oral sensitivity to fat (Stewart & Keast, 2012). Stewart & Keast (2012)
detailed that a 56 g reduction in fat consumption resulted in a 2.2 mM increase in
oral sensitivity to C18:1 over a four-week period, suggesting that the gram value of
fat consumed in the diet may be an important factor in modulating oral fatty acid
sensitivity. Although the low-fat diet group tended to consume a lower percentage of
energy from fat (24.9%), compared to the portion control group (29.2%) (P = 0.058)
at week six of the present study, there were no significant differences found between
diets. Therefore, even though the low-fat diet group were consuming a lower
percentage of energy from fat, they were consuming approximately the same amount
of grams in fat. This reflects the fact that no differences were found in oral fatty acid
sensitivity between the diets and further suggests that the gram value of fat is the
Chapter 6 – Study 3
156
major influence on oral fatty acid sensitivity, rather than the percentage energy from
fat. Thus, it could be hypothesised that if these reduced-fat diets are followed
habitually, individuals may become more sensitive to fats over time and may require
smaller amounts of fat/ fatty acids to elicit the same response within taste receptor
cells. If taste receptor cell activation is linked with development of satiety, then
increasing oral sensitivity to fatty acids may aid in reducing total energy intake and
possibly obesity. However, it is important not to discount the potential effect of
weight loss. As modulation of oral fatty acid sensitivity is yet to be shown
independent of weight loss or weight gain, this will be an important area of future
investigation with studies needed which can alter fat intake without inducing weight
loss, for example a moderate-fat, high kilojoule diet. Future research may include a
follow-up study to determine the long-term effects of such an intervention where
subjects are re-tested after six months or one year, asked about their continued
adherence to their originally allocated diet and again undergo detection threshold
testing. Additionally, comparing a low-fat diet to a control diet in which fat intake is
not reduced, e.g., a Mediterranean diet, may allow for clearer comparisons in oral
fatty acid sensitivity between groups.
The present study found no direct correlation between oral fatty acid sensitivity and
fat intake (either in grams or percentage). This finding is surprising as oral fatty acid
sensitivity appeared to increase following a decrease in dietary fat consumption.
Previous data surrounding this area is conflicting, with some studies finding strong
associations between oral fatty acid sensitivity and habitual fat intake (Stewart, et al.,
2010; Stewart, Newman, et al., 2011), and others finding no associations (Tucker, et
Chapter 6 – Study 3
157
al., 2013; Tucker & Mattes, 2013). Stewart et al. reported in two separate cross-
sectional studies that hyposensitivity to fatty acids was associated with higher
habitual fat consumption (Stewart, et al., 2010; Stewart, Newman, et al., 2011) and
another research group failed to find cross-sectional associations between oral fatty
acid sensitivity and dietary fat consumption over ten testing sessions (Running, et al.,
2013). Additionally, a comparison of fat intake and oral fatty acid sensitivity in lean
and obese subjects found no differences or associations (Stewart & Keast, 2012).
These findings are surprising, given overweight/ obese individuals are thought to
have attenuated sensitivity due to diets habitually high in fat. However, the type of
data presented in these studies may provide insight into how oral fatty acid
sensitivity may be modulated by fat intake. Cross-sectional data may not be the most
effective way to determine the influence of diet on oral fatty acid sensitivity. For
instance, if two subjects who both consume excess dietary fat undergo a single
session of oral fatty acid sensitivity testing, one subject’s threshold may be 12 mM
and the other 2 mM due to expected inter-individual variability; this cross-sectional
data would show no correlation between oral fatty acid sensitivity and fat intake.
However, if the same subjects both followed a low-fat diet, their thresholds may
change to 6.4 mM and 1 mM respectively, demonstrating an association between fat
intake and oral fatty acid sensitivity. Consequently, the results of the present
longitudinal study suggest that there is empirical evidence that fat intake and oral
fatty acid sensitivity are linked, although the area surrounding habitual diet and its
association with oral fatty acid sensitivity is conflicting at this stage. Future studies
involving large, long-term interventions that monitor habitual fat consumption, as
Chapter 6 – Study 3
158
opposed to cross-sectional studies, are needed to determine a definitive answer as to
whether fat intake modulates oral fatty acid sensitivity or vice versa.
The present study found a correlation between BMI and oral sensitivity to C18:1 at
week six. Previous research has demonstrated associations between oral fatty acid
sensitivity and BMI (Stewart, et al., 2010; Stewart, Newman, et al., 2011), however
other studies have found no associations (Mattes, 2009d, 2011b; Stewart & Keast,
2012). The studies that have found associations between the two have used an
abbreviated threshold testing method that divided subjects into hypersensitive and
hyposensitive based on their sensitivity to a certain concentration of C18:1 (Stewart,
et al., 2010; Stewart, Newman, et al., 2011; Stewart, Seimon, et al., 2011). In
contrast, the studies that have found no associations have used a complete threshold
measure procedure (3-AFC, staircase methodology etc.) (Kamphuis, Saris, et al.,
2003; Mattes, 2009d, 2011b; Stewart & Keast, 2012). To the best of the author’s
knowledge, the present study is one of the first studies to find an association between
BMI and oral fatty acid sensitivity using a complete threshold testing method
(triangle tests with ascending forced choice methodology). This suggests that
perhaps there is a link between the two and attenuation of the fat sensing mechanism
in the oral cavity is compromised in the obese population.
Interestingly, only C18:1 detection thresholds changed over the six-week period for
both groups. There were no changes in oral detection thresholds for sucrose or NaCl,
nor were there changes in sugar and sodium intake over the six week period. This
adds to the body of evidence that taste perception is influenced by specific nutrient
Chapter 6 – Study 3
159
intakes and therefore, is suggestive that fat perception is potentially modulated
specifically by fat intake. These tests were used to control for potential learning
effects that may have occurred from session one to session two, and also to
determine if other taste related changes occurred. As there were no changes in oral
detection thresholds for sucrose and NaCl, it can be suggested that the increases in
oral fatty acid sensitivity were specific to the decreased intake of fat throughout the
six-week period.
Whilst significant reductions in oral detection thresholds were seen in the both the
low-fat and portion control diet groups during the intervention, only the low-fat diet
group demonstrated a significant increase in ability to detect the fat content of
custard from baseline to week six. Increases in fat perception in the portion control
group were also seen, however these increases were not significant. This suggests
that directionality in fat perception was similar between the two diet groups but the
magnitude of change was not large enough to see a statistical difference. A larger
sample size or a longer intervention period may have produced statistically
significant differences in the portion control group. Differences between groups in
regards to changes in fat perception may have also been due to the types of foods
that were being consumed throughout the intervention. Subjects following the
portion control diet were instructed to consume the same types of foods as normal
but at reduced quantities. Therefore, the portion control group consumed high-fat
foods such as cheese, fried foods, desserts and condiments significantly more often
during the intervention than the low-fat group. Consumption of these types of foods
throughout the six week period may account for the fact that there was no significant
Chapter 6 – Study 3
160
increase in fat perception in the portion control group. This finding highlights the
possibility that the types of food habitually consumed may positively affect oral
perception in an overweight/ obese individual reversing the attenuation of fatty acid
sensitivity that may have occurred in the alimentary canal. Previous research has also
found similar results, with an increase in fat perception observed after consumption
of a low-fat diet (15-20%) over four weeks (Stewart & Keast, 2012). However, in the
current study there were no significant differences between groups at week six in
their ability to perceive fat in the custard samples.
Minimal changes in hedonics for the foods tested were found in this study. The sole
statistically significant change was increased liking of low-fat cream cheese in both
groups across the intervention, however both groups demonstrated slight non-
significant increases or decreases in preference of some foods pre- and post-
intervention. The data show that all foods were liked in a similar manner both at
baseline and week six. In a study conducted by Stewart et al. (2012) with a duration
of four weeks, there were also no changes in liking of regular- and low-fat foods. A
longer 10-12 week low-fat dietary intervention may be needed to replicate the
increases in liking of low-fat foods as previously reported by Mattes (1993) and in
order for these adaptive changes to be sustainable in the long-term, a change in
preference (increased liking of low fat foods) would need to be seen (Mattes, 1993).
Whilst speculative at this stage, hyposensitivity to fatty acids may be due to
habituation to a high-fat diet which weakens the chemoreceptive response in the oral
cavity. Therefore, hypothetically, if changes are made to reduce the amount of fat
being consumed over a long period of time, regular chemoreceptive responses may
Chapter 6 – Study 3
161
be restored, potentially reducing over consumption and overall body weight as
shown in this study and previous work by Stewart and Keast (2012). Whilst
unconfirmed in the literature at this stage, habituation of the taste system in some
individuals may have occurred in response to the changing food environment, i.e.,
increased availability of high-fat foods, which has potentially resulted in differences
in sensitivities to fats, thus creating the need for greater quantities of fat to be
consumed before detection occurs, consequently resulting in excess consumption.
The results of the present study do not clearly support this position, however being
able to make the links between fat perception, fat preference and oral fatty acid
sensitivity is an important step in establishing the potential fundamental role of
nutrient-specific receptors both in the mouth and GI tract, and how these receptors
influence eating behaviours and perhaps overconsumption, or vice versa. Hence,
there is a possibility that differences in oral fatty acid sensitivity may also affect food
choices and preferences. Nonetheless, for a change in habitual diet to be sustained
long-term, a change in preference needs to occur.
While this study focuses on dietary influences, it is important to note that the ability
to detect fatty acids may differ between individuals and this may be due to
differences in fatty acid receptor functionality or papillae density (Chale-Rush, et al.,
2007b; Gilbertson, et al., 2005). For example, those who have a higher density of
papillae will have a greater number of taste receptors and potentially increased oral
sensitivity to many nutrients (Drayna, 2005; Hayes, et al., 2010). Furthermore,
differences in sensitivity to certain tastants may influence liking or dislike of certain
foods containing those tastants (Drewnowski & Henderson, 2000; Keller, et al.,
Chapter 6 – Study 3
162
2002; Turnbull & Matisoo-Smith, 2002). As fatty acid receptor numbers may differ
from person to person, oral fatty acid sensitivity may also differ between humans
(Kamphuis & Westerterp-Plantenga, 2003), potentially affecting the hedonic
response to fats. However, receptors for fatty acids have not yet been isolated on
fungiform papillae. The present study did not find any relationship between
fungiform papillae number and sensitivity to C18:1, sucrose, NaCl or PROP. The
absence of such associations may be due to the participants’ papillae numbers, which
were much lower than previously reported (Nachtsheim & Schlich, 2013; Shahbake,
et al., 2005). Differences in methodology may account for the low papillae numbers
as laboratories use varying methodologies to determine papillae numbers. The
photographic technique used in the present study has been used by many laboratories
however, there are different ways it can be carried out. Some groups dye half of the
tongue, then take a photograph (Nachtsheim & Schlich, 2013). The area of the
tongue which is to be counted is then determined once the image is on a computer.
Therefore the researchers could potentially use the area which looks as though it
contains the most papillae. However, others research groups place specific sized
circles of filter paper on the tongue at the time of the photograph and only count the
papillae in that particular area (Shahbake, et al., 2005). Thus, if the circle marker is
placed in an area of the tongue which is less populated with papillae, counts may be
lower, as was the case for the present study, than the computer based studies.
Additionally, the use over cover slips is common and this helps to identify non-
stained papillae, however these were not used in the present study.

Chapter 6 – Study 3
163
This study needs to be considered alongside limitations which may have confounded
the results. Dietary adherence is very difficult to monitor during interventions that
continue over many weeks, however the significant reduction in weight, BMI and
waist-hip ratio, along with responses to the food frequency questionnaire suggest
that subjects adhered to their allocated diet. Diet records were used to provide a
snapshot of dietary intake both before and during the intervention, however they do
not necessarily reflect habitual dietary behaviour (Potosky, Block, & Hartman,
1990). Diet records often underreport socially undesirable foods, which also tend to
be high in fat (Voss, Kroke, Klipstein-Grobusch, & Boeing, 1998), however as
subjects would have underreported at both baseline and week six, it is thought the
changes in fat intake (g) and fat percentage intake in the present study are real
changes. Discrimination of a true oral detection effect from fatty acids may be
confounded by differences in the textural attributes of fatty acid and control samples,
which can influence oral detection. However, we used reliable methods to minimise
textural differences, odour differences and oxidation, therefore any influence would
be expected to have been minor (Mattes, 2005). It must also be mentioned that both
the low-fat diet group and the portion control diet group reduced the amount of fat
they were consuming from baseline to week six. Therefore, comparison between the
two groups in regards to changes in oral fatty acid sensitivity are difficult as there
were no significant differences in fat intake, both in grams and percentage, at week
six between the two groups.
Chapter 6 – Study 3
164
6.7 Conclusions
In summary, this study has demonstrated that following either a six-week low-fat
diet or portion control diet significantly increases oral sensitivity to C18:1. These
findings suggest that reducing the total grams of fat consumed has a positive effect
on an individual’s oral fatty acid sensitivity. Individuals who do not make these
dietary changes may be subject to gustatory adaptive changes that may reduce the
physiological and psychological effects of fat, and potentially contribute to excess fat
consumption. Therefore, habitual fat consumption may be a major factor in
influencing an individual’s sensitivity to fat, and in turn either promote or reduce the
likelihood of the development of overweight and obesity. However, the present study
also raises the possibility that a change in fat intake rather than the absolute content
of fat consumed may be an important factor in determining oral fatty acid sensitivity.
In addition, whether there is an underlying influence from genetics on taste
sensitivity is yet to be elucidated, thus, future studies are needed to ascertain the
potential role of variations in receptors and expression of fatty acid specific
receptors.
6.8 Future directions
To extend this research, the next step would be to investigate the changes in habitual
food consumption and preference following dietary adaptation over an extended
period of time to investigate the potential changes in preference. In addition, a
follow-up study whereby the same subjects are re-tested six months to a year later to
ascertain which subjects have continued to adhere to the diet, and whether this
extended adherence has influenced oral fatty acid sensitivity would be interesting.
Chapter 6 – Study 3
165
Another weight loss dietary intervention where the control diet group follow a diet
that does not reduce fat intake, for example a Mediterranean diet, would allow a
clearer comparison between groups in regards to oral fatty acid sensitivity, and
associations between sensitivity and fat intake may be more obvious. Future studies
investigating modulation of oral fatty acid sensitivity through dietary changes will
need to control for energy intake as differences in sensitivity need to be reported
without changes in energy intake occurring, so a definitive link between fat intake
and sensitivity can be made. Another important step would be to investigate the
effect of long-term dietary adaptation on satiety to both low- and high-fat foods.
Importantly, future research must focus on the putative receptors for fatty acid
sensitivity, how expression of these receptors varies from person to person, and what
happens when dietary consumption is altered.

C H A P T E R S E V E N
Summary of major findings and conclusions
7
7.1 Introduction
Excess fat consumption is the leading cause of obesity and thus contributes to
various non-communicable diseases such as cardiovascular disease (CVD) and type-
2 diabetes (World Health Organisation, 2000). Although the area of oral fatty acid
detection is novel, there is emerging evidence that humans may have a mechanism
for sensing fat in the oral cavity which occurs via fatty acid receptors on taste buds.
Whilst there is much speculation over what constitutes a primary taste quality, a
proposed criteria has been established comprising of: defined class of stimuli; unique
transduction mechanism; peripheral taste mechanism; and be distinguishable from
other taste stimuli (Mattes, 2011a). Fatty acids seem to fit all of these criteria,
however challenges arise with distinguishing fatty acid stimuli from other taste
stimuli as there is no established lexicon for fatty acid detection, making testing
difficult for subjects who are experiencing the stimuli for the first time (Running, et
al., 2013). Similarly to the primary tastes, there is large inter-individual variation in
the ability to detect fatty acids within the oral cavity, whereby some individuals have
the ability to detect fatty acids at low concentrations, while others need higher
concentrations before fatty acid detection occurs (Ahne, et al., 2000; Cicerale, et al.,
2009; Mueller, et al., 2011; Newman & Keast, 2013). An individual’s preference for
high-fat food may be influenced by their oral sensitivity to fatty acids, however
whether preference determines oral sensitivity or vice versa is still unknown. Those
who are hypersensitive to fatty acids may consume less fat and total energy, whereas
Chapter 7 – Summary of major findings and conclusions
167
those who are hyposensitive may consume more fat and total energy (Stewart,
Newman, et al., 2011). We suggest this association may be due to gastrointestinal
(GI) sensitivity to fatty acids, in which potent stimulators of the satiety hormone
cascade are affected (Stewart, Seimon, et al., 2011). As fat consumption contributes
to weight gain and obesity is largely becoming an epidemic, factors that may
influence the consumption and preference of fatty foods – including fatty acid
sensitivity – are important considerations. As there are many gaps in the current
knowledge of fatty acid sensitivity, this thesis endeavoured to expand on, and add to
the growing body of evidence of this novel research area.
Variation in oral sensitivity to fatty acids has been consistently reported in both
animal and human studies, with inter-individual variation becoming a well-
documented characteristic of the taste system (Newman & Keast, 2013; Running, et
al., 2013; Tucker & Mattes, 2013). The mechanisms behind variation in individual
sensitivity to fatty acids remains elusive, but is thought to be due to a combination of
genetic factors (Gilbertson, et al., 2005), including the number of taste papillae,
which may be related to a heightened taste perception, and environmental factors, for
example, diet-induced changes in taste receptor functionality via adaptation.
Previous studies have reported changes in the oro-sensory perception of tastants
including 6-n-propylthiouracil (PROP), salt and fats, as well as the liking of foods
containing certain tastants following dietary manipulations. For example, individuals
classed as supertasters of the bitter compound PROP may avoid certain bitter tasting
foods such as brassica vegetables, bitter tasting fruits (grapefruit) and coffee
(Dinehart et al., 2006; Drewnowski & Henderson, 2000; Drewnowski, Henderson,
Chapter 7 – Summary of major findings and conclusions
168
Levine, & Hann, 1999; Drewnowski, Henderson, & Shore, 1997; Hall, Bartoshuk,
Cain, & Stevens, 1975). Prior research has also found a relationship between sodium
consumption and taste sensitivity to sodium, whereby high dietary sodium
consumption is associated with a lower taste sensitivity to sodium (DiNicolantonio,
et al., 1984). It is possible that a similar relationship may exist with fat. Stewart et al.
(2011) demonstrated that fat hypersensitivity was associated with a lower dietary fat
consumption, which suggests a potential link between high dietary fat consumption
and decreased oral fatty acid sensitivity (Stewart, Newman, et al., 2011). Mattes et
al. (1993) evaluated the relationship between habitual fat consumption and the
preferred level of fat in foods, finding that after consumption of a fat-reduced diet,
preference for previously preferred full-fat foods decreased and acceptance of lower-
fat foods increased (Mattes, 1993). Thus, in some circumstances, the environment
may override an individual’s inherent oral sensitivity via adaptation, suggesting a
direct relationship between habitual fat consumption and the level of fat preferred in
a food, and perhaps oral sensitivity to fatty acids. Further exemplifying these
interactions, decreases in oral fatty acid sensitivity were seen after consumption of a
four-week high-fat diet, and oral fatty acid sensitivity increased following a four-
week low-fat diet (Stewart & Keast, 2012). If an individual is repeatedly exposed to
a high-fat diet, attenuation of the physiological and psychological effects of fat may
occur. Accordingly, it may be plausible that prolonged consumption of a high-fat
diet will lead to a decrease in oral sensitivity to fatty acids, and consumption of more
fat will be required to obtain the expected release of appetite supressing hormones
and increased satiety.

Chapter 7 – Summary of major findings and conclusions
169
Recently, a homologous taste receptor response for sugars and proteins was
discovered throughout the GI tract, illustrating a systemic nutrient detection system
for carbohydrates and proteins (Margolskee et al., 2007). Similarities between fatty
acid receptors on papillae and GI tract epithelial cells have been found, including
cluster of differentiation 36 (CD36), G-protein coupled receptors (GPCR) and
delayed rectifying potassium (DRK) channels, suggesting fat is also part of the
systemic nutrient detection system throughout the alimentary canal. The role of gut
nutrient sensing plays a pivotal role in appetite regulation and has been linked to
digestive, metabolic and satiating effects involved in nutrient utilisation and
inhibition of appetite (Sclafani & Ackroff, 2012). Indeed, when healthy individuals
ingest fat, various hormones are released in preparation for fat digestion including
cholecystokinin (CCK) and peptide YY (PYY), which potently affect appetite
suppression by decreasing GI transit time (Feinle et al., 2003; Stoeckel, Weller,
Giddings, & Cox, 2008). Conversely, in the obese population, the GI regulation of
food may be dysfunctional with accelerated, normal and delayed gastric emptying all
being reported, as well as lower concentrations of PYY (Jackson et al., 2004; le
Roux et al., 2006; Vazquez Roque et al., 2006; Verdich et al., 2000). The
explanation for abnormalities in these mechanisms remains elusive, however it is
hypothesised that desensitisation of the GI tract receptors may have occurred,
possibly due to adaptation to dietary conditions, for example a high-fat diet (Little,
Horowitz, & Feinle-Bisset, 2007). Stewart et al. (2011) investigated the link between
fatty acid sensitivity in both the oral cavity and GI tract in lean and obese
individuals, reporting that the obese were less orally sensitive to C18:1, had a
reduced release of appetite supressing hormones after an intra-duodenal infusion of
Chapter 7 – Summary of major findings and conclusions
170
C18:1 compared to the lean group and consumed more energy in the meal following
the fat infusion (Stewart, Seimon, et al., 2011). (Dinehart, et al., 2006; Mattes,
2009b; Sternini, Anselmi, & Rozengurt, 2008). Similarities in mechanisms involved
in sweet, bitter, umami and fat detection between taste receptor cells and GI cells
have been reported whereby associations between oral sensitivity to certain tastants,
dietary intake and preferences were found (Dinehart, et al., 2006; Mattes, 2009b;
Sternini, et al., 2008). This suggests that the oral cavity and GI tract interact very
closely to control appetite regulation and energy intake. However, further studies are
required to determine the relationship between GI and oral fatty acid receptor
functionality and density, and whether they are potentially influenced by dietary fat
consumption.
Fat is a slow satiating but high density food compared to other macronutrients such
as carbohydrates and proteins (Westerterp-Plantenga, 2003). For example, the
mechanisms that induce satiation by fats are delayed in comparison with those
induced by carbohydrates and proteins (Blundell & Macdiarmid, 1997). When
ingested, fats have a potent effect on many peptide hormones and when digested
changes in gastric motility occur which lead to appetite suppression (Feinle, et al.,
2003; Stoeckel, et al., 2008). It has been found that these pathways are defective in
the obese population (Stewart, Seimon, et al., 2011), meaning they are less satiated
by fatty foods due to their decreased sensitivity to fats within the GI tract. Due to this
inability to produce satiation quickly, excess fat may be consumed, increasing total
energy consumption and consequently causing obesity (Snoek, et al., 2004). In
addition, high-fat diets are usually more appealing than low-fat diets due to the high
Chapter 7 – Summary of major findings and conclusions
171
palatability of fat (Drewnowski, et al., 1992). Drewnowski et al. (1992) showed that
hedonic ratings for fat increased with body mass and that obese subjects had a
stronger preference for high-fat foods when compared to leaner subjects
(Drewnowski, et al., 1992). Similar results were found in a study comparing weight-
discordant monozygotic twins, whereby the obese twins reported their current
preference for fatty foods as three times higher than the co-twin (Rissanen, et al.,
2002). These data suggest there is an environmental component for fat preference,
and possibly a link between increasing body mass and an increased preference for
high-fat foods. However, not all studies have reported the same results, with one
study finding no differences in preference for regular-fat and low-fat foods between
lean and obese subjects (Stewart & Keast, 2012). Post-ingestive effects of fat
including feelings of contentment may promote long-term preference and positive
reinforcement (Abumrad, 2005). Therefore, fat consumption produces feelings of
pleasure and satisfaction, which then become positively associated with the fatty
foods, and over time these foods become highly preferable (Abumrad, 2005). The
obese population’s preference for high-fat foods may be due to a decline in oral
sensitivity to fat via adaptation, which may mean more fat must be consumed to
produce the same hedonic response, potentially increasing fat consumption and
increasing BMI. However, a robust relationship between BMI and oral fatty acid
sensitivity is yet to be demonstrated, with recent research finding no relationship
between the two (Kamphuis, Saris, et al., 2003; Mattes, 2009d, 2011b; Newman &
Keast, 2013; Stewart & Keast, 2012).

Chapter 7 – Summary of major findings and conclusions
172
An essential step in furthering evidence for fatty acid taste was establishing the
reliability and reproducibility of the oral fatty acid threshold method. Whilst there is
large speculation over the reliability of the fatty acid detection measurement, we
have recently established that the measure is highly reproducible over a number of
testing sessions (Newman & Keast, 2013). The study found that the most reliable
and convenient measurement to ascertain the most accurate portrayal of a subject’s
sensitivity to C18:1 was to perform the threshold test in duplicate on the same day.
However, other studies have found that numerous sessions (up to seven) over
numerous days (up to ten) are required to determine an accurate measure of oral fatty
acid thresholds (Tucker & Mattes, 2013). Tucker and Mattes (2013) investigated the
reliability of oral fatty acid thresholds using two regularly used methodologies; the
staircase method and the ascending 3-alternate forced choice (3-AFC) method. It was
reported that subjects in this study improved their threshold measure with the more
sessions they completed, thus the authors suggest that up to seven sessions may be
required before an individual’s threshold remained stable (Tucker & Mattes, 2013).
These results are markedly different to those found within this thesis, which may be
due to differences in methodologies used as well as differences in the vehicle used to
present the fatty acids. However, this study raises some important suggestions
surrounding the usefulness of specific methods, suggesting that the ascending 3-AFC
method may be best used when categorising subjects into hypersensitive and
hyposensitive, whereas the staircase method may be best used to determine stability
in threshold measures (Tucker & Mattes, 2013). With that in mind, future research
may need to further investigate the stability and determine whether the differences in
findings between studies do lie with methodological and vehicle differences. There

Chapter 7 – Summary of major findings and conclusions
173
are also questions surrounding the effect that the meal consumed preceding the oral
fatty acid sensitivity test may have on the threshold measure. Some studies had
previously found that taste sensitivity to sucrose, sodium chloride (NaCl) and
quinine increased after a meal, while others had reported they had decreased and
others reported no change (Pangborn, 1959; Pasquet, et al., 2006; Zverev, 2004). To
the best of the author’s knowledge, no studies have investigated the potential effect
of the macronutrient composition of the meal consumed immediately prior to
threshold testing. The results from this thesis have found that there was no
significant effect of a high-fat, low-fat or macronutrient balanced breakfast on oral
detection thresholds for C18:1. The major findings from this thesis are as follows:
Study one hypothesised that oral fatty acid thresholds for C18:1, linoleic acid
(C18:2) and lauric acid (C12:0) would be as reliable and reproducible as thresholds
for sucrose, citric acid, NaCl, caffeine and monosodium glutamate (MSG). This
study reported that detection thresholds for saturated and unsaturated fatty acids
could be reliably established for all participants within a micro- to millimolar
concentration range in a group of healthy individuals over numerous testing sessions.
The test-retest reliability of fatty acid detection thresholds mimicked the reliability of
the five primary tastes which has been tested both in this study and in previous
research (Ahne, et al., 2000; Cicerale, et al., 2009; Mueller, et al., 2011). Oral
sensitivity to C18:1, C18:2 and C12:0 was not associated with oral sensitivity to the
five primary taste qualities; sucrose, citric acid, MSG, NaCl or caffeine. This finding
was expected as there are structural differences between taste molecules, and
individuals may be more or less sensitive to structurally different tastants due to
Chapter 7 – Summary of major findings and conclusions
174
potential differences in receptor systems (Keast, Bournazel, & Breslin, 2003). The
findings of Study one also support previous research in that saturated and
unsaturated fatty acids can be detected within the oral cavity of humans at low
concentrations when non-taste cues, for example, odour, texture and visual prompts
are minimised. In addition, we report that the most reliable and convenient way to
accurately determine an individual’s sensitivity to fatty acids was to measure
detection thresholds in duplicate on the same day. It is important to note that
measuring detection thresholds across days or in triplicate was also highly reliable.
Study two hypothesised that the consumption of a high-fat, low-fat or macronutrient
balanced breakfast immediately prior to threshold testing would not have an
influence on oral sensitivity to C18:1. This study established that the macronutrient
composition of the meal consumed one hour prior to detection threshold testing did
not influence oral fatty acid detection thresholds. Detection thresholds for C18:1
were not significantly different after the consumption of a high-fat, low-fat or
macronutrient balanced breakfast one hour preceding detection threshold testing,
suggesting that a one off high-fat meal does not play a functional role in determining
an individual’s oral sensitivity to fatty acids. In addition, we report that no changes
in fat perception or preference for regular-fat or low-fat foods were seen after the
three different meals. These findings again suggest that short-term dietary fat
consumption does not influence oral fatty acid sensitivity, fat perception and
preferences for regular-fat and low-fat foods.
Chapter 7 – Summary of major findings and conclusions
175
Study three hypothesised that the gustatory system would show a degree of
modulation in relation to oral sensitivity to C18:1 in a similar way to that of NaCl, in
that reducing consumption of NaCl increases sensitivity to NaCl. This study reported
that exposure to either a low-fat diet or a portion control diet for six weeks could
modulate oral fatty acid sensitivity in overweight and obese individuals. In addition,
it has been found previously in healthy weight subjects that consumption of an
extreme high-fat diet (> 45% total energy from fat) for four weeks decreases oral
sensitivity to fatty acids, and consumption of an extreme low-fat diet (< 20% total
energy from fat) for four weeks increases oral fatty acid sensitivity. Therefore, we
report that after consumption of a low-fat (25% total energy from fat) or a portion
control diet (29% total energy from fat) for six weeks by overweight and obese
individuals, oral fatty acid sensitivity was significantly increased. Although the
percentage energy from fat was higher in the portion control group, there were no
significant differences between groups in the grams of fat consumed, suggesting that
the grams of fat consumed is an important factor regarding oral fatty acid sensitivity,
rather than the percentage energy of fat consumed. Interestingly, significant
increases in the ability of subjects to detect small differences in the fat content of
custards occurred in the low-fat diet group only. Nevertheless, directional changes
were also seen in the portion control group, however these were not significant
changes. This suggests that the types of foods consumed over the six-week period
may have played a role. For example, subjects following the portion control diet did
not change their intake of dairy products, fried foods, desserts or condiments
compared to the low-fat diet group, therefore repeated oral exposure to these types of
high-fat foods may explain why significant increases in the portion control group’s

Chapter 7 – Summary of major findings and conclusions
176
ability to perceive fat were not found. In addition, perhaps significant changes in
preference would have been seen if the intervention was longer, or there was a
higher number of subjects in the study. This study also investigated preference shifts
over the six week period in the liking of regular- and low-fat foods. We report that
there were minimal changes in preference seen over this time (only liking of low-fat
cream cheese increased from baseline to week six), which suggests that a six-week
period may have been too short to see such changes and further studies will be
needed to ascertain if links between changes in oral fatty acid sensitivity and
preference for high- and low-fat foods via dietary changes exist. It is also important
to mention that no changes in threshold measures were found for sucrose or NaCl
from baseline to week six after consumption of either the low-fat or portion control
diet, indicating that changes in fat intake may modulate oral fatty acid sensitivity and
were not broadly related to increased sensitivity in the taste system or a learning
effect of the testing procedure. Given that previous research has found inverse
associations between oral fatty acid sensitivity and dietary fat intake, these data have
implications regarding the adherence to low-fat diets, as well as their success in an
overweight and obese population as prescription of a low-fat diet may not be the
most effective method of weight loss for the whole population. For example, an
overweight/ obese individual may be sensitive to fatty acids, but less sensitive to
carbohydrates/ sugars. If they are instructed to follow a low-fat diet, they will reduce
consumption of fats, which normally induce satiety, and concurrently increase
consumption of carbohydrates, which may be less effective at inducing satiety in this
individual. Therefore, overconsumption of carbohydrates will occur to induce
satiety, resulting in excess energy consumption and no weight loss. In contrast, a
Chapter 7 – Summary of major findings and conclusions
177
moderate-fat diet portion control diet would be more beneficial for a fatty acid
sensitive individual as consumption of fat would be permitted. The modest fat
content of such a diet would induce satiety, thereby reducing overall energy intake
and weight loss would occur. Studies investigating the influence of fatty acid
sensitivity on appetite regulation, satiety and weight loss should be a major focus of
future research in the area.
7.2 Conclusions
7.2.1 Major findings
Large inter-individual variation in oral sensitivity to C18:1, C18:2 and C12:0
exists amongst the population, however small intra-individual variation
exists, suggesting that oral fatty acid detection thresholds are reproducible
and reliable when using ascending forced choice triangle tests. These
findings also mirror those found for the five primary taste qualities.
Stability in the oral fatty acid threshold measurement is not affected by the
macronutrient composition of the meal consumed immediately prior to
threshold testing. Consumption of a high-fat, low-fat or macronutrient
balanced breakfast had no significant effect on a subject’s oral detection
thresholds for C18:1.
Oral sensitivity to C18:1 was increased following the consumption of the
low-fat (25% total energy from fat) diet and the portion control diet (29%
total energy from fat) over a six week period in an overweight/ obese
Chapter 7 – Summary of major findings and conclusions
178
population. An increase in an individual’s oral perception of fats within a
food was also seen in the low-fat diet group only. Changes in preference for
regular- and low-fat foods were only seen for one type of food (increased
liking of the low-fat cream cheese) after consumption of a low-fat and
portion control diet over six weeks suggesting that a longer time period may
be needed to see definitive changes.
7.3 Future directions
The studies in this thesis have contributed to and extended research of the potential
existence and function of oral fatty acid sensitivity in humans. It has detailed that
large inter-individual variation exists in regards to oral fatty acid sensitivity, however
minor intra-individual variation exists within subjects suggestive of the high test-
retest reliability of oral fatty acid detection thresholds. This thesis has also reported
that the macronutrient composition of the meal consumed immediately prior to
threshold testing does not impact on oral fatty acid threshold measurements. To the
best of our knowledge, these differences in oral sensitivity to un-oxidised fatty acids
were due to taste cues, not other discriminatory based differences such as odour,
texture and visual cues which were minimised to the best of our ability. In order to
verify the existence of oral fatty acid sensitivity as a modality in humans, future
research will need to focus on putative receptors for fatty acid detection, specifically
whether the putative fatty acid receptors in oral tissue reflect oral sensitivity, how
fatty acids interact with these receptors at a cellular level and how environmental
factors, for example a high-fat diet, influence receptor density and functionality.
Chapter 7 – Summary of major findings and conclusions
179
Studies herein have highlighted that sensitivity to C18:1 can be modulated over a six
week period following exposure to a low-fat diet and a portion control diet,
specifically with a reduction in total amount of fat in grams consumed. When the
two diet groups were compared, there were no differences in the amount of fat
consumed between the groups or in the magnitude of change in oral fatty acid
sensitivity. Conversely, there was a trend (P = 0.058) for a difference in fat
percentage consumed at week six between groups (low-fat diet group: 24.9% fat,
portion control diet group: 29.2% fat). These finding suggest that the grams of fat
consumed may be the major potential influencer of oral fatty acid sensitivity in an
overweight and obese population rather than percentage of fat consumed. Similarly
to previous research, the present study has reported that following a period of
restriction in the grams of fat consumed, oral fatty acid sensitivity was increased,
however energy intake in both groups was also reduced making it difficult to
conclude that energy intake is not also a factor. It is also difficult to conclude
whether weight loss is associated with increased oral fatty acid sensitivity as
modulation of sensitivity is yet to be shown independent of weight loss. Therefore,
future research will need to develop interventions that control for changes in weight
loss and energy intake, for example a moderate-fat, high-kilojoule diet compared to a
high-fat, low-kilojoule diet, so that changes in sensitivity can be reported without
changes in energy intake and weight loss occurring. Additionally, intervention
studies investigating the effect of a long-term low-fat diet on satiety responses is also
an important next step. Previous research has found that hyposensitive individuals
were less satiated by a high-fat meal than hypersensitive individuals (Keast, et al.,
2013). Thus, if oral sensitivity can be increased by a low-fat diet, perhaps satiety
Chapter 7 – Summary of major findings and conclusions
180
responses can also be enhanced, resulting in reduced excess energy consumption and
in turn, decreases in body weight and BMI.
Although this study found positive results in that oral fatty acid sensitivity can be
increased with fat restriction, it is important to keep in mind that oral fatty acid
sensitivity can also potentially be decreased after consumption of a high-fat diet.
Stewart et al. (2012) reported that over a four week period, oral sensitivity to C18:1
was significantly decreased after consumption of a high-fat diet (Stewart & Keast,
2012). Interestingly, this change was only noted in the lean subjects and not in the
obese subjects. Reasons for this were hypothesised by the authors and it was
suggested that the obese population were already consuming a high-fat diet prior to
commencement of the study and had potentially already adapted to the high-fat
environment, therefore no effect was seen in their oral fatty acid sensitivity (Stewart
& Keast, 2012). Adaptation to the high-fat diet or low-fat diet may have included
changes in receptor expression in the oral cavity and GI tract and this will be an
important area to focus future research on, given that sensitivity to other tastants is
genetically determined (Drewnowski, Henderson, & Barratt-Fornell, 1998; Garcia-
Bailo, Toguri, Eny, & El-Sohemy, 2009; Guo & Reed, 2001; Keller, et al., 2002;
Kim, Breslin, Reed, & Drayna, 2004). Investigating whether receptor expression is
altered after long-term consumption of a low-fat diet, whether specific genes can be
switched ‘on’ or ‘off’ in response to the environment they are exposed to and how
that links to changes in oral fatty acid sensitivity will be important considerations for
future research.
Chapter 7 – Summary of major findings and conclusions
181
Studies one and two of this thesis failed to find any associations between BMI and
oral fatty acid sensitivity, however study three did find an association between oral
fatty acid sensitivity and BMI. This is reflective of the literature surrounding this
area with some studies finding correlations while others find no relationship.
Reasons for this may be due to the fact that studies which found a relationship
between BMI and sensitivity used an abbreviated screening procedure to determine
oral fatty acid sensitivity and grouped subjects into hypersensitive and hyposensitive,
whereas studies that found no associations used a complete threshold testing
procedure (3-AFC, staircase methodology etc.) (Running, et al., 2013; Stewart, et al.,
2010; Stewart, Newman, et al., 2011). Variance in oral sensitivity to C18:1 cannot be
seen with the grouping method, and therefore relationships between fatty acid
sensitivity and BMI may be exaggerated. Perhaps the most important factor is that
the development of overweight/ obesity is influenced by many factors, therefore it
could be expected that there would only be weak to moderate associations found.
Nevertheless, this raises the question of whether there is an association between the
oral fatty acid sensitivity and BMI, and future research should be conducted to
ascertain whether there is a link and to identify potential implications for reduction
of weight and prevention of obesity. While this thesis found that consumption of a
low-fat diet will increase an individual’s oral sensitivity and in turn decrease BMI,
this association may not apply to the whole population. Sensitivity to fatty acids does
not only relate to the oral cavity, but also the GI tract. Research has reported that the
obese population have a dysfunction in appetite regulation; in other words, their
appetitive responses, including hormone release and satiety mechanisms are
attenuated in response to fat ingestion and digestion (Stewart, Seimon, et al., 2011).

Chapter 7 – Summary of major findings and conclusions
182
Conversely, due to the conflicting findings regarding sensitivity and BMI, some
overweight or obese individuals may be sensitive to fat in both the oral cavity and GI
tract, thus their hormone and satiety responses will be normal when fat is ingested.
However, the same individual may be insensitive to other macronutrients for
example, carbohydrates or proteins, therefore when these macronutrients are
ingested, the satiety response is attenuated. Thus, by restricting the amount of fat
consumed in a fat sensitive individual, increases in the amount of carbohydrates or
proteins consumed may occur, i.e., excess energy intake, which may in turn lead to
continued weight gain. Thus, oral fatty acid sensitivity screening, as well as
screening for sensitivity to carbohydrates and proteins, may be an important
procedure to ascertain the dietary intervention that will best suit each individual.
This information will be useful in designing nutritional interventions targeted at
decreasing dietary fat consumption, and perhaps aid in weight loss and weight
management.
This thesis did not find any changes in preference immediately after a high-fat meal
or after a prolonged period of fat restriction. This suggests that six weeks is long
enough to increase oral fatty acid sensitivity, however is not prolonged enough to see
adaptive changes in preference. To enable adherence and success of a low-fat diet,
preference for low-fat foods needs to be established and is of great importance for
future investigations as for changes in habitual diet to be sustained long-term, a
change in preference needs to occur.
Chapter 7 – Summary of major findings and conclusions
183
Understanding the factors which affect excess energy and dietary fat intake as well
as fat preference is an essential step in reducing fat intake and consequently obesity.
The findings from this thesis add to the growing body of evidence seeking to
understand the functional role of oral fatty acid detection in humans. Oral sensitivity
to fatty acids is a novel research topic and there are still many gaps in the knowledge
base including the role of diet and appetite regulation and genetics, therefore a
number of research studies need to be conducted in the future to address these gaps.
This thesis has answered some of the many research questions within this field, and
in doing so has contributed to the body of evidence surrounding the association
between oral fatty acid sensitivity and diet, emphasising the importance of continued
research in this area. As detailed throughout this thesis, oral fatty acid sensitivity
seems to mimic characteristics of the primary tastes qualities in its reliability and
reproducibility and plays an important role in the detection of fat within the oral
cavity and regulation of fat intake. As such, fatty acid sensing within the oral cavity,
fat intake regulation and appetite regulation all seem to be associated and may
manifest in body weight regulation and importantly, predisposition to obesity.
184
R E F E R E N C E SAbumrad, N. A. (2005). CD36 may determine our desire for dietary fats. Journal of
Clinical Investigation, 115(11), 2965.
Ahne, G., Erras, A., Hummel, T., & Kobal, G. (2000). Assessment of gustatory function by means of tasting tablets. The Laryngoscope, 110(8), 1396-1401.
Alexy, U., Schaefer, A., Sailer, O., Busch-Stockfisch, M., Huthmacher, S., Kunert, J., et al. (2011). Sensory preferences and discrimination ability of children in relation to their body weight status. Journal Of Sensory Studies, 26(6), 409-412.
Australian Bureau of Statistics. (1995). 4804.0 - National Nutrition Survey: Foods Eaten. Canberra.
Australian Bureau of Statistics. (2008). 4364.0 - National Health Survey: Summary of Results, 2007-08 Risk Factors. Canberra.
Bachmanov, A. A., & Beauchamp, G. K. (2007). Taste Receptor Genes. Annual Review of Nutrition, 27(1), 389-414.
Bartoshuk, L. M., Duffy, V. B., & Miller, I. J. (1994). PTC/PROP tasting: anatomy, psychophysics, and sex effects. Physiology & Behavior, 56(6), 1165-1171.
Beermann, C., Jelinek, J., Reinecker, T., Hauenschild, A., Boehm, G., & Klor, H. U. (2003). Short term effects of dietary medium-chain fatty acids and n-3 long-chain polyunsaturated fatty acids on the fat metabolism of healthy volunteers. Lipids in Health & Disease, 2, 10-10.
Bertino, M., Beauchamp, G. K., & Engelman, K. (1986). Increasing dietary salt alters salt taste preference. Physiology & Behavior, 38(2), 203-213.
Blundell, J. E., Lawton, C. L., Cotton, J. R., & Macdiarmid, J. I. (1996). Control of human appetite: implications for the intake of dietary fat. Annual Review of Nutrition, 16, 285-319.
Blundell, J. E., & Macdiarmid, J. I. (1997). Fat as a Risk Factor for Overconsumption: Satiation, Satiety, and Patterns of Eating. Journal Of The American Dietetic Association, 97(7, Supplement), S63-S69.
Blundell, J. E., Stubbs, R. J., Golding, C., Croden, F., Alam, R., Whybrow, S., et al.(2005). Resistance and susceptibility to weight gain: Individual variability in response to a high-fat diet. Physiology & Behavior, 86(5), 614-622.
Bouchard, C. (2008). Gene-environment interactions in the etiology of obesity: defining the fundamentals. Obesity (Silver Spring), 16 Suppl 3, S5-S10.

185
Bray, G. A., Paeratakul, S., & Popkin, B. M. (2004). Dietary fat and obesity: a review of animal, clinical and epidemiological studies. Physiology & Behavior, 83(4), 549-555.
Breslin, P. A. S. (2013). An Evolutionary Perspective on Food and Human Taste. Current Biology, 23(9), R409-R418.
Cartoni, C., Yasumatsu, K., Ohkuri, T., Shigemura, N., Yoshida, R., Godinot, N., et al. (2010). Taste preference for fatty acids is mediated by GPR40 and GPR120. The Journal Of Neuroscience: The Official Journal Of The Society For Neuroscience, 30(25), 8376-8382.
Chale-Rush, A., Burgess, J. R., & Mattes, R. D. (2007a). Evidence for human orosensory (taste?) sensitivity to free fatty acids. Chemical Senses, 32(5), 423-431.
Chale-Rush, A., Burgess, J. R., & Mattes, R. D. (2007b). Multiple routes of chemosensitivity to free fatty acids in humans. American Journal of Physiology: Gastrointestinal & Liver Physiology, 55(5), G1206-G1212.
Cicerale, S., Breslin, P. A. S., Beauchamp, G. K., & Keast, R. S. J. (2009). Sensory characterization of the irritant properties of oleocanthal, a natural anti-inflammatory agent in extra virgin olive oils. Chemical Senses, 34(4), 333-339.
Cooling, J., Barth, J., & Blundell, J. (1998). The high-fat phenotype: Is leptin involved in the adaptive response to a high fat (high energy) diet? International Journal of Obesity and Related Metabolic Disorders, 22(11), 1132.
Cooling, J., & Blundell, J. (1998). Are high-fat and low-fat consumers distinct phenotypes? Differences in the subjective and behavioural response to energy and nutrient challenges. European Journal of Clinical Nutrition, 52(3), 193-201.
Cooling, J., & Blundell, J. E. (2001). High-fat and low-fat phenotypes: habitual eating of high- and low-fat foods not related to taste preference for fat. European Journal of Clinical Nutrition, 55(11), 1016.
Cordain, L., Eaton, S. B., Sebastian, A., Mann, N., Lindeberg, S., Watkins, B. A., et al. (2005). Origins and evolution of the Western diet: health implications for the 21st century. The American Journal Of Clinical Nutrition, 81(2), 341-354.
Covington, D., Briscoe, C., Brown, A., & Jayawickreme, C. (2006). The G-protein-coupled receptor 40 family (GPR40-GPR43) and its role in nutrient sensing. Biochemical Society Transactions, 34, 770-773.
186
Cox, D. N., Perry, L., Moore, P. B., Vallis, L., & Mela, D. J. (1999). Sensory and hedonic associations with macronutrient and energy intakes of lean and obese consumers. International Journal of Obesity and Related Metabolic Disorders, 23(4), 403-410.
Cox, D. N., van Galen, M., Hedderley, D., Perry, L., Moore, P. B., & Mela, D. J. (1998). Sensory and hedonic judgments of common foods by lean consumers and consumers with obesity. Obesity Research, 6(6), 438-447.
Crystal, S. R., & Teff, K. L. (2006). Tasting fat: Cephalic phase hormonal responses and food intake in restrained and unrestrained eaters. Physiology & Behavior, 89(2), 213-220.
Cummings, D. E., & Overduin, J. (2007). Gastrointestinal regulation of food intake. Journal of Clinical Investigation, 117(1), 13-23.
Delwiche, J. (1996). Are there ‘basic’ tastes? Trends in Food Science & Technology, 7(12), 411-415.
Delwiche, J. F., Buletic, Z., & Breslin, P. A. (2001). Covariation in individuals' sensitivities to bitter compounds: evidence supporting multiple receptor/transduction mechanisms. Perception & Psychophysics, 63(5), 761-776.
Diabetes Prevention Program Research Group. (2002). Reduction in the Incidence of Type 2 Diabetes with Lifestyle Intervention or Metformin. New England Journal of Medicine, 346(6), 393-403.
Dinehart, M. E., Hayes, J. E., Bartoshuk, L. M., Lanier, S. L., & Duffy, V. B. (2006). Bitter taste markers explain variability in vegetable sweetness, bitterness, and intake. Physiology & Behavior, 87(2), 304-313.
DiNicolantonio, R., Teow, B. H., & Morgan, T. O. (1984). Sodium detection threshold and preference for sodium chloride in humans on high and low sodium diets. Clinical And Experimental Pharmacology & Physiology, 11(4), 335-338.
Drayna, D. (2005). Human taste genetics. Annual Review of Genomics & Human Genetics, 6(1), 217-C-212.
Dreon, D. M., Frey-Hewitt, B., Ellsworth, N., Williams, P. T., Terry, R. B., & Wood, P. D. (1988). Dietary fat:carbohydrate ratio and obesity in middle-aged men. The American Journal Of Clinical Nutrition, 47(6), 995-1000.
Drewnowski, A. (1997). Why do we like fat? Journal Of The American Dietetic Association, 97, S58.
Drewnowski, A., & Bellisle, F. (2007). Is sweetness addictive? Nutrition Bulletin, 32, 52-60.
187
Drewnowski, A., & Henderson, S. A. (2000). Genetic taste markers and preferences for vegetables and fruit of female breast care patients. Journal Of The American Dietetic Association, 100(2), 191.
Drewnowski, A., Henderson, S. A., & Barratt-Fornell, A. (1998). Genetic sensitivity to 6-n-propylthiouracil and sensory responses to sugar and fat mixtures. Physiology & Behavior, 63(5), 771-777.
Drewnowski, A., Henderson, S. A., Levine, A., & Hann, C. (1999). Taste and food preferences as predictors of dietary practices in young women. Public Health Nutrition, 2(4), 513-519.
Drewnowski, A., Henderson, S. A., & Shore, A. B. (1997). Taste responses to naringin, a flavonoid, and the acceptance of grapefruit juice are related to genetic sensitivity to 6-n-propylthiouracil. The American Journal Of Clinical Nutrition, 66(2), 391-397.
Drewnowski, A., Kurth, C., Holden-Wiltse, J., & Saari, J. (1992). Food preferences in human obesity: carbohydrates versus fats. Appetite, 18(3), 207-221.
Ebba, S., Abarintos, R. A., Kim, D. G., Tiyouh, M., Stull, J. C., Movalia, A., et al. (2012). The examination of fatty acid taste with edible strips. Physiology & Behavior, 106(5), 579-586.
Eden, B., & Noakes, M. (2003). National Heart Foundation of Australia: Position statement on dietary fat and overweight/obesity. Nutrition & Dietetics, 60(3), 174-176.
Eny, K. M., Wolever, T. M. S., Fontaine-Bisson, B. n. d., & El-Sohemy, A. (2008). Genetic variant in the glucose transporter type 2 is associated with higher intakes of sugars in two distinct populations. Physiological Genomics, 33(3), 355-360.
Farbman, A. I. (1980). Renewal of taste bud cells in rat circumvallate papillae. Cell and Tissue Kinetics, 13(4), 349-357.
Feinle, C., O'Donovan, D., Doran, S., Andrews, J. M., Wishart, J., Chapman, I., et al. (2003). Effects of fat digestion on appetite, APD motility, and gut hormones in response to duodenal fat infusion in humans. American Journal Of Physiology Gastrointestinal And Liver Physiology, 284(5), G798-G807.
Feltrin, K. L., Little, T. J., Meyer, J. H., Horowitz, M., Smout, A. J. P. M., Wishart, J., et al. (2004). Effects of intraduodenal fatty acids on appetite, antropyloroduodenal motility, and plasma CCK and GLP- 1 in humans vary with their chain length. American Journal of Physiology: Regulatory, Integrative & Comparative Physiology, 56(3), R524-R533.
188
Flegal, K. M., Kit, B. K., Orpana, H., & Graubard, B. I. (2013). Association of all-cause mortality with overweight and obesity using standard body mass index categories: a systematic review and meta-analysis. The Journal Of The American Medical Association, 309(1), 71-82.
Forouhi, N. G., Sharp, S. J., Du, H., van der A, D. L., Halkjaer, J., Schulze, M. B., et al. (2009). Dietary fat intake and subsequent weight change in adults: results from the European Prospective Investigation into Cancer and Nutrition cohorts. The American Journal Of Clinical Nutrition, 90(6), 1632-1641.
Fukuwatari, T., Shibata, K., Iguchi, K., Saeki, T., Iwata, A., Tani, K., et al. (2003). Role of gustation in the recognition of oleate and triolein in anosmic rats. Physiology & Behavior, 78(4-5), 579-583.
Galindo-Cuspinera, V., Waeber, T., Antille, N., Hartmann, C., Stead, N., & Martin, N. (2009). Reliability of Threshold and Suprathreshold Methods for Taste Phenotyping: Characterization with PROP and Sodium Chloride. Chemosensory Perception, 2(4), 214-228.
Galindo, M. M., Voigt, N., Stein, J., van Lengerich, J., Raguse, J.-D., Hofmann, T., et al. (2012). G protein-coupled receptors in human fat taste perception. Chemical Senses, 37(2), 123-139.
Garcia-Bailo, B., Toguri, C., Eny, K. M., & El-Sohemy, A. (2009). Genetic variationin taste and its influence on food selection. Omics: A Journal Of Integrative Biology, 13(1), 69-80.
Gaunt, T. R., Cooper, J. A., Miller, G. J., Day, I. N. M., & O’Dell, S. D. (2001). Positive associations between single nucleotide polymorphisms in the IGF2 gene region and body mass index in adult males. Human Molecular Genetics, 10(14), 1491-1501.
Gibson, J. J. (1967). New Reasons for Realism. Synthese, 17(2), 162-172.
Gibson, R. S. (2005). Principles of nutritional assessment (2 ed.). New York: Oxford University Press.
Gilbertson, T. A. (1998). Gustatory mechanisms for the detection of fat. Current Opinion In Neurobiology, 8(4), 447-452.
Gilbertson, T. A., Damak, S., & Margolskee, R. F. (2000). The molecular physiology of taste transduction. Current Opinion In Neurobiology, 10(4), 519-527.
Gilbertson, T. A., & Fontenot, D. T. (1997). Fatty acid modulation of K+ channels in taste receptor cells: Gustatory cues for dietary fat. American Journal of Physiology, 272(4), C1203.
189
Gilbertson, T. A., Liu, L., Kim, I., Burks, C. A., & Hansen, D. R. (2005). Fatty acid responses in taste cells from obesity-prone and -resistant rats. Physiology & Behavior, 86(5), 681-690.
Gilbertson, T. A., Liu, L., York, D. A., & Bray, G. A. (1998). Dietary fat preferences are inversely correlated with peripheral gustatory fatty acid sensitivity. Annals Of The New York Academy Of Sciences, 855, 165-168.
Gotoh, C., Hong, Y.-H., Iga, T., Hishikawa, D., Suzuki, Y., Song, S.-H., et al. (2007). The regulation of adipogenesis through GPR120. Biochemical and Biophysical Research Communications, 354(2), 591-597.
Green, B. G. (2003). Studying taste as a cutaneous sense. Food Quality and Preference, 14(2), 99-109.
Guo, S. W., & Reed, D. R. (2001). The genetics of phenylthiocarbamide perception.Annals of Human Biology, 28(2), 111-142.
Hall, M. J., Bartoshuk, L. M., Cain, W. S., & Stevens, J. C. (1975). PTC taste blindness and the taste of caffeine. Nature, 253(5491), 442-443.
Harris, C. V., Bradlyn, A. S., Coffman, J., Gunel, E., & Cottrell, L. (2008). BMI-based body size guides for women and men: development and validation of a novel pictorial method to assess weight-related concepts. International Journal of Obesity, 32(2), 336-342.
Haupt, A. (2009). Variation in the FTO Gene Influences Food Intake but not Energy Expenditure. Experimental and Clinical Endocrinology and Diabetes, 117(4), 194-197.
Hayes, J. E., & Duffy, V. B. (2008). Oral sensory phenotype identifies level of sugar and fat required for maximal liking. Physiology & Behavior, 95(1-2), 77-87.
Hayes, J. E., & Keast, R. S. J. (2011). Two decades of supertasting: Where do we stand? Physiology & Behavior, 104(5), 1072-1074.
Hayes, J. E., Sullivan, B. S., & Duffy, V. B. (2010). Explaining variability in sodium intake through oral sensory phenotype, salt sensation and liking. Physiology & Behavior, 100(4), 369-380.
Heini, A. F., Lara-Castro, C., Kirk, K. A., Considine, R. V., Caro, J. F., & Weinsier, R. L. (1998). Association of leptin and hunger-satiety ratings in obese women. International Journal of Obesity and Related Metabolic Disorders : Journal of the International Association for the Study of Obesity, 22(11), 1084-1087.
Hiraoka, T., Fukuwatari, T., Imaizumi, M., & Fushiki, T. (2003). Effects of oral stimulation with fats on the cephalic phase of pancreatic enzyme secretion in esophagostomized rats. Physiology & Behavior, 79(4-5), 713-717.

190
Hoad, V., Somerford, P., & Katzenellenbogen, J. (2010). High body mass index overtakes tobacco as the leading independent risk factor contributing todisease burden in Western Australia. Australian and New Zealand Journal of Public Health, 34(2), 214-215.
Ichimura, A., Hirasawa, A., Poulain-Godefroy, O., Bonnefond, A., Hara, T., Yengo, L., et al. (2012). Dysfunction of lipid sensor GPR120 leads to obesity in both mouse and human. Nature, 483, 350-354.
International Organisation for Standardisation. (1991). Sensory analysis-Methodology- Method of investigating sensitivity of taste. ISO 3972(3).
Jackson, S. J., Leahy, F. E., McGowan, A. A., Bluck, L. J., Coward, W. A., & Jebb, S. A. (2004). Delayed gastric emptying in the obese: an assessment using the non-invasive (13)C-octanoic acid breath test. Diabetes, Obesity and Metabolism, 6(4), 264-270.
Kamphuis, M. M. J. W., Lejeune, M. P. G. M., Saris, W. H. M., & Westerterp-Plantenga, M. S. (2003). Effect of conjugated linoleic acid supplementation after weight loss on appetite and food intake in overweight subjects. European Journal of Clinical Nutrition, 57(10), 1268.
Kamphuis, M. M. J. W., Saris, W. H. M., & Westerterp-Plantenga, M. S. (2003). The effect of addition of linoleic acid on food intake regulation in linoleic acid tasters and linoleic acid non-tasters. The British Journal Of Nutrition, 90(1), 199-206.
Kamphuis, M. M. J. W., & Westerterp-Plantenga, M. S. (2003). PROP sensitivity affects macronutrient selection. Physiology & Behavior, 79(2), 167.
Kamphuis, M. M. J. W., Westerterp-Plantenga, M. S., & Saris, W. H. M. (2001). Fat-specific satiety in humans for fat high in linoleic acid vs fat high in oleic acid. European Journal of Clinical Nutrition, 55(6), 499.
Kawai, T., & Fushiki, T. (2003). Importance of lipolysis in oral cavity for orosensory detection of fat. American Journal of Physiology: Regulatory, Integrative & Comparative Physiology, 54(2), R447-R454.
Keast, R. S. J., Azzopardi, K. M., Newman, L. P., & Haryono, R. Y. (2013). Impaired oral fatty acid chemoreception is associated with acute excess energy consumption. Unpublished manuscript. School of Exercise and Nutrition Sciences, Deakin University, Melbourne, Australia.
Keast, R. S. J., Bournazel, M. M. E., & Breslin, P. A. S. (2003). A psychophysical investigation of binary bitter-compound interactions. Chemical Senses, 28(4), 301-313.

191
Keast, R. S. J., & Breslin, P. A. S. (2002). Cross-adaptation and bitterness inhibition of L-tryptophan, L-phenylalanine and urea: further support for shared peripheral physiology. Chemical Senses, 27(2), 123-131.
Keast, R. S. J., & Roper, J. (2007). A complex relationship among chemical concentration, detection threshold, and suprathreshold intensity of bitter compounds. Chemical Senses, 32(3), 245-253.
Keller, K. L., Liang, L. C. H., Sakimura, J., May, D., van Belle, C., Breen, C., et al. (2012). Common variants in the CD36 gene are associated with oral fat perception, fat preferences, and obesity in African Americans. Obesity, 20(5), 1066-1073.
Keller, K. L., Steinmann, L., Nurse, R. J., & Tepper, B. J. (2002). Genetic taste sensitivity to 6-n-propylthiouracil influences food preference and reported intake in preschool children. Appetite, 38(1), 3.
Kim, U. K., Breslin, P. A. S., Reed, D., & Drayna, D. (2004). Genetics of human taste perception. Journal of Dental Research, 83(6), 448-453.
Krarup, B. (1958). Electro-gustometry: a method for clinical taste examinations. Acta Oto-Laryngologica, 49, 294-305.
Kulkarni, B., & Mattes, R. (2013). Evidence for presence of nonesterified Fatty acids as potential gustatory signaling molecules in humans. Chemical Senses, 38(2), 119-127.
Laddu, D., Dow, C., Hingle, M., Thomson, C., & Going, S. (2011). A Review of Evidence-Based Strategies to Treat Obesity in Adults. Nutrition in Clinical Practice, 26(5), 512-525.
Laffargue, A., de Kochko, A., & Dussert, S. (2007). Development of solid-phase extraction and methylation procedures to analyse free fatty acids in lipid-rich seeds. Plant Physiology & Biochemistry, 45(3-4), 250-257.
Lange, U. C., & Schneider, R. (2010). What an epigenome remembers. Bioessays, 32(8), 659-668.
Laugerette, F., Gaillard, D., Passilly-Degrace, P., Niot, I., & Besnard, P. (2007). Do we taste fat? Biochimie, 89(2), 265-269.
Laugerette, F., Passilly-Degrace, P., Patris, B., Niot, I., Febbraio, M., Montmayeur, J.-P., et al. (2005). CD36 involvement in orosensory detection of dietary lipids, spontaneous fat preference, and digestive secretions. Journal of Clinical Investigation, 115(11), 3177.
le Roux, C. W., Batterham, R. L., Aylwin, S. J. B., Patterson, M., Borg, C. M., Wynne, K. J., et al. (2006). Attenuated peptide YY release in obese subjects is associated with reduced satiety. Endocrinology, 147(1), 3-8.

192
Liang, L. C., Sakimura, J., May, D., Breen, C., Driggin, E., Tepper, B. J., et al. (2012). Fat discrimination: a phenotype with potential implications for studying fat intake behaviors and obesity. Physiology and Behavior, 105(2), 470-475.
Linschoten, M. R., Harvey, L. O., Jr., Eller, P. M., & Jafek, B. W. (2001). Fast and accurate measurement of taste and smell thresholds using a maximum-likelihood adaptive staircase procedure. Perception & Psychophysics, 63(8), 1330-1347.
Little, T. J., & Feinle-Bisset, C. (2010). Oral and gastrointestinal sensing of dietary fat and appetite regulation in humans: modification by diet and obesity. Frontiers In Neuroscience, 4, 178-178.
Little, T. J., & Feinle-Bisset, C. (2011). Effects of dietary fat on appetite and energy intake in health and obesity-oral and gastrointestinal sensory contributions. Physiology & Behavior, 104(4), 613-620.
Little, T. J., Horowitz, M., & Feinle-Bisset, C. (2007). Modulation by high-fat diets of gastrointestinal function and hormones associated with the regulation of energy intake: implications for the pathophysiology of obesity. The American Journal Of Clinical Nutrition, 86(3), 531-541.
Liu, P., Shah, B. P., Croasdell, S., & Gilbertson, T. A. (2011). Transient Receptor Potential Channel Type M5 Is Essential for Fat Taste. Journal of Neuroscience, 31(23), 8634-8642.
Margerison, C., Nowson, C. A., Worsley, T., Jorna, M. K., & Frame, A. G. (2003). Fruit and vegetable intake prior to and following a 4-week intervention (OZDASH study). The Asia Pacific Journal of Clinical Nutrition, 12 Suppl,S19.
Margolskee, R. F., Dyer, J., Kokrashvili, Z., Salmon, K. S. H., Ilegems, E., Daly, K., et al. (2007). T1R3 and gustducin in gut sense sugars to regulate expression of Na+-glucose cotransporter 1. Proceedings of the National Academy of Sciences of the United States of America, 104(38), 15075-15080.
Martin, C., Passilly-Degrace, P., Gaillard, D., Merlin, J.-F., Chevrot, M., & Besnard, P. (2011). The Lipid-Sensor Candidates CD36 and GPR120 Are Differentially Regulated by Dietary Lipids in Mouse Taste Buds: Impact on Spontaneous Fat Preference. PLoS ONE, 6(8), e24014.
Matsumura, S., Eguchi, A., Mizushige, T., Kitabayashi, N., Tsuzuki, S., Inoue, K., et al. (2009). Colocalization of GPR120 with phospholipase- -gustducin in the taste bud cells in mice. Neuroscience Letters, 450(2), 186-190.
193
Matsumura, S., Mizushige, T., Yoneda, T., Iwanaga, T., Tsuzuki, S., Inoue, K., et al. (2007). GPR expression in the rat taste bud relating to fatty acid sensing. Biomedical Research, 28(1), 49-55.
Mattes, R. D. (1993). Fat preference and adherence to a reduced-fat diet. The American Journal Of Clinical Nutrition, 57(3), 373-381.
Mattes, R. D. (1997). The taste for salt in humans. The American Journal Of Clinical Nutrition, 65(2 Suppl), 692S-697S.
Mattes, R. D. (2001a). Oral exposure to butter, but not fat replacers elevates postprandial triacylglycerol concentration in humans. The Journal Of Nutrition, 131(5), 1491-1496.
Mattes, R. D. (2001b). The taste of fat elevates postprandial triacylglycerol. Physiology & Behavior, 74(3), 343-348.
Mattes, R. D. (2005). Fat taste and lipid metabolism in humans. Physiology & Behavior, 86(5), 691-697.
Mattes, R. D. (2009a). Brief oral stimulation, but especially oral fat exposure, elevates serum triglycerides in humans. American Journal of Physiology: Gastrointestinal & Liver Physiology, 59(2), G365-G371.
Mattes, R. D. (2009b). Is there a fatty acid taste? Annual Review of Nutrition, 29,305-327.
Mattes, R. D. (2009c). Oral Detection of Short-, Medium-, and Long-Chain Free Fatty Acids in Humans. Chemical Senses, 34, 145-150.
Mattes, R. D. (2009d). Oral Thresholds and Suprathreshold Intensity Ratings for Free Fatty Acids on 3 Tongue Sites in Humans: Implications for Transduction Mechanisms. Chemical Senses, 34(5), 415-423.
Mattes, R. D. (2011a). Accumulating evidence supports a taste component for free fatty acids in humans. Physiology & Behavior, 104(4), 624-631.
Mattes, R. D. (2011b). Oral fatty acid signaling and intestinal lipid processing: Support and supposition. Physiology & Behavior, 105(1), 27-35.
McCormack, D. N., Clyburn, V. L., & Pittman, D. W. (2006). Detection of free fatty acids following a conditioned taste aversion in rats. Physiology & Behavior, 87(3), 582-594.
Mela, D. J. (1996). Eating behaviour, food preferences and dietary intake in relation to obesity and body-weight status. The Proceedings Of The Nutrition Society, 55(3), 803-816.

194
Mela, D. J., & Sacchetti, D. A. (1991). Sensory preferences for fats: relationships with diet and body composition. The American Journal Of Clinical Nutrition, 53(4), 908-915.
Miller, W. C., Lindeman, A. K., Wallace, J., & Niederpruem, M. (1990). Diet composition, energy intake, and exercise in relation to body fat in men and women. The American Journal Of Clinical Nutrition, 52(3), 426-430.
Mindell, S., Smith, G. P., & Greenberg, D. (1990). Corn oil and mineral oil stimulate sham feeding in rats. Physiology & Behavior, 48(2), 283-287.
Montmayeur, J.-P., & le Coutre, J. (2010). Fat Detection: Taste, Texture, and Post Ingestive Effects. Boca Raton: CRC Press.
Moore, M. E., Linker, E., & Purcell, M. (1965). Taste-Sensitivity after Eating: A Signal-Detection Approach. The American Journal of Psychology, 78(1), 107-111.
Mueller, C. A., Pintscher, K., & Renner, B. (2011). Clinical test of gustatory function including umami taste. The Annals Of Otology, Rhinology, And Laryngology, 120(6), 358-362.
Nachtsheim, R., & Schlich, E. (2013). The influence of 6-n-propylthiouracil bitterness, fungiform papilla count and saliva flow on the perception of pressure and fat. Food Quality and Preference, 29(2), 137-145.
Nasser, J. A., Kissileff, H. R., Boozer, C. N., Chou, C. J., & Pi-Sunyer, F. X. (2001). PROP taster status and oral fatty acid perception. Eating Behaviors, 2(3), 237-245.
National Health and Medical Research Council. (2006). Nutrient Reference Values for Australia and New Zealand. Canberra: NHMRC.
Naville, D., Duchampt, A., Vigier, M., Oursel, D., Lessire, R., Poirier, H., et al. (2012). Link between intestinal CD36 ligand binding and satiety induced by a high protein diet in mice. PLoS ONE, 7(1), e30686-e30686.
Nestle, M., & Woteki, C. (1999). Interpretation of dietary change in the United States: fat as an indicator. Appetite, 32(1), 107-112.
Newman, L. P., Haryono, R. Y., & Keast, R. S. J. (2013). Functionality of fatty acid chemoreception: a potential factor in the development of obesity? Nutrients, 5(4), 1287-1300.
Newman, L. P., & Keast, R. S. J. (2013). The Test–Retest Reliability of Fatty Acid Taste Thresholds. Chemosensory Perception, 6(2), 70-77.
195
Nishida, C., Ko, G. T., & Kumanyika, S. (2010). Body fat distribution and noncommunicable diseases in populations: overview of the 2008 WHO Expert Consultation on Waist Circumference and Waist–Hip Ratio. European Journal of Clinical Nutrition, 64(1), 2-5.
O'Mahony, M. (1979). Salt taste adaptation: the psychophysical effects of adapting solutions and residual stimuli from prior tastings on the taste of sodium chloride. Perception, 8(4), 441-476.
O'Sullivan, T. A., Ambrosini, G., Beilin, L. J., Mori, T. A., & Oddy, W. H. (2011). Dietary intake and food sources of fatty acids in Australian adolescents. Nutrition, 27(2), 153-159.
Pallant, J. (2011). SPSS survival manual (4 ed.). Crows Nest, NSW, Australia: Allen and Unwin.
Pangborn, R. M. (1959). Influence of hunger on sweetness preferences and taste thresholds. The American Journal Of Clinical Nutrition, 7(3), 280-287.
Pasquet, P., Monneuse, M.-O., Simmen, B., Marez, A., & Hladik, C.-M. (2006). Relationship between taste thresholds and hunger under debate. Appetite, 46(1), 63-66.
Pedersen, S. D., Kang, J., & Kline, G. A. (2007). Portion control plate for weight loss in obese patients with type 2 diabetes mellitus: a controlled clinical trial. Archives of Internal Medicine, 167(12), 1277-1283.
Pepino, M. Y., Love-Gregory, L., Klein, S., & Abumrad, N. A. (2012). The fatty acid translocase gene CD36 and lingual lipase influence oral sensitivity to fat in obese subjects. Journal of Lipid Research, 53(3), 561-566.
Phillips, C. M., Kesse-Guyot, E., McManus, R., Hercberg, S., Lairon, D., Planells, R., et al. (2012). High dietary saturated fat intake accentuates obesity risk associated with the fat mass and obesity-associated gene in adults. The Journal Of Nutrition, 142(5), 824-831.
Pingel, J., Ostwald, J., Pau, H. W., Hummel, T., & Just, T. (2010). Normative data for a solution-based taste test. European Archives of Oto-Rhino-Laryngology, 267(12), 1911-1917.
Pittman, D. W., Smith, K. R., Crawley, M. E., Corbin, C. H., Hansen, D. R., Watson, K. J., et al. (2008). Orosensory Detection of Fatty Acids by Obesity-Prone and Obesity-Resistant Rats: Strain and Sex Differences. Chemical Senses, 33(5), 449-460.
Potosky, A. L., Block, G., & Hartman, A. M. (1990). The apparent validity of diet questionnaires is influenced by numberof diet-record days used for comparison. Journal Of The American Dietetic Association, 90(6), 810.

196
Prentice, A. M., & Jebb, S. A. (2003). Fast foods, energy density and obesity: a possible mechanistic link. Obesity Reviews, 4(4), 187-194.
Primeaux, S., Braymer, H. D., & Bray, G. (2013). CD36 mRNA in the Gastrointestinal Tract Is Differentially Regulated by Dietary Fat Intake in Obesity-Prone and Obesity-Resistant Rats. Digestive Diseases and Sciences, 58(2), 363-370.
Reiner, D. J., Jan, T. A., Boughter, J. D., Jr., Li, C. X., Lu, L., Williams, R. W., et al. (2008). Genetic analysis of tongue size and taste papillae number and size in recombinant inbred strains of mice. Chemical Senses, 33(8), 693-707.
Rissanen, A., Hakala, P., Lissner, L., Mattlar, C. E., Koskenvuo, M., & Ronnemaa, T. (2002). Acquired preference especially for dietary fat and obesity: a study of weight-discordant monozygotic twin pairs. International Journal Of Obesity And Related Metabolic Disorders: Journal Of The International Association For The Study Of Obesity, 26(7), 973-977.
Rokholm, B., Baker, J. L., & Sørensen, T. I. A. (2010). The levelling off of the obesity epidemic since the year 1999 - a review of evidence and perspectives. Obesity Reviews, 11(12), 835-846.
Rolls, B. J., Kim-Harris, S., Fischman, M. W., Foltin, R. W., Moran, T. H., & Stoner, S. A. (1994). Satiety after preloads with different amounts of fat and carbohydrate: implications for obesity. The American Journal Of Clinical Nutrition, 60(4), 476-487.
Romieu, I., Willett, W. C., Stampfer, M. J., Colditz, G. A., Sampson, L., Rosner, B., et al. (1988). Energy intake and other determinants of relative weight. The American Journal Of Clinical Nutrition, 47(3), 406-412.
Running, C. A., Mattes, R. D., & Tucker, R. M. (2013). Fat taste in humans: Sources of within- and between-subject variability. Progress in Lipid Research, 52(4), 438-445.
Salbe, A. D., DelParigi, A., Pratley, R. E., Drewnowski, A., & Tataranni, P. A. (2004). Taste preferences and body weight changes in an obesity-prone population. The American Journal Of Clinical Nutrition, 79(3), 372-378.
Schifferstein, H. N., & Verlegh, P. W. (1996). The role of congruency and pleasantness in odor-induced taste enhancement. Acta Psychologica, 94(1), 87-105.
Sclafani, A., & Ackroff, K. (2012). Role of gut nutrient sensing in stimulating appetite and conditioning food preferences. American Journal of Physiology: Regulatory, Integrative and Comparative Physiology, 302(10), R1119-1133.
197
Sclafani, A., Ackroff, K., & Abumrad, N. A. (2007). CD36 gene deletion reduces fat preference and intake but not post-oral fat conditioning in mice. American Journal of Physiology: Regulatory, Integrative and Comparative Physiology, 293(5), R1823-1832.
Shahbake, M., Hutchinson, I., Laing, D. G., & Jinks, A. L. (2005). Rapid quantitative assessment of fungiform papillae density in the human tongue. Brain Research, 1052(2), 196-201.
Simons, P. J., Kummer, J. A., Luiken, J. J. F. P., & Boon, L. (2010). Apical CD36 immunolocalization in human and porcine taste buds from circumvallate and foliate papillae. Acta Histochemica, 113(8), 839-843.
Sims, J., Hill, K., Hunt, S., & Haralambous, B. (2010). Physical activity recommendations for older Australians. Australasian Journal On Ageing, 29(2), 81-87.
Sizing up food portions. (2010). Consumer Reports on Health, 22(3), 7-7.
Smit, H. J., Kemsley, E. K., Tapp, H. S., & Henry, C. J. K. (2011). Does prolonged chewing reduce food intake? Fletcherism revisited. Appetite, 57(1), 295-298.
Smutzer, G., Lam, S., Hastings, L., Desai, H., Abarintos, R. A., Sobel, M., et al. (2008). A Test for Measuring Gustatory Function. The Laryngoscope, 118(8), 1411-1416.
Snoek, H. t. M., Huntjens, L., Van Gemert, L. J., De Graaf, C., & Weenen, H. (2004). Sensory-specific satiety in obese and normal-weight women. The American Journal Of Clinical Nutrition, 80(4), 823-831.
Sørensen, L. B., Møller, P., Flint, A., Martens, M., & Raben, A. (2003). Effect of sensory perception of foods on appetite and food intake: a review of studies on humans. International Journal of Obesity and Related Metabolic Disorders, 27(10), 1152.
Speakman, J. R., Rance, K. A., & Johnstone, A. M. (2008). Polymorphisms of the FTO gene are associated with variation in energy intake, but not energy expenditure. Obesity, 16(8), 1961-1965.
Speechly, D. P., & Buffenstein, R. (2000). Appetite dysfunction in obese males: evidence for role of hyperinsulinaemia in passive overconsumption with a high fat diet. European Journal of Clinical Nutrition, 54(3), 225-233.
Stein, A. D., Kahn, H. S., Rundle, A., Zybert, P. A., van der Pal-de Bruin, K., & Lumey, L. H. (2007). Anthropometric measures in middle age after exposure to famine during gestation: evidence from the Dutch famine. The American Journal Of Clinical Nutrition, 85(3), 869-876.
198
Sternini, C., Anselmi, L., & Rozengurt, E. (2008). Enteroendocrine cells: a site of 'taste' in gastrointestinal chemosensing. Current Opinion in Endocrinology Diabetes and Obesity, 15(1), 73-78.
Stevens, J. C., Cruz, L. A., Hoffman, J. M., & Patterson, M. Q. (1995). Taste sensitivity and aging: high incidence of decline revealed by repeated threshold measures. Chemical Senses, 20(4), 451-459.
Stewart, A. L., Mills, K. M., King, A. C., Haskell, W. L., Gillis, D., & Ritter, P. L. (2001). CHAMPS physical activity questionnaire for older adults: outcomes for interventions. Medicine and Science in Sports and Exercise, 33(7), 1126-1141.
Stewart, J. E., Feinle-Bisset, C., Golding, M., Delahunty, C., Clifton, P. M., & Keast, R. S. J. (2010). Oral sensitivity to fatty acids, food consumption and BMI in human subjects. British Journal Of Nutrition, 104(1), 145-152.
Stewart, J. E., & Keast, R. S. J. (2012). Recent fat intake modulates fat taste sensitivity in lean and overweight subjects. International Journal Of Obesity, 36(6), 834-842.
Stewart, J. E., Newman, L. P., & Keast, R. S. J. (2011). Oral sensitivity to oleic acid is associated with fat intake and body mass index. Clinical Nutrition, 6(0), 838-844.
Stewart, J. E., Seimon, R. V., Otto, B., Keast, R. S. J., Clifton, P. M., & Feinle-Bisset, C. (2011). Marked differences in gustatory and gastrointestinal sensitivity to oleic acid between lean and obese men. The American Journal Of Clinical Nutrition, 93(4), 703-711.
Stoeckel, L. E., Weller, R. E., Giddings, M., & Cox, J. E. (2008). Peptide YY levels are associated with appetite suppression in response to long-chain fatty acids. Physiology & Behavior, 93(1-2), 289-295.
Stratford, J. M., Curtis, K. S., & Contreras, R. J. (2006). Chorda tympani nerve transection alters linoleic acid taste discrimination by male and female rats. Physiology & Behavior, 89(3), 311-319.
Suchecka, W., Klimacka-Nawrot, E., Galazka, A., Hartman, M., & Blonska-Fajfrowska, B. (2011). Wplyw spozycia posilku wysokoweglowodanowego na percepcje smaku. [Influence of a high-carbohydrate meal on taste perception]. Wiadomosci Lekarskie, 64(2), 84-90.
Swinburn, B. A., Sacks, G., Hall, K. D., McPherson, K., Finegood, D. T., Moodie, M. L., et al. (2011). The global obesity pandemic: shaped by global drivers and local environments. The Lancet, 378(9793), 804-814.
199
Takeda, M., Sawano, S., Imaizumi, M., & Fushiki, T. (2001). Preference for corn oil in olfactory-blocked mice in the conditioned place preference test and the two-bottle choice test. Life Sciences, 69(7), 847-854.
Tanaka, T., Katsuma, S., Adachi, T., Koshimizu, T.-a., Hirasawa, A., & Tsujimoto, G. (2008). Free fatty acids induce cholecystokinin secretion through GPR120. Naunyn-Schmiedeberg's Archives of Pharmacology, 377(4), 523-527.
Tanofsky-Kraff, M., Han, J. C., Anandalingam, K., Shomaker, L. B., Columbo, K. M., Wolkoff, L. E., et al. (2009). The FTO gene rs9939609 obesity-risk allele and loss of control over eating. The American Journal Of Clinical Nutrition, 90(6), 1483-1488.
Tepper, B. J., & Nurse, R. J. (1997). Fat perception is related to PROP taster status. Physiology & Behavior, 61(6), 949-954.
The Australian National Preventive Health Agency. (2012). Swap it, don't stop it. Retrieved 16/04/13, from http://swapit.gov.au/
Tsuruta, M., Kawada, T., Fukuwatari, T., & Fushiki, T. (1999). The orosensory recognition of long-chain fatty acids in rats. Physiology & Behavior, 66(2), 285-288.
Tucker, L. A., & Kano, M. J. (1993). Dietary fat and body fat: A multivariate study of 205 adult females. Journal Of The American Dietetic Association, 93(3), 345.
Tucker, L. A., Seljaas, G. T., & Hager, R. L. (1997). Body fat percentage of children varies according to their diet composition. Journal Of The American Dietetic Association, 97(9), 981-986.
Tucker, R. M., Laguna, L., Quinn, R., & Mattes, R. D. (2013). The Effect of Short, Daily Oral Exposure on Non-esterified Fatty Acid Sensitivity. Chemosensory Perception, 6(2), 78-85.
Tucker, R. M., & Mattes, R. D. (2012). Are Free Fatty Acids Effective Taste Stimuli in Humans? Journal of Food Science, 77(3), S148-S151.
Tucker, R. M., & Mattes, R. D. (2013). Influences of repeated testing on nonesterified fatty acid taste. Chemical Senses, 38(4), 325-332.
Turnbull, B., & Matisoo-Smith, E. (2002). Taste sensitivity to 6-n-propylthiouracil predicts acceptance of bitter-tasting spinach in 3-6-y-old children. The American Journal Of Clinical Nutrition, 76(5), 1101-1105.
200
Vazquez Roque, M. I., Camilleri, M., Stephens, D. A., Jensen, M. D., Burton, D. D., Baxter, K. L., et al. (2006). Gastric sensorimotor functions and hormone profile in normal weight, overweight, and obese people. Gastroenterology, 131(6), 1717-1724.
Verdich, C., Madsen, J. L., Toubro, S., Buemann, B., Holst, J. J., & Astrup, A. (2000). Effect of obesity and major weight reduction on gastric emptying. International Journal of Obesity and Related Metabolic Disorders, 24(7), 899.
Villarino, B. J., Fernandez, C. P., Alday, J. C., & Cubelo, C. G. R. (2009). Relationship of PROP (6-n-propylthiouracil) taster status with the body mass index and food preferences of Filipino adults. Journal Of Sensory Studies, 24(3), 354-371.
Voss, S., Kroke, A., Klipstein-Grobusch, K., & Boeing, H. (1998). Is macronutrient composition of dietary intake data affected by underreporting? Results from the EPIC-Potsdam Study. European Prospective Investigation into Cancer and Nutrition. European Journal of Clinical Nutrition, 52(2), 119.
Wang, Y. C., McPherson, K., Marsh, T., Gortmaker, S. L., & Brown, M. (2011). Health and economic burden of the projected obesity trends in the USA and the UK. The Lancet, 378(9793), 815-825.
Westerterp-Plantenga, M. S. (2003). The significance of protein in food intake and body weight regulation. Current Opinion in Clinical Nutrition & Metabolic Care, 6(6), 635-638.
Westerterp, K. R. (2006). Perception, passive overfeeding and energy metabolism. Physiology & Behavior, 89(1), 62-65.
World Health Organisation. (2000). Obesity: preventing and managing the global epidemic. Report of a WHO consultation (No. 0512-3054 (Print)).
Yang, J., Loos, R. J., Powell, J. E., Medland, S. E., Speliotes, E. K., Chasman, D. I., et al. (2012). FTO genotype is associated with phenotypic variability of body mass index. Nature, 490(7419), 267-272.
Yeomans, M. R., Gray, R. W., Mitchell, C. J., & True, S. (1997). Independent effects of palatability and within-meal pauses on intake and appetite ratings in human volunteers. Appetite, 29(1), 61-76.
Yeomans, M. R., Lee, M. D., Gray, R. W., & French, S. J. (2001). Effects of test-meal palatability on compensatory eating following disguised fat and carbohydrate preloads. International Journal of Obesity and Related Metabolic Disorders, 25(8), 1215.

201
Yeomans, M. R., Tovey, H. M., Tinley, E. M., & Haynes, C. J. (2004). Effects of manipulated palatability on appetite depend on restraint and disinhibition scores from the Three-Factor Eating Questionnaire. International Journal of Obesity and Related Metabolic Disorders, 28(1), 144-151.
Zhang, X.-J., Zhou, L.-H., Ban, X., Liu, D.-X., Jiang, W., & Liu, X.-M. (2011). Decreased expression of CD36 in circumvallate taste buds of high-fat diet induced obese rats. Acta Histochemica, 113(6), 663-667.
Zhao, L., Kirkmeyer, S. V., & Tepper, B. J. (2003). A paper screening test to assess genetic taste sensitivity to 6-n-propylthiouracil. Physiology & Behavior, 78(4-5), 625-633.
Zverev, Y. P. (2004). Effects of caloric deprivation and satiety on sensitivity of the gustatory system. BMC Neuroscience, 5, 5-5.

Appendix A
Screening form

Screening form
Subject ID________
Source of study________________
Date________
1. D.O.B_______ Age__________ (include 18-75years)
2. Male or female______________
3. Estimated weight (kg)________
4. Estimated height (metres)_______
5. Estimated BMI (kg/m2)________
(include BMI>20 (kg/m2)
6. Do you currently smoke? Yes / No
7. If no to question 6, were you previously a smoker?
8. If yes to question 7, when did you stop smoking?____________________________________________
9. Have you ever been diagnosed with a heart condition? Yes/No
If yes, provide details
______________________________________________________________________________________________________________
10. Do you have any other medical conditions? Yes/No
If yes, provide details
_______________________________________________________

11.Are you taking any prescription medications on a regular basis?Yes / No
If yes, fill in details below.
Medication name ReasonEg Lipitor High cholesterol
12.Are you taking any non prescription medications on a regular basis? Yes / No
If yes, fill in details below
Medication name ReasonEg Panadol Headache
13.Do you have any food allergies or food intolerances? Yes / No
If yes, provide details___________________________________
14.Will you be able to make dietary changes for 6 weeks? Yes / No
(eg reduce fat, 2 serves of fruit/day, 5 serves veg/day, reduce takeaway food and restaurant meals)

15.Will you be able to do moderate exercise for 30 minutes per day for 6 weeks? Yes / No
(eg walking or swimming)
16.Will you be able to taste test a variety of different foods including milk, custard, mousse, cream cheese and yoghurt? Yes / No
17. Are you able to attend Deakin University at the Burwood Campus for two appointments? Yes / No
Subject eligible. Yes / No
If no, provide reason
_______________________________________________________Plan
Appointment booked for WAT study. Yes/No If no, explain plan __________________________________________________________________________________________________________________
Date of appointment:_______________________________________________
Car park booked. Yes/No Research Carpark 1 or 2
Date and time of reminder_____________________________________
Date paperwork sent:________________________________________
Telephone call reminder:__________________________________________________

Appendix B
Detection threshold form

Threshold formSubject ID:
Session #:
DOB:
Height:
Weight:
Concentrations: Oleic acid
CONCENTRATION ATTEMPTS (X = incorrect, = correct)
0.02mM
0.06mM
1.0mM
1.4mM
2.0mM
2.8mM
3.8mM
5.0mM
6.4mM
8mM
9.8mM
12mM
Appendix C
gLMS used to determine taste sensitivity to PROP
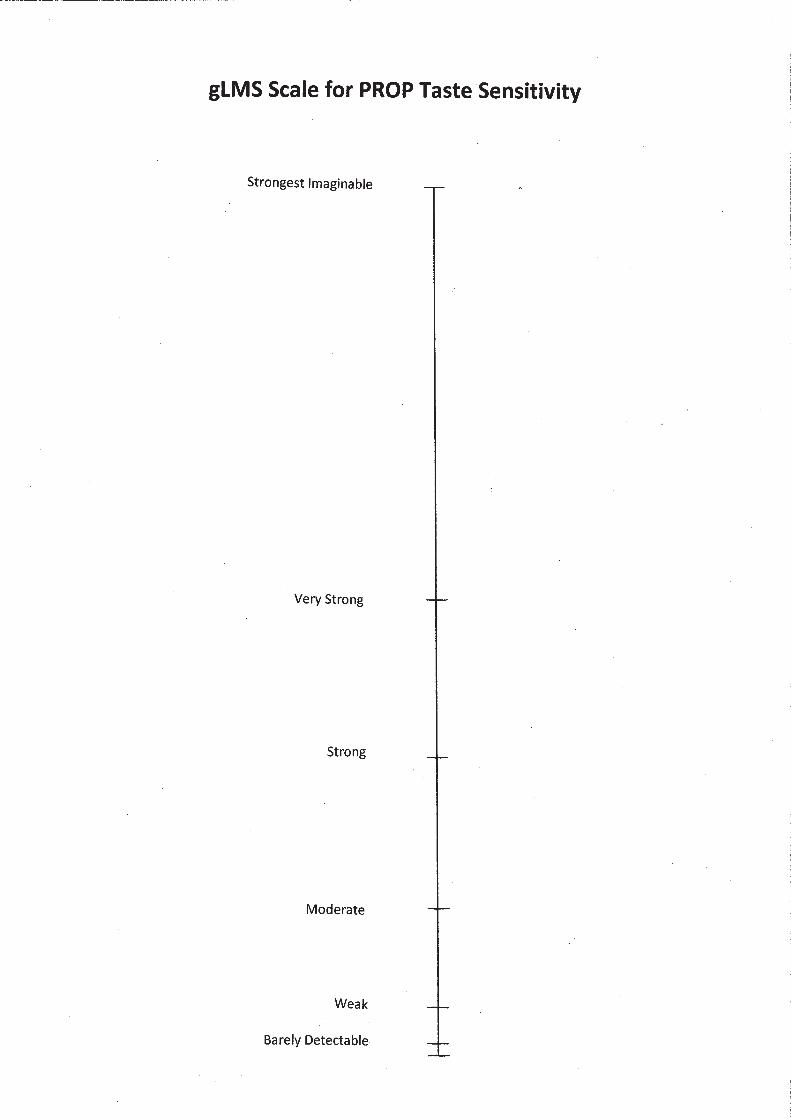

Appendix D
Fat ranking task answer sheet

Subject ID:
Week:
Fat ranking task answer sheet
Please taste each of the custard samples individually, and then place them in order of perceived fattiness (lowest amount of fat to the highest amount of fat).
Please write down the code of each sample in the order you think they belong:
1. __________ (sample with the LEAST amount of fat)
2. __________
3. __________
4. __________ (sample with the MOST amount of fat)

Appendix E
Answer sheets for liking of regular-fat
and low-fat foods
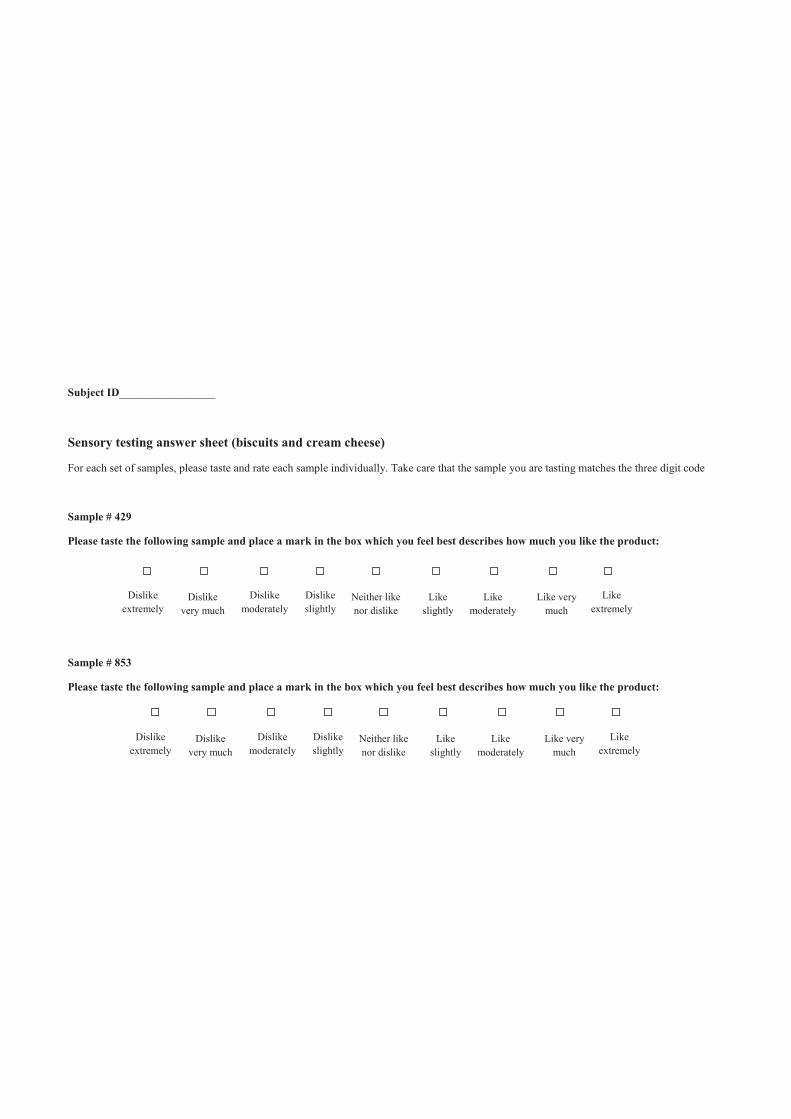
Subject ID_________________
Sensory testing answer sheet (biscuits and cream cheese)
For each set of samples, please taste and rate each sample individually. Take care that the sample you are tasting matches the three digit code
Sample # 429
Please taste the following sample and place a mark in the box which you feel best describes how much you like the product:
Sample # 853
Please taste the following sample and place a mark in the box which you feel best describes how much you like the product:
Dislike extremely
Dislike very much
Dislike moderately
Dislike slightly
Neither like nor dislike
Like slightly
Like moderately
Like very much
Like extremely
Dislike extremely
Dislike very much
Dislike moderately
Dislike slightly
Neither like nor dislike
Like slightly
Like moderately
Like very much
Like extremely

Subject ID_________________
Sensory testing answer sheet (vanilla yoghurt)
For each set of samples, please taste and rate each sample individually. Take care that the sample you are tasting matches the three digit code
Sample # 187
Please taste the following sample and place a mark in the box which you feel best describes how much you like the product:
Sample # 355
Please taste the following sample and place a mark in the box which you feel best describes how much you like the product:
Dislike extremely
Dislike very much
Dislike moderately
Dislike slightly
Neither like nor dislike
Like slightly
Like moderately
Like very much
Like extremely
Dislike extremely
Dislike very much
Dislike moderately
Dislike slightly
Neither like nor dislike
Like slightly
Like moderately
Like very much
Like extremely
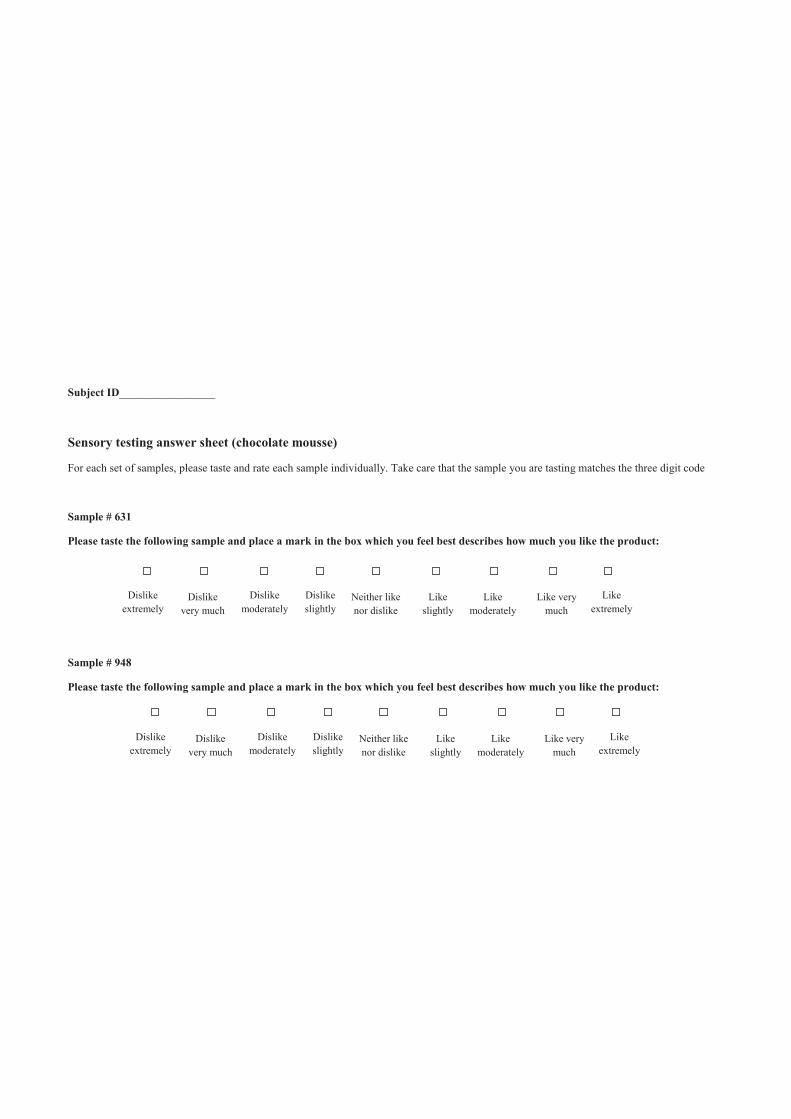
Subject ID_________________
Sensory testing answer sheet (chocolate mousse)
For each set of samples, please taste and rate each sample individually. Take care that the sample you are tasting matches the three digit code
Sample # 631
Please taste the following sample and place a mark in the box which you feel best describes how much you like the product:
Sample # 948
Please taste the following sample and place a mark in the box which you feel best describes how much you like the product:
Dislike extremely
Dislike very much
Dislike moderately
Dislike slightly
Neither like nor dislike
Like slightly
Like moderately
Like very much
Like extremely
Dislike extremely
Dislike very much
Dislike moderately
Dislike slightly
Neither like nor dislike
Like slightly
Like moderately
Like very much
Like extremely

Appendix F
Food record form
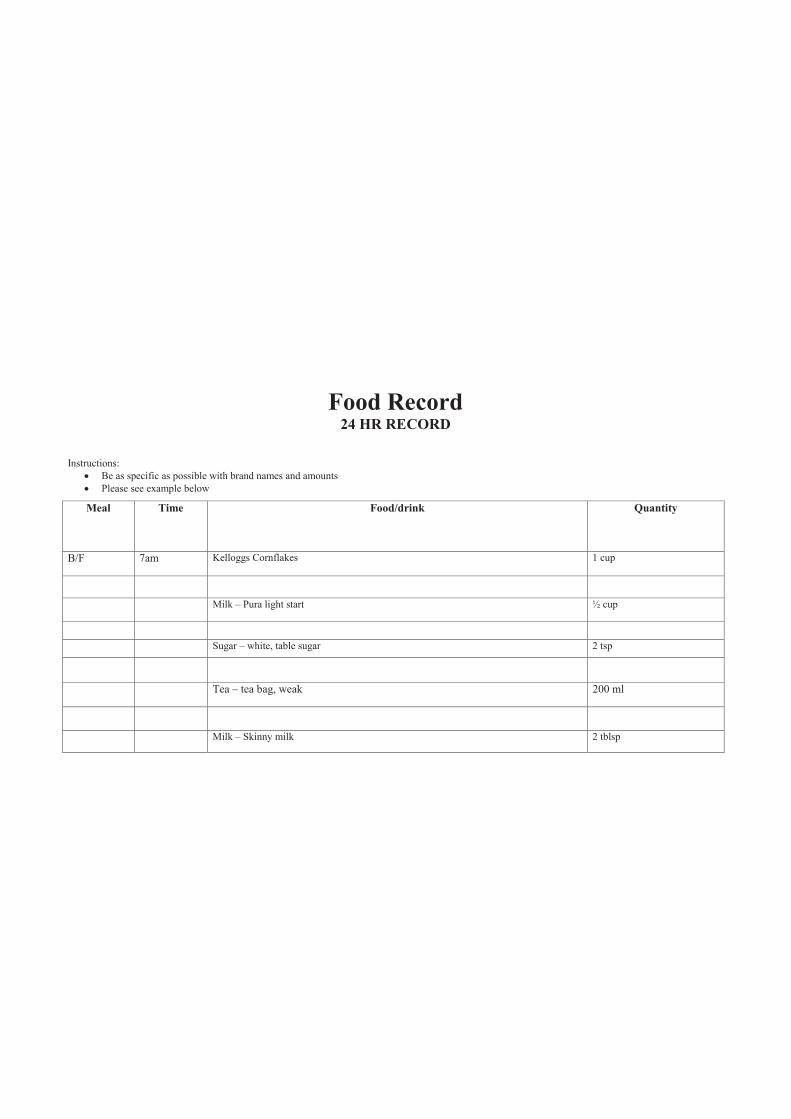
Food Record24 HR RECORD
Instructions:Be as specific as possible with brand names and amountsPlease see example below
Meal Time Food/drink Quantity
B/F 7am Kelloggs Cornflakes 1 cup
Milk – Pura light start ½ cup
Sugar – white, table sugar 2 tsp
Tea – tea bag, weak 200 ml
Milk – Skinny milk 2 tblsp

Day and Date Recorded ________________________ __/__/_____
Meal Time Food/drink Quantity

Appendix G
Food frequency questionnaire
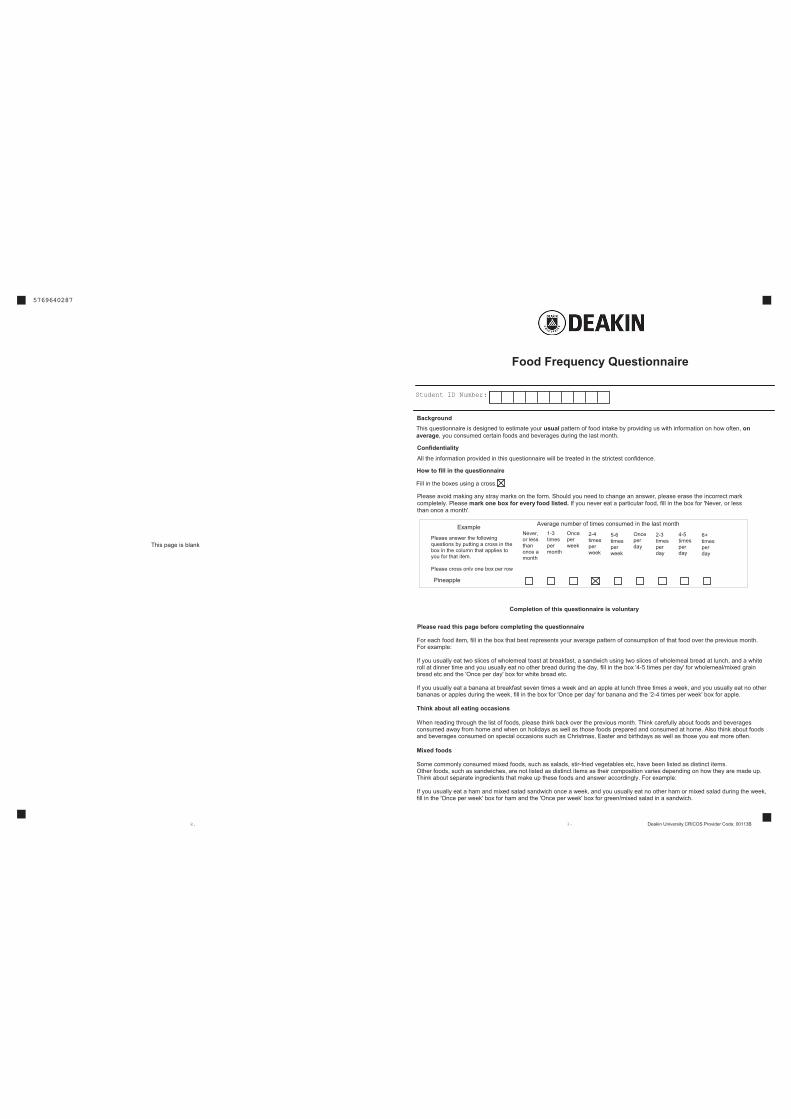
Food Frequency Questionnaire
Deakin University CRICOS Provider Code: 00113B
BackgroundThis questionnaire is designed to estimate your usual pattern of food intake by providing us with information on how often, onaverage, you consumed certain foods and beverages during the last month.
Confidentiality
All the information provided in this questionnaire will be treated in the strictest confidence.
How to fill in the questionnaire
Fill in the boxes using a cross.
Please avoid making any stray marks on the form. Should you need to change an answer, please erase the incorrect markcompletely. Please mark one box for every food listed. If you never eat a particular food, fill in the box for 'Never, or lessthan once a month'.
Never,or lessthanonce amonth
1-3timespermonth
Onceperweek
2-4timesperweek
5-6timesperweek
Onceperday
2-3timesperday
4-5timesperday
6+timesperday
Average number of times consumed in the last month
Please answer the followingquestions by putting a cross in thebox in the column that applies toyou for that item.
Please cross only one box per row
Example
Pineapple
Completion of this questionnaire is voluntary
Please read this page before completing the questionnaire
For each food item, fill in the box that best represents your average pattern of consumption of that food over the previous month.For example:
If you usually eat two slices of wholemeal toast at breakfast, a sandwich using two slices of wholemeal bread at lunch, and a whiteroll at dinner time and you usually eat no other bread during the day, fill in the box '4-5 times per day' for wholemeal/mixed grainbread etc and the 'Once per day' box for white bread etc.
If you usually eat a banana at breakfast seven times a week and an apple at lunch three times a week, and you usually eat no otherbananas or apples during the week, fill in the box for 'Once per day' for banana and the '2-4 times per week' box for apple.
Think about all eating occasions
When reading through the list of foods, please think back over the previous month. Think carefully about foods and beveragesconsumed away from home and when on holidays as well as those foods prepared and consumed at home. Also think about foodsand beverages consumed on special occasions such as Christmas, Easter and birthdays as well as those you eat more often.
Mixed foods
Some commonly consumed mixed foods, such as salads, stir-fried vegetables etc, have been listed as distinct items.Other foods, such as sandwiches, are not listed as distinct items as their composition varies depending on how they are made up.Think about separate ingredients that make up these foods and answer accordingly. For example:
If you usually eat a ham and mixed salad sandwich once a week, and you usually eat no other ham or mixed salad during the week,fill in the 'Once per week' box for ham and the 'Once per week' box for green/mixed salad in a sandwich.
1.8.
Student ID Number:
This page is blank
5769640287
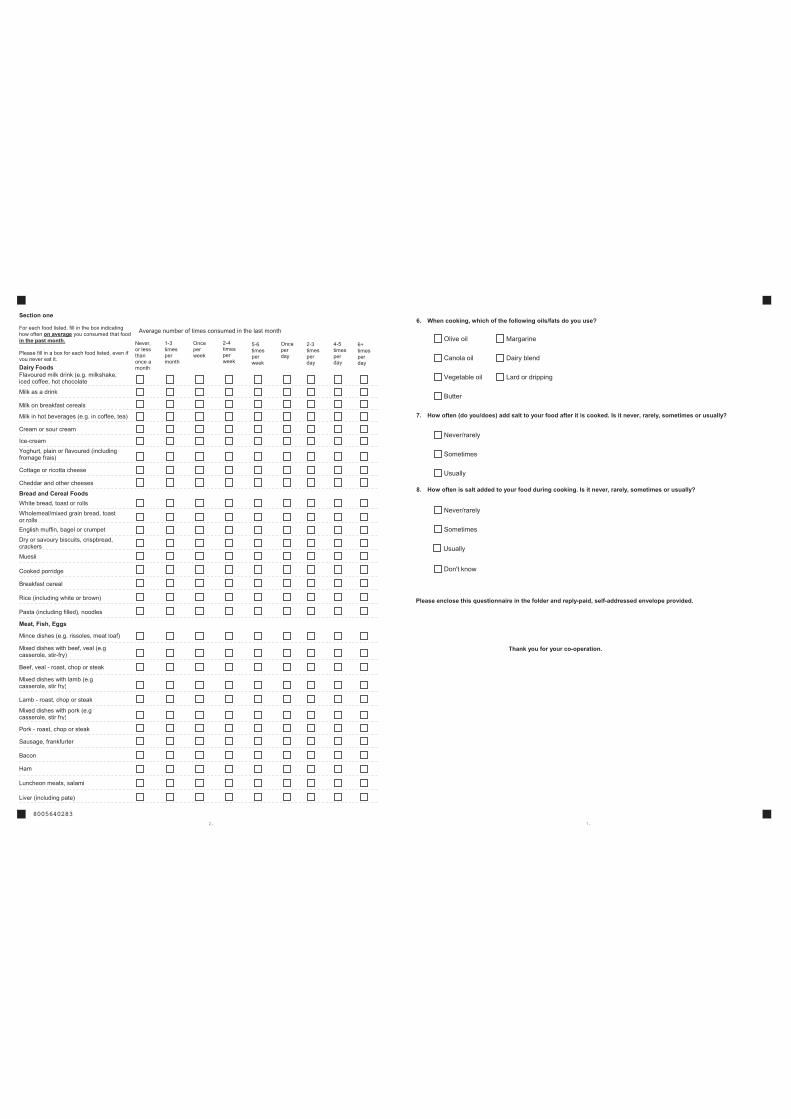
Never,or lessthanonce amonth
1-3timespermonth
Onceperweek
2-4timesperweek
5-6timesperweek
Onceperday
2-3timesperday
4-5timesperday
6+timesperday
Average number of times consumed in the last monthFor each food listed, fill in the box indicatinghow often on average you consumed that foodin the past month.
Please fill in a box for each food listed, even ifyou never eat it.
Section one
Dairy FoodsFlavoured milk drink (e.g. milkshake,iced coffee, hot chocolate
Milk as a drink
Milk on breakfast cereals
Milk in hot beverages (e.g. in coffee, tea)
Cream or sour cream
Ice-cream
Yoghurt, plain or flavoured (includingfromage frais)
Cottage or ricotta cheese
Cheddar and other cheeses
Bread and Cereal FoodsWhite bread, toast or rolls
Wholemeal/mixed grain bread, toastor rollsEnglish muffin, bagel or crumpet
Dry or savoury biscuits, crispbread,crackers
Muesli
Cooked porridge
Breakfast cereal
Rice (including white or brown)
Pasta (including filled), noodles
Mince dishes (e.g. rissoles, meat loaf)
Mixed dishes with beef, veal (e.gcasserole, stir-fry)
Beef, veal - roast, chop or steak
Mixed dishes with lamb (e.gcasserole, stir fry)
Meat, Fish, Eggs
Lamb - roast, chop or steak
Mixed dishes with pork (e.gcasserole, stir fry)
Pork - roast, chop or steak
Sausage, frankfurter
Bacon
Ham
Luncheon meats, salami
Liver (including pate)
2. 7.
6. When cooking, which of the following oils/fats do you use?
Please enclose this questionnaire in the folder and reply-paid, self-addressed envelope provided.
Thank you for your co-operation.
8. How often is salt added to your food during cooking. Is it never, rarely, sometimes or usually?
7. How often (do you/does) add salt to your food after it is cooked. Is it never, rarely, sometimes or usually?
8005640283
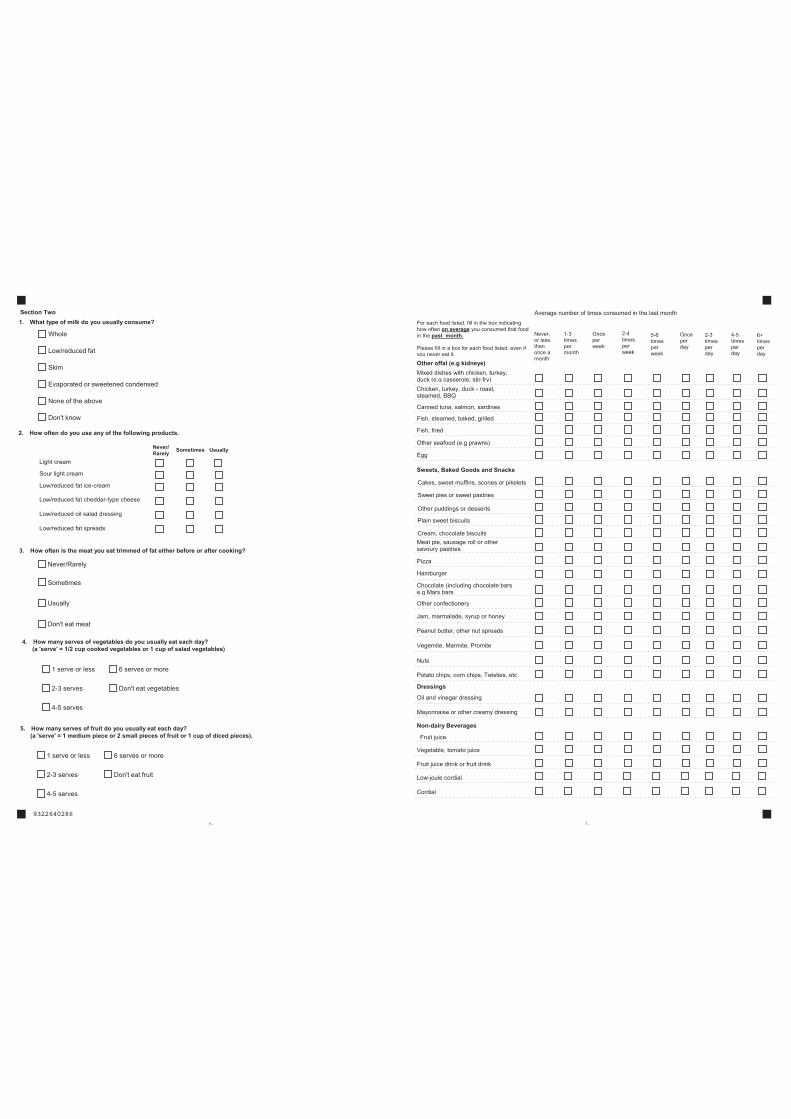
3.6.
Never,or lessthanonce amonth
1-3timespermonth
Onceperweek
2-4timesperweek
5-6timesperweek
Onceperday
2-3timesperday
4-5timesperday
6+timesperday
Average number of times consumed in the last monthFor each food listed, fill in the box indicatinghow often on average you consumed that foodin the past month.
Please fill in a box for each food listed, even ifyou never eat it.
Other offal (e.g kidneys)Mixed dishes with chicken, turkey,duck (e.g casserole, stir-fry)Chicken, turkey, duck - roast,steamed, BBQ
Canned tuna, salmon, sardines
Fish, steamed, baked, grilled
Fish, fried
Other seafood (e.g prawns)
Egg
Sweets, Baked Goods and Snacks
Cakes, sweet muffins, scones or pikelets
Sweet pies or sweet pastries
Other puddings or desserts
Plain sweet biscuits
Cream, chocolate biscuitsMeat pie, sausage roll or othersavoury pastries
Pizza
Hamburger
Chocolate (including chocolate barse.g Mars bars
Other confectionery
Jam, marmalade, syrup or honey
Peanut butter, other nut spreads
Vegemite, Marmite, Promite
Dressings
Nuts
Potato chips, corn chips, Twisties, etc
Oil and vinegar dressing
Mayonnaise or other creamy dressing
Fruit juice
Vegetable, tomato juice
Low-joule cordial
Cordial
Non-dairy Beverages
1. What type of milk do you usually consume?
2. How often do you use any of the following products.
Light cream
Sour light cream
Low/reduced fat ice-cream
Low/reduced fat cheddar-type cheese
Low/reduced oil salad dressing
Low/reduced fat spreads
Never/Rarely Sometimes Usually
3. How often is the meat you eat trimmed of fat either before or after cooking?
4. How many serves of vegetables do you usually eat each day? (a 'serve' = 1/2 cup cooked vegetables or 1 cup of salad vegetables)
5. How many serves of fruit do you usually eat each day? (a 'serve' = 1 medium piece or 2 small pieces of fruit or 1 cup of diced pieces).
Fruit juice drink or fruit drink
Section Two
9322640286

4. 5.
Never,or lessthanonce amonth
1-3timespermonth
Onceperweek
2-4timesperweek
5-6timesperweek
Onceperday
2-3timesperday
4-5timesperday
6+timesperday
Average number of times consumed in the last month
For each food listed, fill in the box indicatinghow often on average you consumed that foodin the past month.
Please fill in a box for each food listed, even ifyou never eat it.
Sweetcorn, corn on the cob
Mushrooms
Tomatoes
Lettuce
Celery, cucumber
Onion or leeks
Soybeans, tofu
Baked beans
Other beans, lentils
Apple or pear
Orange, mandarin or grapefruit
Banana
Peach, nectarine, plum or apricot
Mango or paw-paw
Pineapple
Grapes or berries
Melon (e.g watermelon, rockmelon,honeydew melon
Multi vitamin with iron or other minerals
Multi vitamin
Vitamin A
Vitamin B
Vitamin and Mineral Supplements(including tablets, capsules or drops)
Vitamin C
Vitamin E
B-carotene
Calcium
Folic Acid/Folate
Iron
Zinc
Fruits (including dried, frozen and tinned)
Capsicum
Never,or lessthanonce amonth
1-3timespermonth
Onceperweek
2-4timesperweek
5-6timesperweek
Onceperday
2-3timesperday
4-5timesperday
6+timesperday
Average number of times consumed in the last monthFor each food listed, fill in the box indicatinghow often on average you consumed that foodin the past month.
Please fill in a box for each food listed, even ifyou never eat it.
Low-joule soft drink
Soft drinks (including flavouredmineral water)
Water (including unflavoured mineralwater, soda water, tap water
Coffee
Tea
Soy beverages
Beer - low alcohol
Beer -ordinary
Red wine
White wine or champagne/sparklingwine
Wine cooler
Sherry or port
Spirits, liqueurs
In a sandwich
As a side salad/with a main meal
Stir-fried or mixed vegetables
Vegetable casserole
Potato, boiled, mashed, baked
Hot chips
Pumpkin
Sweet potato
Excluding their use in the above mixeddishes, please indicate how often you eatthe following vegetables
Peas
Green beans
Silverbeet, spinach
Broccoli
Cauliflower
Brussel sprouts, cabbage, coleslaw
Carrots
Vegetables (including frozen and tinned)Green/mixed salad (including lettuce, tomato,etc)
Zucchini, eggplant, squash
1013640285
Appendix H
Recipes for frittatas baked in study two
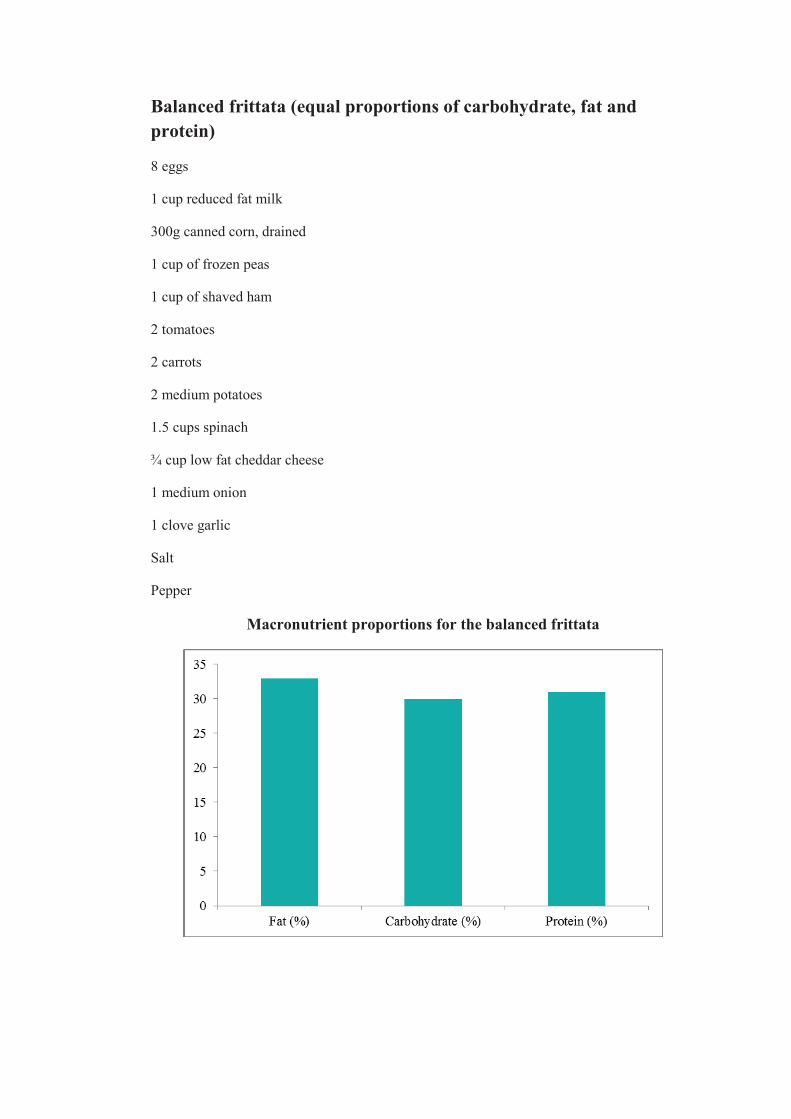
Balanced frittata (equal proportions of carbohydrate, fat and protein)
8 eggs
1 cup reduced fat milk
300g canned corn, drained
1 cup of frozen peas
1 cup of shaved ham
2 tomatoes
2 carrots
2 medium potatoes
1.5 cups spinach
¾ cup low fat cheddar cheese
1 medium onion
1 clove garlic
Salt
Pepper
Macronutrient proportions for the balanced frittata
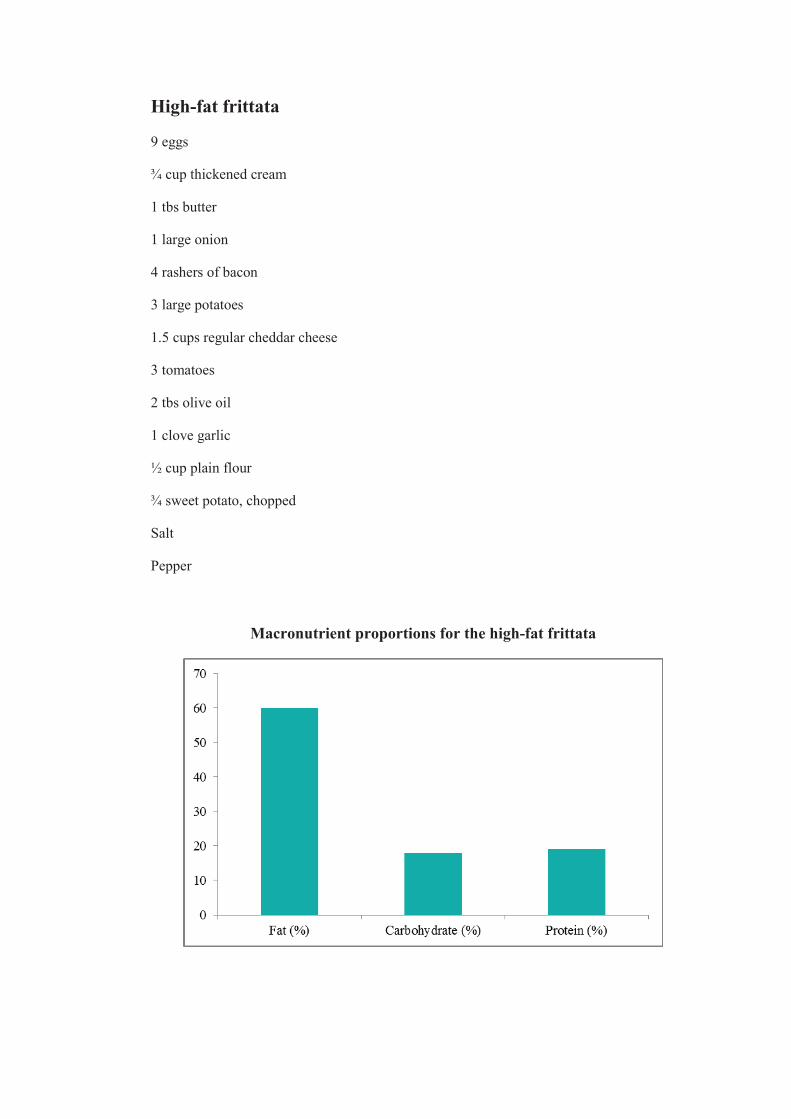
High-fat frittata
9 eggs
¾ cup thickened cream
1 tbs butter
1 large onion
4 rashers of bacon
3 large potatoes
1.5 cups regular cheddar cheese
3 tomatoes
2 tbs olive oil
1 clove garlic
½ cup plain flour
¾ sweet potato, chopped
Salt
Pepper
Macronutrient proportions for the high-fat frittata
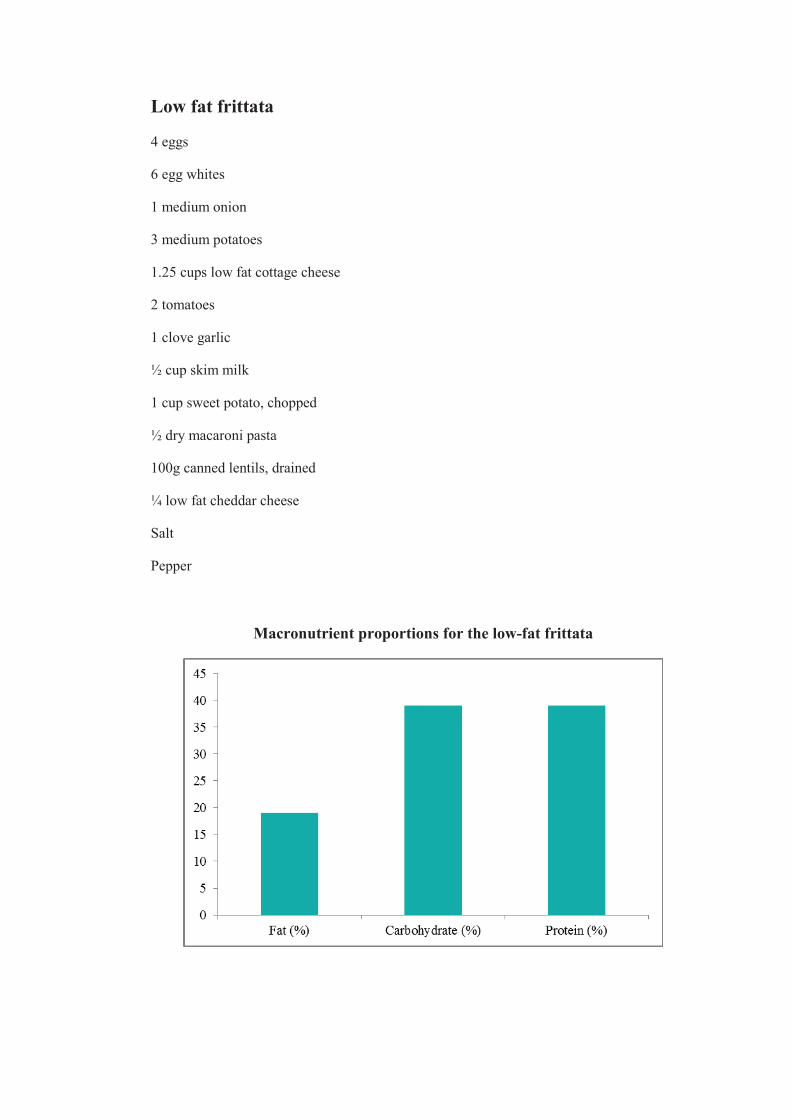
Low fat frittata
4 eggs
6 egg whites
1 medium onion
3 medium potatoes
1.25 cups low fat cottage cheese
2 tomatoes
1 clove garlic
½ cup skim milk
1 cup sweet potato, chopped
½ dry macaroni pasta
100g canned lentils, drained
¼ low fat cheddar cheese
Salt
Pepper
Macronutrient proportions for the low-fat frittata

1
Appendix I
Diet booklet given to subjects following the low-fat dietin study three

2
Deakin University WAT Study
(Weight Loss and Taste Study)
Diet & Exercise Information Booklet

3
WAT Diet (6 weeks)
This diet is a weight loss diet designed to: Increase
Fruits Vegetables Reduce
Full fat dairy products Fatty meats Baked products High fat spreads Calories/kilojoules You will be required to follow this diet for 6 weeks. The following summarises the diet:
Food Group Daily allowance Fruit At least 2 serves/ day Vegetables At least 5 serves/ day Low-fat dairy 3 serves/ day Protein (fish, chicken, legumes, red meat)
Approximately 1 serve/ day
Fats (mono- and poly-unsaturated) Maximum 3 serves/ day

4
FRUIT & FRUIT JUICE
We are asking you to make sure you have at least 2 serves of fruit or fruit juice per day.
1 serve is equivalent to any one of the following:
1 medium piece of fruit (e.g. 1 banana, 1 orange, 1 apple, 1 pear)
1 medium tomato
¼ cup dried fruit (e.g. apricots, sultanas) no more than 1 serve per day
½ cup fresh fruit (e.g. grapes, melon strawberries),
½ cup canned fruit but no more than 1 serve per day (due to the high energy content)
½ cup per day of fruit juice. N more than 1 serve per day (due to the high energy content)
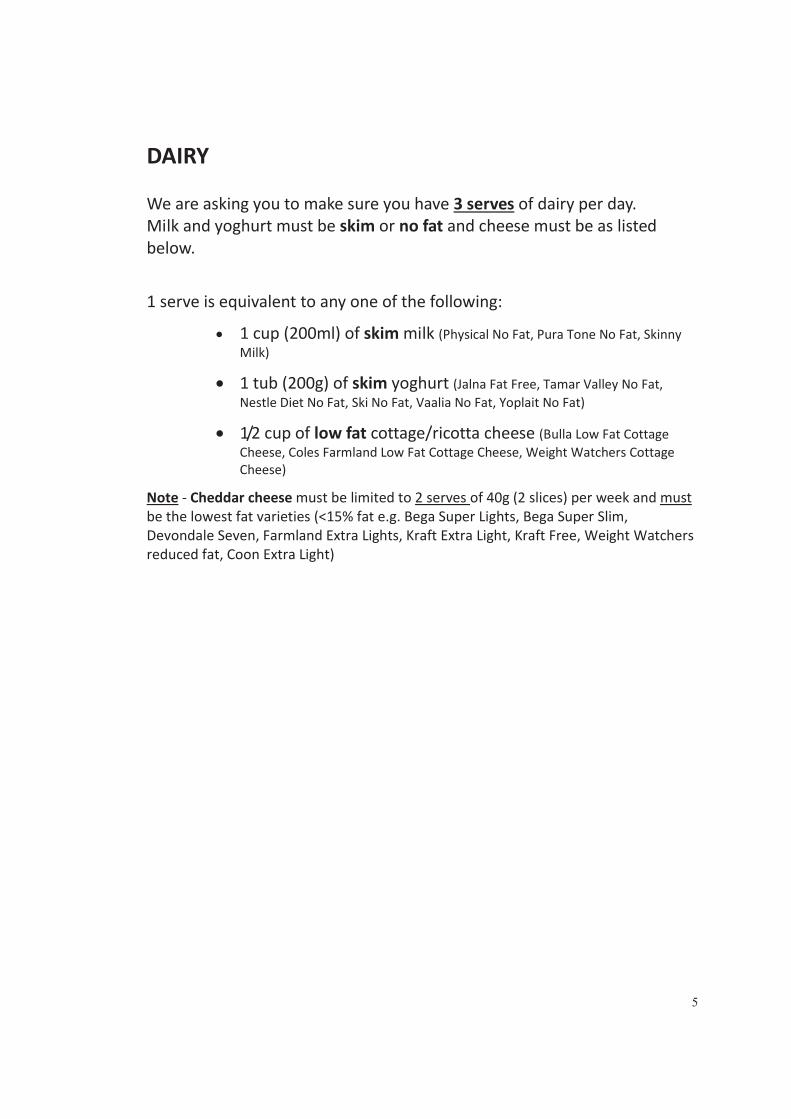
5
DAIRY We are asking you to make sure you have 3 serves of dairy per day. Milk and yoghurt must be skim or no fat and cheese must be as listed below.
1 serve is equivalent to any one of the following:
1 cup (200ml) of skim milk (Physical No Fat, Pura Tone No Fat, Skinny Milk)
1 tub (200g) of skim yoghurt (Jalna Fat Free, Tamar Valley No Fat, Nestle Diet No Fat, Ski No Fat, Vaalia No Fat, Yoplait No Fat)
1/2 cup of low fat cottage/ricotta cheese (Bulla Low Fat Cottage Cheese, Coles Farmland Low Fat Cottage Cheese, Weight Watchers Cottage Cheese)
Note - Cheddar cheese must be limited to 2 serves of 40g (2 slices) per week and must be the lowest fat varieties (<15% fat e.g. Bega Super Lights, Bega Super Slim, Devondale Seven, Farmland Extra Lights, Kraft Extra Light, Kraft Free, Weight Watchers reduced fat, Coon Extra Light)

6
VEGETABLES
We are asking you to make sure you have at least 5 serves of vegetables per day.
1 serve is equivalent to any one of the following:
1 cup raw leafy vegetables (e.g. lettuce, spinach, cabbage)
½ cup cooked vegetables (e.g. corn, cauliflower, pumpkin, sweet potato, carrot, beans, peas, zucchini, leek, mushroom)
1 medium potato (preferably whole baked)
PROTEIN FOODS Try to limit the amount of fatty red meats you consume. Try and substitute these with lean alternatives, for example, fish or chicken. We recommend you have 1-2 serves per day. 1 serve is equivalent to any one of the following:
65–100g cooked meat or chicken (½ cup lean mince, 2 small chops, 2 slices of roast meat) ½ cup cooked dried or canned beans, lentils, chick peas or split peas 80–100g fish fillet

7
FATS AND OILS On this diet you are allowed a maximum of 3 serves of fat per day. 1 serve is equivalent to any of the following:
1 tsp of monounsaturated (Canola or Olive Oil) or polyunsaturated oil (but not blended vegetable oils)
1 tsp of regular fat margarine
2 tsp of reduced fat margarine
2 tsp of Avocado
Some Recommended brands to use -
Reduced Fat Margarines Flora Light Margarine Meadow Lea Light Margarine Bertolli Spread light
Please note that these lower fat margarines are not suitable for cooking.

8
BREAD & CEREALS
We will ask you to have a maximum of 5 serves per day. This group includes pasta, rice, wholegrain bread, breakfast cereals etc.
1 serve is equivalent to any of the following:
2 slices of bread 1 medium bread roll 1 cup cooked rice, pasta, noodles 1 cup porridge 1 cup breakfast cereal flakes ½ cup muesli
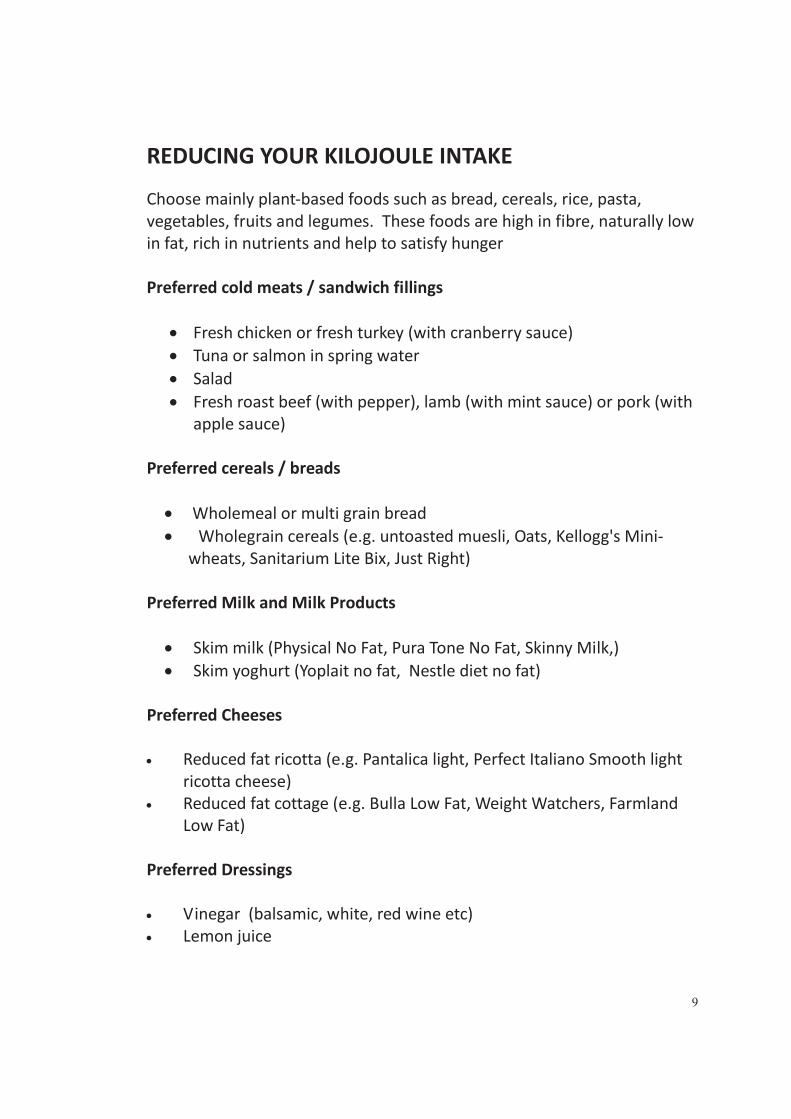
9
REDUCING YOUR KILOJOULE INTAKE Choose mainly plant-based foods such as bread, cereals, rice, pasta, vegetables, fruits and legumes. These foods are high in fibre, naturally low in fat, rich in nutrients and help to satisfy hunger Preferred cold meats / sandwich fillings
Fresh chicken or fresh turkey (with cranberry sauce) Tuna or salmon in spring water Salad Fresh roast beef (with pepper), lamb (with mint sauce) or pork (with apple sauce)
Preferred cereals / breads
Wholemeal or multi grain bread
Wholegrain cereals (e.g. untoasted muesli, Oats, Kellogg's Mini-wheats, Sanitarium Lite Bix, Just Right)
Preferred Milk and Milk Products
Skim milk (Physical No Fat, Pura Tone No Fat, Skinny Milk,) Skim yoghurt (Yoplait no fat, Nestle diet no fat)
Preferred Cheeses
Reduced fat ricotta (e.g. Pantalica light, Perfect Italiano Smooth light ricotta cheese) Reduced fat cottage (e.g. Bulla Low Fat, Weight Watchers, Farmland Low Fat)
Preferred Dressings
Vinegar (balsamic, white, red wine etc) Lemon juice

10
Preferred Alcohol (if any) Alcohol is high in kilojoules (energy) so often contributes to excess weight. Alcohol should be limited when trying to lose weight. On this diet try and limit alcohol to a maximum of 4 standard drinks per week. Hints for decreasing alcohol intake:
Try alternating alcoholic drinks with water Swap to low alcohol or ‘light’ beer or wine Mix drinks with low kilo joule soft drinks such as diet cola Use only half measures of spirits in mixed drinks Put your drink down between sips, talk more and drink less

11
SOME FOOD FOR THOUGHT...
BEVERAGES
TRY AVOID Water Fruit juice (maximum of ½ cup per day) Tea, coffee with skim milk and an artificial sweetener
Sports drinks (Powerade etc)
Diet soft drinks and cordials Flavoured milks Plain mineral or soda water Flavoured soft drinks, mineral waters and
cordials Alcoholic drinks
CONDIMENTS, SWEETENING AGENTS & FLAVOURINGS
TRY AVOID Sugar Commercial mayonnaise and salad
dressings Honey, jam Ordinary peanut butter Spices, herbs Butter Vinegar Tartare sauce Apple or cranberry sauce Parmesan cheese Mint sauce Vegemite Equal sweetener LOW FAT sauces and dressings
TAKE AWAY FOODS
TRY AVOID Grilled fish Hamburgers Sliced roast meat Fried and BBQ chicken Salads Pizza Fruit Indian, Thai, Italian, Chinese, Vietnamese
take away Homemade pizzas Battered fish and chips

12
SNACKS
TRY AVOID Raw or cooked vegetables Savoury biscuits (Shapes, Savoys etc) Unsalted popcorn Potato crisps Raisin bread Sweet biscuits/ cookies Wholegrain breakfast cereals Dips Toasted muffins and crumpets Baked goods (cake, pies, pasties etc) Rice cakes or low fat rice crackers Nuts No fat yoghurt Diet soft drinks Fresh or tinned fruit Low fat milkshakes or fruit smoothies Grainy breads and rolls

13
FRESH FOOD SUGGESTIONS AND COOKING IDEAS Barbeques
Marinate skinless chicken breast fillets or lean meats in fruit juice or wine before grilling Bake fish fillets or kebabs in foils with seasonings and lemon juice Make kebabs using lean meat and vegetable chunks Pre-cook whole potatoes in the microwave or oven, then crisp on the BBQ
Cooked Vegetables
Add a squeeze of lemon or ground black pepper to freshly steamed or microwave vegetables Stir fry vegetables in small amounts of oil or use water Add skim yoghurt to jacket potatoes instead of sour cream
Dinner
Have lots of vegetables, and use smaller portions of lean meat, chicken or fish Use low fat ricotta cheese in cheese dishes, with a sprinkle of parmesan cheese for flavour
Frying foods
Use a non stick fry pan Brush the base of the pan with oil such as canola, sunflower, olive or peanut oil, to prevent food from sticking Microwave vegetables and then brown them under the griller
Soups and sauces
Use evaporated skim milk for ‘cream’ soups Use pureed vegetables to thicken sauces Use wholegrains, barley, or lentils to thicken casseroles or stews

14
Lunch Fill sandwiches with lots of salad vegetables and a small serving of lean meat, skinless chicken, canned fish (in spring water), hummus or a low fat cheese such as cottage cheese Toasted sandwiches. Try filling with baked beans or lean ham and asparagus Have cooked vegies left over from dinner the night before Hard boiled eggs (with pepper, curry, mustard powder or chilli powder) For variety, try fresh fruit salad and skim yoghurt for lunch
Pasta
Serve pasta with a sauce that has plenty of vegetables (eg tomato based) Limit creamy and cheese based pasta sauces
Roast Dinner
Select a lean leg of lamb, beef, or pork – trim off any fat Roast a chicken and don’t eat the skin Cook in a roasting pan with a little water or wine Brush or spray vegetables with oil such as canola, sunflower or olive oils and bake in a separate pan
Toast
Spread peanut butter thinly and limit other higher fat toppings such as cheese and cheese spreads Spread with ricotta or cottage cheese, marmalade, honey, chutney, mustard or top with a small serve of baked beans, spaghetti or fresh tomato

15
USEFUL TIPS: Prepare extra vegetables or salads at dinner time for use at lunch the following day Cut and prepare fruit at the beginning of the day so that it is easily available to eat later that day Be creative - Use different sauces, herbs and spices to enhance the flavour of food eg.
bay leaf brandy chives cinnamon cloves curry dill garlic ginger mint dry mustard paprika nutmeg onions rosemary parsley pepper lemon juice sugar thyme rum vanilla wine sage
vinegar
Use smaller serving dishes at meal times to help reduce portion sizes Eat your meal slowly so your body has a chance to register that you are
full. If you eat quickly then you are likely to consume more energy than you actually need
Hunger is a sign that the diet is actually working! If you find biscuits, lollies, cakes, soft drinks etc irresistible, then don’t have
any of these foods at home. If they are not there, then you won’t eat them. Set up your home environment so you can only eat healthy foods.

16
EXAMPLE OF DAILY MEAL PLAN BREAKFAST: ½ cup muesli ½ cup skim milk 200g low-fat yogurt MORNING SNACK: 2 rice cakes with vegemite 1 carrot (cut into sticks) LUNCH: 2 slices wholegrain bread (toasted sandwich) 1 teaspoon light margarine
150g baked beans 1 glass water AFTERNOON SNACK: 1 piece of fresh fruit or 30g sultanas DINNER: 150g Satay chicken stir fry (with vegetables:
capsicum, onion, snow peas, carrot etc) ½ cup brown rice DESSERT: ½ cup low fat custard 1 piece of fruit

17
TIPS FOR DINING OUT
Modify meals to suit you
Here's where you have to take some responsibility for your own healthy eating and speak up by:
Checking the ingredients and preparation method of meals with your waiter. Asking to replace different ingredients with healthier options. For example: vegetables instead of chips, skim milk rather than full cream. Requesting sauces or dressings on the side, that way you can control the quantity on your plate. Not being swayed by pushy waiters or jibes from your fellow dinners; just order what you want.
Enjoy, don't indulge
It's all about portions. Keep your meal sizes small by:
Have light meals and snacks during the day if you know you are going to have a restaurant meal at night. Sharing dishes to keep portions sizes down or ordering two entrees rather than one entree and a main meal. Making sure you have a booking so you can go straight to your table rather than wait at the bar. Have water with your meal rather than soft drink, juices or alcohol
Know what is good and bad
Good:
Balsamic vinegar dressings, salsa, cocktail, soy or tomato sauce, mustard and lemon. Foods which are described as steamed, fresh, baked, roasted, poached, lightly sautéed or stir-fried. Lean steaks such as tenderloin, club and sirloin. Seafood; even the fattest fishes have less fat than the leanest meats.

18
The bad:
Creamy soups, stick to clear ones instead. Fatty steak cuts such as rib eye, porterhouse, ribs and brisket. Quiches and omelettes if made with cheese. Antipastos.
HEALTHY MENU SUGGESTIONS...
Breakfast
Opt for muesli and cereals over sticky danishes and croissants. Ask for eggs poached or boiled. Choose brown or wholegrain toast over white. Pancakes are better topped with jam, low-fat yoghurt or fruit rather than maple syrup and ice-cream. Most muffins are actually high in fat. Look for the low-fat varieties or just skip them altogether. English muffins and bagels are good choices, but ask for spreads on the side.
Lunch
Sandwiches on wholegrain or brown bread Say no to butter, mayonnaise, gravy and cheese. Choose turkey or ham In salads skip the croutons and bacon bits and go for tuna or chickpeas instead.
Dessert
Fruit is your best option. Sorbets and yoghurts are also good. If you absolutely can't resist a chocolate mud cake, share with a friend so you don't eat more than your share. Say no to whipped cream
19
LABEL READING
Food labels follow certain rules set down by law and they contain a lot of information. Reading labels can tell you a lot about the food you’re eating (see attached handout). INGREDIENTS The ingredients on the label are listed in order of quantity. This means there is more of the ingredients higher on the list compared to those lower down the list. Try to avoid food with high amounts of fat. A low fat food generally has less than 10 grams of fat per 100 grams.

20
EXERCISE GUIDELINES As part of a weight loss regime it is also very important to include some physical activity. It will be best if you start exercising slowly, but please make sure you have been given clearance by your doctor before you start. Your aim by the end of the study will have completed 30 minutes of exercise every day, but to start with you should focus on whatever you can comfortably achieve and you may even want to begin at a lower intensity. The most important thing with this exercise program is that you are consistent. Your exercise program should be continued daily and this will allow you to increase your duration and intensity of the exercise and your fitness levels will begin to rise. When increasing your exercise you can start by either increasing the duration you are exercising but keeping the intensity the same, or increase your intensity and keep your duration the same. If required, the level of exercise that you do must be approved by your doctor. Walking will be the best way to start your program. A general guideline may be to start with 30 minutes of very low intensity walking (see attached ‘physical activity’ sheet), and this can be broken up into intervals if needed. Once you can comfortably walk for 30 minutes at a time, try to gradually increase the intensity. When you become comfortable with walking for 30 minutes, maybe increase your duration to 40 minutes and when you become comfortable at each level, increase either the duration or intensity of the exercise. It is important to remember your body will not improve its performance immediately and that the increase in duration and intensity should be gradual. Please make sure that you do not do anymore than feels comfortable!

21
SOME POINTS TO REMEMBER:
Weight loss is not simple. It takes effort and time You must use up more energy through physical activity and consume less kilojoules (energy) from food and drinks
Weight loss must be gradual to ensure it is fat loss not muscle or water Healthy eating is not dieting, it’s everyday eating Don’t weigh yourself every day. Weigh yourself no more than once a week as your weight is likely to fluctuate daily
Limit high kilojoule foods and drinks o Foods to enjoy include bread, cereals, rice, pasta, vegetables,
fruits, legumes, lean meats, fish and skim dairy products Reduce saturated fat
o This will help reduce your overall energy intake as well as help reduce your risk of heart disease
Be more physically active o All physical activity helps burn up extra kilos
Reward yourself (e.g. movies, not food) when you have maintained a lifestyle change for a certain length of time
Take time over your meals, enjoy your food, savour the taste of each mouthful, don't be rushed by others and eat to a comfortable level of fullness
Try not to buy tempting high kilojoule foods like chocolates and pastries but look for healthier alternatives
Think positively Get support from family and friends-everyone can enjoy healthy eating
Good luck

22
SUITABLE SNACKS ON THE WAT DIET
Although the WAT diet is a weight loss diet, suitable snacks can be enjoyed. Weight loss always comes down to reducing your energy intake so you take in less energy than you expend (exercise). So you are in negative energy balance. Since all foods are a source of energy (kilojoules/calories), the first rule of thumb is that if you are not hungry it is obviously better if you do not eat anything. However, if you are hungry then choosing a suitable snack can prevent over eating or binge eating later on in the day. Common snack foods are high in energy and/or salt and/or fat e.g. potato chips, corn chips, sweet biscuits, chocolates, cakes, pastries, muffins, chocolate bars, salted nuts, dry biscuits, regular fat cheese, dips, muesli bars, high fat dairy snacks, ice creams, hot chips, potato cakes and dim sims
SUGGESTED SNACK FOODS
Fresh whole fruit of any type (except avocado), e.g. bananas, apples, oranges, pears, grapes, melon, berries, peaches, pineapple, plums, nectarines, apricots, grapefruits, kiwi fruits, mangoes, mandarins and many more! Fresh fruit salad Raw carrot and celery sticks and low fat/low salt dip Cherry tomatoes Rice cakes (and jam or vegemite) Unsalted popcorn (no butter) No Fat yoghurts No Fat drinking yoghurt Skim milk fruit smoothies A bowl of lower fat cereals and skim milk Pita bread and low fat/low salt dip

23
EATING OUT AND TAKE AWAYS ON THE WAT DIET
Because the WAT diet is a weight loss diet, eating out can be difficult. Restaurant meals are often high in fat and salt. If you eat out regularly, it is impossible to be compliant on the WAT diet. However, an occasional meal out should be able to be included as long as you make appropriate choices.
EATING OUT HINTS
Ask about any sauces that come with a meal selection. Often they are made with butter and/or cream and must therefore be avoided. Ask for them not to be added. Restaurants often add butter to vegetables. Request that no butter be added. Ask for salad dressings not to be added unless it is vinegar or lemon juice only. Remove any fat from foods served to you (e.g. the fat and skin from chicken and the visible fat from meat). Ask for small meals or choose entrée-sized dishes. Beware of smorgasbords – you always eat a lot more than you need. Chose lean meats and ask for extra vegetables. Avoid garlic and herb breads – they are too high in fat.
SUGGESTED MENU CHOICES
Entrees: o Salads with no oil dressings (request balsamic vinegar or lemon juice) o Fruit cocktail o Oysters or fresh seafood platter (not deep fried)
Mains: o Grilled, baked or steamed fish (not crumbed or fried) o Lean meat (no gravy/marinade) o Grilled, baked or poached skinless chicken o Avoid sauces o Pasta with tomato based sauce (not a creamy or cheesy sauce)
Salads and Vegetables: o Use lemon juice or balsamic vinegar dressings (beware home made
dressings which are often made with oil) o Choose or ask for grilled, boiled or steamed vegetables o Steamed potatoes or jacket potatoes (without butter/margarine)
Rice and breads: o Plain steamed or boiled rice (not fried)
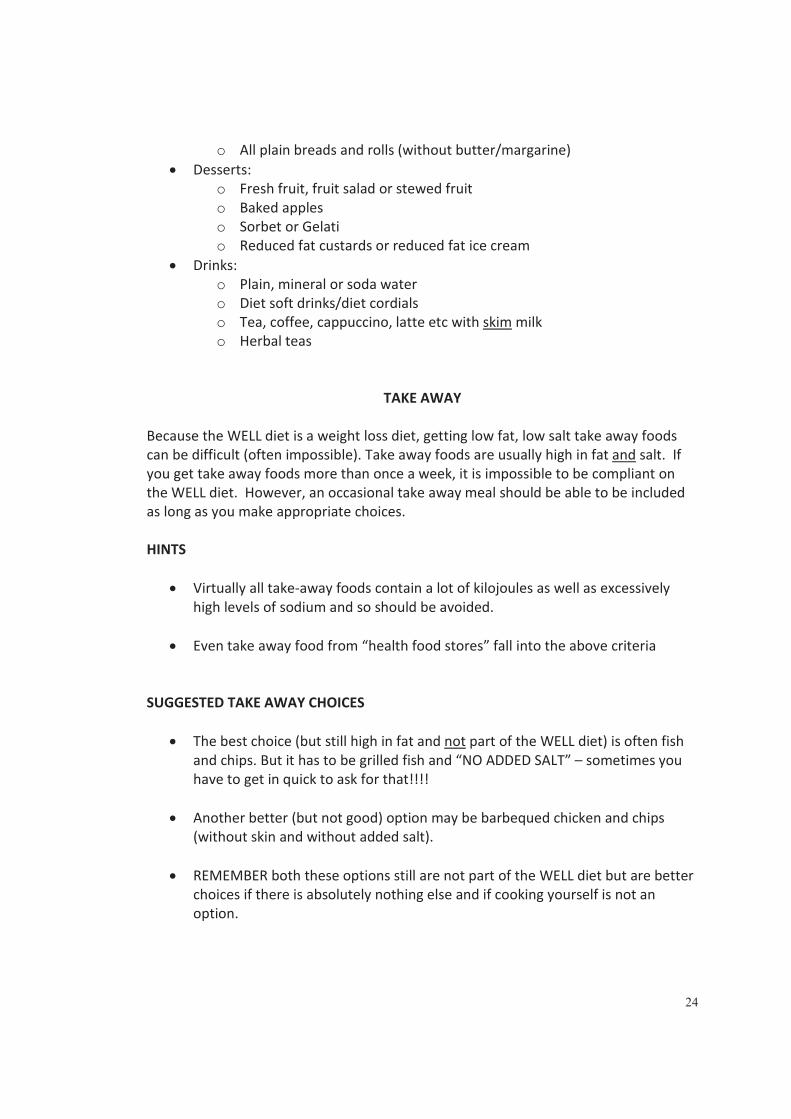
24
o All plain breads and rolls (without butter/margarine) Desserts:
o Fresh fruit, fruit salad or stewed fruit o Baked apples o Sorbet or Gelati o Reduced fat custards or reduced fat ice cream
Drinks: o Plain, mineral or soda water o Diet soft drinks/diet cordials o Tea, coffee, cappuccino, latte etc with skim milk o Herbal teas
TAKE AWAY Because the WELL diet is a weight loss diet, getting low fat, low salt take away foods can be difficult (often impossible). Take away foods are usually high in fat and salt. If you get take away foods more than once a week, it is impossible to be compliant on the WELL diet. However, an occasional take away meal should be able to be included as long as you make appropriate choices. HINTS
Virtually all take-away foods contain a lot of kilojoules as well as excessively high levels of sodium and so should be avoided.
Even take away food from “health food stores” fall into the above criteria
SUGGESTED TAKE AWAY CHOICES
The best choice (but still high in fat and not part of the WELL diet) is often fish and chips. But it has to be grilled fish and “NO ADDED SALT” – sometimes you have to get in quick to ask for that!!!!
Another better (but not good) option may be barbequed chicken and chips (without skin and without added salt).
REMEMBER both these options still are not part of the WELL diet but are better choices if there is absolutely nothing else and if cooking yourself is not an option.

25
REDUCING FAT ON THE WAT DIET
The WAT Diet involves a reduction in fat intake to result in significant loss of body fat.
Fat: Fat is a very concentrated source of energy. In fact, 1 gram of fat (from any source) will provide you with 37 kJ (or 9 calories), whereas 1 gram or protein or carbohydrate will provide 16-17 kJ (or 4 calories). So you can see that fat is much more energy dense than other nutrients.
How much fat do we need?
The human body requires only a small amount of fat to provide us with fat-soluble vitamins and essential fatty acids. However, most Australians eat a lot more than they need. Excess fat (of any kind) will be stored in the body as fat.
Weight Loss: For weight loss (fat loss) to occur, the energy consumed (from all foods) needs to be less than the energy expended.
ENERGY IN ENERGY OUTFOOD EATEN EXERCISE = WEIGHT
LOSS
Different types of fat: Fats are categorised as saturated, mono-unsaturated or poly-unsaturated. Most foods contain a mixture of these different types of fats.
Saturated fats occur in both animal and vegetable foods (a popular myth is that saturated fat comes only from animal products). Saturated fat is found in fatty meats, full fat dairy products, palm oil, coconut oil, chocolate, baked foods etc. Saturated fats should be limited as they increase LDL cholesterol and are therefore a risk factor for heart disease. Mono-unsaturated fats are found in olive, peanut and canola oils, avocados, peanuts, eggs, chicken, some fish, macadamia and hazelnuts. Mono-unsaturated fats actually increase the protective HDL cholesterol. Poly-unsaturated fats are found in vegetable oils, margarines, fish, nuts and seeds.
Just remember that all types of fat provide the same amount of energy (kilojoules) and can all cause weight gain.
<

26
Fat sources: Some common sources of fat include fried foods, pies, pasties, sausage rolls, chocolates, cakes, biscuits, pastries, fatty meats (sausages, salami etc), ice cream, cream, cheese, full fat dairy products, full fat mayonnaise and salad dressings, salted chips and nuts, pizza, oil, butter, margarine and takeaway food.
Fat on the WAT Diet:
The WAT Diet is a low fat diet. We want you to reduce the amount of fat you consume. So depending on how much you consume now, we need to you to significantly decrease this.
HINTS FOR DECREASING FAT INTAKE
Cut out spreads such as margarine as much as possible, or choose a reduced fat version and spread very thinly. Use low fat or skim dairy products. Skim milk has up to 0.1% fat, whereas low and reduced fat versions have up to 2% fat. Full fat milk has about 4% fat. Cheese is very high in fat (~35%). Try lower fat versions like low fat cottage and ricotta. Try low fat ice creams and custards instead of full fat versions. Avoid take away foods. Use lean meat, trim off all visible fat before cooking and remove the skin off chicken. Choose canned tuna in spring water rather than oil or brine. Use lower fat cooking methods such as grilling, steaming or microwaving and always avoid frying foods. Don’t add fat for flavour, be creative with herbs, spices, pepper, garlic, ginger, wine etc. Make your own fat free dressings. If you have to add fat, use a very light spray of oil or use a pastry brush to brush a small amount onto the food instead of pouring oil straight from the bottle. Be careful with “light”, “lower fat”, and “fat reduced“ and ”no added fat” claims on food labels. Often these foods still contain too much fat (eg light olive oil is just light in colour!) A “low cholesterol” or “no cholesterol” claim does NOT mean low/no fat. All vegetable products are cholesterol free (it is only found in animal products), but they may still contain fat (e.g. all olive oil varieties are cholesterol free but are 100% mono-unsaturated fat). To reduce your cholesterol you need to eat less fat, especially saturated fat, and maintain a healthy weight.
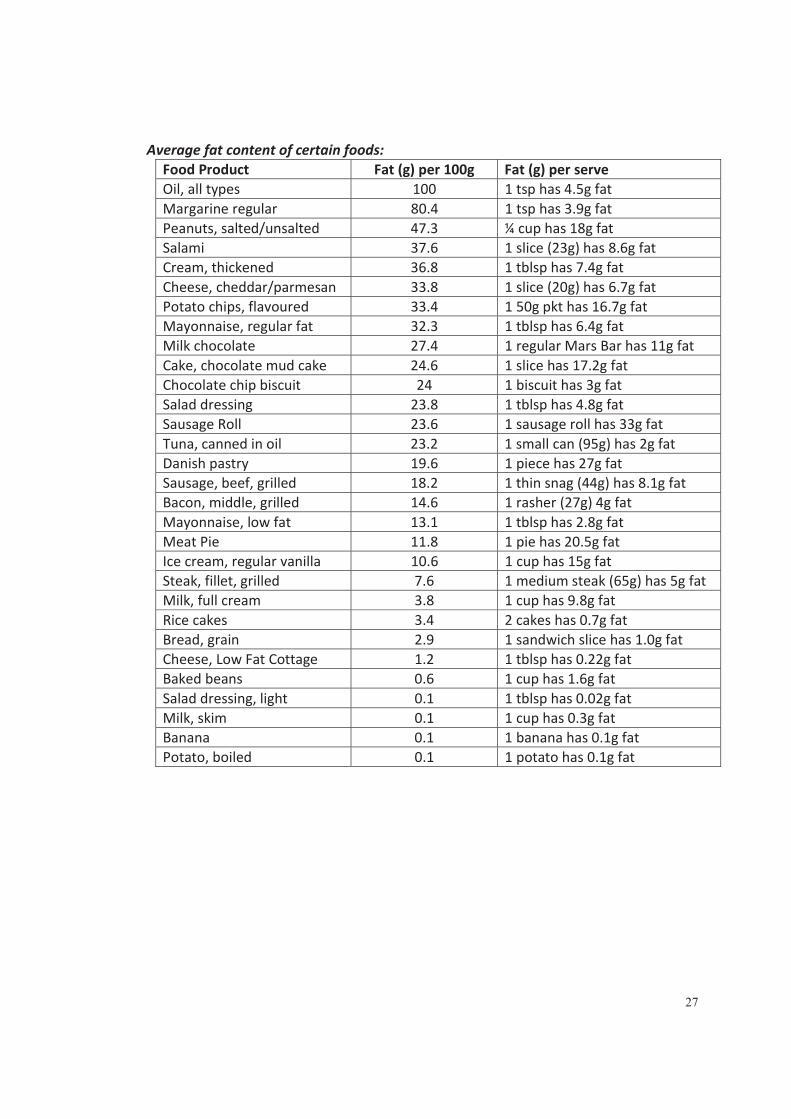
27
Average fat content of certain foods: Food Product Fat (g) per 100g Fat (g) per serve Oil, all types 100 1 tsp has 4.5g fat Margarine regular 80.4 1 tsp has 3.9g fat Peanuts, salted/unsalted 47.3 ¼ cup has 18g fat Salami 37.6 1 slice (23g) has 8.6g fat Cream, thickened 36.8 1 tblsp has 7.4g fat Cheese, cheddar/parmesan 33.8 1 slice (20g) has 6.7g fat Potato chips, flavoured 33.4 1 50g pkt has 16.7g fat Mayonnaise, regular fat 32.3 1 tblsp has 6.4g fat Milk chocolate 27.4 1 regular Mars Bar has 11g fat Cake, chocolate mud cake 24.6 1 slice has 17.2g fat Chocolate chip biscuit 24 1 biscuit has 3g fat Salad dressing 23.8 1 tblsp has 4.8g fat Sausage Roll 23.6 1 sausage roll has 33g fat Tuna, canned in oil 23.2 1 small can (95g) has 2g fat Danish pastry 19.6 1 piece has 27g fat Sausage, beef, grilled 18.2 1 thin snag (44g) has 8.1g fat Bacon, middle, grilled 14.6 1 rasher (27g) 4g fat Mayonnaise, low fat 13.1 1 tblsp has 2.8g fat Meat Pie 11.8 1 pie has 20.5g fat Ice cream, regular vanilla 10.6 1 cup has 15g fat Steak, fillet, grilled 7.6 1 medium steak (65g) has 5g fat Milk, full cream 3.8 1 cup has 9.8g fat Rice cakes 3.4 2 cakes has 0.7g fat Bread, grain 2.9 1 sandwich slice has 1.0g fat Cheese, Low Fat Cottage 1.2 1 tblsp has 0.22g fat Baked beans 0.6 1 cup has 1.6g fat Salad dressing, light 0.1 1 tblsp has 0.02g fat Milk, skim 0.1 1 cup has 0.3g fat Banana 0.1 1 banana has 0.1g fat Potato, boiled 0.1 1 potato has 0.1g fat

28
ALCOHOL ON THE WAT DIET
In any weight loss diet, alcohol intake must be moderated. On the WAT diet we are asking you to limit your intake of alcohol to a maximum of 4 standard drinks a week. Alcohol often contributes to excess weight for two reasons:
It is high in energy (kilojoules/calories). o Alcohol provides 29kJ per gram which is nearly double that
provided by protein and carbohydrate (16-17kJ/g) but not quite as much per gram as fat (37kJ/g)
It is often consumed with other high-energy foods such as chips, nuts and soft drink.
Alcohol can still be enjoyed as part of a weight loss diet but IN MODERATION! So depending on how much alcohol you drink, you may need to cut down a little bit or quite a lot!! WHAT IS A STANDARD DRINK? One standard alcoholic drink contains about 14g alcohol. A common mistake is to think that one drink is the same as one “standard drink”. In fact the difference can be quite significant. One standard drink of wine is 100ml but most wine glasses hold at least 200ml. There are seven standard drinks in a regular bottle of wine. So remember:
One 200ml glass of wine is actually 2 standard drinks One can or stubby of heavy beer is 1.5 standard drinks One 375ml can of pre mixed spirits is 1.5 standard drinks
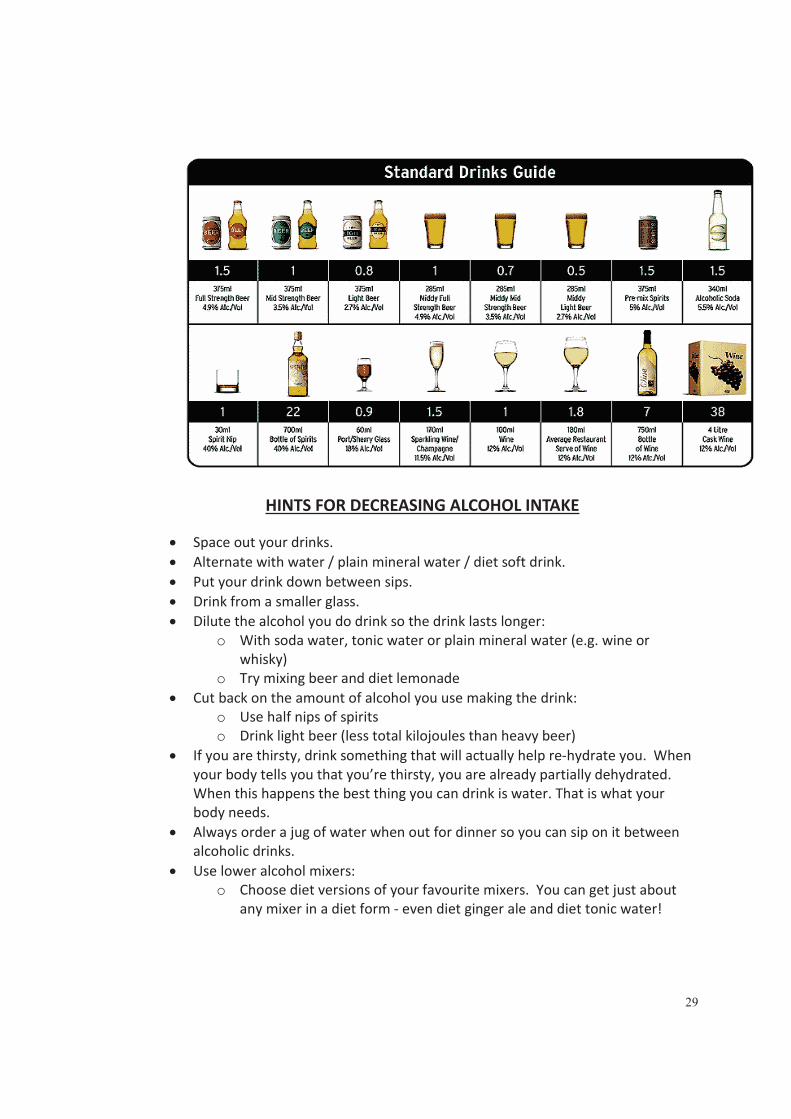
29
HINTS FOR DECREASING ALCOHOL INTAKE
Space out your drinks. Alternate with water / plain mineral water / diet soft drink. Put your drink down between sips. Drink from a smaller glass. Dilute the alcohol you do drink so the drink lasts longer:
o With soda water, tonic water or plain mineral water (e.g. wine or whisky)
o Try mixing beer and diet lemonade Cut back on the amount of alcohol you use making the drink:
o Use half nips of spirits o Drink light beer (less total kilojoules than heavy beer)
If you are thirsty, drink something that will actually help re-hydrate you. When your body tells you that you’re thirsty, you are already partially dehydrated. When this happens the best thing you can drink is water. That is what your body needs. Always order a jug of water when out for dinner so you can sip on it between alcoholic drinks. Use lower alcohol mixers:
o Choose diet versions of your favourite mixers. You can get just about any mixer in a diet form - even diet ginger ale and diet tonic water!

30
Average kilojoule (kJ) content of certain alcoholic drinks:
Drink Energy (kJ) per serve Beer, heavy 1 x 375 ml can has 550kJ (1.5 standard drinks) Beer, light 1 x 375 ml can has 393kJ (0.8 standard drinks) Wine, red or white 1 x 150 ml wine glass has 425kJ (1.5 standard drinks) Wine, red or white 1 x 200 ml wine glass has 565kJ (2.0 standard drinks) Wine, white sparkling 1 x 150 ml glass has 406 kJ Rum 1 x 30ml nip has 255kJ (1.0 standard drink) Mixed Drink,Rum&Cola 30ml rum & 200ml cola has 605kJ Mixed Drink,Rum&DietCola 30ml rum & 200ml diet cola has 259kJ Mixed Drink,Pre-Mixed,Canned,Rum&Cola 1 x 375 ml can has 984kJ (1.5 standard drinks) Gin 1 x 30ml nip has 260kJ (1.0 standard drink) Mixed Drink,Gin&Tonic 30ml gin & 200ml tonic has 547kJ Mixed Drink,Gin&DietTonic 30ml gin & 200ml diet tonic has 256kJ Mixed Drink,Pre-Mixed,Canned,Gin&Tonic 1 x 375 ml can has 903kJ (1.5 standard drinks) Vodka 1 x 30ml nip has 256kJ (1.0 standard drink) Mixed Drink,Vodka&Orange 30ml vodka & 200ml orange juice has 558kJ Mixed Drink,Pre-Mixed,Canned,Vodka&Orange
1 x 375 ml can has 890kJ (1.5 standard drinks)
Mixed Drink,Pre-Mixed,Vodka,Lemon,Lime&Soda
1 x 375 ml can has 1938kJ (1.5 standard drinks)
Mixed Drink,Premixed,Canned,Brandy,Lime&Soda
1 x 375 ml can has 1857kJ (1.5 standard drinks)
Port 1 x 55ml glass has 341kJ Liqueur,Cream-Based,Coffee Flavour 1 x 30ml nip has 436kJ

31
PHYSICAL ACTIVITY Physical activity is a VITAL part of any weight loss program. Weight Loss: For weight loss (fat loss) to occur, the energy expended (physical activity) needs to be greater than the energy consumed (from all foods).
ENERGY IN ENERGY OUTFOOD EATEN EXERCISE = WEIGHT
LOSS
Physical Activity Goal on the Weight loss program: 30 minutes of MODERATE intensity AEROBIC physical activity on
all or most days of the week
What does aerobic physical activity mean? Aerobic exercise is continuous in nature, involves large muscle groups and increases your heart rate. Examples include, brisk walking, jogging, stair climbing, cycling, swimming, cross-country skiing, rowing, aerobics and dancing. Other sports like tennis and basketball can also incorporate an aerobic component, but due to continual stoping and starting you will need to increase your total time i.e. longer than 30 minutes. What does moderate intensity mean? Moderate intensity means the exercise should feel “somewhat hard” causing an increase in heart rate. A leisurely walk would not achieve this. A fast/brisk power walk with large steps and large arm movements would cause an increase in heart rate and thus burn more energy. Incorporating a hill or a light jog is another way of increasing your heart rate. Remember, as you get fitter, your body becomes more efficient as it adapts to the change. Because of this, you need to constantly increase the difficulty of the exercise in order to elevate your heart rate and continue weight loss. How do you determine moderate intensity physical activity? (Am I exercising hard enough?) Method 1
The Borg Rate of Perceived Exertion scale is one method to gauge the intensity of your physical activity. This scale assigns a number for different levels of exercise intensity. Moderate intensity would be classed as somewhat hard at 12-13.
very, very very fairly somewhat hard very very, very light light light hard hard hard6 7 8 9 10 11 12 13 14 15 16 17 18 19 20
<
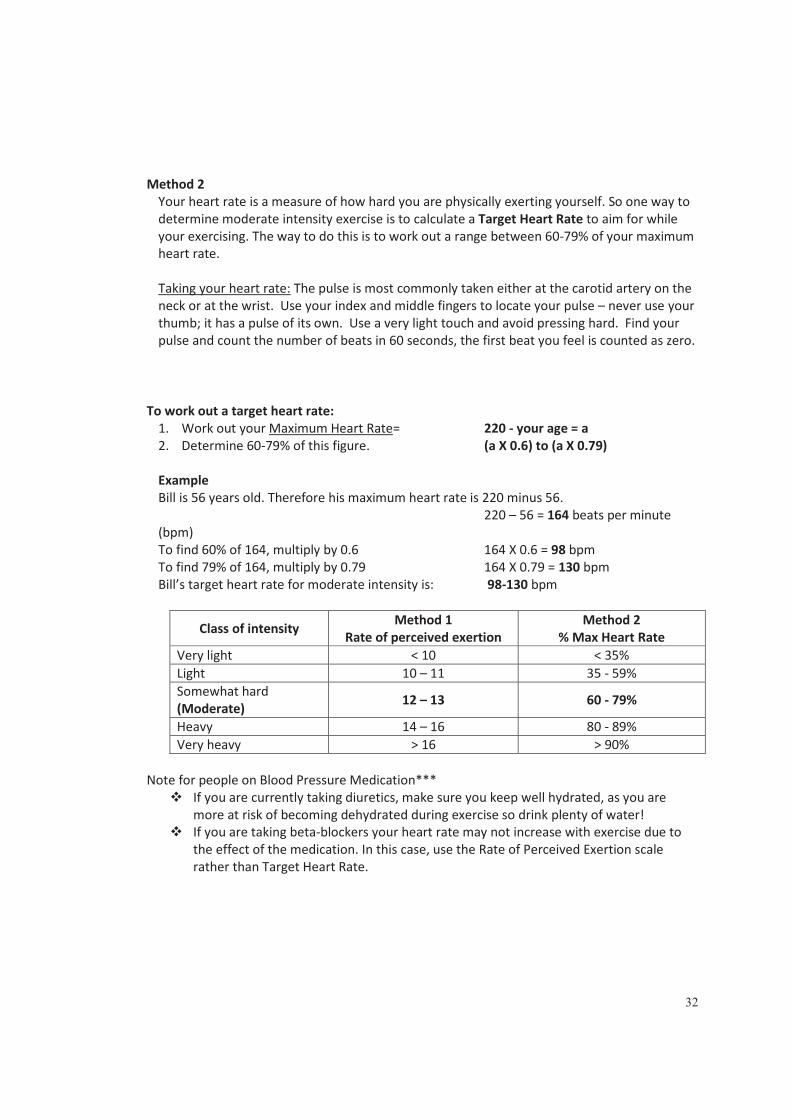
32
Method 2
Your heart rate is a measure of how hard you are physically exerting yourself. So one way to determine moderate intensity exercise is to calculate a Target Heart Rate to aim for while your exercising. The way to do this is to work out a range between 60-79% of your maximum heart rate. Taking your heart rate: The pulse is most commonly taken either at the carotid artery on the neck or at the wrist. Use your index and middle fingers to locate your pulse – never use your thumb; it has a pulse of its own. Use a very light touch and avoid pressing hard. Find your pulse and count the number of beats in 60 seconds, the first beat you feel is counted as zero.
To work out a target heart rate: 1. Work out your Maximum Heart Rate= 220 - your age = a 2. Determine 60-79% of this figure. (a X 0.6) to (a X 0.79) Example Bill is 56 years old. Therefore his maximum heart rate is 220 minus 56. 220 – 56 = 164 beats per minute (bpm) To find 60% of 164, multiply by 0.6 164 X 0.6 = 98 bpm To find 79% of 164, multiply by 0.79 164 X 0.79 = 130 bpm Bill’s target heart rate for moderate intensity is: 98-130 bpm
Class of intensity Method 1 Rate of perceived exertion
Method 2 % Max Heart Rate
Very light < 10 < 35% Light 10 – 11 35 - 59% Somewhat hard (Moderate) 12 – 13 60 - 79%
Heavy 14 – 16 80 - 89% Very heavy > 16 > 90%
Note for people on Blood Pressure Medication***
If you are currently taking diuretics, make sure you keep well hydrated, as you are more at risk of becoming dehydrated during exercise so drink plenty of water! If you are taking beta-blockers your heart rate may not increase with exercise due to the effect of the medication. In this case, use the Rate of Perceived Exertion scale rather than Target Heart Rate.

33
General safety tips Keep breathing! Never hold your breath while exercising. Always warm up by gradually increasing the intensity (walk before running) and cool down (slow down back to a walk) for a minimum of 5 – 10 minutes at the start and end of every exercise session. Always stretch the appropriate muscles in use after the warm up and cool down (approx 30sec). Never stretch cold muscles! Always take a water bottle and keep well hydrated. Dress appropriately to avoid over heating and wear appropriate footwear (how old are your sneakers????). Old sneakers increase the amount of force going through your joints and thus increase risk of injury. Wear appropriate protective gear i.e. Bike helmets. Always gradually increase the intensity over time. Stop if experiencing pain. Ring or email Lisa ([email protected]) with any queries, concerns or questions! IF IN DOUBT ASK FIRST.
For a CHALLENGE
For a change, walk with a friend who is fitter or walks faster than you (and keep up!). Try carrying hand weights and make large arm swinging actions while walking. Try underwater running rather than swimming. Add a few hills in your walk. Introduce a light jog intermittently in your walk eg. a 30 sec jog every 5 minutes. Try a new activity!
Appendix J
Information given to subjects following the portion
control diet in study three

The WAT Study
This diet is designed to REDUCE the portion sizes of the meals you consume. You do not have to change what you are eating, just the AMOUNT of what you are eating. Large portion sizes are a cause for weight gain and by following the below tips, weight loss should occur. Here are some guidelines to follow:
1. Use the provided plate This plate is probably smaller than your own. This makes a little food look like a lot, and research suggests that eating on smaller plates helps people eat less.
2. Eat mindfully
Take time to enjoy the taste and texture of food – and the experience of feeling full.
3. Avoid distractions
You’re more likely to notice how much you eat if you don’t multitask. So avoid eating while driving, reading or watching TV.
4. Follow the 80 percent rule
Stop eating before you feel completely full. This guideline fits in with eating mindfully (dot point 2)
These tips may be easy to follow at home, but what happens when you are eating out at a restaurant?
1. Just get an appetizer or two Or share the entrée
2. Doggy bag it
Bring half of your meal home to enjoy on another day. Get the extra food wrapped up early so there’s less temptation.
3. Avoid “value” meals
You may get more food but the extra calories, saturated fat, and sodium will probably hurt your heart and waist more than help your wallet.
4. Order water
The average caloric intake has increased in Australians over the past 20 years, and about half of the increase comes from sugar sweetened drinks, which are often packed with calories and are easily consumed.

1
Appendix K
CHAMPS questionnaire
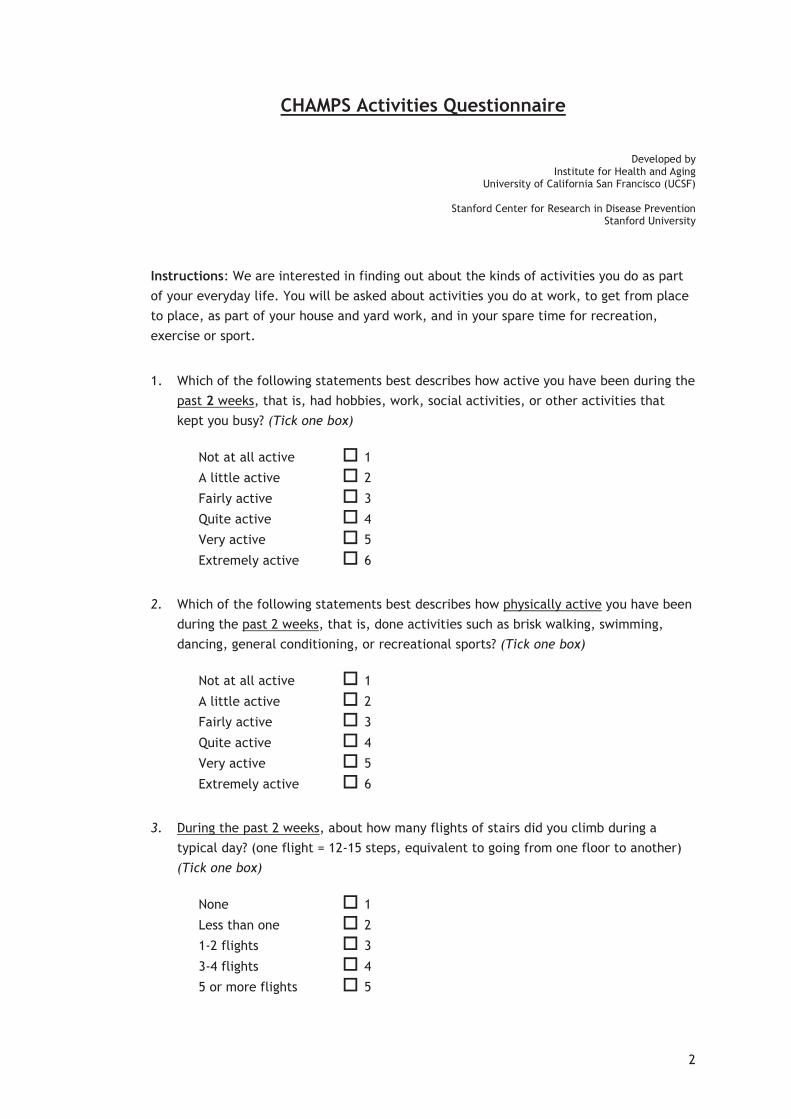
2
CHAMPS Activities Questionnaire
Developed byInstitute for Health and Aging
University of California San Francisco (UCSF)
Stanford Center for Research in Disease PreventionStanford University
Instructions: We are interested in finding out about the kinds of activities you do as part of your everyday life. You will be asked about activities you do at work, to get from place to place, as part of your house and yard work, and in your spare time for recreation, exercise or sport.
1. Which of the following statements best describes how active you have been during the past 2 weeks, that is, had hobbies, work, social activities, or other activities that kept you busy? (Tick one box)
Not at all active 1
A little active 2
Fairly active 3
Quite active 4
Very active 5
Extremely active 6
2. Which of the following statements best describes how physically active you have been during the past 2 weeks, that is, done activities such as brisk walking, swimming, dancing, general conditioning, or recreational sports? (Tick one box)
Not at all active 1
A little active 2
Fairly active 3
Quite active 4
Very active 5
Extremely active 6
3. During the past 2 weeks, about how many flights of stairs did you climb during a typical day? (one flight = 12-15 steps, equivalent to going from one floor to another) (Tick one box)
None 1
Less than one 2
1-2 flights 3
3-4 flights 4
5 or more flights 5

3
Instructions: Read Carefully
4. Think about the past 4 weeks. The next few pages list various activities you might have done. Before you begin, please review the following steps and examples:
Step #1: Number of times each week
For each activity, write on the line provided how many times each week, on average, you did that activity. If you did an activity less than once a week or not at all, please write “0” on the line provided
For example, if you did not do the activity at all or did it less than once a weekduring the past 4 weeks (see Example A)
Example A Step #1
Activities Number of times a week
(If none, write “0”)
Less than 1 hr/wk
1-2½ hrs/wk
3-4½ hrs/wk
5-6½ hrs/wk
7-8½ hrs/wk
9 or more
hrs/wk
Mow lawnsTimes
a week _0_ A B C D E F
Step #2: Total time, on average, each week
If you did the activity at least once a week, circle one letter representing how much total time, on average, you spent doing it each week (see Example B)
For example, if you did the activity on average 3 times a week for a total of 1½ hours:
Example B Step #1 Step #2
Activities Number of times a week
(If none, write “0”)
Less than 1 hr/wk
1-2½ hrs/wk
3-4½ hrs/wk
5-6½ hrs/wk
7-8½ hrs/wk
9 or more
hrs/wk
Use computer
Times
a week _3_ A B C D E F
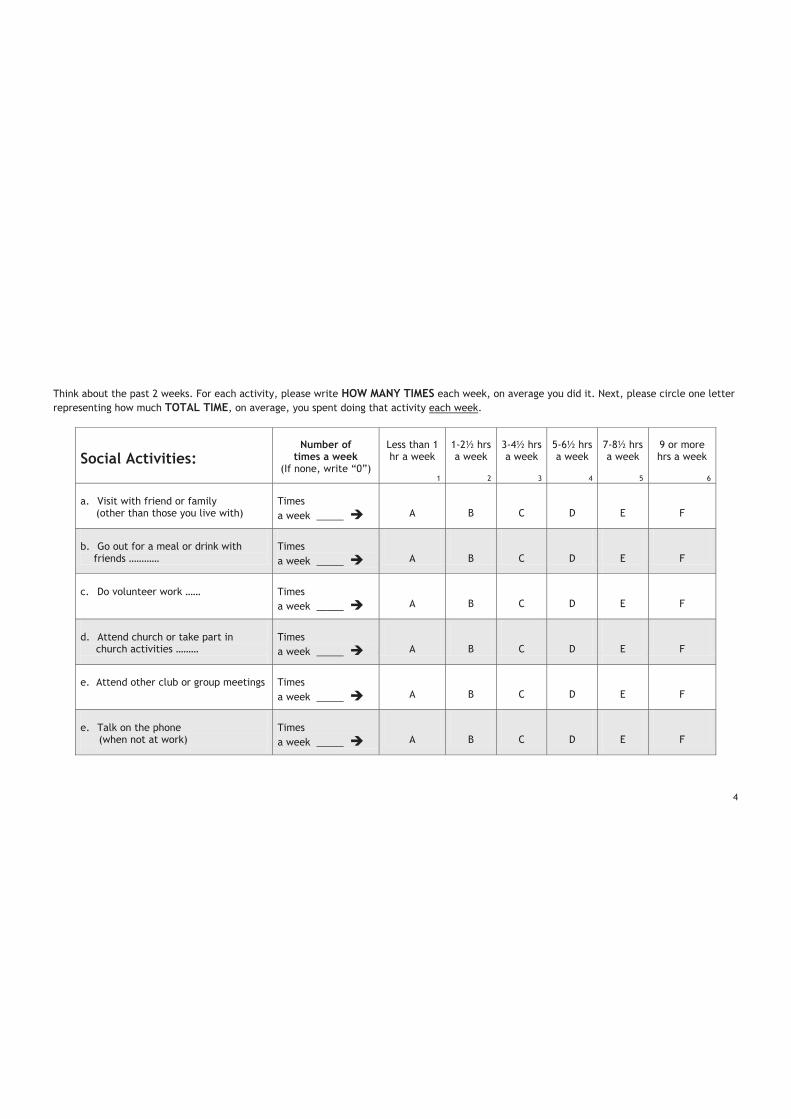
4
Think about the past 2 weeks. For each activity, please write HOW MANY TIMES each week, on average you did it. Next, please circle one letter representing how much TOTAL TIME, on average, you spent doing that activity each week.
Social Activities:Number of
times a week(If none, write “0”)
Less than 1 hr a week
1
1-2½ hrs a week
2
3-4½ hrs a week
3
5-6½ hrs a week
4
7-8½ hrs a week
5
9 or more hrs a week
6
a. Visit with friend or family (other than those you live with)
Times a week _____ A B C D E F
b. Go out for a meal or drink with friends …………
Times a week _____ A B C D E F
c. Do volunteer work …… Times a week _____ A B C D E F
d. Attend church or take part in church activities ………
Times a week _____ A B C D E F
e. Attend other club or group meetings Times a week _____ A B C D E F
e. Talk on the phone(when not at work)
Times a week _____ A B C D E F
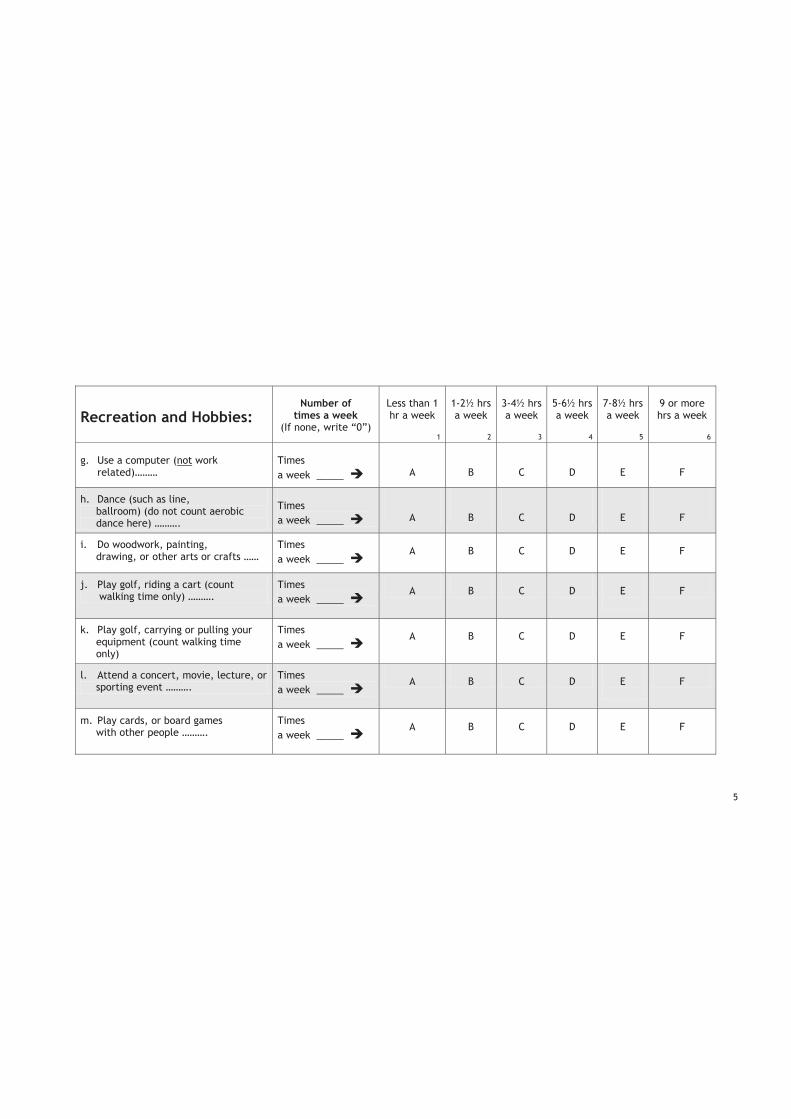
5
Recreation and Hobbies:Number of
times a week(If none, write “0”)
Less than 1 hr a week
1
1-2½ hrs a week
2
3-4½ hrs a week
3
5-6½ hrs a week
4
7-8½ hrs a week
5
9 or more hrs a week
6
g. Use a computer (not work related)………
Times a week _____ A B C D E F
h. Dance (such as line, ballroom) (do not count aerobic dance here) ……….
Times a week _____ A B C D E F
i. Do woodwork, painting, drawing, or other arts or crafts ……
Times a week _____
A B C D E F
j. Play golf, riding a cart (count walking time only) ……….
Times a week _____
A B C D E F
k. Play golf, carrying or pulling your equipment (count walking time only)
Times a week _____
A B C D E F
l. Attend a concert, movie, lecture, or sporting event ……….
Times a week _____
A B C D E F
m. Play cards, or board games with other people ……….
Times a week _____
A B C D E F
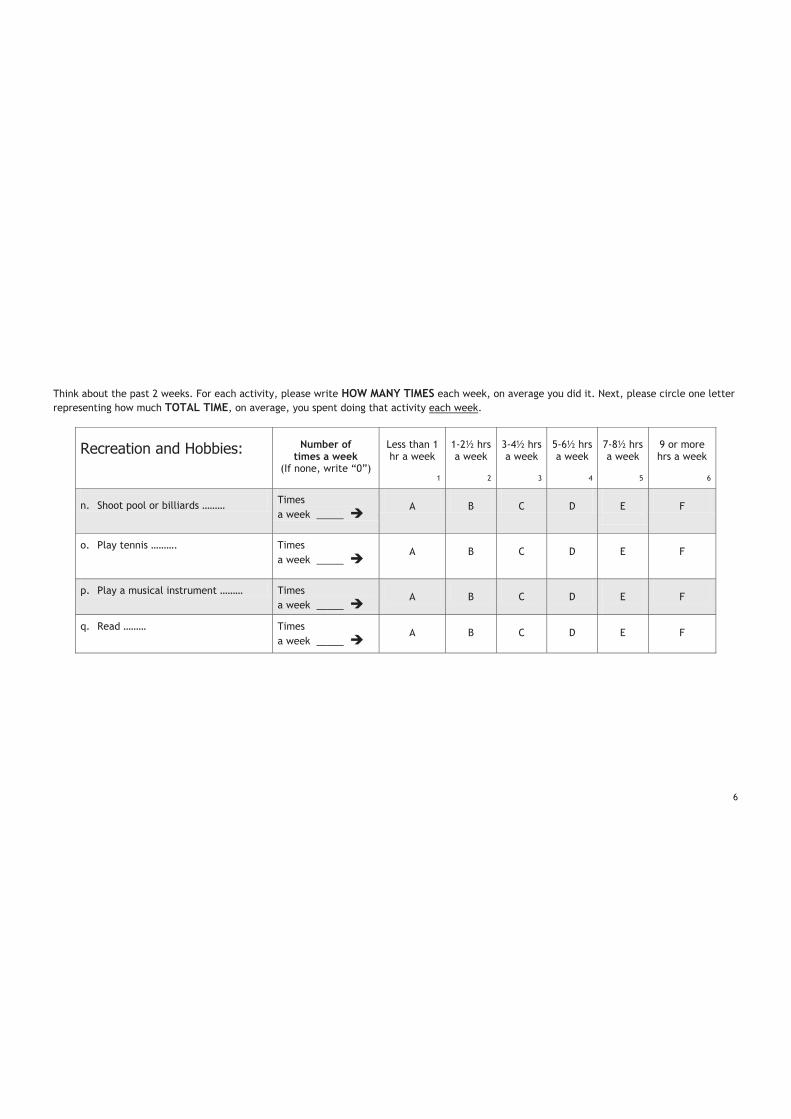
6
Think about the past 2 weeks. For each activity, please write HOW MANY TIMES each week, on average you did it. Next, please circle one letter representing how much TOTAL TIME, on average, you spent doing that activity each week.
Recreation and Hobbies: Number of times a week
(If none, write “0”)
Less than 1 hr a week
1
1-2½ hrs a week
2
3-4½ hrs a week
3
5-6½ hrs a week
4
7-8½ hrs a week
5
9 or more hrs a week
6
n. Shoot pool or billiards ……… Times a week _____
A B C D E F
o. Play tennis ………. Times a week _____
A B C D E F
p. Play a musical instrument ……… Times a week _____
A B C D E F
q. Read ……… Times a week _____
A B C D E F
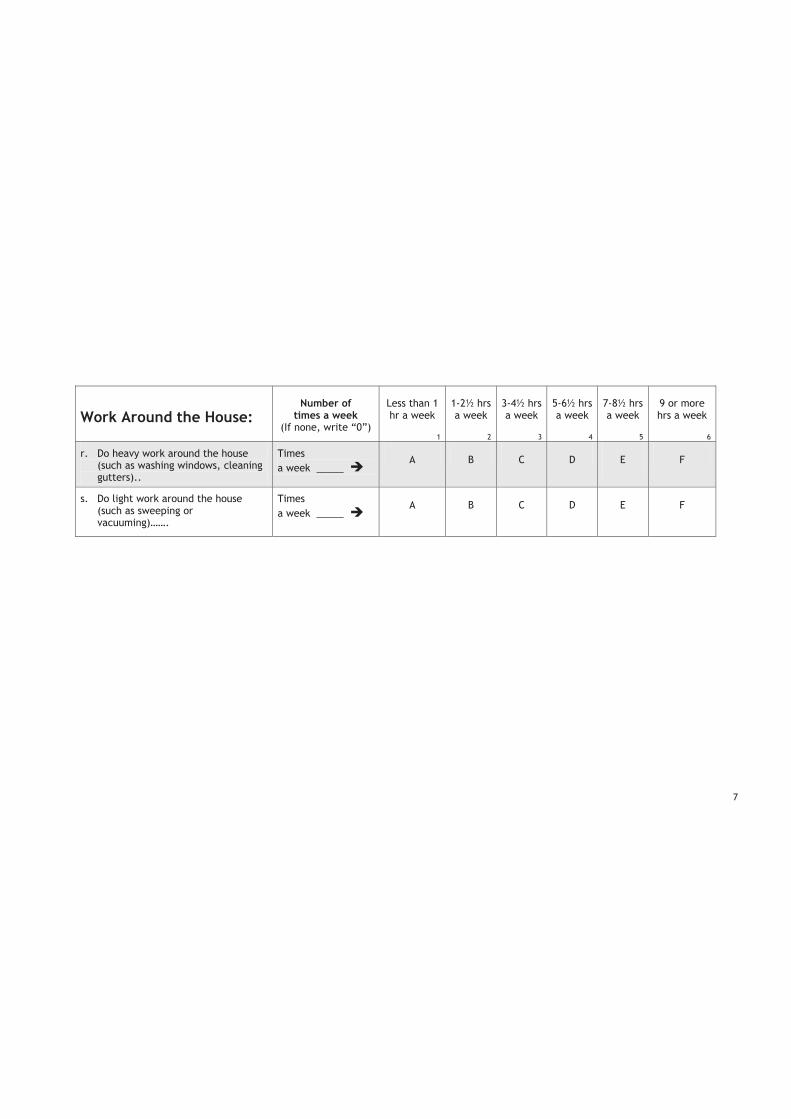
7
Work Around the House:Number of
times a week(If none, write “0”)
Less than 1 hr a week
1
1-2½ hrs a week
2
3-4½ hrs a week
3
5-6½ hrs a week
4
7-8½ hrs a week
5
9 or more hrs a week
6
r. Do heavy work around the house (such as washing windows, cleaning gutters)..
Times a week _____
A B C D E F
s. Do light work around the house (such as sweeping or vacuuming)…….
Times a week _____
A B C D E F

8
Work Around the House: Number of times a week
(If none, write “0”)
Less than 1 hr a week
1
1-2½ hrs a week
2
3-4½ hrs a week
3
5-6½ hrs a week
4
7-8½ hrs a week
5
9 or more hrs a week
6
t. Do heavy gardening (such as digging in garden, raking)……….
Times a week _____
A B C D E F
u. Do light gardening (such as watering plants) ………
Times a week _____
A B C D E F
v. Work on your car, truck, lawn mower, or other machinery …..
Times a week _____
A B C D E F
Walking and Jogging:Number of
times a week(If none, write “0”)
Less than 1 hr a week
1
1-2½ hrs a week
2
3-4½ hrs a week
3
5-6½ hrs a week
4
7-8½ hrs a week
5
9 or more hrs a week
6
w. Walk uphill or hike uphill (count only uphill part) ……..
Times a week _____
A B C D E F
x. Walk leisurely for exercise or pleasure ………
Times a week _____
A B C D E F
z. Walk to do errands (such as to/from a shop) (count walk time only)
Times a week _____
A B C D E F
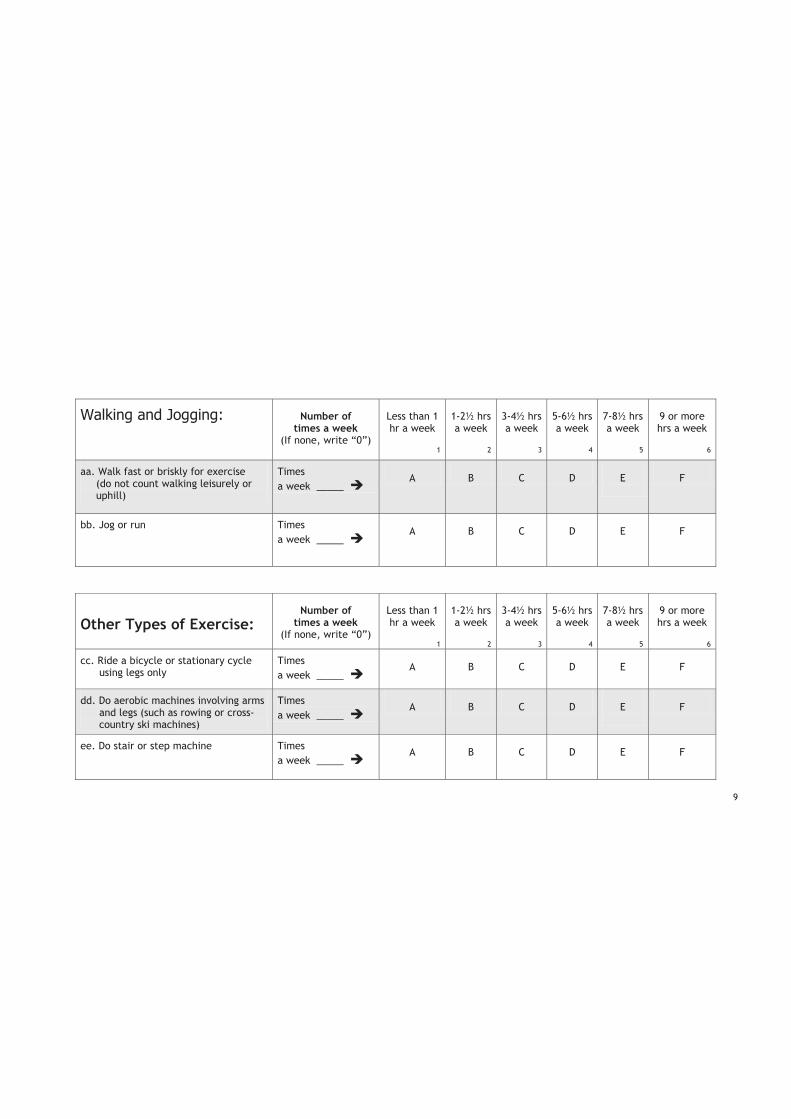
9
Walking and Jogging: Number of times a week
(If none, write “0”)
Less than 1 hr a week
1
1-2½ hrs a week
2
3-4½ hrs a week
3
5-6½ hrs a week
4
7-8½ hrs a week
5
9 or more hrs a week
6
aa. Walk fast or briskly for exercise (do not count walking leisurely or uphill)
Times a week _____
A B C D E F
bb. Jog or run Times a week _____
A B C D E F
Other Types of Exercise:Number of
times a week(If none, write “0”)
Less than 1 hr a week
1
1-2½ hrs a week
2
3-4½ hrs a week
3
5-6½ hrs a week
4
7-8½ hrs a week
5
9 or more hrs a week
6
cc. Ride a bicycle or stationary cycle using legs only
Times a week _____
A B C D E F
dd. Do aerobic machines involving arms and legs (such as rowing or cross- country ski machines)
Times a week _____
A B C D E F
ee. Do stair or step machine Times a week _____
A B C D E F
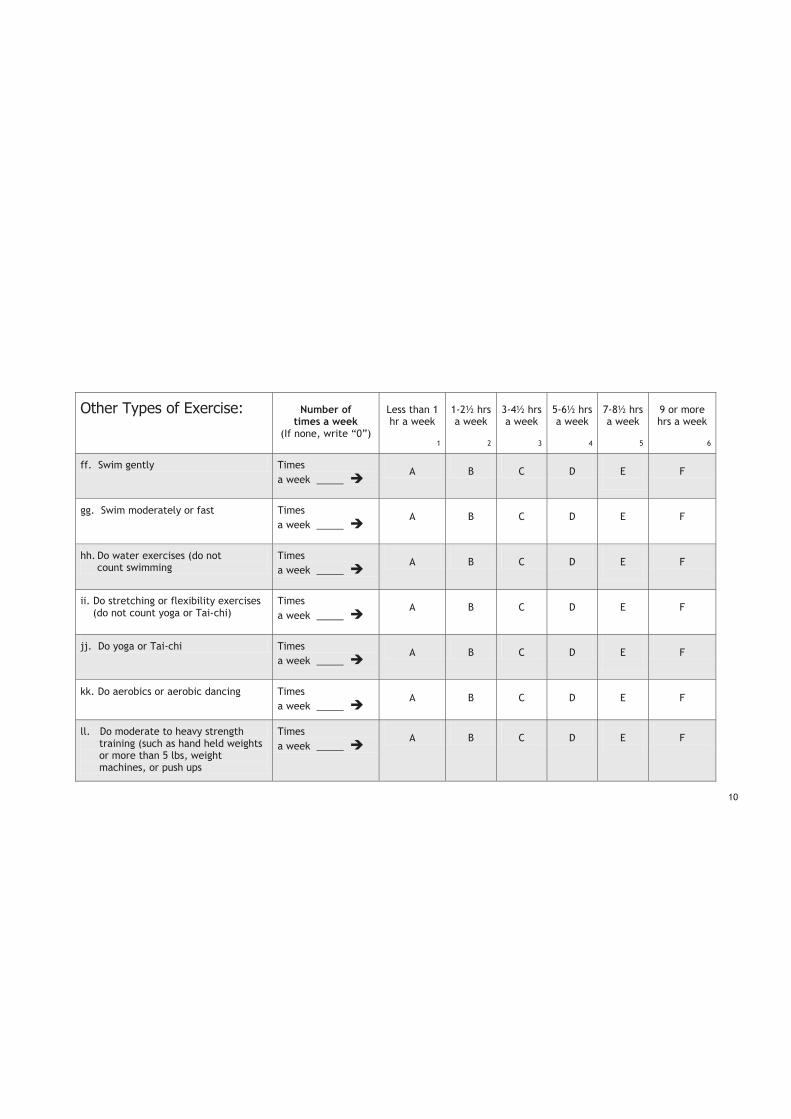
10
Other Types of Exercise: Number of times a week
(If none, write “0”)
Less than 1 hr a week
1
1-2½ hrs a week
2
3-4½ hrs a week
3
5-6½ hrs a week
4
7-8½ hrs a week
5
9 or more hrs a week
6
ff. Swim gently Times a week _____
A B C D E F
gg. Swim moderately or fast Times a week _____
A B C D E F
hh. Do water exercises (do notcount swimming
Times a week _____
A B C D E F
ii. Do stretching or flexibility exercises (do not count yoga or Tai-chi)
Times a week _____
A B C D E F
jj. Do yoga or Tai-chi Times a week _____
A B C D E F
kk. Do aerobics or aerobic dancing Times a week _____
A B C D E F
ll. Do moderate to heavy strength training (such as hand held weights or more than 5 lbs, weight machines, or push ups
Times a week _____
A B C D E F
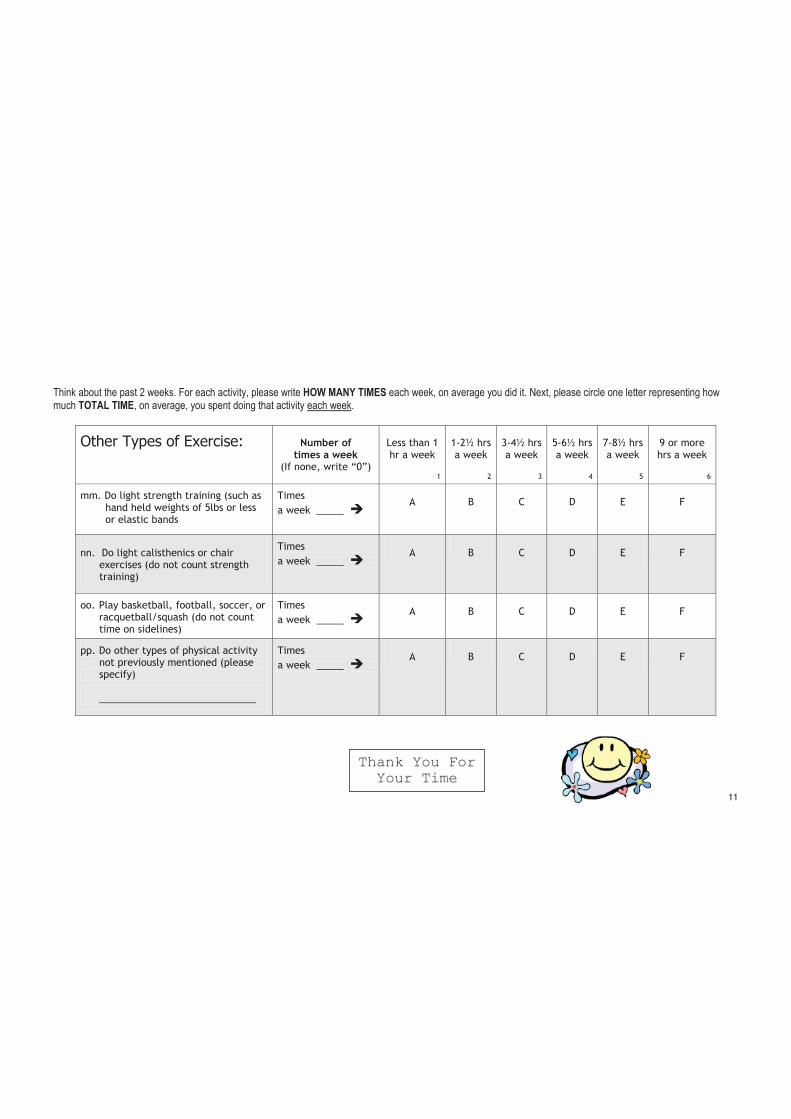
11
Think about the past 2 weeks. For each activity, please write HOW MANY TIMES each week, on average you did it. Next, please circle one letter representing how much TOTAL TIME, on average, you spent doing that activity each week.
Other Types of Exercise: Number of times a week
(If none, write “0”)
Less than 1 hr a week
1
1-2½ hrs a week
2
3-4½ hrs a week
3
5-6½ hrs a week
4
7-8½ hrs a week
5
9 or more hrs a week
6
mm. Do light strength training (such as hand held weights of 5lbs or less or elastic bands
Times a week _____
A B C D E F
nn. Do light calisthenics or chair exercises (do not count strength training)
Times a week _____
A B C D E F
oo. Play basketball, football, soccer, or racquetball/squash (do not count time on sidelines)
Times a week _____
A B C D E F
pp. Do other types of physical activity not previously mentioned (please specify)
_____________________________
Times a week _____
A B C D E F
Thank You For Your Time
Appendix L
Recruitment flyer for study two


Appendix M
Recruitment flyer for study three