Embed Size (px)
Citation preview
Physiology & Behavior 129 (2014) 36–42
Contents lists available at ScienceDirect
Physiology & Behavior
j ourna l homepage: www.e lsev ie r .com/ locate /phb
Oral fat perception is related with body mass index, preference andconsumption of high-fat foods
Nina R. Martínez-Ruiz a, José A. López-Díaz b, Abraham Wall-Medrano b,Jorge A. Jiménez-Castro c, Ofelia Angulo a,⁎a Sensory Evaluation Laboratory, UNIDA, Instituto Tecnológico de Veracruz, Miguel Ángel de Quevedo 2779, Col. Formando Hogar, C.P. 97897, H. Veracruz, Veracruz, Mexicob Instituto de Ciencias Biomédicas, Universidad Autónoma de Ciudad Juárez, Anillo Envolvente del Pronaf y Estocolmo s/n, Col. Pronaf, C.P. 32300, Ciudad Juárez, Chihuahua, Mexicoc Statistics Area, Facultad de Zootecnia y Ecología, Universidad Autónoma de Chihuahua, Periférico Francisco R. Almada kilómetro 1, Zootecnia, C.P. 31415, Chihuahua, Chihuahua, Mexico
H I G H L I G H T S
• Oral linoleic acid (LA) intensity perception was evaluated in humans.• High-intensity ratings of linoleic acid were inversely related with BMI and WC.• High-fat foods were preferred less by subjects with high-intensity ratings for LA.• Subjects with high-intensity ratings of LA had low consumption of high-fat foods.
⁎ Corresponding author at: Holbein 51 303-B Col. STel.: +52 55 1953 2681.
E-mail address: [email protected] (O. Angulo).
http://dx.doi.org/10.1016/j.physbeh.2014.02.0100031-9384/© 2014 Published by Elsevier Inc.
a b s t r a c t
a r t i c l e i n f oArticle history:Received 24 April 2013Received in revised form 31 October 2013Accepted 4 February 2014Available online 14 February 2014
Keywords:FatIntensity perceptionFatty acidIntensity scalingBody mass indexPreference
Oral sensory perception may play an important role in food preferences, driving food intake and energy balance.Fat perceived in oral cavity has been associated with satiety and homeostatic signals. The purpose of this studywas to test the hypothesis that fat oral-intensity perception may be associated with BMI, food preferences andconsumption of fat-rich foods. The ability to perceive linoleic acid at different concentrations by intensity scalingwas measured in young adults (n = 121), characterized by anthropometric measurements such as body massindex (BMI), waist circumference (WC) and total body fat (TBF) percentage. Additionally, dietary habits wererecorded online during 35 days using a questionnaire designed according to the 24-hour recall and the fooddiarymethods. Finally, food preferenceswere evaluated online using a nine-point hedonic scale. Taste sensitivity(intensity scaling with suprathreshold concentrations) was estimated with different linoleic acid concentrationsusing a linear scale of 150 mm labeled at the ends. Four groups were established after the ratings for oral-intensity perception of linoleic acid: quartile high ratings (QH), quartile medium-high ratings (QMH), quartilemedium-low ratings (QML) and quartile low ratings (QL). Participants with high-intensity ratings for linoleicacid (QH) had lower BMI (p = 0.04) and waist circumference (WC) (p = 0.03) values than participants in theQL group. High-fat foods (foods with more than 20% of energy from lipids such as fast foods and Mexican streetfoods) were less preferred by participants with high-intensity ratings for linoleic acid (QH) than by participantswithmedium- (QMH, QML) and low-(QL) intensity ratings (p b 0.01). Also, participantswith high-intensity ratingsfor linoleic acid (QH) presented lower consumption of high-fat foods like fast foods (p = 0.04) and Mexicanstreet foods (p = 0.03) than subjects with medium- (QMH, QML) and low-(QL) intensity ratings. Overall, thesedata suggest that the participant's intensity ratings for oral perception of linoleic acid were inversely correlatedwith BMI, WC, preference and consumption of high-fat foods such as fast foods and Mexican street foods, andit may serve as a predisposing factor for fat consumption in humans.
© 2014 Published by Elsevier Inc.
an Juan, México D.F., Mexico.
1. Introduction
Detection thresholds for fatty acids in human indicate that fatperception involves gustatory, olfactory and, somatosensory cues [1].In fact, human can detect free fatty acids (FFA) in the oral cavity whennongustatory cues, such as viscosity and lubricity, are minimized [1,2].The importance of FFA as signaling molecules is firmly established [3].
37N.R. Martínez-Ruiz et al. / Physiology & Behavior 129 (2014) 36–42
Fourmechanisms have been suggested for taste receptor cells: blockingrectifying potassium channels, interactionswith CD36 receptor, bindingto a range of G-protein coupled receptors and diffusion [3]. The CD36protein has been identified in a wide range of cells and tissues in verte-brate animals, and linkedwithmultiple roles such as, adhesion phenom-ena, signal transduction, and hematopathology [4,5]. Additionally, CD36protein has been associatedwith oral sensory detection of lipids, with fatpreference andwith digestive secretions [6–8]. In fact, full inactivation ofCD36 gene abolished the preference for long-chain fatty acids (LCFA) inCD36-null mice [8]. This protein affects the lipid-induced cephalicphase that prepares the digestive tract to incoming fat [9]. The presenceof CD36 protein has been confirmed in human circumvallate and foliatepapillae cells [10] showing high affinity for LCFA [11]. The chorda tympa-ni (CT) nerve and the glossopharyngeal (GL) nerve are linked to fatsignals after oral linoleic acid deposition in rodents [12].
Recent studies suggested that, subjects hypersensitive to fatty acids(measured by detection threshold for oleic acid), showed lower valuesof body mass index (BMI) and lower fat intake than hyposensitivesubjects [13,14]. However, the opposite results have been reportedby Mattes [15]. Polymorphisms in CD36 gene (rs1761667) indicatedthat subjects homozygous for the G-allele had lower oral detectionthresholds for oleic acid and triolein than subjects homozygous for theA allele, which was associated with lower CD36 expression [16]. Also,African-Americans who were not able to detect different contentsof fat in Italian salad dressings (fat non-discriminators) had greaterabdominal adiposity than fat discriminators [17].
Fat taste sensitivitymay play an important role in dietary habits andbody energy balance. Preference and over-consumption of foods withhigh content of lipids, characteristic of the Western diet (~40% dailycaloric intakes from lipids), contribute to the development of obesityand other related diseases. Mexico has among the highest rates ofoverweight and obesity in the world [18] and few sensory-nutritionalstudies have been conducted in Mexican population. The study offactors and behaviors that affect food intake is necessary for a betterunderstanding of this pathology. The aim of this study was to assess,in human, the oral sensitivity to linoleic acid by intensity scaling(suprathreshold concentrations) and its relationship with BMI, prefer-ence and consumption of high-fat (HF) foods. It was hypothesizedthat fat oral-intensity perception may be associated with BMI, prefer-ence and consumption of food rich in fat.
2. Materials and methods
2.1. Subjects
One hundred and twenty one university students (43 males; 78 fe-males), mean age 21.1±3.6 years, participated in this study. Participantshad to be Mexican or Ciudad Juarez residents for at least one year. Onehundred and nineteen were Mexican and two were American citizens.The residence mean-time in Ciudad Juarez, Chihuahua was 18.6 ±5.8 years. Participants were healthy and free of diseases that interferewith the ability to taste such as damage in the nerves of taste, chronicrespiratory infections, smoking or drug use. None of the participants pre-sented problems identifying and perceiving taste (ageusia, disgeusia).Participants were not on a diet neither were they on medication thatcould affect taste, food intake and boy weight. Pregnant or lactatingwomen were not included in the study.
2.2. Ethics
This study was conducted in accordance with the guidelines ofthe Declaration of Helsinki. The committee on human experimentationof the Universidad Autónoma de Ciudad Juárez approved all the proce-dures. Participants gave informed written consent.
2.3. Anthropometrics
Participants' weight (Seca® weight scale, Model 700) and height(Seca® stadiometer, Model 700) were used to calculate body massindex (BMI = kg/m2). Waist circumference (Seca® measuring tape,Model 201)wasmeasured and total body fat percentage was calculatedfrom four skinfold measurements (bicipital, tricipital, subscapular andsuprailiac) using a skinfold caliper (LANG®, 1 mm precision). Partici-pants were classified by BMI as underweight, normal weight, over-weight and obesity, according to criteria established by the WorldHealth Organization (WHO).
2.4. Dietary habits
Food records were done online during 35 days using a questionnairedesigned according to the 24-hour recall and the food diary methods[19]. All participants were trained to register the questionnaire onlinebefore the test began. Food records were registered daily and feedbackwas given to each participant. The purpose of feedback was to keepthe group motivated, and it did not interfere with food records. Thefeedback was done daily by e-mail, notifying the reception of foodrecords, reminding the importance of the study and, looking forwardto the next food records. The food record questionnaire included sixshort-sections (three meals: breakfast, lunch and dinner and, threesnacks: middle-morning, middle-afternoon and after-dinner) withsub-sections for drinks, foods and other foods (peripheral foods). Typeof food, description (including brands, preparation, and flavor),frequency and approximate amount of consumption were registeredin each section. Photographs with weight or volume references wereincluded, according to a previous study [20]. The questionnaire wasplaced in the University online platform (Claroline®), username andpasswordwere given to each participant and, a report from each subjectwas obtained daily. The energy and macronutrient content were calcu-lated for all foods using tables of food [21,22], nutritional calculators orchemical composition analysis.
2.5. Taste test-stimuli
Linoleic acid was chosen as stimulus based on previous studies onphysiological and sensory results [8]. Preliminary tests were conductedusing linoleic acid emulsions that ranged from 0.04 to 2.0% (v/v), withintervals of 0.5 units, considering linoleic acid emulsions used in previ-ous studies [8] and detection thresholds reported [13,23]. The followinglinoleic acid concentrations were used: 1.5, 17.5, 35.0 and 70.0 mM(0.04, 0.5, 1.0 and 2.1% (v/v), respectively) (Fluka Analytical Sigma-Aldrich®, St. Louis, MO). Linoleic acid was stored at 2–8 °C, accordingto themanufacturer recommendations. Linoleic acid (C18:2) emulsionswere prepared with xanthan gum (Sigma-Aldrich®, St. Louis, MO)0.15% (w/v) and mineral oil (Spectrum Chemical® Gardena, CA) 0.18%(v/v) to produce perceptually identical textural attributes including vis-cosity and lubricity between fatty acid and control samples. To preventoxidation, all samples were mixed with 0.01% (w/v) EDTA (JT Baker®,Phillipsburg, NJ) [13,23]. All emulsions were prepared using distilledwater (Ultrapura®, Chihuahua, Mex), and homogenized for 5 min per1000 ml emulsion [24] in a standard kitchen blender (Osterizer®,Model No. 6662) on seventh velocity [17,25]. The emulsions werestored in plastic bottles covered with aluminum foil. All sampleswere prepared the same day of testing. Control samples were pre-pared the same way, but without added linoleic acid. The emulsionstability was evaluated at 20, 40, 60 and 120 min according to theturbidimetric technique of Pearce and Kincella [26] with modifica-tions [27]. Samples' pH was monitored. Replicates of samples atdifferent linoleic acid concentrations were evaluated the same wayat room temperature (25 °C).
38 N.R. Martínez-Ruiz et al. / Physiology & Behavior 129 (2014) 36–42
2.6. Linoleic acid: taste sensitivity (intensity scaling)
Subjects were presented with four 5 ml C18:2 emulsions and onecontrol emulsion in 1 oz. plastic cups, identified with three-digitrandom numbers. Samples were tasted, spat, and scored for perceivedintensity using a 150 mm linear scale labeled at the ends with “Not atall fatty” and “Extremely fatty” [25,28,29]. These end-labels wereestablished after preliminary test, where panelist applied the word“fatty” over descriptors such as “pungent”, “bitter” or “sour”, when iden-tifying the flavor for linoleic acid, and considering a language study forbasic tastes reported by Majid and Levinson [30]. Participants rinsedtheir mouth with water at the beginning and between samples. One-minute interval between samples and 5 min between tests weretaken. Triplicate tests were carried out in individual booths, under redlight. Additionally, participants used goggles covered with red translu-cent paper during testing. Participants were asked not to eat, drink ortake any other oral product 1 h before testing. To reduce scaling bias;a “zero point”was set for the control emulsion. Themean of three inten-sity ratings per participant was obtained. Participants' ratings forlinoleic acid perception were ranked from lower to higher ratingsgiven to linoleic acid emulsion at the highest concentration tested. Thequartile position and linear interpolation were calculated [31]; theseresults were confirmed by the quartile estimation (XLSTAT version2012.2). Participants' intensity ratings were grouped by quartile asfollows: low (QL), medium–low (QML), medium–high (QMH) and high-(QH) intensity ratings for oral perception of linoleic acid.
2.7. Food preferences
The most frequently consumed foods were tested for preference.The food consumption frequency was estimated as follows: a) twotimes per day, b) three times per week or c) at least once during theperiod of study (35 days) by all participants [32,33]. Each foodwas eval-uated online (Claroline®University platform) by the participants, usinga nine-point hedonic scale, which ranged from 1= dislike extremely to9= like extremely [34]. Participants were asked to select the phrase onthe scale that best expresses their degree of liking for each food [35]. Foranalysis, the most frequently consumed foods were grouped into thefollowing categories based on nutritional and/or sensory properties:white meats (chicken, fish, sea food), red meats (beefs, sausages,pork), high-fat foods (HF) (foods with more than 20% of energy comingfrom lipids such as: fast foods, Mexican street foods also known as“antojitos”, i.e. taco, torta, quesadilla, burrito, tostada, menudo, amongothers), baked products, added fats and spreads and low-fat foods(fruits, fruit juices, vegetables, cereals and legumes).
Table 1Anthropometric characteristics of participants.
Participants by BMI groups⁎
Underweightn = 8
Normal weightn = 74
On
Males n (%) 1 (2.3) 26 (60.5) 9Females n (%) 7 (9.0) 48 (61.5) 1Age (y)⁎⁎ 19.3 ± 1.6a 21.1 ± 3.0a 2Weight (kg)⁎⁎ 46.7 ± 4.9a 57.9 ± 6.9b 7Height (cm)⁎⁎ 162.8 ± 0.1a 163.7 ± 0.1a 1BMI (kg/m2)⁎⁎ 17.5 ± 0.6a 21.6 ± 1.6b 2BMI ranges (kg/m2) (16.6–18.2) (18.7–24.4) (WC (cm)⁎⁎ 63.5 ± 3.5a 72.0 ± 5.2b 8TBF (%)⁎⁎ 20.6 ± 4.6a 23.3 ± 6.7b 2
Data are given by mean ± SD. BMI — body mass index, WC — waist circumference, and TBF—⁎ Criteria established by the World Health Organization (WHO): underweight, BMI ≤18
obesity, BMI ≥ 30.0 kg/m2.⁎⁎ Comparison among BMI groups.
2.8. Statistical analysis
Results from weight, height, BMI, WC and TBF percentage includ-ing gender data were analyzed by ANOVA (type III sum of squares)using Fisher's multiple comparisons (LSD). BMI, WC, TBF percentage,energy and macronutrient consumption, frequency and consump-tion of food were analyzed among quartiles with ANOVA (type IIIsum of squares) using Fisher's multiple comparisons (LSD) andPearson's correlation. Emulsion concentration and intensity percep-tion ratings for linoleic acid were analyzed by 2-factor-ANOVA (typeIII sum of squares). Preference data were analyzed by Kruskal–Wallistest. Gender, BMI and preference data proportions were analyzed byz-test (comparing two proportions) and χ2 (comparing k propor-tions) with Marascuilo procedure. All statistical analyses were con-ducted using XLSTAT program version 2012.2 (Addinsoft Paris,France). Data in the tables and figures are presented as mean valueswith standard deviation (SD). Criterion for statistical significancewas p b 0.05.
3. Results
3.1. Participants anthropometric characteristics
Participant's anthropometric characteristics are shown in Table 1.Males and females did not differ in BMI, age, and residence mean-time(p N 0.05). Significant correlations were observed between BMI-WC (r = 0.9, p b 0.01), BMI-TBF (r = 0.4, p b 0.01) and WC-TBF (r =0.3, p b 0.01) measurements. Ten participants presented level I obesity(32.1 ± 2.1 kg/m2), three presented level II (38.3 ± 1.2 kg/m2) andthree were in level III (47.0 ± 6.2 kg/m2), according to the criteriaestablished by WHO.
3.2. Dietary habits
The mean daily dietary record was 31.4 days. Total registered foodswere 857. One hundred and twenty one foods were frequently con-sumed. The cereals group had the highest consumption rate alongwith the non-alcoholic beverages (F (16,2040) = 120.8, p b 0.01).Fast foods, added fats, fruits (p = 0.87, p = 0.38) and white meats(p = 0.12, p = 0.61) were equally consumed. High-fat foods suchas Mexican street foods and baked products were more consumedthan vegetables and related group (p b 0.01). Potato chips, nachochips, tortilla chips, popcorn and legumes were equally consumed(p = 0.70).
verweight= 23
Obesityn = 16
p Alln = 121
(20.3) 7 (16.3) 43 (100)4 (18.0) 9 (11.5) 78 (100)0.8 ± 3.5a 22.3 ± 6.1a 0.27 21.1 ± 3.62.0 ± 9.9c 101.5 ± 24.2d b0.01 65.6 ± 19.064.4 ± 0.1a 167.3 ± 0.1a 0.52 164.2 ± 0.16.5 ± 1.3c 36.1 ± 6.6d b0.01 24.2 ± 5.825.0–29.5) (30.0–52.2) (16.6–52.2)5.2 ± 4.5c 105.2 ± 12.8d b0.01 78.4 ± 13.67.9 ± 5.6c 32.1 ± 5.5c b0.01 25.2 ± 7.1
total body fat. Different letters indicate significant difference (p b 0.05)..5 kg/m2; normal weight, BMI = 18.5–24.9 kg/m2; overweight, BMI= 25.0–29.9 kg/m2;
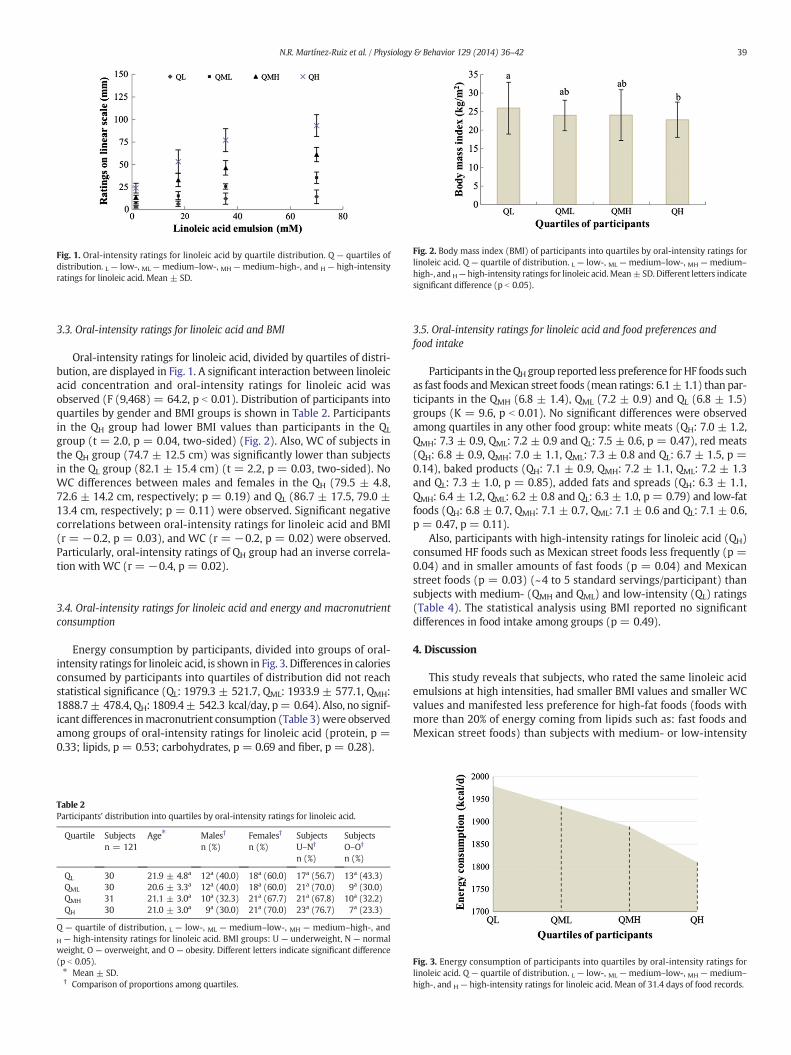
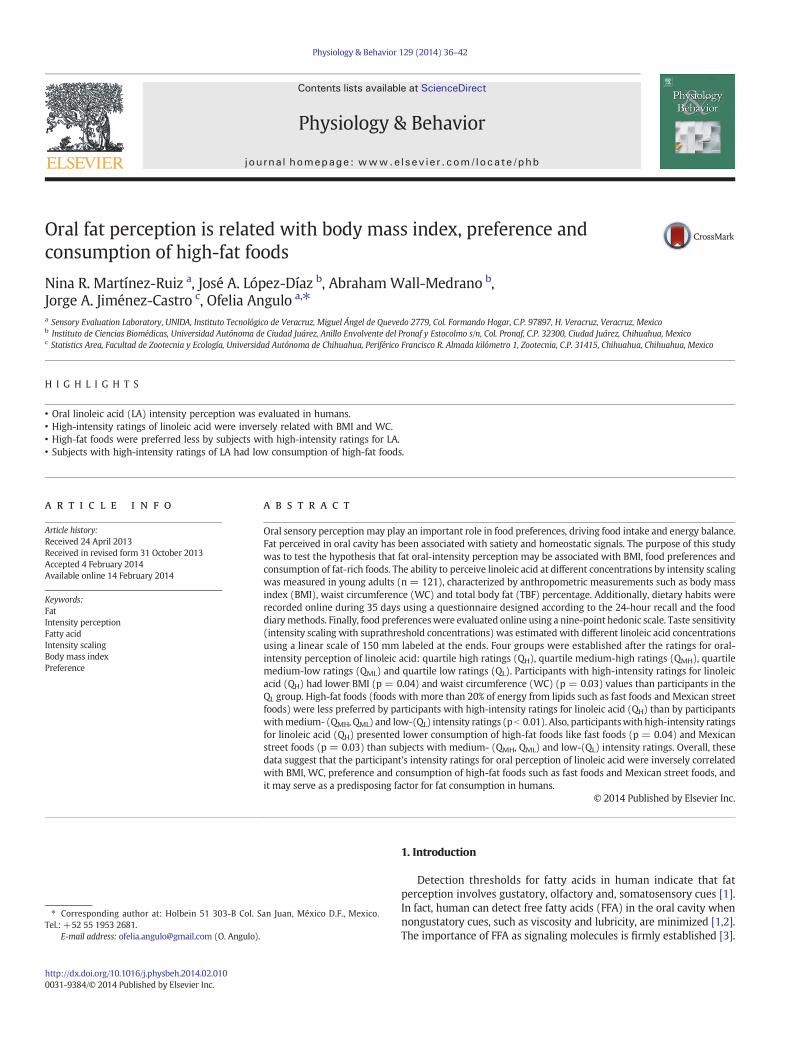
Fig. 1. Oral-intensity ratings for linoleic acid by quartile distribution. Q — quartiles ofdistribution. L — low-, ML — medium–low-, MH — medium–high-, and H — high-intensityratings for linoleic acid. Mean ± SD.
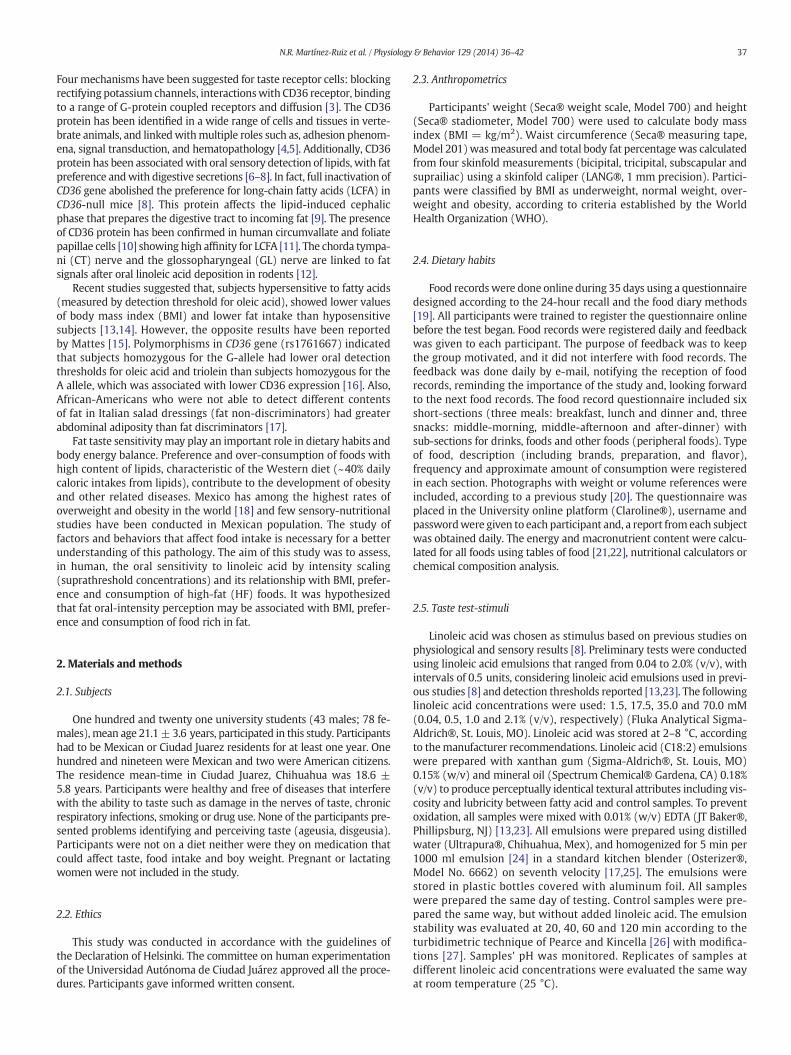
Fig. 2. Body mass index (BMI) of participants into quartiles by oral-intensity ratings forlinoleic acid. Q — quartile of distribution. L — low-, ML — medium–low-, MH — medium–
high-, and H— high-intensity ratings for linoleic acid.Mean± SD. Different letters indicatesignificant difference (p b 0.05).
39N.R. Martínez-Ruiz et al. / Physiology & Behavior 129 (2014) 36–42
3.3. Oral-intensity ratings for linoleic acid and BMI
Oral-intensity ratings for linoleic acid, divided by quartiles of distri-bution, are displayed in Fig. 1. A significant interaction between linoleicacid concentration and oral-intensity ratings for linoleic acid wasobserved (F (9,468) = 64.2, p b 0.01). Distribution of participants intoquartiles by gender and BMI groups is shown in Table 2. Participantsin the QH group had lower BMI values than participants in the QL
group (t = 2.0, p = 0.04, two-sided) (Fig. 2). Also, WC of subjects inthe QH group (74.7 ± 12.5 cm) was significantly lower than subjectsin the QL group (82.1 ± 15.4 cm) (t = 2.2, p = 0.03, two-sided). NoWC differences between males and females in the QH (79.5 ± 4.8,72.6 ± 14.2 cm, respectively; p = 0.19) and QL (86.7 ± 17.5, 79.0 ±13.4 cm, respectively; p = 0.11) were observed. Significant negativecorrelations between oral-intensity ratings for linoleic acid and BMI(r = −0.2, p = 0.03), and WC (r = −0.2, p = 0.02) were observed.Particularly, oral-intensity ratings of QH group had an inverse correla-tion with WC (r = −0.4, p = 0.02).
3.4. Oral-intensity ratings for linoleic acid and energy and macronutrientconsumption
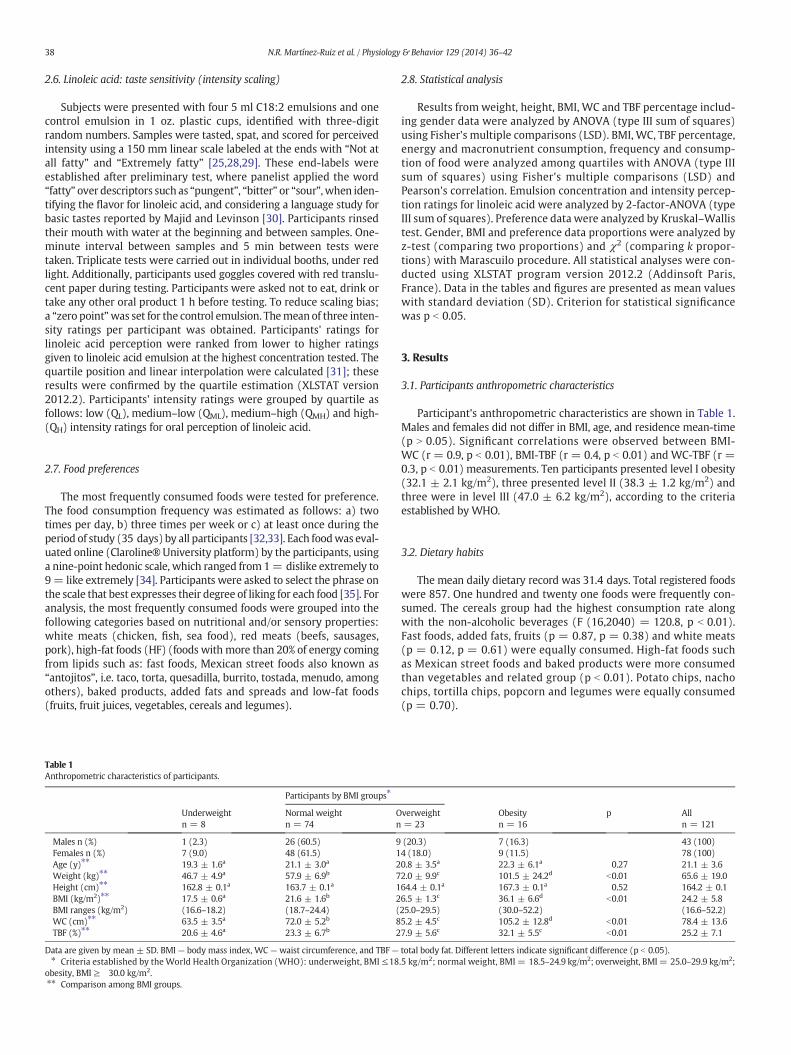
Energy consumption by participants, divided into groups of oral-intensity ratings for linoleic acid, is shown in Fig. 3. Differences in caloriesconsumed by participants into quartiles of distribution did not reachstatistical significance (QL: 1979.3 ± 521.7, QML: 1933.9 ± 577.1, QMH:1888.7± 478.4, QH: 1809.4± 542.3 kcal/day, p= 0.64). Also, no signif-icant differences inmacronutrient consumption (Table 3)were observedamong groups of oral-intensity ratings for linoleic acid (protein, p =0.33; lipids, p = 0.53; carbohydrates, p = 0.69 and fiber, p = 0.28).
Table 2Participants' distribution into quartiles by oral-intensity ratings for linoleic acid.
Quartile Subjectsn = 121
Age⁎ Males†
n (%)Females†
n (%)SubjectsU–N†
n (%)
SubjectsO–O†
n (%)
QL 30 21.9 ± 4.8a 12a (40.0) 18a (60.0) 17a (56.7) 13a (43.3)QML 30 20.6 ± 3.3a 12a (40.0) 18a (60.0) 21a (70.0) 9a (30.0)QMH 31 21.1 ± 3.0a 10a (32.3) 21a (67.7) 21a (67.8) 10a (32.2)QH 30 21.0 ± 3.0a 9a (30.0) 21a (70.0) 23a (76.7) 7a (23.3)
Q — quartile of distribution, L — low-, ML — medium–low-, MH — medium–high-, andH — high-intensity ratings for linoleic acid. BMI groups: U — underweight, N — normalweight, O — overweight, and O — obesity. Different letters indicate significant difference(p b 0.05).⁎ Mean ± SD.† Comparison of proportions among quartiles.
3.5. Oral-intensity ratings for linoleic acid and food preferences andfood intake
Participants in theQH group reported less preference forHF foods suchas fast foods andMexican street foods (mean ratings: 6.1±1.1) than par-ticipants in the QMH (6.8 ± 1.4), QML (7.2 ± 0.9) and QL (6.8 ± 1.5)groups (K = 9.6, p b 0.01). No significant differences were observedamong quartiles in any other food group: white meats (QH: 7.0 ± 1.2,QMH: 7.3 ± 0.9, QML: 7.2 ± 0.9 and QL: 7.5 ± 0.6, p = 0.47), red meats(QH: 6.8 ± 0.9, QMH: 7.0 ± 1.1, QML: 7.3 ± 0.8 and QL: 6.7 ± 1.5, p =0.14), baked products (QH: 7.1 ± 0.9, QMH: 7.2 ± 1.1, QML: 7.2 ± 1.3and QL: 7.3 ± 1.0, p = 0.85), added fats and spreads (QH: 6.3 ± 1.1,QMH: 6.4 ± 1.2, QML: 6.2 ± 0.8 and QL: 6.3 ± 1.0, p = 0.79) and low-fatfoods (QH: 6.8 ± 0.7, QMH: 7.1 ± 0.7, QML: 7.1 ± 0.6 and QL: 7.1 ± 0.6,p = 0.47, p = 0.11).
Also, participants with high-intensity ratings for linoleic acid (QH)consumed HF foods such as Mexican street foods less frequently (p =0.04) and in smaller amounts of fast foods (p = 0.04) and Mexicanstreet foods (p = 0.03) (~4 to 5 standard servings/participant) thansubjects with medium- (QMH and QML) and low-intensity (QL) ratings(Table 4). The statistical analysis using BMI reported no significantdifferences in food intake among groups (p = 0.49).
4. Discussion
This study reveals that subjects, who rated the same linoleic acidemulsions at high intensities, had smaller BMI values and smaller WCvalues and manifested less preference for high-fat foods (foods withmore than 20% of energy coming from lipids such as: fast foods andMexican street foods) than subjects with medium- or low-intensity
Fig. 3. Energy consumption of participants into quartiles by oral-intensity ratings forlinoleic acid. Q — quartile of distribution. L — low-, ML — medium–low-, MH — medium–
high-, and H — high-intensity ratings for linoleic acid. Mean of 31.4 days of food records.
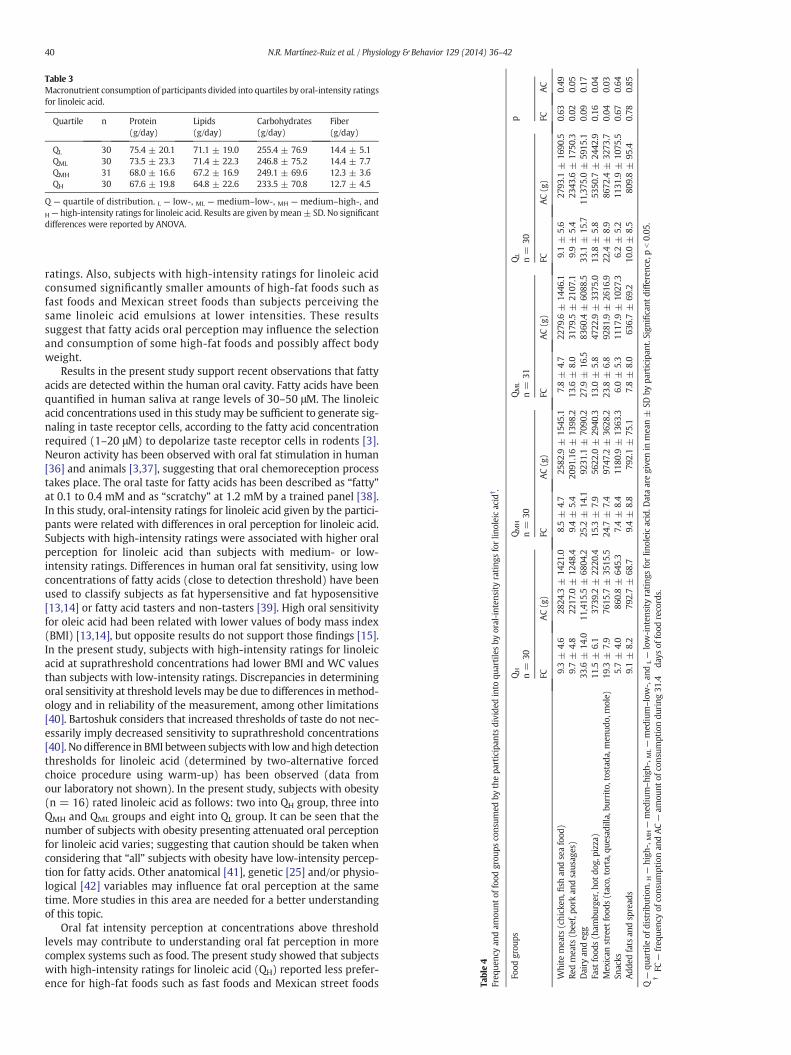
Table 3Macronutrient consumption of participants divided into quartiles by oral-intensity ratingsfor linoleic acid.
Quartile n Protein(g/day)
Lipids(g/day)
Carbohydrates(g/day)
Fiber(g/day)
QL 30 75.4 ± 20.1 71.1 ± 19.0 255.4 ± 76.9 14.4 ± 5.1QML 30 73.5 ± 23.3 71.4 ± 22.3 246.8 ± 75.2 14.4 ± 7.7QMH 31 68.0 ± 16.6 67.2 ± 16.9 249.1 ± 69.6 12.3 ± 3.6QH 30 67.6 ± 19.8 64.8 ± 22.6 233.5 ± 70.8 12.7 ± 4.5
Q — quartile of distribution. L — low-, ML — medium–low-, MH — medium–high-, andH — high-intensity ratings for linoleic acid. Results are given bymean± SD. No significantdifferences were reported by ANOVA.
Table4
Freq
uenc
yan
dam
ount
offood
grou
psco
nsum
edby
thepa
rticipan
tsdivide
dinto
quartilesby
oral-inten
sity
rating
sforlin
oleicacid
† .
Food
grou
psQH
n=
30QMH
n=
30QML
n=
31QL
n=
30p
FCAC(g)
FCAC(g)
FCAC(g)
FCAC(g)
FCAC
White
meats
(chicken
,fish
andseafood
)9.3±
4.6
2824
.3±
1421
.08.5±
4.7
2582
.9±
1545
.17.8±
4.7
2279
.6±
1446
.19.1±
5.6
2793
.1±
1690
.50.63
0.49
Redmeats
(bee
f,po
rkan
dsaus
ages)
9.7±
4.8
2217
.0±
1248
.49.4±
5.4
2091
.16±
1398
.213
.6±
8.0
3179
.5±
2107
.19.9±
5.4
2343
.6±
1750
.30.02
0.05
Dairy
andeg
g33
.6±
14.0
11,415
.5±
6804
.225
.2±
14.1
9231
.1±
7090
.227
.9±
16.5
8360
.4±
6088
.533
.1±
15.7
11,375
.0±
5915
.10.09
0.17
Fast
food
s(h
ambu
rger,h
otdo
g,pizza)
11.5
±6.1
3739
.2±
2220
.415
.3±
7.9
5622
.0±
2940
.313
.0±
5.8
4722
.9±
3375
.013
.8±
5.8
5350
.7±
2442
.90.16
0.04
Mex
ican
street
food
s(taco,
torta,qu
esad
illa,bu
rrito,
tostad
a,men
udo,
mole)
19.3
±7.9
7615
.7±
3515
.524
.7±
7.4
9747
.2±
3628
.223
.8±
6.8
9281
.9±
2616
.922
.4±
8.9
8672
.4±
3273
.70.04
0.03
Snacks
5.7±
4.0
860.8±
645.3
7.4±
8.4
1180
.9±
1363
.36.0±
5.3
1117
.9±
1027
.36.2±
5.2
1131
.9±
1075
.50.67
0.64
Add
edfats
andspread
s9.1±
8.2
792.7±
68.7
9.4±
8.8
792.1±
75.1
7.8±
8.0
636.7±
69.2
10.0
±8.5
809.8±
95.4
0.78
0.85
Q—
quartile
ofdistribu
tion
. H—
high
-,MH—
med
ium–high
-,ML—
med
ium–low-,an
dL—
low-inten
sity
rating
sforlin
oleicacid.D
ataaregive
nin
mea
n±
SDby
participan
t.Sign
ificant
diffe
renc
e,pb0.05
.†FC
—freq
uenc
yof
cons
umptionan
dAC—
amou
ntof
cons
umptiondu
ring
31.4
days
offood
records.
40 N.R. Martínez-Ruiz et al. / Physiology & Behavior 129 (2014) 36–42
ratings. Also, subjects with high-intensity ratings for linoleic acidconsumed significantly smaller amounts of high-fat foods such asfast foods and Mexican street foods than subjects perceiving thesame linoleic acid emulsions at lower intensities. These resultssuggest that fatty acids oral perception may influence the selectionand consumption of some high-fat foods and possibly affect bodyweight.
Results in the present study support recent observations that fattyacids are detected within the human oral cavity. Fatty acids have beenquantified in human saliva at range levels of 30–50 μM. The linoleicacid concentrations used in this studymay be sufficient to generate sig-naling in taste receptor cells, according to the fatty acid concentrationrequired (1–20 μM) to depolarize taste receptor cells in rodents [3].Neuron activity has been observed with oral fat stimulation in human[36] and animals [3,37], suggesting that oral chemoreception processtakes place. The oral taste for fatty acids has been described as “fatty”at 0.1 to 0.4 mM and as “scratchy” at 1.2 mM by a trained panel [38].In this study, oral-intensity ratings for linoleic acid given by the partici-pants were related with differences in oral perception for linoleic acid.Subjects with high-intensity ratings were associated with higher oralperception for linoleic acid than subjects with medium- or low-intensity ratings. Differences in human oral fat sensitivity, using lowconcentrations of fatty acids (close to detection threshold) have beenused to classify subjects as fat hypersensitive and fat hyposensitive[13,14] or fatty acid tasters and non-tasters [39]. High oral sensitivityfor oleic acid had been related with lower values of body mass index(BMI) [13,14], but opposite results do not support those findings [15].In the present study, subjects with high-intensity ratings for linoleicacid at suprathreshold concentrations had lower BMI and WC valuesthan subjects with low-intensity ratings. Discrepancies in determiningoral sensitivity at threshold levels may be due to differences inmethod-ology and in reliability of the measurement, among other limitations[40]. Bartoshuk considers that increased thresholds of taste do not nec-essarily imply decreased sensitivity to suprathreshold concentrations[40]. No difference in BMI between subjectswith low andhigh detectionthresholds for linoleic acid (determined by two-alternative forcedchoice procedure using warm-up) has been observed (data fromour laboratory not shown). In the present study, subjects with obesity(n = 16) rated linoleic acid as follows: two into QH group, three intoQMH and QML groups and eight into QL group. It can be seen that thenumber of subjects with obesity presenting attenuated oral perceptionfor linoleic acid varies; suggesting that caution should be taken whenconsidering that “all” subjects with obesity have low-intensity percep-tion for fatty acids. Other anatomical [41], genetic [25] and/or physio-logical [42] variables may influence fat oral perception at the sametime. More studies in this area are needed for a better understandingof this topic.
Oral fat intensity perception at concentrations above thresholdlevels may contribute to understanding oral fat perception in morecomplex systems such as food. The present study showed that subjectswith high-intensity ratings for linoleic acid (QH) reported less prefer-ence for high-fat foods such as fast foods and Mexican street foods
41N.R. Martínez-Ruiz et al. / Physiology & Behavior 129 (2014) 36–42
than subjects in other groups, suggesting that differences in oral fattyacid perception may influence preferences for some foods rich in fat.This effect was not observed in other food groups with high content offat such as baked products and added fats and spreads. In African-American subjects, discriminators tended to have lower preferencesfor added fats and spreads, but no differences were observed in high-fat foods or sweet fats [17]. It is possible that food palatability [43], thedietary pattern [44] and the oral fat perception [45] contribute differen-tially in defining preference for some food groups that are rich infats. Differences in this complex behavior concerning food preferenceare unclear. It has been hypothesized that the hedonic response, as afunction of concentration, may be a quantitative difference generatedby lower taste intensity perception rather than a qualitative differencein hedonic response [46]. A recent study reported that individualswith low-intensity ratings for the greatest concentrations of fat stimuliwere higher in the reinforcing value of food [47]. According to thepreferences showed in this study, participants with high-intensity rat-ings for linoleic acid (QH) reported a lower consumption of HF foodssuch as fast foods and Mexican street foods than individuals withminor-intensity ratings. These findings suggest that differences in fattyacid oral-intensity perception may influence food intake, particularlyHF foods [48]. It has been speculated that consumers with high- andlow-fat diet differ in their ability to distinguish between high- andlow-fat foods [49]. Low sensitivity to oleic acid in the oral cavity andgastrointestinal tract was inversely associated with dietary fat intake[13,50], suggesting a lower suppression of appetite and energy intake[42]. In the present study, no statistical differences were observed inenergy and macronutrient consumption among groups. However,during four weeks there was a small additional consumption of caloriesamong participants withmedium- and low-intensity ratings for linoleicacid and participants with high-intensity ratings, suggesting that adiscreet over-consumption of energy was maintained through time.Participants with medium-intensity ratings for linoleic acid (QMH andQML) consumed 79.3 and 124.5 kcal/day, and participants with low-intensity ratings (QL) consumed 169.9 kcal/day more than participantswith high-intensity ratings (QH). An annual estimate of this differencein energy consumption may represent 28,944.5, 45,442.5 and62,013.5 kcal, respectively. Considering that a kilogram of body fatrequires 9000 kcal from dietary foods, this represents 3.2, 5.0 and6.9 kg/year of fat respectively. This situation may represent a risk inbody weight gain for subjects presenting oral medium- and low-intensity ratings for linoleic acid in comparisonwith subjects presentinghigh-intensity ratings. These small differences had been identified inother studies in individuals with diets rich in fat who had a positiveenergy balance (~120 kcal/day) in long term [51] and insensitive tohigh or low content of fat in foods [49]. Small over-consumption ofenergy may occur unintentionally and without the consumption of ex-cess bulk but may contribute to the development of obesity as a gradualprocess during years [52]. It is therefore possible to speculate that smalldifferences in energy consumption may represent a risk in body weightgain for subjects with attenuated oral perception for fatty acids. Thiseffect, detected in young individuals may increase in later years andgradually generate overweight or obesity in these individuals. Addition-al studies are needed to confirm this.
5. Conclusion
Oral-intensity perception for linoleic acid is inversely related withbody mass index (BMI), preference and consumption of high-fat foodssuch as fast foods and Mexican street foods. A discreet additionalconsumption of calories was observed in subjects with oral medium-and low-intensity ratings for linoleic acid that may represent a risk ofobesity in a long term. These results may be useful for designing dietsand healthy foods that satisfy the sensory and nutritional needs ofconsumers and help them maintain suitable body weight.
Disclosure
There are no conflicts of interest on behalf of any of the authors.
Acknowledgments
The authors thank Universidad Autónoma de Ciudad Juárez andInstituto Tecnológico de Ciudad Juárez for the facilities provided for thedevelopment of this study. The authors also thank the Programa deMejoramiento del Profesorado (PROMEP) for funding Nina R. Martínez-Ruiz's doctoral scholarship in Instituto Tecnológico de Veracruz, México.
References
[1] Chalé-Rush A, Burgess JR, Mattes RD. Multiple routes of chemosensitivity to freefatty acids in humans. Am J Physiol Gastrointest Liver Physiol 2007;292:G1206–12.
[2] Mattes RD. Oral threshold and suprathreshold intensity ratings for fatty acids on 3tongue sites in humans: implications for transduction mechanisms. Chem Senses2009;34:415–23.
[3] Mattes RD. Accumulating evidence supports a taste component for free fatty acids inhumans. Physiol Behav 2011;204:624–31.
[4] Greenwalt DE, Lipsky RH, Ockenhouse CF, Ikeda H, Tandon NN, Jamieson GA.Membrane glycoprotein CD36: a review of its roles in adherence, signal transduc-tion, and transfusion medicine. Blood 1992;80:1105–15.
[5] Silverstein RL. Inflammation, atherosclerosis, and arterial thrombosis: role of thescavenger receptor CD36. Cleve Clin J Med 2009;76:S27–30.
[6] Fukuwatari T, Kawada T, Tsuruta M, Hiraoka T, Iwanaga T, Sugimoto E, et al.Expression of the putative membrane fatty transporter (FAT) in taste buds of thecircumvallate papillae in rats. FEBS Lett 1997;414:61.
[7] Tsuruta M, Kawada T, Fukuwatari T, Fushiki T. The orosensory recognition of long-chain fatty acids in rats. Physiol Behav 1998;66:285–8.
[8] Laugerette F, Passilly-Degrace P, Patris B, Niot I, Febbraio M, Montmayeur JP, et al.CD36 involvement in orosensory detection of dietary lipids, spontaneous fatpreference, and digestive secretions. J Clin Invest 2005;115:3177–84.
[9] Laugerette D, Gaillard D, Passilly-Degrace P, Niot I, Besnard P. Do we taste fat?Biochemie 2007;89:265–9.
[10] Simons PJ, Kummer JA, Luiken JJFP, Boon L. Apical CD36 immunolocalization inhuman and porcine taste buds from circumvallate and foliate papillae. ActaHistochem 2011;113:839–43.
[11] El-Yassimi A, Hichami A, Besnard P, Khan NA. Linoleic acid induces calcium signal-ing, Scr kinase phosphorylation, and neurotransmitter release in mouse CD36-positive gustatory cells. J Biol Chem 2008;283:12949–59.
[12] Gaillard D, Pasilly-Degrace P, Besnard P.Molecular mechanisms of fat preference andovereating. Ann N Y Acad Sci 2008;1141:163–75.
[13] Stewart JE, Feinle-Bisset C, Golding M, Delahunty C, Clifton PM, Keast RSJ. Oral sen-sitivity to fatty acids, food consumption and BMI in human subjects. Br J Nutr2010;104:145–52.
[14] Stewart JE, Newman LP, Keast RSJ. Oral sensitivity to oleic acid is associated with fatintake and body mass index. Clin Nutr 2011;30:838–44.
[15] Mattes RD. Oral fatty acid signaling and intestinal lipid processing: support andsupposition. Physiol Behav 2011;105:27–35.
[16] Pepino MY, Love-Gregory L, Klein S, Abumrad NA. The fatty acid translocase geneCD36 and lingual lipase influence oral sensitivity to fat in obese subjects. J LipidRes 2012;53:561–6.
[17] Liang LCH, Sakimura J, May D, Breen C, Driggin E, Tepper BJ. Fat discrimination: aphenotype with potential implications for studying fat intake behaviors and obesity.Physiol Behav 2012;105:470–5.
[18] FAO. The state of food and agriculture. Rome: FAO; 2013 73–9.[19] Marti-Cid R, Bocio A, Llobet JM, Domingo JL. Balancing health benefits and chemical
risks associated to dietary habits: RIBEFOOD, a new internet resource. Toxicology2008;244:242–8.
[20] Subar AF, Crafts J, Zimmerman TP, Wilson M, Mittl B, Islam NG, et al. Assessment ofthe accuracy of portion size reports using computer-based food photographs aids inthe development of an automated self-administered 24-hour recall. J Am Diet Assoc2010;110:55–64.
[21] U.S. Department of Agriculture, Agricultural Research Service. USDA NationalNutrient Database for Standard Reference, Release 25. Nutrient Data LaboratoryHome; 2012 [http://www.ars.usda.gov/main/site_main.htm?modecode=12-35-45-00 (last accessed: February 10th 2012)].
[22] Muñoz de Chávez M. Composición de alimentos. Valor nutritivo de los alimentos demayor consumo 2nd ed. México: McGraw Hill; 2010.
[23] Chalé-Rush A, Burgess JR, Mattes RD. Evidence for human orosensory (Taste?)sensitivity to free fatty acids. Chem Senses 2007;32:423–31.
[24] Stewart JE, Keast RSJ. Recent fat intake modulates fat taste sensitivity in lean andoverweight subjects. Int J Obes 2012;36:834–42.
[25] Keller KL, Liang LCH, Sakimura J, May D, van Belle C, Breen C, et al. Common variantsin CD36 gene are associated with oral fat perception, fat preferences, and obesity inAfrican Americans. Genetics 2012;20:1066–73.
[26] Pearce KN, Kincella JE. Emulsifying properties of proteins: evaluation of turbidimet-ric technique. J Agric Food Chem 1978;25:716–23.
42 N.R. Martínez-Ruiz et al. / Physiology & Behavior 129 (2014) 36–42
[27] Careche M, Cofrades S, Carballo J, Jimenez Colmenero F. Emulsifying and gelationproperties during freezing and frozen storage of hake, pork and chicken actomyo-sins as affected by addition of formaldehyde. J Agric Food Chem 1998;46:813–9.
[28] Carter EC, Monsivais P, Drewnowski A. The sensory optimum of chicken broths sup-plemented with calcium di-glutamate: a possibility for reducing sodium whilemaintaining taste. Food Qual Preference 2011;22:699–703.
[29] Hayes JE, Allen AA, Bennett SM. Direct comparison of the generalized visual analogscale (gVAS) and general labeled magnitude scale (gLMS). Food Qual Preference2013;28:36–44.
[30] Majid A, Levinson SC. Language does provide support for basic tastes. Behav Brain Sci2008;31:86–7.
[31] Kazmier LJ, Díaz-Mata A. Estadística aplicada a la administración y a la economía.2nd ed. México: McGraw-Hill; 1993.
[32] MacMillan KN. Valoración de hábitos de alimentación, actividad física y condiciónnutricional de estudiantes de la Pontificia Universidad Católica de Valparaíso. RevChil Neuropsiquiatr 2007;34:330–6.
[33] Gámbaro A, Raggio L, Dauber C, Ellis AC, Toribio Z. Conocimientos nutricionales yfrecuencia de consumo de alimentos: un estudio de caso. Arch Latinoam Nutr2011;61:308–15.
[34] Rosas-Nexticapa M, Angulo O, O'Mahony M. How well does the 9-point hedonicscale predict purchase behavior? J Sens Stud 2005;20:313–31.
[35] Stone H, Sidel J. Sensory evaluation practices. 3rd ed. California: Elsevier AcademicPress; 2004.
[36] De Araujo IE, Rolls ET. Representation in the human brain of food texture and oralfat. J Neurosci 2004;24:3086–93.
[37] Gaillard D, Laugerette F, Darcel N, El-Yassimi A, Passilly-Degrace P, Hichami A, et al.The gustatory pathway is involved in CD36-mediated orosensory perception oflong-chain fatty acids in mouse. FASEB J 2008;22:1458–68.
[38] GalindoMM, Voigt N, Stein J, van Lengerich J, Raguse JD, Hofmann T, et al. G protein-coupled receptors in human fat taste perception. Chem Senses 2012;37:123–39.
[39] Kamphuis MMJW, Saris WHM, Westerterp-Plantenga MS. The effect of addition oflinoleic acid on food intake regulation in linoleic acid tasters and linoleic acid non-tasters. Br J Nutr 2003;90:199–206.
[40] Bartoshuk LM. The psychophysics of taste. Am J Clin Nutr 1978;31:1068–77.[41] Essick GK, Chopra A, Guest S, McGlone F. Lingual tactile acuity, taste perception, and
the density and diameter of fungiform papillae in female subjects. Physiol Behav2003;80:289–302.
[42] Little TJ, Feinle-Bisset C. Effects of dietary fat on appetite and energy intake in healthand obesity — oral and gastrointestinal sensory contributions. Physiol Behav2011;104:613–20.
[43] Yeomans MR, Blundell JE, Leshem M. Palatability: response to nutritional need orneed-free stimulation of appetite? Br J Nutr 2004;92:S3–S14.
[44] Wądołowska L, Babicz-Zielińska E, Czarnocińska J. Food choice models and their re-lation with food preferences and eating frequency in the Polish population: POFPRESstudy. Food Policy 2008;33:122–34.
[45] Keller KL. Genetic influences on oral fat perception and preference. J Food Sci2012;77:S143–7.
[46] Yeomans MR, Tepper BJ, Rietzschel J, Prescott J. Human hedonic responses tosweetness: role of taste genetics and anatomy. Physiol Behav 2007;91:264–73.
[47] Panek-Scarborough LM, Dewey AM, Temple JL. Sensation and perception ofsucrose and fat stimuli predict the reinforcing value. Physiol Behav 2012;105:1242–9.
[48] Zhang KJ, Zhou LH, Ban X, Liu DX, JiangW, Liu XM. Decreased expression of CD36 incircumvallate taste buds of high-fat diet induced obese rats. Acta Histochem2011;113:663–7.
[49] Cooling J, Blundell J. Are high-fat and low-fat consumers distinct phenotypes?Differences in the subjective and behavioral response to energy and nutrientchallenges. Eur J Clin Nutr 1998;52:193–201.
[50] Stewart JE, Seimon RV, Otto B, Keast RSJ, Clinfton PM, Feinle-Bisset C. Markeddifferences in gustatory and gastrointestinal sensitivity to oleic acid between leanand obese men. Am J Clin Nutr 2011;93:703–11.
[51] Drewnowski A, Almirong-Roig E. Human perceptions and preferences for fat-richfoods. In: Montmayeur JP, Le Coutre J, editors. Fat detection: taste, texture andpost ingestive effects. Florida: CRC Press; 2010. p. 265–94.
[52] Prentice AM. Manipulation of dietary fat and energy density and subsequent effectson substrate flux and food intake. Am J Clin Nutr 1998;67:535S–41S.