Embed Size (px)
Citation preview

HAL Id: tel-00836252https://tel.archives-ouvertes.fr/tel-00836252
Submitted on 20 Jun 2013
HAL is a multi-disciplinary open accessarchive for the deposit and dissemination of sci-entific research documents, whether they are pub-lished or not. The documents may come fromteaching and research institutions in France orabroad, or from public or private research centers.
L’archive ouverte pluridisciplinaire HAL, estdestinée au dépôt et à la diffusion de documentsscientifiques de niveau recherche, publiés ou non,émanant des établissements d’enseignement et derecherche français ou étrangers, des laboratoirespublics ou privés.
Oral and post-oral factors controlling energy balance inGF rodentsTimothy Swartz
To cite this version:Timothy Swartz. Oral and post-oral factors controlling energy balance in GF rodents. Microbiologyand Parasitology. Université Pierre et Marie Curie - Paris VI, 2012. English. �NNT : 2012PAO66290�.�tel-00836252�

Thesis for a Ph.D. in Physiology and Pathophysiology
Timothy David Swartz
University Pierre et Marie Curie (Paris VI)
Oral and post-oral factors controlling energy
balance in GF rodents
Defense:
June 18, 2012
INRA (Institut National de la Recherche Agronomique), Jouy-en-Josas, FRANCE
Thesis committee
Dr Patricia SERRADAS President of the jury
Dr Patricia PARNET Reader
Dr Olivier RAMPIN Reader
Dr Andre BADO Examiner
Dr Daniel TOME Examiner
Dr Mihai COVASA Thesis supervisor

i
Abstract
The present studies examine intestinal, metabolic, and behavioral alterations in germ-free (GF) animals. The first set of experiments examine preference and acceptance for sweet solutions, sucrose and saccharin, in GF C57Bl/6J mice with associated changes in expression of lingual and intestinal nutrient-sensing sweet taste receptors, T1R2 and T1R3, and the glucose transporter, SGLT1. It demonstrates that GF mice consumed more of the highest concentration of sucrose relative to NORM controls, with an increased expression of intestinal T1R3 and SGLT1. The second set of studies examine if findings of increased sucrose intake extend to fat, and whether the GF mice display alterations in lingual and intestinal fat sensors as well as intestinal satiety peptides. We found that GF mice display increased intake and preference of fat at high and low concentrations, respectively. Additionally GF mice display decreased fatty-acid GPRs and satiety peptides in the intestine, decreased circulating gut peptide levels, increased lingual fat detecting receptors, and increased markers of fatty-acid metabolism, all of which are adaptive effects to the chronically depleted energy state of the GF mice. The final succession of experiments was to determine if the GF state, with its associated decreases in adiposity and chronic fasting state in mice, is present in the GF rat model. Interestingly, we found that GF rats display similar or increased levels of body adiposity, with decreased markers of liver lipogenesis, yet increased lipogenesis in adipose tissue associated with adipocyte hypertrophy. Overall, these data demonstrate that absence of gut microbiota in mice leads to increased energy consumption of sugars and fats associated with alterations in oral and intestinal nutrient sensors while the gut microbiota in the F344 does not play a pivotal role in adiposity.
Mes études ont pour but d'examiner les altérations métaboliques et comportementales dans des modèles de souris axéniques. Nous avons démontré que les souris axéniques présentent une augmentation de préférence et d'acceptation des solutions sucrées. Cette augmentation est corrélée à des changements des niveaux d'expression des récepteurs du goût sucré au niveau de l'épithélium lingual et la muqueuse intestinale; T1R2, T1R3, et le transporteur de glucose SGLT-1. De plus, elles ont une préférence pour des fortes concentrations de saccharose comparées aux souris normales. Cet effet est associé à une augmentation des niveaux d'expression de T1R3 et SGLT-1 dans l'intestin. Nous avons étudié si cette augmentation de consommation de sucre était similaire à celle de acide gras, étayé les effets d'une consommation des lipides sur les niveaux d'expression des récepteurs des acides gras "CD36" au niveau de l'épithélium lingual et la muqueuse intestinale ainsi que les niveaux d'expression et de sécrétion des peptides intestinales à vocation satiétogène chez les souris axéniques comparées aux souris normales. En effet, nous avons démontré que les souris axéniques affichent une consommation accrue et une préférence pour les acides gras à des fortes et faibles concentrations respectivement. Ces changements étaient associés à une diminution des niveaux d'expression des détecteurs gustatifs de gras (GPRs), des faibles taux d'expression et de sécrétion des peptides intestinales, une augmentation d'expression du récepteur des acides gras au niveau de l'épithélium lingual et une augmentation des taux circulants des acides gras. Ces modifications peuvent constituer des mécanismes d'adaptation à l'état énergétique appauvri des souris axéniques. Nous avons essayé de savoir si ces altérations étaient présentes chez le rat dépourvu axénique. En effet, nous avons constaté que les rats axéniques présentent un niveau similaire ou élevé de la masse grasse, avec une diminution de la lipogenèse et une augmentation de l'adipogenèse expliquant l'hyperphagie du tissu adipeux. En résumé, nous avons démontré que l'absence du microbiote intestinal chez la souris conduit à une augmentation de l'apport énergétique en augmentant la consommation de sucres et de gras. Ces effets sont associés à des altérations orales et post-orales des niveaux d'expressions des détecteurs gustatifs tandis que le microbiote intestinal du rat F344 ne joue pas un rôle central dans l'adiposité.

ii
TABLE OF CONTENTS
1 Introduction ____________________________________________________ 1
1.1 Obesity and healthcare costs _______________________________________ 1
1.2 The digestive system _____________________________________________ 3 1.2.1 Oral cavity ___________________________________________________________ 3
1.2.1.1 Taste __________________________________________________________ 3
1.2.1.2 Sweet taste _____________________________________________________ 5
1.2.1.2.1 Sweet taste and feeding behavior ________________________________ 5
1.2.1.2.2 Mechanisms of oral sweet detection ______________________________ 7
1.2.1.3 Fat taste _______________________________________________________ 12
1.2.1.3.1 Fat taste and feeding behavior _________________________________ 12
1.2.1.3.2 Mechanisms of oral fat detection _______________________________ 13
1.2.1.4 Taste transduction, central signaling, and reward _______________________ 17
1.2.1.5 Obesity and taste ________________________________________________ 22
1.2.2 Stomach ___________________________________________________________ 25
1.2.2.1 Gastric distention ________________________________________________ 25
1.2.2.2 Endocrine function _______________________________________________ 27
1.2.2.2.1 Gastric leptin _______________________________________________ 28
1.2.2.2.2 Ghrelin ____________________________________________________ 29
1.2.3 Intestine ___________________________________________________________ 34
1.2.3.1 Intestinal nutrient satiation _________________________________________ 34
1.2.3.2 Intestinal carbohydrates ___________________________________________ 35
1.2.3.2.1 Intestinal carbohydrates and feeding behavior _____________________ 35
1.2.3.2.2 Mechanisms of intestinal carbohydrate detection ___________________ 36
1.2.3.3 Intestinal fats ___________________________________________________ 42
1.2.3.3.1 Intestinal fats and feeding behavior _____________________________ 42
1.2.3.3.2 Mechanisms of intestinal fat detection ___________________________ 43
1.2.3.4 Intestinal nutrients, conditioned preferences, and reward _________________ 47
1.2.3.5 Obesity and intestinal nutrient satiation _______________________________ 51
1.2.3.6 Vagal afferents and intstinal nutrient satiation __________________________ 53
1.2.3.7 Intestinal satiety peptides __________________________________________ 55
1.2.3.7.1 Cholecystokinin (CCK) _______________________________________ 55
1.2.3.7.2 Glucagon-like Peptide-1 (GLP-1) _______________________________ 58
1.2.3.7.2 Peptide YY (PYY) ___________________________________________ 60
1.2.4 Liver ______________________________________________________________ 63

iii
1.2.4.1 Hepatic nutrients and feeding behavior _______________________________ 63
1.2.4.2 Hepatic metabolism and feeding behavior _____________________________ 64
1.2.4.3 Obesity and hepatic metabolism ____________________________________ 65
1.3 Microbiota _____________________________________________________ 66 1.3.1 Microbiota and energy harvest __________________________________________ 67
1.3.2 Microbiota and intestinal morphology _____________________________________ 68
1.3.3 Microbiota and intestinal endocrine function ________________________________ 69
1.3.4 Microbiota and inflammation ____________________________________________ 71
1.3.5 Microbiota and obesity ________________________________________________ 73
1.4 Overall significance and experimental outline ________________________ 78 1.4.1 Specific Aim 1 _______________________________________________________ 79
1.4.2 Specific Aim 2 _______________________________________________________ 80
1.4.3 Specific Aim 3 _______________________________________________________ 81
2 Specific Aim 1: How the absence of gut microbiota affects oral and post-
oral detection of sweet nutrients as well as intestinal sugar transporters ____ 82
2.1 Introduction ____________________________________________________ 82
2.2 Up-regulation of intestinal type 1 taste receptor 3 and sodium glucose
luminal transporter 1 expression and increased sucrose intake in mice
lacking gut microbiota ____________________________________________ 83
2.3 Summary of results and conclusions _______________________________ 84
3 Specific Aim 2: How gut microbiota affects oral and post-oral detection of lipids
and associated changes in nutrient-responsive g-protein coupled receptors
(GPRs) and intestinal satiety peptides _______________________________ 86
3.1 Introduction ____________________________________________________ 86
3.2 Increased oral detection, but decreased intestinal signaling for fats in mice
lacking gut microbiota ____________________________________________ 87
3.3 Summary of results and conclusions ______________________________ 121
4 Specific Aim 3: How gut microbiota affects host liver, intestinal, and adipose
metabolic parameters in a GF rat model ____________________________ 123
4.1 Introduction ___________________________________________________ 123

iv
4.2 Absence of gut microbiota is not protective of fat deposition in the GF F344
rat model ______________________________________________________ 124
4.3 Specific Aim 3: Summary of results and conclusions _________________ 146
5 General summary _____________________________________________ 148
5.1 General results ________________________________________________ 148
5.2 General discussion _____________________________________________ 150
5.3 General conclusions ____________________________________________ 158
6 Index _______________________________________________________ 159
6.1 Figures _______________________________________________________ 159 6.1.1 Chapter 1 _________________________________________________________ 159
6.1.2 Chapter 3 _________________________________________________________ 159
6.1.3 Chapter 4 _________________________________________________________ 160
6.1.4 Chapter 5 _________________________________________________________ 160
6.2 Tables ________________________________________________________ 160 6.2.1 Chapter 4 _________________________________________________________ 160
6.3 Abbreviations __________________________________________________ 160
7 References __________________________________________________ 163

1
1. Introduction
1.1. Obesity and healthcare costs
Currently, the obesity epidemic afflicting the global population spans numerous
countries and over 300 million people. While the United States is a large contributor to
this epidemic, with approximately 33% of its population obese [1], over 115 million
people in developing countries are currently obese as well [2]. Furthermore, obesity is a
risk factor for other life-threatening co morbidities, such as diabetes mellitus,
cardiovascular disease, hypertension, and certain cancers. In response to the myriad of
health problems associated with obesity, national governments and global organizations
have implemented funding systems in an attempt to curb the growth of this disease,
which has been rampant for the past 40 years. Recently, the annual direct and indirect
costs of obesity in the United States are estimated to be higher than $147 billion [3]. In
France, the 1992 obesity-related healthcare costs were approximately 2% of healthcare
costs [4] with no recent indications of its cost. However, despite France having one of
the lowest rates of obesity in Europe and lowest average body mass index (BMI); nearly
50% of the French male population is overweight and over 11% obese [5]. While these
data demonstrate that obesity is prevalent globally, with an increased prevalence in
developed countries, the etiology of obesity remains unclear.
The causes of obesity are complex and include genetic deficits or alterations in
central homeostatic signaling, involving mutations in hormone sequences or hormone
receptors that govern feeding behavior and regulate metabolism. Evidence of these
alterations in obesity comes from studies demonstrating that replacement with
exogenous leptin in leptin-deficient individuals results in normalization of body weight

2
and adiposity [6]. More recently, an array of data has demonstrated that mutations in
the fat mass and obesity-associated protein (FTO) results in obesity as well [7-9].
Despite these evidences clearly linking genetic alterations with obesity, the prevalence
of obesity has risen dramatically in the past 50 years while genetic mutations occur over
much longer periods of time. Thus, the current obesity epidemic is hypothesized to
occur due to an interaction of genetics and environmental factors, such as obesigenic
diets. Obesigenic diets promote increased body weight and adiposity in the presence
[10, 11] and absence of hyperphagia [12, 13]. The cause of obesity induced by these
diets is unclear; however, both peripheral and central homeostatic signaling deficits are
implicated. For example, diet-induced obese (DIO) rats display decreased sensitivity to
leptin [14, 15] while displaying decreased capacity for peripheral fatty acid oxidation [16,
17]. Additionally, DIO rodent models display decreased sensitivity to intestinal satiety
peptides, such as cholecystokinin [18]. Evidence for peripheral satiety signals in the
treatment of obesity comes from data demonstrating that administration of exogenous
satiety peptides normalizes food intake, body weight, and metabolism of obese rodent
models [19, 20]. In addition to intestinal satiety peptides influencing energy regulation,
recent evidence suggests microbes lining the GI tract, collectively referred to as the gut
microbiota, contribute to the obese state [21, 22]. Accordingly, this thesis aims to focus
on the gut microbiota, its contribution to alterations in food intake, nutrient detection,
and metabolism, and how energy balance is associated with these changes.

3
1.2 The digestive system
1.2.1 Oral cavity
1.2.1.1 Taste
The most elementary evidence of taste arising from the tongue predates scientific
publications and comes from the ingrained response that application of various
substances on the tongue results in the stimulation of further intake or avoidance of a
tasted substance. Alternatively, injury to the tongue or surface of the tongue results in
loss of sensation to taste or total inability to taste substances, denoting the importance
of this organ, its sensory cells, and innervations in taste function [23]. The specific
contribution of the lingual epithelium to taste had begun over 120 years ago as the
identification of specific taste bud locations, types, and their sensory pathways had
taken place at the beginning of the 20th century [24]. While animals generally can taste
a variety of chemicals and nutrients, which together play a pivotal role in the perception
of a meal, taste can be generalized to five categories: sweet, bitter, sour, salty, and
umami. While these tastes have been well established and have withstood numerous
scientific rigors, more recently, substantial evidence has demonstrated that fat should
be added to this list, prompting many taste researchers to recognize the newly coined
“fat taste.”
The lingual epithelium contains distinct regional papillae that house taste buds,
which are comprised of 100 – 150 single taste receptor cells (TRCs) that directly sense
incoming nutrients and chemicals (Figure 1) [25]. Taste receptor cells are grouped into
three categories: Type I, Type II, and Type III. Briefly, the function of Type I TRCs is the
sensing of salt [26]; Type II TRCs are responsible for sweet, bitter, and umami taste

4
[25]; Type III TRCs sense sour taste [27]. The focus of this thesis will be on Type II
TRCs as they express the receptors for sweet, and possibly fat taste; however, the
possible function of Type III receptors will also be addressed briefly. In total, there are
four afferent nerves that innervate the oral cavity, but the majority of taste transduction
involves the chorda tympani (CT) nerve that innervates the anterior lingual epithelium
containing the fungiform papillae, and the glossopharyngeal (GP) nerve that innervates
the posterior epithelium containing the vallate and circumvallate papillae. While at the
most basic level researchers hypothesized that specific taste buds respond to distinct
taste stimuli, provoking unique responses upon activation. However, the predominant
hypothesis, which has prevailed for the last 30 years, is that taste buds are capable of
responding to a variety of taste [28]. This has led to the connotation that taste buds are
generalists rather than specialists. As such, each area of the tongue is hypothesized as
capable of detecting every taste, with varying thresholds and sensitivity to each specific
taste. Despite this, the specific TRCs, with individually expressed taste receptors, are
relatively tuned to sense specific taste stimuli. More recently, the identification of
multiple receptor configurations, belonging to the appropriately named taste receptor
family, has allowed researchers to better understand the role of taste cell populations.

5
Figure 1: Taste papillae and structure of taste buds comprised of TRCs. Lingual taste papillae
located in the anterior (fungiform), lateral (foliate), and poster (circumvallate) contain apical
membrane TRCs that are positioned to sense stimuli and transduce taste signaling to afferent
nerve fibers [25].
1.2.1.2 Sweet taste
1.2.1.2.1 Sweet taste and feeding behavior
Sweet taste has long been known to evoke pleasure and stimulate intake of sugar-laden
foods. Laboratory animals generally prefer sweet tasting solutions and foods, even in
the absence of nutritive value [29]. The strength of sweet taste in altering food intake
was first shown by studies employing the sham feeding technique. Sham feeding,
which typically is performed by placing a fistula in the stomach so that contents drain
from the stomach before entering the intestine, is largely influenced by oral factors as
the intestine receives very little of the ingested substance and thus cannot provide
sufficient chemosensory feedback [30] (Figure 2). During sham feeding of sweet
solutions, animals will drink copious amounts of fluid generally in a monotonic function
of concentration [31]. While animals sham-feed sweet solutions continuously, previous

6
exposure to the sweet solution is also important in determining fluid intake via
conditioned “oral satiation,” which is probably due to the lingual sensing of sweet
substances [32]. In addition to sham feeding experiments, 24-h two-bottle tests and
brief access tests have revealed the role of sweet taste in feeding behavior. In 24-h
two-bottle tests, animals are presented with varying concentrations of sweet solutions in
one bottle and water in the other bottle. Through this method, researchers can
determine the threshold of detection for sweet stimuli, the overall intake of sweet
solution, as well as the preference of the solution relative to water. However, with the
nutritive value of most sweet solutions, post-oral feedback can significantly alter these
responses [33]. Thus, brief access tests in which animals are given access to taste
solutions for brief periods (seconds) has better assessed the role of oral sweet sensing
in determining intake. Similarly to sham feeding, animals exhibit increased oral
acceptance of sweet solutions during brief-access tests, with variations between animal
models and strain used [29, 34]. These observed variations have been found to be due
to the Sac locus, discovered 40 years ago, which houses the genetic material that
encodes for sweet taste receptor proteins [35].

7
Figure 2: Depiction of sham feeding in the rat. Left: A surgically placed fistula with a screw cap
intact allows for the passage of ingesta into the intestine. Right: When the screw cap is removed,
ingested fluids in the stomach drain into a reservoir, allowing for the examination of oral
infuences in the absence of intestinal feedback.
1.2.1.2.2 Mechanisms of oral sweet detection
While highly complex and integrative central pathways in reward signaling may be
largely responsible for driving consumption of palatable sugary foods (discussed below),
the sensing of sweet taste is initially detected in the lingual epithelium and mediated
predominantly by two apical membrane g-protein-coupled receptors (GPR) belonging to
the taste receptor type 1 (T1) family: T1R2, and T1R3 [35-39]. The relative expression
of these two receptors throughout the lingual epithelium is broad with T1R2 being most
commonly expressed in the posterior circumvallate and foliate papillae in both rats and
mice; however, expression of T1R2 in the anterior fungiform papillae is sparse in rats
while mice express high levels of fungiform T1R2 [36, 40]. This could explain the
relative weakness of sweet stimuli to activate the CT nerve in rats while mice exhibit
strong activation of the CT nerve in response to sweet stimuli [41, 42]. Similarly to

8
T1R2 in the mouse, T1R3 is highly expressed in the fungiform and circumvallate
papillae [35, 37, 40, 43]. Both homodimeric or heterdimeric assembly of these proteins
results in a functional sweet taste receptor [44], and this is consistent with expression
patterns of T1R2 and T1R3 [35]. For example, a large degree of T1R2 and T1R3 are
co-expressed in both the fungiform and circumvallate papillae, with the former papillae
expressing T1R3-only taste receptor cells as well [35]. Electrophysiological recordings
from the CT nerve in T1R knock-out (KO) animals have revealed the functional role of
these receptors in taste. For example, KO of T1R2 or T1R3 in the mouse results in
abolishment of non-nutritive sweetener-induced activation of the CT nerve [45, 46].
However, both of these models display weak responses to nutritive sweet substances,
such as glucose, fructose, and sucrose, especially at higher concentrations [42, 45, 46].
It should also be noted that in addition to the heterodimeric T1R2+3 receptor, the
homodimeric T1R3 complex is responsible for high nutritive sweet taste responses [35].
While these findings in KO models suggest the possibility of another receptor mediating
sweet taste, double KO of T1R2 and T1R3 abolishes nutritive sweet mediated CT and
GP nerve responses [46]. Together this demonstrates that T1R2 and T1R3 are
responsible for the detection of sweet taste.
While the previously mentioned data demonstrate a strong role of these
receptors to mediate neural activation in response to sweet tastants, the behavioral role
has been established using both 24-h and brief access tests. During 24-h tests, T1R3
KO mice display no preference for non-nutritive sweeteners over water compared to
control animals that display a preference for sweeteners [35, 45, 46]. However, when
exposed to nutritive sweet solutions, such as sucrose, T1R3 KO mice display

9
preferences at higher concentrations when naïve and low and high concentrations with
previous exposure, suggesting an involvement of post-oral learning [42]. Similarly,
when subjected to brief access tests, both T1R2 KO and T1R3 KO animals display no
response to nonnutritive sweeteners and only a mild response to highly concentrated
nutritive sweeteners [35, 45, 46]. Double KO of these proteins, however, abolishes all
preferences to both nutritive and nonnutritive sweeteners [46]. Polymorphisms of the
T1R3 receptor also alter sweet taste responsiveness as mice with variants of the T1R3
gene display altered sensitivity to sweet substances [47]. Despite these behavioral and
electrophysiological data demonstrating the role of T1R2+3 in sweet taste,
administration of a T1R3 antagonist in rodents does not affect the ability of animals to
discriminate sweet tastants from water [48]. Interestingly, the functionality of T1R2 and
T1R3 are not confined to laboratory animals alone as felines, which do not respond to
sweet substances, maintain a naturally occurring mutation in the T1R2 gene rendering
the receptor nonfunctional, further signifying the importance of these receptors in sweet
taste [49].
The sensing of sweet substances in the oral cavity is also species specific and
an important determinant in the detection of various sweet tastants. For example,
humans, but not mice can distinguish aspartame from water, and insertion of the human
variant of T1R2 in mice results in an ability of mice to taste aspartame [50-52]. The
observed differences and the finding that T1Rs respond to a variety of sweet stimuli,
denotes an importance of the ligand binding domains in sweet sensing. The differences
in domains observed even between the T1R2 and T1R3 receptors in the same species
explains the broad perceived sweet taste across a variety of substances. For both

10
T1R2 and T1R3, the N-terminus is responsible for binding multiple sweet taste
molecules [52] while the transmembrane and cysteine rich domain of the T1R3 receptor
is also responsible for mediating sweet taste [51]. However, for some sweet
substances, such as glucose, sucrose, and the sucrose derivative sucralose, the N-
terminus of both T1R2 and T1R3 is necessary for the binding of these ligands [53].
Both T1R2 and T1R3 belong to the g-protein coupled receptor superfamily in
which intracellular signaling is dependent upon second messenger g-proteins. The
specific intracellular signaling mechanisms responsible for sweet taste signaling involve
cyclic adenosine monophosphate (cAMP) signaling [54-57], as well as phospholipase-C
β2 pathways (PLCβ2) [25, 58, 59] (Figure 3). The latter is thought to be the
predominant pathway of sweet taste recognition as ablation of PLCβ2 results in
decreased electrophysiological and behavioral sweet taste responses [58]. Additionally,
for T1R2+3, α-gustducin may be the specific second messenger subunit. Behaviorally,
this comes from the finding that α-gustducin animals display an abolished preference for
sweet solutions [60]. Immunohistolochemical studies also have determined that the
T1R2+3 complex is co-expressed with α-gustducin [43] while electrophysiological
results have demonstrated a decreased CT or GP nerve response in α-gustducin KO
animals in response to sweet stimuli [61]. Despite this, application of either nonnutritive
saccharin or sucrose to cells expressing T1R2+3 does not activate gustducin [62].
Interestingly, similar to ligand binding domains, the activation of intracellular signaling
mechanisms differs between non-nutritive and nutritive sweet T1R2+3 activation. For
example, upon binding to the sweet taste receptor, nonnutritive stimuli are hypothesized
to activate a PLCβ2 pathway, increasing intracellular Ca+2 stores. Intracellular Ca+2

11
then binds to transient receptor potential melastatin-5 channel (TRPM5), which is a
selectively permeable Na+ and K+ ion channel and responsible for cellular depolarization
and eventual exocytosis of neurotransmitters from TRCs that activate the CT and GP
nerves [63]. In support of this mechanism involving TRPM5 is that TRPM5 KO mice
exhibit abolished behavioral and electrophysiological responses to sweet tastants [58].
Additionally, nutritive sweeteners may signal via adenyl cyclase, serving to increase
intracellular cAMP activing Protein Kinase A, which inhibits basolateral potassium
channels leading to taste cell depolarization, increased intracellular Ca+2 and
subsequent release of adenosine triphosphate (ATP), which may interact with Type III
TRCs to stimulate afferent nerve fibers, or possibly involved in direct activation of nerve
fibers via connexins [64-66].
Figure 3: Intracellular sweet taste transduction pathway. A sweet stimulus is bound to the
extracellular domain of T1R2+3 (Taste GPCR). The secondary messenger system for sweet taste
involves PLCβ2, leading to release of Ca+2 and an increase in intracellular Ca+2. Elevated Ca+2
levels allow for the depolarization of the TRCs via TRPM5-dependent influxes of Na+ [67].

12
1.2.1.3 Fat taste
Relatively recent findings demonstrate that in addition to the five tastes that have been
known for many years, both rodents and humans can detect fatty-acids in the oral cavity.
The sensing of fat is indeed thought to be considered a fat “taste” as it occurs across a
large range and classification of fatty acids and does not occur with similarly textured
non-nutritive oils and is not blocked when olfactory cues are removed [51, 68-70].
Although lingual lipase is found in extremely low concentrations in adult human saliva,
and its physiological role is still debated, there is a sufficient concentration of naturally
occurring free-fatty acids in oils and other food products to elicit oral sensory feedback
[71].
1.2.1.3.1 Fat taste and feeding behavior
The dissection of factors involving fat intake leading to alterations in feeding behavior
has been a topic of research for over 60 years. The first finding that oral properties of
fat alter food consumption was that addition lard, stimulates food intake in rodents [72].
In general, laboratory rodents prefer HF foods relative to a standard low-fat diet [73-75].
In one study examining the general propensity of laboratory mice to prefer HF foods, it
was demonstrated that 10 out of a total 13 mouse strains examined prefered HF foods
to low-fat foods [76]. Using two-bottle preference tests, it has also been demonstrated
that rodents prefer oil emulsions with varying degrees of fat relative to water or non-
nutritive control solutions with similar texture [77]. To minimize post-oral feedback,
which has a potent influence on stimulating food intake following previous exposures
with nutritive solution, a majority of these experiments have been conducted using brief

13
access to the test preference. In addition to brief access tests, research also
demonstrates that animals subjected to the sham feeding paradigm freely drink nutritive
corn oil or non-nutritive mineral oil emulsions during one-bottle feeding tests [77, 78].
However, when presented with two bottles in a choice preference test with one bottle
containing corn oil and the other mineral oil, animals always prefer corn oil to mineral oil
[77]. With the current discovery of fatty-acid receptors on the lingual epithelium, this
effect can likely be attributed to the free fatty acids found in corn oil, which activate
lingual taste receptor cells and are not present in mineral oil [79]. Finally, demonstrating
the ability of fat taste to alter energy consumption, sham feeding fats stimulates
increased intake of a standard rat diet following fat exposure [80]. Together, these data
exemplify the profound role that oral fat detection can have on influencing feeding
behavior.
1.2.1.3.2 Mechanisms of oral fat detection
The location of oral fat detection is thought to occur almost solely in the posterior lingual
epithelium, specifically, in the taste receptor cells of the circumvallate papillae [81, 82].
Lingual fat sensing involves several receptors expressed on taste receptor cells such as
g-protein coupled receptor 40 (GPR40) [83] and GPR120 [84, 85] as well as the fatty
acid translocase CD36 [81] and delayed-rectifying potassium channels [86]. Similarly to
sweet taste, fat detection is transduced via gustatory nerves that innervate the lingual
epithelium, which transmit signals to higher brain centers ultimately controlling food
intake [79].

14
Fat activates taste receptor cells via an apical sensor, such as voltage-gated ion
channels that contribute to neurotransmitter release on the basolateral portion of the cell
[87]. For example, patch-clamp recordings on isolated fungiform taste cells
demonstrate that free-fatty acids inhibit delayed rectifying potassium channels (DRKs)
[88]. This is specific to poly-unsaturated fatty-acids that are applied extracellularly,
denoting these channels may establish oral fat preferences. Various DRKs have been
found in the fungiform papillae [89], but the specific Kv1.5 channel that is found in
cardiac tissue and inhibited by fatty acids [90] is present in rodent lingual epithelium [86].
The proposed mechanism of activation of this channel is via a direct binding between
fatty acids and a domain of the Kv1.5, which has been reported in cardiomyocytes [90].
Furthermore, DRKs may contribute to taste modulation by enhancing perceived
intensity of taste, which is in agreeance with findings that fatty acids enhances
perceived intensity of various tastes [86].
G-protein coupled receptors on the lingual epithelium may also be responsible for
the oral detection of fat. Normally localized on intestinal epithelium enteroendocrine
cells, GPRs respond to various lengths of free fatty acids and mediate the release of gut
hormones CCK [91, 92] and GLP-1 [93]. Recently, researchers have identified GPR120,
which responds to long chain fatty acids, in the sensory fungiform and circumvallate
papillae, whereas GPR40, which responds to medium and long-chain fatty acids, was
absent from the lingual epithelium [85]. Interestingly, the enteroendocrine cell model,
STC-1, expresses GPR120 and activation of this receptor induces cellular
depolarization via a PLCβ2, Ca+2-dependent mechanism similar to the activation of
taste receptor cells by a taste stimulus [93, 94]. Furthermore, genetic ablation of

15
GPR120 results in reduced fatty-acid preference and loss of fatty acid-induced
activation of nerves innervating the lingual epithelium [83]. Together, these data
exemplify a role of GPR120 in the detection of oral fats.
In addition to DRKs and GPRs, the fatty acid translocase, CD36, may play the
most pivotal role in oral fat detection as suggested by research over the past 10 years
[81, 82]. Originally discovered as the main mechanism of fatty-acid uptake in
adipocytes [95], CD36 is also significantly expressed in the lingual epithelium,
specifically in the circumvallate papillae [81, 82]. Located on the apical membrane of
taste cells [82] and conservatively expressed across multiple species [82, 96], CD36 is
positioned to bind extracellular fatty acids in the oral cavity. Furthermore, taste receptor
cells that express CD36 are located in close proximity to a lipid-rich environment near
the Von Ebner’s glands that secrete lingual lipase [97] (Figure 4). The extracellular
structure of CD36, with a large hydrophobic pocket, also illustrates its role in binding
fatty acids [98]. Indeed, CD36 reversibly binds fatty acids, specifically in the nanomolar
range [99, 100]. Experiments using CD36 KO mice demonstrate the significant
physiological role of this receptor in fat taste [82, 101]. The integral function of CD36 in
fat detection was established by Laugerette et al, who demonstrated that deletion of
CD36 in mice results in abolished spontaneous fat preference and an absence of oral
fatty-acid induced neural activation [82]. Together, it is hypothesized that GPR120 and
CD36 may mediate fat taste; however, due to its relative infancy in relation to sweet
taste, further clarification is needed to examine the exact mechanisms of fat taste.
16
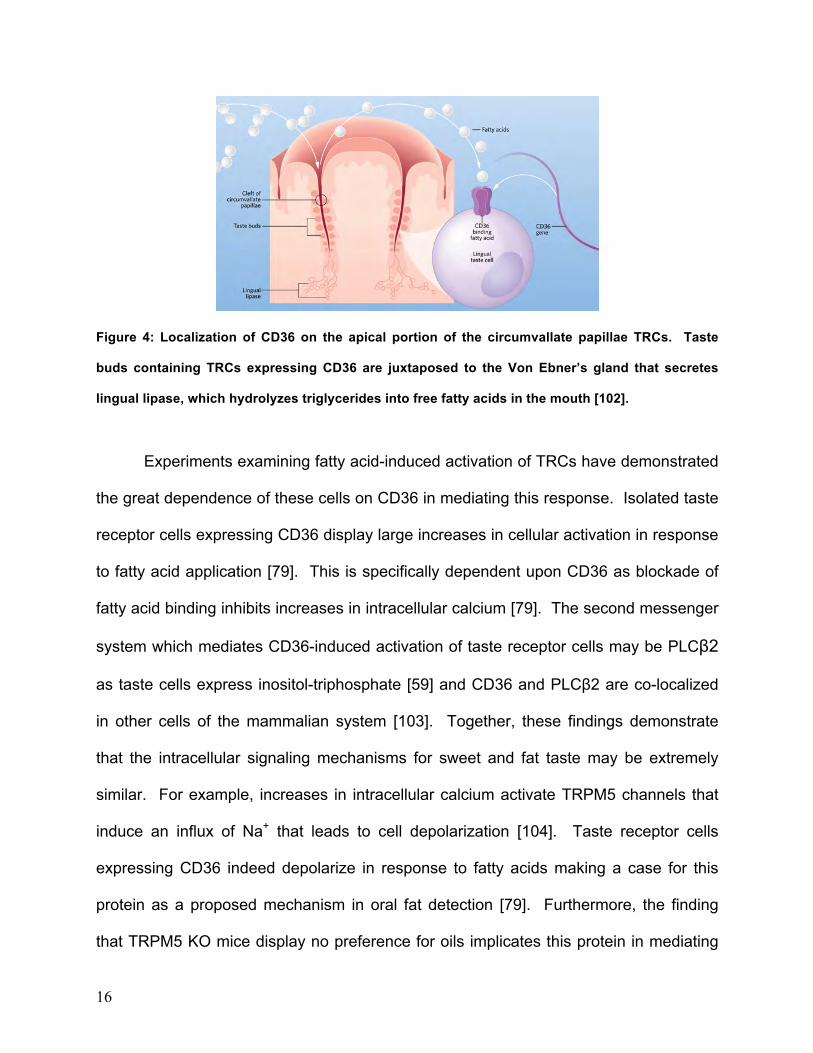
Figure 4: Localization of CD36 on the apical portion of the circumvallate papillae TRCs. Taste
buds containing TRCs expressing CD36 are juxtaposed to the Von Ebner’s gland that secretes
lingual lipase, which hydrolyzes triglycerides into free fatty acids in the mouth [102].
Experiments examining fatty acid-induced activation of TRCs have demonstrated
the great dependence of these cells on CD36 in mediating this response. Isolated taste
receptor cells expressing CD36 display large increases in cellular activation in response
to fatty acid application [79]. This is specifically dependent upon CD36 as blockade of
fatty acid binding inhibits increases in intracellular calcium [79]. The second messenger
system which mediates CD36-induced activation of taste receptor cells may be PLCβ2
as taste cells express inositol-triphosphate [59] and CD36 and PLCβ2 are co-localized
in other cells of the mammalian system [103]. Together, these findings demonstrate
that the intracellular signaling mechanisms for sweet and fat taste may be extremely
similar. For example, increases in intracellular calcium activate TRPM5 channels that
induce an influx of Na+ that leads to cell depolarization [104]. Taste receptor cells
expressing CD36 indeed depolarize in response to fatty acids making a case for this
protein as a proposed mechanism in oral fat detection [79]. Furthermore, the finding
that TRPM5 KO mice display no preference for oils implicates this protein in mediating
17
CD36-dependent fatty-acid signaling and taste cell depolarization [105]. While it is
hypothesized that CD36 is localized on Type II TRCs due similar intracellular signaling
markers as sweet taste, this has yet to be examined. Rapid influxes in intracellular
calcium also serve to induce neurotransmitter via cellular depolarization, which is
observed in CD36-positive TRCs [106]. Some of the proposed neurotransmitters
responsible for taste cell signaling to afferent nerve fibers include acetylcholine,
norepinephrine, serotonin, and glutamate. Specifically, serotonin and noradrenaline
may be the primary neurotransmitters released by CD36-positive taste receptor cells as
the transcript for two vital enzymes in the production of these neurotransmitters is
present in CD36-positive cells [106]. As such, serotonin and noradrenaline are both
released from fatty-acid activated taste receptor cells; however whether this is directly
by CD36 expressing cells or indirectly via other TRCs is unknown [106]. Thus, despite
the wealth of data illustrating the role for CD36 mediating the oral detection of fats,
intriguing questions such as the exact pathways in TRCs that are responsible for fat
taste transduction as well as the TRC type that expresses CD36 remain unanswered.
1.2.1.4 Taste transduction, central signaling, and reward
Regardless of the taste detected, TRCs directly or indirectly release various
neurotransmitters [107-112] or peptide hormones [113-117] that activate the CT and GP
nerve fibers. The specific mechanism is not completely understood; however, this may
involve direct TRC to nerve connections, in which Type II cells generate ATP that
interacts via connexins to nerve fibers [65, 66]. A second mechanism is that indirect
signaling from TRC Type II cells that sense tastants, release ATP, which then

18
stimulates Type III TRCs to release neurotransmitters that activate afferent nerves.
Support of this latter hypothesis comes from the finding that Type III cells are the only
TRCs that express voltage gated calcium channels and neurotransmitters, such as
serotonin [108, 109]. Additionally, the release of ATP from Type II cells can bind to P2X
receptors [64], which are ion channels that open in response to extracellular ATP and
expressed by Type III TRCs (Figure 5). While this intriguing and yet unestablished
transduction mechanism is currently under investigation, the afferent CT and GP fibers
indeed receive input from taste bud complexes and signal upstream to the nucleus of
the solitary tract (NTS) of the caudal brainstem.
19
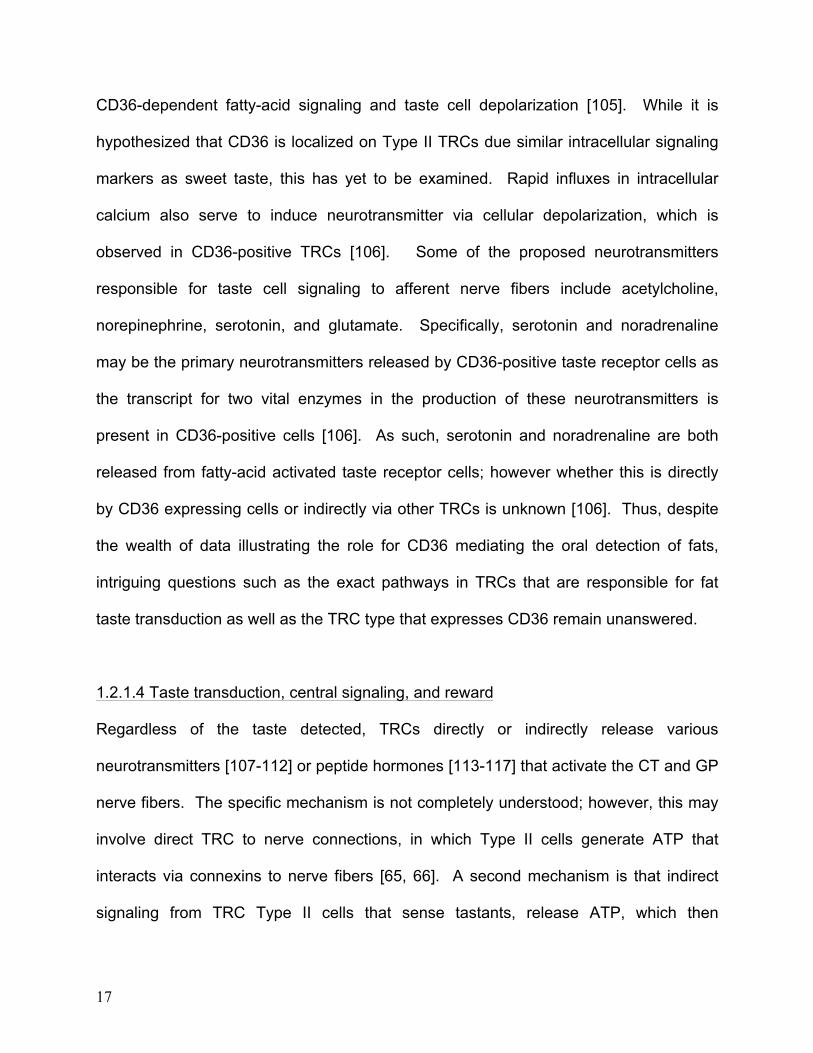
Figure 5: Proposed mechanism of cell-to-cell communication for taste transduction. Type II TRCs
express the receptors for a variety of tastants, most importantly, T1R2+3. Type II cells relay taste
information either directly via cell-afferent nerve connections or indirectly via Type III cell-nerve
synapses which repond to extracellular ATP released by Type II cells. Afferent nerves then relay
information to the hindbrain for taste coding [118].
Somewhat similar to the taste buds, in which taste receptive fields are
reasonably broad, NTS neurons can respond to a broad number of stimuli [119].
Despite this, specific populations of NTS neurons are more responsive to specific taste
stimuli [120-122]. This has been shown by various electrophysiological methods, such

20
as single neuron recordings, which has led to the identification of “tuned” neurons. For
example, neurons that are highly activated by sweet stimuli evoke a specific neural
activation pattern and can be differentiated from neurons responding to other tastes
such as umami, sour, or bitter [123]. Furthermore, for each taste, different stimuli evoke
specific neural firing patterns. For example, a nonnutritive sweetener, such as
saccharin, can be differentiated from a nutritive sweet stimuli, such as sucrose based on
neural firing [124]. Using single neuron recordings, researchers have demonstrated that
T1R3 is vital in the activation of sweet responsive NTS neurons, providing evidence of
this receptor in the central processing of sweet stimuli [125]. Upstream, neurons from
the NTS project to the pontine Parabrachial Nucleus (PBN). From the PBN, neurons
project in two directions, the first is the gustatory cortex (GC), which is responsible for
encoding taste, mechanical, and visceral stimuli. The second pathway consists of PBN
neurons projecting to the limbic system, ultimately terminating in the ventral striatum,
involving reward function. The gustatory cortex is best viewed as the brain region that
assigns hedonic value to taste stimuli. For example, stimuli with similar hedonic values
activate similar regions of the GC and differing hedonic values activate more distinct
regions [126-128]. Additionally, the GC is also associated with conditioned taste
aversion (CTA), in which an animal avoids a normally preferred taste stimuli (such as
saccharin) paired with an aversive stimuli (such as lithium chloride (LiCl)) [129, 130]. In
this manner, the GC exhibits relative plasticity as saccharin will typically activate specific
neuron subsets of the GC, but after pairing with LiCl, a different neural activation
patterning occurs [131]. Furthermore, due to the plasticity of this brain region, this effect
is fully reversible. Although these pieces of evidence may demonstrate the functional

21
role of the GC in determining taste, an overwhelming amount of evidence places a role
of the PBN limbic projection to the ventral striatum in hedonics and controlling reward
function of palatable stimuli.
Central reward pathways upstream of the NTS and PBN are strong contributors
to both sweet and fat taste. Behavioral evidence of this comes from the finding of
reinforcement studies demonstrating the rewarding values of sweet and fat stimuli. For
example, reinforcement designs are used in which an animal must work more to obtain
the same reward (palatable food). When given access to sucrose or fat, in the absence
of post-oral feedback, rats work harder for continued access to these stimuli,
demonstrating the behaviorally rewarding value of sweet or fat taste [132, 133]. As
previously mentioned, neurons of the PBN extend to the ventral striatum [134]. Using
microdialysis, immunohistochemistry, and brain lesioning, several collective studies
demonstrated that the PBN-striatal projections are responsible for the stimulation of
sweet solution intake and subsequent sucrose-induced influxes of dopamine (DA) in the
Nucleus of Accumbens (NAcc), a nuclei in the ventral striatum involved in reward
function [135]. While the NAcc consists of two parts, a core and shell, the latter of the
two is vital in tracking reward. Thus, in addition to the view that the GC tracks hedonic
value, release of DA from the striatum, which contains the NAcc, is associated with this
perception as well [136, 137]. For example, influxes of DA in the NAcc are a direct
function of oral reward and the motivational state to obtain a reward, such as sweet
stimuli [138, 139]. The first initial evidence linking sweet taste to reward function was
the finding that drinking saccharin led to increases in NAcc DA, and is associated with
learned behavioral processes [138]. As well as saccharin, the consumption of sucrose

22
leads to increases of DA in the NAcc [140]. However, this latter finding could be
influenced by the nutritive value of sucrose reaching the intestine. Thus, through a
variety of controlled experiments using fixed and non-fixed volumes of low and high
concentrations of sucrose during sham-feeding, it was demonstrated that sweet taste
alone is sufficient for increasing NAcc DA [141]. In addition to sweet taste, sham
feeding of nutritive oils has also demonstrated fat taste leading to increases in DA in the
NAcc relative to water [142]. Therefore, although detection of taste arises from the
tongue involving apical membrane bound receptors, afferent signals relayed from TRCs
indirectly provide input to central brain areas, such as the NAcc, which signal sweet and
fat taste as rewarding, and lead to stimulation of intake for these palatable stimuli.
1.2.1.5 Obesity and taste
While the varying detection for sweet and fat taste influences short-term intake of these
stimuli, the role of oral sensitivity to sweets and its relation to obesity is less clear. In
general, obese animals over consume sweet foods, with evidence suggesting this may
be mediated by taste functions. Genetic rodent models of obesity display an inability to
detect low concentrations of sweet solutions with an accompanying increased
consumption of highly concentrated sweet solutions [143, 144]. Thus, obese animals
are typically described as having a decreased oral sensitivity to sweet solutions.
Decreased oral detection of sweets could contribute to over consumption as more
sucrose would be needed to stimulate lingual sweet receptors and release sufficient DA
to signify reward [145]. The mechanism responsible for the observed detection of sweet
stimuli in obese rodents may be due in part to the fact that the sweet taste heterodimer

23
is co-localized with the leptin receptor, and loss of leptin receptor function leads to
diminished oral sensitivity to sweet substances [146]. Thus, the observed leptin
resistance in obese rodent models due to increased adiposity denotes that energy
status in these models is a major determinant for these behavioral findings.
Furthermore, lean or food deprived animals, where normal or enhanced leptin receptor
sensitivity is present, exhibit in an increased sensitivity to oral sweet stimuli [147]. Both
of these findings, however, could also be attributed to central reward signaling
controlling feeding behavior and guiding taste function as obese animals display
increased motivational states [145, 148, 149] demonstrating the complexity of taste
signaling in energy homeostasis. While obesity clearly is correlated with impaired sweet
taste signaling in animal models already obese, studies examining variations in the
sweet taste receptor before the onset of obesity have been less promising. For
example, the genotype of T1R3 does not predict sucrose- or fructose-induced
hyperphagia [47]. However, this does not necessarily rule out altered taste in the pre-
obese state as animals prone to obesity display increases in consumption of palatable
sweet stimuli before the onset of obesity [145, 150]. Furthermore, in humans, a
polymorphism in the T1R2 gene has been shown to correlate with an overweight BMI
and increased consumption of carbohydrates [151]. Whether individuals displaying the
T1R2 polymorphism exhibit altered sensitivity to sweets, which would lead to increased
carbohydrate consumption is unclear from this study alone. In general, data concerning
sweet taste sensitivity in obesity is conflicting, and little data has assessed the
contribution of taste to human obesity. Initial data demonstrated that obese individuals
do not differ in sweet taste sensitivity relative to normal weight individuals [152-155] with

24
formerly obese individuals displaying increases in sweet taste responsiveness [156].
More recent evidence, however, reveals obese individuals maintain a higher affinity for
sweet stimuli relative to lean individuals [157-160]. The observed differences in these
studies are explained by improvements in the assessment of sweet taste function [158].
Interestingly, in animals, while obesity is associated with alterations in sweet taste
function, more recent evidence indicates that taste is vital in influencing short-term
intake of sweet solutions and post-oral feedback contributes to long-term intake [161].
In addition to oral sweet sensitivity, obese animals also display altered oral
sensitivity to fats. For example, the Otsuka Long-Evans Tokushima Fatty (OLETF) rat,
which is hyperphagic and subsequently becomes obese due its overeating consumes
more of high corn oil concentrations when sham feeding than lean controls during the
fed state. Furthermore, at a relatively low concentration of corn oil, OLETF rats exhibit
increased intake compared to lean animals when food deprived [162]. While this
genetic model of obesity clearly displays alteration in oral fat sensitivity leading to
increased consumption of fat, high-fat (HF) feeding in rats or mice, which results in
obesity, is associated with decreases in lingual expression of CD36 [163]. Thus, it is
hypothesized that by expressing less CD36, these animals are unable to detect lingual
fats as well as lean or chow-fed controls and increase fat consumption as a response.
However, the effect of HF feeding on lingual CD36 expression in the absence of obesity
has not been examined. This is extremely important as HF-feeding influences oral fat
sensitivity regardless of the obese state as HF-fed non-obese animals display increased
acceptance for fats relative to low-fat (LF) fed controls [164]. Nevertheless, together
these findings exemplify a decreased ability of obese rodents to detect oral fats, which

25
is associated with increased fat intake. Despite these data, one study in inbred obese
rats, which prefer HF foods over LF foods, shows that these rats exhibit increased
sensitivity to linoleic acid relative to obese resistant animals during LF-feeding [165].
However this effect is in conflict with previous data demonstrating that the same obese
prone animals exhibited decreased inhibition of delayed-rectifying K+ channels, which
would result in decreased activation of taste receptor cells compared to the lean
controls [166]. Surprisingly, lingual CD36 in this model has yet to be examined, and
may play a significant role in these behavioral findings. Unlike sweet taste, obesity in
humans is well correlated with increased affinity for fats [156, 167, 168], with the
analyses of possible genetic contributions currently under investigation. While initial
data from a European population suggested no differences in BMI or oral fat sensitivity
in individuals displaying CD36 polymporphisms [71], more recent data demonstrates
that polymorphisms in CD36 are associated with fat perception and BMI [169, 170].
1.2.2 Stomach
1.2.2.1 Gastric distention
While oral detection of sweet and fat are thought to be largely stimulatory in regards to
food intake, post-oral detection of nutrients, involving predominantly gastric and
intestinal feedback typically serve to terminate a meal. The temporary distention of the
gastric wall observed upon the entrance of ingesta in the stomach may be the most
important means of the stomach to regulate food intake. For example, humans with
naturally occurring gastric fistulas remain hungry following a meal [171]. As well, rats
with man-made esophageal [172] or gastric [173] fistulas consume food continuously

26
when food drains from a cannula. However, in the same animals, closing the cannula to
allow passage of ingesta into the stomach and intestine rapidly reduces food intake
[174]. While these data do not exclude the contribution of intestinal satiation,
experiments that prevent gastric using an inflatable pyloric cuff have shown that gastric
loads produce volume-related suppression of liquid diet intake [175, 176]. Thus, the
distention of the stomach alone is sufficient for the termination of a meal. Furthermore,
the finding that this reduction in intake is extraneous to nutritive value as intragastric
delivery of non-nutritive loads suppresses food intake similarly to nutritive loads of the
same volume [176] demonstrates the mechanical, rather than chemical nature of this
process in inducing satiation.
Vagal nerve mechanoreceptors are the mediators of gastric distention-induced
satiation, and this comes from the finding that vagotomy abolishes the effect of a gastric
preload to inhibit food intake [177]. The stomach is lined with various nerve endings,
which consist of two morphologically distinct nerve endings: intraganglionic laminar
endings (IGLEs), as well as intramuscular arrays (IMAs). Intraganglionic laminar
endings that are comprised of sensory fibers that are positioned to adjacent myenteric
neurons [178, 179] and IMAs are nerve fibers located in the longitudinal and circular
muscle layers that run parallel to the muscle fibers [180]. The former of these two is
thought to respond predominantly to the stretch reflex and tension produced by
incoming ingesta, inducing satiation. The support of this hypothesis comes from the
finding that stimulation of vagal afferents via mechanical stretching of the stomach is
associated with IGLEs, and not IMAs [181, 182]. Furthermore, despite the apparent
physiological function of IGLEs in gastric distention, both fibers are hypothesized to

27
respond to distention or stretching of the stomach as IMAs are activated by large forces
of distention and stretch. This piece of evidence may be important in behavioral
experiment as although gastric distention reduces food intake in the absence of
intestinal signals, animals with an occluded pylorus display increased gastric volume,
and thus increased gastric distention, compared to freely feeding animals [183], which
most likely denotes that post-gastric signals are also important in inducing satiation.
Thus, despite findings that tension may activate vagal endings synapsing with the
stomach, signals from the stomach do not autonomously induce satiation. For example,
while draining of ingesta from the stomach via a fistula results in increased intake of
nutritive liquids, the observed increase could be due to lack of distention from the
stomach as well as lack of nutrients entering the intestine, the major site of nutrient
absorption. Furthermore, while gastric loads indeed induce distention of the gastric
cavity, nutrients empty from the stomach and provoke intestinal stimulation. As such,
previous research indicates that approximately 40% of a liquid meal may empty from
the stomach into the intestine during a meal [184]. In addition to its mechanical role in
reducing food intake, the stomach also serves an endocrine organ that is responsible
for controlling energy balance.
1.2.2.2 Endocrine function
In addition to the stomach serving as an endocrine organ secreting gastrin and
somatostatin, which influence gastric acid secretion, the stomach releases at least two
signals, leptin and ghrelin, which may be integral for intestinal sensing and absorption of
nutrients, as well as the control of energy intake. Furthermore, while the stomach lacks

28
chemosensory properties, more recent evidence suggests a role of gastric nutrients in
altering endocrine secretions although this is still debated.
1.2.2.2.1 Gastric Leptin
Leptin, a 16 kDa protein that is normally secreted from adipose tissue and reflective of
energy status, also is secreted by epithelial cells of the stomach [185-188] and thought
to play a role in gastrointestinal signaling [189]. Gastric leptin secretion is influenced by
feeding [190], neurotransmitter release [191], as well as other gastrointestinal hormones
[189]. Furthermore, the identification of leptin receptors (LepR) on the cell bodies of
vagal afferents [192, 193] and application of leptin increases activation of neurons in the
vagus [194], which implies that gastric leptin may play a role in feeding behavior.
Indeed, leptin and CCK synergistically activate vagal neurons [195-197], and produce
synergistic reductions in food intake [198, 199]. It is thought that gastric leptin, rather
than circulating leptin is responsible for leptin activation of the vagal afferents. Evidence
of this comes from the finding that gastric, but not circulating leptin quickly rises after
ingestion of a meal [190] and circulating hormones typically do not utilize a vagally
mediated pathway [200]. Also, despite the acidic pH of the stomach, leptin remains
stable, and enters the intestinal lumen [189]. This, together with the identification of
leptin receptors on the brush border of the intestinal lumen denotes the possibility of
gastric leptin influencing intestinal function [201].
Interestingly, application of leptin to an enterocyte cell model or intestinal infusion
of leptin increases enterocyte absorption of amino acids [202]. The effects of intestinal
luminal leptin on sugar transport are less clear. For example, luminal leptin has an
29
adverse effect on glucose absorption, decreasing expression of the active glucose
transporter SGLT1 [201, 203]. However, in vitro and in vivo, luminal leptin increases
expression of the passive sugar transporters GLUT2 and GLUT5 [204]. Additionally,
luminal leptin may inhibit secretion of intestinal triglyceride processing via inhibition of
apolipoprotein A-IV [205, 206]. In addition to its effects on nutrient transport, leptin
activates enteroendocrine cells of the duodenum evoking the release of CCK.
Interestingly, luminal leptin alone sufficiently increases plasma CCK concentrations
similar to that of a meal [189]. This mediation of CCK secretion by gastric leptin is
thought to be a positive regulatory loop as intestinally released CCK stimulates
secretion of gastric leptin as well [189]. Despite these findings, the relative contribution
of gastric leptin to food intake has yet to be elucidated, but the finding that vagal
afferents contain leptin receptors [193] denotes a possible role in this gastric peptide in
the regulation of food intake.
1.2.2.2.2 Ghrelin
Of all the hormones and peptides secreted from the gastrointestinal tract, only one
discovered thus far has been shown to promote food consumption. Discovered in
nearly 15 years ago, ghrelin, the potent orexigen, is a 28 amino acid peptide released
mainly from specialized endocrine X/A-type cells [207] of the stomach. It exerts its
physiological effects on stimulating eating and growth hormone (GH) secretion by
binding to the growth hormone (GH) secretagogue receptor-1a (GHS-R1a). Compared
to other peptides released from the GI tract, ghrelin is unique due to its increased
circulating levels during fasting, which together with its ability to increase food intake,

30
indicates the possibility of a role in initiating a meal. In addition to its direct effects in
stimulating food intake, ghrelin also decreases energy expenditure and promotes the
storage of fatty acids in adipocytes, denoting its potential importance in pathological
conditions, such as obesity.
Ghrelin is the endogenous ligand for the GHS-R1a receptor or recently renamed,
“ghrelin receptor.” Both ghrelin and its receptor are located in peripheral and central
tissues. Within the central nervous system (CNS), ghrelin is localized in hypothalamic
and pituitary nuclei of the forebrain that are heavily implicated in the control of food
intake or growth hormone secretion. Despite the initial finding that ghrelin stimulates
GH secretion [208], the most potent biological function of the peptide is stimulation of
food intake through a GH-independent mechanism [209]. The arcuate nucleus (ARC) of
the hypothalamus, which is involved in controlling food intake, expresses the highest
concentration of centrally distributed ghrelin [210]. Although ghrelin is distributed
throughout the central nervous system, peripheral ghrelin from the GI tract, most
notably the stomach, is thought to be the primary site for ghrelin secretion and
circulating ghrelin [211]. In support of this, partial or complete, gastrectomy (removal of
the stomach) markedly reduces circulating ghrelin levels by approximately 70% [212].
Ghrelin is produced in the mucosal layer of the stomach by the endocrine X/A-type cells
[207], which are distributed throughout the stomach, but are highly concentrated in the
gastric fundus [213]. Gastric X/A-type cells increase in number throughout the fetal
period, reaching a maximum during infancy. Likewise, ghrelin levels in the stomach are
low during development. One month following birth, however, ghrelin concentrations
reach a peak and show no further increase. While the stomach is the main site of
31
ghrelin secretion, ghrelin is detected throughout all layers of the GI tract, salivary glands
and alimentary organs, such as the pancreas [214], all of which contribute to the
remaining 30% of circulating ghrelin. In the circulation, ghrelin is represented by two
forms: des-acyl ghrelin and acyl ghrelin (n-octanoyl-modified ghrelin) [215]. The former
version is 5 to 10 times more abundant in plasma than the latter; however, the less
common acyl-peptide is thought to be the active form in nearly all physiological,
behavioral, and endocrine processes, including food intake. To yield the biologically
active acyl-ghrelin, the enzyme, gastric O-acyl transferase (GOAT), cleaves the pre-
proghrelin peptide [216]. While the finding of two forms or ghrelin as well as the
enzyme responsible for yielding the active form of ghrelin have been recent in respect to
the discovery of ghrelin, both total ghrelin and active ghrelin plasma concentrations
have been shown to be highly correlative following experimental manipulations [217]. A
variety of factors control ghrelin secretion from the stomach into the peripheral
circulation with energy and macronutrient content of a meal the main contributors.
Ghrelin is the only known potent peripheral peptide hormone that is an orexigenic.
This is supported by several pieces of evidence. First, both central and peripheral
administration of ghrelin results in increased food intake and associated appetitive
ratings [218-220]. In rodents, exogenous ghrelin induces food intake during the light
cycle, a period associated with minimal food consumption [220]. Second, administration
of either a ghrelin receptor antagonist or an anti-ghrelin immunoglobulin (IgG), which
inactivates biologically active ghrelin, causes a decrease in food intake in several
feeding paradigms [221, 222]. Furthermore, ghrelin decreases latency to eat and
increases meal number. Interestingly, both humans and rodent models retain sensitivity

32
to the peptide and repeated administration results in exponential increase in cumulative
food intake leading to increased bodyweight and adiposity [218, 220, 223] (Table 3).
Altogether, these findings support the hypothesis that ghrelin is an orexigenic signal
controlling food intake.
Endogenous ghrelin levels are consistent between sexes and across age groups;
however, age-related anorexic rats’ plasma ghrelin levels fail to increase after 72 hours
fasting [224]. While this could implicate age as a factor in modulating ghrelin secretion,
it more likely underscores the importance of food components regulating secretion of
the peptide. As such, during periods of food deprivation, across a large range of ages,
plasma ghrelin is substantially elevated while refeeding or recovery from food
deprivation rapidly blunts elevated circulating levels [218, 225]. Furthermore, increased
levels of plasma ghrelin during these deprivation challenges are associated with up-
regulation of ghrelin receptors leading to increased food intake [226].
Ghrelin levels are also influenced by the timing of a meal. In schedule-fed rats,
rising ghrelin levels coincide with pre-prandial period or onset of a meal [227]. Similarly,
in humans, ghrelin levels substantially increase before the onset of a meal and adjust
according to meal times [228]. Long-term markers of altered energy homeostasis, such
as adiposity, also correlate with circulating ghrelin concentrations. Obesity, a
pathological state characterized by increased body mass, is characterized by an
alteration of secretion and circulating ghrelin concentrations. Specifically, an increased
body mass index (BMI) directly correlates with decreased plasma ghrelin levels [225].
Because obesity is associated with suppressed ghrelin levels, it is not surprising then
that anorexic patients with significantly lower BMIs exhibit chronically elevated

33
circulating ghrelin concentrations [229]. The decreased concentration of circulating
ghrelin in obese individuals is thought to be due to excess energy intake; whereas in
anorexic patients, a constant caloric deficit causes elevated plasma ghrelin
concentrations, in attempt to restore proper energy balance. In both pathological states,
however, ghrelin levels begin to return to normal concentrations when the individual is
nearing normal body weight [230]. Furthermore, in addition to food intake and energy
balance, the composition of an ingested meal is an important regulator of ghrelin
secretion.
Despite ghrelin being released from the stomach, an organ sensitive to
mechanical rather than chemical signals (volume vs. specific nutrients of a meal), and
macronutrient content of the meal has a significant effect on modulating ghrelin release.
Nutrients from all three major macronutrient classes suppress ghrelin secretion;
however, carbohydrates and proteins are most potent inhibitors. Specifically, in humans,
a carbohydrate solution significantly decreases ghrelin secretion in a biphasic manner,
while protein suppresses circulating ghrelin significantly more 40-min post-prandially
than an equicaloric and equivolumetric lipid drink [231]. In rodents, gastric infusions of
glucose more potently inhibit ghrelin secretion than infusions of fatty acids and amino
acids. These effects, however, are dependent upon intestinal absorption of nutrients as
gastrically infused glucose solutions fail to suppress circulating ghrelin concentrations
when the gastric pylorus is occluded [232]. Furthermore, treatment with orlistat, a
potent lipase inhibitor, abolishes long-chain fatty acid induced reduction of plasma
ghrelin levels [233]. Together, these pieces of evidence demonstrate the importance of
short- and long-term food intake as well as macronutrient content of a meal to regulate

34
ghrelin secretion. The exact detection of nutrients that regulates ghrelin secretion is
thought to occur predominantly in the intestine, as it rapidly receives ingesta that is
emptied from the stomach.
1.2.3 Intestine
1.2.3.1 Intestinal nutrients and satiation
The small intestine of the GI tract serves as a portal for digesting, sensing, and
absorbing nutrients, which all contribute to intestinal nutrient satiation. Infusion of a
liquid diet into the intestine results in inhibition of food intake [234-237]. While the
effects of intestinal nutrient infusions on the suppression of food intake may be long-
lasting and extend to multiple hours, termination of the meal begins rapidly, normally
seconds after commencing of a nutrient infusion [235, 238]. Thus, it is hypothesized
that the sensing, rather than absorption of nutrients is of importance in intestinal
nutrients reducing food intake. Furthermore, while intestinal nutrient infusions inhibit
feeding in animals, intestinal nutrients surely reduce the rate of gastric emptying, thus
increasing distention of the stomach, which could be one way by which nutrients reduce
food intake [239]. However, intestinal nutrient infusions also inhibit feeding in animals
with gastric fistulas, where gastric distention is absent [235, 240] denoting the
importance of intestinal factors in autonomously controlling meal size. Ingesta entering
the intestine from the gastric cavity are typically hyperosmotic, and contain a variety of
nutrients, all of which influence feeding responses. In animals, the infusion of
hyperosmotic loads indeed decreases food intake in freely feeding animals [241].
Despite this, the hyperosmotic and complete nutritive nature of chyme is not the main

35
contributor to intestinal satiation. For example, intestinal infusion of specific
macronutrients, such as oligosaccharides [242] or long-chain fatty acids [243] reduces
food intake, even in hypotonic or isotonic concentrations.
1.2.3.2 Intestinal carbohydrates
1.2.3.2.1 Intestinal carbohydrates and feeding behavior
Intestinal carbohydrates and sugars have been reported to reduce food intake in both
sham- and real-feeding animals [243, 244], and increasing the length of the
oligosaccharide used for an intestinal infusion results in a greater reduction of food
intake than a simple sugar [245]. Additionally, the digestion of oligosaccharides to
simple sugars is nearly essential in reducing food intake as administration of the
oligosaccharidase inhibitor, acarbose, results in attenuation of oligosaccharide-induced
reduction in food intake [246]. Specifically, the ability of carbohydrates to reduce food
intake may require glucose, at least when low concentrations are present as glucose
infusions will significantly reduce food intake, but low concentrations of fructose has no
effect on feeding [247]. Collectively, these data implicate carbohydrate-induced
satiation, and most likely, the detection of glucose in influencing food intake.
The specific intestinal mechanism responsible for glucose-induced satiation is
still not completely understood. It is well known that hydrolysis of oligosaccharides
produces monosaccharides, which are predominantly absorbed via active transport on
the apical membrane of the intestinal epithelium. For example, luminal glucose is
largely transported by the active glucose transporter SGLT1 while other
monosaccharides, such as fructose, require the passive transporter, GLUT5, for

36
absorption. Interestingly, intestinal infusions of glucose isomers, which are substrates
for SGLT1 reduce food intake [248] while the aforementioned fructose does not.
However, the findings that intravenous glucose is mostly ineffective at reducing food
intake compared to intestinal infusions of glucose, and that glucose in the lumen is
inversely related to blood glucose levels exemplifies that a pre-absorptive mechanism is
responsible for glucose-induced satiation [245]. This is probably independent of SGLT1
as well because inhibition of SGLT1 activity does not attenuate intestinal glucose-
induced satiation [249]. Therefore, the hydrolysis of oligosaccharides to glucose is at
least somewhat necessary for carbohydrate-induced reductions in food intake, but the
absorption of glucose is not. Recent evidence suggests that luminal intestinal epithelial
receptors, similar to those located in the lingual epithelium, may a possible pathway in
detecting intestinal glucose, and subsequently regulating dietary absorption of
carbohydrates.
1.2.3.2.2 Mechanisms of intestinal carbohydrate detection
The transport of luminal glucose in the intestine is carried out by the active glucose
transporter SGLT1. To facilitate this process, SGLT1 localized on the apical epithelium
of enterocytes transports both glucose and sodium, which is driven by the increased
glucose concentration in the intestinal lumen and decreased intracellular Na+ levels due
to the basolateral Na+-ATPase [250] (Figure 6). The other major dietary
monosaccharide, fructose, is transported into the enterocyte via the passive GLUT5
transporter. Once localized in the enterocyte, glucose exits the cell and enters the
hepatic portal circulation via the basolaterally expressed passive transporter, GLUT2
37
[250]. The general expression pattern for SGLT1 is greatest in the proximal intestine,
and more specifically, the duodenum [251]. While the basolaterally expressed GLUT2
may also be expressed on the apical membrane of enterocytes, and has been
hypothesized to play a role in post-prandial glucose transport [252-254], an animal
model displaying a GLUT2 mutation does not exhibit defects in intestinal glucose
absorption [255]. As such, it is hypothesized that SGLT1 is the principal mediator of
intestinal glucose absorption.
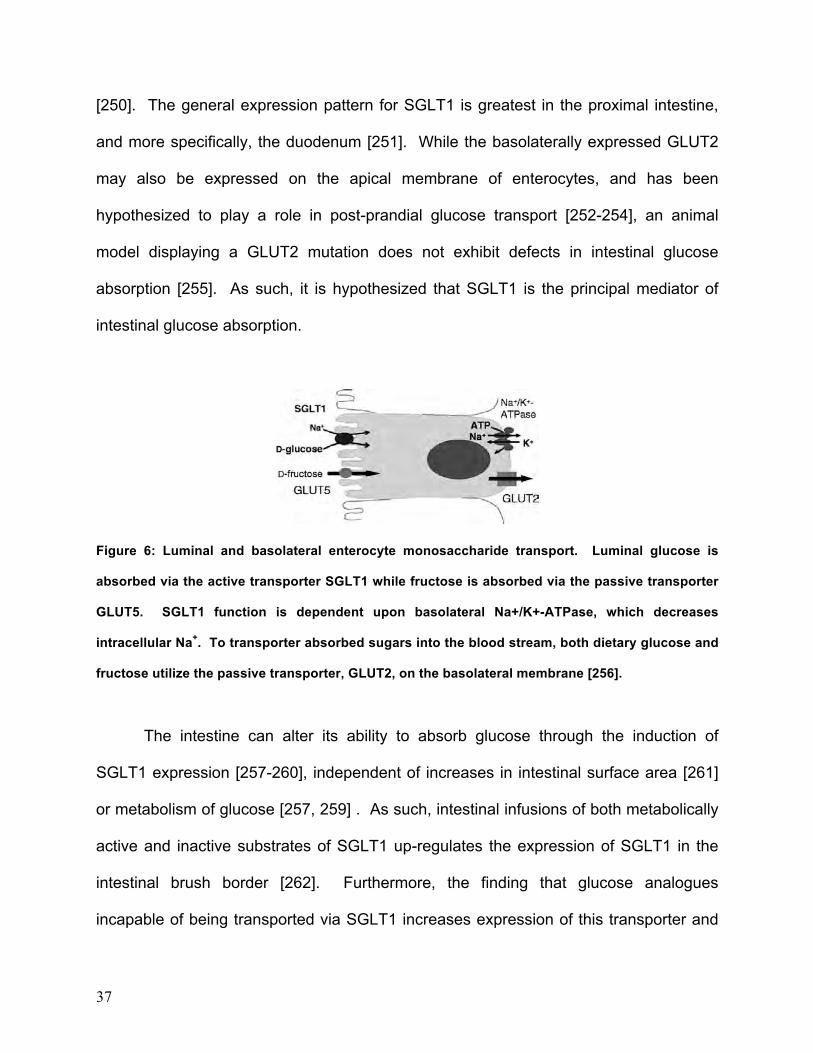
Figure 6: Luminal and basolateral enterocyte monosaccharide transport. Luminal glucose is
absorbed via the active transporter SGLT1 while fructose is absorbed via the passive transporter
GLUT5. SGLT1 function is dependent upon basolateral Na+/K+-ATPase, which decreases
intracellular Na+. To transporter absorbed sugars into the blood stream, both dietary glucose and
fructose utilize the passive transporter, GLUT2, on the basolateral membrane [256].
The intestine can alter its ability to absorb glucose through the induction of
SGLT1 expression [257-260], independent of increases in intestinal surface area [261]
or metabolism of glucose [257, 259] . As such, intestinal infusions of both metabolically
active and inactive substrates of SGLT1 up-regulates the expression of SGLT1 in the
intestinal brush border [262]. Furthermore, the finding that glucose analogues
incapable of being transported via SGLT1 increases expression of this transporter and

38
is independent of SGLT1 activity suggests that a SGLT1-independent mechanism
senses luminal glucose concentration to up-regulate SLGT1. The transfection of cells
with glucose sensing elements further reveals that SGLT1 expression regulation is
dependent upon G-protein coupled receptor signaling [263]. In addition to its
localization in the taste buds, the sweet taste receptor dimer, comprised of T1R2 and
T1R3, coupled with α-gustducin, is found throughout all levels of the gastrointestinal
tract of many animals [264-267] as well as enteroendocrine cell lines [268]. Both
proteins, however, are largely expressed in the proximal intestine, specifically in the
duodenum and jejunum, where SGLT1 expression is highest, with only marginal
expression occurring in the distal ileum and colon [269].
It is hypothesized that the T1R2+3 complex, identical to that found in the lingual
epithelium (Figure 7), coupled to α-gustducin, is the mediator of glucose-induced
SGLT1 up-regulation [265]. The definitive importance of these receptors in regulating
glucose absorption and glucose sensing comes from studies that show absence of
T1R3 or α-gustducin results in an inability of animals to increase expression of SGLT1
during high carbohydrate feeding [265, 270]. In cats, which lack a functional T1R2
receptor [49], and are relatively insensitive to sweet taste, SGLT1 expression is not up-
regulated in response to carbohydrate feeding as well [264]. Similarly, in chickens,
which lack expression of T1R2 [271], intestinal infusion of carbohydrates does not up-
regulate SGLT1 expression [272]. Finally, feeding wild-type mice a high-carbohydrate
diet or standard laboratory chow diet with sucralose added to drinking water enhances
expression of SGLT1, an effect absent from T1R3 KO animals. The contribution of
T1R3 in up-regulating SGLT1 expression is not necessary; however, as T1R3 KO mice

39
fed a low carbohydrate diet express similar SGLT1 levels as wild type animals [265].
Thus, there is constitutive expression of SGLT1, and the sweet receptor taste complex
is hypothesized to have a role in up-regulating SGLT1 expression when dietary
carbohydrates are increased. In support of this is the finding in pigs that the feeding of
low and moderate levels of dietary carbohydrates results in similar SGLT1 expression ;
however, increasing dietary carbohydrates further increases expression of SGLT1 [266].
Recent evidence also suggests that T1R3 may play a crucial role in increasing GLUT2
expression [273], which is not necessarily mutually exclusive from T1R2+3 increasing
SGLT1 as these receptors function in coordination to deliver luminal glucose to the
enterocyte and into the circulation.

40
Figure 7: Similarities between lingual TRCs and intestinal enteroendocrine cells. Recent evidence
demonstrates that numerous receptors located on TRCs in the mouth are also located on
enteroendocrine cells in the intestine and display similar second messenger pathways.
The exact mechanisms of T1R2+3 mediated up-regulation of SGLT1 in response
to dietary carbohydrates are still unclear; however, it is thought to be dependent upon
intestinal peptide release. The initial hypothesis was that T1R2+3 stimulation, occurs
on the apical membrane of the enteroendocrine cells results in secretion of gut incretin
peptides GLP-1, GLP-2, or GIP via a Ca+2-dependent mechanism identical to that of
intracellular taste signaling described previously [274]. Briefly, this pathway utilizes
PLCβ2 to increase intracellular Ca+2 stores, which bind to TRPM5, and serve to
depolarize the cell (Figure 8). However, further research in humans and rats has
yielded conflicting results of T1R2+3 stimulation leading to gut peptide release [275,

41
276]. Despite this, T1R3 KO mice display decreased circulating levels of GLP-1 during
the fasting and post-prandial state [277]. The exact mechanism thought to induced
SGLT1 up-regulation involves the ENS and GLP-2 signaling [277-281]. As such, GLP-2
is localized in enteroendocrine cells expressing T1R2+3 [269] and the GLP-2R is
located on enteric neurons [282, 283]. Furthermore, application of GLP-2 stimulates
enteric neurons innervating the small intestine, and activation of these neurons induces
responsiveness of enterocytes [283]. As well, use of electric field stimulation up-
regulates SGLT1 expression in enterocytes. In support of a glucose-mediated
mechanism involving the ENS regulating SGLT1 expression is luminal glucose-
mediated increases in SGLT1 is abolished when enterocytes are isolated from the
intestinal mucosa [284]. Together, these pieces of evidence demonstrate the ENS,
involving GLP-2 signaling as a likely candidate to increase SGLT1 after stimulation of
T1R2+3 on enteroendocrine cells. In the enterocyte, the specific intracellular signaling
for the up-regulation of SGLT1 is dependent upon adenyl cyclase signaling mechanisms
and cAMP concentrations [285-287] as mutations in PKA results in impaired SGLT1
expression [288] and increases in cAMP result in increased SGLT1 expression. [289]
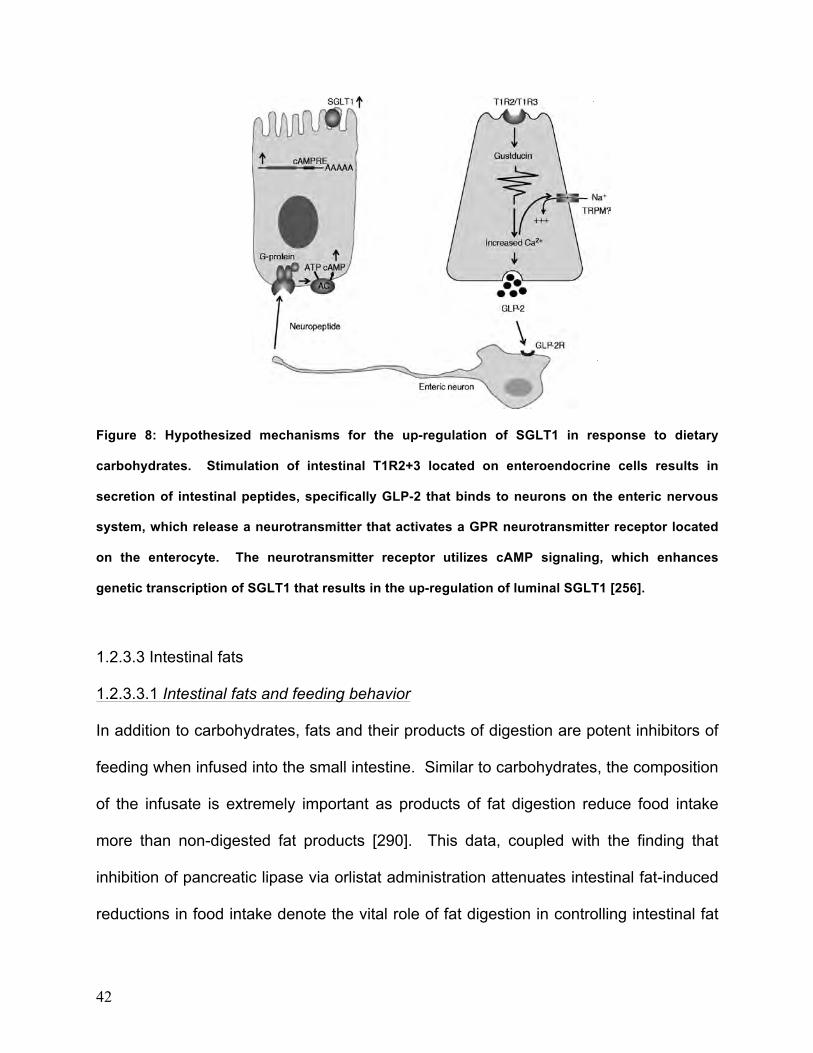
42
Figure 8: Hypothesized mechanisms for the up-regulation of SGLT1 in response to dietary
carbohydrates. Stimulation of intestinal T1R2+3 located on enteroendocrine cells results in
secretion of intestinal peptides, specifically GLP-2 that binds to neurons on the enteric nervous
system, which release a neurotransmitter that activates a GPR neurotransmitter receptor located
on the enterocyte. The neurotransmitter receptor utilizes cAMP signaling, which enhances
genetic transcription of SGLT1 that results in the up-regulation of luminal SGLT1 [256].
1.2.3.3 Intestinal fats
1.2.3.3.1 Intestinal fats and feeding behavior
In addition to carbohydrates, fats and their products of digestion are potent inhibitors of
feeding when infused into the small intestine. Similar to carbohydrates, the composition
of the infusate is extremely important as products of fat digestion reduce food intake
more than non-digested fat products [290]. This data, coupled with the finding that
inhibition of pancreatic lipase via orlistat administration attenuates intestinal fat-induced
reductions in food intake denote the vital role of fat digestion in controlling intestinal fat

43
satiation [291]. In addition to this, the carbon chain length of fatty acids is important as
intestinally infused oleic acid, comprised of an 18 carbon chain reduces food intake
while infusion of the 8 carbon length octenoic acid does not [242]. These findings may
be due to the digesting and processing of longer chain fatty acids into chylomicrons as
long-chain fatty acids are suspended in micellar emulsions in the intestinal lumen, and
then processed into chylomicrons, and secreted to the lymph [292, 293]. Short- and
medium-chain fatty acids, in contrast, are absorbed directly into the hepatic-portal duct.
The importance for chylomicron formation in fat-induced satiation is further supported by
the finding that administration of Pluronic L-81, a chemical that blocks fat absorption via
inhibition of chylomicron formation [294], attenuates reductions in food intake induced
by intestinal fat infusion [291, 295].
1.2.3.3.2 Mechanisms of intestinal fat detection
Similar to the detection of carbohydrates, receptors expressed in TRCs that are
responsive to fatty acids are also expressed on the apical membrane of gut enterocytes
and enteroendocrine cells positioned to sense intestinal lipids [296]. The fatty acid
translocase CD36 is necessary for proximal intestine lipid absorption [297] and
chylomicron formation [298]. For example, CD36 KO mice exhibit decreased proximal,
but not distal intestine chylomicron formation [298] and cholesterol and fatty acid
absorption [299]. The binding of CD36 is almost exclusive to long-chain fatty-acids
(LCFA) as there is almost no effect of CD36 KO on short-chain fatty-acid (SCFA) or
medium-chain fatty-acid (MCFA) absorption. While the specific mechanism by which
CD36 mediates LCFA absorption is unclear, one hypothesis is that it is part of a larger

44
complex assisting in the absorption, which is further dependent upon fatty acid
transporter 4 or simple diffusion. In support of CD36 mediating chylomicron formation is
that isolated enterocytes from CD36 KO mice display decreased triglyceride secretion
[300]. Similar to glucose transporters, the intestine also increases production of CD36
in response to increasing dietary fat [301]. As such mice fed a HF diet exhibit up-
regulation of CD36. Furthermore, CD36 KO animals display decreased intake and
preference of fat emulsions [82]; however, the contribution of CD36 lingual fat detect
(discussed previously), as well as the possible role of neurons utilizing CD36 for lipid
sensing [302] blur the contribution of intestinal CD36 in these findings. Interestingly,
CD36 KO mice display decreased reductions in food intake in response to intestinal lipid
infusions [303]. Despite this wealth of data demonstrating a distinct role in lipid sensing,
absorption, and short-term satiation, the specific contribution to intestinal CD36 to long-
term feeding behavior is uncertain
. In addition to LCFA, energy status mediated signals, such as peroxisome
proliferative factor-α (PPAR-α), are responsible for mediation of CD36 [303]. The
endogenously produced fatty acid ethanolamide, oleoylethanolamide (OEA), present in
the proximal small intestine is also a crucial mediator of CD36. For example,
administration or over-expression of OEA results in decreased expression of CD36 and
PPAR-α, with subsequent reductions in food intake [304]. Endogenous OEA is
produced in response to the presence of intestinal fat. Hence, with intestinal fat infusion,
OEA synthesis is increased and food deprivation inhibits OEA synthesis. Synthesis of
OEA is accompanied by increases in intestinally produced oleic acid as well, denoting
this pathway as a crucial pathway of intestinal fat satiation [303]. Thus, in the presence
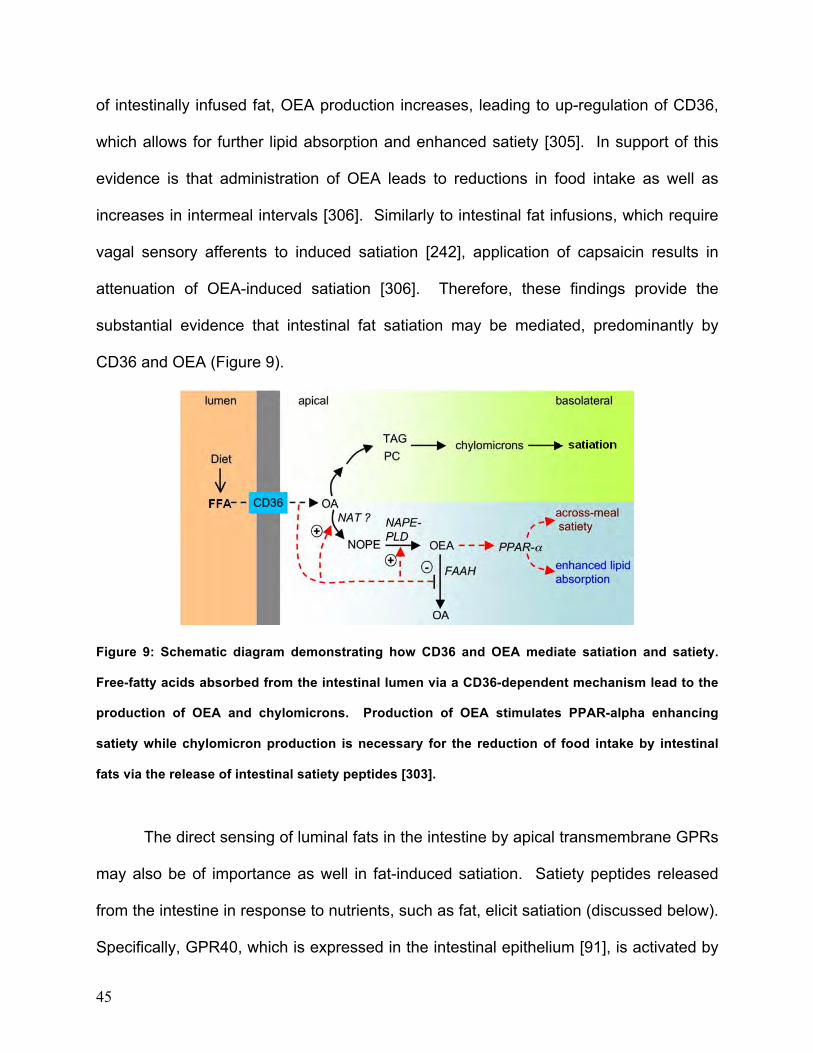
45
of intestinally infused fat, OEA production increases, leading to up-regulation of CD36,
which allows for further lipid absorption and enhanced satiety [305]. In support of this
evidence is that administration of OEA leads to reductions in food intake as well as
increases in intermeal intervals [306]. Similarly to intestinal fat infusions, which require
vagal sensory afferents to induced satiation [242], application of capsaicin results in
attenuation of OEA-induced satiation [306]. Therefore, these findings provide the
substantial evidence that intestinal fat satiation may be mediated, predominantly by
CD36 and OEA (Figure 9).
Figure 9: Schematic diagram demonstrating how CD36 and OEA mediate satiation and satiety.
Free-fatty acids absorbed from the intestinal lumen via a CD36-dependent mechanism lead to the
production of OEA and chylomicrons. Production of OEA stimulates PPAR-alpha enhancing
satiety while chylomicron production is necessary for the reduction of food intake by intestinal
fats via the release of intestinal satiety peptides [303].
The direct sensing of luminal fats in the intestine by apical transmembrane GPRs
may also be of importance as well in fat-induced satiation. Satiety peptides released
from the intestine in response to nutrients, such as fat, elicit satiation (discussed below).
Specifically, GPR40, which is expressed in the intestinal epithelium [91], is activated by
46
fatty acids with 6 or more carbons [307], mediates CCK secretion [91]. Additionally,
GPR40 is co-localized with CCK expressing cells of the intestine and KO of GPR40 in
mice results in attenuation of lipid-induced CCK secretion. Isolated enteroendocrine
cells from these animals also display an abolish response of LCFA-induced stimulation
of intracellular Ca+2 level increases and are unable to secrete CCK in response to LCFA
[91]. Despite the clear role of GPR40 in enteroendocrine cell activation and CCK
secretion as well as the finding that GPR40 KO animals consume more standard chow
than wild-type animals, HF-feeding, a potent stimulus for CCK secretion, results in
similar daily food intake and body weight between GPR40 KO and wild-type mice [308].
Short-chain fatty acids activate GPR41 and 43 [309], which are found in both the
proximal and distal intestine [310, 311], and are linked to PYY [312] and 5-HT secretion
[313]. In cell models, stimulation of either receptor with SCFA results in PYY secretion
and both GPR41 and 43 are co-localized with PYY [313]. As well, SCFA in the distal
intestine, including the colon, induce PYY and serotonin secretion. Despite this, to date,
only GPR41 is known to mediate PYY secretion in vivo as KO of this receptor leads to
decreases in circulating PYY [312]. Furthermore, GPR41 KO animals display increased
intestinal transit, which is most likely secondary to the decreased secretion in PYY,
which serves to inhibit intestinal motility [312]. As well, GPR120, which is activated by
long-chain fatty acids, is responsible for GLP-1 and possibly CCK secretion as
knockdown of GPR120 results in attenuation of GLP-1 [93] and CCK [91] secretion from
enteroendocrine cells lines. Finally, KO of GPR120 results in increased body weight
and deleterious effects on blood glucose metabolism during HF-feeding relative to
control animals [314]. However, the fact that GPR120 is found on various metabolically

47
active tissues [315], such as the pancreas [316] and adipose tissue [317] has
confounded the relative contribution of GPR120 in feeding behavior. Thus, despite the
few in vivo studies demonstrating a role of these receptors in intestinal satiety peptide
secretion, the majority of research demonstrating GPR stimulation inducing gut-peptide
release has been performed in cell models, and it remains unclear how these receptors
regulate feeding behavior.
The specific intracellular pathway that each GPR utilizes to induce gut peptide
secretion is under investigation, and has been found to encompass second messenger
pathways similar to TRCs. After the binding of fatty acids to GPRs on the extracellular
N-terminus, coupled second messenger proteins dissociate and stimulate downstream
kinases and lipases. The first, which is nearly identical to that of T1R2+3, is that second
messenger g-proteins activate PLCβ2, leading to increases in intracellular Ca+2
signaling resulting in exocytosis of gut peptides via a Ca+2-dependent mechanism [318].
Additionally, these GPRs also utilize a second messenger pathway stimulating Protein
Kinase B via an extracellular receptor kinase (ERK) [319], which leads to secretion of
gut peptides. As such, stimulation of enteroendocrine cells lines with nutrients results in
a rapid increase of intracellular Ca+2 as well as activation of ERK and concomitant gut
peptide secretion.
1.2.3.4 Intestinal nutrients, conditioned preferences, and reward
In addition to intestinal nutrients playing a profound role in terminating a meal, the
exposure of nutrients to the intestine is vital in establish learned food preferences, a
term coined “post-oral conditioning.” The evidence of post-oral conditioning influencing

48
feeding behavior comes from studies where intake of a flavored nonnutritive solution is
paired with gastric or intestinal infusion of a specific macronutrient, typically
carbohydrates that are strong enforcers of post-oral conditioning. For example, rats that
are trained alternating days to drink a specific flavor (e.g. grape) paired with a gastric
infusion of glucose or another flavor (e.g. cherry) paired with a gastric infusion of water
display a profound preference for the grape flavored solution over the cherry solution
when given concomitant access to both flavors and in the absence of gastric infusion
[320]. In these studies, animals typically “self-infuse” the infusate by starting to drink the
flavored solution and the infusion beginning almost simultaneously [321]. However,
post-oral infusions of glucose also can also stimulate consumption of a flavored solution
when paired 1-h post consumption [322]. The effects of post-oral glucose conditioning
flavor preferences also is long lasting, denoting a probable reward pathway controlling
this behavior [323-325]. As well as increases in flavor preference, post-oral conditioning
with intestinal carbohydrates increases overall intake of the flavored solution [326-328].
The site of action for this phenomenon is the proximal intestine as occluding the
stomach prevents gastric infusions from conditioning flavor preferences [329] and
duodenal or jejunal, but not ileal [329, 330], or intravascular infusions of sugars [331]
results in post-oral flavor conditioning . However, changes in the feeding paradigm,
such as water and food deprivation, coupled with a flavored nutritive solution can result
in intravascular glucose to condition flavor preferences [332].
While glucose is an extremely strong enforcer of conditioned flavor preferences,
other nutritive sweet substances, such as sucrose and fructose can have the same
effect [333-336]. However, for the latter, animals require long infusions (>20-h) in

49
conditioning flavor preferences paired with gastric infusions [336]. In contrast to this,
nutritive sweet lactose and galactose [320, 337, 338] as well as nonnutritive sweet
stimuli, such as sacharrin or sucralose [339, 340] do not condition flavor preferences.
The former two may be explained by the inability of an animal to fully digest these
nutrients while the latter two are explained by the nonnutritive value. In addition to
these findings, research demonstrating that T1R3 KO mice maintain normal post-oral
conditioned flavor preferences [340] lends notion that a mechanism other than sweet
receptors, such as SGLT1 or SGLT3 activity [341], may be responsible for these
findings. Furthermore, in the absence of post-intestinal signaling, such as vagal
deafferentation via mechanical [342, 343] or chemical [344] means, animals continue to
display conditioned flavor preferences with glucose infusions. Additionally, intestinal
satiety peptides, which are released in response to intestinal nutrients, control nutrient-
induced satiation, but do not control glucose-induced conditioned flavor preferences
[335, 345, 346]. Collectively these findings demonstrate that a pre-absorptive
mechanism, localized in the intestine, is responsible for post-oral conditioned flavor
preferences induced by glucose.
Similarly to glucose and sucrose, intestinal infusions of fat can condition flavor
preferences rapidly [347] with a resistance to extinction [348]. The length and
composition of the fatty acid is important as well in influencing this finding as medium
chain fatty acids or saturated fatty acids do not condition flavor preferences as strongly
as polyunsaturated, long chain fatty acids do [349]. Further, although the caloric value
of intestinal fat infusions is important to condition flavor preferences, and inhibition of fat
digestion with orlistat partially blocks fat conditioned flavor preferences [350], it is not

50
the major determinant of this effect. For example, an oil emulsion that has a higher
caloric density than a glucose solution, conditions flavor preferences less than glucose
[339]. However, the relatively long time course for the digestion of fat is hypothesized to
play an integral role in its conditioned effects as more trials are needed to condition
flavor preferences than those observed with glucose [325, 333], but once established,
animals consume more of the fat-paired flavor over one hour [351] . Currently, the
origin and mechanisms of intestinal fat conditioned flavor preferences are unknown, but
involve a post-gastric site [344]. Post-intestinal, intravascular infusions of fat have not
been examined, and CD36 KO mice display relatively strong fat conditioned
preferences [101] while GPR KO animals have not been tested under this paradigm.
Despite this relative uncertainty, vagal afferents are not necessary for fat conditioned
flavor preferences [344], but peripheral inhibition of fat oxidation reduces reinforcing
properties and preference of fat [352]. Thus, it is probable that the oxidation of fat, and
not an intestinal factor, is responsible for fat conditioned preferences.
Similarly to taste signaling, post-oral nutrient conditioned flavor preferences and
the enhancement of solution intake is hypothesized to be controlled via reward centers
in the brain [332, 353]. However, in contrast to central taste processing and via afferent
pathways, which are better established, the knowledge of post-oral signals conditioning
intake are less clear. Intestinal and intravascular glucose is a documented stimulator of
DA release in the NAcc [332, 353], and a metabolic, rather than central glucose sensing
mechanism is thought to induce this release as hepatic-portal infusions stimulate more
DA release than jugular infusions [332]. Additionally, intestinal infusion of glucose also
increases neuronal activation of the NAcc, and is unchanged following vagotomy [354,

51
355], similar to behavioral findings of conditioned flavor preferences [343, 344]. The
role of endogenous DA stimulating intestinal glucose-induced conditioned preferences
comes from the finding that application of a DA1 receptor antagonist in the NAcc blocks
glucose conditioned flavor preferences [356]. Similarly to taste, this pathway may
involve neurons of the PBN as lesions of this nucleus results in impairment of
carbohydrate induced flavor learning [357]. The effect of post-oral fat on reward centers
are even less known. Intestinal infusions of fat stimulate DA release from the NAcc in
the absence of oral stimuli. As well, post-oral infusions of fat active neurons in reward
nuclei, such as the NAcc ventral tegmental area and amgydala with neural activation
occurring before fat absorption [358]. Despite this, peripheral administration of DA
receptor antagonists does not prevent fat conditioned flavor preferences in rats [359],
but blocks fat-induced place preference [360] and operant licking for gastrically infused
oil emulsions in mice [361]. Together, this relative scantiness of data with the fact that
in humans, post-oral feedback from foods likely contributes to the over consumption of
high calorie and palatable foods, demonstrates the need for further research in
examining how post-oral nutritive feedback stimulates feeding behavior and its
relationship with reward pathways.
1.2.3.5 Obesity and intestinal nutrient satiation
Studies examining the effect of obesity on intestinal sensitivity to nutrients show that
obese rodent models display decreases in nutrient-induced satiation, which likely
contributes to their over consumption. For example, carbohydrate or fat infusions in
genetically obese OLETF rats suppress food intake less than in lean controls [143, 362].

52
Similarly, the obese prone Osborne-Mendel (OM) rat displays decreases in intestinal fat
satiation [363]. Also, the Zucker fatty rat, which displays impaired leptin signaling,
exhibits decreased intestinal-induced satiation relative to lean controls, but increased
protein-induced satiation. While the OLETF model most likely exhibits a broad
decreased sensitivity to intestinal nutrients due to lack of functional CCK signaling [364],
the mechanism responsible for the decreased reduction of food intake following nutrient
loads in the OM and Zucker rat are less clear. For example, the OM rat displays
modestly enhanced sensitivity to endogenously CCK [365], which is largely released in
response to intestinal fats [238]. However, blockade of endogenous CCK, which
mediates intestinal fat satiation [238] was not examined and could provide conclusive
evidence for the mechanism of decreased intestinal fat satiation observed in this model.
The Zucker fatty rat, on the other hand, displays impaired leptin signaling, and given
that leptin interacts with numerous signals inhibiting feeding, including CCK [199, 366],
this may be the main contributor to decreased intestinal fat satiation in this model. More
recent evidence in the outbred DIO model, which becomes obese during HF-feeding,
demonstrates that these animals exhibit decreases in gastrointestinal fat induced
satiation relative to DIO resistant (DR) animals fed the same diet [10]. In humans, this
data is less clear, with virtually no studies examining intestinal expression of
carbohydrate and fatty acid sensing receptors in the intestine between obese and
normal individuals. However, the diabetic state is not associated with any differential
expression of intestinal T1R2+3 relative to normal patients [367]. Despite this, a
majority of studies in humans that have examined circulating levels of intestinal satiety

53
peptides following a meal have demonstrated levels are decreased in obese individuals,
and this is reversed during weight loss [368-370].
1.2.3.6 Vagal afferents and intestinal nutrient satiation
Signals generated from the intestine in response to the presence of intestinal nutrients
are transmitted through the vagus nerve to the caudal brainstem, which receives and
process visceral information that then relays information to upstream forebrain nuclei
that regulate long-term energy homeostasis. However, forebrain structures are not
necessary in regulating food intake as decerebrate animals, with only the brainstem
intact, terminate a meal normally [371-373]. As such, vagal afferents mediate a majority
of nutrient [242, 243] and nutrient-induced satiation signaling [374] arising from the
small intestine. This is thought to be due predominantly to sensory vagal afferents,
because while vagotomy abolishes reduction in food intake from both carbohydrate and
fat infusions [243], peripheral or central administration of capsaicin, a potent neurotoxin
that selectively destroys vagal sensory fibers only, abolishes carbohydrate and fat-
induced satiation as well [242]. Furthermore, the coeliac vagotomy, which denervates
the main branch of the vagus that provides innervation to the duodenum, abolishes
carbohydrate or fat induced satiation [247, 375]. This, along with behavioral evidence
also demonstrates the duodenum being a major site for nutrient-induced satiation. For
example, infusions in the proximal intestine suppress food intake more than distal
intestinal infusions [248]. However, some recent data still demonstrate a significant role
of ileal nutrient infusions reducing food intake and elevating plasma intestinal satiety
peptide levels [376].

54
The specific layer of the intestine that underlies vagal mediated signals inducing
satiation is unknown, however, evidence suggests it is the intestinal mucosa [377]. The
intestinal mucosa is highly innervated by the mucosal vagal terminals predominantly
located in the duodenum, and these nerve fibers are relatively unresponsive to
distention and highly responsive to mechanical changes of the mucosa, which occurs in
the presence of intestinal nutrients [378-381]. Mucosal afferents penetrate through the
ENS and muscular layers of the intestinal wall supplying innervations from the lamina
propia to the intestinal villi. Despite their relative proximity to enterocytes that readily
absorb nutrients, and enteroendocrine cells that release intestinal satiety peptide
release, no experimental evidence has demonstrated that the mucosal endings maintain
synapses with these intestinal epithelial cell types. However, in relative lack of this
anatomical evidence, capsaicin infusions into the intestine, resulting in denervation of
the submucosal plexus containing the mucosal nerve endings, but not myenteric plexus,
which contains IGLEs, results in abolishment of intestinal fat-induced satiation [377].
Thus, the mucosal afferents are a main contributing pathway to intestinal nutrient
satiation. Furthermore, because vagal afferents do not come into direct contact with
intestine luminal contents, but are in close proximity to epithelial cells, the main
hypothesis is that absorbed nutrients or more likely chemical signals, released in
response to nutrients, mediate intestinal nutrient satiation between the intestinal lumen
and vagal afferents.

55
1.2.3.7 Intestinal satiety peptides
1.2.3.7.1 Cholecystokinin (CCK)
Cholecystokinin (CCK) was the first discovered gastrointestinal peptide implicated in the
control of food intake and subsequently coined “satiation signal”. Detected for the first
time in 1928 by Ivy and Oldberg and later characterized by Jorpes and Mutt [382], it was
not until 36 years ago when Gibbs et al. published the landmark paper showing that the
biologically active, synthetic, CCK octapeptide (CCK-8) reduced food intake in the rat
[383]. Since then, the investigation into the role of CCK on food intake continued
unabated making CCK one of the most intensely studied gut peptide. Consequently, its
suppressive effects on food intake have been demonstrated in several species including
humans [246]. CCK controls food intake by coordinating visceral functions to optimize
digestion and absorption and by interacting with other short- and long-term meal-related
signals. CCK may also contribute to satiation by reducing caloric consumption, thus
exerting its role in the control or regulation of other systems, such as body adiposity.
CCK is released from discrete enteroendocrine I-cells concentrated primarily
along the proximal duodenal and jejunal mucosa. The apical surface of the CCK cells
comes in contact with food components triggering a series of intracellular events
resulting in the peptide release from the basolateral cell membrane into the circulation
[384]. Several molecular forms of CCK have been identified and they are derived from
the 95 amino acid pro-CCK (CCK-5 to CCK-83) with CCK-8 and CCK-58 being the most
biologically potent in suppression of food intake [385].
Reduction of food intake by intraintestinal nutrient infusions is thought to exercise
controls of food intake, which normally are activated when components of a meal enter

56
the duodenum from the stomach. In the rat and other mammals, plasma CCK
concentrations are elevated in response to intraintestinal products of fat digestion,
unhydrolyzed protein, and inhibitors of pancreatic trypsin [386-388]. Some, but not all,
intestinal nutrients stimulate secretion of the gut peptide, cholecystokinin. For example,
carbohydrates and amino acids do not release CCK in the rat [386] although in humans,
CCK is released in response to both l-phenylalanine [389] and glucose [390]. CCK
reduces food intake by acting at CCK-1Rs, located on small unmyelinated vagal
sensory neurons [391], indicating that the substrate that mediates CCK-induced
satiation is similar, if not identical, to that which mediates reduction of food intake by
intestinal nutrients. Participation of CCK-1Rs in the reduction of food intake by intestinal
nutrients is well supported by the fact that CCK-1R antagonists attenuate or abolish
reduction of food intake by intraintestinally infused triglycerides [392], long chain fatty
acids [238], oligosaccharides [393], and protein [394]. In addition to reversing the
reduction of food intake observed following exogenous CCK [395] injection or intestinal
nutrient infusion, CCK-1R antagonists increase food intake when they are administered
alone denoting an important role of endogenous CCK in controlling meal size [395,
396]. Taken together, these results suggest a direct relationship between CCK-1Rs and
control of food intake by intestinal nutrients.
There is accumulating convincing evidence indicating that CCK mediates
nutrient-suppression of food intake mainly through a paracrine rather than an endocrine
mode of action. For example, both suppression of food intake and inhibition of gastric
emptying by intraintestinal carbohydrate infusions, which do not elevate plasma CCK,
are attenuated by a CCK-1R antagonist [386]. On the other hand, infusions of proteins

57
that markedly increase plasma CCK concentrations have a marginal effect on reduction
of sham feeding [386]. Furthermore, administration of a CCK-1R antagonist
impermeable to the blood-brain barrier attenuates the satiating effects of CCK and
intestinal nutrients [395] and increases food intake when given alone [395]. Finally, the
endocrine source of CCK must undergo hepatic portal degradation which renders most
of the biologically active CCK ineffective in suppressing food intake [397]. Consistent
with this, very low concentrations of CCK (1-5 picomolar range) is detectable in the
blood circulation and the only endocrine form of CCK found in the rat is CCK-58 [397].
Together, these data overwhelmingly point to a peripheral site of action whereby a local
source of CCK acting in proximity of vagal afferent fibers may be sufficient to mediate
reduction of food intake. This is also supported by studies showing that low doses of
intraperitoneal, that likely mimic the paracrine mode of action on vagal afferents [398],
or near-arterial administration of CCK-8 reduces food intake more than higher doses
when administered intravenously [399]. Whether sufficient amounts of systemically
administered CCK are able to penetrate the lamina propria and elicit a physiological and
behavioral effect is unknown. Thus, the exact identity of this source of CCK outside the
enteroendocrine cells remains to be located. Studies examining receptor affinity indicate
a relationship between local concentrations of CCK in the GI tract and CCK-1R affinity.
It is thought that low affinity receptors are localized near areas with high CCK
concentration while high affinity receptors are in areas with low CCK levels [400, 401].
For example, administration of an agonist of high affinity CCK-1Rs does not decrease
food intake [402]. Additionally, work done in vagal afferent preparations shows the
majority of CCK-1Rs expressed on vagal afferent neurons are thought to be low affinity

58
CCK-1Rs [403]. Together, these data suggest that gastrointestinal CCK acting locally
on vagal afferent sensory fibers is responsible for nutrient induced satiation.
1.2.3.7.2 Glucagon-like Peptide-1 (GLP-1)
A number of glucagon-like peptides have been identified with similar biological activities
that are representative of the proglucagon family. One such peptide is glucagon-like
peptide-1 (GLP-1). GLP-1 exerts physiological and behavioral effects by binding to the
GLP-1 receptor (GLP-1R), which is expressed by central and peripheral nervous
systems as well as alimentary organs, such as the pancreas. In addition to the L-cells
of the GI tract, neurons of the CNS produce GLP-1. To decrease food intake, GLP-1
acts through paracrine and endocrine pathways, which stimulate neuronal nuclei
involved in the control of food intake.
Intestinal L cells located mainly in the distal ileum and colon secrete GLP-1 in
response to a variety of nutrient, neural, and endocrine factors. Initially, due to the
kinetics of meal-induced GLP-1 release, the primary mechanism of GLP-1 secretion
was thought to be through an indirect, neuro-humoral reflex. Specifically, GLP-1
secretion is highest ten minutes post meal ingestion when nutrients are not yet thought
to make contact with GLP-1 secreting L-cells [404]. While this mechanism induces
secretion of GLP-1, nutrients are also thought to directly regulate release of the peptide
[405]. Two pieces of indirect evidence support this. First, infusion of glucose directly
into the proximal small intestine results in elevated circulatory GLP-1 levels comparable
to distal small intestine infusion of glucose [406]. Secondly, recent advances in the
ability to tag and detect L-cells throughout the GI tract have identified large populations

59
of GLP-1 secreting cells that are also present in the proximal intestinal tissues that most
likely mediate this rapid release of the peptide [407].
The L-cells of the GI tract are open-type endocrine cells, with the apical surface
strategically positioned to sense intraluminal intestinal nutrients. Binding of nutrients to
apical surface membrane proteins is thought to stimulate release of GLP-1. Some of
the candidate receptors thought to induce GLP-1 release are gustducin and T1R family
receptor subtypes [408]. Inside the cells, a vesicular transport system shuttles GLP-1 to
the basolateral portion of the cell and releases the peptide into the circulation or lymph.
Thus, GLP-1-secreting cells are in an excellent position to release the hormone in
response to mixed meals or single nutrients. Indeed, ingested nutrients cause secretion
of GLP-1 from the GI tract. Specifically, peptone or products of protein digestion, such
as amino-acids, result in secretion of GLP-1 both in vitro and in vivo [409, 410]. Fatty
acids, triglycerides, and carbohydrates are also potent stimuli for GLP-1 secretion [411].
GLP-1 is secreted from cell models via mechanisms that are normally dependent on
glucose, including sodium-glucose transporters, and potassium-ATP sensitive pumps
[412]. The increase of circulatory GLP-1 is prolonged in response to complex
carbohydrates and fiber as well, which can be attributed to the slow digestion of these
nutrients allowing for greater intestinal transit time, and increasing exposure of nutrients
to GLP-1 secreting L-cells. While fasting typically results in low levels of GLP-1,
blockade of enzymatic GLP-1 degradation results in increased circulatory levels,
denoting some constitutive release of the peptide [413]. Altogether, these data show
that nutrients stimulate GLP-1 secretion, thus demonstrating the role of GLP-1 in control
of food intake.

60
Administration of GLP-1 into either the periphery or central tissues results in a
subsequent dose-dependent decrease of food intake in several species [414-416].
Similar to injections of other peripheral satiety agents, such as CCK, GLP-1 limits food
intake by decreasing meal size; however, at high doses, GLP-1 also decreases meal
number. Furthermore, chronic administration of the GLP-1R agonist, exendin-4, results
in reduced bodyweight gain and adiposity [417, 418]. Conversely, blockade by exendin-
9 in fed rats increases food intake [419]. In humans, peripheral administration of GLP-1
reduces food intake and gastric emptying. However, the role of endogenous GLP-1 in
control of food intake in humans is not entirely clear since no studies thus far examined
the effect of exendin-9 on energy intake. In contrast, mice lacking the GLP-1R exhibit
normal eating behavior and are of normal body weight [420]. This has been attributed to
compensatory up-regulation of other satiation signals derived from the gastrointestinal
tract, especially hormones co-secreted with GLP-1 from the intestinal L-cells. Together,
these data provide strong support that GLP-1 has an important role in energy balance.
1.2.3.7.2 Peptide YY (PYY)
The intestinal peptide PPY, a member of the pancreatic polypeptide-fold family of
peptides is synthesized by the L-cells and contains tyrosine residues at its terminus.
The cleavage of two amino acid residues by DPP-IV produces the major circulating form
of the hormone, PYY3-36 [421, 422]. PYY mediates inhibition of gastric emptying [423],
intestinal motility [424], gallbladder contractions [425], and is co-localized in L-cells with
GLP-1 [426]. Peptide YY is released predominantly in the ileum and colon [424];
however, the jejunum also exhibits significant PYY activity [427]. Additionally,
61
circulating PYY, which may be a result of both nutrient- and neural-humoral reflex-
induced secretion, rises shortly following a meal, and levels are highest following
carbohydrates and protein while fats are also a potent secretagogue of PYY. Caloric
content of a meal is also an important determinant of PYY release. Specifically,
circulating PYY rises 15 minutes following a meal, peaks approximately between 1 to 2-
h post feeding, and remains elevated for another 4 – 5-h. The findings that PYY levels
remain elevated for hours following a meal suggest that it may be a satiety factor,
promoting a longer intermeal interval rather than decreasing meal size.
The finding that peripheral administration of PYY leads to decreases in food
intake in a variety of species has further lent notion that it can modulate feeding
behavior. Effects of injected PYY occur via the Y2 receptor, for which PYY maintains a
high affinity. Both the peripheral and central nervous system express the Y2 receptor.
Specifically, nodose ganglia cell bodies of the vagal afferents express Y2, as does the
arcuate nucleus. The main upstream effects of PYY are mediated by the hypothalamus,
specifically the ARC; however the mode of transmission may occur via two pathways.
Found in relatively high circulating concentrations, PYY can easily diffuse across the
median eminence that lacks a functional blood barrier, and bind to ARC Y2 receptors.
By binding Y2 receptors, PYY down-regulates the orexigenic signals NPY and AgRP
that are localized in the ARC as well as up-regulating POMC and CART expression in
neurons. A second paracrine mode, involving vagal afferents has also been suggested
to mediate PYY’s effects on the hypothalamus and eating behavior as vagotomy
abolishes PYY-induced down-regulation of NPY and AgRP as well as its feeding
suppressive effects. While an endogenous role of PYY in controlling food intake is not

62
completely clear, several pieces of evidence lend notion to the fact that it plays a role in
food intake and energy balance.
While PYY is elevated in response to macronutrients, and caloric value of a meal,
fasting results in suppression below typically observed basal levels of circulating PYY.
Additionally HP feeding results in significantly increased circulating levels of PYY, and in
humans, feeding a meal high in protein resulted in higher circulating PYY compared to a
HF or HC meal. Long-term energy homeostasis also regulates PYY secretion as obese
individuals display significantly decreased levels of PYY. For example, fasting and
post-prandial PYY is negatively correlated with BMI, which may be one reason for
increased energy intake in this population. Similarly to humans, DIO rats display
decreases in peripheral PYY. Interestingly, surgical interventions for obesity results in
weight loss and subsequent increases in circulating PYY. In addition to the obese state
reducing circulating PYY levels, chronic administration of PYY results in reductions in
food intake and body weight in animal models. The most evident endogenous role for
PYY in the control of body weight and food intake is that PYY deficiency leads to
hyperphagia and obesity with reversal occurring following PYY treatment. Despite this
finding in an animal model, human trials examining the efficacy of PYY to reduce body
weight have been unfruitful. However, together, with the use of other peptide hormone
treatments, PYY may have a place in the curbing of obesity rates.

63
1.2.4. Liver
1.2.4.1 Hepatic nutrients and feeding behavior
The liver maintains a wealth of responsibilities that are integral to the functions of many
systems such metabolizing, detoxifying, and inactivating endogenous hormones as well
as exogenous chemicals, such as drugs. Juxtaposed to the intestine and connected via
the hepatic portal vein, the liver also processes absorbed nutrients, ultimately sensing
and controlling peripheral metabolism. The hepatic regulation of food intake was initially
demonstrated over 50 years ago when infusions of glucose into the liver of dogs
reduced food intake while infusions of systemic glucose did not [428]. Subsequently,
this finding was limited by further research that yielded conflicted results, but eventually
was supported that hepatic portal vein infusions of glucose reduced intake in rats during
normal feeding [429]. Furthermore, the finding that administration of 2-deoxy-D-glucose
(2-DG), a competitive inhibitor of glucose uptake and glycolysis, stimulates food intake
when infused into the liver [430] supported that the hepatic sensing of glucose is
partially responsible for controlling food intake. The ability of glucose hepatic portal vein
infusions to reduce food intake lasts for an extended time following infusion, and is
determined by the presence of glucose itself, rather than the amount of glucose [431,
432]. As well as glucose, hepatic infusions of fructose, which is exclusively processed
in the liver, and cannot enter the CNS, also reduces food intake [433]. The effects
observed with carbohydrates and portal vein infusions reducing food intake in rats also
extend to medium to long chain fatty acids [434, 435]. Additionally, inhibition of liver
fatty acid oxidation increases food intake in rodents [436]. Despite these evidences of
hepatic nutrients controlling food intake, similar to intestinal nutrient-induced satiation, it

64
the exact events that are responsible for reductions of food intake observed following
hepatic glucose infusions are unclear. Similarly to the stomach and small intestine, the
liver is high innervated by the vagus nerve. The presence of nutrients in the liver and
their effects on food intake are mediated at least partially via the vagus. For example,
infusion of nutrients in the hepatic portal vein increases vagal firing [437, 438], and the
increase in food intake following administration of 2-DG is diminished by hepatic branch
vagotomy or capsaicin application [439, 440]. Additionally, administration of inhibitors of
metabolism increase neural activation in the caudal brainstem, where vagal afferents
synapse [439]. Finally, deafferentation of the hepatic vagal branch also increases
daytime food intake in male rats, resulting in increased daily food intake and
subsequent weight gain [441].
1.2.4.2 Hepatic metabolism and feeding behavior
Although nutrient infusions into the hepatic portal vein decrease food intake, the
majority of evidence linking the liver to controlling food intake suggests that the energy
status of the liver is more important than the nutrient itself in regulating feeding. In the
normal physiological state, fasting, which stimulates food intake, is associated with
decreases in liver energy status [442]. The specific evidence that hepatic energy status
is important in controlling food intake comes from administration of metabolic inhibitors.
For example, infusion of the fructose analogue, 2,5-anhydro-D-mannitol increases food
intake in rats [443]. In the liver, the end step of processing this analogue is
phosphorylation, which decreases free phosphate levels in hepatocytes [444]. The
decrease in free phosphates in the liver leads to decreases in phosphorylation of ADP

65
to ATP, leading to negative energy balance signaling at the cellular level as evidenced
by the ADP:ATP ratio [445]. In this case, the energy status induced by the fructose
analogue is the primary cause of increasing food intake as treatment with sodium
phosphate increases liver ATP levels and prevents the feeding behavior effects of 2,5-
anhydro-D-mannitol [446]. Further evidence of hepatic cellular energy levels being
responsible for the hepatic control of food intake comes from the finding that decreasing
ATP via a phosphate-independent mechanism increases food intake [447]. Collectively,
these data demonstrate that hepatic energy status is influential in feeding behavior.
1.2.4.3 Obesity and hepatic metabolism
The obese state is associated with decreased liver catabolism, and reduced fatty acid
oxidation specifically plays an important role in the development of obesity. For
example, while animals are lean and feeding a low-fat diet, fatty acid oxidation is
correlated with weight gain during subsequent HF diet feeding [448]. Specifically, a
lower rate of fatty acid oxidation in obesity prone animals during LF feeding is correlated
with increased weight gain on a HF-diet. Furthermore, when lean and fed a LF diet,
obesity prone animals oxidize less fat than obesity resistant animals [16]. The specific
mechanisms for the decreased fatty acid oxidation in these animals is not clear;
however, it is associated with decreased expression of the rate limiting step of fatty acid
oxidation [16]. An endogenous role for the decreased expression of this rate-limiting
enzyme partially in DIO comes from the finding that administration of fenofibrate, which
attenuates hyperphagia and body weight gain in obesity prone animals fed a HF-diet
results in up-regulation of fatty acid oxidation [449]. Further direct evidence of fatty acid

66
oxidation leading to perturbed energy balance is the finding that inhibition of oxidation
leads to increases in food intake and body weight in lean animals [450, 451]. Thus, liver
energy status, due to decreased fatty acid oxidation, is hypothesized to contribute to
obesity. As such, basal hepatic ATP concentrations in humans are inversely correlated
with BMI [452]. Additionally, the inability to increase hepatic ATP in response to hepatic
ATP depletion is correlated with obesity [453]. Collectively, these results demonstrate
that the obese state is associated with decreased fatty acid oxidation and may be one
underlying factor contributing to the obese state.
1.3. Microbiota
The mammalian associated microbiota is comprised of three life domains (Bacteria,
Archaea, and Eukarya), and the term for this population was first introduced in the
middle of the 20th century [454]. While the collective term “microbiota” refers to all the
microorganisms inhabiting a eukaryotic organism, the focus from here forth will focus
solely on the gut microbiota, which is found throughout the gastrointestinal tract, but
predominantly the distal small intestine and colon. The gut microbiota consists of both
indigenous and non-indigenous microbes [455], which are responsible in maintaining
intestinal function, and at first, were greatly underestimated in number. The gut
microbiota is an enormous population, containing 1014 organisms, which outnumbers
the host cell number 100 to 1 [456]. Of interest in intestinal function and energy
homeostasis are the two largest phyla of the gut microbiota: Bacteroides and Firmicutes,
which account for approximately 10 - 20 and 60 - 80% of the dominant bacterial
population, respectively [457]. The gut microbiota of an organism is acquired at birth

67
[458], and varies throughout age [459] and exposure to environmental factors, such as
diet [460].
1.3.1 Microbiota and energy harvest
The majority of nutrients ingested from a typical diet are digested via enzymes that are
produced by the mammalian host. However, ingested dietary fiber, which contains
acetal β linkages, is unable to be digested by mammalian produced enzymes.
Interestingly, the gut microbiota displays high activity of various glycosylhydrolases,
which are capable of digesting β linkages found in dietary fibers [461]. The result of this
hydrolysis, combined with the lack of oxygen in the distal intestine, results in the
production of SCFA and gases in the distal intestine. The SCFAs that are produced in
the distal intestine are predominantly acetate, propionate, and butyrate [462, 463],
which are absorbed in the colon. The resulting SCFAs from fiber digestion supply
energy for the colonic epithelium [464], or transported to various tissues, such as the
liver, cardiac and skeletal muscle [465], or adipocytes [466]. Furthermore, increasing
the amount of dietary fiber can increase SCFA production, and energy derived from
dietary fiber intake has been estimated to be approximately 10% of the daily total
energy intake [21, 465]. While this may seem relatively meager to the total daily energy
intake, initial studies have shown that conventional animals with an intact gut microbiota
can eat 30% less food daily than germ-free (GF) animals, which lack the gut microbiota,
and maintain similar body weights [467].

68
1.3.2 Microbiota and intestinal morphology
Animals bred to be GF are especially useful in determining the contribution of the gut
microbiota to a variety of behavioral, physiological, endocrine, and metabolic functions.
Preliminarily, the contribution of the gut microbiota to overall energy balance was not as
apparent as its contribution to intestinal morphology and physiology. Perhaps the
greatest visual difference between GF and CV animals is the substantially increased
colon size and contents [468]. At the microscopic level, the morphology of the intestine
in GF animals is distinctively different from the CV animals as GF rats display
significantly smaller mucosal surface area, which is marked by decreases in intestinal
crypt cell depth [469]. These findings are most likely due to proliferative factors as
epithelial cell renewal rate is decreased in GF animals. Specifically, the transit time
from crypt to villus peak is twice as long in GF mice relative to CV controls [470]. This is
accompanied by an increase in the time for generating duodenal crypt cells, which is 2-
h longer in the GF mouse [471]. This is also found in the colonic epithelium as well,
which is marked by significant decreases in cell proliferation in GF rats, which is fully
reversed by the inoculation of GF animals with microbiota [472].
Gastrointestinal physiology is also slightly altered in the GF animal, which is
perhaps a function to compensate for morphological and digestive changes observed.
Most studies examining gastric emptying in GF animals have found a slower rate of
emptying [312, 473]. As well, intestinal transit time measurements have shown that
both GF rats and mice display slower intestinal transit of a radioactively labeled meal
[474, 475]. In addition to this effect of the microbiota on the intestine morphology and
physiology, the absence of the gut microbiota leads to significant increases in

69
disaccharidase levels in the proximal small intestine as well as the distal intestine [476,
477]. While the apparent reasons for the increase in the proximal small intestine are
unknown, the increase in distal intestinal activity to disaccharidases may be due to lack
of bacterial inactivation of these enzymes [478]. Despite these changes, the absence of
the gut microbiota does not lead to any other significant alterations in digestive
machinery compared to the CV animal [479]. The effects of the microbiota on intestinal
absorption are less known, however, recent evidence suggests impaired glucose
absorption is present in GF animals [21].
1.3.3 Microbiota and intestinal endocrine function
While studies examining nutrient digestion in GF animals are relatively scant, the gut
microbiota has an influential role on GI endocrine function. For example, in the small
intestine GF mice display decreased CCK immunoreactivity of gut peptides compared to
control animals [480]. This effect is also present in the colon as well; however, colonic
immunoreactivity of CCK is lower than in the small intestine [481]. Examinations of
enteroglucagon, the precursor for GLP-1, and PYY levels in GF and CV animals,
however, have demonstrated that both peptides are increased in GF rats, yet decreased
in the GF mouse. The first study, examining the effects of various fiber products on
circulating enteroglucagon and PYY levels during refeeding demonstrated GF rats
display increased circulating levels of both PYY and enteroglucagon relative to CV
controls during refeeding [482]. Consecutive studies from another laboratory
demonstrated that GF rats display increased enteroglucagon immunoreactivity in the
proximal compared to CV controls and density of PYY and enteroglucagon reactive cell

70
number was significantly increased in GF animals as well [483, 484]. Finally, a more
recent study has shown that GF mice display decreases in circulating PYY, an effect
attributed to the lack of SCFA normally present from microbial fermentation [312].
Collectively, the effect of these alterations in intestinal satiety peptides in the GF model
on food intake is not clear as relatively few studies have examined feeding behavior in
this model. Despite this, the absence of the microbiota clearly alters the level of
intestinal satiety peptides.
Dietary supplementation with soluble fibers and starches, which are collectively
referred to as “prebiotics,” has recently shown promise as a means of manipulating gut
peptides levels and potentially food intake as well. Typical prebiotic fibers include
dietary resistant starch and inulin, both of which are hydrolyzed by the wealth of
bacterial glycohydrolases in the distal intestinal. The addition of prebiotics to various
diets, spanning from low-fat to HF and even high-protein have demonstrated an
increase in GLP-1 levels relative to the respective control diet following this
supplementation [485, 486]. Surprisingly, this occurs in obese animals that display
insulin resistance or impaired glucose metabolism, which would signify the ability of
prebiotics to ameliorate metabolic impairments. In addition to GLP-1, dietary prebiotic
supplementation also increases intestinal and circulating PYY [487]. Interestingly, as
well as increasing circulating GLP-1 and PYY, the addition of dietary prebiotics up-
regulates arcuate nucleus expression of POMC, a potent central peptide that reduces
food intake, as well as decreases in plasma leptin [488]. Whether this effect is
mediated by the alterations in circulating GLP-1, PYY, or leptin is unknown given all of
these peptides influence on central POMC expression; however, it is independent of

71
vagal signaling [488]. Interestingly, reduced food intake and adiposity in rats fed
prebiotics may be an effect of ameliorating the inflammatory state associated with
obesity as well.
1.3.4 Microbiota and inflammation
The obese state and other metabolic pathological states are associated with low-grade
inflammation, which is marked by increased secretion of adipokines and cytokines from
various tissues [489, 490]. The term “cytokine” is typically used to refer to
immunomodulating factors, which comprises a large group of molecules emcompassing
interleukins and interferons. Originally, cytokines were thought to be produced
predominantly or exclusively by macrophages, which play an integral role in immune
function; however 15 years ago the discovery that adipocytes secrete cytokines
(predominantly TNF-alpha and IL-6) that impair metabolism reevaluated the role of
adipose tissue on metabolism and the obesity [490]. Furthermore, increases in
adiposity are associated with increased macrophage infiltration of adipocytes [491, 492].
While macrophages and adipocytes share similar pathways to differentiation, and
macrophages may be locally produced in adipose tissue, isolated macrophages from
adipose tissue display bone marrow lineage. As well as obesity itself, nutritional
regulation of obesity may also occur with and high fat meals inducing post-prandial
inflammation [493]; however, the ability to separate obesity from diet and its role on
systemic inflammation is relatively difficult as rodent models fed high sugar or HF diets
are typically obese [494]. Recently, the systemic inflammation that occurs during HF
feeding and obesity has been attributed to the gut microbiota [495].

72
Intestinal epithelial cells that come into contact with the intestinal microbiota
express various receptors that display affinity for bacteria-related products. For
example, intestinal cells express an abundance of toll-like receptors (TLRs), which
respond to foreign molecules and trigger the inflammatory process [496]. During HF-
feeding, the circulating levels of the bacteria-produced inflammatory molecule
lipopolysaccharide (LPS) are increased. As such, this display of increased systemic
LPS is defined as “endotoxemia” [497] (Figure 10). Through various efforts, LPS was
shown to be responsible for the accompanying metabolic derangements displayed
during HF-feeding as knockout of LPS-related receptors prevented impaired metabolism
and obesity [498, 499]. Furthermore, the intestinal bacteria is most likely the cause of
the increased circulating LPS as LPS is an integral component to the cellular membrane
in Gram-negative bacteria and increases in the ratio of Gram-negative to Gram-positive
bacteria are associated with HF feeding [497]. Additionally, while HF-feeding increases
plasma LPS, treatment against Gram-negative bacteria with antibiotics in the water of
mice, which induces little effects systemically, ameliorates increases in plasma LPS and
associated pro-inflammatory markers. Furthermore, this treatment decreases insulin
resistance as well as visceral adiposity despite increases in food intake [500]. More
recently, the role of HF-diet induced increases in bacterial LPS has also been extended
to influencing vagal signaling. Specifically, HF-diet fed obese, but not non-obese,
animals display increases in intestinal and circulating LPS [460]. Furthermore, vagal
afferent neurons of these animals are resistant to leptin, which may be a cause of their
hyperphagia [501]. This effect is may be due primarily to LPS as vagal afferents display
TLR4 [502], which is a co-receptor for LPS, and application of LPS to vagal afferent

73
neurons results in leptin resistance [501]. Thus, while the gut microbiota clearly
contributes to systemic inflammation, this effect may alter pathways that control food
intake while promoting metabolic impairment leading to pathological states, such as
obesity and/or diabetes.
Figure 10: Mechanisms by which microbiota and increased intestinal permeability lead to
metabolic impairment. In obese animals that are normally fed HF-diets, bacterial LPS production
is increased, and when entering the circulation, triggers an inflammatory response in peripheral
organs, such as the liver, adipose tissue, and the hypothalamus. Ensuing peripheral low-grade
inflammation leads to impaired insulin sensitivity and metabolic dysregulation [503].
1.3.5 Gut microbiota and obesity
The role of the gut microbiota in obesity is becoming increasingly clear with
accumulating evidence. The first study to establish the effect of the microbiota on daily

74
energy regulation and adiposity established that the lack of microbiota in a mouse
model drastically reduces adiposity during standard rodent diet feeding [21]. When
given microbiota from a donor mouse, a process referred to as “conventionalization,”
GF mice increase adiposity by 60% within two weeks. Similarly, GF mice are protected
from DIO maintaining significantly less adiposity relative to conventional (CV) mice. This
effect is independent of increases in daily energy intake as conventionalized animals
display lower daily food intake relative to GF animals in both low-fat and HF diet feeding.
Decreased adiposity in the GF animal also is associated with inhibition of hepatic
lipogenesis as conventionalization induces increases in nuclear response elements
carbohydrate regulatory element binding protein (ChREBP) and sterol regulatory
element binding protein-1 (SREBP-1), both of which regulate lipogenesis. The
mechanism of decreased hepatic lipogenesis in the GF animal is most likely due to
decreased absorption of glucose, as conventionalization also increases glucose uptake
in the small intestine. Thus, by decreasing the amount of glucose shunted to the liver
via the hepatic portal vein, hepatocytes increase inhibition of lipogenesis in GF animals.
Furthermore, the liver of GF mice displays increases in phosphorylated AMPK and
ACC-1, which are potent inhibitors of lipogenesis.
While these factors clearly demonstrate a shift towards peripheral catabolism, the
proposed mechanism by which GF animals display decreased adiposity relative to CV
animals is through increased expression of FIAF, a regionally expressed inhibitor of LPL
[504, 505], which is involved in the rate limiting step of increasing circulating fatty acid
uptake in adipocytes. For example, GF FIAF KO animals display similar levels of
adiposity as CV animals during both low-fat and HF feeding [21]. These data
75
demonstrate that the gut microbiota regulates adiposity and the absence of the gut
microbiota leads to severely decreased adiposity. While the majority of studies have
demonstrated that GF mice indeed display severely diminished adipose deposition, one
study in a GF mouse model different from that of previous GF studies demonstrated no
effect of the absence of the gut microbiota on adiposity levels [506]. The authors of this
study used the C3H mouse model in both the GF and CV state and conducted a series
of experiments using low- and HF diets as well as a HF, high sucrose western diet,
similar to that of previous studies in GF mice. Feeding the LF and HF diets, GF mice
displayed similar and increased levels of adiposity, respectively, relative to CV animals
feeding the same diet. However, similar to previous studies performed in GF mice,
adiposity levels were significantly decreased in GF animals relative to CV controls when
fed a western diet. While the authors of this study found varying levels of adiposity in
GF animals relative to CV controls across three different diets, the GF state was always
associated with up-regulation of intestinal FIAF. Furthermore, the authors of this study
could not detect circulating FIAF, raising the question of the role of intestinal FIAF in
metabolic alterations in GF animals. The authors postulated that the high sucrose
concentration of the western diet, but not LF and HF diets contributed to the obesity in
CV animals, which was absent in the GF group. Despite this, work from Rabot et al.
[507] demonstrate that feeding a HF-diet with low sucrose content results in decreased
adiposity in GF mice relative to CV controls in the C57Bl/6J mouse model. Thus, the
differing strain of mice in this study cannot be excluded as a possible reason for these
conflicting results.

76
Additional studies have shown the gut microbiota in the obese state is
responsible for further increases in adiposity relative lean animals [22, 508]. Data from
Ley et al. [457] demonstrate that the obese state is associated with alterations in gut
microbiota populations. Specifically, the obese ob/ob mouse displays a 50% reduction
in Bacteroidetes population, which is compensated by a 50% increase in Firmicutes
population. As Firmicutes are fermenting bacteria [509] that release an abundance of
SCFA in response to the breakdown of polysaccharides found in the diet, these bacteria
may contribute to increased energy extraction from the diet leading to further perturbed
energy balance [21]. The direct evidence for the gut microbiota of ob/ob mice playing at
least a marginal role in obesity came from a follow-up experiment in which the same
group implanted microbiota from lean mice or ob/ob mice into GF animals [508]. In
doing this, it was discovered that GF animals conventionalized with ob/ob microbiota
resulted in increased adiposity levels relative to conventionalized animals receiving lean
donor microbiota. Similar to the ob/ob mouse, DIO mice display phylogenic shifts of the
gut microbiota with Bacteroides decreasing and proportional increases in Firmicutes
[510]. Additionally, conventionalization of GF animals with the DIO microbiota leads to
further increases in adiposity than conventionalization with lean donor microbiota.
Surprisingly, placing DIO donors on a carbohydrate or fat restricted diet results in
attenuation of this effect demonstrating that adiposity, rather than macronutrient content
is responsible for changes in gut microbiota populations in DIO animals. In addition to
mouse models, obese humans display reductions in Bacteroidetes populations with
proportional increases in Firmicutes, independent of diet composition [511, 512]. Thus,
collectively, these studies show that the presence of gut microbiota leads to adipose

77
deposition through increases in energy harvest via bacterial population changes as well
as altering peripheral hepatic and skeletal muscle metabolism. Together, these findings
demonstrate a clear role for the microbiota in adiposity and the possible distinct
population of an “obese microbiota”; however further experiments have challenged the
hypothesis of a distinct microbiota population during obesity [460, 513].
When feeding an obesigenic diet, the growth curves of animals vary greatly and
in some instances, subsets of populations can be selected as resistant to DIO (DR)
when animals display similar adiposity to that of chow-fed controls [514]. To assess
whether diet is a factor in altering gut microbiota populations independent of obesity,
Hlidebrandt et al. [513] used a genetically engineered KO model that is resistant to DIO
during HF-feeding. Surprisingly, gut microbiota populations were similar in the wild-type
DIO animals and the lean KO model. Similarly, in an outbred DIO and DR rats fed a
HF-diet, gut microbiota populations are similar; however, HF-feeding reduces the total
bacteria number, with increases of Bacteroidiales and Clostridiales, the dominant orders
of the Bacteroidetes and Frimicutes phyla, respectively [460]. Interestingly, despite
sharing similar bacterial populations, the response to these populations in DIO and DR
animals differ. Specifically, DIO animals display increased Toll-like receptor-4 (TLR4)
activity, which is a co-receptor to lipopolysaccharide (LPS), and decreased alkaline
phosphatase activity, which serves to neutralize LPS. Ultimately, increases in TLR4
activation was associated with increased intestinal permeability in DIO animals, with
subsequent increases in circulating inflammatory markers. Given the interaction of the
inflammatory pathways and metabolic impairments, the response of DIO animals to the
altered gut microbiota population due to HF-feeding clearly plays a role in their obesity.

78
Together, these findings demonstrate that diet may be a more important factor in
determining gut microbiota populations in rat models, and have yielded a recent
hesitation to accept the term “obese microbiota.” Despite this, whether due to
population changes during HF-feeding or the obese state, or the hosts’ response to
bacterial-produced agents, the microbiota plays an important role in regulating energy
balance.
1.4. Overall significance and experimental outline
The gastrointestinal (GI) tract is a specialized sensory system that detects and
responds to incoming luminal factors including nutrient-derived signals and micro-
organisms. Significant progress has been made in understanding the events underlying
chemosensory functions of the gut, but the exact mechanisms involved in nutrient
detection are not well understood. In addition to nutrients as previously discussed, the
intestinal epithelium comes in direct contact with trillions of micro-organisms that affect
gut absorptive, morphological, physiological, and endocrine functions and liver
metabolism. Recently, there has been emerging evidence implicating the gut
microbiota in energy metabolism and obesity [21, 22, 460, 495, 508]. Sweet
substances and fats are known to stimulate intake both at the level of the oral cavity [30],
as well as the reinforcement through post-oral influences [348]. Furthermore, the
effects of nutritive components of a meal, such as sugars and fats are potent inhibitors
of food intake [238, 242, 243]. Despite these evidences that the gut microbiota and
nutrients influence peripheral factors controlling food intake, data on how the gut
microbiota regulates energy intake and furthermore, intake of specific macronutrients,

79
such as sweet substances and fat, is scant. Thus, the significance of the proposal of
this thesis is three-fold. First, it establishes the importance of the gut microbiota in
regulating oral factors regulating food intake, specifically sweet and fat taste. Secondly,
it determines the effect of the gut microbiota on post-oral factors regulating nutritive
sweet and fat intake. Thirdly, it demonstrates the role of the absence of gut microbiota
in hepatic and adipocyte metabolism, which may control food intake and are ultimately
associated with body adiposity. Together, the significance of this proposal are to
demonstrate the effects of the absence of the gut microbiota on taste and intestinal
nutrient detection, intestinal satiety peptides regulating food intake, peripheral
metabolism, and how these alterations in GF animals are associated with adiposity.
To establish the role of the gut microbiota in oral and post-oral factors controlling
food intake, a series of studies have been conducted to address the following three
specific aims:
1.4.1 Specific Aim 1: How the absence of gut microbiota affects oral and post-oral
detection of sweet nutrients as well as intestinal sugar transporters
In mice, the absence of gut microbiota results in decreased absorption of a radiolabeled
glucose gavage when measured from the distal intestine [22]. However, in GF rats, the
expression of the predominant transporter regulating glucose absorption, SGLT1, is
increased in the distal intestine [251]. As well, GF mice exhibited marginal increases in
consumption of a palatable western diet, which is comprised of a high sucrose content
[22]. The effects of the microbiota on oral nutrient detection and proximal intestinal
nutrient detection and physiology are not clear, despite data demonstrating increased

80
dissaccharidases in the proximal intestine [477] and decreases in proximal intestine
surface area in GF animals [470]. Whether these alterations in intestinal enzymes and
nutrient transporters lead to alterations in sweet solution intake remains unexamined.
The results of Chapter 2 demonstrate the association of intestinal carbohydrate
detection and transport, with increased nutritive sweet solution intake in GF mice.
1.4.2 Specific Aim 2: How gut microbiota affects oral and post-oral detection of lipids
and associated changes in nutrient-responsive GPRs and intestinal satiety
peptides.
The GF state is characterized as that of mimicking fasting, with depleted adipose depots
[21, 22]. As well, fatty acid receptors in the distal intestine of GF rats are significantly
up-regulated, denoting a possible role of the microbiota in intestinal fat sensing [312].
Fat is a calorically dense nutrient that when exposed only to the oral cavity is highly
preferred during both the fed and fasting condition [77]. Increased fat metabolism,
which is observed during the fasting state and HF feeding, is also associated with
increased intake of fats [73]. The mechanisms responsible for intestinal fat detection
and fat-induced satiation, however, are less understood, but are mediated by CD36
[303], intestinal GPRs [91-93], and satiety peptide release [238, 419]. Results of
experiments examining the hypothesis that GF mice display increases in oral factors
promoting fat intake and decreases in intestinal fatty acid receptors and satiety peptides
are presented in Chapter 3.
81
1.4.3 Specific Aim 3: How gut microbiota affects host liver, intestinal, and adipose
metabolic parameters in a GF rat model.
Hepatic and adipose metabolic function has a significant impact on adiposity and the
regulation of energy balance. Previous studies using the C57Bl/6J GF mouse model
have found that the GF state is characterized by decreased body adiposity, increased
lipolysis [21], and protection from HF diet-induced obesity [22] . Despite these findings
in the C57Bl/6J model, another strain of GF mice was found to exhibit similar adipose
deposition as CV controls during LF or HF-feeding [506], denoting a possible effect of
strain and/or animal model on the absence of gut microbiota influencing body adiposity.
To examine whether absence of a gut microbiota in the rat is associated with behavioral,
phenotypic, and metabolic changes similar to those reported in the mouse model,
Chapter 3 contains results of adiposity, hepatic and adipose metabolism, and adipocyte
morphology in the Fisher 344 (F344) GF rat model.

82
2 Specific Aim 1: How the absence of gut microbiota affects oral and
post-oral detection of sweet nutrients as well as intestinal sugar
transporters
2.1 Introduction
A potential role of gut microbiota in influencing food intake, energy homeostasis and
weight gain in mice has been suggested. As such, GF mice consume more standard
chow while maintaining significantly lower levels of body fat [21]. Additionally, GF mice
consume more of a palatable western diet, in which a large portion of energy comes
from carbohydrates, despite being resistant to DIO [22]. In the colon of GF mice,
expression of fatty acid responsive receptors is increased [312], and expression of
colonic SGLT1 is increased in GF rats [251] while GF mice display decreases in distal
measurements of glucose absorption [21]. Whether the gut microbiota modulates
expression of sweet nutrient-responsive receptors and transporters in the proximal
intestine, where nutrients are largely sensed and absorbed, is unknown. Thus, in this
first study, we examined preference and intake of nutritive (sucrose) and non-nutritive
(saccharin) sweet solutions in germ-free (GF, C57BL/6J) mice compared with normal
(NORM, C57BL/6J) control mice using a two-bottle preference test and associated
changes in proximal intestine expression of the sweet receptor, T1R3, and the luminal
glucose transporter, SGLT-1.

83
84
2.3 Summary of results and conclusions
In the current study, we found that GF mice display increased intake of a highly
concentrated sucrose solution, which leads to increased daily energy consumption from
sucrose. This is most likely dependent upon intestinal rather than oral factors as we
found no differences in the preference or consumption of the non-nutritive sweetener
saccharin, similar expression of lingual sweet receptors in GF and NORM mice, but
increased intestinal T1R3 and SGLT-1. The increased consumption of highly
concentrated sucrose solutions is most likely due to the energy of this sweet solution as
GF mice display significantly decreased energy stores, which leads to increased energy
intake. Furthermore, this effect may be mediated by glucose sensing via T1R3 and/or
SGLT-1. As such although T1R3 deficient mice display normal preferences of sucrose
after intestinal exposure [42], and intestinal sucrose infusions can condition flavor
preferences in these animals [340], they still exhibit decreased consumption of sucrose
solutions [42]. The exact mechanism of increased T1R3 is not apparent from this study
alone; however, because GF animals display a marked reduction in intestinal surface
area [470], which normally would lead to decreases in nutrient absorption. Increases in
T1R3 and SGLT-1 may be a means of compensation to these observed morphological
differences. We did not measure glucose absorption in these animals, but despite this,
we observed no signs of glucose malabsorption, which could occur with the
consumption of such large volumes of sucrose. The increased T1R3 may be due to the
fact that GF animals display increases in brush border disaccharidases [477], which
would lead to higher levels of luminal glucose that stimulate T1R3 expression in GF
mice [274] . In turn, as previously demonstrated, increased stimulation of T1R3 would

85
lead to increased SGLT-1, allowing for greater absorption of luminal glucose [265].
Collectively our data demonstrate that GF animals consume more of a highly
concentrated nutritive sweet solution than NORM animals and this is associated with
increased intestinal T1R3 and SGLT1 expression in the proximal intestine.

86
3 Specific Aim 2: How gut microbiota affects oral and post-oral
detection of lipids and associated changes in nutrient-responsive g-
protein coupled receptors (GPRs) and intestinal satiety peptides.
3.1 Introduction
The results from Chapter 2 demonstrate that mice lacking gut microbiota over consume
increasing amount of calories from nutritive sweet solutions, a phenomenon associated
with increased expression of intestinal “sweet” sensing receptors [515]. The western
diet in which GF animals consume more of than CV mice is highly comprised of dietary
fat as well. While expression of colonic fatty acid receptors that contribute to intestinal
satiety peptide release in GF mice are increased [312], the relative expression in the
proximal intestine, which predominantly contributes to intestinal nutrient satiation, is
relatively unknown. Therefore, to examine whether our results in Chapter 3 extends to
other nutrients, and may be another reason for GF mice’s increased consumption of a
western diet, we tested intake and preference of intralipid emulsions (IL, 0.156, 0.313,
0.626, 1.25) in germ free (GF) and control (NORM) mice. Furthermore, we measured
the associated changes in expression of lingual CD36 from the posterior lingual
epithelium, intestinal fatty acid receptors and satiety peptide expression, and circulating
levels of satiety hormones in GF and NORM mice.

87
3.2 Increased oral detection, but decreased intestinal signaling for fats in
mice lacking gut microbiota
Introduction
By the year 2030, half of the American adult population is predicted to be obese,
which is attributed primarily to increased caloric intake [516]. As such, the large
contribution of calories from dietary fats may play a major role in the development of
obesity. Despite the strong link between dietary fat intake and obesity, the factors
leading to the over consumption of, and preference for, fats are less clear, but may be
due to oral, intestinal, and metabolic influences. For example, rats rapidly consume oils
during sham feeding, a process that limits post-oral feedback [77], while post-oral
infusion of fat conditions flavor preferences in rats and mice [33, 517]. Furthermore,
animals efficient in fat digestion or metabolism consume more fat than inefficient fat
digesting and metabolizing counterparts [73]. Intestinal and metabolic factors are
profoundly influenced and modulated by the presence of trillions of microbes residing in
the intestinal tract, collectively referred to as the gut microbiota, which contribute to
altered energy intake and increased adiposity. Recent studies have linked the gut
microbiota to obesity and associated alterations in metabolism. For example, germ-free
(GF) animals, lacking gut microbiota, are significantly leaner on a standard rodent chow
diet than normal (NORM) animals with an intact microbiota despite consuming more
energy [21]. Furthermore, most studies show that GF-mice are resistant to diet-induced
obesity from a HF or western diet [22, 507], although in one recent study; albeit in a
different strain, GF mice gained more weight and body fat than NORM mice on a similar
calorie HF diet but differing ingredient composition [506]. The resistance to fat

88
deposition in GF mice appears to be due to several mechanisms, including decreased
hepatic de novo lipogenesis. As well, increased systemic lipolysis through increased
expression of fasting induced adipocyte factor (FIAF), an intestinal lipoprotein lipase
(LPL) inhibitor, which results predominantly from decreased extraction of energy from
the diet[22] may play a role in the protection from obesity in GF mice, although the role
of FIAF in the relationship between gut colonization and adiposity has been recently
disputed (see [506]). In addition to influencing host metabolism, the absence of gut
microbiota leads to alterations in intestinal morphology and physiology. We have
recently demonstrated that GF mice exhibit increased “sweet” nutrient receptors and,
sodium glucose-like transporter 1 (SGLT1) expression in the proximal intestine which
was associated with increased sucrose intake [518]. The contribution of nutrient
receptors to increased caloric intake in GF animals is not known, however, activation of
nutrient responsive receptors leads to release of intestinal satiety peptides, such as
CCK, GLP-1 and PYY [92, 93, 312]. Further evidence linking the gut microbiota to
intestinal satiety peptides is the demonstration that GF mice conventionalized with
donor microbiota display an increase in plasma PYY [312], while prebiotic treatment
increases circulating GLP-1 and PYY with concomitant decreases in plasma ghrelin
[486]. Together, these results suggest that alterations in nutrient sensing and peptide
hormones influencing fat ingestion due to lack of microbiota may result in altered fat
intake in GF animals.
In addition to the influence of intestinal nutrient sensing on long-term
consumption of dietary fats, oral factors also play an important role in the detection of,
and preference for, fats. As such, mice lacking CD36, a putative fatty-acid translocase

89
located on the posterior lingual epithelium, are unable to develop preferences for low
concentrations of oil [101]. Interestingly, expression of CD36 is determined by a variety
of factors, including diet and energy status. For example, obese and non-obese
animals consuming a HF-diet display decreased expression of CD36 compared to LF-
fed or non-obese controls [519]. Conversely, during fasting, mice exhibit increased
expression of CD36, an energy state associated with increased detection of fats [519,
520]. Because GF mice display marked reduction in adiposity, reflecting a state of
energy deprivation, they may also display increased CD36, leading to increased
detection or consumption of fats. Therefore, to examine the impact of the absence of
the microbiota on fat intake and preference we first employed two-bottle 48-h access to
increasing concentrations of intralipid emulsions in GF and NORM C57Bl/6J mice.
Secondly, to assess changes in fat detection components and possible mechanisms
involved in increased caloric intake, we measured expression of fatty acid sensors and
receptors in the lingual and proximal intestine epithelium as well as peptide content and
circulating satiety peptide levels in GF and NORM mice. Finally, we measured plasma
lipid metabolites and quantified the enteroendocrine cells in the proximal (duodenum,
jejunum) and distal (ileum, colon) intestine of both groups.
Methods
Animals
Throughout all experiments, male C57BL/6J GF mice (n=10) from our germ-free
colonies, originally derived from Charles River colonies (ANAXEM, Jouy-en-Josas,
France), and normal (NORM) mice (n=10) (Charles River, France) were housed

90
individually in polycarbonate cages with cedar bedding. Each group (GF or NORM) was
housed separately in two Trexler-type isolators (Igenia, France). Throughout the
studies, sterility of the germ-free isolator was verified through weekly analysis of mouse
fecal samples. Both groups of mice received similar autoclaved, deionized water and
irradiated standard rodent chow (Safe Diets, Belgium) ad libitum, unless noted
otherwise. They were allowed a minimum of one-week acclimation before experimental
manipulations began. Procedures were carried out in accordance with the European
Guidelines for the Care and Use of Laboratory Animals.
48-h two bottle preference tests
Ten-wk old GF and 9-wk old NORM mice weighing 27.1 ± 0.3g and 24.5 ± 0.5g
respectively, were given access to intralipid emulsions that were prepared on the basis
of percentage of soybean oil (0.156, 0.313, 0.626, 1.25 % oil (v/v)) in ascending
concentrations, and water during 48-h two-bottle testing. Due to technical logistics, only
eight out of the 10 rats for each group were used for testing. At the beginning of each
test, mice were weighed, the water removed and replaced with 2 similar 250-ml plastic
bottles with the spouts penetrating from the top floor of the cage at 2-4 cm distance from
the floor and 5-6 cm apart. The positions of the two bottles were alternated every 24-h
to control for side preference. Bottles were weighed at the beginning and end of each
24-h test. Between each test, mice received one-bottle access to water. In previous
experiments using the same bottles, we found that spillage from water bottles was
negligible, therefore we did not account for spillage. Emulsions were presented once
every 3–5 days, giving mice access to emulsions at least once a week. At no time did

91
the mice receive more than two intralipid emulsion concentrations per week. To
account for the fact that mice may have altered caloric intake from chow during intralipid
presentations, we also measured 48hr chow intake during the final two intralipid tests.
A pre-weighed amount of chow was presented before testing, and total intake,
accounting for spillage, was measured at the completion of the 48-h tests.
Lingual epithelium and plasma collection
Approximately 3 weeks after completion of two-bottle preference tests for oil emulsions,
GF and NORM mice (n = 10 each) were sacrificed for collection of lingual epithelium
and plasma after either a fast or re-feeding with intralipid. After an overnight-food
deprivation (1700 – 0900-h), half of GF and NORM mice (n = 5 each) received a burette
filled with 1-ml of 20% intralipid, while the other received a burette filled with water.
Mice were sacrificed via decapitation 30-min after drinking the total volume of intralipid.
Trunk blood was collected in EDTA-coated tubes (Becton Dickinson) containing 35 µl
aprotonin (Sigma), 20 µl pefabloc (Sigma), and 20 µl DPP-4 inhibitor (Millipore),
centrifuged at 3,500 x g at 4oC, plasma aliquoted, and stored at -80° for further analysis.
The posterior lingual epithelium was collected from fasted mice by excising the tongue,
and subdermally injecting 0.5 ml of 1 mg/ml dispase and elastase dissolved in
mammalian physiological saline containing 1,2-Bis(2-Aminophenoxy)ethane-N,N,N′,N′-
tetraacetic acid (Sigma, France). After 20-min incubation at room temperature, the
posterior lingual epithelium containing the circumvallate papillae was dissected under a
Stereoscope (Zeiss) and placed into a 1.5-ml microfuge tube containing AllProtect
Tissue Reagent (Qiagen, France) and stored at 2oC.
92
Intestinal Epithelial Cell Collection
For quantification of intestinal epithelial proteins, a separate group of GF and NORM
mice (n = 5 per group) were used. Under deep isofluorane anesthesia, the proximal
portion of the small intestine, containing the duodenum and jejunum was removed and
placed into sterile physiological saline. Intestinal epithelial cells were collected using
the everted sac method. Briefly, after excision, proximal intestines were flushed using
10 ml of ambient physiological saline followed by 10 ml oxygenated (95:5 O2:CO2) Ca+2
and Mg+2-free Krebs-Heinslet buffer. After rinsing, intestines were everted, divided into
three segments, and placed into flasks with oxygenated Ca+2, Mg+2-free Krebs-
Heinslet buffer with EDTA and DTT. Flasks were placed in a 37oC water bath and
shaken for 20 min to dissociate epithelial cells from the connective tissue. The
subsequent suspension was collected, centrifuged and washed with sterile Dulbecco’s
Phosphate Buffered-Saline without Ca+2 or Mg+2. This process was repeated three
times. Aliquots of isolated intestinal cells were snap frozen and stored at -80oC.
Quantitative Real-Time PCR (qRT-PCR)
Posterior lingual epithelium was lysed and homogenized using a TissueLyser (Qiagen,
France) and RNA extracted using a RNEasy Fibrous Tissue Mini-kit (Qiagen, France)
according to the manufacturer’s instructions. For cDNA synthesis, 2 µg of RNA was
reverse transcribed in a reaction volume of 60 µl, using a high-capacity cDNA kit
(Applied Biosystems, Courtaboeuf, France). Subsequent cDNA was diluted 5-fold and
qPCR performed in a reaction volume of 20µl using an ABI Prism 7700 (Applied

93
Biosystems, Courtaboeuf, France) thermal cycler. Samples were run in triplicate and
transcription levels of CD36 was quantified using Taqman® Gene Expression Assays
and Gene Expression Master Mix (Applied Biosystems, Courtaboeuf, France). Relative
mRNA expression was quantified using the 2-ΔΔCT method with β-actin as internal
control.
Western blotting
Isolated intestinal epithelial cell aliquots were thawed on ice and suspended in 1-ml of
radioimmunoprecipitation assay (RIPA) buffer containing protease inhibitors (Sigma,
France). Cells were lysed and homogenized and the resulting homogenate was
centrifuged for 20-min at 14,000 x g at 4oC. The protein concentration in the
supernatant was determined with NanoDrop system (GE Healthcare). Soluble protein
(100 µg) was then run on SDS-PAGE gels containing 10 - 12% acrylamide, transferred
to nitrocellulose membranes, and probed with anti-CD36, GPR40, GPR120, GPR41,
FIAF, PYY, GLP-1, and CCK (Santa Cruz Biotechnology) antibodies. Immune
complexes were detected by chemiluminescence (GE Healthcare). Quantification was
performed by scanning densitometry using ImageJ (NIH, Bethesda, MD, USA) against
β-actin (Santa Cruz Biotechnology) as internal control.
Plasma Analysis
Plasma was analyzed for glucose, triglycerides, total cholesterol and total high-density
lipoprotein (HDL) using an AU 400 automated biochemical analyzer (Olympus).
Additionally, circulating levels of leptin, PYY, and acyl-ghrelin were determined using

94
Enzyme-linked Immunosorbent Assays (Millipore, France) according to manufacturer’s
instructions.
Immunohistochemistry (IHC) of enteroendocrine cells
A separate group of overnight food deprived 10-wk old GF and NORM mice (n = 4 per
group), were sacrificed, and 3 cm sections of the duodenum, jejunum, ileum, and colon
were quickly removed, opened, pinned mucosal side up in agarose coated petri-dishes,
and fixed with 4% formaldehyde overnight. Intestinal segments were stored in 75%
ethanol, embedded in paraffin, and 4-µm-thick microtome cut sections mounted on
glass slides were processed using standard procedures. After deparaffinizing and
rehydrating, slides were placed in 6% hydrogen peroxide for 30 minutes, then blocked
with PBS/3% BSA / 2% goat serum for one hour. Sections were incubated overnight at
4°C with rabbit polyclonal antibody raised against chromogranin A (1:200, Abcam,
ab15160), washed, followed by 1-h incubation at room temperature with biotinylated
donkey anti rabbit antibody (1:400, Santa Cruz), incubated with a hematoxylin solution
for nuclear staining, and processed using DAB (Dako) for 10-20 seconds. Sections
were then dehydrated and mounted with DPX (Sigma), and examined under 100x
microscope (Nikon) for enteroendocrine cell counts. Counting was performed manually
by two individuals blinded to the treatment by observing five, non-overlapping
microscopic areas from similar locations of each intestinal segment between GF and
NORM mice.
95
Statistical Analyses
Differences in bodyweight gain between groups from the start to the end of the
experiment were analyzed with student’s t-test. Preference for intralipid were
determined by the following formula: (48-h intake of intralipid)/(48-h intake of total
fluid)*100 and subjected to one-way (group) repeated measures (rm) ANOVA.
Additionally, 48-h acceptance (raw intake solution) as well as total calories consumed
from intralipid were subjected to two-way (group x concentration) rmANOVA. To
determine taste sensitivity to intralipid (concentration at which the animal first prefers
tastant over water), we performed paired student’s t-test for each concentration within
each group. The resulting values from Western blotting and qPCR, were analyzed
using student’s t-test. Levels of plasma biochemical markers and satiety peptides were
analyzed by two-way (group x treatment) ANOVA with Bonferroni post-hoc tests, where
appropriate. Enteroendocrine cell counts were calculated for each intestinal segment of
GF or NORM group as the total of all five microscopic fields, and analyzed by student’s
t-test. For all statistical tests, differences were considered significant at α < 0.05.
Results
Body weight
There were no significant differences in weight gain between GF (0.8 ± 0.5 g)
and NORM (0.9 ± 0.3) mice during the duration of the experiment.

96
48-h two bottle oil preference and acceptance
There were significant main effects of concentration [F(3, 42) = 6.4, P=0.01],
group [F(1, 14) = 12.56, P<0.01], and group x concentration interaction [F(3, 42) =
3.8, P<0.05] on intralipid preference in GF and NORM mice. At the lowest
concentration tested (0.156% oil), GF mice preferred intralipid to water more than
NORM mice (GF: 87.72 ± 3.2% vs. NORM: 68.09 ± 3.3%; P < 0.001) (Fig 1A). When
acceptance of 48-h intralipid intake was evaluated, there were significant main effects of
concentration [F(3, 42) = 32.98, P<0.0001] and group [F(1, 14) = 5.66, P < 0.05], but
not group x concentration [F(3, 42) = 2.02, P = 0.13]. Thus, we found no difference in
total intake between GF and NORM mice at any of the concentrations tested (Fig 1B).
However, when intake was converted into kilocalories, there was a significant fixed
effect of concentration [F(3, 42) = 78.94, P<0.0001], and group x concentration
interaction [F(3, 42) = 2.90, P<0.05], but not group [F(1, 14) = 4.43, P=0.05]. Post-
hoc analysis revealed a significant difference in caloric intake between GF (1.73 ± 0.2
kcal) and NORM (1.19 ± 0.2 kcal) mice at the highest concentration tested (1.25% oil)
(P < 0.05) (Fig 1C). Additionally, we found no difference in 48-h solid chow energy
intake between GF and NORM mice during exposure to 0.626% (GF: 10.14 ± 0.3kcal;
NORM: 10.2 ± 0.3g) or 1.25% (GF: 10.04 ± 0.5g; NORM: 8.77 ± 0.8kcal) intralipid.
Lingual and intestinal CD36 expression
In GF mice, expression of CD36 transcript in the posterior lingual epithelium of fasted
mice was up-regulated 3-fold relative to NORM mice (P<0.05) (Fig 2A). However,
intestinal protein expression of CD36 was down-regulated in GF compared to NORM

97
mice (P < 0.05) (Fig 2B). Additionally, intestinal FIAF expression in GF mice was up-
regulated relative to NORM mice (P < 0.001) (Fig 2C).
Intestinal nutrient receptor, gut peptide, and lipid-related protein levels
Protein expression of fatty-acid receptors GPR40 (P< 0.0001), GPR41 (P<0.0001),
GPR43 (P<0.05), and GPR120 (P<0.0001) in the proximal intestine was significantly
decreased in GF mice relative to NORM controls (Fig 3). Similarly, protein expression
of CCK (P<0.0001), GLP-1 (P<0.001), and PYY (P<0.001) were also significantly
decreased in GF compared to NORM mice (Fig 4).
Enteroendocrine cell counts
Total enteroendocrine cells, represented by chromogranin-A stained cells, were
increased in the colon (P < 0.05), but decreased in the ileum (P < 0.05) of GF compared
to NORM mice (Fig 5A-B). At the level of the duodenum and jejunum, there were no
significant differences between groups.
Plasma Analysis
Plasma gastrointestinal hormone levels were consistently decreased in GF mice
compared to NORM controls. Specifically, GF mice had significantly lower levels of
leptin in both fasted (P<0.001) and re-fed state (P<0.0001) compared to NORM mice,
and re-feeding increased plasma leptin in both GF (P<0.001) and NORM (P<0.0001)
mice (Fig 6A). In both conditions, GF mice displayed decreased circulating PYY
compared to NORM mice (P<0.0001 for both conditions) while re-feeding resulted in

98
increased plasma PYY in both GF and NORM mice (P<0.0001 for both) (Fig 6B).
Ghrelin levels were also significantly lower in GF mice compared to NORM mice
(P<0.0001 for both conditions); however, re-feeding decreased plasma ghrelin in NORM
(P<0.001), but not GF mice (Fig 6C).
During both fasted (P<0.0001) and re-fed (P<0.001) conditions, GF mice had
significantly lowers levels of glucose compared to NORM mice, however, re-feeding
increased glucose levels in GF (P<0.0001), but not NORM mice (Fig 7A). Triglyceride
levels were similar between GF and NORM mice in both conditions (Figure 7B). Total
cholesterol was increased in GF compared to NORM mice in both fasted (P<0.001) and
re-fed (P<0.001) conditions. Additionally, total cholesterol levels were elevated after re-
feeding in both GF (P<0.05) and NORM (P<0.05) mice compared to fasting (Fig 7C).
Consistent with this, HDL levels were significantly higher in GF mice in both conditions
(fasted: P<0.0001; re-fed: P<0.0001) compared to NORM mice. Additionally, plasma
HDL was elevated after re-feeding in both groups of mice (P<0.0001 for both) (Fig 7D).
Discussion
Our present studies demonstrate that GF mice display an increased preference
for a low concentration of intralipid and consume slightly more intralipid than NORM
mice, resulting in increased caloric intake. This increased preference for, and intake of,
intralipid in GF mice is associated with increased expression of lingual CD36 and down-
regulation of intestinal fatty-acid receptors. Furthermore, GF mice have decreased
expression of intestinal satiety peptides CCK, GLP-1, and PYY and lower levels of
circulating leptin, PYY and ghrelin. They also have fewer enteroendocrine cells in the

99
ileum, and more in the colon, but an equal number in the proximal (duodenum, jejunum)
intestine, compared to NORM mice. Finally, GF mice display alterations in plasma
biochemical markers that mimic a fasting state, with increased fat metabolism and
decreased circulating glucose. Together, these results suggest that GF mice have
increased oral but decreased post-oral nutrient detection and satiation signaling,
contributing to increased energy intake, which most likely occurs as a compensatory
mechanism for their decreased energy stores.
Oral and post-oral factors are strong determinants of meal size. For example,
consumption of a HF diet leading to increased fat metabolism in rodents is associated
with increased acceptance of fat [73]. On the other hand, during the fasting state,
lingual sensors for fat detection in the oral cavity are markedly increased [519].
Absence of the gut microbiota in mice results in a dramatic metabolic shift that closely
resembles the fasting state of a normal animal [21]. For example, while body weight is
similar between GF and normal mice, adiposity in GF mice is severely decreased, which
is attributed to significant decreases in liver de novo lipogenesis[22]. Furthermore,
plasma leptin and glucose are also lower in GF mice, an observation similar to that of a
fasted state. These physiological and metabolic changes present in the GF condition
may drive increased fat preference and/or intake observed in the current studies.
Indeed, we found that GF mice prefer a low concentration of intralipid more than NORM
mice while consuming more calories from intralipid at the highest concentration tested.
These findings may be explained by the decreased energy state exhibited by GF mice,
leading to adaptive changes in the lingual epithelium, such as increased CD36. For
example, fasting animals exhibit increased preference of low concentrations of fats and

100
increased caloric intake from fats [163] Furthermore, our result of increased preference
for the low intralipid concentration in GF mice was associated with increased expression
of the fatty-acid translocase, CD36, in the posterior lingual epithelium. Expressed on
the apical portion of sensory taste cells in the circumvallate papillae, CD36 plays a
significant role in detection of LCFAs and acts as a lipid sensor. For example, CD36
KO mice exhibit marked reduction in detection and preference for fats [101].
Additionally, expression of CD36 is elevated during fasting, a physiological state
associated with increased oral sensitivity to fats [162, 519]. Conversely, HF-feeding
and obesity is associated with decreases in lingual CD36 expression [519]. Thus,
increased expression of CD36, leading to increased oral sensitivity to intralipid may be a
secondary effect observed and attributed to chronically depleted energy stores
observed in GF mice. Additionally, while it is unknown if microbiota in the oral cavity
play a role in taste signaling, increased expression of CD36 is most likely independent
of changes in taste cell number. Specifically, we previously found no difference in
expression of α-gustducin, a marker of bitter and sweet taste receptor cells, T1R2, or
T1R3 in the posterior lingual epithelium of GF and control mice [518]. However, despite
the fact that GF mice are more sensitive to the low concentration of intralipid, intralipid is
a nutritive fat source, and GF mice consume more calories from the high concentration
of intralipid, denoting possible alterations in post-oral feedback.
While oral factors influence short-term preference and detection of stimuli, long-
term acceptance and preference is predominantly driven by post-oral nutrient feedback,
in addition to taste associations, which ultimately stimulate further consumption[161].
For example, intestinal infusions of nutrients paired with a flavored non-nutritive solution
101
increases intake of that flavored solution [521]. As well, at higher concentrations of
intralipid, CD36 KO mice display similar intralipid intake as wild type mice, and
preference for nutritive fats is similar to wild type mice after repeated exposures with no
impairments in post-oral conditioning. Thus, because GF mice have decreased energy
stores and consume more of a nutritive solution than NORM counterparts, the
composition and nutritive value of the intralipid, rather than oral factors, may be the
main contributing factors for increased energy intake [101]. Although GF mice remain in
a chronically fasting state, they also display a host of alterations in intestinal morphology
and physiology. Specifically, GF animals have decreased intestinal villus length and
crypth depth, lower rates of intestinal cell differentiation, all of which could contribute to
impaired nutrient absorption [472]. Indeed, this is true of monosaccharide absorption,
which is decreased in GF mice [21], and may be reflective of lower plasma glucose
observed in our study. However, absorption of saturated fatty acids in GF mice is
increased relative to controls [522, 523], which may be partially due to prolonged
intestinal nutrient contact time as intestinal transit time is decreased in GF animals[312].
Finally, GF mice have decreased expression of intestinal CD36, which is predominantly
located on the brush border; however, CD36 KO mice display no alterations in fat
absorption[524]. Therefore, based on these data, it is unlikely that increased caloric
intake in GF mice is due to decreased absorption of fats.
Enteroendocrine cells represent a candidate site of interaction between
regulation of energy homeostasis and microbiota as they are exposed to the intestinal
luminal environment, act as primary chemoreceptors, and respond to GI nutrients by
releasing satiety peptides [525]. Emerging evidence has demonstrated that fatty-acid
102
responsive GPRs located on enteroendocrine cells are responsible for secretion of gut
peptides that control energy intake [91]. Furthermore, metabolic byproducts from the
gut microbiota are thought to interact with some of these GPRs. Interestingly, GF
animals display altered expression of intestinal nutrient receptors and associated
changes in plasma intestinal satiety peptides [312, 482]. In the present study, we found
decreased expression of fatty-acid receptors GPR40, 41, 43, and 120 in the proximal
intestine of GF mice with parallel decreases in intestinal satiety peptide CCK, PYY, and
GLP-1 expression that together may be responsible for increased energy intake in GF
mice. While the majority of CCK is released from the proximal intestine, PYY and GLP-
1 are predominately secreted from the L-cells located in the distal intestine. However, it
has been shown that the duodenum contains enough L-cells that are capable of eliciting
satiation through GLP-1 and PYY release [407]. Furthermore, unlike changes in the
expression of CD36, which are most likely secondary adaptive responses from lack of
intestinal microbial stimulation, down-regulation of intestinal fatty-acid receptors seems
to be a consequence of the lack of microbial stimulation. For example GPRs located on
the luminal portion of enteroendocrine cells come into direct contact with the microbiota,
which secrete nutritive byproducts of fermentation, and may alter nutrient receptor
expression [312]. This is of relevance to our study, since secretion of GLP-1 and PYY
from the proximal intestine is most likely a function of direct luminal nutrient stimulation,
while distally secreted GLP-1 and PYY is thought to be primarily mediated by neural
pathways [407]. It is known that consumption of fat or stimulation of intestinal cell lines
with fatty acids results in release of satiety peptides such as CCK, PYY and GLP-1
through binding to GPR40, 41, 43, and 120. Specifically, short-chain fatty-acids
103
(SCFA)-induced release of PYY is mediated by GPR41 and 43 [312], while GPR40 and
120 mediate CCK and GLP-1 secretion stimulated by medium and long-chain fatty acids,
respectively [91, 93]. Very few studies have examined the relative influence of the gut
microbiota on intestinal satiety peptides and nutrient receptors in the intestine, and no
studies have linked these changes to appetitive responses. For example, Samuel et. al.
found increased GPR41 in the colon of GF mice, which was associated with decreases
in circulating PYY [312]. In our study, we only examined receptor expression in the
proximal intestine and the relative distribution of fatty-acid responsive receptors
throughout the GI tract is unclear. Our immunohistochemical data show no difference in
the EEC number in the proximal intestine between GF and NORM mice. Thus, based
on the broad decreases in the small intestinal GPRs and satiety peptide expression it
appears that absence of microbiota affects intestinal peptide content rather than
enteroendocrine cell numbers.
We also found that circulating levels of leptin, PYY, and ghrelin were all
decreased in GF animals relative to controls. Although we have not assessed whole
body fat composition in this study, carcasses of GF mice were virtually void of fat pads
and we were unable to dissect any quantifiable fat depots from the GF mice. Because
the majority of circulating leptin originates from white adipose tissue and GF mice are
mostly fat depleted [21], decreased circulating leptin in GF mice is reflective of
decreased adiposity. In addition, in a separate study we found that GF mice displayed
drastically reduced fat mass (significantly less epididymal fat pad mass: GF: 0.04 g vs.
NORM: 0.14 g; unpublished) which was very similar to what we qualitatively observed in
the mice from this current study. Our results are consistent with previous published

104
work using GF C57Bl/6J mice. However, as mentioned in the introduction, decreased
adiposity was not observed in GF male adult C3H mice fed a high fat diet [506] which
may be attributed to strain difference and the type of diet used. Thus with a 30%
reduction in circulating leptin observed in our GF mice, a chronic energy deficit may be
the main driving factor for increased caloric intake from intralipid. Similarly, PYY, which
is released mainly from the distal intestine, where the majority of microbiota resides, is
also decreased in GF mice. SCFA are potent stimulators of PYY release [526], thus it is
not surprising that, decreased delivery of SCFA in the distal intestine, due to lack of the
microbiota, results in decreased circulating PYY, similar to that proposed previously.
GF mice also had lower plasma levels of ghrelin compared to controls. As the only
known orexigenic hormone released mainly from the stomach and duodenum, ghrelin is
elevated during fasting and increases food intake and adiposity in rodent models when
administered exogenously [218]. Based on this and given the constant energy deficits
of the GF mice, one would expect increased circulating ghrelin in fasted GF mice. The
reason for this effect is not immediately clear but changes in GI tract morphology, such
as differences in X/A-cell number may be responsible. As expected, intralipid feeding
increased leptin and PYY levels in both GF and NORM mice; however, re-feeding
decreased ghrelin in NORM, but not GF mice, which may be reflective of the chronic
fasting state in these animals.
In addition to changes in satiety hormone levels, we found slight alterations in
circulating biochemical parameters. For example, plasma glucose was decreased in
GF mice relative to NORM controls, an effect predictive of the energy deficits in the GF
model and consistent with previous reports [22, 507]. Equally, we found that the

105
intestinal glycoprotein FIAF, a lipoprotein lipase inhibitor, was significantly upregulated
in GF mice. This is not unexpected, since intestinal microbiota promotes fat storage by
suppressing intestinal expression of FIAF[21] and fasting increases FIAF
expression[504]. However, the role of intestinal FIAF as an inhibitor of lipoprotein lipase
in peripheral tissues of GF mice has been recently disputed [506]. FIAF stimulates
lipolysis, resulting in elevated plasma triglycerides and lipoproteins with subsequent
reduction in fat stores [527]. While we found no differences in total plasma TG levels,
we found increases in plasma cholesterol and HDL in GF mice, consistent with the
physical associations of FIAF with plasma lipoproteins [527]. Recent evidence suggests
that serum TG levels are not altered in GF animals, but decreased LPL activity in this
model has an effect on circulating TG levels [21, 528]. The reasons for the discrepancy
in these findings regarding increased FIAF, yet unaltered plasma TG levels is not
completely clear. While FIAF is indeed an important factor altering LPL activity in
adipose tissue, recently, it has been suggested that intestinal FIAF levels do not
influence circulating FIAF, as GF mice displayed increased intestinal FIAF but no
difference in plasma FIAF compared to CV mice [506]. Furthermore, FIAF is a potent
inhibitor of angiogenesis [529], and the gut microbiota has a profound ability to influence
intestinal angiogenesis [530]. Thus, intestinal FIAF may serve as local contributor to
angiogenesis rather than circulating metabolism. Additionally, cholesterol levels are
typically unaltered or increased in GF rodents relative to controls during standard chow
feeding [22, 528, 531], and decreased during HF-feeding [507]. Interestingly, increased
circulating markers of fat metabolism are associated with increased acceptance of
fat[73], supporting our behavioral findings. Together, these data confirms previous
106
reports that markers of lipid metabolism are dramatically altered in GF animals and are
influenced by energy status and feeding conditions.
In summary, we have shown that GF mice prefer a low concentration of intralipid
more than NORM mice and consume more calories from a high concentration of
intralipid. Increased preference for, and caloric intake of, intralipid was associated with
an increase in lingual CD36 expression and concomitant decrease in intestinal fatty-acid
responsive receptors and satiety peptide content. As well, circulating biochemical
markers indicated a shift toward increased fat metabolism in GF mice, while circulating
satiety hormones signified decreased energy stores. Collectively, these results
demonstrate, for the first time, that in addition to profound effects on energy status of
the animal resulting in a significant loss of adipose stores and subsequent metabolic
changes, the absence of gut microbiota profoundly alters the physiological mechanisms
and molecular substrates responsible for nutrient detection and signaling pathways that
ultimately affect feeding behavior.

107
Figure legends
Fig 1. Preference (A), raw intake (B), and calorie intake from intralipid emulsions (C) in
GF and NORM C57B6/J mice during 48-h two-bottle sucrose vs. water tests. (A) GF
mice preferred the lowest concentration (0.156% oil) of intralipid emulsion tested more
than NORM mice. (B) Intake of intralipid emulsions was similar across all concentrations
tested. (C) GF mice consumed more energy from the highest concentration (1.25% oil)
of intralipid emulsion tested. Data are expressed as means ± SEM. *P<0.05 compared
to NORM
Fig 2. Gene expression of (A) lingual CD36, and protein expression of (B) intestinal
CD36, and (C) intestinal FIAF. (A) GF mice exhibited 3-fold up-regulation of lingual
CD36 mRNA in the posterior lingual epithelium relative to NORM mice. (B) Expression
of intestinal CD36 was down-regulated in GF mice compared to NORM controls. (C)
Intestinal FIAF expression was increased over 3-fold in GF mice relative to NORM mice
Data are expressed as means ± SEM. *P<0.05 compared to NORM, **P<0.01,
***P<0.001
Fig 3. Intestinal epithelial protein expression of fatty-acid responsive receptors in GF
and NORM mice. GF mice displayed down-regulation of proximal intestinal GPR40, 41,
43, and 120 relative to NORM mice. Data are expressed as means ± SEM. *P<0.05
compared to NORM mice, ***P<0.001.

108
Fig 4. Intestinal epithelial protein expression of satiety peptide in GF and NORM mice.
Data are expressed as means ± SEM. GF mice exhibited down-regulation of proximal
intestinal CCK, GLP-1 and PYY relative to NORM mice.**P<0.01 compared to NORM
mice, ***P<0.001.
Fig 5. (A) Cell counts of enteroendocrine cells expressing chromogrannin-A and (B)
representative microphotographs of ileum and colon sections at 100X magnification.
GF mice had less enteroendocrine cells in the ileum, but more in the colon compared to
NORM controls. Data are expressed as means ± SEM. *P<0.05 compared to NORM
mice.
Fig 6. Plasma levels of (A) leptin, (B) ghrelin, and (C) PYY in GF and NORM mice
following an overnight fast or refeeding with 1-ml of 20% intralipid. (A) Plasma leptin
was lower in GF mice relative to NORM controls. Refeeding elevated plasma leptin in
both groups. (B) GF mice displayed lower levels of plasma PYY compared to NORM
mice. Refeeding increased plasma PYY in both groups. (C) GF mice exhibited lower
circulating ghrelin in both conditions. Refeeding increased plasma ghrelin in NORM, but
not GF mice. Data are expressed as means ± SEM. **P<0.01 compared to NORM
mice, ***P<0.001. ††P<0.01 compared to fasting condition within group, ††† P<0.001.
Fig 7. Plasma levels of (A) glucose, (B) cholesterol, (C) total triglycerides, and (D) HDL
in GF and NORM mice following an overnight fast or refeeding with 1-ml of 20%
intralipid. (A) Plasma glucose levels of GF mice were lower than NORM controls and

109
refeeding increased glucose levels in GF, but not NORM mice. (B) Plasma
triglycerides were similar between both groups and both feeding conditions. (C) Plasma
total cholesterol was increased in GF mice relative to NORM controls and refeeding
increased cholesterol levels in both NORM and GF mice. Total plasma HDL was
increased in GF mice relative to NORM mice with refeeding increasing total HDL in both
groups. Data are expressed as means ± SEM. **P<0.01 compared to NORM mice,
***P<0.001. †P<0.05 compared to fasting condition within group, †† P<0.01.

110
References
1. Wang YC, McPherson K, Marsh T, Gortmaker SL, Brown M (2011) Health and
economic burden of the projected obesity trends in the USA and the UK. Lancet 378:
815-825.
2. Mindell S, Smith GP, Greenberg D (1990) Corn oil and mineral oil stimulate sham
feeding in rats. Physiol Behav 48: 283-287.
3. Lucas F, Sclafani A (1996) The composition of the maintenance diet alters flavor-
preference conditioning by intragastric fat infusions in rats. Physiol Behav 60: 1151-
1157.
4. Sclafani A, Glendinning JI (2005) Sugar and fat conditioned flavor preferences in
C57BL/6J and 129 mice: oral and postoral interactions. Am J Physiol Regul Integr
Comp Physiol 289: R712-720.
5. Reed DR, Tordoff MG, Friedman MI (1991) Enhanced acceptance and metabolism of
fats by rats fed a HF diet. Am J Physiol 261: R1084-1088.
6. Backhed F, Ding H, Wang T, Hooper LV, Koh GY, et al. (2004) The gut microbiota as
an environmental factor that regulates fat storage. Proc Natl Acad Sci U S A 101:
15718-15723.
7. Backhed F, Manchester JK, Semenkovich CF, Gordon JI (2007) Mechanisms
underlying the resistance to diet-induced obesity in germ-free mice. Proc Natl Acad
Sci U S A 104: 979-984.
8. Rabot S, Membrez M, Bruneau A, Gerard P, Harach T, et al. (2010) Germ-free
C57BL/6J mice are resistant to HF-diet-induced insulin resistance and have altered
cholesterol metabolism. FASEB J.
9. Fleissner CK, Huebel N, Abd El-Bary MM, Loh G, Klaus S, et al. (2010) Absence of
intestinal microbiota does not protect mice from diet-induced obesity. Br J Nutr 104:
919-929.
10. Swartz TD, Duca FA, de Wouters T, Sakar Y, Covasa M (2011) Up-regulation of
intestinal type 1 taste receptor 3 and sodium glucose luminal transporter-1
expression and increased sucrose intake in mice lacking gut microbiota. Br J Nutr: 1-
10.

111
11. Samuel BS, Shaito A, Motoike T, Rey FE, Backhed F, et al. (2008) Effects of the gut
microbiota on host adiposity are modulated by the short-chain fatty-acid binding G
protein-coupled receptor, Gpr41. Proc Natl Acad Sci U S A 105: 16767-16772.
12. Tanaka T, Katsuma S, Adachi T, Koshimizu TA, Hirasawa A, et al. (2008) Free fatty
acids induce cholecystokinin secretion through GPR120. Naunyn Schmiedebergs
Arch Pharmacol 377: 523-527.
13. Hirasawa A, Tsumaya K, Awaji T, Katsuma S, Adachi T, et al. (2005) Free fatty
acids regulate gut incretin glucagon-like peptide-1 secretion through GPR120. Nat
Med 11: 90-94.
14. Delzenne NM, Cani PD, Daubioul C, Neyrinck AM (2005) Impact of inulin and
oligofructose on gastrointestinal peptides. Br J Nutr 93 Suppl 1: S157-161.
15. Sclafani A, Ackroff K, Abumrad NA (2007) CD36 gene deletion reduces fat
preference and intake but not post-oral fat conditioning in mice. Am J Physiol Regul
Integr Comp Physiol 293: R1823-1832.
16. Martin C, Passilly-Degrace P, Gaillard D, Merlin JF, Chevrot M, et al. The lipid-
sensor candidates CD36 and GPR120 are differentially regulated by dietary lipids in
mouse taste buds: impact on spontaneous fat preference. PLoS One 6: e24014.
17. Zhang XJ, Zhou LH, Ban X, Liu DX, Jiang W, et al. (2011) Decreased expression of
CD36 in circumvallate taste buds of HF diet induced obese rats. Acta Histochem
113: 663-667.
18. Martin C, Passilly-Degrace P, Gaillard D, Merlin JF, Chevrot M, et al. (2011) The
lipid-sensor candidates CD36 and GPR120 are differentially regulated by dietary
lipids in mouse taste buds: impact on spontaneous fat preference. PLoS One 6:
e24014.
19. Swartz TD, Hajnal A, Covasa M (2010) Altered orosensory sensitivity to oils in CCK-
1 receptor deficient rats. Physiol Behav 99: 109-117.
20. Glendinning JI, Beltran F, Benton L, Cheng S, Gieseke J, et al. (2010) Taste does
not determine daily intake of dilute sugar solutions in mice. Am J Physiol Regul
Integr Comp Physiol 299: R1333-1341.
21. Ackroff K, Sclafani A (1991) Flavor preferences conditioned by sugars: rats learn to
prefer glucose over fructose. Physiol Behav 50: 815-824.

112
22. Cherbuy C, Honvo-Houeto E, Bruneau A, Bridonneau C, Mayeur C, et al. (2010)
Microbiota matures colonic epithelium through a coordinated induction of cell cycle-
related proteins in gnotobiotic rat. Am J Physiol Gastrointest Liver Physiol 299:
G348-357.
23. Demarne Y, Corring T, Pihet A, Sacquet E (1982) Fat absorption in germ-free and
conventional rats artificially deprived of bile secretion. Gut 23: 49-57.
24. Demarne Y, Sacquet E, Garnier H (1972) [Gastrointestinal flora and fat digestion in
monogastrics]. Ann Biol Anim Biochim Biophys 12: 509-524.
25. Goudriaan JR, Dahlmans VE, Febbraio M, Teusink B, Romijn JA, et al. (2002)
Intestinal lipid absorption is not affected in CD36 deficient mice. Mol Cell Biochem
239: 199-202.
26. Engelstoft MS, Egerod KL, Holst B, Schwartz TW (2008) A gut feeling for obesity:
7TM sensors on enteroendocrine cells. Cell Metab 8: 447-449.
27. Liou AP, Lu X, Sei Y, Zhao X, Pechhold S, et al. (2011) The G-protein-coupled
receptor GPR40 directly mediates long-chain fatty acid-induced secretion of
cholecystokinin. Gastroenterology 140: 903-912.
28. Goodlad RA, Ratcliffe B, Fordham JP, Ghatei MA, Domin J, et al. (1989) Plasma
enteroglucagon, gastrin and peptide YY in conventional and germ-free rats refed
with a fibre-free or fibre-supplemented diet. Q J Exp Physiol 74: 437-442.
29. Theodorakis MJ, Carlson O, Michopoulos S, Doyle ME, Juhaszova M, et al. (2006)
Human duodenal enteroendocrine cells: source of both incretin peptides, GLP-1 and
GIP. Am J Physiol Endocrinol Metab 290: E550-559.
30. Cherbut C, Ferrier L, Roze C, Anini Y, Blottiere H, et al. (1998) Short-chain fatty
acids modify colonic motility through nerves and polypeptide YY release in the rat.
Am J Physiol 275: G1415-1422.
31. Tschop M, Smiley DL, Heiman ML (2000) Ghrelin induces adiposity in rodents.
Nature 407: 908-913.
32. Kersten S, Mandard S, Tan NS, Escher P, Metzger D, et al. (2000) Characterization
of the fasting-induced adipose factor FIAF, a novel peroxisome proliferator-activated
receptor target gene. J Biol Chem 275: 28488-28493.

113
33. Mandard S, Zandbergen F, van Straten E, Wahli W, Kuipers F, et al. (2006) The
fasting-induced adipose factor/angiopoietin-like protein 4 is physically associated
with lipoproteins and governs plasma lipid levels and adiposity. J Biol Chem 281:
934-944.
34. Velagapudi VR, Hezaveh R, Reigstad CS, Gopalacharyulu P, Yetukuri L, et al.
(2011) The gut microbiota modulates host energy and lipid metabolism in mice. J
Lipid Res 51: 1101-1112.
35. Le Jan S, Amy C, Cazes A, Monnot C, Lamande N, et al. (2003) Angiopoietin-like 4
is a proangiogenic factor produced during ischemia and in conventional renal cell
carcinoma. Am J Pathol 162: 1521-1528.
36. Stappenbeck TS, Hooper LV, Gordon JI (2002) Developmental regulation of
intestinal angiogenesis by indigenous microbes via Paneth cells. Proc Natl Acad Sci
U S A 99: 15451-15455.
37. Wostmann BS, Kan DF (1964) The Cholesterol-Lowering Effect of Commercial Diet
Fed to Germfree and Conventional Rats. J Nutr 84: 277-282.

114
Figure 1
0.156 0.313 0.626 1.25050
60
70
80
90
100
NORMGF
*
Pref
eren
ce (%
)
0.156 0.323 0.626 1.2500
10
20
30
40
Emul
sion
inta
ke (
ml)
0.156 0.323 0.626 1.2500.0
0.5
1.0
1.5
2.0
2.5
*
Ener
gy in
take
from
oil
(kca
l)A
B
C

115
Figure 2
NORM GF0
1
2
3
4 *
Rel
ativ
e to
NO
RM
mic
e
NORM GF0.0
0.5
1.0
1.5
**
Rel
ativ
e to
NO
RM
mic
e
NORM GF0
1
2
3
4
5
***
Rel
ativ
e to
NO
RM
mic
eA
B
C

116
Figure 3
GPR40
NORM GF0.0
0.5
1.0
1.5
***
Rel
ativ
e to
NO
RM
mic
e
GPR41
NORM GF0.0
0.5
1.0
1.5
***
Rel
ativ
e to
NO
RM
mic
e
GPR43
NORM GF0.0
0.5
1.0
1.5
*
Rel
ativ
e to
NO
RM
mic
e
GPR120
NORM GF0.0
0.5
1.0
1.5
***
Rel
ativ
e to
NO
RM
mic
e

117
Figure 4
CCK
NORM GF0.0
0.5
1.0
1.5
***
Rel
ativ
e to
NO
RM
mic
e
GLP-1
NORM GF0.0
0.5
1.0
1.5
**
Rel
ativ
e to
NO
RM
mic
e
PYY
NORM GF0.0
0.5
1.0
1.5
**
Rel
ativ
e to
NO
RM
mic
e
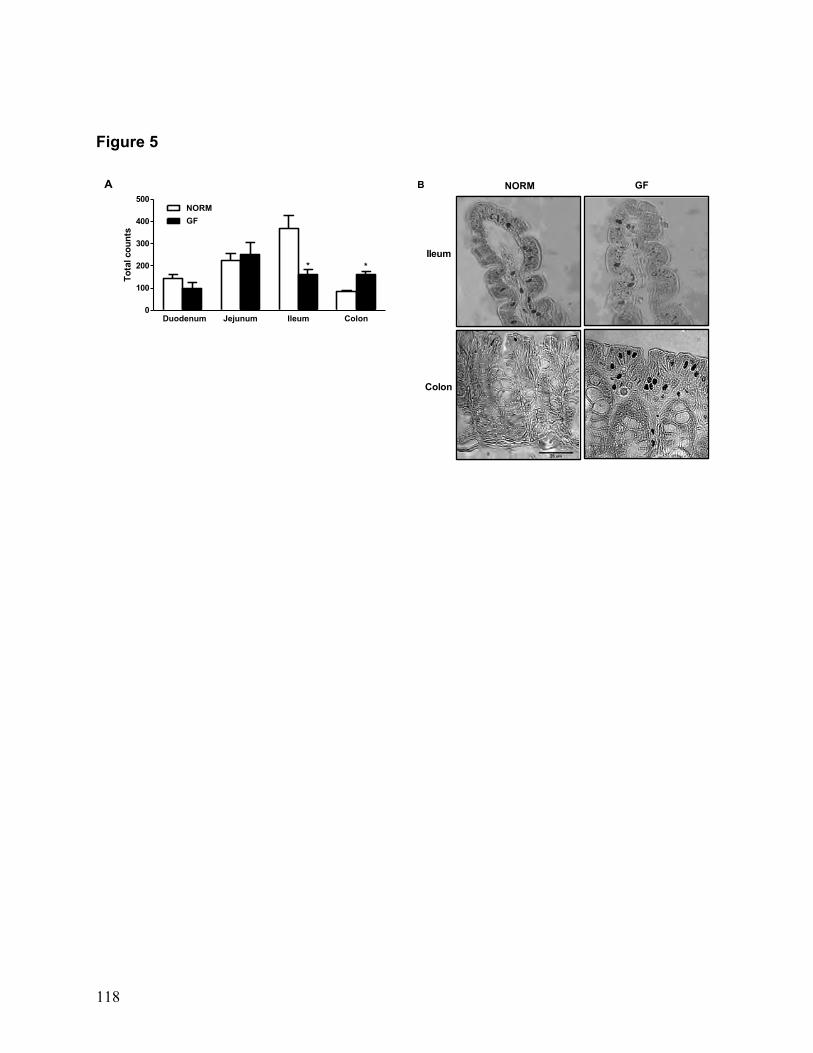
118
Figure 5
Duodenum Jejunum Ileum Colon0
100
200
300
400
500NORMGF
* *
Tota
l cou
nts
NORM GF
Ileum
Colon
A B

119
Figure 6
NORM GF NORM IL GF IL0.0
0.5
1.0
1.5
**
***
†††
†††
Lept
in n
g/m
L
NORM GF NORM IL GF IL0
20
40
60
80
100
******
†††
†††
PYY
pg/m
L
NORM GF NORM IL GF IL0
50
100
150
******
††
Ghr
elin
pg/
mL
A B
C

120
Figure 7
NORM GF NORM IL GF IL0
2
4
6
8
**
***
†††
Glu
cose
mm
ol/L
NORM GF NORM IL GF IL0.0
0.5
1.0
1.5
Trig
lyce
rides
mm
ol/L
NORM GF NORM IL GF IL0.0
0.5
1.0
1.5
2.0
2.5
****
†
†
Cho
lest
erol
mm
ol/L
NORM GF NORM IL GF IL0.0
0.5
1.0
1.5
***
***†††
HD
L m
mol
/L
A B
DC

121
3.3 Specific Aim 2: Summary of results and conclusions
The present study demonstrated that GF mice display increased preference of a lower
concentration of intralipid while consuming more of a higher concentration. As well, we
also found increases in intestinal FIAF, a marker of fasting, in GF mice, with decreases
in circulating levels of the adipocyte hormone leptin, which is highly correlated with
adiposity [532]. The finding of increased preference of a low intralipid concentration in
these animals is thought to be due to increased lingual CD36, which allows for better
detection of oral fats. The increased intake of more energy dense intralipid emulsions;
however, is thought to be due to decreased intestinal expression of fatty acid receptors
and intestinal satiety peptides. Increased lingual CD36 in our current study is not
surprising as GF mice display significantly decreased energy stores [21, 22], and
expression of lingual CD36 is highly correlated with feeding states [163]. For example,
fasting leads to increases in CD36 expression [163] while obesity is associated with
decreased lingual CD36 [520]. The decrease in intestinal fatty acid receptors is most
likely due to the exhibited fasting state of these animals. As such, mice lacking CD36
are less sensitive to intestinal infusions of fat [303], and by expressing less intestinal
CD36, GF mice are most likely less sensitive to intestinal fats. This is not associated
with decreased intestinal fat absorption; however, as CD36 KO mice do not display
steatorrhea [297, 533]. Furthermore, decreases in intestinal CD36 lead to decreased
chylomicron formation [533], which is a critical process in intestinal fat satiation [295].
Finally, the decreased intestinal satiety peptides and secretion, which may be due to
CD36 via chylomicron formation, may also be due to decreases in intestinal GPRs,
which are largely responsible for their secretion. As intestinal satiety peptides often

122
serve to control food intake, decreased levels of these peptides would allow for GF mice
to consume more fat. Thus, collectively, these data demonstrate that GF mice display
an energy state mimicking fasting, which leads to increased oral CD36 that is
associated with increased fat preference and decreased intestinal fat receptors that
could contribute to decreased intestinal satiety peptide levels and increased energy
intake from fats.

123
4 Specific Aim 3: How gut microbiota affects host liver, intestinal, and
adipose metabolic parameters in a GF rat model
4.1 Introduction
The results from Chapter 2 and 3 collectively demonstrated that the absence of gut
microbiota in C57Bl/6J mice results in alterations in feeding behavior, impaired intestinal
nutrient detection, and is associated with changed in expression and secretion of gut
peptides relative to NORM controls. Previous studies using a GF mouse model have
found that the GF state is characterized by decreased body adiposity, increased hepatic
lipolysis, and protection from HF diet-induced obesity [22]. These results were
predominantly attributed to increases in intestinal FIAF as GF-derived FIAF KO animals
exhibit similar adiposity levels as CV controls [21, 22]. Despite this landmark finding, a
more recent finding has demonstrated that in a C3N mouse model, GF mice exhibit
increases in intestinal FIAF yet similar or decreased adiposity levels [506]. Therefore,
the effect of the GF status on adiposity may be specific to the mouse strain used.
Furthermore, it is unclear whether the lack of gut microbiota produces similar effects in
the GF rat model as in the C57Bl/6J mouse. Therefore, the focus of this study was to
examine whether the absence of a gut microbiota in the Fisher 344 (F344) rat is
associated with behavioral, phenotypic and metabolic changes similar to those reported
in the mouse model.

124
4.2 Absence of gut microbiota is not protective of fat deposition in the GF
F344 rat model
Introduction
Studies comparing germ-free (GF) animals, devoid of gut microbiota, and conventional
(NORM) animals, which have an intact microbiota, have revealed a wealth of
information on the microbiota and how it affects physiology, endocrinology, and
metabolism of the host it inhabits. Recently, the gut microbiota of the distal
gastrointestinal tract has been identified as a possible factor influencing energy intake
and obesity. For example, when GF mice receive microbiota from a lean donor, a term
referred to as “conventionalization,” the animals rapidly increase body adiposity, with
little change in body weight while maintained on chow. Interestingly, while mice
increase adipose deposition after conventionalization, they reduce caloric intake, which
can be partially attributed to the increased absorption of energy from byproducts of
microbial fermentation in the distal GI tract [21]. These results are further extended to a
western diet, when GF mice are protected from HF diet induced obesity relative to
NORM controls [22]. Additionally, while receiving microbiota from a lean donor results
in increased adiposity, further increases are noted in animals conventionalized from
genetically obese or dietary-induced obese animals [22, 508, 510].
Currently, there are multiple alterations including morphological, physiological,
endocrine, and metabolic factors that are thought to contribute to the increased
adiposity and altered feeding behavior seen in GF animals compared to NORM animals.
For example, the GF status is characterized by marked shortening of the intestinal villus
and decreases in crypt depth relative to controls [472]. Furthermore, expression of

125
nutrient receptors and transporters is markedly altered throughout the gastrointestinal
tract [312], which may be a primary effect due to lack of microbial stimulation or
secondary to alterations in intestinal morphology or an energy state similar to that of
fasting. As well, proximal intestine glucose absorption is decreased in GF mice [21],
which may attribute to the observed increases in liver lipolysis [22]. Intestinal transit
time has also been observed to be decreased in GF mice, due primarily to decreases in
gastric emptying, resulting from decreased secretion of the intestinal satiety peptide
PYY [312] as well as decreased proximal intestine CCK, GLP-1, and PYY. However,
more recently, decreased adiposity in the GF mouse has been primarily attributed to
decreased hepatic lipogenesis.
The GF state is characterized by increased fatty acid oxidation and inhibition of
lipogenesis due to the chronically low levels of adiposity observed in these animals [21,
22, 507, 508]. The main mechanism of decreased lipogenesis, is thought to be through
fasting-induced adipocyte factor (fiaf), an inhibitor of lipoprotein lipase (LPL) that is
produced in the intestinal epithelium [21, 22]. As such, GF mice express increased fiaf
in the intestine, but not liver or adipose, and fiaf knock-out (KO) mice express
significantly lower adipose LPL, and decreased liver de novo lipogenesis [21, 22].
Furthermore, while GF mice are resistant to obesity, GF fiaf KO mice are not resistant to
ensuing obesity, demonstrating a critical role for fiaf in energy balance [21]. Despite this
wealth of data, more recently, Fleissner et al found that GF mice are not resistant to
diet-induced obesity, and exhibit increased adipose deposition, yet up-regulated
intestinal fiaf, an effect attributed to diet [506]. Whether the altered metabolism
observed in the GF mouse model extends to other species, commonly used to examine

126
feeding behavior, is relatively unclear. Similar to mice, GF rats maintain similar body
weights as control animals, and exhibit increased food and water intake, which is
thought to occur due to decreased energy extraction from the diet in GF rats [467].
Therefore, it is possible that due to decreased energy extraction from the gut microbiota,
and associated morphological changes, GF rats maintain lower levels of adiposity
relative to NORM controls. Thus, to better determine the contribution of gut microbiota
on influencing peripheral metabolism and adiposity in rats, we examined adiposity in the
GF Fisher F344 rat during standard rodent chow feeding with associated alterations in
fiaf expression as well as markers of hepatic and adipose lipogenesis and adipogenesis.
Methods
Subjects
Throughout all experiments, adult male GF F344 rats from our local germ-free facility
(ANAXEM, Jouy-en-Josas, FRANCE) and NORM F344 rats (Charles River,
L’Arboseilles, FRANCE) were used. All rats were housed in polycarbonate cages with
cedar bedding, except where noted otherwise and placed in Trexler-type isolators
(Igenia, FRANCE). Rats were given ad libitum access to sterlized standard rodent chow
(SAFE diets, Belgium) and sterile deionized water throughout experiments.
Body weight and food intake
Adult male rats (n = 5 NORM, 5 GF) were placed in polycarbonate cages with stainless
steel metal bottoms to allow for accurate food spillage collection, one week prior to food
intake measurements. After acclimation, 24-h food intake was measured for 5

127
consecutive days, accounting for spillage. Body weights of rats were also recorded
every day for five days after which rats were switched back to cedar bedding.
Terminal tissue collection
Three separate groups of naïve rats (Group 1: n = 10 NORM, 10 GF; Group 2: n = 15
NORM, 15 GF; Group 3: n = 6 NORM, 6 GF) were used to measure relative epididymal
fat pad mass in NORM and GF rats. Rats from Group 3 in the adiposity measurements
were subsequently used to examine expression of intestinal glucose transporters and
markers of peripheral metabolism. Rats were decapitated and fresh trunk blood
collected in EDTA-coated tubes and the proximal intestine comprising both the
duodenum and jejunum was excised and placed into physiological saline for the
isolation of intestinal epithelial cells as described previously. Briefly, after excision,
proximal intestines were flushed using 10 ml of ambient physiological saline, everted
and divided into three segments, and placed into oxygenated Ca+2, Mg+2-free Krebs-
Heinslet buffer with EDTA and DTT. Flasks containing sections were placed in a 37oC
water bath and shaken for 20 minutes to dissociate epithelial cells from the connective
tissue. The suspension was collected, centrifuged and washed with Dulbecco’s
Phosphate Buffered-Saline (DPBS, Lonza). Afterwards, cell extract aliquots were snap
frozen and stored at -80oC until further analysis. Samples from liver were taken and
snap frozen until further analysis. Epididymal, retroperitoneal, and visceral adipose
tissue were excised and weighed, and samples of epididymal fat pads were snap frozen
for analysis. The remainder of the epididymal fat pad was post-fixed in
paraformaldehyde, embedded in paraffin, and 4-µm sections were stained with

128
hematoxylin and eosin. Adipocyte size was measured in at least 150 rat and analyzed
using NIS Elements (Nikon).
qRT-PCR
Intestinal epithelial cells, adipose tissue, and liver tissues were lysed and homogenized
with a rotor homogenizer and RNA extracted using TRiZol (Invitrogen). Resulting RNA
was quantified with a Nanodrop (Thermo Scientific) and for all tissues, 10 µg of RNA
was reverse transcribed into 100 µl cDNA using the high capacity cDNA kit (Applied
Biosystem, Courtabeouf, FRANCE). Subsequent cDNA for all samples was diluted 5-
fold and used for qRT-PCR using taqman gene expression master mix and inventoried
taqman gene expression assays (Table 1) in an ABI Prism.
Western Blotting
Liver samples used for western blotting were homogenized in Radio Immuno
Precipitation Assay (RIPA) buffer containing protease inhibitors (Sigma) using a rotor
homogenizer. The resulting homogenate was centrifuged for 20 min at 13,000 RPM at
4oC, the supernatant was transferred, and protein quantified using a nanodrop system
(Thermo Scientific). Solubilized liver proteins (50 - 100 µg) were run on 8% acrylamide
SDS-PAGE gels and transferred to nitrocellulose membranes, and probed with anti-
bodies for ACC, ACC-P, AMPK, and AMPK-P (Santa Cruz Biotechnologies). Immune
complexes were detected by chemiluminescence (GE Healthcare). Quantification was
performed by densitometric analysis using ImageJ (NIH, Bethesda, MD, USA) and

129
ACC-P and AMPK-P were normalized to ACC and AMPK (Santa Cruz Biotechnology)
as internal controls, respectively.
Adipocyte morphology
Epididymal fat pads were post-fixed in 4% paraformaldehyde overnight and then
transferred to 75% ethanol. Subsequently, fat pads were impeded in paraffin and
sectioned at 4 µm, and hematoxylin and eosin stained. Microphotographs of adipocytes
were captured at 10X magnification, converted to binary using photoshop, and
adipocyte surface area was measured in at least 150 adipocytes for each animal (n = 6
animals for each group) using NSI Elements (Nikon).
Statistical analysis
All values are expressed as mean ± SEM and statistical analyses performed using
GraphPad™ Prism (version 5.0, San Diego, CA). Average 5-d body weight and food
intake of GF and NORM rats was analyzed by one-way (type) analysis of variance
(ANOVA). Body weights, adiposity, plasma biochemical analyses, and gene and
protein expression of intestinal, liver and adipose tissues were analyzed using unpaired
student’s t-tests with Welch’s correction for unequal variance where appropriate.
Adipocyte surface area measurements were analyzed by one-way (type) repeated
measures ANOVA.
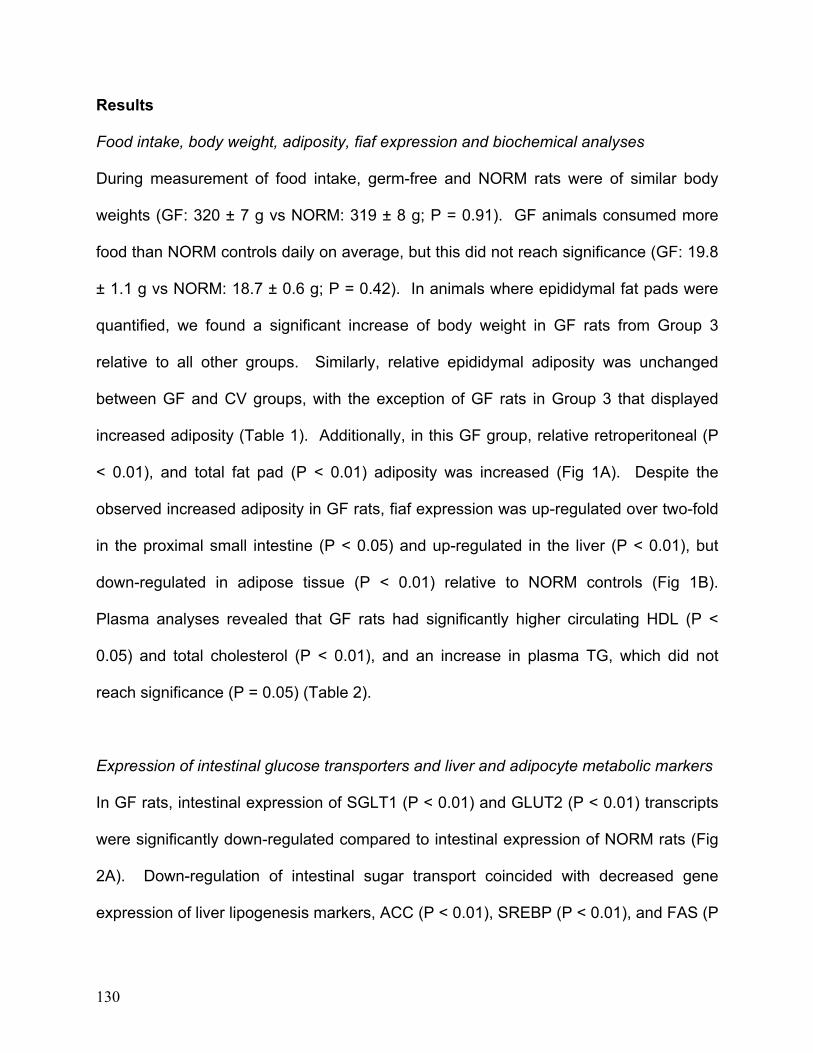
130
Results
Food intake, body weight, adiposity, fiaf expression and biochemical analyses
During measurement of food intake, germ-free and NORM rats were of similar body
weights (GF: 320 ± 7 g vs NORM: 319 ± 8 g; P = 0.91). GF animals consumed more
food than NORM controls daily on average, but this did not reach significance (GF: 19.8
± 1.1 g vs NORM: 18.7 ± 0.6 g; P = 0.42). In animals where epididymal fat pads were
quantified, we found a significant increase of body weight in GF rats from Group 3
relative to all other groups. Similarly, relative epididymal adiposity was unchanged
between GF and CV groups, with the exception of GF rats in Group 3 that displayed
increased adiposity (Table 1). Additionally, in this GF group, relative retroperitoneal (P
< 0.01), and total fat pad (P < 0.01) adiposity was increased (Fig 1A). Despite the
observed increased adiposity in GF rats, fiaf expression was up-regulated over two-fold
in the proximal small intestine (P < 0.05) and up-regulated in the liver (P < 0.01), but
down-regulated in adipose tissue (P < 0.01) relative to NORM controls (Fig 1B).
Plasma analyses revealed that GF rats had significantly higher circulating HDL (P <
0.05) and total cholesterol (P < 0.01), and an increase in plasma TG, which did not
reach significance (P = 0.05) (Table 2).
Expression of intestinal glucose transporters and liver and adipocyte metabolic markers
In GF rats, intestinal expression of SGLT1 (P < 0.01) and GLUT2 (P < 0.01) transcripts
were significantly down-regulated compared to intestinal expression of NORM rats (Fig
2A). Down-regulation of intestinal sugar transport coincided with decreased gene
expression of liver lipogenesis markers, ACC (P < 0.01), SREBP (P < 0.01), and FAS (P

131
< 0.0001) relative to NORM rats as well (Fig 2B). Although GF mice expressing less
total AMPK in the liver relative to NORM controls (P < 0.05), protein expression of
phosphorylated AMPK (P < 0.05) was increased in GF rats compared to NORM controls,
with an increase in phosphorylated ACC as well, which did not reach significance (P =
0.17) (Fig 2C). Analysis of adipocyte expression of adipogenesis markers revealed
decreases in LPL (P < 0.01), PPAR-γ (P < 0.01), and aBP2 (P < 0.01) (Fig 3A);
however, there were increases in expression of lipogenic enzymes ACC (P < 0.05) and
FAS (P < 0.01) in GF rats’ epididymal fat pads.
Adipose morphology
Increases in lipogenic enzyme expression was associated with observed increases in
adipocyte surface area in GF rats relative to NORM controls, but this did not reach
statistical significance (P = 0.05).
Discussion
In our current study, we have shown that in the F344 rat, the absence of the gut
microbiota is not a major factor preventing adipose deposition. While food intake was
similar in GF and NORM rats, relative adiposity of GF rats was relatively unchanged,
and in one group, adiposity was increased compared to NORM rats. Despite increased
adiposity in this group, these animals displayed increased intestinal fiaf. Furthermore,
while expression of proximal intestine glucose transporters and markers of lipogenesis
in the liver was decreased, adipocyte lipogenesis markers were increased. Finally, the
increased lipogenesis in adipocytes of GF rats was associated with modest increases in

132
adipocyte size. Together, these changes suggest that lack of the microbiota, which
leads to a decreased energy state in the intestine and liver, and decreased hepatic de
novo lipogenesis in the rat, is not a factor in the protection from adiposity deposition in
this model. Furthermore, lack of microbiota results in increases in anabolic pathways in
adipose tissue of F344 rats, which may account for the relative difference of adiposity in
this model compared to GF mice models.
The GF status generally is associated with extremely low levels of adiposity and
decreased extraction of energy from the diet, due to lack of microbial fermentation in the
distal intestine. For example, Backhed et al. demonstrated that despite similar body
weights, GF mice are significantly leaner than NORM mice and consume more food
over 24-h, with increased energy in the feces [21]. Additionally, when placed on a HF
diet, GF mice increase adiposity relative to chow feeding, but remain significantly leaner
than NORM animals fed either a chow or HF diet [22]. In our current findings, we have
demonstrated that GF and NORM rats have no differences in 24-h food intake when
animals were of similar body weights and similar adiposity. However, in a second group
of animals, GF rats weighed more than NORM controls, and exhibited increased
adiposity relative to body weight. While GF rats in this group displayed general
increases in adiposity, they still expressed increased intestinal and liver fiaf, which has
been a suggested factor in preventing obesity in GF mice [21, 22]. Similar to our
current findings, Fleissman et al reported that while GF mice exhibited increased
intestinal fiaf, the maintained increased levels of adiposity and were not resistant to HF
diet induced obesity [506]. Furthermore, GF mice in their study did not exhibit increases
in plasma fiaf, suggesting that intestinal fiaf may not have a role in circulating

133
metabolism, but rather intestinal angiogenesis. As such, intestinal fiaf may be elevated
in GF animals due to the lack of intestinal cell differentiation observed in this model
[472]. While we did not measure plasma fiaf, thus being unable to exclude whether
intestinal fiaf in our study had a role in circulating metabolism, we observed increases in
liver fiaf, yet decreases in adipocyte fiaf. Previous reports demonstrate liver and
adipocyte fiaf are largely unchanged, or slightly increased in GF animals [21].
Nevertheless, circulating biochemical markers show that increases in fiaf expression as
well as the GF state during standard chow feeding are highly associated with increases
in circulating triglycerides and cholesterol [21, 22, 534], which we found in our study.
Reflective of the fasting state typically observed in GF mice, blood glucose is also
decreased, which is similar to our current findings. This could also be due to a
decrease in glucose absorption, as found previously [21]. Thus, while intestinal fiaf may
be important in metabolism regulation of GF mice, delivery of intestinal sugars to the
liver may be the primary factor influencing this metabolic state. For example, decreased
glucose delivery to the liver via intestinal absorption can shift liver metabolism towards
catabolic pathways [535]. Additionally, the finding that the absence of glucose in an
obesigenic diet results in normalized adiposity of GF animals suggests that the inability
to absorb dietary sugars is important in influencing GF mice adiposity levels.
Nutrients absorbed from the intestine are sent through the portal vein for
metabolism in the liver. Thus, decreases in extraction of energy from the diet,
predominantly due to decreased absorption of SCFAs and sugars in the intestine may
be one cause of the decreased liver lipogenesis in GF animals. To examine if the
increased liver fiaf, which may be reflective of a negative energy state in the liver was

134
associated with changes in proximal intestine nutrient absorption, we measured
transcript expression of SGLT1 and GLUT2, the two major transporters responsible for
glucose absorption. We found that both proximal intestine SGLT1 and GLUT2 were
decreased in GF rats, which was associated with slight decreases in plasma glucose
levels, all of which would contribute to decreasing liver lipogenesis. This is in
accordance with previous data demonstrating decreased intestinal absorption of
glucose in GF mice. Together with increased intestinal fiaf expression, decreased
expression of proximal intestine glucose transporters leading to decreased glucose
absorption may be another reason for the decreases in liver lipogenesis observed in the
GF model.
When we examined makers of liver lipogenesis, we found, expression of two
important regulators of de novo fatty acid synthesis, ACC and FAS, were down-
regulated in the liver of GF rats signifying that the GF status in rats is associated with
this previously observed phenomenon in mice. Furthermore, expression of SREBP, a
key transcription factor of glucose-induced hepatocyte lipogenesis and activator of ACC
and FAS, was decreased in GF rats. Thus, from our study, it appears that the observed
down-regulation of ACC and FAS expression in the liver may be through a SREBP-
dependent mechanism. To further assess the energy status in the liver of GF animals,
we examined protein expression of hepatic phosphorylated AMPK and ACC. AMP-
activated protein kinase reflects cellular energy stores and the activation of AMPK
through phosphorylation is dependent upon factors that signal decreased energy status
[535]. In a fasting state, P-AMPK increases the generation of ATP through catabolic
pathways, which is predominantly through inhibition of lipogenesis and stimulation of β-

135
oxidation. The mechanism responsible for inhibition of lipogenesis, and thus increased
β-oxidation is the phosphorylation of the lipogenic enzyme, ACC, by P-AMPK which
leads to its inactivation. We found that protein expression of P-AMPK and P-ACC was
up-regulated in liver of GF rats, which may denote increased β-oxidation of the liver,
and thus, decreased lipogenesis. Together, these data suggest that the GF status is
indeed associated with decreased makers de novo lipogenesis, which are, surprisingly,
independent of adiposity in this group of animals. Despite these findings, it is plausible
that increased expression of local factors in adipocytes, and downstream of the
decreased adipocyte fiaf observed, which are responsible for adipogenesis and
lipogenesis may be one reason for the observed increase in adiposity observed in the
GF rat.
Changes in adiposity are reflective of adipocyte hyperplasia or hypertrophy,
which are due to increased adipogenesis and lipogenesis, respectively. For this reason,
we examined the transcript expression of adipogenic factors PPAR-γ and ABP2 as well
as key enzymes of fatty acid synthesis, ACC, FAS, and LPL, in the epididymal fat pads
of GF and NORM rats. Peroxisome proliferator activated receptor is a nuclear
transcription receptor that is a key regulator of adipogenesis via proteins such as ABP2
[536]. In general, we found that GF rats displayed increases in adipocyte lipogenesis
markers yet decreased markers of adipogenesis. For example GF rats displayed
decreased expression of PPAR and ABP2. Conversely, expression of ACC and FAS,
two important enzymes responsible for fatty acid synthesis were increased.
Interestingly, intestinal fiaf-induced LPL inhibition had been thought to be responsible
for the observed decrease in adiposity in GF animals. As such, fiaf-deficient GF mice

136
are obese and fiaf-deficient mice display increased LPL activity [21]. However, these
current data suggest that despite increased intestinal fiaf, adiposity is not decreased in
GF rats and this is independent of LPL expression as well. Unlike LPL, the increase of
ACC and FAS may be an underlying mechanism responsible for increased adiposity
observed in GF rats. Being the committed step to fatty acid biosynthesis, ACC may
induce the accumulation of fatty acids into adipocytes, and lead to increased adipocyte
hypertrophy. Indeed, we did find modest increases in adipocyte surface area in the
epididymal fat of GF rats relative to NORM controls. Therefore, from these results, we
demonstrate that increased adiposity in GF rats from this group may be due to
increased fatty acid synthesis and adipocyte size. Interestingly, adipocyte hypertrophy
is associated with metabolic abnormalities, such as diabetes [537, 538]; however, GF
rats in our study exhibited similar or lower levels for fasting plasma glucose. The
discrepancy between these two findings may be explained by the observed increased in
adipocyte size occurring in the epididymal fat pad. As such, we found no difference in
the visceral fat mass and did not examine visceral adipocyte morphology, which is an
independent predictor of diabetes and metabolic dysregulation [538]. While we found
modest adipocyte hypertrophy in the GF rat, the exact mechanism may involve
increased ACC and FAS as well as possible differences in fatty acid uptake.
In summary, our current results indicate that the absence of gut microbiota do not
result in reduced adiposity in the GF F344 rat model, contrary to previous results using
C57Bl/6J mice. Furthermore, while decreased adiposity in GF mice has been attributed
to increased intestinal fiaf, a possible circulating metabolic regulator, and decreases in
liver lipogenesis, we found that in one group of GF rats that displayed increased

137
adiposity, intestinal fiaf was still up-regulated, similar to that of a previous study[506].
Finally, the increase in adiposity in GF rat was associated with increased fatty acid
synthesis markers in epididymal fat pads of GF rats, leading to adipocyte hypertrophy,
and overall was independent of hepatic lipogenic markers. Collectively, these results
demonstrate that the absence of gut microbiota in rats may not be important in
preventing adiposity deposition in this rat model while maintaining importance in
intestinal nutrient transporter expression and liver metabolism.
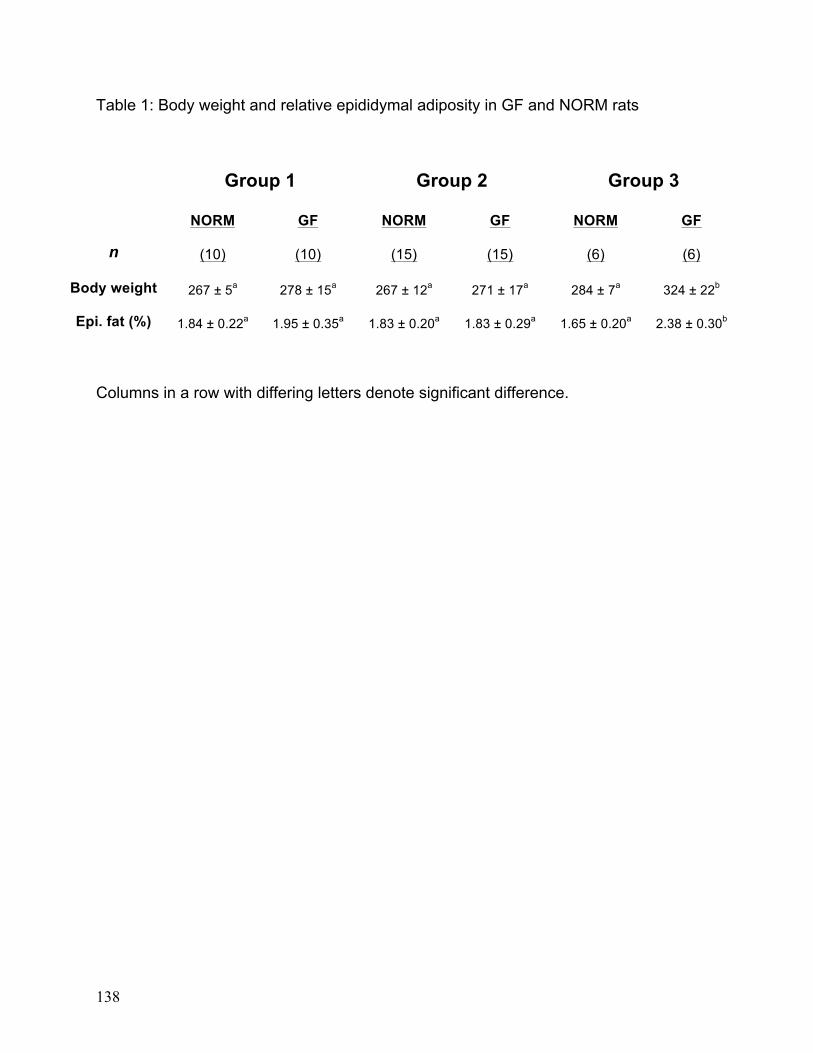
138
Table 1: Body weight and relative epididymal adiposity in GF and NORM rats
Group 1 Group 2 Group 3
n
NORM
(10)
GF
(10)
NORM
(15)
GF
(15)
NORM
(6)
GF
(6)
Body weight 267 ± 5a 278 ± 15a 267 ± 12a 271 ± 17a 284 ± 7a 324 ± 22b
Epi. fat (%) 1.84 ± 0.22a 1.95 ± 0.35a 1.83 ± 0.20a 1.83 ± 0.29a 1.65 ± 0.20a 2.38 ± 0.30b
Columns in a row with differing letters denote significant difference.

139
Table 2: Plasma biochemical markers in NORM and GF rats
NORM GF
Glucose (mg/dl) 176.5 ± 19.0 137.1 ± 6.0
Triglycerides (mg/dl) 167.8 ± 10.7 213.6 ± 16.9
Cholesterol (mg/dl) 64.73 ± 4.9 87.2 ± 2.0*
HDL (mg/dl) 33.6 ± 2.8 44.7 ± 3.0* *denotes significant difference from NORM rats

140
Figure legends
Fig 1. Relative fat pad mass (A), and fiaf tissue expression (B) in NORM (open bars)
and GF (closed bars) rats from Group 3. (A) Relative epididymal, retroperitoneal, and
total fat pad masses were increased in GF rats compared to NORM controls. (B)
Intestinal and liver fiaf were up-regulated and down-regulated in adipose tissue of GF
rats relative to NORM rats. Data are expressed as mean ± SEM. *P<0.05, **P<0.01
relative NORM controls
Fig 2. Intestinal glucose transporter mRNA expression (A), gene expression of hepatic
lipogenesis markers (B), and hepatic phosphorylated AMPK and ACC-1 (C) in NORM
and GF rats from Group 3. (A) GF rats exhibited decreased expression of both GLUT
and SGLT1 in the proximal intestine. (B) Markers of hepatic lipogenesis were decreased
in GF rats. (C) Enzymes responsible for inactivating lipogenesis were increased in GF
rats
Fig 3. Markers of fatty acid synthesis and adipogenesis (A) and average adipocyte
surface area and adipocyte morphology (B and C) in epididymal fat pads of NORM and
GF rats from Group 3. GF rats expressed increased ACC-1 and FAS, but decreased
markers of adipogenesis. (B) Average surface area measurements revealed modest
adipocyte hypertrophy in GF mice. (C) Microphotographs (10X magnification) of
adipocytes from NORM and GF rats.

141
References 1. Backhed F, Ding H, Wang T, Hooper LV, Koh GY, et al. (2004) The gut microbiota as
an environmental factor that regulates fat storage. Proc Natl Acad Sci U S A 101:
15718-15723.
2. Backhed F, Manchester JK, Semenkovich CF, Gordon JI (2007) Mechanisms
underlying the resistance to diet-induced obesity in germ-free mice. Proc Natl Acad
Sci U S A 104: 979-984.
3. Turnbaugh PJ, Backhed F, Fulton L, Gordon JI (2008) Diet-induced obesity is linked
to marked but reversible alterations in the mouse distal gut microbiome. Cell Host
Microbe 3: 213-223.
4. Turnbaugh PJ, Ley RE, Mahowald MA, Magrini V, Mardis ER, et al. (2006) An
obesity-associated gut microbiome with increased capacity for energy harvest. Nature
444: 1027-1031.
5. Cherbuy C, Honvo-Houeto E, Bruneau A, Bridonneau C, Mayeur C, et al. (2010)
Microbiota matures colonic epithelium through a coordinated induction of cell cycle-
related proteins in gnotobiotic rat. Am J Physiol Gastrointest Liver Physiol 299: G348-
357.
6. Samuel BS, Shaito A, Motoike T, Rey FE, Backhed F, et al. (2008) Effects of the gut
microbiota on host adiposity are modulated by the short-chain fatty-acid binding G
protein-coupled receptor, Gpr41. Proc Natl Acad Sci U S A 105: 16767-16772.
7. Rabot S, Membrez M, Bruneau A, Gerard P, Harach T, et al. (2010) Germ-free
C57BL/6J mice are resistant to HF-diet-induced insulin resistance and have altered
cholesterol metabolism. FASEB J.
8. Fleissner CK, Huebel N, Abd El-Bary MM, Loh G, Klaus S, et al. (2010) Absence of
intestinal microbiota does not protect mice from diet-induced obesity. Br J Nutr 104:
919-929.
9. Wostmann BS, Larkin C, Moriarty A, Bruckner-Kardoss E (1983) Dietary intake,
energy metabolism, and excretory losses of adult male germfree Wistar rats. Lab
Anim Sci 33: 46-50.

142
10. Lin ZJ, Zhang B, Liu XQ, Yang HL (2009) Abdominal fat accumulation with
hyperuricemia and hypercholesterolemia quail model induced by high fat diet. Chin
Med Sci J 24: 191-194.
11. Kahn BB, Alquier T, Carling D, Hardie DG (2005) AMP-activated protein kinase:
ancient energy gauge provides clues to modern understanding of metabolism. Cell
Metab 1: 15-25.
12. Bastie C, Luquet S, Holst D, Jehl-Pietri C, Grimaldi PA (2000) Alterations of
peroxisome proliferator-activated receptor delta activity affect fatty acid-controlled
adipose differentiation. J Biol Chem 275: 38768-38773.
13. Jernas M, Palming J, Sjoholm K, Jennische E, Svensson PA, et al. (2006)
Separation of human adipocytes by size: hypertrophic fat cells display distinct gene
expression. FASEB J 20: 1540-1542.
14. Weyer C, Foley JE, Bogardus C, Tataranni PA, Pratley RE (2000) Enlarged
subcutaneous abdominal adipocyte size, but not obesity itself, predicts type II
diabetes independent of insulin resistance. Diabetologia 43: 1498-1506.

143
Figure 1
Epi Retro Visc Total0
2
4
6NORMGF
****
**
Fat p
ad m
ass
(% B
W)
Intestine Liver Adipose0
1
2
3
**
**
*
n-fo
ld c
hang
eA
B

144
Figure 2
SGLT1 GLUT20.0
0.5
1.0
1.5
****
n-fo
ld c
hang
e
ACC-1 FAS LPL SREBP0.0
0.5
1.0
1.5
****
***
n-fo
ld c
hang
e
ACC-P AMPK-P0
100
200
300
400
**
*
% r
elat
ive
CV
A
B
C

145
Figure 3
ACC-1 FAS LPL ABP2 PPAR-γ0.0
0.5
1.0
1.5
2.0 NORMGF
*
**
**** **
n-fo
ld c
hang
e
0
1000
2000
3000
4000
5000
P = 0.05
Surf
ace
area
(µm
2 )
A
B
C
NORM
GF
146
4.3 Specific Aim 3: Summary of results and conclusions
The final experiments from these collective sets of studies demonstrate that in the F344
rat model, the GF status is not predictive of decreased adiposity. The findings of
absence of decreased adiposity in GF rats occurs despite increases in intestinal FIAF
expression, increases in markers of hepatic fat lipolysis, and increased circulating
biochemical markers resembling that of GF mice, which are extremely lean. While
adiposity was similar between GF and NORM rats the first two groups, in a third group
we examined, GF rats displayed increased adiposity that was due primarily to increased
epididymal and retroperitoneal fat pad masses. Furthermore, while intestinal FIAF was
up-regulated and intestinal glucose transporters were down-regulated, both of which
were associated with decreased markers of hepatic lipogenesis. We also directly
showed a negative energy balance in the liver of GF rats as they displayed increases in
P-AMPK and P-ACC, which inhibit lipogenesis. One mechanism responsible for this
hepatic energy status could be the decreased delivery of glucose to the liver as
observed by the decreases in intestinal glucose transporters. Despite these findings,
we found that adipocytes of GF rats had increases in lipogenesis enzymes with
decreases in adipogenesis factors. Histological examination of the epididymal fat pads
of GF rats supported these findings as GF rats displayed modest adipocyte hypertrophy
relative to control rats. The immediate reason for the lack effects of the GF state on
adiposity in this model is not clear from these findings alone as the GF model is typically
described as maintaining a fasting state [21, 22], which is associated with general
decreases in liver and adipocyte lipogenesis [22]. However, the increases in adipocyte
lipogenesis markers in our study may signal that local factors, independent of liver

147
metabolism, regulate adiposity in this model. As well, fatty acid absorption may be
enhanced in the adipocytes of GF rats, leading to compensatory changes in adiposity
due to the lack of microbiota.

148
5. General summary
5.1 General results
Collectively, these experiments demonstrate the influential role of the gut microbiota on
feeding behavior of specific nutrients, intestinal nutrient detection, and intestinal and
liver metabolism. In Chapter 2 of this thesis, we presented that the GF C57Bl/6J mouse,
which exhibits reduced adiposity, increases consumption of highly concentrated nutritive
sweet solutions, while maintaining the same affinity for nonnutritive sweet solutions as
control animals. These behavioral effects were associated with similar levels of the
lingual sweet taste receptor between groups, but significant up-regulation of intestinal
T1R3 and the active glucose transporter, SGLT1 [515]. Together, these data implicate
intestinal sugar sensing in the increased consumption of nutritive sweet solutions.
Additionally, in Chapter 3, we demonstrate that the same GF mouse model also
displays increased preference and acceptance for nutritive oil emulsions. This increase
in oil preference and acceptance was associated with increased expression of lingual
CD36 and decreased expression of intestinal fatty acid sensors and intestinal satiety
peptides, respectively. The significance of these studies is that unlike intestinal sugar
detection, which is increased in GF mice, intestinal fat detection is decreased, allowing
for greater consumption of highly nutritive oil emulsions. Finally, in Chapter 4, we reveal
that the effect of the gut microbiota on adiposity and energy balance may be species
specific as GF F344 rats do not display severely reduced adiposity stores, despite
similar findings of increased intestinal FIAF and inhibition of hepatic lipogenesis in this
model. However, the relative modest increase in adiposity in one group of GF rats is
associated with increases in local adipocyte lipogenesis enzymes and increased

149
adipocyte size. Together, these data demonstrate the broad effects of the absence of
microbiota on oral and post-oral nutrient sensing in GF mice to increase consumption of
nutritive stimuli and how the effect of microbiota has differing effects on peripheral
metabolism in GF animal models (Figure 1).
Figure 1: The effect of the GF status on oral and intestinal nutrient receptors, metabolism, and
adiposity. The GF status in C57Bl/6J mice is characterized by decreased adiposity, leading to
increases in consumption of fat and sugar, which is associated with alterations in intestinal fat
and sugar detection. In the F344 rat, the GF status is not associated with decreased adiposity or
altered energy consumption. While hepatic lipogenesis is decreased in the GF F344 rat, adipocyte
lipogenesis is increased, which is associated with increased adipocyte size in the epididymal fat
pad.

150
5.2 General discussion
Germ-free animals are a model that allow for the examination of the effects of the gut
microbiota on various metabolic, physiological, and endocrine parameters. Previously,
GF models have been used to examine intestinal digestive [476, 477], morphological
[470, 472], and physiological [473] effects of the microbiota; however, more recently a
case for the gut microbiota affecting energy balance has been made. Originally, in 2004,
using C57Bl/6J mice, Backhed et al reported that the gut microbiota was a key regulator
of energy balance as mice lacking microbiota were extremely lean compared to control
animals that normally possess a gut microbiota and conventionalized animals [21].
Additionally these same GF mice are resistant to obesity during HF-feeding [22], an
effect replicated more recently [507]. Despite the relative lack of adiposity in GF mice,
these animals consume more energy, an affect attributed largely to lack of energy
extraction from the diet [21]. Furthermore, due to the expression of various
glycosylhydrolyases that breakdown dietary fibers and are not inherent to the
mammalian genome [461], expression of distal nutrient receptors are altered in GF mice
[312]. While decreased energy extraction is most likely the primary reason for the
energy deficit in GF mice, the specific mechanisms in this model controlling the
consumption of macronutrients that comprise a meal are poorly understood.
The detection and control of nutrient intake occurs primarily at two levels: oral
and post-oral [539]. While the first involves almost exclusively the lingual epithelium
[25], afferent taste pathways [118], and ultimately reward centers [540], the latter is
controlled primarily by intestinal chemosensing [541] with input from mechanic and
metabolic signals arising from the stomach [180] and liver [542], respectively. The

151
lingual contribution to at least short-term food intake is apparent by studies
demonstrating that KO of various receptors localized on TRCs in the lingual epithelium,
which maintain affinity for a variety of taste stimuli, results in attenuated or abolished
preference for that specific taste, and decreased afferent nerve transmission following
lingual application of tastants [46, 79]. For example, T1R2+3, a g-protein coupled
transmembrane receptor complex is activated by sweet stimuli and KO of this receptor
complex results in total abolishment of oral sweet detection and subsequent CT nerve
activation in response to sweet stimuli [46]. For fat taste, KO of the fatty acid
translocase CD36 [79] or GPR120 [83] also results in abolished preference for a range
of nutritive and non-nutritive oil emulsions. As well, the central pathways involving taste
for these palatable stimuli are strong determinants for their intake as oral stimulation
with saccharin [138], sucrose [141], or oil [142] results in the release of DA from reward
centers, such as the NAcc while dopamine deficient mice are hypophagic and
normalization of DA levels increases food consumption [543]. Taste modalities are
heavily influenced by energy balance as well. For example, genetically obese rodents
display decreased oral sensitivity to both sweet [143, 144] and fat [162] stimuli. The
finding of decreased lingual sensitivity to sweet tastants is most likely a direct function of
impaired leptin signaling that is observed in many obese rodent models [544]. For
example, the absence of leptin, the application of sweet stimuli on the lingual epithelium
results in decreased CT nerve responses; however, application of leptin normalizes this
response [146]. In our findings, we did not find a difference in taste preferences with
saccharin or sucrose or associated changes with T1R2+3 expression in the lingual
epithelium of GF mice [515]. Thus, from these findings alone, it does not appear that
152
sweet taste differs in this model. In respect to fat taste; however, we found that GF
mice displayed increased oral sensitivity to fats, preferring a low concentration of
intralipid more than NORM mice. This finding was associated with increased
expression of lingual CD36. For both of sweet solutions and oil emulsions, we found
differences in intake of nutritive stimuli, thus, post-oral factors involving the intestine
could also influence our behavioral findings. More recently, it has been suggested that
while oral factors clearly influence short-term intake, the post-oral consequences of
nutrients may play a larger role in establish long-term feeding behavior [161].
Nutrients in the intestine evoke the release of signals inducing satiation, and may
serve as satiation signals themselves [246]. For example, intestinal infusion of
carbohydrates, fats, or protein results in reductions in short-term food intake [242, 243],
which is though to require digestion and nutritive value [291], but not absorption or
metabolism of nutrients [245]. As such, while glucose polymers and fatty acids induce
satiation [238], inhibition of dissacharidases [249] or lipases [291] results in attenuation
of this behavioral response. Furthermore, blockade of the active glucose transporter,
SGLT1, does not prevent glucose-induced satiation [245], intravascular glucose
infusions are not efficient in reducing food intake [428], and SCFA and MCFA that are
readily absorbed do not induce satiation as effectively as LCFA, which require
chylomicron formation [242]. This finding may depend upon intestinal fatty acid sensors,
such as CD36 or GPRs, as CD36 is integral for proximal, but not distal, intestine fat
absorption [299] and chylomicron formation [298], an area where nutrient satiation is
strongest [248]. Furthermore, in our studies, we found that increased intralipid intake in
GF mice was associated with decreased proximal intestine CD36, GPR40, 41, 43, and

153
120. Thus, GF mice may overconsume nutritive sources of fat due to decreased
intestinal fat sensing. For example, CD36, the apically expressed fatty acid translocase
mediates fat-induced satiation as CD36 KO mice display attenuation of intestinal fat
satiation. As well, GPRs lining the intestinal tract are at least in part responsible for the
secretion of intestinal satiety peptides that mediate nutrient satiation [91, 93, 312].
The mediation intestinal nutrient satiation is hypothesized to be due
predominantly to the secretion of intestinal satiety signals acting on vagal afferents or
via the circulation in response to nutrients. Direct support of this comes from the
evidence that administration of satiety peptide receptor antagonists results in
attenuation of abolishment of intestinal nutrient satiation [238]. Additionally, vagotomy
via chemical or surgical means abolishes intestinal nutrient and satiety peptide-induced
satiation [242, 243]. However, because feeding is still regulated in the absence of vagal
synapses in the intestine, it is not the only means to govern intestinal satiation.
Intestinal nutrient infusions also stimulate the release of satiety peptides in the lymph
[545] and circulation [546] signaling a likely endocrine pathway for these peptides to
mediate satiation. For example, vascular infusions of CCK or GLP-1 inhibit feeding in
the absence of vagal signaling [200]. The ARC, which is open to the circulation and
lacks a permanent blood brain barrier at the median eminence, expresses receptors for
various gut peptides [547]. The direct evidence for the mediation of the forebrain in
intestinal satiety signaling is that ablation of transduction pathways to this forebrain
nucleus results in abolishment of satiety peptide-induced satiation [548]. As satiety
peptides are released in response to a meal, both humans [549] and rodent models
[550] display decreased fasting levels of intestinal and plasma satiety peptides, which

154
rise upon feeding. Predictably, we found that in GF mice, which exhibit a fasting state
characterized by low levels of adiposity [21], both intestinal and plasma levels of satiety
peptides were decreased. Our results further confirm these decreased levels of body
adiposity by demonstrating the reduction of circulating leptin in GF mice. Collectively,
these data demonstrate that the associated changes with decreased satiety signals and
fat sensing may contribute to the increased consumption of fats displayed by GF mice.
While nutrients in the intestine indeed reduce food intake, the post-oral learning
and pairing with taste also has a stimulating effect on feeding behavior [551]. Both
carbohydrates [552] and fat [339] are potent nutrients in conditioning learned flavor
preferences as intestinal infusions of either nutrient condition preferences of a paired
non-nutritive flavor; however, carbohydrates are by far a stronger conditioning nutrient
[339]. While intestinal glucose can also reinforce behavior, and conditioned flavor
preferences clearly involve brain areas implicated in reward [356, 553, 554], the
intestinal detection of nutrients clearly is the first step in this process [330]. Similarly to
satiation, post-oral nutrient conditioning is hypothesized to require digestive [350] and
pre-absorptive intestinal machinery [330 ] as KO of CD36 [101] does not prevent post-
oral conditioning. Additionally, intravascular glucose infusions [330] and non-nutritive
sweet stimuli [340] or oil emulsions [555] condition weak or no flavor preferences. The
finding that GF mice display increased sucrose intake with associated up-regulation of
T1R3 and SGLT1 may implicate T1R3 in establishing increased nutritive sweet
acceptance in this model. As well, T1R3 KO mice, display decreased acceptance of
sucrose, despite normalization of sucrose preference during multiple exposures to
sucrose [42]. Despite these two somewhat convincing pieces of evidence, T1R3 KO

155
mice display normal glucose conditioned flavor preferences demonstrating this intestinal
glucose sensor may not be responsible for the increased sucrose intake in GF mice
[340]. However, similar to sweet taste, intestinal “sweet” sensing at high volumes and
concentrations of sucrose, such as tested in our study, may play a pivotal role in the
establishment of sucrose intake as high carbohydrate diets increase SGLT1 expression
via a T1R3-dependent mechanism [265, 266]. To clarify this uncertainty, further testing
of glucose conditioned flavor preferences in GF mice is sure to elucidate whether post-
oral signaling is responsible for the increased intake of sucrose in this model. Finally,
the derivation of T1R3 KO animals in the GF state would allow for the demonstration
that T1R3 in this model is at least in part responsible for the increased intake of sucrose.
While the GF C57Bl/6J mouse model is clearly characterized by decreased
adiposity [21, 22, 507], the relationship of the gut microbiota and adiposity in other
mouse strains and even other rodent models is less clear [460, 506, 513]. In normal
C57Bl/6J mice, microbiota populations play a significant role in energy balance as
genetically obese ob/ob mice display significantly different microbiota populations from
lean controls with proportional increases in firmicutes and decreases in bacteroides
[457]. Furthermore, when GF animals are conventionalized with genetically obese or
lean donor microbiota, animals receiving the obese donor microbiota exhibit increased
adiposity relative to recipients of lean donor microbiota [508]. This finding has also
been extended to mice made obese through HF feeding, and is not an effect of the diet
as switching obese animals to a LF-diet and conventionalizing GF animals still results in
increased adipose deposition relative to recipients of lean donor microbiota during HF-
feeding [510]. Despite these multiple evidences that the microbiota clearly plays a role

156
in energy balance, more recent evidences in a different strain of mice and rats suggest
that the absence of gut microbiota is not necessarily a predictor of decrease adiposity
[506]. Using GF C3N mice fed either a LF, HF or western diet, Fleissner et al
demonstrated that GF mice exhibit equal or increased adiposity levels relative to control
mice during LF or HF-feeding [506]. During western diet feeding; however, GF mice
maintained lower adiposity levels than control animals. While the effect in their study
was attributed to the carbohydrate content of the diet, because both the LF- and HF-diet
contain low dietary sugar content while the western diet contains a high level of sucrose,
this explanation is in direct conflict with a previous study [507].
The major factor that is hypothesized to contribute to the decreased energy state
exhibited by GF C57Bl/6J mice is the increases in intestinal FIAF [21, 22], which we
confirm in our current data from Chapter 3. As such, KO of FIAF in GF animals results
in similar adiposity as conventionalized control animals [21, 22]. Fast-induced
adipocyte factor is a peripheral regulator of metabolism through direct inhibition of LPL.
As such, transgenic FIAF models display increased fat metabolism and increased
markers of circulating biochemical markers, such as total cholesterol, HDL, and
triglycerides [505]. Similarly, GF animals from our study displayed increases in these
markers as well. The hepatic metabolism of GF animals is thought to be the primary
factor in shifting peripheral metabolism to lipolysis. For example, GF mice display
decreases in intestinal glucose absorption, leading to a decreased hepatic glucose
shunt, decreases in liver glycogen, and as a result, hepatic lipogenesis is inhibited [21].
As such, the hepatocytes of GF mice display increases in P-AMPK, which occurs during
periods of fasting, and leads to the inactivation of ACC, a key rate limiting enzyme of

157
lipogenesis, via phosphorylation [22]. Germ-free mice also display broad decreases in
hepatic lipogenic factors and increased hepatic LPL activity, demonstrating the
increased lipolysis in this model [21, 22]. In both humans [556] and rodents [557],
hepatic lipogenesis is associated with weight gain and obesity as well. However, in the
study demonstrating GF C3N mice do not exhibit decreased adiposity, intestinal FIAF
was increased in all GF animals, and circulating FIAF was non-existant with no
measurements in liver metabolism [506]. This led the authors to hypothesize that
intestinal FIAF, which has anti-angiogenic properties, is not a factor regulating
peripheral metabolism. In our data, we clearly demonstrate that in a group of GF rats,
hepatic lipogenesis markers are decreased and that the liver is in a negative energy
state, perhaps due to the decreased intestinal expression of glucose transporters. The
apparent increases in local lipogenic factors in adipose tissue most likely can explain
the increased adipocyte size and modest increases in epididymal fat pads in one group
of GF rats. As such, increased adipocyte lipogenesis and adipogenesis are associated
with increases in adiposity in rodent models [558]. However, our results also
demonstrate variability in the GF F344 rat as another group of GF animals exhibited
similar adiposity relative to normal controls. These results demonstrate the importance
of both strain and species in examining the effect of the microbiota. This evidence can
also be extrapolated to humans in which unlike rats, and more like mice, obesity, rather
than diet, may have a larger effect on the gut microbial populations [511].

158
5.3 General conclusions and perspectives
Overall, these data lay out the preliminary studies to assess the relative effect of the gut
microbiota on oral and post-oral factors controlling energy balance in rodent models. Of
course, in a normal environment, humans and animals co-exist with prokaryotic
organisms and are not devoid of an intestinal microbiota. Other environmental factors
or genetic factors, such as diet or receptor polymorphisms are well documented in
affecting the gut microbiota populations and the host organism’s response to microbiota
secreted products. Furthermore, the effect of specific microbiota populations on these
factors controlling energy balance remains elusive. For example, genetically obese
rodent models display increases in consumption of palatable foods with decreases in
oral sensitivity to these stimuli with decreases in intestinal nutrient satiation [143].
Whether this is an effect of the microbiota is unknown and could provide for fruitful
evidence demonstrating an effect of “obese” microbiota shaping food preferences and
leading to consumption of palatable foods. As well, the interaction between diet and
inherent microbiota populations may provide clues to the prevalence of DIO in rodent
models. Using comprehensive conventionalization studies, in which GF mice receive
HF or chow-fed DIO or DR donor microbiota, and are subsequently fed chow and HF
diets we could determine the effect of the microbiota, diet, and its interaction in
promoting changes in nutrient sensing, satiation signaling, and the obese state.

159
6 Index
6.1 Figures 6.1.1 Chapter 1
Figure 1 : Taste papillae in the lingual epithelium and taste bude structure _____ 5
Figure 2 : Sham-feeding preparation in the rat ___________________________ 7
Figure 3 : Intracellular transduction pathway for sweet taste _______________ 11
Figure 4 : CD36 localization on the lingual epithelium ____________________ 16
Figure 5 : Cell-to-cell taste transduction _______________________________ 19
Figure 6 : Intestinal glucose and fructose transport ______________________ 37
Figure 7 : Lingual TRC and intestinal enteroendocrine cell similarities _______ 40
Figure 8 : GLP-2-mediated up-regulation of intestinal SGLT1 ______________ 42
Figure 9 : CD36, OEA, and intestinal fat satiation _______________________ 45
Figure 10 : Gut microbiota, inflammation, and obesity ____________________ 73
6.1.2 Chapter 3
Figure 1 : Preference, intake, and calorie consumption from intralipid emulsions in GF
and NORM C57B6/J mice ________________________________________ 114
Figure 2 : Gene expression of lingual CD36, and protein expression of intestinal CD36,
and intestinal FIAF in GF and NORM C57B6/J mice ____________________ 115
Figure 3 : Intestinal epithelial protein expression of fatty-acid responsive receptors in GF
and NORM mice ________________________________________________ 116
Figure 4 : Intestinal epithelial protein expression of satiety peptide in GF and NORM
mice _________________________________________________________ 117
Figure 5 : Cell counts of enteroendocrine cells expressing chromogrannin-A and
representative microphotographs of ileum and colon sections at 100X magnification
_____________________________________________________________ 118

160
Figure 6 : Plasma levels of leptin, ghrelin, and PYY in GF and NORM mice following an
overnight fast or refeeding with 1-ml of 20% intralipid ___________________ 119
Figure 7 : Plasma levels of glucose, cholesterol, total triglycerides, and (D) HDL in GF
and NORM mice following an overnight fast or refeeding with 1 ml of 20% intralipid
_____________________________________________________________ 120
6.1.3 Chapter 4
Figure 1 : Fat pad mass relative to body weight and fiaf tissue expression in NORM and
GF rats _______________________________________________________ 143
Figure 2 : Gene expression of intestinal glucose transporters and hepatic lipogenesis
marker expression, and phosphorylated AMPK and ACC-1 in NORM and GF rats
__________________________________________________________ ___144
Figure 3 : Markes of fatty acid synthesis and adipogensis, average adipocyte surface
area and adipocyte morpohology in NORM and GF rats _________________ 145
6.1.4 Chapter 5
Figure 1 : The effect of the GF status on oral and intestinal nutrient receptors,
metabolism, and adiposity. ________________________________________ 149
6.2 Tables 6.2.1 Chapter 4
Table 1 : Body weight and epididymal adiposity in NORM and GF rats ______ 138
Table 2 : Plasma biochemical markers in NORM and GF rats _____________ 139
6.3 Abbreviations
2-DG – 2-deoxy-D-glucose
ACC-1 – acetyl-CoA decarboxylase-1

161
AMPK – adenosine monophosphate kinase
ARC – arcuate nucleus
ATP – adenosine triphosphate
BMI – body mass index
cAMP – cyclic adenosine monophosphate
CCK – cholecystokinin
ChREBP – carbohydrate regulatory element binding protein
CNS – central nervous system
CT – chorda tympani nerve
CTA – conditioned taste aversion
CV – conventional
DA – dopamine
Diet-induced obesity (DIO)
DR – diet-induced obese resistant
DRK – delayed rectifying potassium channels
ENS – enteric nervous system
ERK – extracellular receptor kinase
Fat mass and obesity-associated protein (FTO)
GC – gustatory cortex
GF – germ-free
GH – growth hormone
GHS-R1a – growth hormone secretagogue receptor-1a
GLP-1 – glucagon-like peptide-1
GLP-2 – glucagon-like peptide-2
GOAT – gastric O-acyl transferase
GP – glossopharyngeal nerve
GPR – g-protein coupled receptor
HF – high-fat
IGLE – intraganglionic laminar endings
IMA – intramuscular array
KO – knock-out

162
LCFA – long-chain fatty-acid
LepR – leptin receptor
LF – low-fat
LiCl – lithium chloride
LPS – lipopolysaccharide
MCFA – medium-chain fatty-acid
NAcc – nucleus accumbens
NORM – normal
NTS – nucleus of the solitary tract
OEA – oleoylethanolamide
OLETF – Otsuka Long-Evans Tokushima Fatty
OM – Osborne-Mendle rat
PBN – parabrachial nucleus
PLCβ2 – phospholipase C β2
PPAR-α – peroxisome proliferative factor-α
PYY – peptide YY
SCFA – short-chain fatty-acid
SGLT1 – sodium-glucose transporter 1
SREBP-1 – sterol regulatory element binding protein-1
T1R2 – taste type 1 receptor 2
T1R3 – taste type 1 receptor 3
Taste receptor cells (TRCs)
TLR4 – Toll-like receptor-4
TRPM5 – transient receptor potential melastatin-5 channel
163
7 References 1. Flegal, K.M., et al., Prevalence and trends in obesity among US adults, 1999-
2008. JAMA, 2010. 303(3): p. 235-41.
2. Controlling the global obesity epidemic. 2008 2012 [cited 2012 4/26/2012].
3. Finkelstein, E.A., et al., Annual medical spending attributable to obesity: payer-
and service-specific estimates. Health Aff (Millwood), 2009. 28(5): p. w822-31.
4. Levy, E., et al., The economic cost of obesity: the French situation. Int J Obes
Relat Metab Disord, 1995. 19(11): p. 788-92.
5. WHO Global database country profiles: France. 2007 [cited 2012 05/03/2012].
6. Halaas, J.L., et al., Weight-reducing effects of the plasma protein encoded by the
obese gene. Science, 1995. 269(5223): p. 543-6.
7. Farooqi, I.S., FTO and obesity: the missing link. Cell Metab, 2011. 13(1): p. 7-8.
8. Meyre, D., et al., Prevalence of loss-of-function FTO mutations in lean and obese
individuals. Diabetes, 2010. 59(1): p. 311-8.
9. Wardle, J., et al., Obesity associated genetic variation in FTO is associated with
diminished satiety. J Clin Endocrinol Metab, 2008. 93(9): p. 3640-3.
10. Duca, F.A., et al., Decreased intestinal nutrient response in diet-induced obese
rats: role of gut peptides and nutrient receptors. Int J Obes (Lond), 2012.
11. Farley, C., et al., Meal pattern analysis of diet-induced obesity in susceptible and
resistant rats. Obes Res, 2003. 11(7): p. 845-51.
12. Levin, B.E. and A.A. Dunn-Meynell, Defense of body weight against chronic
caloric restriction in obesity-prone and -resistant rats. Am J Physiol Regul Integr
Comp Physiol, 2000. 278(1): p. R231-7.

164
13. Levin, B.E. and A.A. Dunn-Meynell, Defense of body weight depends on dietary
composition and palatability in rats with diet-induced obesity. Am J Physiol Regul
Integr Comp Physiol, 2002. 282(1): p. R46-54.
14. Levin, B.E., A.A. Dunn-Meynell, and W.A. Banks, Obesity-prone rats have
normal blood-brain barrier transport but defective central leptin signaling before
obesity onset. Am J Physiol Regul Integr Comp Physiol, 2004. 286(1): p. R143-
50.
15. Levin, B.E., et al., Abnormalities of leptin and ghrelin regulation in obesity-prone
juvenile rats. Am J Physiol Endocrinol Metab, 2003. 285(5): p. E949-57.
16. Ji, H. and M.I. Friedman, Reduced capacity for fatty acid oxidation in rats with
inherited susceptibility to diet-induced obesity. Metabolism, 2007. 56(8): p. 1124-
30.
17. Weigle, D.S. and B.E. Levin, Defective dietary induction of uncoupling protein 3
in skeletal muscle of obesity-prone rats. Obes Res, 2000. 8(5): p. 385-91.
18. Nefti, W., et al., A high-fat diet attenuates the central response to within-meal
satiation signals and modifies the receptor expression of vagal afferents in mice.
Am J Physiol Regul Integr Comp Physiol, 2009. 296(6): p. R1681-6.
19. Reidelberger, R.D., et al., Effects of exendin-4 alone and with peptide YY(3-36)
on food intake and body weight in diet-induced obese rats. Obesity (Silver
Spring), 2011. 19(1): p. 121-7.
20. Trevaskis, J.L., et al., Interaction of leptin and amylin in the long-term
maintenance of weight loss in diet-induced obese rats. Obesity (Silver Spring),
2010. 18(1): p. 21-6.

165
21. Backhed, F., et al., The gut microbiota as an environmental factor that regulates
fat storage. Proc Natl Acad Sci U S A, 2004. 101(44): p. 15718-23.
22. Backhed, F., et al., Mechanisms underlying the resistance to diet-induced obesity
in germ-free mice. Proc Natl Acad Sci U S A, 2007. 104(3): p. 979-84.
23. Zuniga, J.R., N. Chen, and I.J. Miller, Jr., Effects of chorda-lingual nerve injury
and repair on human taste. Chem Senses, 1994. 19(6): p. 657-65.
24. Bailey, E.H. and E.L. Nichols, On the Sense of Taste. Science, 1888. 11(268): p.
145-6.
25. Chandrashekar, J., et al., The receptors and cells for mammalian taste. Nature,
2006. 444(7117): p. 288-94.
26. Chandrashekar, J., et al., The cells and peripheral representation of sodium taste
in mice. Nature, 2010. 464(7286): p. 297-301.
27. Huang, Y.A., et al., Presynaptic (Type III) cells in mouse taste buds sense sour
(acid) taste. J Physiol, 2008. 586(Pt 12): p. 2903-12.
28. Smith, D.V. and S.J. St John, Neural coding of gustatory information. Curr Opin
Neurobiol, 1999. 9(4): p. 427-35.
29. Sclafani, A. and M. Abrams, Rats show only a weak preference for the artificial
sweetener aspartame. Physiol Behav, 1986. 37(2): p. 253-6.
30. Weingarten, H.P. and S.D. Watson, Sham feeding as a procedure for assessing
the influence of diet palatability on food intake. Physiol Behav, 1982. 28(3): p.
401-7.
31. Geary, N. and G.P. Smith, Pimozide decreases the positive reinforcing effect of
sham fed sucrose in the rat. Pharmacol Biochem Behav, 1985. 22(5): p. 787-90.

166
32. Davis, J.D. and G.P. Smith, The conditioned satiating effect of orosensory stimuli.
Physiol Behav, 2009. 97(3-4): p. 293-303.
33. Sclafani, A. and J.I. Glendinning, Sugar and fat conditioned flavor preferences in
C57BL/6J and 129 mice: oral and postoral interactions. Am J Physiol Regul
Integr Comp Physiol, 2005. 289(3): p. R712-20.
34. Sclafani, A., Enhanced sucrose and Polycose preference in sweet "sensitive"
(C57BL/6J) and "subsensitive" (129P3/J) mice after experience with these
saccharides. Physiol Behav, 2006. 87(4): p. 745-56.
35. Nelson, G., et al., Mammalian sweet taste receptors. Cell, 2001. 106(3): p. 381-
90.
36. Hoon, M.A., et al., Putative mammalian taste receptors: a class of taste-specific
GPCRs with distinct topographic selectivity. Cell, 1999. 96(4): p. 541-51.
37. Kitagawa, M., et al., Molecular genetic identification of a candidate receptor gene
for sweet taste. Biochem Biophys Res Commun, 2001. 283(1): p. 236-42.
38. Li, X., T1R receptors mediate mammalian sweet and umami taste. Am J Clin
Nutr, 2009. 90(3): p. 733S-737S.
39. Li, X., et al., Human receptors for sweet and umami taste. Proc Natl Acad Sci U
S A, 2002. 99(7): p. 4692-6.
40. Kim, M.R., et al., Regional expression patterns of taste receptors and gustducin
in the mouse tongue. Biochem Biophys Res Commun, 2003. 312(2): p. 500-6.
41. Inoue, M., et al., Allelic variation of the Tas1r3 taste receptor gene selectively
affects taste responses to sweeteners: evidence from 129.B6-Tas1r3 congenic
mice. Physiol Genomics, 2007. 32(1): p. 82-94.

167
42. Zukerman, S., et al., T1R3 taste receptor is critical for sucrose but not Polycose
taste. Am J Physiol Regul Integr Comp Physiol, 2009. 296(4): p. R866-76.
43. Montmayeur, J.P., et al., A candidate taste receptor gene near a sweet taste
locus. Nat Neurosci, 2001. 4(5): p. 492-8.
44. Pin, J.P. and F. Acher, The metabotropic glutamate receptors: structure,
activation mechanism and pharmacology. Curr Drug Targets CNS Neurol Disord,
2002. 1(3): p. 297-317.
45. Damak, S., et al., Detection of sweet and umami taste in the absence of taste
receptor T1r3. Science, 2003. 301(5634): p. 850-3.
46. Zhao, G.Q., et al., The receptors for mammalian sweet and umami taste. Cell,
2003. 115(3): p. 255-66.
47. Glendinning, J.I., et al., Differential effects of sucrose and fructose on dietary
obesity in four mouse strains. Physiol Behav, 2010. 101(3): p. 331-43.
48. Jiang, P., et al., Lactisole interacts with the transmembrane domains of human
T1R3 to inhibit sweet taste. J Biol Chem, 2005. 280(15): p. 15238-46.
49. Li, X., et al., Pseudogenization of a sweet-receptor gene accounts for cats'
indifference toward sugar. PLoS Genet, 2005. 1(1): p. 27-35.
50. Jiang, P., et al., Molecular mechanisms of sweet receptor function. Chem Senses,
2005. 30 Suppl 1: p. i17-8.
51. Jiang, P., et al., The cysteine-rich region of T1R3 determines responses to
intensely sweet proteins. J Biol Chem, 2004. 279(43): p. 45068-75.
52. Xu, H., et al., Different functional roles of T1R subunits in the heteromeric taste
receptors. Proc Natl Acad Sci U S A, 2004. 101(39): p. 14258-63.

168
53. Nie, Y., et al., Distinct contributions of T1R2 and T1R3 taste receptor subunits to
the detection of sweet stimuli. Curr Biol, 2005. 15(21): p. 1948-52.
54. Avenet, P., F. Hofmann, and B. Lindemann, Transduction in taste receptor cells
requires cAMP-dependent protein kinase. Nature, 1988. 331(6154): p. 351-4.
55. Avenet, P., F. Hofmann, and B. Lindemann, Signalling in taste receptor cells:
cAMP-dependent protein kinase causes depolarization by closure of 44 pS K-
channels. Comp Biochem Physiol A Comp Physiol, 1988. 90(4): p. 681-5.
56. Cummings, T.A., C. Daniels, and S.C. Kinnamon, Sweet taste transduction in
hamster: sweeteners and cyclic nucleotides depolarize taste cells by reducing a
K+ current. J Neurophysiol, 1996. 75(3): p. 1256-63.
57. Cummings, T.A., J. Powell, and S.C. Kinnamon, Sweet taste transduction in
hamster taste cells: evidence for the role of cyclic nucleotides. J Neurophysiol,
1993. 70(6): p. 2326-36.
58. Perez, C.A., et al., A transient receptor potential channel expressed in taste
receptor cells. Nat Neurosci, 2002. 5(11): p. 1169-76.
59. Bernhardt, S.J., et al., Changes in IP3 and cytosolic Ca2+ in response to sugars
and non-sugar sweeteners in transduction of sweet taste in the rat. J Physiol,
1996. 490 ( Pt 2): p. 325-36.
60. Wong, G.T., K.S. Gannon, and R.F. Margolskee, Transduction of bitter and
sweet taste by gustducin. Nature, 1996. 381(6585): p. 796-800.
61. Tomonari, H., et al., Galpha-gustducin is extensively coexpressed with sweet and
bitter taste receptors in both the soft palate and fungiform papillae but has a
different functional significance. Chem Senses, 2012. 37(3): p. 241-51.

169
62. Ruiz-Avila, L., et al., Dominant loss of responsiveness to sweet and bitter
compounds caused by a single mutation in alpha -gustducin. Proc Natl Acad Sci
U S A, 2001. 98(15): p. 8868-73.
63. Margolskee, R.F., The molecular biology of taste transduction. Bioessays, 1993.
15(10): p. 645-50.
64. Finger, T.E., et al., ATP signaling is crucial for communication from taste buds to
gustatory nerves. Science, 2005. 310(5753): p. 1495-9.
65. Huang, Y.J., et al., The role of pannexin 1 hemichannels in ATP release and cell-
cell communication in mouse taste buds. Proc Natl Acad Sci U S A, 2007.
104(15): p. 6436-41.
66. Romanov, R.A., et al., Voltage dependence of ATP secretion in mammalian taste
cells. J Gen Physiol, 2008. 132(6): p. 731-44.
67. Chaudhari, N. and S.D. Roper, The cell biology of taste. J Cell Biol, 2010. 190(3):
p. 285-96.
68. Chale-Rush, A., J.R. Burgess, and R.D. Mattes, Evidence for human orosensory
(taste?) sensitivity to free fatty acids. Chem Senses, 2007. 32(5): p. 423-31.
69. Chale-Rush, A., J.R. Burgess, and R.D. Mattes, Multiple routes of
chemosensitivity to free fatty acids in humans. Am J Physiol Gastrointest Liver
Physiol, 2007. 292(5): p. G1206-12.
70. Mattes, R.D., Oral detection of short-, medium-, and long-chain free fatty acids in
humans. Chem Senses, 2009. 34(2): p. 145-50.
71. Stewart, J.E., et al., Oral sensitivity to fatty acids, food consumption and BMI in
human subjects. Br J Nutr, 2010. 104(1): p. 145-52.

170
72. Hamilton, C.L., Rat's Preference for High Fat Diets. J Comp Physiol Psychol,
1964. 58: p. 459-60.
73. Reed, D.R., M.G. Tordoff, and M.I. Friedman, Enhanced acceptance and
metabolism of fats by rats fed a high-fat diet. Am J Physiol, 1991. 261(5 Pt 2): p.
R1084-8.
74. Takeda, M., M. Imaizumi, and T. Fushiki, Preference for vegetable oils in the two-
bottle choice test in mice. Life Sci, 2000. 67(2): p. 197-204.
75. Tsuruta, M., et al., The orosensory recognition of long-chain fatty acids in rats.
Physiol Behav, 1999. 66(2): p. 285-8.
76. Smith, J.C., et al., Orosensory factors in the ingestion of corn oil/sucrose
mixtures by the rat. Physiol Behav, 2000. 69(1-2): p. 135-46.
77. Mindell, S., G.P. Smith, and D. Greenberg, Corn oil and mineral oil stimulate
sham feeding in rats. Physiol Behav, 1990. 48(2): p. 283-7.
78. Reed, D.R., M.G. Tordoff, and M.I. Friedman, Sham-feeding of corn oil by rats:
sensory and postingestive factors. Physiol Behav, 1990. 47(4): p. 779-81.
79. Gaillard, D., et al., The gustatory pathway is involved in CD36-mediated
orosensory perception of long-chain fatty acids in the mouse. FASEB J, 2008.
22(5): p. 1458-68.
80. Tordoff, M.G. and D.R. Reed, Sham-feeding sucrose or corn oil stimulates food
intake in rats. Appetite, 1991. 17(2): p. 97-103.
81. Fukuwatari, T., et al., Expression of the putative membrane fatty acid transporter
(FAT) in taste buds of the circumvallate papillae in rats. FEBS Lett, 1997. 414(2):
p. 461-4.

171
82. Laugerette, F., et al., CD36 involvement in orosensory detection of dietary lipids,
spontaneous fat preference, and digestive secretions. J Clin Invest, 2005.
115(11): p. 3177-84.
83. Cartoni, C., et al., Taste preference for fatty acids is mediated by GPR40 and
GPR120. J Neurosci, 2010. 30(25): p. 8376-82.
84. Matsumura, S., et al., Colocalization of GPR120 with phospholipase-Cbeta2 and
alpha-gustducin in the taste bud cells in mice. Neurosci Lett, 2009. 450(2): p.
186-90.
85. Matsumura, S., et al., GPR expression in the rat taste bud relating to fatty acid
sensing. Biomed Res, 2007. 28(1): p. 49-55.
86. Gilbertson, T.A., et al., Fatty acid responses in taste cells from obesity-prone and
-resistant rats. Physiol Behav, 2005. 86(5): p. 681-90.
87. Gilbertson, T.A. and J.D. Boughter, Jr., Taste transduction: appetizing times in
gustation. Neuroreport, 2003. 14(7): p. 905-11.
88. Gilbertson, T.A., et al., Fatty acid modulation of K+ channels in taste receptor
cells: gustatory cues for dietary fat. Am J Physiol, 1997. 272(4 Pt 1): p. C1203-10.
89. Liu, L., et al., Expression and characterization of delayed rectifying K+ channels
in anterior rat taste buds. Am J Physiol Cell Physiol, 2005. 289(4): p. C868-80.
90. Honore, E., et al., External blockade of the major cardiac delayed-rectifier K+
channel (Kv1.5) by polyunsaturated fatty acids. Proc Natl Acad Sci U S A, 1994.
91(5): p. 1937-41.

172
91. Liou, A.P., et al., The G-protein-coupled receptor GPR40 directly mediates long-
chain fatty acid-induced secretion of cholecystokinin. Gastroenterology, 2011.
140(3): p. 903-12.
92. Tanaka, T., et al., Free fatty acids induce cholecystokinin secretion through
GPR120. Naunyn Schmiedebergs Arch Pharmacol, 2008. 377(4-6): p. 523-7.
93. Hirasawa, A., et al., Free fatty acids regulate gut incretin glucagon-like peptide-1
secretion through GPR120. Nat Med, 2005. 11(1): p. 90-4.
94. Saitoh, O., A. Hirano, and Y. Nishimura, Intestinal STC-1 cells respond to five
basic taste stimuli. Neuroreport, 2007. 18(18): p. 1991-5.
95. Harmon, C.M. and N.A. Abumrad, Binding of sulfosuccinimidyl fatty acids to
adipocyte membrane proteins: isolation and amino-terminal sequence of an 88-
kD protein implicated in transport of long-chain fatty acids. J Membr Biol, 1993.
133(1): p. 43-9.
96. Simons, P.J., et al., Apical CD36 immunolocalization in human and porcine taste
buds from circumvallate and foliate papillae. Acta Histochem, 2011. 113(8): p.
839-43.
97. Kawai, T. and T. Fushiki, Importance of lipolysis in oral cavity for orosensory
detection of fat. Am J Physiol Regul Integr Comp Physiol, 2003. 285(2): p. R447-
54.
98. Rac, M.E., K. Safranow, and W. Poncyljusz, Molecular basis of human CD36
gene mutations. Mol Med, 2007. 13(5-6): p. 288-96.

173
99. Baillie, A.G., C.T. Coburn, and N.A. Abumrad, Reversible binding of long-chain
fatty acids to purified FAT, the adipose CD36 homolog. J Membr Biol, 1996.
153(1): p. 75-81.
100. Ibrahimi, A., et al., Expression of the CD36 homolog (FAT) in fibroblast cells:
effects on fatty acid transport. Proc Natl Acad Sci U S A, 1996. 93(7): p. 2646-51.
101. Sclafani, A., K. Ackroff, and N.A. Abumrad, CD36 gene deletion reduces fat
preference and intake but not post-oral fat conditioning in mice. Am J Physiol
Regul Integr Comp Physiol, 2007. 293(5): p. R1823-32.
102. Tepper, B.J. and K.L. Keller, Can we taste fats? The Scientist, 2011.
November/December 2011.
103. Gousset, K., et al., Important role of raft aggregation in the signaling events of
cold-induced platelet activation. Biochim Biophys Acta, 2004. 1660(1-2): p. 7-15.
104. Liu, D. and E.R. Liman, Intracellular Ca2+ and the phospholipid PIP2 regulate the
taste transduction ion channel TRPM5. Proc Natl Acad Sci U S A, 2003. 100(25):
p. 15160-5.
105. Sclafani, A., et al., Fat and carbohydrate preferences in mice: the contribution of
alpha-gustducin and Trpm5 taste-signaling proteins. Am J Physiol Regul Integr
Comp Physiol, 2007. 293(4): p. R1504-13.
106. El-Yassimi, A., et al., Linoleic acid induces calcium signaling, Src kinase
phosphorylation, and neurotransmitter release in mouse CD36-positive gustatory
cells. J Biol Chem, 2008. 283(19): p. 12949-59.
107. Huang, Y.A., Y. Maruyama, and S.D. Roper, Norepinephrine is coreleased with
serotonin in mouse taste buds. J Neurosci, 2008. 28(49): p. 13088-93.
174
108. Huang, Y.J., et al., Mouse taste buds use serotonin as a neurotransmitter. J
Neurosci, 2005. 25(4): p. 843-7.
109. Huang, Y.J., et al., Mouse taste buds release serotonin in response to taste
stimuli. Chem Senses, 2005. 30 Suppl 1: p. i39-40.
110. Oakley, B., et al., The morphogenesis of mouse vallate gustatory epithelium and
taste buds requires BDNF-dependent taste neurons. Brain Res Dev Brain Res,
1998. 105(1): p. 85-96.
111. Takeda, M. and K. Kitao, Effect of monoamines on the taste buds in the mouse.
Cell Tissue Res, 1980. 210(1): p. 71-8.
112. Takeda, M., et al., Biogenic monoamines in developing taste buds of mouse
circumvallate papillae. Arch Histol Jpn, 1981. 44(5): p. 485-95.
113. Herness, S. and F.L. Zhao, The neuropeptides CCK and NPY and the changing
view of cell-to-cell communication in the taste bud. Physiol Behav, 2009. 97(5): p.
581-91.
114. Herness, S., et al., Expression and physiological actions of cholecystokinin in rat
taste receptor cells. J Neurosci, 2002. 22(22): p. 10018-29.
115. Lu, S.G., F.L. Zhao, and S. Herness, Physiological phenotyping of
cholecystokinin-responsive rat taste receptor cells. Neurosci Lett, 2003. 351(3): p.
157-60.
116. Shen, T., et al., Co-expression patterns of the neuropeptides vasoactive
intestinal peptide and cholecystokinin with the transduction molecules alpha-
gustducin and T1R2 in rat taste receptor cells. Neuroscience, 2005. 130(1): p.
229-38.

175
117. Zhao, F.L., et al., Expression, physiological action, and coexpression patterns of
neuropeptide Y in rat taste-bud cells. Proc Natl Acad Sci U S A, 2005. 102(31): p.
11100-5.
118. Carleton, A., R. Accolla, and S.A. Simon, Coding in the mammalian gustatory
system. Trends Neurosci, 2010. 33(7): p. 326-34.
119. Lemon, C.H. and D.V. Smith, Neural representation of bitter taste in the nucleus
of the solitary tract. J Neurophysiol, 2005. 94(6): p. 3719-29.
120. Geran, L.C. and S.P. Travers, Single neurons in the nucleus of the solitary tract
respond selectively to bitter taste stimuli. J Neurophysiol, 2006. 96(5): p. 2513-27.
121. Geran, L.C. and S.P. Travers, Bitter-responsive gustatory neurons in the rat
parabrachial nucleus. J Neurophysiol, 2009. 101(3): p. 1598-612.
122. Travers, S.P. and L.C. Geran, Bitter-responsive brainstem neurons:
characteristics and functions. Physiol Behav, 2009. 97(5): p. 592-603.
123. Roussin, A.T., et al., Variability in responses and temporal coding of tastants of
similar quality in the nucleus of the solitary tract of the rat. J Neurophysiol, 2008.
99(2): p. 644-55.
124. Monroe, S. and P.M. Di Lorenzo, Taste responses in neurons in the nucleus of
the solitary tract that do and do not project to the parabrachial pons. J
Neurophysiol, 1995. 74(1): p. 249-57.
125. Lemon, C.H. and R.F. Margolskee, Contribution of the T1r3 taste receptor to the
response properties of central gustatory neurons. J Neurophysiol, 2009. 101(5):
p. 2459-71.

176
126. Jones, L.M., et al., Natural stimuli evoke dynamic sequences of states in sensory
cortical ensembles. Proc Natl Acad Sci U S A, 2007. 104(47): p. 18772-7.
127. Stapleton, J.R., et al., Ensembles of gustatory cortical neurons anticipate and
discriminate between tastants in a single lick. Front Neurosci, 2007. 1(1): p. 161-
74.
128. Stapleton, J.R., et al., Rapid taste responses in the gustatory cortex during
licking. J Neurosci, 2006. 26(15): p. 4126-38.
129. Grossman, S.E., et al., Learning-related plasticity of temporal coding in
simultaneously recorded amygdala-cortical ensembles. J Neurosci, 2008. 28(11):
p. 2864-73.
130. Yasoshima, Y. and T. Yamamoto, Short-term and long-term excitability changes
of the insular cortical neurons after the acquisition of taste aversion learning in
behaving rats. Neuroscience, 1998. 84(1): p. 1-5.
131. Accolla, R. and A. Carleton, Internal body state influences topographical plasticity
of sensory representations in the rat gustatory cortex. Proc Natl Acad Sci U S A,
2008. 105(10): p. 4010-5.
132. Sclafani, A. and K. Ackroff, Reinforcement value of sucrose measured by
progressive ratio operant licking in the rat. Physiol Behav, 2003. 79(4-5): p. 663-
70.
133. Yoneda, T., et al., Reinforcing effect for corn oil stimulus was concentration
dependent in an operant task in mice. Life Sci, 2007. 81(23-24): p. 1585-92.
134. Norgren, R., Taste pathways to hypothalamus and amygdala. J Comp Neurol,
1976. 166(1): p. 17-30.

177
135. Hajnal, A., R. Norgren, and P. Kovacs, Parabrachial coding of sapid sucrose:
relevance to reward and obesity. Ann N Y Acad Sci, 2009. 1170: p. 347-64.
136. Small, D.M., M. Jones-Gotman, and A. Dagher, Feeding-induced dopamine
release in dorsal striatum correlates with meal pleasantness ratings in healthy
human volunteers. Neuroimage, 2003. 19(4): p. 1709-15.
137. Volkow, N.D., et al., Brain dopamine is associated with eating behaviors in
humans. Int J Eat Disord, 2003. 33(2): p. 136-42.
138. Mark, G.P., D.S. Blander, and B.G. Hoebel, A conditioned stimulus decreases
extracellular dopamine in the nucleus accumbens after the development of a
learned taste aversion. Brain Res, 1991. 551(1-2): p. 308-10.
139. Grigson, P.S. and A. Hajnal, Once is too much: conditioned changes in
accumbens dopamine following a single saccharin-morphine pairing. Behav
Neurosci, 2007. 121(6): p. 1234-42.
140. Hajnal, A. and R. Norgren, Accumbens dopamine mechanisms in sucrose intake.
Brain Res, 2001. 904(1): p. 76-84.
141. Hajnal, A., G.P. Smith, and R. Norgren, Oral sucrose stimulation increases
accumbens dopamine in the rat. Am J Physiol Regul Integr Comp Physiol, 2004.
286(1): p. R31-7.
142. Liang, N.C., A. Hajnal, and R. Norgren, Sham feeding corn oil increases
accumbens dopamine in the rat. Am J Physiol Regul Integr Comp Physiol, 2006.
291(5): p. R1236-9.
178
143. De Jonghe, B.C., A. Hajnal, and M. Covasa, Increased oral and decreased
intestinal sensitivity to sucrose in obese, prediabetic CCK-A receptor-deficient
OLETF rats. Am J Physiol Regul Integr Comp Physiol, 2005. 288(1): p. R292-300.
144. Hajnal, A., M. Covasa, and N.T. Bello, Altered taste sensitivity in obese,
prediabetic OLETF rats lacking CCK-1 receptors. Am J Physiol Regul Integr
Comp Physiol, 2005. 289(6): p. R1675-86.
145. Geiger, B.M., et al., Deficits of mesolimbic dopamine neurotransmission in rat
dietary obesity. Neuroscience, 2009. 159(4): p. 1193-9.
146. Kawai, K., et al., Leptin as a modulator of sweet taste sensitivities in mice. Proc
Natl Acad Sci U S A, 2000. 97(20): p. 11044-9.
147. Mook, D.G., J.A. Brane, and J.A. Whitt, Effects of food deprivation on intake of
solid and liquid sugars in the rat. Appetite, 1983. 4(4): p. 259-68.
148. Hajnal, A., et al., Obese OLETF rats exhibit increased operant performance for
palatable sucrose solutions and differential sensitivity to D2 receptor antagonism.
Am J Physiol Regul Integr Comp Physiol, 2007. 293(5): p. R1846-54.
149. Hajnal, A., B.C. De Jonghe, and M. Covasa, Dopamine D2 receptors contribute
to increased avidity for sucrose in obese rats lacking CCK-1 receptors.
Neuroscience, 2007. 148(2): p. 584-92.
150. Chen, K., et al., Nutritional status alters saccharin intake and sweet receptor
mRNA expression in rat taste buds. Brain Res, 2010. 1325: p. 53-62.
151. Eny, K.M., et al., Genetic variation in TAS1R2 (Ile191Val) is associated with
consumption of sugars in overweight and obese individuals in 2 distinct
populations. Am J Clin Nutr, 2010. 92(6): p. 1501-10.

179
152. Pangborn, R.M. and M. Simone, Body size and sweetness preference. J Am Diet
Assoc, 1958. 34(9): p. 924-8.
153. Thompson, D.A., H.R. Moskowitz, and R.G. Campbell, Effects of body weight
and food intake on pleasantness ratings for a sweet stimulus. J Appl Physiol,
1976. 41(1): p. 77-83.
154. Underwood, P.J., E. Belton, and P. Hulme, Aversion to sucrose in obesity. Proc
Nutr Soc, 1973. 32(3): p. 93A-94A.
155. Wooley, O.W., S.C. Wooley, and R.B. Dunham, Calories and sweet taste: effects
on sucrose preference in the obese and nonobese. Physiol Behav, 1972. 9(5): p.
765-8.
156. Drewnowski, A., et al., Sweet tooth reconsidered: taste responsiveness in human
obesity. Physiol Behav, 1985. 35(4): p. 617-22.
157. Bartoshuk, L.M., et al., Valid across-group comparisons with labeled scales: the
gLMS versus magnitude matching. Physiol Behav, 2004. 82(1): p. 109-14.
158. Bartoshuk, L.M., et al., Psychophysics of sweet and fat perception in obesity:
problems, solutions and new perspectives. Philos Trans R Soc Lond B Biol Sci,
2006. 361(1471): p. 1137-48.
159. Moskowitz, H.R., The sweetness and pleasantness of sugars. Am J Psychol,
1971. 84(3): p. 387-405.
160. Moskowitz, H.R., et al., Sugar sweetness and pleasantness: evidence for
different psychological laws. Science, 1974. 184(4136): p. 583-5.
180
161. Glendinning, J.I., et al., Taste does not determine daily intake of dilute sugar
solutions in mice. Am J Physiol Regul Integr Comp Physiol, 2010. 299(5): p.
R1333-41.
162. Swartz, T.D., A. Hajnal, and M. Covasa, Altered orosensory sensitivity to oils in
CCK-1 receptor deficient rats. Physiol Behav, 2010. 99(1): p. 109-17.
163. Martin, C., et al., The lipid-sensor candidates CD36 and GPR120 are
differentially regulated by dietary lipids in mouse taste buds: impact on
spontaneous fat preference. PLoS One, 2011. 6(8): p. e24014.
164. Swartz, T.D., D.M. Savastano, and M. Covasa, Reduced sensitivity to
cholecystokinin in male rats fed a high-fat diet is reversible. J Nutr, 2010. 140(9):
p. 1698-703.
165. Pittman, D.W., et al., Orosensory detection of fatty acids by obesity-prone and
obesity-resistant rats: strain and sex differences. Chem Senses, 2008. 33(5): p.
449-60.
166. Gilbertson, T.A., et al., Dietary fat preferences are inversely correlated with
peripheral gustatory fatty acid sensitivity. Ann N Y Acad Sci, 1998. 855: p. 165-8.
167. Mela, D.J. and D.A. Sacchetti, Sensory preferences for fats: relationships with
diet and body composition. Am J Clin Nutr, 1991. 53(4): p. 908-15.
168. Pangborn, R.M., K.E. Bos, and J.S. Stern, Dietary fat intake and taste responses
to fat in milk by under-, normal, and overweight women. Appetite, 1985. 6(1): p.
25-40.
169. Keller, K.L., Genetic influences on oral fat perception and preference: Presented
at the symposium "The Taste for Fat: New Discoveries on the Role of Fat in

181
Sensory Perception, Metabolism, Sensory Pleasure and Beyond" held at the
Institute of Food Technologists 2011 Annual Meeting, New Orleans, LA, June 12,
2011. J Food Sci, 2012. 77(3): p. S143-7.
170. Keller, K.L., et al., Common Variants in the CD36 Gene Are Associated With Oral
Fat Perception, Fat Preferences, and Obesity in African Americans. Obesity
(Silver Spring), 2012. 20(5): p. 1066-73.
171. Busch, W., Contribution to the physiology of the digestive organs. Arch Pathol
Anat Physiol Klin Med, 1858. 14: p. 140 - 186.
172. Mook, D.G., Oral and postingestional determinants of the intake of various
solutions in rats with esophageal fistulas. J Comp Physiol Psychol, 1963. 56: p.
645 - 659.
173. Gibbs, J., R.C. Young, and G.P. Smith, Cholecystokinin elicits satiety in rats with
open gastric fistulas. Nature, 1973. 245(5424): p. 323-5.
174. Davis, J.D. and G.P. Smith, Learning to sham feed: behavioral adjustments to
loss of physiological postingestional stimuli. Am J Physiol, 1990. 259(6 Pt 2): p.
R1228-35.
175. Eisen, S., et al., Gastric negative feedback produced by volume and nutrient
during a meal in rats. Am J Physiol Regul Integr Comp Physiol, 2001. 281(4): p.
R1201-14.
176. Phillips, R.J. and T.L. Powley, Gastric volume rather than nutrient content inhibits
food intake. Am J Physiol, 1996. 271(3 Pt 2): p. R766-9.
177. Gibbs, J. and G.P. Smith, Gut peptides and food in the gut produce similar
satiety effects. Peptides, 1982. 3(3): p. 553-7.
182
178. Nonidez, J.F., Afferent nerve endings in the ganglia of the intermuscular plexus
of the dog's oesophagus. J Comp Neurol, 1946. 85(2): p. 177-89.
179. Rodrigo, J., et al., Vegetative innervation of the esophagus. II. Intraganglionic
laminar endings. Acta Anat (Basel), 1975. 92(1): p. 79-100.
180. Berthoud, H.R. and T.L. Powley, Vagal afferent innervation of the rat fundic
stomach: morphological characterization of the gastric tension receptor. J Comp
Neurol, 1992. 319(2): p. 261-76.
181. Zagorodnyuk, V.P. and S.J. Brookes, Transduction sites of vagal
mechanoreceptors in the guinea pig esophagus. J Neurosci, 2000. 20(16): p.
6249-55.
182. Zagorodnyuk, V.P., B.N. Chen, and S.J. Brookes, Intraganglionic laminar
endings are mechano-transduction sites of vagal tension receptors in the guinea-
pig stomach. J Physiol, 2001. 534(Pt 1): p. 255-68.
183. Seeley, R.J., J.M. Kaplan, and H.J. Grill, Effect of occluding the pylorus on
intraoral intake: a test of the gastric hypothesis of meal termination. Physiol
Behav, 1995. 58(2): p. 245-9.
184. Kaplan, J.M., A.C. Spector, and H.J. Grill, Dynamics of gastric emptying during
and after stomach fill. Am J Physiol, 1992. 263(4 Pt 2): p. R813-9.
185. Bado, A., et al., The stomach is a source of leptin. Nature, 1998. 394(6695): p.
790-3.
186. Mix, H., et al., Expression of leptin and its receptor in the human stomach.
Gastroenterology, 1999. 117(2): p. 509.

183
187. Mix, H., et al., Expression of leptin and leptin receptor isoforms in the human
stomach. Gut, 2000. 47(4): p. 481-6.
188. Sobhani, I., et al., Leptin secretion and leptin receptor in the human stomach. Gut,
2000. 47(2): p. 178-83.
189. Guilmeau, S., et al., Duodenal leptin stimulates cholecystokinin secretion:
evidence of a positive leptin-cholecystokinin feedback loop. Diabetes, 2003.
52(7): p. 1664-72.
190. Attoub, S., et al., Physiological role of cholecystokinin B/gastrin receptor in leptin
secretion. Endocrinology, 1999. 140(10): p. 4406-10.
191. Sobhani, I., et al., Vagal stimulation rapidly increases leptin secretion in human
stomach. Gastroenterology, 2002. 122(2): p. 259-63.
192. Burdyga, G., et al., Expression of the leptin receptor in rat and human nodose
ganglion neurones. Neuroscience, 2002. 109(2): p. 339-47.
193. Buyse, M., et al., Expression and regulation of leptin receptor proteins in afferent
and efferent neurons of the vagus nerve. Eur J Neurosci, 2001. 14(1): p. 64-72.
194. Wang, Y.H., et al., Two types of leptin-responsive gastric vagal afferent
terminals: an in vitro single-unit study in rats. Am J Physiol, 1997. 273(2 Pt 2): p.
R833-7.
195. Peters, J.H., et al., Cooperative activation of cultured vagal afferent neurons by
leptin and cholecystokinin. Endocrinology, 2004. 145(8): p. 3652-7.
196. Peters, J.H., R.C. Ritter, and S.M. Simasko, Leptin and CCK selectively activate
vagal afferent neurons innervating the stomach and duodenum. Am J Physiol
Regul Integr Comp Physiol, 2006. 290(6): p. R1544-9.
184
197. Peters, J.H., R.C. Ritter, and S.M. Simasko, Leptin and CCK modulate
complementary background conductances to depolarize cultured nodose
neurons. Am J Physiol Cell Physiol, 2006. 290(2): p. C427-32.
198. Matson, C.A., et al., Cholecystokinin and leptin act synergistically to reduce body
weight. Am J Physiol Regul Integr Comp Physiol, 2000. 278(4): p. R882-90.
199. Matson, C.A., D.F. Reid, and R.C. Ritter, Daily CCK injection enhances reduction
of body weight by chronic intracerebroventricular leptin infusion. Am J Physiol
Regul Integr Comp Physiol, 2002. 282(5): p. R1368-73.
200. Zhang, J. and R.C. Ritter, Circulating GLP-1 and CCK-8 reduce food intake by
capsaicin-insensitive, nonvagal mechanisms. Am J Physiol Regul Integr Comp
Physiol, 2012. 302(2): p. R264-73.
201. Lostao, M.P., et al., Presence of leptin receptors in rat small intestine and leptin
effect on sugar absorption. FEBS Lett, 1998. 423(3): p. 302-6.
202. Buyse, M., et al., PepT1-mediated epithelial transport of dipeptides and
cephalexin is enhanced by luminal leptin in the small intestine. J Clin Invest,
2001. 108(10): p. 1483-94.
203. Fanjul, C., et al., Leptin regulates sugar and amino acids transport in the human
intestinal cell line Caco-2. Acta Physiol (Oxf), 2012. 205(1): p. 82-91.
204. Sakar, Y., et al., Positive regulatory control loop between gut leptin and intestinal
GLUT2/GLUT5 transporters links to hepatic metabolic functions in rodents. PLoS
One, 2009. 4(11): p. e7935.
205. Morton, N.M., et al., Leptin action in intestinal cells. J Biol Chem, 1998. 273(40):
p. 26194-201.

185
206. Stan, S., et al., Effect of human recombinant leptin on lipid handling by fully
differentiated Caco-2 cells. FEBS Lett, 2001. 508(1): p. 80-4.
207. Date, Y., et al., Ghrelin, a novel growth hormone-releasing acylated peptide, is
synthesized in a distinct endocrine cell type in the gastrointestinal tracts of rats
and humans. Endocrinology, 2000. 141(11): p. 4255-61.
208. Kojima, M., et al., Ghrelin is a growth-hormone-releasing acylated peptide from
stomach. Nature, 1999. 402(6762): p. 656-60.
209. Wren, A.M., et al., The novel hypothalamic peptide ghrelin stimulates food intake
and growth hormone secretion. Endocrinology, 2000. 141(11): p. 4325-8.
210. Lu, S., et al., Immunocytochemical observation of ghrelin-containing neurons in
the rat arcuate nucleus. Neurosci Lett, 2002. 321(3): p. 157-60.
211. Hosoda, H., et al., Ghrelin and des-acyl ghrelin: two major forms of rat ghrelin
peptide in gastrointestinal tissue. Biochem Biophys Res Commun, 2000. 279(3):
p. 909-13.
212. Jeon, T.Y., et al., Changes in plasma ghrelin concentration immediately after
gastrectomy in patients with early gastric cancer. J Clin Endocrinol Metab, 2004.
89(11): p. 5392-6.
213. Yabuki, A., et al., Characterization and species differences in gastric ghrelin cells
from mice, rats and hamsters. J Anat, 2004. 205(3): p. 239-46.
214. van der Lely, A.J., et al., Biological, physiological, pathophysiological, and
pharmacological aspects of ghrelin. Endocr Rev, 2004. 25(3): p. 426-57.

186
215. Hosoda, H., et al., Structural divergence of human ghrelin. Identification of
multiple ghrelin-derived molecules produced by post-translational processing. J
Biol Chem, 2003. 278(1): p. 64-70.
216. Yang, J., et al., Identification of the acyltransferase that octanoylates ghrelin, an
appetite-stimulating peptide hormone. Cell, 2008. 132(3): p. 387-96.
217. Yokota, I., et al., Concentration of the n-octanoylated active form of ghrelin in
fetal and neonatal circulation. Endocr J, 2005. 52(2): p. 271-6.
218. Tschop, M., D.L. Smiley, and M.L. Heiman, Ghrelin induces adiposity in rodents.
Nature, 2000. 407(6806): p. 908-13.
219. Wren, A.M., et al., Ghrelin enhances appetite and increases food intake in
humans. J Clin Endocrinol Metab, 2001. 86(12): p. 5992.
220. Wren, A.M., et al., Ghrelin causes hyperphagia and obesity in rats. Diabetes,
2001. 50(11): p. 2540-7.
221. Nakazato, M., et al., A role for ghrelin in the central regulation of feeding. Nature,
2001. 409(6817): p. 194-8.
222. Asakawa, A., et al., Antagonism of ghrelin receptor reduces food intake and body
weight gain in mice. Gut, 2003. 52(7): p. 947-52.
223. Druce, M.R., et al., Ghrelin increases food intake in obese as well as lean
subjects. Int J Obes (Lond), 2005. 29(9): p. 1130-6.
224. Wolden-Hanson, T., Mechanisms of the anorexia of aging in the Brown Norway
rat. Physiol Behav, 2006. 88(3): p. 267-76.
187
225. Ariyasu, H., et al., Stomach is a major source of circulating ghrelin, and feeding
state determines plasma ghrelin-like immunoreactivity levels in humans. J Clin
Endocrinol Metab, 2001. 86(10): p. 4753-8.
226. Tups, A., et al., Circulating ghrelin levels and central ghrelin receptor expression
are elevated in response to food deprivation in a seasonal mammal (Phodopus
sungorus). J Neuroendocrinol, 2004. 16(11): p. 922-8.
227. Drazen, D.L., et al., Effects of a fixed meal pattern on ghrelin secretion: evidence
for a learned response independent of nutrient status. Endocrinology, 2006.
147(1): p. 23-30.
228. Cummings, D.E., et al., A preprandial rise in plasma ghrelin levels suggests a
role in meal initiation in humans. Diabetes, 2001. 50(8): p. 1714-9.
229. Otto, B., et al., Weight gain decreases elevated plasma ghrelin concentrations of
patients with anorexia nervosa. Eur J Endocrinol, 2001. 145(5): p. 669-73.
230. Cummings, D.E., et al., Plasma ghrelin levels after diet-induced weight loss or
gastric bypass surgery. N Engl J Med, 2002. 346(21): p. 1623-30.
231. Foster-Schubert, K.E., et al., Acyl and total ghrelin are suppressed strongly by
ingested proteins, weakly by lipids, and biphasically by carbohydrates. J Clin
Endocrinol Metab, 2008. 93(5): p. 1971-9.
232. Williams, D.L., et al., Meal-related ghrelin suppression requires postgastric
feedback. Endocrinology, 2003. 144(7): p. 2765-7.
233. Feinle-Bisset, C., et al., Fat digestion is required for suppression of ghrelin and
stimulation of peptide YY and pancreatic polypeptide secretion by intraduodenal
lipid. Am J Physiol Endocrinol Metab, 2005. 289(6): p. E948-53.

188
234. Chapman, I.M., et al., Effects of small-intestinal fat and carbohydrate infusions on
appetite and food intake in obese and nonobese men. Am J Clin Nutr, 1999.
69(1): p. 6-12.
235. Gibbs, J., S.P. Maddison, and E.T. Rolls, Satiety role of the small intestine
examined in sham-feeding rhesus monkeys. J Comp Physiol Psychol, 1981.
95(6): p. 1003-15.
236. Matzinger, D., et al., Inhibition of food intake in response to intestinal lipid is
mediated by cholecystokinin in humans. Am J Physiol, 1999. 277(6 Pt 2): p.
R1718-24.
237. Reidelberger, R.D., et al., Postgastric satiety in the sham-feeding rat. Am J
Physiol, 1983. 244(6): p. R872-81.
238. Yox, D.P., L. Brenner, and R.C. Ritter, CCK-receptor antagonists attenuate
suppression of sham feeding by intestinal nutrients. Am J Physiol, 1992. 262(4 Pt
2): p. R554-61.
239. Garnier, L., N. Mei, and J. Melone, Further data on the inhibitory enterogastric
reflex triggered by intestinal osmotic changes in cats. J Auton Nerv Syst, 1986.
16(3): p. 171-80.
240. Falasco, J.D., G.P. Smith, and J. Gibbs, Cholecystokinin suppresses sham
feeding in the rhesus monkey. Physiol Behav, 1979. 23(5): p. 887-90.
241. Houpt, T.R., K.A. Houpt, and A.A. Swan, Duodenal osmoconcentration and food
intake in pigs after ingestion of hypertonic nutrients. Am J Physiol, 1983. 245(2):
p. R181-9.

189
242. Yox, D.P. and R.C. Ritter, Capsaicin attenuates suppression of sham feeding
induced by intestinal nutrients. Am J Physiol, 1988. 255(4 Pt 2): p. R569-74.
243. Yox, D.P., H. Stokesberry, and R.C. Ritter, Vagotomy attenuates suppression of
sham feeding induced by intestinal nutrients. Am J Physiol, 1991. 260(3 Pt 2): p.
R503-8.
244. Yin, T.H. and C.T. Tsai, Effects of glucose on feeding in relation to routes of entry
in rats. J Comp Physiol Psychol, 1973. 85(2): p. 258-64.
245. Ritter, R.C., Brenner, L., Yox, D.P., Participation of vagal sensory neurons in
putative satiety signals from the upper gastrointestinal tract, in Neuroanatomy
and physiology of abdominal vagal afferents. 1992, CRC Press: Ann Arbor. p.
221 - 248.
246. Ritter, R.C., Gastrointestinal mechanisms of satiation for food. Physiol Behav,
2004. 81(2): p. 249-73.
247. Walls, E.K., et al., Suppression of meal size by intestinal nutrients is eliminated
by celiac vagal deafferentation. Am J Physiol, 1995. 269(6 Pt 2): p. R1410-9.
248. Meyer, J.H., et al., Length of intestinal contact on nutrient-driven satiety. Am J
Physiol, 1998. 275(4 Pt 2): p. R1308-19.
249. Ritter, R.C., T. Bui, and M. Covasa, Digestion and absorption are not required for
satiation by intestinal maltotriose, A.-S.f. Neuroscience, Editor. 2001.
250. Shirazi-Beechey, S.P., Molecular biology of intestinal glucose transport. Nutr Res
Rev, 1995. 8(1): p. 27-41.

190
251. Yoshikawa, T., et al., Comparative expression of hexose transporters (SGLT1,
GLUT1, GLUT2 and GLUT5) throughout the mouse gastrointestinal tract.
Histochem Cell Biol, 2011. 135(2): p. 183-94.
252. Affleck, J.A., P.A. Helliwell, and G.L. Kellett, Immunocytochemical detection of
GLUT2 at the rat intestinal brush-border membrane. J Histochem Cytochem,
2003. 51(11): p. 1567-74.
253. Kellett, G.L. and E. Brot-Laroche, Apical GLUT2: a major pathway of intestinal
sugar absorption. Diabetes, 2005. 54(10): p. 3056-62.
254. Kellett, G.L. and P.A. Helliwell, The diffusive component of intestinal glucose
absorption is mediated by the glucose-induced recruitment of GLUT2 to the
brush-border membrane. Biochem J, 2000. 350 Pt 1: p. 155-62.
255. Stumpel, F., et al., Normal kinetics of intestinal glucose absorption in the
absence of GLUT2: evidence for a transport pathway requiring glucose
phosphorylation and transfer into the endoplasmic reticulum. Proc Natl Acad Sci
U S A, 2001. 98(20): p. 11330-5.
256. Shirazi-Beechey, S.P., et al., Glucose sensing and signalling; regulation of
intestinal glucose transport. Proc Nutr Soc, 2011. 70(2): p. 185-93.
257. Dyer, J., K.B. Hosie, and S.P. Shirazi-Beechey, Nutrient regulation of human
intestinal sugar transporter (SGLT1) expression. Gut, 1997. 41(1): p. 56-9.
258. Ferraris, R.P. and J.M. Diamond, Crypt/villus site of substrate-dependent
regulation of mouse intestinal glucose transporters. Proc Natl Acad Sci U S A,
1993. 90(12): p. 5868-72.

191
259. Shirazi-Beechey, S.P., et al., Ontogenic development of lamb intestinal sodium-
glucose co-transporter is regulated by diet. J Physiol, 1991. 437: p. 699-708.
260. Solberg, D.H. and J.M. Diamond, Comparison of different dietary sugars as
inducers of intestinal sugar transporters. Am J Physiol, 1987. 252(4 Pt 1): p.
G574-84.
261. Shirazi-Beechey, S.P., et al., Postnatal development of lamb intestinal digestive
enzymes is not regulated by diet. J Physiol, 1991. 437: p. 691-8.
262. Stearns, A.T., et al., Rapid upregulation of sodium-glucose transporter SGLT1 in
response to intestinal sweet taste stimulation. Ann Surg, 2010. 251(5): p. 865-71.
263. Dyer, J., et al., Glucose sensing in the intestinal epithelium. Eur J Biochem, 2003.
270(16): p. 3377-88.
264. Batchelor, D.J., et al., Sodium/glucose cotransporter-1, sweet receptor, and
disaccharidase expression in the intestine of the domestic dog and cat: two
species of different dietary habit. Am J Physiol Regul Integr Comp Physiol, 2011.
300(1): p. R67-75.
265. Margolskee, R.F., et al., T1R3 and gustducin in gut sense sugars to regulate
expression of Na+-glucose cotransporter 1. Proc Natl Acad Sci U S A, 2007.
104(38): p. 15075-80.
266. Moran, A.W., et al., Expression of Na+/glucose co-transporter 1 (SGLT1) is
enhanced by supplementation of the diet of weaning piglets with artificial
sweeteners. Br J Nutr, 2010. 104(5): p. 637-46.
267. Hofer, D., E. Asan, and D. Drenckhahn, Chemosensory Perception in the Gut.
News Physiol Sci, 1999. 14: p. 18-23.

192
268. Wu, S.V., et al., Expression of bitter taste receptors of the T2R family in the
gastrointestinal tract and enteroendocrine STC-1 cells. Proc Natl Acad Sci U S A,
2002. 99(4): p. 2392-7.
269. Dyer, J., et al., Expression of sweet taste receptors of the T1R family in the
intestinal tract and enteroendocrine cells. Biochem Soc Trans, 2005. 33(Pt 1): p.
302-5.
270. Dyer, J., et al., Intestinal glucose sensing and regulation of intestinal glucose
absorption. Biochem Soc Trans, 2007. 35(Pt 5): p. 1191-4.
271. Shi, P. and J. Zhang, Contrasting modes of evolution between vertebrate
sweet/umami receptor genes and bitter receptor genes. Mol Biol Evol, 2006.
23(2): p. 292-300.
272. Barfull, A., et al., Ontogenetic expression and regulation of Na(+)-D-glucose
cotransporter in jejunum of domestic chicken. Am J Physiol Gastrointest Liver
Physiol, 2002. 282(3): p. G559-64.
273. Mace, O.J., et al., Sweet taste receptors in rat small intestine stimulate glucose
absorption through apical GLUT2. J Physiol, 2007. 582(Pt 1): p. 379-92.
274. Bezencon, C., J. le Coutre, and S. Damak, Taste-signaling proteins are
coexpressed in solitary intestinal epithelial cells. Chem Senses, 2007. 32(1): p.
41-9.
275. Ford, H.E., et al., Effects of oral ingestion of sucralose on gut hormone response
and appetite in healthy normal-weight subjects. Eur J Clin Nutr, 2011. 65(4): p.
508-13.

193
276. Reimann, F., et al., Glucose sensing in L cells: a primary cell study. Cell Metab,
2008. 8(6): p. 532-9.
277. Jang, H.J., et al., Gut-expressed gustducin and taste receptors regulate secretion
of glucagon-like peptide-1. Proc Natl Acad Sci U S A, 2007. 104(38): p. 15069-74.
278. Cheeseman, C.I., Upregulation of SGLT-1 transport activity in rat jejunum
induced by GLP-2 infusion in vivo. Am J Physiol, 1997. 273(6 Pt 2): p. R1965-71.
279. Cottrell, J.J., et al., Glucagon-like peptide-2 protects against TPN-induced
intestinal hexose malabsorption in enterally refed piglets. Am J Physiol
Gastrointest Liver Physiol, 2006. 290(2): p. G293-300.
280. Ramsanahie, A., et al., Effect of GLP-2 on mucosal morphology and SGLT1
expression in tissue-engineered neointestine. Am J Physiol Gastrointest Liver
Physiol, 2003. 285(6): p. G1345-52.
281. Sangild, P.T., et al., Glucagon-like peptide 2 stimulates intestinal nutrient
absorption in parenterally fed newborn pigs. J Pediatr Gastroenterol Nutr, 2006.
43(2): p. 160-7.
282. Baldassano, S., et al., Glucagon-like peptide-2 modulates neurally evoked
mucosal chloride secretion in guinea pig small intestine in vitro. Am J Physiol
Gastrointest Liver Physiol, 2009. 297(4): p. G800-5.
283. Bjerknes, M. and H. Cheng, Modulation of specific intestinal epithelial progenitors
by enteric neurons. Proc Natl Acad Sci U S A, 2001. 98(22): p. 12497-502.
284. Debnam, E.S., Adaptation of hexose uptake by the rat jejunum induced by the
perfusion of sugars into the distal ileum. Digestion, 1985. 31(1): p. 25-30.

194
285. Moreto, M., et al., Involvement of cellular cyclic AMP in theophylline-induced
sugar accumulation in chicken intestinal epithelial cells. Biochim Biophys Acta,
1984. 771(1): p. 68-73.
286. Nath, S.K. and J.F. Desjeux, Human intestinal cell lines as in vitro tools for
electrolyte transport studies with relevance to secretory diarrhoea. J Diarrhoeal
Dis Res, 1990. 8(4): p. 133-42.
287. Sharp, P.A. and E.S. Debnam, The role of cyclic AMP in the control of sugar
transport across the brush-border and basolateral membranes of rat jejunal
enterocytes. Exp Physiol, 1994. 79(2): p. 203-14.
288. Amsler, K., S. Ghatani, and B.A. Hemmings, cAMP-dependent protein kinase
regulates renal epithelial cell properties. Am J Physiol, 1991. 260(6 Pt 1): p.
C1290-9.
289. Williams, M. and P. Sharp, Regulation of jejunal glucose transporter expression
by forskolin. Biochim Biophys Acta, 2002. 1559(2): p. 179-85.
290. Greenberg, D., G.P. Smith, and J. Gibbs, Oleic acid inhibits sham feeding when
duodenally infused while triolein does not, A.S.f. Neuroscience, Editor. 1988.
291. Meyer, J.H., et al., Chemical specificities and intestinal distributions of nutrient-
driven satiety. Am J Physiol, 1998. 275(4 Pt 2): p. R1293-307.
292. Phan, C.T. and P. Tso, Intestinal lipid absorption and transport. Front Biosci,
2001. 6: p. D299-319.
293. Tso, P. and K. Fujimoto, The absorption and transport of lipids by the small
intestine. Brain Res Bull, 1991. 27(3-4): p. 477-82.

195
294. Tso, P. and S.R. Gollamudi, Pluronic L-81: a potent inhibitor of the transport of
intestinal chylomicrons. Am J Physiol, 1984. 247(1 Pt 1): p. G32-6.
295. Sakata, Y., et al., Postabsorptive factors are important for satiation in rats after a
lipid meal. Am J Physiol, 1996. 271(3 Pt 1): p. G438-42.
296. Lobo, M.V., et al., Localization of the lipid receptors CD36 and CLA-1/SR-BI in
the human gastrointestinal tract: towards the identification of receptors mediating
the intestinal absorption of dietary lipids. J Histochem Cytochem, 2001. 49(10): p.
1253-60.
297. Drover, V.A., et al., CD36 mediates both cellular uptake of very long chain fatty
acids and their intestinal absorption in mice. J Biol Chem, 2008. 283(19): p.
13108-15.
298. Nauli, A.M., et al., CD36 is important for chylomicron formation and secretion and
may mediate cholesterol uptake in the proximal intestine. Gastroenterology, 2006.
131(4): p. 1197-207.
299. Nassir, F., et al., CD36 is important for fatty acid and cholesterol uptake by the
proximal but not distal intestine. J Biol Chem, 2007. 282(27): p. 19493-501.
300. Goudriaan, J.R., et al., CD36 deficiency in mice impairs lipoprotein lipase-
mediated triglyceride clearance. J Lipid Res, 2005. 46(10): p. 2175-81.
301. Petit, V., et al., Chronic high-fat diet affects intestinal fat absorption and
postprandial triglyceride levels in the mouse. J Lipid Res, 2007. 48(2): p. 278-87.
302. Le Foll, C., et al., Characteristics and mechanisms of hypothalamic neuronal fatty
acid sensing. Am J Physiol Regul Integr Comp Physiol, 2009. 297(3): p. R655-64.

196
303. Schwartz, G.J., et al., The lipid messenger OEA links dietary fat intake to satiety.
Cell Metab, 2008. 8(4): p. 281-8.
304. Fu, J., et al., Targeted enhancement of oleoylethanolamide production in
proximal small intestine induces across-meal satiety in rats. Am J Physiol Regul
Integr Comp Physiol, 2008. 295(1): p. R45-50.
305. Schwartz, G.J., Gut fat sensing in the negative feedback control of energy
balance--recent advances. Physiol Behav, 2011. 104(4): p. 621-3.
306. Rodriguez de Fonseca, F., et al., An anorexic lipid mediator regulated by feeding.
Nature, 2001. 414(6860): p. 209-12.
307. Briscoe, C.P., et al., The orphan G protein-coupled receptor GPR40 is activated
by medium and long chain fatty acids. J Biol Chem, 2003. 278(13): p. 11303-11.
308. Lan, H., et al., Lack of FFAR1/GPR40 does not protect mice from high-fat diet-
induced metabolic disease. Diabetes, 2008. 57(11): p. 2999-3006.
309. Brown, A.J., et al., The Orphan G protein-coupled receptors GPR41 and GPR43
are activated by propionate and other short chain carboxylic acids. J Biol Chem,
2003. 278(13): p. 11312-9.
310. Tazoe, H., et al., Expression of short-chain fatty acid receptor GPR41 in the
human colon. Biomed Res, 2009. 30(3): p. 149-56.
311. Dass, N.B., et al., The relationship between the effects of short-chain fatty acids
on intestinal motility in vitro and GPR43 receptor activation. Neurogastroenterol
Motil, 2007. 19(1): p. 66-74.

197
312. Samuel, B.S., et al., Effects of the gut microbiota on host adiposity are modulated
by the short-chain fatty-acid binding G protein-coupled receptor, Gpr41. Proc Natl
Acad Sci U S A, 2008. 105(43): p. 16767-72.
313. Karaki, S., et al., Short-chain fatty acid receptor, GPR43, is expressed by
enteroendocrine cells and mucosal mast cells in rat intestine. Cell Tissue Res,
2006. 324(3): p. 353-60.
314. Ichimura, A., et al., Dysfunction of lipid sensor GPR120 leads to obesity in both
mouse and human. Nature, 2012. 483(7389): p. 350-4.
315. Cornall, L.M., et al., Diet-induced obesity up-regulates the abundance of GPR43
and GPR120 in a tissue specific manner. Cell Physiol Biochem, 2011. 28(5): p.
949-58.
316. Rayasam, G.V., et al., Fatty acid receptors as new therapeutic targets for
diabetes. Expert Opin Ther Targets, 2007. 11(5): p. 661-71.
317. Oh, D.Y., et al., GPR120 is an omega-3 fatty acid receptor mediating potent anti-
inflammatory and insulin-sensitizing effects. Cell, 2010. 142(5): p. 687-98.
318. Hara, T., et al., Novel selective ligands for free fatty acid receptors GPR120 and
GPR40. Naunyn Schmiedebergs Arch Pharmacol, 2009. 380(3): p. 247-55.
319. Katsuma, S., et al., Free fatty acids inhibit serum deprivation-induced apoptosis
through GPR120 in a murine enteroendocrine cell line STC-1. J Biol Chem, 2005.
280(20): p. 19507-15.
320. Sclafani, A., L.J. Fanizza, and A.V. Azzara, Conditioned flavor avoidance,
preference, and indifference produced by intragastric infusions of galactose,
glucose, and fructose in rats. Physiol Behav, 1999. 67(2): p. 227-34.

198
321. Ackroff, K. and A. Sclafani, Conditioned flavor preferences: evaluating
postingestive reinforcement by nutrients. Curr Protoc Neurosci, 2001. Chapter 8:
p. Unit 8 6F.
322. Ackroff, K., D.B. Drucker, and A. Sclafani, The CS-US delay gradient in flavor
preference conditioning with intragastric carbohydrate infusions. Physiol Behav,
2012. 105(2): p. 168-74.
323. Drucker, D.B., K. Ackroff, and A. Sclafani, Nutrient-conditioned flavor preference
and acceptance in rats: effects of deprivation state and nonreinforcement.
Physiol Behav, 1994. 56(4): p. 701-7.
324. Elizalde, G. and A. Sclafani, Flavor preferences conditioned by intragastric
polycose infusions: a detailed analysis using an electronic esophagus
preparation. Physiol Behav, 1990. 47(1): p. 63-77.
325. Myers, K.P., Robust preference for a flavor paired with intragastric glucose
acquired in a single trial. Appetite, 2007. 48(1): p. 123-7.
326. Perez, C., F. Lucas, and A. Sclafani, Increased flavor acceptance and preference
conditioned by the postingestive actions of glucose. Physiol Behav, 1998. 64(4):
p. 483-92.
327. Ramirez, I., Stimulus specificity in flavor acceptance learning. Physiol Behav,
1996. 60(2): p. 595-610.
328. Ramirez, I., Intragastric carbohydrate exerts both intake-stimulating and intake-
suppressing effects. Behav Neurosci, 1997. 111(3): p. 612-22.
199
329. Drucker, D.B. and A. Sclafani, The role of gastric and postgastric sites in
glucose-conditioned flavor preferences in rats. Physiol Behav, 1997. 61(2): p.
351-8.
330. Ackroff, K., Y.M. Yiin, and A. Sclafani, Post-oral infusion sites that support
glucose-conditioned flavor preferences in rats. Physiol Behav, 2010. 99(3): p.
402-11.
331. Gowans, S.E. and H.P. Weingarten, Elevations of plasma glucose do not support
taste-to-postingestive consequence learning. Am J Physiol, 1991. 261(6 Pt 2): p.
R1409-17.
332. Oliveira-Maia, A.J., et al., Intravascular food reward. PLoS One, 2011. 6(9): p.
e24992.
333. Ackroff, K., et al., Rapid acquisition of conditioned flavor preferences in rats.
Physiol Behav, 2009. 97(3-4): p. 406-13.
334. Ackroff, K. and A. Sclafani, Fructose-conditioned flavor preferences in male and
female rats: effects of sweet taste and sugar concentration. Appetite, 2004.
42(3): p. 287-97.
335. Ackroff, K., A. Sclafani, and K.V. Axen, Diabetic rats prefer glucose-paired flavors
over fructose-paired flavors. Appetite, 1997. 28(1): p. 73-83.
336. Ackroff, K., et al., Flavor preferences conditioned by intragastric fructose and
glucose: differences in reinforcement potency. Physiol Behav, 2001. 72(5): p.
691-703.
337. Sclafani, A. and D.L. Williams, Galactose consumption induces conditioned flavor
avoidance in rats. J Nutr, 1999. 129(9): p. 1737-41.

200
338. Sclafani, A. and K. Ackroff, Flavor preferences conditioned by intragastric
glucose but not fructose or galactose in C57BL/6J mice. Physiol Behav, 2012.
339. Lucas, F. and A. Sclafani, Differential reinforcing and satiating effects of
intragastric fat and carbohydrate infusions in rats. Physiol Behav, 1999. 66(3): p.
381-8.
340. Sclafani, A., et al., Gut T1R3 sweet taste receptors do not mediate sucrose-
conditioned flavor preferences in mice. Am J Physiol Regul Integr Comp Physiol,
2010. 299(6): p. R1643-50.
341. Wright, E.M., D.D. Loo, and B.A. Hirayama, Biology of human sodium glucose
transporters. Physiol Rev, 2011. 91(2): p. 733-94.
342. Sclafani, A., K. Ackroff, and G.J. Schwartz, Selective effects of vagal
deafferentation and celiac-superior mesenteric ganglionectomy on the reinforcing
and satiating action of intestinal nutrients. Physiol Behav, 2003. 78(2): p. 285-94.
343. Sclafani, A. and F. Lucas, Abdominal vagotomy does not block carbohydrate-
conditioned flavor preferences in rats. Physiol Behav, 1996. 60(2): p. 447-53.
344. Lucas, F. and A. Sclafani, Capsaicin attenuates feeding suppression but not
reinforcement by intestinal nutrients. Am J Physiol, 1996. 270(5 Pt 2): p. R1059-
64.
345. Perez, C., F. Lucas, and A. Sclafani, Devazepide, a CCK(A) antagonist,
attenuates the satiating but not the preference conditioning effects of intestinal
carbohydrate infusions in rats. Pharmacol Biochem Behav, 1998. 59(2): p. 451-7.
346. Perez, C. and A. Sclafani, Cholecystokinin conditions flavor preferences in rats.
Am J Physiol, 1991. 260(1 Pt 2): p. R179-85.
201
347. Ackroff, K. and A. Sclafani, Oral and Postoral Determinants of Dietary Fat
Appetite. 2010.
348. Lucas, F. and A. Sclafani, Flavor preferences conditioned by intragastric fat
infusions in rats. Physiol Behav, 1989. 46(3): p. 403-12.
349. Ackroff, K., F. Lucas, and A. Sclafani, Flavor preference conditioning as a
function of fat source. Physiol Behav, 2005. 85(4): p. 448-60.
350. Ackroff, K. and A. Sclafani, Effects of the lipase inhibitor orlistat on intake and
preference for dietary fat in rats. Am J Physiol, 1996. 271(1 Pt 2): p. R48-54.
351. Lucas, F., K. Ackroff, and A. Sclafani, High-fat diet preference and overeating
mediated by postingestive factors in rats. Am J Physiol, 1998. 275(5 Pt 2): p.
R1511-22.
352. Suzuki, A., T. Yamane, and T. Fushiki, Inhibition of fatty acid beta-oxidation
attenuates the reinforcing effects and palatability to fat. Nutrition, 2006. 22(4): p.
401-7.
353. Ren, X., et al., Nutrient selection in the absence of taste receptor signaling. J
Neurosci, 2010. 30(23): p. 8012-23.
354. Otsubo, H., et al., Induction of Fos expression in the rat forebrain after
intragastric administration of monosodium L-glutamate, glucose and NaCl.
Neuroscience, 2011. 196: p. 97-103.
355. Tsurugizawa, T., et al., Mechanisms of neural response to gastrointestinal
nutritive stimuli: the gut-brain axis. Gastroenterology, 2009. 137(1): p. 262-73.
356. Touzani, K., R. Bodnar, and A. Sclafani, Activation of dopamine D1-like receptors
in nucleus accumbens is critical for the acquisition, but not the expression, of

202
nutrient-conditioned flavor preferences in rats. Eur J Neurosci, 2008. 27(6): p.
1525-33.
357. Sclafani, A., et al., Parabrachial nucleus lesions block taste and attenuate flavor
preference and aversion conditioning in rats. Behav Neurosci, 2001. 115(4): p.
920-33.
358. Tsurugizawa, T., et al., Blood oxygenation level-dependent response to
intragastric load of corn oil emulsion in conscious rats. Neuroreport, 2009.
20(18): p. 1625-9.
359. Dela Cruz, J.A., et al., Roles of dopamine D1 and D2 receptors in the acquisition
and expression of fat-conditioned flavor preferences in rats. Neurobiol Learn
Mem, 2012. 97(3): p. 332-7.
360. Imaizumi, M., M. Takeda, and T. Fushiki, Effects of oil intake in the conditioned
place preference test in mice. Brain Res, 2000. 870(1-2): p. 150-6.
361. Ferreira, J.G., et al., Regulation of fat intake in the absence of flavour signalling.
J Physiol, 2012. 590(Pt 4): p. 953-72.
362. Schwartz, G.J., et al., Decreased responsiveness to dietary fat in Otsuka Long-
Evans Tokushima fatty rats lacking CCK-A receptors. Am J Physiol, 1999. 277(4
Pt 2): p. R1144-51.
363. Greenberg, D., et al., Differential satiating effects of fats in the small intestine of
obesity-resistant and obesity-prone rats. Physiol Behav, 1999. 66(4): p. 621-6.
364. Funakoshi, A., et al., Little or no expression of the cholecystokinin-A receptor
gene in the pancreas of diabetic rats (Otsuka Long-Evans Tokushima Fatty =
OLETF rats). Biochem Biophys Res Commun, 1994. 199(2): p. 482-8.

203
365. White, C.L., et al., Effect of meta-chlorophenylpiperazine and cholecystokinin on
food intake of Osborne-Mendel and S5B/P1 rats. Obesity (Silver Spring), 2007.
15(3): p. 624-31.
366. Matson, C.A. and R.C. Ritter, Long-term CCK-leptin synergy suggests a role for
CCK in the regulation of body weight. Am J Physiol, 1999. 276(4 Pt 2): p. R1038-
45.
367. Young, R.L., et al., Expression of taste molecules in the upper gastrointestinal
tract in humans with and without type 2 diabetes. Gut, 2009. 58(3): p. 337-46.
368. le Roux, C.W., et al., Gut hormone profiles following bariatric surgery favor an
anorectic state, facilitate weight loss, and improve metabolic parameters. Ann
Surg, 2006. 243(1): p. 108-14.
369. le Roux, C.W., et al., Attenuated peptide YY release in obese subjects is
associated with reduced satiety. Endocrinology, 2006. 147(1): p. 3-8.
370. le Roux, C.W., et al., Gut hormones as mediators of appetite and weight loss
after Roux-en-Y gastric bypass. Ann Surg, 2007. 246(5): p. 780-5.
371. Kaplan, J.M., R.J. Seeley, and H.J. Grill, Daily caloric intake in intact and chronic
decerebrate rats. Behav Neurosci, 1993. 107(5): p. 876-81.
372. Flynn, F.W., K.C. Berridge, and H.J. Grill, Pre- and postabsorptive insulin
secretion in chronic decerebrate rats. Am J Physiol, 1986. 250(4 Pt 2): p. R539-
48.
373. Grill, H.J. and R. Norgren, Chronically decerebrate rats demonstrate satiation but
not bait shyness. Science, 1978. 201(4352): p. 267-9.

204
374. Lorenz, D.N. and S.A. Goldman, Vagal mediation of the cholecystokinin satiety
effect in rats. Physiol Behav, 1982. 29(4): p. 599-604.
375. Walls, E.K., et al., Selective vagal rhizotomies: a new dorsal surgical approach
used for intestinal deafferentations. Am J Physiol, 1995. 269(5 Pt 2): p. R1279-88.
376. Dailey, M.J., et al., Nutrient specific feeding and endocrine effects of jejunal
infusions. Obesity (Silver Spring), 2010. 18(5): p. 904-10.
377. Tamura, C.S. and R.C. Ritter, Intestinal capsaicin transiently attenuates
suppression of sham feeding by oleate. Am J Physiol, 1994. 267(2 Pt 2): p.
R561-8.
378. Berthoud, H.R., et al., Vagal sensors in the rat duodenal mucosa: distribution and
structure as revealed by in vivo DiI-tracing. Anat Embryol (Berl), 1995. 191(3): p.
203-12.
379. Berthoud, H.R. and L.M. Patterson, Anatomical relationship between vagal
afferent fibers and CCK-immunoreactive entero-endocrine cells in the rat small
intestinal mucosa. Acta Anat (Basel), 1996. 156(2): p. 123-31.
380. Lynn, P.A. and L.A. Blackshaw, In vitro recordings of afferent fibres with
receptive fields in the serosa, muscle and mucosa of rat colon. J Physiol, 1999.
518 ( Pt 1): p. 271-82.
381. Williams, R.M., H.R. Berthoud, and R.H. Stead, Vagal afferent nerve fibres
contact mast cells in rat small intestinal mucosa. Neuroimmunomodulation, 1997.
4(5-6): p. 266-70.
382. Jorpes, E. and V. Mutt, [Secretin, pancreozymin, and cholecystokinin; their
physiology and future clinical use.]. Nord Med, 1956. 56(42): p. 1511-7.

205
383. Gibbs, J., R.C. Young, and G.P. Smith, Cholecystokinin decreases food intake in
rats. J Comp Physiol Psychol, 1973. 84(3): p. 488-95.
384. Liddle, R.A., Cholecystokinin cells. Annu Rev Physiol, 1997. 59: p. 221-42.
385. Glatzle, J., et al., Cholecystokinin-58 is more potent in inhibiting food intake than
cholecystokinin-8 in rats. Nutr Neurosci, 2008. 11(2): p. 69-74.
386. Brenner, L., D.P. Yox, and R.C. Ritter, Suppression of sham feeding by
intraintestinal nutrients is not correlated with plasma cholecystokinin elevation.
Am J Physiol, 1993. 264(5 Pt 2): p. R972-6.
387. Weller, A., et al., Trypsin inhibitor and maternal reunion increase plasma
cholecystokinin in neonatal rats. Peptides, 1992. 13(5): p. 939-41.
388. Liddle, R.A., et al., Proteins but not amino acids, carbohydrates, or fats stimulate
cholecystokinin secretion in the rat. Am J Physiol, 1986. 251(2 Pt 1): p. G243-8.
389. Ballinger, A.B. and M.L. Clark, L-phenylalanine releases cholecystokinin (CCK)
and is associated with reduced food intake in humans: evidence for a
physiological role of CCK in control of eating. Metabolism, 1994. 43(6): p. 735-8.
390. Parker, B.A., et al., Effects of small intestinal and gastric glucose administration
on the suppression of plasma ghrelin concentrations in healthy older men and
women. Clin Endocrinol (Oxf), 2005. 62(5): p. 539-46.
391. South, E.H. and R.C. Ritter, Capsaicin application to central or peripheral vagal
fibers attenuates CCK satiety. Peptides, 1988. 9(3): p. 601-12.
392. Woltman, T., D. Castellanos, and R. Reidelberger, Role of cholecystokinin in the
anorexia produced by duodenal delivery of oleic acid in rats. Am J Physiol, 1995.
269(6 Pt 2): p. R1420-33.

206
393. Brenner, L.A. and R.C. Ritter, Type A CCK receptors mediate satiety effects of
intestinal nutrients. Pharmacol Biochem Behav, 1996. 54(3): p. 625-31.
394. Woltman, T. and R. Reidelberger, Role of cholecystokinin in the anorexia
produced by duodenal delivery of peptone in rats. Am J Physiol, 1999. 276(6 Pt
2): p. R1701-9.
395. Brenner, L. and R.C. Ritter, Peptide cholesystokinin receptor antagonist
increases food intake in rats. Appetite, 1995. 24(1): p. 1-9.
396. Moran, T.H., et al., Blockade of type A, not type B, CCK receptors attenuates
satiety actions of exogenous and endogenous CCK. Am J Physiol, 1992. 262(1
Pt 2): p. R46-50.
397. Reeve, J.R., Jr., et al., CCK-58 is the only detectable endocrine form of
cholecystokinin in rat. Am J Physiol Gastrointest Liver Physiol, 2003. 285(2): p.
G255-65.
398. Canova, A. and N. Geary, Intraperitoneal injections of nanogram CCK-8 doses
inhibit feeding in rats. Appetite, 1991. 17(3): p. 221-7.
399. Cox, J.E., G.S. Perdue, and W.J. Tyler, Suppression of sucrose intake by
continuous near-celiac and intravenous cholecystokinin infusions in rats. Am J
Physiol, 1995. 268(1 Pt 2): p. R150-5.
400. Pandya, P.K., et al., Biochemical regulation of the three different states of the
cholecystokinin (CCK) receptor in pancreatic acini. Biochim Biophys Acta, 1994.
1224(1): p. 117-26.

207
401. Talkad, V.D., et al., Characterization of the three different states of the
cholecystokinin (CCK) receptor in pancreatic acini. Biochim Biophys Acta, 1994.
1224(1): p. 103-16.
402. Weatherford, S.C., et al., CCK satiety is differentially mediated by high- and low-
affinity CCK receptors in mice and rats. Am J Physiol, 1993. 264(2 Pt 2): p.
R244-9.
403. Simasko, S.M., et al., Cholecystokinin increases cytosolic calcium in a
subpopulation of cultured vagal afferent neurons. Am J Physiol Regul Integr
Comp Physiol, 2002. 283(6): p. R1303-13.
404. Roberge, J.N. and P.L. Brubaker, Secretion of proglucagon-derived peptides in
response to intestinal luminal nutrients. Endocrinology, 1991. 128(6): p. 3169-74.
405. Dube, P.E. and P.L. Brubaker, Nutrient, neural and endocrine control of
glucagon-like peptide secretion. Horm Metab Res, 2004. 36(11-12): p. 755-60.
406. Holst, J.J., On the physiology of GIP and GLP-1. Horm Metab Res, 2004. 36(11-
12): p. 747-54.
407. Theodorakis, M.J., et al., Human duodenal enteroendocrine cells: source of both
incretin peptides, GLP-1 and GIP. Am J Physiol Endocrinol Metab, 2006. 290(3):
p. E550-9.
408. Rozengurt, E. and C. Sternini, Taste receptor signaling in the mammalian gut.
Curr Opin Pharmacol, 2007. 7(6): p. 557-62.
409. Layer, P., et al., Ileal release of glucagon-like peptide-1 (GLP-1). Association with
inhibition of gastric acid secretion in humans. Dig Dis Sci, 1995. 40(5): p. 1074-
82.

208
410. Cordier-Bussat, M., et al., Peptones stimulate both the secretion of the incretin
hormone glucagon-like peptide 1 and the transcription of the proglucagon gene.
Diabetes, 1998. 47(7): p. 1038-45.
411. Chu, Z.L., et al., A role for intestinal endocrine cell-expressed g protein-coupled
receptor 119 in glycemic control by enhancing glucagon-like Peptide-1 and
glucose-dependent insulinotropic Peptide release. Endocrinology, 2008. 149(5):
p. 2038-47.
412. Tolhurst, G., F. Reimann, and F.M. Gribble, Nutritional regulation of glucagon-like
peptide-1 secretion. J Physiol, 2009. 587(Pt 1): p. 27-32.
413. Mari, A., et al., Vildagliptin, a dipeptidyl peptidase-IV inhibitor, improves model-
assessed beta-cell function in patients with type 2 diabetes. J Clin Endocrinol
Metab, 2005. 90(8): p. 4888-94.
414. Turton, M.D., et al., A role for glucagon-like peptide-1 in the central regulation of
feeding. Nature, 1996. 379(6560): p. 69-72.
415. Flint, A., et al., Glucagon-like peptide 1 promotes satiety and suppresses energy
intake in humans. J Clin Invest, 1998. 101(3): p. 515-20.
416. Gutzwiller, J.P., et al., Glucagon-like peptide-1: a potent regulator of food intake
in humans. Gut, 1999. 44(1): p. 81-6.
417. Mack, C.M., et al., Antiobesity action of peripheral exenatide (exendin-4) in
rodents: effects on food intake, body weight, metabolic status and side-effect
measures. Int J Obes (Lond), 2006. 30(9): p. 1332-40.

209
418. Larsen, P.J., et al., Systemic administration of the long-acting GLP-1 derivative
NN2211 induces lasting and reversible weight loss in both normal and obese rats.
Diabetes, 2001. 50(11): p. 2530-9.
419. Williams, D.L., D.G. Baskin, and M.W. Schwartz, Evidence that intestinal
glucagon-like peptide-1 plays a physiological role in satiety. Endocrinology, 2009.
150(4): p. 1680-7.
420. Scrocchi, L.A., et al., Glucose intolerance but normal satiety in mice with a null
mutation in the glucagon-like peptide 1 receptor gene. Nat Med, 1996. 2(11): p.
1254-8.
421. Medeiros, M.D. and A.J. Turner, Processing and metabolism of peptide-YY:
pivotal roles of dipeptidylpeptidase-IV, aminopeptidase-P, and endopeptidase-
24.11. Endocrinology, 1994. 134(5): p. 2088-94.
422. Medeiros, M.S. and A.J. Turner, Post-secretory processing of regulatory
peptides: the pancreatic polypeptide family as a model example. Biochimie, 1994.
76(3-4): p. 283-7.
423. Allen, J.M., et al., Effects of peptide YY and neuropeptide Y on gastric emptying
in man. Digestion, 1984. 30(4): p. 255-62.
424. Lundberg, J.M., et al., Localization of peptide YY (PYY) in gastrointestinal
endocrine cells and effects on intestinal blood flow and motility. Proc Natl Acad
Sci U S A, 1982. 79(14): p. 4471-5.
425. Baba, H., M. Fujimura, and N. Toda, Mechanism of inhibitory action of peptide
YY on cholecystokinin-induced contractions of isolated dog ileum. Regul Pept,
1990. 27(2): p. 227-35.

210
426. Kim, B.J., et al., Peptide YY is secreted after oral glucose administration in a
gender-specific manner. J Clin Endocrinol Metab, 2005. 90(12): p. 6665-71.
427. Zhou, J., et al., Peptide YY and proglucagon mRNA expression patterns and
regulation in the gut. Obesity (Silver Spring), 2006. 14(4): p. 683-9.
428. Russek, M., Participation of hepatic glucoreceptors in the control of intake of food.
Nature, 1963. 197: p. 79-80.
429. Tordoff, M.G. and M.I. Friedman, Hepatic portal glucose infusions decrease food
intake and increase food preference. Am J Physiol, 1986. 251(1 Pt 2): p. R192-6.
430. Novin, D., D.A. VanderWeele, and M. Rezek, Infusion of 2-deoxy-D-glucose into
the hepatic-portal system causes eating: evidence for peripheral glucoreceptors.
Science, 1973. 181(4102): p. 858-60.
431. Baird, J.P., H.J. Grill, and J.M. Kaplan, Intake suppression after hepatic portal
glucose infusion: all-or-none effect and its temporal threshold. Am J Physiol,
1997. 272(5 Pt 2): p. R1454-60.
432. Tordoff, M.G., J.P. Tluczek, and M.I. Friedman, Effect of hepatic portal glucose
concentration on food intake and metabolism. Am J Physiol, 1989. 257(6 Pt 2): p.
R1474-80.
433. Tordoff, M.G. and M.I. Friedman, Hepatic control of feeding: effect of glucose,
fructose, and mannitol infusion. Am J Physiol, 1988. 254(6 Pt 2): p. R969-76.
434. Jambor de Sousa, U.L., et al., Hepatic-portal oleic acid inhibits feeding more
potently than hepatic-portal caprylic acid in rats. Physiol Behav, 2006. 89(3): p.
329-34.

211
435. Anil, M.H. and J.M. Forbes, Feeding in sheep during intraportal infusions of
short-chain fatty acids and the effect of liver denervation. J Physiol, 1980. 298: p.
407-14.
436. Friedman, M.I., et al., Fatty acid oxidation affects food intake by altering hepatic
energy status. Am J Physiol, 1999. 276(4 Pt 2): p. R1046-53.
437. Lutz, T.A., M. Diener, and E. Scharrer, Intraportal mercaptoacetate infusion
increases afferent activity in the common hepatic vagus branch of the rat. Am J
Physiol, 1997. 273(1 Pt 2): p. R442-5.
438. Lutz, T.A., A. Niijima, and E. Scharrer, Intraportal infusion of 2,5-anhydro-D-
mannitol increases afferent activity in the common hepatic vagus branch. J Auton
Nerv Syst, 1996. 61(2): p. 204-8.
439. Langhans, W. and E. Scharrer, Evidence for a vagally mediated satiety signal
derived from hepatic fatty acid oxidation. J Auton Nerv Syst, 1987. 18(1): p. 13-8.
440. Ritter, S., T.T. Dinh, and M.I. Friedman, Induction of Fos-like immunoreactivity
(Fos-li) and stimulation of feeding by 2,5-anhydro-D-mannitol (2,5-AM) require
the vagus nerve. Brain Res, 1994. 646(1): p. 53-64.
441. Friedman, M.I. and P.E. Sawchenko, Evidence for hepatic involvement in control
of ad libitum food intake in rats. Am J Physiol, 1984. 247(1 Pt 2): p. R106-13.
442. Ji, H. and M.I. Friedman, Compensatory hyperphagia after fasting tracks
recovery of liver energy status. Physiol Behav, 1999. 68(1-2): p. 181-6.
443. Tordoff, M.G., N. Rawson, and M.I. Friedman, 2,5-anhydro-D-mannitol acts in
liver to initiate feeding. Am J Physiol, 1991. 261(2 Pt 2): p. R283-8.

212
444. Rawson, N.E., et al., Hepatic phosphate trapping, decreased ATP, and increased
feeding after 2,5-anhydro-D-mannitol. Am J Physiol, 1994. 266(1 Pt 2): p. R112-7.
445. Koch, J.E., et al., Temporal relationships between eating behavior and liver
adenine nucleotides in rats treated with 2,5-AM. Am J Physiol, 1998. 274(3 Pt 2):
p. R610-7.
446. Rawson, N.E. and M.I. Friedman, Phosphate loading prevents the decrease in
ATP and increase in food intake produced by 2,5-anhydro-D-mannitol. Am J
Physiol, 1994. 266(6 Pt 2): p. R1792-6.
447. Rawson, N.E., P.M. Ulrich, and M.I. Friedman, L-ethionine, an amino acid
analogue, stimulates eating in rats. Am J Physiol, 1994. 267(2 Pt 2): p. R612-5.
448. Ji, H. and M.I. Friedman, Fasting plasma triglyceride levels and fat oxidation
predict dietary obesity in rats. Physiol Behav, 2003. 78(4-5): p. 767-72.
449. Ji, H., L.V. Outterbridge, and M.I. Friedman, Phenotype-based treatment of
dietary obesity: differential effects of fenofibrate in obesity-prone and obesity-
resistant rats. Metabolism, 2005. 54(4): p. 421-9.
450. Leonhardt, M. and W. Langhans, Fatty acid oxidation and control of food intake.
Physiol Behav, 2004. 83(4): p. 645-51.
451. Scharrer, E. and W. Langhans, Control of food intake by fatty acid oxidation. Am
J Physiol, 1986. 250(6 Pt 2): p. R1003-6.
452. Cortez-Pinto, H., et al., Alterations in liver ATP homeostasis in human
nonalcoholic steatohepatitis: a pilot study. JAMA, 1999. 282(17): p. 1659-64.

213
453. Nair, S., et al., Hepatic ATP reserve and efficiency of replenishing: comparison
between obese and nonobese normal individuals. Am J Gastroenterol, 2003.
98(2): p. 466-70.
454. Rosebury, T., Microorganisms indigenous to man. 1962, New York, New York:
McGraw-Hill.
455. Savage, D.C., Microbial ecology of the gastrointestinal tract. Annu Rev Microbiol,
1977. 31: p. 107-33.
456. Xu, J., et al., Evolution of symbiotic bacteria in the distal human intestine. PLoS
Biol, 2007. 5(7): p. e156.
457. Ley, R.E., et al., Obesity alters gut microbial ecology. Proc Natl Acad Sci U S A,
2005. 102(31): p. 11070-5.
458. Palmer, C., et al., Development of the human infant intestinal microbiota. PLoS
Biol, 2007. 5(7): p. e177.
459. Spor, A., O. Koren, and R. Ley, Unravelling the effects of the environment and
host genotype on the gut microbiome. Nat Rev Microbiol, 2011. 9(4): p. 279-90.
460. de La Serre, C.B., et al., Propensity to high-fat diet-induced obesity in rats is
associated with changes in the gut microbiota and gut inflammation. Am J
Physiol Gastrointest Liver Physiol, 2010. 299(2): p. G440-8.
461. Sonnenburg, J.L., et al., Glycan foraging in vivo by an intestine-adapted bacterial
symbiont. Science, 2005. 307(5717): p. 1955-9.
462. Cummings, J.H., et al., Short chain fatty acids in human large intestine, portal,
hepatic and venous blood. Gut, 1987. 28(10): p. 1221-7.

214
463. Macfarlane, G.T., G.R. Gibson, and J.H. Cummings, Comparison of fermentation
reactions in different regions of the human colon. J Appl Bacteriol, 1992. 72(1): p.
57-64.
464. Roediger, W.E., Role of anaerobic bacteria in the metabolic welfare of the colonic
mucosa in man. Gut, 1980. 21(9): p. 793-8.
465. Cummings, J.H. and G.T. Macfarlane, The control and consequences of bacterial
fermentation in the human colon. J Appl Bacteriol, 1991. 70(6): p. 443-59.
466. Bergman, E.N., Energy contributions of volatile fatty acids from the
gastrointestinal tract in various species. Physiol Rev, 1990. 70(2): p. 567-90.
467. Wostmann, B.S., et al., Dietary intake, energy metabolism, and excretory losses
of adult male germfree Wistar rats. Lab Anim Sci, 1983. 33(1): p. 46-50.
468. Wostmann, B. and E. Bruckner-Kardoss, Development of cecal distention in
germ-free baby rats. Am J Physiol, 1959. 197: p. 1345-6.
469. Gordon, H.A. and E. Bruckner-Kardoss, Effect of normal microbial flora on
intestinal surface area. Am J Physiol, 1961. 201: p. 175-8.
470. Abrams, G.D., H. Bauer, and H. Sprinz, Influence of the normal flora on mucosal
morphology and cellular renewal in the ileum. A comparison of germ-free and
conventional mice. Lab Invest, 1963. 12: p. 355-64.
471. Lesher, S., H.E. Walburg, Jr., and G.A. Sacher, Jr., Generation Cycle in the
Duodenal Crypt Cells of Germ-Free and Conventional Mice. Nature, 1964. 202: p.
884-6.

215
472. Cherbuy, C., et al., Microbiota matures colonic epithelium through a coordinated
induction of cell cycle-related proteins in gnotobiotic rat. Am J Physiol
Gastrointest Liver Physiol, 2010. 299(2): p. G348-57.
473. Abrams, G.D. and J.E. Bishop, Effect of the normal microbial flora on
gastrointestinal motility. Proc Soc Exp Biol Med, 1967. 126(1): p. 301-4.
474. Riottot, M., E. Sacquet, and C. Leprince, Variations of bile salt pool size and
secretion rate in rats according to the modes of sterilization and preparation of a
semi-synthetic diet. Reprod Nutr Dev, 1980. 20(5A): p. 1481-8.
475. Sacquet, E., H. Garnier, and P. Raibaud, [Study of rate of the gastrointestinal
transit of spores of a strictly thermophilic strain of Bacillus subtilis in the holoxenic
rat, the axenic rat and the cecectomized axenic rat]. C R Seances Soc Biol Fil,
1970. 164(3): p. 532-7.
476. Reddy, B.S., J.R. Pleasants, and B.S. Wostmann, Effect of dietary carbohydrates
on intestinal disaccharidases in germfree and conventional rats. J Nutr, 1968.
95(3): p. 413-9.
477. Reddy, B.S. and B.S. Wostmann, Intestinal disaccharidase activities in the
growing germfree and conventional rats. Arch Biochem Biophys, 1966. 113(3): p.
609-16.
478. Dahlqvist, A. and B. Borgstrom, Digestion and absorption of disaccharides in
man. Biochem J, 1961. 81: p. 411-8.
479. Corring, T., C. Juste, and C. Simoes-Nunes, Digestive enzymes in the germ-free
animal. Reprod Nutr Dev, 1981. 21(3): p. 355-70.

216
480. Pen, J. and G.W. Welling, Influence of the microbial flora on the amount of
CCK8- and secretin21-27-like immunoreactivity in the intestinal tract of mice.
Comp Biochem Physiol B, 1983. 76(3): p. 585-9.
481. Pen, J. and G.W. Welling, The concentration of cholecystokinin in the intestinal
tract of germ-free and control mice. Antonie Van Leeuwenhoek, 1981. 47(1): p.
84-5.
482. Goodlad, R.A., et al., Plasma enteroglucagon, gastrin and peptide YY in
conventional and germ-free rats refed with a fibre-free or fibre-supplemented diet.
Q J Exp Physiol, 1989. 74(4): p. 437-42.
483. Arantes, R.M. and A.M. Nogueira, Distribution of enteroglucagon- and peptide
YY-immunoreactive cells in the intestinal mucosa of germ-free and conventional
mice. Cell Tissue Res, 1997. 290(1): p. 61-9.
484. Arantes, R.M. and A.M. Nogueira, Increased intracellular content of
enteroglucagon in proximal colon is related to intestinal adaptation to germ-free
status. Cell Tissue Res, 2001. 303(3): p. 447-50.
485. Cani, P.D., et al., Oligofructose promotes satiety in rats fed a high-fat diet:
involvement of glucagon-like Peptide-1. Obes Res, 2005. 13(6): p. 1000-7.
486. Delzenne, N.M., et al., Impact of inulin and oligofructose on gastrointestinal
peptides. Br J Nutr, 2005. 93 Suppl 1: p. S157-61.
487. Zhou, J., et al., Dietary resistant starch upregulates total GLP-1 and PYY in a
sustained day-long manner through fermentation in rodents. Am J Physiol
Endocrinol Metab, 2008. 295(5): p. E1160-6.

217
488. Shen, L., et al., Dietary resistant starch increases hypothalamic POMC
expression in rats. Obesity (Silver Spring), 2009. 17(1): p. 40-5.
489. Cai, D., et al., Local and systemic insulin resistance resulting from hepatic
activation of IKK-beta and NF-kappaB. Nat Med, 2005. 11(2): p. 183-90.
490. Hotamisligil, G.S., et al., Increased adipose tissue expression of tumor necrosis
factor-alpha in human obesity and insulin resistance. J Clin Invest, 1995. 95(5): p.
2409-15.
491. Weisberg, S.P., et al., Obesity is associated with macrophage accumulation in
adipose tissue. J Clin Invest, 2003. 112(12): p. 1796-808.
492. Xu, H., et al., Chronic inflammation in fat plays a crucial role in the development
of obesity-related insulin resistance. J Clin Invest, 2003. 112(12): p. 1821-30.
493. Wood, L.G., M.L. Garg, and P.G. Gibson, A high-fat challenge increases airway
inflammation and impairs bronchodilator recovery in asthma. J Allergy Clin
Immunol, 2011. 127(5): p. 1133-40.
494. Ricci, M.R. and B.E. Levin, Ontogeny of diet-induced obesity in selectively bred
Sprague-Dawley rats. Am J Physiol Regul Integr Comp Physiol, 2003. 285(3): p.
R610-8.
495. Cani, P.D., et al., Role of gut microflora in the development of obesity and insulin
resistance following high-fat diet feeding. Pathol Biol (Paris), 2008. 56(5): p. 305-
9.
496. Abreu, M.T., Toll-like receptor signalling in the intestinal epithelium: how bacterial
recognition shapes intestinal function. Nat Rev Immunol, 2010. 10(2): p. 131-44.

218
497. Cani, P.D., et al., Metabolic endotoxemia initiates obesity and insulin resistance.
Diabetes, 2007. 56(7): p. 1761-72.
498. Davis, J.E., et al., Tlr-4 deficiency selectively protects against obesity induced by
diets high in saturated fat. Obesity (Silver Spring), 2008. 16(6): p. 1248-55.
499. Fernandez-Real, J.M., et al., CD14 monocyte receptor, involved in the
inflammatory cascade, and insulin sensitivity. J Clin Endocrinol Metab, 2003.
88(4): p. 1780-4.
500. Cani, P.D., et al., Changes in gut microbiota control metabolic endotoxemia-
induced inflammation in high-fat diet-induced obesity and diabetes in mice.
Diabetes, 2008. 57(6): p. 1470-81.
501. de Lartigue, G., et al., Diet-induced obesity leads to the development of leptin
resistance in vagal afferent neurons. Am J Physiol Endocrinol Metab, 2011.
301(1): p. E187-95.
502. Hosoi, T., et al., Novel pathway for LPS-induced afferent vagus nerve activation:
possible role of nodose ganglion. Auton Neurosci, 2005. 120(1-2): p. 104-7.
503. Tsukumo, D.M., et al., Translational research into gut microbiota: new horizons in
obesity treatment. Arq Bras Endocrinol Metabol, 2009. 53(2): p. 139-44.
504. Kersten, S., et al., Characterization of the fasting-induced adipose factor FIAF, a
novel peroxisome proliferator-activated receptor target gene. J Biol Chem, 2000.
275(37): p. 28488-93.
505. Lichtenstein, L., et al., Angptl4 upregulates cholesterol synthesis in liver via
inhibition of LPL- and HL-dependent hepatic cholesterol uptake. Arterioscler
Thromb Vasc Biol, 2007. 27(11): p. 2420-7.

219
506. Fleissner, C.K., et al., Absence of intestinal microbiota does not protect mice
from diet-induced obesity. Br J Nutr, 2010. 104(6): p. 919-29.
507. Rabot, S., et al., Germ-free C57BL/6J mice are resistant to high-fat-diet-induced
insulin resistance and have altered cholesterol metabolism. FASEB J, 2010.
508. Turnbaugh, P.J., et al., An obesity-associated gut microbiome with increased
capacity for energy harvest. Nature, 2006. 444(7122): p. 1027-31.
509. Barcenilla, A., et al., Phylogenetic relationships of butyrate-producing bacteria
from the human gut. Appl Environ Microbiol, 2000. 66(4): p. 1654-61.
510. Turnbaugh, P.J., et al., Diet-induced obesity is linked to marked but reversible
alterations in the mouse distal gut microbiome. Cell Host Microbe, 2008. 3(4): p.
213-23.
511. Turnbaugh, P.J., et al., A core gut microbiome in obese and lean twins. Nature,
2009. 457(7228): p. 480-4.
512. Ley, R.E., et al., Microbial ecology: human gut microbes associated with obesity.
Nature, 2006. 444(7122): p. 1022-3.
513. Hildebrandt, M.A., et al., High-fat diet determines the composition of the murine
gut microbiome independently of obesity. Gastroenterology, 2009. 137(5): p.
1716-24 e1-2.
514. Levin, B.E., et al., Selective breeding for diet-induced obesity and resistance in
Sprague-Dawley rats. Am J Physiol, 1997. 273(2 Pt 2): p. R725-30.
515. Swartz, T.D., et al., Up-regulation of intestinal type 1 taste receptor 3 and sodium
glucose luminal transporter-1 expression and increased sucrose intake in mice
lacking gut microbiota. Br J Nutr, 2012. 107(5): p. 621-30.

220
516. Wang, Y.C., et al., Health and economic burden of the projected obesity trends in
the USA and the UK. Lancet, 2011. 378(9793): p. 815-25.
517. Lucas, F. and A. Sclafani, The composition of the maintenance diet alters flavor-
preference conditioning by intragastric fat infusions in rats. Physiol Behav, 1996.
60(4): p. 1151-7.
518. Swartz, T.D., et al., Up-regulation of intestinal type 1 taste receptor 3 and sodium
glucose luminal transporter-1 expression and increased sucrose intake in mice
lacking gut microbiota. Br J Nutr, 2011: p. 1-10.
519. Martin, C., et al., The lipid-sensor candidates CD36 and GPR120 are
differentially regulated by dietary lipids in mouse taste buds: impact on
spontaneous fat preference. PLoS One. 6(8): p. e24014.
520. Zhang, X.J., et al., Decreased expression of CD36 in circumvallate taste buds of
high-fat diet induced obese rats. Acta Histochem, 2011. 113(6): p. 663-7.
521. Ackroff, K. and A. Sclafani, Flavor preferences conditioned by sugars: rats learn
to prefer glucose over fructose. Physiol Behav, 1991. 50(4): p. 815-24.
522. Demarne, Y., et al., Fat absorption in germ-free and conventional rats artificially
deprived of bile secretion. Gut, 1982. 23(1): p. 49-57.
523. Demarne, Y., E. Sacquet, and H. Garnier, [Gastrointestinal flora and fat digestion
in monogastrics]. Ann Biol Anim Biochim Biophys, 1972. 12(3): p. 509-24.
524. Goudriaan, J.R., et al., Intestinal lipid absorption is not affected in CD36 deficient
mice. Mol Cell Biochem, 2002. 239(1-2): p. 199-202.
525. Engelstoft, M.S., et al., A gut feeling for obesity: 7TM sensors on
enteroendocrine cells. Cell Metab, 2008. 8(6): p. 447-9.

221
526. Cherbut, C., et al., Short-chain fatty acids modify colonic motility through nerves
and polypeptide YY release in the rat. Am J Physiol, 1998. 275(6 Pt 1): p.
G1415-22.
527. Mandard, S., et al., The fasting-induced adipose factor/angiopoietin-like protein 4
is physically associated with lipoproteins and governs plasma lipid levels and
adiposity. J Biol Chem, 2006. 281(2): p. 934-44.
528. Velagapudi, V.R., et al., The gut microbiota modulates host energy and lipid
metabolism in mice. J Lipid Res, 2011. 51(5): p. 1101-12.
529. Le Jan, S., et al., Angiopoietin-like 4 is a proangiogenic factor produced during
ischemia and in conventional renal cell carcinoma. Am J Pathol, 2003. 162(5): p.
1521-8.
530. Stappenbeck, T.S., L.V. Hooper, and J.I. Gordon, Developmental regulation of
intestinal angiogenesis by indigenous microbes via Paneth cells. Proc Natl Acad
Sci U S A, 2002. 99(24): p. 15451-5.
531. Wostmann, B.S. and D.F. Kan, The Cholesterol-Lowering Effect of Commercial
Diet Fed to Germfree and Conventional Rats. J Nutr, 1964. 84: p. 277-82.
532. Klein, S., et al., Adipose tissue leptin production and plasma leptin kinetics in
humans. Diabetes, 1996. 45(7): p. 984-7.
533. Drover, V.A., et al., CD36 deficiency impairs intestinal lipid secretion and
clearance of chylomicrons from the blood. J Clin Invest, 2005. 115(5): p. 1290-7.
534. Lin, Z.J., et al., Abdominal fat accumulation with hyperuricemia and
hypercholesterolemia quail model induced by high fat diet. Chin Med Sci J, 2009.
24(3): p. 191-4.

222
535. Kahn, B.B., et al., AMP-activated protein kinase: ancient energy gauge provides
clues to modern understanding of metabolism. Cell Metab, 2005. 1(1): p. 15-25.
536. Bastie, C., et al., Alterations of peroxisome proliferator-activated receptor delta
activity affect fatty acid-controlled adipose differentiation. J Biol Chem, 2000.
275(49): p. 38768-73.
537. Jernas, M., et al., Separation of human adipocytes by size: hypertrophic fat cells
display distinct gene expression. FASEB J, 2006. 20(9): p. 1540-2.
538. Weyer, C., et al., Enlarged subcutaneous abdominal adipocyte size, but not
obesity itself, predicts type II diabetes independent of insulin resistance.
Diabetologia, 2000. 43(12): p. 1498-506.
539. Duca, F.A. and M. Covasa, Current and emerging concepts on the role of
peripheral signals in the control of food intake and development of obesity. Br J
Nutr, 2012: p. 1-16.
540. Hajnal, A. and R. Norgren, Taste pathways that mediate accumbens dopamine
release by sapid sucrose. Physiol Behav, 2005. 84(3): p. 363-9.
541. Steinert, R.E. and C. Beglinger, Nutrient sensing in the gut: interactions between
chemosensory cells, visceral afferents and the secretion of satiation peptides.
Physiol Behav, 2011. 105(1): p. 62-70.
542. Friedman, M.I., Obesity and the hepatic control of feeding behavior. Drug News
Perspect, 2007. 20(9): p. 573-8.
543. Szczypka, M.S., et al., Viral gene delivery selectively restores feeding and
prevents lethality of dopamine-deficient mice. Neuron, 1999. 22(1): p. 167-78.

223
544. Friedman, J.M., The function of leptin in nutrition, weight, and physiology. Nutr
Rev, 2002. 60(10 Pt 2): p. S1-14; discussion S68-84, 85-7.
545. Arnold, M., et al., Meal-Contingent Intestinal Lymph Collection from Awake,
Unrestrained Rats. Am J Physiol Regul Integr Comp Physiol, 2012.
546. Byrnes, D.J., et al., Radioimmunoassay of cholecystokinin in human plasma. Clin
Chim Acta, 1981. 111(1): p. 81-9.
547. Elias, C.F., et al., Chemical characterization of leptin-activated neurons in the rat
brain. J Comp Neurol, 2000. 423(2): p. 261-81.
548. Abbott, C.R., et al., The inhibitory effects of peripheral administration of peptide
YY(3-36) and glucagon-like peptide-1 on food intake are attenuated by ablation
of the vagal-brainstem-hypothalamic pathway. Brain Res, 2005. 1044(1): p. 127-
31.
549. Seimon, R.V., et al., Effects of varying combinations of intraduodenal lipid and
carbohydrate on antropyloroduodenal motility, hormone release, and appetite in
healthy males. Am J Physiol Regul Integr Comp Physiol, 2009. 296(4): p. R912-
20.
550. Shin, A.C., et al., Meal-induced hormone responses in a rat model of Roux-en-Y
gastric bypass surgery. Endocrinology, 2010. 151(4): p. 1588-97.
551. Sclafani, A. and K. Ackroff, Invited Review: The role of gut nutrient sensing in
stimulating appetite and conditioning food preferences. Am J Physiol Regul
Integr Comp Physiol, 2012.
552. Elizalde, G. and A. Sclafani, Starch-based conditioned flavor preferences in rats:
influence of taste, calories and CS-US delay. Appetite, 1988. 11(3): p. 179-200.

224
553. Touzani, K., R.J. Bodnar, and A. Sclafani, Dopamine D1-like receptor
antagonism in amygdala impairs the acquisition of glucose-conditioned flavor
preference in rats. Eur J Neurosci, 2009.
554. Touzani, K. and A. Sclafani, Critical role of amygdala in flavor but not taste
preference learning in rats. Eur J Neurosci, 2005. 22(7): p. 1767-74.
555. Elizalde, G. and A. Sclafani, Fat appetite in rats: flavor preferences conditioned
by nutritive and non-nutritive oil emulsions. Appetite, 1990. 15(3): p. 189-97.
556. Diraison, F., et al., Increased hepatic lipogenesis but decreased expression of
lipogenic gene in adipose tissue in human obesity. Am J Physiol Endocrinol
Metab, 2002. 282(1): p. E46-51.
557. Godbole, V. and D.A. York, Lipogenesis in situ in the genetically obese Zucker
fatty rat (fa/fa): role of hyperphagia and hyperinsulinaemia. Diabetologia, 1978.
14(3): p. 191-7.
558. Avram, A.S., M.M. Avram, and W.D. James, Subcutaneous fat in normal and
diseased states: 2. Anatomy and physiology of white and brown adipose tissue. J
Am Acad Dermatol, 2005. 53(4): p. 671-83.