Embed Size (px)
Citation preview

1
ORAL ABSTRACTS JUNE 3, 2010 11.00-12.30 Emerging Monitoring Techniques in Cardionephrology O1 Utility of Cardiovascular Monitoring for Individualisation of Haemodialysis Therapy Helen Jefferies Department of Renal Medicine, Royal Derby Hospital, Derby, UK Cardiovascular (CV) mortality is grossly elevated in patients with chronic kidney disease (CKD), and appears to be driven largely by non-traditional cardiovascular risk factors. Patients with CKD exhibit a wide variety of structural and functional cardiovascular abnormalities. The ability to continuously monitor the CV response to haemodialysis (HD), and potentially to assess the success of an introduced intervention to improve a patient’s stability, is becoming increasingly important in the general care of vulnerable HD patients. Despite improvements in HD technology, intradialytic hypotension remains an important cause of morbidity, and an independent risk factor for mortality, in dialysis patients. Identifying predictors of IDH and aberrant haemodynamic response during HD is therefore extremely important. Multiple facets of IDH have been identified, including insufficient refill, left ventricular dysfunction, ultrafiltration volume and rate, and autonomic dysfunction. Short-term regulation of blood pressure is largely controlled by appropriate autonomic nervous activity through the baroreflex arc. Autonomic dysfunction is common in dialysis patients, and impaired baroreflex sensitivity (BRS) has been demonstrated in patients who are unstable on HD. Non-invasive continuous BP recording by devices such as the Finometer (FMS, Amsterdam, The Netherlands), which reconstructs central haemodynamics from digital photoplethysmography via validated transfer functions, allows the calculation of spontaneous BRS both at rest and during HD. We have demonstrated that IDH-prone patients exhibit remarkable differences in BRS profile when compared to patients resistant to IDH. Baroreflex sensitivity (BRS) as a marker of the fundamental control of BP is of physiological significance in the study of HD, particularly since BRS is potentially amenable to therapeutic intervention. For example, transfer from conventional haemodialysis three times weekly to nocturnal haemodialysis has been demonstrated to increase BRS. Haemodynamic instability during HD is capable of producing recurrent cardiac injury (myocardial stunning), resulting in acute segmental and global myocardial dysfunction during dialysis, and global reduction in myocardial performance over one year. Furthermore, stunning is associated with increased risk of cardiovascular events and mortality. Two-dimensional echocardiography is performed serially throughout dialysis sessions to quantify myocardial stunning. Continuous non-invasive monitoring of blood pressure and haemodynamic variables (such as cardiac output and peripheral resistance) facilitates high-resolution profiling of the haemodynamic response in individual patients and the identification of significant haemodynamic associations with dialysis-induced cardiac injury. Independent modifiable determinants of stunning include systolic fall in blood pressure during dialysis, and ultrafiltration volume. We have demonstrated that modification of dialysis to target these factors, and patient-centred individualisation of therapies, can improve haemodynamic tolerability, reduce the occurrence of stunning, and may improve cardiovascular outcomes and patient survival.

2
O2 Monitoring of Fluid Balance and Haemodynamics in Patients on Haemodialysis Frantisek Lopot 1st Medical Faculty, Charles University and General University Hospital, Department of Medicine, Prague –Strahov, Czech Republic Background: Adequate fluid balance control in patients dialysed for terminal renal failure is an essential part of adequate haemodialysis (HD) treatment, both in terms of optimal post-HD body weight (BW) as the target and fluid removal (UF – ultrafiltration) strategy during HD as the way to reach the target. Its importance is well documented by the fact that cardiovascular problems accounts for about 60% of deaths in patients on maintenance HD with no decrease of this figure over the last several decades, as well as by works showing clear association between the length of interdialytic interval and death. Clinical risks of inadequate fluid balance control: While inadequate estimation of the optimal post-HD BW results mostly in long-term adverse effects, such as hypervolemia-induced hypertension, left ventricular hypertrophy, systolic and diastolic dysfunction, inadequate UF strategy brings about the risk of acute adverse events during HD with intradialytic hypotension (IDH) being the most risky one. Moderate IDH results in lowered HD efficiency because of worsened perfusion of body tissues. Decrease in cardiac output (sometimes as high as 40%) possibly combined with IDH may lead to thrombosis of vascular access towards the end of HD or shortly afterward. The most severe IDH may end up with cardiac arrest and patient´s death. Methods of fluid status and haemodynamics monitoring/control: To minimise the above risks, appropriate measures and technical means are needed in fluid status assessment as well as in fluid removal control (UF strategy). For the former task, different approaches have been tried out in the past, such as measurement of vena cava inferior diameter or its collapsibility index, levels of natrium uretic peptide etc. In the last years, the bioimpedance spectroscopy is quickly gaining ground. For the latter task, the continuous blood volume monitoring (CBVM) during HD has been found quite useful. However, although the intravasal hypovolemia (possibly further augmented by positive thermal balance-induced peripheral vasodilation) is the main reason of IDH, this causal relationship may be widely modified by vascular system condition, namely its elasticity, and also by administered antihypertensives in a particular patient. That is what makes exploitation of some more direct marker(s) of haemodynamic stability (HS) tempting. Blood pressure (BP) itself is not the best candidate because of its highly nonlinear relation to volemic status as well as technical difficulties in and uncomfortability of continuous BP monitoring for the patient. Much easier in both respects appears the on-line heart rate variability (HRV) analysis. This approach may prove efficient in early detection of IDH risk regardless of individual differences in vascular system status and administered medication. Surprisingly, potential of HRV already widely used in cardiology has not yet been recognised in dialysis. The presentation will discuss the issue of fluid status and fluid removal monitoring and control in HD with special focus on the CBVM and HRV analysis and will try to highlight “liason areas” between cardiology and nephrology/dialysis.

3
O3 Circulatory Malfunction during Dialysis–Basic Physiology Joakim Cordtz Dep. of Nephrology, Copenhagen University Hospital, Denmark Circulatory malfunction is a common and troublesome adverse reaction to hemodialysis treatment that causes patient discomfort, influences dialysis adequacy and is associated with increased morbidity and mortality. Hypotensive episodes may be caused by a variety of factors of which hypovolemia owing to aggressive ultrafiltration is the most frequent. As the clinical evaluation of volume status in dialysis patients is fraught with uncertainties, intradialytic cardiovascular monitoring is an important tool to prevent the occurrence of hypotension. Relative blood volume sensoring, the tracking of the hematocrit change during dialysis, has become the standard method. However, widespread routine use has turned out to be helpful but not sufficient to eliminate the problem. The presentation will outline the pathophysiologic events related to hemodialysis-induced circulatory malfunction. Particular focus will be put on the role of the autonomic nervous system in the counterregulatory response to hypovolemia, and how shifts in autonomic nervous activity can be exploited for electrocardiographic monitoring. The possible role for intradialytic monitoring as an aid in the determination of dry weight will be discussed.

4
O4 Alterations of Atrial Electrophysiology After Hemodialysis Session: a Simulation Study in Volumetric Atrial Tissues Martin Wolfgang Krueger1, Stefano Severi2, Gunnar Seemann1, Frank Michael Weber1, Simonetta Genovesi3,4, Antonio Vincenti5, Paolo Fabbrini4, Olaf Dössel1 1 Institute of Biomedical Engineering, Karlsruhe Institute of Technology (KIT), Germany 2 Laboratorio di Ingegneria Biomedica – D.E.I.S., Università di Bologna, Cesena, Italy 3 Department of Clinical Medicine and Prevention, University of Milano Bicocca, Monza, Italy 4 Nephrology Unit , San Gerardo Hospital, Monza, Italy 5 Electrophisiology and Cardiac Pacing Unit, San Gerardo Hospital, Monza, Italy Background: Patients with end stage renal disease (ESRD) show an increased prevalence of atrial fibrillation (AF). A combined simulation and ECG-analysis study revealed a correlation between the changes in plasma electrolytes and intra-atrial conduction velocity related to hemodialysis (HD) session. A recognized limitation of the study is that simulations were performed on single-cell level. We present a computer study to investigate the influence of HD related electrolyte modifications on atrial electrophysiology in a volumetric environment. Methods: Based on the Courtemanche-Ramirez-Nattel model and its parameterization for different atrial tissues we studied action potential (AP), effective refractory period (ERP), conduction velocity (CV) restitution and wave length (WL) restitution for common atrial myocardium (CAM) and fast conducting Crista Terminalis (CT). We used isotropic, homogeneous tissue patches. External stimuli were applied with 184 different pacing rates (PR) from 330ms to 1250ms. Results: The effect of temporary HD- related electrolyte changes on the AP morphology and ERP showed results consistent with the previous single cell study [1]. AP morphology was not significantly altered both in CAM and CT, but resting potential decreased from -82.6 to -88.2mV for CAM and from -81.7 to -87.3mV for CT. ERP decreased from 325ms (pre-HD) to 308ms (end-HD). At a PR of 832ms CV dropped by ~6.3% for both types of tissue (CAM: 741 694mm/s; CT: 746 699mm/s). WL increased slightly with higher PR, but rapidly fell off below a PR of 450ms. WL was ~30mm shorter in the end-HD condition. Conclusions: CV decrease and consequent WL shortening increases vulnerability for AF onset, especially in conjunction with structural dilation often present in atria of ESRD patients. Temporary HD-caused electrical remodeling has equal effects on regular and fast-conducting tissue. Although there is no biophysical model for fast inter-atrial condution pathways (e.g. Bachmann’s Bundle) available, the HD influence on them should also be similar and therefore slow down inter-atrial conduction significantly. It has been suggested that constantly repeating alteration of atrial electrophysiology may lead to a longer lasting electrical atrial remodeling, future studies should therefore investigate the long-term HD effects.

5
O5 Noninvasive Quantification of Blood Potassium Concentration from ECG Analysis Cristiana Corsi, Stefano Severi, Mark Haigney, Johan De Bie, David Mortara DEIS, University of Bologna, Cesena, Italy Background. Maintenance of normal potassium homeostasis is increasingly a limiting factor in the therapy of several diseases, in particular for patients with heart failure and with chronic renal failure maintained on hemodialysis therapy. Electrocardiographic effects of potassium are well known since many years but no quantitative relationship between parameters derived from ECG analysis and [K+] have been established for clinical use. We developed a new method to quantify [K+] from T-wave analysis in real-time and tested it on data from dialysis patients, since they undergo large potassium variations in a relatively short time (about four hours). Materials and methods. We retrospectively analyzed Holter ECG recordings (H12+, Mortara Instrument Inc.) acquired during 39 dialysis sessions on 13 patients (3 per patient for 3 weeks, the same day of the week). ECG data were exported (SuperECG, Mortara Instrument Inc.). The most significant two eigenleads were used to calculate the slope and amplitude of the T-wave for each beat. The 2-minute window median value of the ratio of the T wave slope to amplitude [TS/A] was used for the [K+] estimation at 15 minute intervals. Reference values for [K+] were obtained at the following times: 0, 30, 60, 120, 180, 240 minutes from the start of dialysis by blood samples (RapidLab 855, Bayer). Results. A significant correlation (r=0.63, p<0.0001) was found between TS/A and [K+]. Based on these results an ECG-based potassium estimator (KECG) was defined as a quadratic function of TS/A and compared with the reference potassium measurements. The agreement was good (absolute error: 0.48±0.18 mM) for most of the sessions (33/39 sessions) except for 6 sessions (absolute error: 1.10±0.29 mM) in which the presence of a systematic error (bias) all along the session did not allow reliable estimates. Bland-Altman analysis showed that the overall systematic (mean) error was almost null (-0.03 mM) whereas the standard deviation (sd) was 0.75 mM. The manual correction of the bias over each dialysis session resulted in excellent results for all patients. Conclusion. We propose a new method for non-invasive potassium concentration measurements in real-time from the ECG. Preliminary results are promising although further investigation is required to understand the reason for session-dependent bias in some patients. Following a comprehensive validation, this method could be effectively applied to monitor patients at risk for hyper- and hypokalemia which are among the main risk factors for cardiac arrhythmias as well as being indicators for worsening heart or kidney failure.

6
Basic Electrophysiology O6 Electrophysiological Characteristics of Ventricular Myocytes Isolated from Young mXin-alpha Null Mice Cheng-I Lin1, Fu-Chi Chan1, Chia-Pei Cheng1, Yue-Xia Loh2, Yao-Cheng Chen3, Yu-Jun Lai1,5, Kuo-Ho Wu1, Chih-Hsueng Hsu4, Jim Jung-Ching Lin6 1 Institute of Physiology, National Defense Medical Center, Taipei, Taiwan, ROC 2 Institute of Pharmacology, National Defense Medical Center, Taipei, Taiwan, ROC 3 Department of Biomedical Engineering, National Defense Medical Center, Taipei, Taiwan, ROC 4 Departments of Internal Medicine, National Defense Medical Center, Taipei, Taiwan, ROC 5 Department of Medical Research, Mackay Memorial Hospital and Medical College, Taipei, Taiwan, ROC 6 Deparment of Biological Sciences, University of Iowa, Iowa City, U.S.A. Background: Nkx2.5-insufficient mice with decreased cardiac transient outward currents (ITO) are susceptible to ventricular tachyarrhythmia. mXin-alpha, a downstream target gene of Nkx2.5 transcription factor, was shown to encode the Xin protein which localizes to the intercalated discs of adult hearts. Our preliminary study using whole-cell patch-clamp techniques have shown that adult (10-20 weeks old) ventricular myocytes (VM) of mXin-alpha null mice exhibited a significant reduction in ITO, IK and L-type Ca2+ currents (ICa,L) as compared to wild type VM. Also KChIP2 and filamin were significantly decreased in the membrane fraction of mXin-alpha null hearts. Question is whether this decrease would lead to ITO current depression in neonatal (1-month-old) cardiomyocytes. The depressed ITO current may also enhance cardiac hypertrophy and cardiomyopathy. Materials and methods: The present experiments aim to explore the time course of alterations in ITO, IK (the delayed rectifier outward K+ currents) and ICaL during development (from 3-4 wk to 10-20 wk of age). Results: Results show that ITO of 3-4 wk mXin-alpha null VM was smaller than that of wild-type VM, consistent with the decrease in membrane- associated KChIP2 that has been observed previously. As a consequence, action potential duration (APD) prolongation in mXin-alpha null VM has been hypothesized to be responsible for the increase of intracellular Ca2+. However, the ICa,L of 3-4 wk-old mXin-alpha null VM was similar to that of same age wild type VM. Also, at age of 3-4 wk old (but not at 10-20 wk), mXin-alpha null cells were same size as wild type cells. Recently, we found that amplitude of intracellular Ca2+ transient was significantly reduced in 3-4 wk-old mXin-alpha null VM, indicating a smaller amount of intracellular Ca2+ in mXin-alpha null than in wild type cells. Conclusion: Different mechanism other than ICa,L is responsible for cardiac hypertrophy and triggered arrhythmias.

7
O7 Ventricular Transepicardial and Transmural Changes in the Mechanism of Hypokalemia-Induced Arrhythmogenicity in the Guinea-pig Heart Oleg Osadchii The Panum Institute, University of Copenhagen, Denmark Background: Hypokalemia may promote electrical instability in cardiac patients via incompletely understood mechanism. The present study was designed to explore the role of spatial repolarization gradients and conduction abnormalities in genesis of ventricular tachyarrhythmias induced by hypokalemia isolated, perfused guinea-pig heart preparations. Methods: Epicardial and endocardial monophasic action potentials from distinct left ventricular (LV) and right ventricular (RV) recording sites were monitored simultaneously with volume-conducted electrocardiogram during steady-state pacing and following a premature extrastimulus application at progressively reducing coupling stimulation intervals in normokalemic and hypokalemic conditions. The effective refractory periods were measured at LV epicardial, RV epicardial and LV endocardial stimulation sites. Local activation times were determined at distinct ventricular sites to assess the LV-to-RV transepicardial and LV transmural (epicardial-to-endocardial) conduction. Results: Hypokalemic perfusion (2.5 mM K+ for 30 min) markedly increased the inducibility of tachyarrhythmias by programmed ventricular stimulation and rapid pacing, prolonged ventricular repolarization, and shortened LV epicardial and endocardial effective refractory periods, thereby increasing the critical interval for LV re-excitation. Hypokalemia increased the RV-to-LV transepicardial repolarization gradients as well as dispersion in refractoriness. In contrast, hypokalemia had no effect on transmural dispersion of APD90 or effective refractory period across the LV wall. Both the LV-to-RV transepicardial conduction and the LV transmural (epicardial-to-endocardial) conduction were slowed in hypokalemic heart preparations. This change has been attributed to depressed diastolic excitability as evidenced by increased ventricular pacing thresholds. Conclusion: These findings suggest that hypokalemia may promote ventricular tachyarrhythmias by shortening LV refractoriness, increasing critical intervals for LV re-excitation, amplifying RV-to-LV transepicardial gradients in repolarization and refractoriness, and slowing ventricular conduction in the guinea-pig heart. The LV transmural repolarization gradients seem to play no significant role in hypokalemia-induced arrhythmogenicity.

8
O8 Expression of Chronotopography of Atrial Excitation with the Cardiopotential Distribution on the Body Surface of ISIAH Rats. Svetlana Smirnova1, Ludmila Ivanova 2, Arcadey Markel 3, Irina Roshchevskaya 4, Mikhail Roshchevsky 5 1 Laboratory of Comparative Cardiology of the Komi Science Centre of the Ural Division of the Russian Academy of Sciences (Syktyvkar), Russia 2 Institute of Cytology and Genetics of the Siberian Division or the Russian Academy of Sciences (Novosibirsk), Russia 3 Institute of Cytology and Genetics of the Siberian Division or the Russian Academy of Sciences (Novosibirsk, Russia 4 Laboratory of Comparative Cardiology of the Komi Science Centre of the Ural Division of the Russian Academy of Sciences (Syktyvkar), Russia 5 Laboratory of Comparative Cardiology of the Komi Science Centre of the Ural Division of the Russian Academy of Sciences (Syktyvkar), Russia Background: Lines of hypertensive animals may serve as an adequate experimental model of the research of heart electrical activity. The aim of the research is the expression of chronotopography of atrial excitation with cardiopotential distribution on the body surface. Methods: Cardioelectric field on the body surface at the period of the atrial depolarization and the excitation wave distribution on the atrial epicardium were studied by the method of electrocardiotopography in ISIAH rats. Results: On the epicardium the excitation wave begins to spread from the superior vena cava ostium and divides into two fronts: the first depolarizes straight the right atrium (RA), the second passes from the interatrial septum to the left atrium (LA). The inversion of positional relationship of areas of positive and negative cardiopotentials on rats’ body surface occurs before the beginning of the II-wave and corresponds to the initial period of the excitation wave distribution on the RA epicardium and the beginning of the passage of the excitation wave from the interatrial septum to the LA. The depolarization wave on the interatrial septum evenly spreads to the dorsal side in the area of pulmonary venous (PV) return to the LA. The depolarization front evenly spreads in the area of PV lacunae from the dorsal side and meets with the front that spreads from the ventral side of the LA appendage. The process of atrial excitation finishes on the dorsal side of the LA (in 55%). In 18% of rats in the area of PV lacunae the excitation wave comes from the ventral side of the LA. In 27% of rats the heterogeneity of excitation wave distribution is found in the area of PV lacunae of the LA, the zones, depolarizing simultaneously or 2-3 ms later with the area of the SA node, are revealed. On the body surface of these rats the zone of positive cardiopotentials is situated left laterally from dorsal and ventral sides, the zone of negative ones-right laterally. Conclusion: The passage of the excitation wave front reflects on cardioelectric field on the body surface by the movement of extrema at the period of the ascending phase of the II-wave. At the period of the descending phase of the II-wave the movement of extrema corresponds with the termination of RA excitation and LA depolarization.

9
O9 Epicardial Activation-to-Repolarization Coupling Differs in the Local Areas and the Entire Ventricular Surface Marina Vaykshnorayte, Jan Azarov Institute of Physiology, Komi Science Center, Ural Branch, Russian Academy of Sciences, Russia The overall ventricular epicardial repolarization sequence is governed by the distribution of local repolarization durations and independent of activation sequence (Kanai, Salama, 1995; Efimov et al., 1996; Azarov et al., 2007) which was documented by the different activation and repolarization sequences and dispersions. The present study aimed at test of a hypothesis that the relationship between repolarization and activation patterns in the local epicardial fragment be different from that on the entire ventricular surface. Experiments were done in dogs (n=12), frogs (n=7). In 64 ventricular epicardial unipolar leads organized in a rectangular matrix 5*5 mm, activation times (AT, as dV/dt min during QRS), end of repolarization times (RT, as dV/dt max during ST-T), and activation-recovery intervals (ARI, as the time interval between the AT and RT) were measured. Dispersions of ATs, ARIs, and RTs were determined as the differences between maximal and minimal values of a correspondent variable. In the local epicardial fragment of all studied animals, the dispersions of ATs, ARIs, and RTs were significantly lower than those on the entire surface, as expected. However, the differences between the magnitudes of AT dispersion on the one hand and ARI or RT dispersion on the other hand consistently observed on the entire epicardium were absent on the local epicardial fragment. A negative correlation was found between the AT and ARI values in all the animal species suggesting repolarization to be longer in the early activated sites. The similarity between the repolarization and activation sequences quantitated by the correlation coefficient between ATs and RTs was found to depend on the AT dispersion / ARI dispersion ratio in a given mapped area. Thus, in contrast to the entire ventricular epicardial surface, the activation sequence strongly influenced the repolarization sequence of the local epicardial fragment by the determination of either onset or duration of repolarization.

10
O10 Comparison of Sequence of Depolarization with Terminals Distribution of the Conducting System in the Left Ventricle of the Pig’s Heart Anna Gulyaeva, Irina Roshchevskay, Michail Roshchevsky Laboratory of Comparative Cardiology, Komi Science Center, Ural Division, Russian Academy of Science, Russia Background: The purpose of this work was to compare areas of the earliest and late depolarization with the distribution of Purkinje fibers in the pig’s left ventricle. Materials and methods: The researches were carried out in the heart left ventricle of conventional pigs, at the age of three and eight months accordingly. The sequence of depolarization was studied by a method of multi-channel synchronous cardioelectrotopography. Cardioelectric potentials were recorded in intramural myocardial layers by original needle electrodes. Histological analysis showed the distribution of terminals of the conducting system in the area of the base of anterior and posterior papillary muscles and the area of the base of the left ventricular dorsal wall. Results: The zones of the initial ventricular depolarization are registered in the subendocardium of the base of the left ventricular anterior and posterior papillary muscles. Further there appear numerous foci of depolarization located in intramural layers of the myocardium from which activation extends radially. The base of the dorsal wall is a zone of the late depolarization in the left ventricle. In the subendocardium the conductive fibers are numerous, branching, large, their average diameter makes 55 micron, in the thickness of the myocardium wall it is 30 40 micron and in the subepicardium areas are noted fibers with a diameter of 26 36 micron. In subepicardium and subendocardium layers the Purkinje fibers pass under a various corner relative to the fibers of a working myocardium. In the middle layer they basically run parallel or perpendicularly in relation to the fibers of a contractile myocardium. In the area of the left ventricular base from the dorsal side the Purkinje fibers are seldom found in the thickness of the whole wall, their average diameter is 20 24 micron. Conclusion: The appearance of zones of early depolarization in the subendocardial area of the papillary muscles base occurs due to the presence of large and numerous conductive fibers. In the area of the base of the dorsal wall where the network of Purkinje fibers is less, the depolarization wave generally extends in a myogenic way due to the movement of the excitation wave from the early depolarized areas.

11
JUNE 3, 2010 15.00-16.30 Methods for Detection of Subtle ECG Phenomena O11 Nonparametric, Nonstationary Noise Rejection in TWA Analysis Reveals Unusual Dynamics Shamim Nemati1,2,3, Atul Malhotra2,3, Gari Clifford1,2,3,4 1 Massachusetts Institute of Technology, Cambridge, MA, USA 2 Harvard University, Cambridge, MA, USA 3 Harvard Medical School, Brigham and Women's Hospital, Boston, MA, USA 4 University of Oxford, Dept. Engineering Science, Oxford, UK The manifestation of T-Wave Alternans (TWA) (both in time and amplitude) is believed to be related to physiological state. We investigated TWA activity on several public and private databases at various heart rates and in healthy subjects, arrhythmia patients, and sleep apnea patients using a superior non-parametric adaptive surrogate test that allows for the differentiation of statistically significant TWA from noise-related alternating patterns. We employed a simple averaging method (SAM) for TWA estimation (which we have shown to be at least as good as the standard Modified Moving Average (MMA) Technique) with and without surrogate testing for TWA detection. Five databases are used: 1) Healthy subjects from PhysioNet's Normal Sinus Rhythm Database (NSRDB), 2,3) Arrhythmia patients from PhysioNet's Chronic Heart Failure Database (CHFDB) and Sudden Cardiac Death Database (SCDDB), and sleep apneic patients from PhysioNet's MIT-BIH Polysomnographic Database (SLPDB), and 4) a private Sleep Apnea Database(SADB). This latter database comprises 85 subjects undergoing overnight polysomnographic analysis for sleep apnea (6-8 hours of recording, apnea-hypopnea index (AHI) ranging from 0 to 122 events/hour with a mean AHI of 16.0 events/hour). TWA magnitudes were calculated for 7 intervals of 10 beats per minute (BPM) between 40 and 110 BPM for each database. We then tested for significant differences between data in each heart rate decade interval between databases using the Kolmogorov-Smirnov test. Figure 1 illustrates the TWA detection statistics after eliminating indeterminate TWA episodes. The lower plots illustrate the statistics after employing the surrogate statistical test (p<0.01). The results indicate that, in the healthy population, the TWA activity level tends to increase with heart rate. But, in the sleep apnea patients there is no apparent increase in TWA activity with an increase in heart rate. Moreover, we note that there appears to be a nadir in TWA around 60-70 BPM, and a small but significant rise in TWA above and below these heart rates. The rise at lower heart rates is not previously reported to our knowledge. We also show that TWA is lower in sleep apnea patients and does not increase with heart rate, although the implications of this finding are unclear.

12
Nonparametric, nonstationary noise rejection in TWA analysis reveals unusual dynamics2
40 60 80 100 1200
20
40
60
80
100
17437213
14027115557517
3058541
Heart Rate (bpm)
TWA
Ampl
itude
(µV)
NSRDB
40 60 80 100 1200
20
40
60
80
100
400912651
140796836
2002582
17
Heart Rate (bpm)
SSADB
%5%50 (median)%95
0
20
40
60
80
100
Perc
enta
ge In
dete
rmin
ate
0
20
40
60
80
100
Perc
enta
ge In
dete
rmin
ate
40 60 80 100 1200
20
40
60
80
100
21153
14432
32
Heart Rate (bpm)
40 60 80 100 1200
20
40
60
80
100
134
579841 862
553201
64
Heart Rate (bpm)
TWA
Ampl
itude
(µV)
Figure 1. Comparison of the NSRDB and SADB patient populations (at matched
HRs) without significance testing (top) and after significance testing (bottom). The
small numbers by the blue circles indicate the number of detected episodes of TWA
for the given HR range. The grey error bars signify the percentage of indeterminate
cases at each HR range over the entire population. Note that, in the top panels the
indeterminate cases are caused by preprocessing failure of associated analysis windows,
while in the indeterminate cases in the bottom panels are an aggregate result of
preprocessing failure and application of surrogate significance testing (α = 0.05). The
results indicate that in the healthy population the TWA activity level tends to increase
with heart rate. But, in the sleep apnea patients there is no apparent increase in TWA
activity with an increase in heart rate.
Nonparametric, nonstationary noise rejection in TWA analysis reveals unusual dynamics3
Table 1. Comparison of TWA activity at different HR in the NSRDB, SLPDB,
and SADB populations using the SAM without significance testing (top) and after
significance testing with α = 0.05 (bottom). For a given HR range, ∆med(1,2) is the
median TWA amplitude of SLPDB population minus the median TWA amplitude
in the NSRDB population. Similarly, ∆med(1,3) is the median TWA amplitude of
SADB population minus the median TWA amplitude in the NSRDB population. †indicates a significant difference between TWA amplitudes at a given HR range using
the Kolmogorov-Smirnov test (p < 0.0001). The empty entries (−) indicate that there
were fewer than 10 detected episodes of TWA activity in the corresponding patient
populations, and thus not amenable to significance testing using the Kolmogorov-
Smirnov test.
HR Band ∆med(1,2) ∆med(1,3)
(beats/min) (µV) (µV)
SAM
50-60 -5.91† -7.60†60-70 -8.82† -8.43†70-80 -9.86† -8.88†80-90 -8.76† -9.19†90-100 -8.00† -9.09†100-110 -8.02† -7.98†
After Significance Testing
50-60 - -5.14
60-70 - -7.87†70-80 - -8.62†80-90 - -8.33†90-100 - -7.88†100-110 - -
Nonparametric, nonstationary noise rejection in TWA analysis reveals unusual dynamics4
Table 2. Comparison of TWA activity at different HR in the NSRDB, CHFDB,
and SCDDB populations using the SAM without significance testing (top) and after
significance testing with α = 0.05 (bottom). For a given HR range, ∆med(1,2) is the
median TWA amplitude of CHFDB population minus the median TWA amplitude
in the NSRDB population. Similarly, ∆med(1,3) is the median TWA amplitude of
SCDDB population minus the median TWA amplitude in the NSRDB population. †indicates a significant difference between TWA amplitudes at a given HR range using
the Kolmogorov-Smirnov test (p < 0.0001). The empty entries (−) indicate that there
were fewer than 10 detected episodes of TWA activity in the corresponding patient
populations, and thus not amenable to significance testing using the Kolmogorov-
Smirnov test.
HR Band ∆med(1,2) ∆med(1,3)
(beats/min) (µV) (µV)
SAM
40-50 - -2.28†50-60 0.03† -2.58†60-70 -1.67† -3.14†70-80 -2.82† -6.23†80-90 -1.08† -5.50†90-100 3.05† -5.70†100-110 9.28† -5.60†110-120 25.05† -1.35†
After Significance Testing
40-50 - -2.70†50-60 - 18.41†60-70 8.01† 6.47†70-80 3.45† 0.11†80-90 9.60† 6.95†90-100 20.71† 0.43†100-110 28.09† 9.69†110-120 30.96† 41.51†
13
O12 Analysis of T-wave Alternans in Stress Tests with Periodic Component Analysis Violeta Monasterio1, Juan Pablo Martinez2 1 CIBER de Bioingeniería, Biomateriales y Nanomedicina, Spain 2 Communications Technology Group, Aragon Institute of Engineering Research, Universidad de Zaragoza, Spain Background: T wave alternans (TWA) analysis was performed on stress test ECGs, comparing a multilead analysis scheme based on periodic component analysis with a single-lead scheme. Materials and methods: The dataset comprised the 12-lead ECGs of 136 subjects recorded during treadmill exercise test in the University Hospital Lozano Blesa of Zaragoza (Spain). Records belonged to two groups: 66 asymptomatic volunteers who underwent the test with negative results for coronary artery disease, and 79 patients with significant stenosis in at least one major coronary artery as shown by angiography. Signals were processed with a multilead scheme that combines periodic component analysis (an eigenvalue decomposition technique whose aim is to extract the most periodic sources of the signal) with the Laplacian likelihood ratio (LLR) method, a single-lead TWA analysis technique. To evaluate the advantages of using a multilead approach, results were compared to those obtained with a single-lead scheme also based on the LLR method. Results and conclusion: The multilead scheme provided a higher sensitivity to low-level alternans than the single-lead scheme. With the multilead scheme, TWA was detected in 43.9% of volunteers and 47.1% of ischemic patients, and with the single-lead scheme in 28.7% and 28.5%, respectively. The same sensitivity was set for both schemes by analyzing ECG fragments where no TWA was likely to be found (signals from healthy subjects at heart rates lower than 100 beats per minute (bpm)). To distinguish between groups according to the risk of sudden cardiac death, results obtained before the heart rate reached a cut-off value were analyzed. With the multilead scheme, the percentage of records with TWA was significantly higher in the ischemic group than in the volunteer group for cut-off points of 100 bpm (7.5% of volunteers, 24.2% of ischemic patients) and 110 bpm (16.6% and 37.1%) whereas this difference was not significant with the single-lead scheme (7.5% and 14.2% for 100 bpm, 13.6% and 21.4% for 110 bpm). The results suggest that the multilead scheme based on periodic component analysis can improve the prognostic utility of TWA tests. However, a cut-off heart rate to predict cardiovascular events in the study population could not be determined because the follow-up information in terms of arrhythmic events was not available.
14
O13 Analysis of T Wave Alternans Using the Dominant T-wave Luca Mainardi1, Roberto Sassi2 1 Department of Bioengineering, Politecnico di Milano, Milano, Italy 2 Dipartimento di tecnologie dell'informazione, Univerità di Milano, Crema, Italy Background. The Dominant T-wave (DTW) reflects the derivative of the repolarization phase of transmembrane potential of myocytes. T-Wave Alternans (TWA) is defined as a beat-to-beat alteration of this repolarization morphology that repeats every other heart beat. We investigate if DTW analysis can be useful to enhance information on TWA. Materials and methods. The CinC Challenge 2008 database consists of 100 multichannel ECG records (2, 3 or 12 leads) sampled at 500 Hz. Thirty-two of these records were generated artificially using 6 ECG models in which TWA was added at different extent (range 2-60 uV). Also, in two synthetic records no alternans was added. This work processed synthetic records only. The ECG signal was high-pass filtered to remove baseline wander and processed for QRS detection using the freely available software ECGPUWAVE. Two average T-wave patterns were built for even and odd beats. Waves were aligned through cross-correlation. Using a biophysical model of repolarization, it can be shown that the T-waves in each thoracic lead is, in first approximation, a scaled version t=s T of a single waveform shape T: the Dominant T-wave. The scaling factor, s, takes into account the effects of volume conductor and of the differences in repolarization times among myocytes. DTW can be computed through Singular Value Decomposition (SVD) of a matrix H, whose rows contain the T-wave measured on each thoracic lead. We have H=USV' where columns of V are the DTW and its derivatives, while the singular values, i.e. the element of the diagonal of S, are related to the scattering of repolarization times around their mean. We computed DTW for each synthetic recording in the database. Two waves were obtained by performing SVD on the average T-waves template (even and odd beats). In presence of TWA we expect that singular values would differ when SVD is performed on even or odd beats’ averages. Results. A significant relationship was observed between synthetic TWA amplitudes and the ratio of the first singular value obtained from even and odd beats’ averages (y=0.993x–6.4318, p<0.00001 in the log-log space) or their differences (y=1.033x+1.697, p<.0001). Conclusions. This study shows the potentiality of the Dominant T-wave concept for quantification of TWA, especially because the parameters we obtained can be linked directly to the physiology of myocytes’ repolarization. Further studies are necessary to evaluate the performance of the method on real data and for different noise levels.
15
O14 Heart Rate Turbulence Denoising Benchmarking Using a Lumped Parameter Model Óscar Barquero-Pérez1, Inmaculada Mora-Jiménez1, Carlos Figuera-Pozuelo1, Rebeca Goya-Esteban1, Juan José Vinagre-Díaz1, Arcadi García-Alberola2, José Luis Rojo-Álvarez1 1 Department of Signal Theory and Communications. University Rey Juan Carlos. Fuenlabrada. Spain 2 Arrhythmia Unit. Hospital Virgen de la Arrixaca. Murcia. Spain Background. Current Heart Rate Turbulence (HRT) measurements require the average of several HRT tachograms. Filtering isolated tachogram will allow to estimate short-term HRT indices, and HRT assessment in a higher number of patients. We aimed to benchmark different denoising techniques for reducing the noise of the HRT, in controlled physiological conditions by using a baroreflex, lumped parameter model. Material and Methods. We used a lumped parameter model (Mrowka et al) as gold-standard, to benchmark denoising techniques. The sensitivity to the modulation of heart rate by the autonomic system was characterized by a baroreceptor sensitivity parameter (BRS). Two denoising methods were tested: (1) Support Vector Machines (SVM), by our group; and (2) cubic splines. A mirror technique was studied for compensating border effects. Tachograms were simulated for three BRS values (50, 24, 4), accounting for normal, medium, and low modulation. Tachograms were corrupted with Gaussian noise (SNR=2, 5, 10, 15 dB). Turbulence slope (TS) was computed for each tachogram realization. Spectral plots of tachograms from the model suggested using the spectral peak (Pmax = max(|FFT|)) to characterize the HRT (fig 1). TS and Pmax estimations were compared (bias and mean absolute error, MAE), with parameters computed in actual, noise-free tachograms. Results. Parameters in noise-free tachograms were TS (0.61, 3.78, 8.49 ms/RR-Int) and Pmax (27.70, 103.12, 210.02) for low, medium, and normal BRS, respectively. TS in denoised tachograms had similar bias when using Spline and SVM for low and medium BRS, whereas the bias was higher using Spline for normal BRS. For normal BRS, TS_Spline(SNR_2)=-2.13 ms/RR-Int, TS_SVM(SNR_2)=-1.40 ms/RR-Int, TS_Spline(SNR_15)=-2.70 ms/RR-Int, and TS_SVM(SNR_15)=-0.52 ms/RR-Int. Mirror technique enhanced TS estimation using SVM, reducing bias and absolute error ([bias,absolute error]) for low-BRS: TS_SVM(SNR_2)=[0.72,0.72] ms/RR-Int; TS_SVM_mirror(SNR_2)=[0.52,0.55] ms/RR-Int; TS_SVM(SNR_15)=[0.29,0.31] ms/RR-Int; TS_SVM_mirror(SNR_15)=[0.12,0.15] ms/RR-Int. Pmax was better estimated with SVM, mainly in medium and normal BRS. Normal BRS: Pmax_Spline(SNR_2)=50.38; Pmax_SVM(SNR_2)=10.54; Pmax_Spline(SNR_15)=8.41; Pmax_SVM(SNR_15)=-5.52. Conclusions. SVM denoising provided a more stable and accurate HRT parameters estimation. Mirror techniques allowed to enhance HRT accuracy using SVM. Frequency domain parameters can complement current HRT characterization.

16
0 0.1 0.2 0.3 0.4 0.5
020
40600
50
100
150
200
250
Frequency (Hz)
HRT |FFT|. Mrowka Model
BRS
|FFT
|

17
O15 Heart Rate Turbulence and Phase-Rectified Signal Averaging: Methods and Clinical Application Raphael Schneider Medtronic Bakken Research Center, Research & Technology Methods analyzing ECGs to assess heart rate variability (HRV) have to deal with non-stationary and noisy signals. The methods presented, Heart Rate Turbulence (HRT) and phase-rectified signal averaging (PRSA), facilitates the processing of such signals to extract clinical relevant information. HRT assess the reaction of the autonomic nervous system when a premature ventricular complex (PVC) occurs by analysing the sinus rhythm after PVCs. Thus, HRT looks at specific segments of an ECG. PRSA on the other hand analyses the whole ECG and provides a high sensitivity to detect small oscillations in the heartbeat tachogram. PRSA also allows to analyse separately oscillations related to heart rate decelerations and heart rate accelerations. Both methods enable a better risk stratification in post myocardial infarction patients than the standard HRV parameters. The presentation will explain both methods in more detail and the clinical application of both methods.

18
O16 A Statistical Approach for Accurate Detection of Atrial Fibrillation and Flutter Shishir Dash, Ernst Raeder, Snehraj Merchant, Ki H. Chon Department of Biomedical Engineering, SUNY at Stony Brook, Stony Brook, NY,11794, USA Atrial fibrillation (AF) is the most common clinical arrhythmia afflicting 2-3 million Americans. It is a major risk factor for ischemic stroke and therefore early detection of AF and mitigation of its deleterious consequences must be a public health priority. Atrial fibrillation is generally considered to be a random sequence of heart beat intervals with markedly increased beat-to-beat variability. We have developed an algorithm for real-time detection of AF and atrial flutter (AFL) which combines four statistical techniques to exploit these characteristics, namely the Root Mean Square of Successive RR interval differences to quantify variability, the Turning Points Ratio to test for randomness of the time series, Shannon entropy to characterize its complexity and a high-resolution time-frequency spectral method to find the number of high frequency spectral peaks in a given 128-beat RR interval segment. In an analysis of long-term recordings in the MIT Atrial Fibrillation database, we have achieved a sensitivity of 95% and a specificity of 96.7% in detecting AF. It should be recognized that for clinical applications, the most relevant objective is to detect the presence of AF in a given recording but not necessarily every single AF beat. Using this latter criterion, we achieved episode detection accuracy of 100% for the MIT-BIH AF database. In a more recent analysis of 72 Holter recordings provided by the Scottcare Corporation (www.scottcare.com), we correctly identified the presence of AF episodes in all subjects with a beat-to-beat sensitivity of 95% and specificity of 87%. The algorithm performed well even when tested against AF mixed with several other potentially confounding arrhythmias in the MIT-BIH Arrhythmia Database (Sensitivity = 90.2%, Specificity = 91.2%). The flutter detection algorithm has undergone preliminary testing on 2 files of the MIT AFIB database which contained around 80 minutes of AFL. High sensitivity (97%) and specificity (95%) have been obtained. Due to the simplicity of our algorithm, the computational speed is higher, thus making it easier to implement and requiring less memory than competing algorithms which store training data information.

19
Magnetocardiography O17 Space-time Standardization of magnetocardiography - closer to the goal Akihiko Kandori1, Kuniomi Ogata1, Tsuyoshi Miyashita1, Yasushi Watanabe2, Kimio Tanaka2, Masahiro Murakami3, Yuji Oka2, Hiroshi Takaki4, Syuji Hashimoto4, Yuko Yamada4, Kazuo Komamura4, Wataru Shimizu4, Shiro Kamakura4, Shigeyuki Watanabe5, Kazutaka Aonuma5 1Advanced Research Laboratory, Hitachi, Ltd., Tokyo, Japan 2Hitachi General Hospital, Ibaraki, Japan 3Hitachi High-Technologies Corporation, Ibaraki, Japan 4National Cardiovascular Center, Osaka, Japan 5Tsukuba University, Tsukuba, Ibaraki, Japan Background The magnetocardiogram (MCG) is a new non-contact medical tool for detecting and visualizing cardiac electrical activation in the heart. To determine the abnormalities in the heart disease patients using MCG, we have produced a large-scale MCG database [1] and a standard MCG waveform [2] of healthy subjects. In this presentation, we have summarized MCG features regarding to the time length and current distribution. Methods We measured 869 MCG data (male: 554 subjects; female: 315) using a conventional 64-channel MCG system, which covers the whole heart. Out of 869 subjects, 464 people (male: 268, female: 196) were identified and analyzed as a normal group using ECG data. Time intervals (PQ, QRS, QT, and QTc), current distributions (maximum current vector (MCV), and the total current vector (TCV)) of MCG data of the 464 normal subjects were analyzed to obtain basic MCG parameters. Furthermore, the measured data were averaged after shortening or lengthening and normalization to produce a standard MCG waveform. Using the standard MCG waveforms, the current distribution feature was clarified in each waveform. Results Although mean values of PQ and QRS intervals of the male subjects were about 10ms (PQ) and 6 ms (QRS) longer than those of the female subjects, no intervals were correlated with gender or age. The correlation (R2=0.8) between PQ intervals of ECG and those of MCG was better than the correlation (R2=0.3 or 0.4) between QRS and QT intervals of ECG and those of MCG. Both MCV and TCV angles were much smaller (30-50%) than the electrical-axis angle in ECG. Furthermore, the current distribution of the produced standard waveform had a ‘breakthrough’ at 25 ms from the QRS onset. Conclusion The large-scale MCG database provides a standardization for space-time MCG analysis. References [1] Kandori A, et al., Space-time database for standardization of adult magnetocardiogram- Making standard MCG parameters Pacing and Clinical Electrophysiology, 2008 Apr;31(4):422-31. [2] Kandori A, et al., Standard template of adult magnetocardiogram, Annals of Noninvasive Electrocardiology, 2008;13(4):390–399. Acknowledgements This work was supported by ‘Strategic Promotion of Innovative R&D’ in Japan Science and Technology Agency (JST). Key words: magnetocardiogram, database, current-arrow map
20
O18 AF Shows Recurrent Spatial Characteristics in MCG Ville Mäntynen1,2, Raija Jurkko1,3, Lauri Toivonen1,3, Juha Montonen1 1 BioMag Laboratory, HUSLAB, Helsinki University Central Hospital, Helsinki, Finland 2 Department of Biomedical Engineering and Computational Science, Aalto University School of Science and Technology, Helsinki, Finland 3 Department of Internal Medicine, Helsinki University Central Hospital, Helsinki, Finland Background: The purpose of the study was to find out if magnetocardiography (MCG) could be utilized in characterization of atrial fibrillation. Materials and methods: We studied 99-channel MCG mappings of five patients with atrial fibrillation (AF) measured during AF for 7 minutes. In signal morphology, recordings of two patients showed high amplitude and stabile fibrillatory signal but different morphologies, recordings of two other patients showed bursts of a few fibrillatory wave forms but different morphology and inter burst times, and the recording of one patient showed atrial flutter. Magnetic fields were visualized as isofield contours and pseudocurrent maps on sensor plane, formed using magnetic multipole interpolation. Mean direction of the strongest 30 percent of the pseudocurrents was defined as the magnetic field map orientation. R-R intervals exceeding 1000 ms were animated, from the end of T wave until the onset of the QRS, using 20 ms moving average window with 5 ms succession between frames. Frames consisting of a snapshot of isofield contours, pseudocurrents and current interval MCG data were combined and viewed as movies. Movies were reviewed for cyclic and recurrent spatial patterns in magnetic field maps. Magnetic field map orientation was plotted on time axis for comparison with movies. Orientation data was “unwrapped” changing absolute jumps greater than or equal to pi to their 2*pi complement. Results: Stable fibrillatory rate or bursts of a few fibrillatory waves with large amplitude were mainly perceived as rotation of the map. The two recordings with stabile high amplitude fibrillation differed in stability of map rotation: In the first clockwise rotation dominated, whereas in the second counter-clockwise and clockwise rotation alternated. This behavior could be seen in orientation versus time plots as consistent increase or fluctuation, respectively. In the two recordings with bursts the difference was more subtle. Nevertheless, the recording with stronger bursts and higher repetition rate also showed larger range of rotation. In flutter recording the same cyclic signal morphology was observed in all intervals. Flutter was perceived as counter-clockwise rotation of the map and decreasing orientation versus time curve. Conclusion: Magnetocardiographic mapping seems feasible in characterization of AF. With MCG, cyclic and recurrent spatial patterns can be detected during AF, and moreover, magnetic field map rotation seems to change direction in conjunction with a change in morphology of fibrillatory wave. MCG mapping seems to provide a new useful tool for characterization of AF.

21
O19 Magnetocardiographic Assessment of TP Segment Morphology in Mitral Regurgitation Due to Mitral Valve Prolapse Andrey Vasnev, Yuri Maslennikov, Mikhail Primin, Igor Nedayvoda, Oksana Sitnikova, Svetlana Kuznetsova, Yuri Gulyaev 1 CRYOTON Co.Ltd, Troitsk, Moscow Region, Russia 2 Institute of Radio-engineering and Electronics, Russian Academy of Sciences, Moscow, Russia 3 Institute of Cybernetics, Ukrainian Academy of Sciences, Kiev, Ukraine 4 Institute of Cybernetics, Ukrainian Academy of Sciences, Kiev, Ukraine 5 CRYOTON Co.Ltd, Troitsk, Moscow Region, Russia 6 Central Clinical Hospital of Russian Academy of Sciences, Moscow, Russia 7 Institute of Radio-engineering and Electronics, Russian Academy of Sciences, Moscow, Russia Background: We studied in subjects with mitral regurgitation due to mitral valve prolapse (MR-VP): specific alterations of the TP segment (TPS) shape, cardiac magnetic fields (CMFs) distribution and activation patterns during the TPS and P-wave. Materials and methods: 9-channel MCG recordings were performed in 40 subjects with the MR-VP (grade - ) in an unshielded space at rest. The control group included 20 subjects without MR. Negative and positive Pmax-waves (P-max and P+max) of the synchronized and averaged PQRST magnetocardiocycles were taken for the TPS shape analysis. We assessed during the TPS and P-wave interval: position of the main positive extremum (M+extr) and additional positive extrmum(s) (mn+extr) in the three triangular sectors (2-4 TSs) corresponding to the areas of the left atrial (LA) magnetic field distribution on sequential CMF maps; positive extremums amplitudes alterations. Results: We observed the presence of the external magnetic noise during the whole TPS and absence of positive extremums in the three TSs (2-4) during right atrial (RA) depolarization in the control group. We determined: 1) slowly downsloping TPS deviation (a negative "delta TP-wave") beginning from the TP baseline and ending at the depressed TP-to-P-wave transition point of the P-max -wave in all MR-VP subjects; 2) slowly upsloping TPS deviation (a positive "delta TP-wave") beginning from the TP baseline and ending at the elevated TP-to-P-wave transition point of the P+max-wave in those who also had this P-wave type. The mean "delta TP-wave" duration was (170 ± 41ms). The CMFs generation occurred during the "delta TP-wave" and went on during the RA depolarization phase. General CMFs distribution patterns included: a "fixed" position of the M+extr in one of the three (2-4) TSs (dipolar structure mono-jet); an "unfixed" position or "switching" of the M+extr between the three (2-4) TSs and the appearance of one or more mn+extr(s) in these TSs (multipolar structure poly-jets). Activation patterns included steady activation and unsteady one due to dynamic waxing and waning alterations of the positive extremum(s) amplitudes. The appearance of "bizarre" additional low amplitude positive/negative extremums was due to external magnetic noise admixing during the "delta TP-wave". Conclusions: The appearance of the "delta TP-waves" before the P-waves during the TPS is due to the MR jet(s) inflow. We hypothesize that directed systolic MR jet(s) impinging against the wall(s) of the LA cause regional stretch-induced diastolic LA depolarization through the mechanoelectrical feedback mechanism during the "delta TP-wave" and RA depolarization phase.

22
Conventional 12-lead ECG: What’s New? O20 Similarity of ST and T Waveforms of 12-lead ECG Acquired from Different Monitoring Electrode Positions Elin Trägårdh Johansson1, Annika Welinder2, Olle Pahlm2 1 Dept of Clinical Physiology, Lund University, Malmö, Sweden 2 Dept of Clinical Physiology, Lund University, Lund, Sweden Background: Diagnostic criteria used to interpret the standard 12-lead ECG have been developed for recordings done with the 3 limb electrodes placed on the distal limbs. However, for monitoring, the limb electrodes are usually placed on the torso to reduce noise. The Mason-Likar (M-L) torso positions are commonly used, although waveforms obtained from this method have shown large differences when compared with those obtained from the standard limb electrode positions. To develop only 1 convention for ECG recording in the future, such a recording must produce waveforms that have morphologies close to those obtained with standard ECG, and of high noise immunity. Previous studies have reported that the “Lund” (LU) system agreed better with the standard system than did the M-L system (figure 1), with regard to Q-wave width and QRS axis. We tested whether the LU and the M-L electrode placement systems would produce waveforms similar to those of standard ECGs with regard to the ST-T-segment. Methods: Four 12-lead ECGs were recorded in 52 patients (patients admitted to Clinical Physiology or Cardiology Units in Malmö): 2 standard, 1 LU, and 1 M-L ECGs. Patients whose standard ECG were reported as “Normal ECG” based on computer interpretation were not included. The T axis, as well as STJ level and T wave amplitude in leads V2, V5, I and aVF were automatically measured. The paired t-test was used comparison of the ECG variables with each lead system. Results: Of all ECG variables tested, only the differences between the first standard and the M-L ECG with regard to STJ level in lead V2 and T wave amplitude in lead V2 were found to be statistically significant (p=0.021 and p=0.049, respectively). Conclusion: The results from the present study, together with previous results regarding Q waves and QRS axis, indicate that the LU system might qualify as a “universal system” for diagnostic ECGs as well as monitoring ECG applications.
23
O21 A Study of Minnesota Code ECG Classification System in an Apparently Healthy Taiwanese Population Ming-Ju Tsai1, Yu-Shan Chen1, Ching-Shiun Chang1, Chia Chun Lu1, Yueh Chen1, Ing-Fang Yang2,3, Ten-Fang Yang1,3 1 College of Biological Science and Technology, National Chiao Tung University, Hsin-Chu City, Taiwan 2 Department of Internal Medicine, Jen-Chi General Hospital, Taipei city, Taiwan 3 Institute of Biomedical informatics, Taipei Medical University, Taipei City, Taiwan Background: The ECG Minnesota code (MC) classification system was first introduced in 1960 which comprises rules for classifying electrocardiographic waveforms . Many computer programs have since been designed for the classification of electrocardiograms(ECGs) according to MC. The criteria include Q and QS Patterns(code 1), QRS axes deviation(code 2), high amplitude R waves(code 3), ST junction and segment depression(code 4), T-waves(code 5), A-V conduction defect(code 6) , ventricular conduction defect(code 7) , arrhythmias(code 8) and ST segment elevation(code 9).These codes have been applied in many large scale epidemiological clinical trials in Caucasians worldwide Until recently, there is no large scale of MC ECG application in Taiwanese reported. Therefore, the present research focuses on the accuracy of MC application in Taiwanese normal ECGs. Materials and Methods:A total of 513 healthy Taiwanese (255 Men Aged 44.4±14.9, 258 Women Age 43.3±14.3) were recruited from Taiwan and stored in the Glasgow database for this study. First of all, ECG data processing and storage. All ECGs were subsequently analyzed using the latest version of the University of Glasgow ECG interpretation program to which automated methods for Minnesota Coding were added and then exported into a format suitable for statistical data analysis. The data were first stratified by implemented Minnesota code. Secondly, data were filtered and MC criteria correctly classified cases were excluded. The wrongly (total: 358) classified ECGs were left for the analysis. Finally, further analysis of ECG data and MC coding were performed. Specificity was calculated according to the existing each MC codes in the complete Database. Numbers of ECGs and their corresponding specificities were tabulated in the table shown in the results. Results: Specificity of each code were depicted by tables of code 1 to code 8 (Table 1).Each MC can be demonstrated and evaluated from these results for this specificity in this Taiwanese normal population. For instance: The specificities of all code 1 are greater than 99% that means the criteria of Q and QS Patterns are suitable to applied in this Taiwanese normal population (Table 2). But there were three exceptions code 3-1, code 7-6 and code 9 determined to be of no clinical significance were excluded. Conclusion:Through the evaluation of the results reveals that the relatively high specificities on this normal Taiwanese ECGs might lead to MC application in large scale epidemiological and clinical studies.

24
.
!"#$%&'&
()%*+,+*+-.&/,&%"*0&12&*/3%4&
!"#$%"!&"'#(()*$+" ,-.#/)"0()1+"
23%)" $415)*" +6)278727(9" 23%)" $415)*" +6)278727(9"
:-:-;" '& 5'675'89::;<=>& <-;" '?& @:A75'89:A;A=>&
:-;-:" '& 5'675'89::;<=>& <-=" 68& @:B75'89:5;5=>&
:-;-;" @& 5B:75'89::;6=>& <->" 'B& 5'B75'89:<=>&
:-;->" '& 5'675'89::;<=>& " & &
:-=-=" 8& 5'B75'89::;@=>& " " "
:-=->" 6& 5''75'89::;A=>& " " "
!?&"@A7+"B)/7#(73$" @-C"D3$%42(73$"B)8)2(&
23%)" $415)*" +6)278727(9" 23%)" $415)*" +6)278727(9"
;-:" 8& 5'B75'89::;@=>& E->-:" 8& 5'B75'89::;@=>&
;-;" 8& 5'B75'89::;@=>& E-<" '6& 5B'75'89:?;A=>&
;-=" '<& @:575'89:A;@=>& " & "
;-<" 8& 5'B75'89::;@=>& & & &
F7GH"@16I7(4%)"?".#/)+" C)$(*724I#*"D3$%42(73$"B)8)2(&
23%)" $415)*" +6)278727(9" 23%)" $415)*" +6)278727(9"
=-:" 8B& @<875'89:@;'=>& J->" 'B& 5B875'89:<=>&
=-;" 6& 5''75'89::;A=>& J-<" 6@& @<:75'89:5;8=>&
=-=" 65& @<<75'89:5;'=>& J-E" :B& @6875'89<6;@=>&
&,"K4$2(73$LKM"#$%"&)G1)$("B)6*)++73$" @**H9(H17#+&
23%)" $415)*" +6)278727(9" 23%)" $415)*" +6)278727(9"
>-;" 6& 5''75'89::;A=>& N-:-:" 8& 5'B75'89::;@=>&
>-=" 'B& 5B89:<=>& N-:-;" 6& 5''75'89::;A=>&
>->" 6& 5''9::;A>& N-J" A& 5B?75'89:<;<=>&
" & & N-N" 8& 5'B75'89::;@=>&
&
!"#$%&6&
!0%&3+4-C+#D-+/E&/,&12&()%*+,+*+-.&+4&,C/F&$/G%C&-0"E&:5=&-/&::=&+E&E/CF"$&!"+G"E%4%&H2I4&
()%*+,+*+-.& 1+EE%4/-"&*/3%&
J:5=& 8K'& ?KA& & & & & & & & & &
:5=& 8K8& 5K8& ?K5& & & & & & & & &
:A=& 6K8& 5K6& & & & & & & & & &
:?=& AK5& ?K8& & & & & & & & & &
:<=& @K8& 5K@& ?K@& <K?& & & & & & & &
::=& 2/3%&'& 6K'& 6K6& 6K5& 8K6& @K6& @K@& AK@K'& <K'K'& <K'K6& <K<&
&

25
O22 R Wave Amplitude in Normal Nigerians Using Debut Automated Analysis. Ibraheem Katibi, Peter Macfarlane, Elaine Clark, Brian Devine, Suzanne Lloyd, Stephen Aiyedun, Wemimo Alaofin, Toyin Omoneyin University of Ilorin, United Kingdom Introduction: R wave amplitude of normal ECG has been well studied for several racial groups except indigenous Black Africans. All previously reported ECG studies among Nigerians have been through manual rather than automated analysis. Methods: 12 lead ECGs were recorded using a Burdick Atria 6100 electrocardiograph in and around Ilorin, Nigeria. Volunteers were recruited from the University of Ilorin and from surrounding villages. Each was medically examined by a physician and a detailed medical history obtained. Data was gathered locally on a PC and sent to Glasgow for further analysis. ECGs were reviewed to exclude any that were technically unsatisfactory and others that had an unexpected abnormality. The ECG measurements underwent statistical analysis using SAS v9.1. Plots and summary statistics were used to assess, informally, the relationship of R amplitude with age and sex. Regression techniques addressed formal relationships. Normal ranges were established by splitting the data into age-sex subgroups and by calculating the 96th percentile range within each subgroup. Results: The study included 782 males and 479 females, all apparently healthy, with a relatively even spread of ages between 20 and 87 years. The R voltages showed remarkable progression across the age groups for females but not for males. Similar trends were also observed for Cornell Index, Sokolow and Lyon and Araoye’s voltage criteria. S voltages were highest in the male population aged 20-29 years and progressively decline with advancing age, particularly in V1. Conclusion: This is the first large study of automated ECG recording in healthy Blacks living in West Africa. The findings reported here are in sharp contrast to those seen in Caucasians, thereby requiring further evaluation.

26
O23 Early Repolarization in Children with Unexplained Syncope Eva Fernlund, Petru Liuba Early repolarization in children with unexplained syncope Introduction: It has traditionally been believed that early repolarization (ER) is benign. Recently Haissaguerre et al (NEJM 2008) found in a large cohort of adult survivors of sudden cardiac arrest significant association between ER and sudden cardiac arrest due to idiopathic ventricular fibrillation. In some prior studies, unexplained syncope has been linked to risk of sudden death but the mechanisms remain speculative. We assessed herein the prevalence of ER in children referred to our center for unexplained syncope. Methods: We evaluated retrospectively electrocardiograms from such children (n=29; mean age 12.1, range 7-18 years) for presence of ER, which was defined as an elevation of the QRS–ST junction (J-point) in at least two leads of at least 1 mm (0.1 mV) above the baseline level. The anterior precordial leads (V1 to V3) were excluded from the analysis to avoid inclusion of patients with right ventricular dysplasia or Brugada syndrome. Age-matched children (n=33; mean age 12.3, range 7-16 years) with non-cardiac chest pain were included as controls. Results: ER was detected in 45 % (13/29) of children with unexplained syncope versus 24 % (8/33) in the chest pain group. Among children with syncope, ER was far more frequent in males than in females (8/12 versus 5/17, respectively). Echocardiography showed normal functional and structural findings in all children. Conclusion: In this relatively small-scale retrospective study of children with unexplained syncope with otherwise normal cardiac findings, we found particularly among those of male gender a greater prevalence of ER than in controls (noncardiac chest pain). With view to earlier findings of Haisaguerre et al (NEJM 2008), this intriguing association warrants further prospective studies addressing its precise clinical implication and underlying mechanisms.

27
JUNE 3, 2010 16,45 – 18.15 ECG in Atrial Fibrillation O24 Ventricular Response During AF–A Mathematical Model of the AV Nodal Function Frida Sandberg1, Valentina Corino2, Luca Mainardi2, Antonio Bayes de Luna, Leif Sörnmo1 1 Dept. of Electrical and Information Technology, Lund University, Sweden 2 Dept. of Bioengineering, Politecnico di Milano, Italy 3 Catalan Institute of Cardiovascular Sciences, Barcelona, Spain Background: The atrioventricular (AV) node is of particular importance during atrial fibrillation (AF). The aim of this study is to present a mathematical AV node model for which the parameters can be estimated from short-term analysis of the surface ECG. Materials and methods: Atrial impulses are assumed to arrive to the AV node according to a Poisson process with a mean arrival rate. Each atrial impulse arriving at the AV node will result in a ventricular contraction, unless the atrial impulse is blocked. The atrial impulses are blocked at the AV node according to a time-dependent probability, modeling AV nodal refractory period and concealed conduction. An atrial impulse arriving close in time to the previous ventricular contraction is more likely to be blocked; all atrial impulses arriving prior to the end of the AV nodal refractory period are blocked. Two different refractory periods (tau1 and tau2), corresponding to dual AV nodal paths, as well as the probability of an atrial impulse choosing either of these, are used in the model. The mean arrival rate is estimated by the AF frequency, obtained from the atrial activity of the surface ECG, and the shortest refractory period (tau1) is estimated from the lower envelope of the Poincaré plot of the RR series. The other parameters characterizing the AV model are obtained from the series by means of maximum likelihood estimation. The output of the AV model is the probability density function (PDF) of the time for which the ventricular activations occur. The average absolute error between the normalized RR histogram and the estimated PDF is computed for bins of 20 ms size, spaced between 0 and 2 s. In addition, the absolute error between the mean and the variance of RR series and of the PDF is assessed. The model was tested on 115 recordings from patient with AF and congestive heart failure (NYHA II-III) enrolled in the MUSIC study (MUerte Subita en Insuficiencia Cardiaca). Results: The median error is 0.0021 and the 25th/75th percentile error 0.0017/0.0026. We judged the maximum acceptable error to be 0.0025. Using this threshold, 81 of 115 recordings (70%) were well-fitted by the model. The average error between the mean and the variance is 0.01±0.02 and 0.01±0.01, respectively. Conclusion: These preliminary results are encouraging as certain AV nodal properties can be noninvasively characterized by a set of statistical parameters with electrophysiological interpretation.

28
O25 Conduction Patterns in the Coronary Sinus During Atrial Fibrillation and their Modification by Pulmonary Vein Isolation Pyotr Platonov1, Prashanthan Sanders2, Shashidar 2, Anthony Brooks2, Fredrik Holmqvist1, Jonas Carlson1 1 Department of Cardiology, Lund University and Center for Integrative Electrocardiology at Lund University (CIEL), Sweden 2 Discipline of Medicine, University of Adelaide, Adelaide, Australia Introduction: Correlation function analysis has been used for analysis of preferential conduction during atrial fibrillation (AF). This study was aimed to evaluate whether preferential activation patterns in coronary sinus (CS) are affected by AF ablation. Methods: Seventeen pts (56±9 yrs) undergoing ablation of AF were studied. Unipolar signals were recorded during 60 sec from 10-pole CS catheter during AF at baseline (BL), after isolation of left and right PV and after additional lines in the left atrium (End). Correlation function analysis was applied to signals from each pair of adjacent electrodes, and graphs of cumulated time delays were made to enable interpretation of direction of activation. AFCL was calculated in each CS electrode pair and mean AFCL value in CS was studied. Results: At BL, 11 pts had left-to-right, 3 had right-to-left and 3 had simultaneous activation in CS. During ablation, AFCL increased from 184±32 ms at BL to 193±39 ms after PV isolation and 215±39 ms at the end of ablation (p<0,05, BL vs. End). In 4, AF terminated during the procedure. In 4 of 11 pts with left-to-right activation at BL, its direction changed to simultaneous or right-to-left. In 1 of 3 pts with simultaneous activation at BL, the direction changed to right-to-left. No direction change was observed in any of 3 pts with right-to-left activation at BL. Conclusions: Correlation function analysis reveals changes in preferential conduction during ablation of AF that may reflect modification of AF substrate and indicate persistent right atrial sources not affected by ablation of in the left atrium only.

29
O26 Non-invasive Estimation of Organization in Atrial Fibrillation as a Predictor of Sinus Rhythm Maintenance Richard Petersson1, Frida Sandberg2, Pyotr Platonov1, Fredrik Holmqvist1 1 Department of Cardiology, Lund University and Center for Integrative Electrocardiology at
Lund University (CIEL), Sweden 2 Department of Electrical and Information Technology, Lund University and Center for Integrative Electrocardiology at Lund University (CIEL), Sweden
Background. Atrial fibrillatory rate (AFR) has been suggested to be a non-invasive index of atrial refractoriness and hence of electrical remodeling. Previous studies indicate that the predictive value of AFR in patients undergoing cardioversion of atrial fibrillation (AF) of long duration is limited. The present study investigates AF signal entropy as a predictor of sustained sinus rhythm (SR). Methods. A standard 12-lead ECG was recorded from 66 consecutive patients (46 men; mean age 68 ± 9 years) with AF undergoing cardioversion. The atrial signal was isolated by cancelling out the QRST signal. The dominant atrial frequency (DAF) was then calculated. In order to reduce residual noise in the atrial signal, the main atrial wave, which constitutes the fundamental waveform of the atrial activity, was obtained from the atrial activity by applying a filter, based on the DAF. Sample entropy was then computed. A mean sample entropy value for the whole recording for each patient was finally calculated. At follow-up, four weeks post cardioversion, new ECG recordings were acquired for rhythm analysis. Results. At the four-week follow-up, 59% of the patients had relapsed to AF. The AF signal entropy of these patients before cardioversion was 0.099 ± 0.015, while it was 0.093 ± 0.012 amongst the 41% maintaining SR (P = 0.02). The left atrial diameter was 50 ± 7 mm in the group with AF at follow-up and 48 ± 8 mm in the SR group (P = 0.39). AFR, 372 ± 48/min in the AF group and 350 ± 40/min in the SR group (P = 0.02), and AF duration, 163 (2-983) days in the AF group and 90 (2-240) days in the SR group (P < 0.05), were predictive of SR maintenance. Conclusion. It is possible that AF signal entropy is of clinical importance when it comes to identifying patients likely to maintain SR after cardioversion. This may help the clinician choose between a rhythm control strategy (i.e. cardioversion and antiarrhythmic drugs) and a rate-control strategy.
Rhythm at follow-up
SRAF
AF
sign
al e
ntro
py
,15
,10
,05
,00
AF signal entropy and rhythm at follow-up
Page 1

30
O27 Effects of Atrial Septal Pacing Sites on the P-wave Duration Correlated with Baseline P-wave Duration and Morphology Yan Huo2, Fredrik Holmqvist1, Jonas Carlson1, Arash Arya2, Ulrike Wetzel2, Andreas Bollmann2, Pyotr Platonov1 1 Department of Cardiology, Lund University Hospital and Center for Integrative Electrocardiology at Lund University (CIEL), Sweden
2 Department of Electrophysiology, Leipzig Heart Center, Leipzig University, Leipzig, Germany Background: Atrial septal pacing (SP) has been shown to shorten P-wave duration and lower the risk of atrial fibrillation (AF) recurrence in patients with bradyarrhythmias. However, high variability of interatrial conduction pathways and baseline atrial conduction properties may explain the modest clinical benefit of SP and the high number of non-responders. We performed a study to test the hypothesis whether interatrial conduction properties during sinus rhythm may be used for selection of atrial septal pacing site and predict the benefit of SP. Methods: Forty-one consecutive patients (age 48±16y, 24 men) were studied. Atrial septal pacing was delivered at high atrial septum (HAS), posterior septum behind Fossa Ovalis (PSFO) and CS ostium (CSo) with a fixed cycle length. 12-lead ECG was recorded during 30 sec at baseline and during pacing, transformed to orthogonal leads and signal-averaged for analysis of P-wave duration (PWD). Results: PWD was significantly shorter during pacing at CSo (112±17ms) than at HAS (122±14ms, P=0.031) or PSFO (125±25ms, P=0.005). There was a positive linear correlation between PWD ( PWD = baseline PWD - paced PWD) and PWD at baseline with longer P-waves being associated with more advanced PWD. 11 of 41 patients had normal PWD at baseline, defined as PWD < 120ms. There were statistically significant differences in PWD between PWD < 120ms and PWD > 120ms groups at all HAS (-9.27±19.84 vs. 12.55±15.62ms, P=0.001), PSFO (-13.45±18.11 vs. 11.13±31.16ms, P=0.019) and CSo (-6.09±18.05 vs. 25.20±21.14ms, P=0.000) pacing sites. Conclusion: The optimal septal pacing sites can be selected by using combination of P-wave duration at baseline and interatrial conduction properties. When P wave is prolonged at baseline, pacing at CSo might offer the most optimal biatrial synchronization. However, the patients with normal P-wave duration might not benefit from septal pacing.

31
Cardiovascular Resuscitation O28 The Comparison of Six Quantitative Waveform Measures in Measuring the Deterioration of Untreated VF Lawrence Sherman1,2, Thomas Rea1,2, Randi Phelps2, Carol Fahrenbruch2 1 University of Washington School of Medicine, Seattle, WA, USA 2 King County Public Health Emergency Services Division Background: Quantitative waveform measures (QWM) of VF are predictive of shock outcome. These include: logarithm of absolute correlations (LAC), median slope (MS), amplitude spectrum area (AMSA), angular velocity (AV), frequency Ratio (FR), and cardioversion output predictor (COP). Several important characteristics of these QWM have not been experimentally determined: (1) how much variation exists between adjacent segments of VF, (2) what is the minimal length of VF required to determine the state of VF, (3) how rapidly do the QWM deteriorate over time with untreated VF. We sought to determine these characteristics. Methods: We used the AED recordings from 85 out of hospital VF arrests from a metropolitan EMS system to derive the 6 waveform measures: In part one, 152 five second epochs of VF were isolated. The six QWM were calculated on epochs decreasing from 5 to 1 second duration in 0.1 second increments. Altman/Bland analysis was performed to compare the truncated segments with the 5 second reference segment. Bias and standard deviations (SD) of matched points at each time interval were performed. In part two, 14 episodes of VF free of CPR for over 20 seconds were identified. The six QWM were then calculated with measurements made at 0.1 second intervals over the length of the episode. Altman/Bland analysis was performed to compare the initial interval of VF to each of the subsequent intervals. Bias at each point was then plotted and the slope of this curve defined the rate of change. The SD between adjacent VF segments in part two was taken as the reference used to determine the minimum sufficient length of VF from part one with SD less than that. Results: Part one: Minimum VF duration required for QWM calculation (seconds): AMSA (2.3), MS (3.5), AV (4.4), COP (4.5), LAC (4.6), FR (<1). Part two: The average rate of change in untreated VF (units/minute): MS (1.728), AV (1.326), AMSA (1.014), FR (0.438), LAC (0.288), and COP (0.168). Conclusion: The deterioration of VF can be measured quantitatively by QWM. The MS, AV and AMSA demonstrate the greatest change. Length of recording required for accurate determination of QWM varies between measures from less than 1 second to 4.6 seconds. The MS, AV and AMSA can be used to monitor VF and guide therapy.

32
O29 Modelling the Relationship Between ECG Characteristics and CPR Quality During Cardiac Arrest Kenneth Gundersen1,2, Jan Terje Kvaløy1 1 University of Stavanger, Norway 2 Norrwegian Air Ambulance Foundation Background: Cardiopulmonary resuscitation (CPR) and defibrillation are the main treatment interventions for cardiac arrest patients. In the recent years it has become possible to record signals reflecting in detail the characteristics of clinical CPR, and it has also been shown that characteristics of the ECG reflect the state ('vitality') of fibrillating myocardium. Developing a statistical model for the relationship between clinically obtainable physiological measurements (e.g. ECG characteristics, end-tidal CO2) and CPR characteristics (e.g. compression force, depth) would be interesting for several purposes. For example the CPR characteristics for optimal myocardial perfusion might be identified, and a model might be used clinically to guide treatment by predicting the effect of CPR of some quality on the patient. In general, having a good, descriptive or mechanistic, model that relates important physiological measurements and treatment factors can allow for a better understanding of how treatment affect a patient and how different treatments interact. Methods: In the current work we have attempted to develop a minimal model for the relationship between median-slope (an indicator of the state of the myocardium calculated from the ECG) and CPR characteristics by using mixed effects stochastic differential equation models and fitting these to observational data from out-of hospital cardiac arrest episodes. Mixed effects models are required since we have data from multiple patients in greatly varying condition, and with possibly varying model parameters due to differences in anatomy and etiology. Further, a stochastic model, as opposed to an ordinary (deterministic) differential equations model, is necessary to account for correlation between model residuals and possible system noise. The development with time of median-slope, and how this is influenced by CPR, is in the current minimal model represented by a single differential equation. Candidate models were compared by their Akaike information criterion. Results: In the best identified model the presence of chest compressions had a significant positive effect on the state of the patients as measured by the median-slope. However, none of the CPR characteristics compression force, depth, rate, duty cycle or leaning, or ventilation rate were significant in this model. Conclusion: Mixed effects stochastic differential equation models seems to be a reasonable choice of model type for the current modelling problem. However, much work remain, both to test and validate the current minimal model, to develop more elaborate models and to develop models including more measurements (e.g end-tidal CO2).

33
O30 A Reliable AED Diagnosis During Uninterrupted CPR: Past, Present and Challenges for the Future Unai Irusta University of the Basque Country, Spain Chest compression artefacts during cardiopulmonary resuscitation (CPR) deteriorate the rhythm diagnosis of automated external defibrillators (AED). CPR must therefore be interrupted for a reliable shock/no-shock decision. However, these hands-off intervals adversely affect the defibrillation success, in addition pauses in chest compressions compromise circulation. An accurate diagnosis of the rhythm while performing CPR is therefore needed to minimize these hands-off intervals. The characteristics of the CPR artefact are very variable and the artefact presents an important spectral overlap with human cardiac arrest rhythms. Consequently, elaborate adaptive signal processing techniques are needed to filter the CPR artefact and reconstruct the underlying artefact-free ECG. Following an additive noise model, several methods were initially tested by artificially mixing human ventricular fibrillation (VF) samples and CPR artefacts recorded from pigs in asystole. The performance of the filters was evaluated for different levels of corruption, i.e. signal-to-noise ratio (SNR). These studies showed satisfactory results after the filters were applied, both in terms of the improved SNR and the sensitivity of the AED, which exceeded the 90% performance goal set by the American Heart Association (AHA). A posterior study reported similar results using a mixture of human VF and human CPR artefacts extracted from real out-of-hospital interventions. The first filtering method tested on shockable and non-shockable cardiac arrest rhythms from of out-of-hospital interventions was published in 2004. The artefact was estimated using up to four additional reference channels, acquired using a modified version of a commercial AED. The sensitivity after filtering (96.7%) exceeded AHA goals; the method however failed to accurately identify non-shockable rhythms as the specificity (79.9%) fell below the 95% AHA performance goal. Later, efforts focused on simplifying the filtering methods by either analyzing the ECG alone or using only one reference channel (two-channel methods). The ECG alone is not sufficient to estimate the artefact, however comparable results were reported for multi-channel and two-channel methods on out-of-hospital rhythms. The possibility of identifying the rhythm by directly analyzing the corrupted ECG has also been proposed, although the reported specificity is also unsatisfactory. Currently, a reliable rhythm analysis during CPR is not possible because the specificity is too low. Two-channel filtering methods combined with rhythm identification applied to the filtered ECG should be further investigated to improve the detection of non-shockable rhythms.

34
O31 Experimental Study on the Effects of Physical Training on the Defibrillation Threshold José Millet1, Eduardo Roses1, Germán Parra3, Manuel Zarzoso3, Luis Such-Miquel4, Luis Such3, Xavier Ibáñez-Català1, Antonio Guill1, Álvaro Tormos1, Francisco Javier Chorro2 1 Bio-ITACA, Universitat Politècnica de València, València, Spain 2 Departament de Medicina, Universitat de València, València, Spain 3 Departament de Fisiologia, Universitat de València, València, Spain 4 Departament de Fisioterapia, Universitat de València, València, Spain Background: Many authors have suggested that physical training could protect against cardiac sudden death, produced in most cases by ventricular fibrillation (VF), and it has been proposed as an antiarrhythmic intervention. The occurrence of VF and maintenance are related to the complexity of this arrhythmia and with the electrophysiological heterogeneity of the myocardium. Moreover, it has also been reported that physical training decreases this heterogeneity. We hypothesized that physical exercise reduces the necessary energy to revert VF and decrease immediately recurrence of this arrhythmia. Methods: Six NZW rabbits were submitted to a six-week endurance exercise training program, and six controls were not trained. Following the exercise program was finished, rabbits were anaesthetized, killed and the hearts excised, isolated and perfused in a Langendorff-system. A pacing electrode and a plaque with 256 recording electrodes were positioned on the left ventricle. Without interrupting the perfusion of the isolated heart, VF was induced at increasing frequencies and recordings were performed. We used a custom defibrillator able to provide a biphasic waveform of reduced energy (0.05 to 1 joule, stepwise=0.01 joule). Immediately after VF triggering, the attempts to defibrillate were applied using increasing levels of energy until achieving VF defibrillation successfully. In the case of recurring VF, the down-up procedure was induced from the last successful energy. This procedure was repeated until the sinus rhythm was completely reverted. We have determined: a) the total recurrence of VF after its cessation; b) the minimum energy to defibrillate successfully VF; c) In the case of recurrence, maximum DT to establish sinus rhythm. To compare the recurrence of VF between control and trained group a “chi-square” test was applied. To compare the energy to defibrillate between the two groups an unpaired Student t test was used. Results: VF recurred in three hearts from control group (50%) whereas no heart recurrence was observed in the trained group (p<0.05). Mean energy to defibrillate in the control group was higher than in the trained group (0,16±0,06 J vs. 0,11±0,02 J). Conclusion: These preliminary results appear to be in accordance with the findings previously reported on the increase in ventricular electrical homogeneity and stability of ventricular myocardium by training. Indeed, as the mentioned properties are maintained, VF complexity will be reduced and it will also be easier to interrupt the arrhythmia. In conclusion, physical training decreases VF fibrillation recurrence and the energy needed to revert this arrhythmia.

35
JUNE 4, 2010 May 14 11.00-12.30 Young Investigator Award O32 Left Ventricular Transmural Gradient of Na+ Channel Expression and its Electrophysiological Correlates Ewa Soltysinska The Danish National Research Foundation Centre for Cardiac Arrhythmia, Department of Biomedical Sciences, The Panum Institute, University of Copenhagen, Copenhagen N, Denmark Background: Na+ channels play important role in cardiac electrophysiology by contributing to ventricular excitability, conduction changes, and arrhythmic susceptibility. The purpose of the present study was (i) to assess distribution of Na+ channel expression across the left ventricular (LV) wall, and (ii) to determine its contribution to electrophysiological heterogeneities in ventricular myocardium. Material and methods: Na+ channel mRNA (SCN5A) and protein (Nav1.5) expression has been assessed by Real-Time PCR and Western-blotting in specimens of LV epicardial and endocardial tissue dissected from the non-diseased human (n=2) and guinea pig (n=8) hearts. For electrophysiological studies, monophasic action potentials at distinct ventricular epicardial sites and volume-conducted ECG were recorded in isolated, perfused guinea-pig heart preparations. The LV was paced at epicardial and endocardial stimulation sites to assess diastolic excitability and inducibility of tachyarrhythmias, and to reconstruct the restitution of effective refractory period (ERP) over wide range of beating rates. Results: Both in human and guinea pig hearts, SCN5A mRNA and Nav1.5 protein expression exhibited heterogeneous distribution in the LV chamber, being significantly greater at endocardial than epicardial layers. Consistent with non-uniform distribution of Na+ channels, the LV endocardial stimulation site showed lower pacing threshold and greater inducibility of ventricular fibrillation by tachypacing than LV epicardial stimulation site. The analysis of ERP restitution revealed greater maximum restitution slope and faster restitution kinetics at LV endocardium than LV epicardium. Flecainide, a Na+ channel blocker, prolonged ERP over wide range of pacing intervals, flattened the ERP restitution slope, and slowed the restitution kinetics both at LV epicardial and LV endocardial stimulation sites. The epicardial-to-endocardial difference in ERP restitution has been eliminated in flecainide-treated heart preparations. Conclusion:Non-uniform distribution of Na+ channel expression across the LV wall may account for higher diastolic excitability, greater inducibility of tachyarrhythmias, and increased steepness of electrical restitution at LV endocardium as compared to LV epicardium.

36
O33 Quantitative Determination of Wave Direction and Conduction Velocity in the Human Atrium from Intracardiac Electrograms Frank Michael Weber1, Christopher Schilling1, Armin Luik2, Martin Wolfgang Krueger1, Gunnar Seemann1, Cristian Lorenz3, Claus Schmitt2, Olaf Dössel1 1 Institute of Biomedical Engineering, Karlsruhe Institute of Technology (KIT), Karlsruhe, Germany 2 IV. Medizinische Klinik, Städtisches Klinikum Karlsruhe, Karlsruhe, Germany 3 Philips Research, Hamburg, Germany Background: Catheter ablation of complex atrial arrythmias, such as atrial fibrillation and atypical atrial flutter, is still challenging. Clinically evaluated ablation methods are leading to moderate success rates. Assessments of intracardiac electrograms are often done subjectively by the physician. Automatic algorithms can therefore improve the analysis of complex atrial electrograms (EGMs). In this work, we demonstrate a quantitative analysis of intracardiac EGMs from circular mapping catheters in humans. Both the wave direction and the local conduction velocity (CV) were calculated from individual wave fronts passing the catheter. Methods: Intracardiac EGMs measured with circular mapping catheters in humans were retrospectively analyzed. Five data sets from three patients undergoing catheter ablation of atrial fibrillation or flutter were available. Using a non-linear energy operator, activation times from nine bipolar catheter signals were calculated for each atrial activity. The resulting activation pattern was fitted to a cosine-shaped data model that has been validated in a previous simulation study. The cosine phase represented the wave direction. From the cosine amplitude and the catheter radius, the conduction velocity was calculated. Results: The wave directions in all five measurements were stable with a standard deviation below 10 degrees. Calculated CVs were in the range of 70 to 110 cm/s, which is in accordance with published values. In one patient, electrograms were recorded during atrial stimulation. Stimulation cycle length was decreased from 500 to 300 ms. CV decreased by approximately 10% at a cycle length of 300 ms compared to the CV at 500 ms. Conclusions: The results show the ability to reliably extract wave direction and conduction velocity from intracardiac EGMs recorded with circular mapping catheters. Detected directions were stable, and the CV values were in a physiological range. As individual beats are analyzed, the method will also enable the quantitative study of singular events such as ectopic beats and facilitate the localization of tachycardia origins. Further, it will help to measure substrate parameters such as the CV and even CV restitution behavior. This way, the method can help to identify patient-specific physiological parameters that can be integrated into patient-specific models. Furthermore, it can directly provide quantitative data of high diagnostic value to the examiner and thereby improve clinical success rates.

37
O34 Age and Origin of the Y111C/KCNQ1 Founder Mutation–A Major Cause of the Long QT Syndrome in Sweden Annika Winbo1, Ulla-Britt Diamant2, Annika Rydberg1, Steen M Jensen2, Eva-Lena Stattin3 1 Department of Clinical Sciences, Pediatrics, Umeå University, Sweden 2 Department of Public Health and Clinical Medicine, Heart Centre, Umeå University, Sweden 3 Department of Medical Biosciences, Medical and Clinical Genetics, Umeå University, Sweden Background: The Y111C/KCNQ1-mutation has been identified as a major cause of the Long QT Syndrome in Sweden. The Swedish Y111C mutation-carriers exhibit a mild clinical phenotype with a low incidence of life-threatening cardiac events. This is found in spite of a markedly prolonged mean QTc on the 12-lead electrocardiogram and in contradiction of the dominant-negative electrophysiological properties of the Y111C mutation demonstrated in vitro. The aim of this study was to investigate the origin, age and possible founder-nature of the Y111C/KCNQ1 mutation. Materials and methods: In all identified Swedish Y111C families, ancestors’ geographical origin, migration and possible interrelation were investigated using parish registers and genealogical databases. In 26 index families haplotype analysis was performed using 15 satellite markers, 6 upstream and 9 downstream of the KCNQ1 gene (distance ~8 cM). To identify the mutation-associated allele, two mutation-carriers in separate generations in each family were analysed. Forty-eight chromosomes from healthy Swedish controls were included to calculate allele frequency. The ESTIAGE computer software was used for estimating the age of the mutation. Results: We have identified 166 Y111C mutation-carriers in 36 index families. Their ancestors were traced back to a northern inland region, from where the population spread, migrating along the Ångerman river valley during the 17th-19th century. Twenty-six index cases are genealogical descendants of a founder couple born in 1605/1614. From their two sons the Y111C pedigree separates into two major branches. The 26 haplotyped Y111C families share 3-15 (median 13) uncommon allele-variants surrounding the Y111C locus, with allele-frequencies ranging between 0.02-0.69 (median 0.17) in the general population. Familial haplotypes co-segregate within the subdivisions of the pedigree, supporting the genealogical data. The estimated age of the mutation is 31 generations (95% CI 23; 41). Assuming that one generation is 25 years, the mutation is 775 years old (95% CI 575; 1,025), thus pre-dating the colonization of northern Sweden. Conclusion: The Swedish Y111C/KCNQ1 founder mutation is approximately 800 years old and was probably introduced in the inland of northern Sweden by early settlers. The subsequent population development within the relatively isolated river valleys caused strong founder effects that in combination with the mutations’ mild phenotype most likely enabled the enrichment of this LQT1 mutation in the Swedish population. This Y111C founder population constitutes an invaluable asset for future genetic and clinical studies.

38
O35 Spatially Discordant Alternans in Action Potential Voltage Underlie T-wave Alternans in Human Heart Failure Jason Bayer1, Sanjiv Narayan2, Gautam Lalani2, Natalia Trayanova1 1 Johns Hopkins University, Baltimore, USA 2 University of California, San Diego, USA Background: Alternans in action potential voltage (APV) is a novel index to predict ventricular arrhythmias, and may explain ECG T-wave alternans at relatively slow heart rates when action potential duration restitution is flat. However, the distribution of APV alternans in the human ventricles and its arrhythmic role is unknown. We hypothesized that spatially discordant APV alternans underlie T-wave alternans and explain increased arrhythmia vulnerability in human heart failure. Materials and Methods: The hypothesis was tested in an image-based biophysically-detailed model of the human ventricles constructed from diffusion tensor and magnetic resonance imaging data. The mathematical description of ventricle tissue was based on the monodomain representation and included realistic human membrane kinetics. Observed electrophysiological heterogeneities, as well as remodeling in failing myocardium, were incorporated throughout the model based on published western-blot and patch clamp data. The left ventricle apex of the model was then paced at the cycle length of 550ms (109 beats/min) for 64 beats. Alternans in APV and the T-wave were detected using spectral analysis and were validated with monophasic action potential and ECG recordings from patients with systolic heart failure during programmed ventricular stimulation. Spatial distribution of APV throughout the human ventricles was analyzed using a finite element approach to determine the direction and magnitude of APV gradients. Results: APV alternans that underlie T-wave alternans are greatest in the base of the left ventricle with larger magnitude in action potential phase II than in phase III (Valt=242 µV and Valt=156 µV respectively). The difference in APV between beats in the left ventricle base and apex has opposite sign that switches after every beat. The magnitude of the gradient in APV is maximal in the left ventricle (0.1 mV/mm), and increases to 5 mV/mm in the presence of discordant APV alternans. Conclusions: The results support the hypothesis that T-wave alternans in failing ventricles represents spatially discordant APV alternans. Moreover, resulting apicobasal gradients in APV directly led to unidirectional conduction block and reentrant arrhythmias. Future studies should determine whether T-wave alternans magnitude correlates with the magnitude of APV gradients, and whether discordant APV alternans underlies spontaneous life-threatening ventricular arrhythmias.

39
O36 When Deriving the Spatial QRS-T Angle from the 12-lead ECG, which Transform is More Frank: Regression or Inverse Dower? Daniel Cortez1,2,3, Todd Schlegel3 1 University of Illinois College of Medicine, Rockford, USA 2 National Space Biomedical Research Institute, Houston, USA 3 National Aeronautics and Space Administration's Johnson Space Center, Houston, USA Background: Of the various 12-to-Frank-lead transformation methods, arguably the two most commonly utilized are the inverse Dower method and the regression-related method of Kors et al. While the latter method has tended to demonstrate better performance based on, for example, the production of relatively smaller mean quadratic deviations from true Frank XYZ-lead results, it remains unclear from the literature which of these methods actually best reconstructs those secondarily derived parameters, such as the spatial QRS-T angle, that have sufficient importance to effectively drive a clinical need for 12-to-Frank-lead transformations in the first place. In this study, our specific primary objective was to ascertain which of these two commonly utilized 12-to-Frank-lead transformations yields spatial QRS-T angle values closest to those obtained from simultaneously collected true Frank XYZ-lead recordings. Materials and methods: Simultaneous 12-lead and Frank XYZ-lead recordings for 100 post-myocardial infarction patients and for 50 controls were obtained from the publicly available Physikalisch-Technische Bundesanstalt (PTB) Diagnostic ECG Database (available at: http://www.physionet.org/physiobank/database/ptbdb/ ) and analyzed using custom software programs developed at NASA. Relative agreement, with true Frank XYZ-lead results, of 12-to-Frank-lead transformed results for the spatial QRS-T angle using inverse Dower versus Kors’ regression was assessed via ANOVA, Lin’s concordance and Bland-Altman plots. Results: Spatial QRS-T angles from the true Frank XYZ-leads were not significantly different than those derived from the Kors’ regression-related transformation but were significantly smaller than those derived from the inverse Dower-related transformation (P<0.001). Independent of method, so-called spatial “mean” QRS-T angles were also always significantly larger than so-called spatial “maximum” (“peaks”) QRS-T angles. Conclusion: When utilizing the 12-lead ECG to derive the spatial QRS-T angle, regression-related transforms such as that of Kors et al better approximate actual Frank XYZ-related results than do inverse Dower-related transforms. Spatial mean and spatial “peaks” QRS-T angles are not statistically equivalent and should not be used interchangeably.

40
O37 Reduction in Cardiac Kir3.4 Channel Expression Causes Congenital long QT Syndrome - A Functional Role of GIRK Currents in Ventricular Repolarization Bo Liang1, Yanzong Yang2, Yiqing Yang3,4, Morten Grunnet1,5, Søren-Peter Olesen1,5, Yi-Han Chen3,4, Thomas Jespersen1 1 Danish National Research Foundation Centre for Cardiac Arrhythmia (DARC), Department of Biomedical Sciences, Faculty of Health Sciences, University of Copenhagen, Denmark
2 Department of Cardiology, First Affiliated Hospital of Dalian Medical University, Dalian, China 3 Department of Cardiology, Tongji Hospital, Tongji University School of Medicine, Shanghai, China 4 Key Laboratory of Arrhythmias of Ministry of Education, Institute of Medical Genetics, Tongji University School of Medicine, Shanghai, China
5 NeuroSearch A/S, Denmark Background: Ventricular repolarization is promoted by the delayed rectifier potassium currents. Mutations in the genes underlying these currents, primarily being IKr, IKs, and IK1, have previously been found to cause congenital long-QT syndrome (LQTS). Kir3.1/3.4 channels previously been ascribed a prominent role in atrial and nodal parasympathetic regulation, where acetylcholine mediated muscarinic stimulation leads to an activation of this channel complex, thereby generating G protein-coupled inward-rectifier potassium channel current (IK,ACh). However, a functional role of these channels in ventricle has not previously been demonstrated in humans. Recent evidence indicates that in conventional whole cell recordings, IK,Ach in ventricular myocytes contributes significantly, but is masked by constitutively active IK1. Thus, IK,ACh might be of greater physiological and pathophysiological relevance than previously thought in ventricular myocytes.The purpose of this study was a functional assessment of a mutation in Kir3.4 identified in a large LQTS family. Methods: A large Chinese family (4 generations, 49 individuals) with an autosomal dominant trait of LQTS was clinically evaluated. Genome-wide linkage analysis was performed using polymorphic microsatellite markers to map the locus, and the positional candidate genes were screened by sequencing for mutations. The expression pattern and functional characteristics of the mutated protein was investigated by Western blotting and patch-clamping. Results: The genetic locus of the LQTS-associated gene was mapped to chromosome 11q23.3-24.3, where a heterozygous mutation in the gene KCNJ5, coding for the G protein-coupled inward rectifier potassium channel subunit Kir3.4, was identified (Kir3.4-G387R). This specific mutation was present in all 10 affected family members, but absent in 528 ethnically matched controls and in the healthy family members. A cross-species alignment of Kir3.4 protein sequences displayed that the altered amino acid is highly conserved evolutionarily. Heterologous expression studies revealed a loss-of-function phenotype of Kir3.4-G387R caused by reduced surface membrane expression. Western blotting of human cardiac tissue demonstrated significant expression of Kir3.4 in ventricle. Conclusion: We provide evidence for Kir3.4 being associated with LQTS, and thereby reveal a physiological function of Kir3 channels in human ventricles.

41
Inherited Arrhythmic Disorders/Channelopathies O38 A1379 Spectrum of Heart Rhythm Disturbances in LMNA and SCN5A Mutation Carriers in Russian DCM Patients Elena Zaklyazminskaya1, Yulia Frolova1, Dmitry Podolyak1, Alexandre Polyakov2, Sergei Dzemeshkevich1 1 Petrovsky Russian Research Centre of Surgery, Russia 2 Russian Research Centre for Medical Genetics, Russia Background: The aim of this study was to estimate the prevalence of genetic alterations in LMNA, EMD, and SCN5A genes in iDCM patients and to define the indication to offer this testing. Material and Methods: We did perform clinical examination (anamnesis, ECG, 24-h Holter Monitoring, EchoCG, neurological examination) and molecular genetic investigations (LMNA, EMD, and SCN5A coding areas sequencing) of DNA samples from 72 unrelated Russian iDCM probands . Probands were subdivided into two clinical groups: 46 “pure” DCM patients including 10 proband younger 3 years old (group I) and 26 DCM patients with atrial or ventricular arrhythmias and/or conduction block (group II). Genomic DNA sample was isolated from EDTA venous blood by standard methods. For mutation screening, original intronic primers were developed that encompassed the complete coding sequence, the splice sites, and the adjacent areas. Results: We identified 6 LMNA gene mutations in 6 unrelated families (DCM, 1A; 18 patients) and 1 SCN5A mutation in 1 family (DCM 1E; 2 patients). No mutation in EMD gene was found. In group I we did find single mutation in LMNA gene in 2 y.o. male proband. Diagnostic efficiency of LMNA, EMD, and SCN5A gene analysis was 2.2%. In group II we did find 5 LMNA mutations in 5 probands (20%) and 1 SCN5A mutation in 1 proband (4%). The cardiac features were similar in patients with mutations in DCM 1A and DCM 1E genes. Most of the patients (93%) had various rhythm and conduction defects except one 2-years-old patient. The prevalence and intensity of arrhythmias were age-dependent and had increased with age. The various degrees of conduction defects were observed in 87%, atrial fibrillation in 59%, PM or ICD were implanted in 57%; ventricular arrhythmias in 34%. All ascertained arrhythmias were stably resistant for drug treatment, and about 28% patients died suddenly despite medication. Patients with mutations in these genes are resistant for anti-arrhythmic drugs and could be rate as candidate for interventional treatment. Only LMNA mutations carriers had clinical manifestation of muscular weakness (56%) and flexor contractures (12%). Conclusion: We suppose that genetic screening of LMNA and SCN5A genes with following medical genetic counseling could be reasonable for Russian patients with combination of iDCM, conduction system diseases with or without muscular involvement . Analysis of the LMNA, EMD, and SCN5A genes as routine diagnostic procedure for “pure” DCM patients seems to be controversial.

42
ECG in Ischemia O39 Discrimination of Coronary Artery Disease Patients by Means of Heart Rate Variability Analysis During Exercise Stress Testing Raquel Bailon1,2, Cesar Grao1, Pablo Laguna1,2 1 Communications Technology Group (GTC) at the Aragon Institute of Engineering Research (I3A), University of Zaragoza, Spain
2 CIBER de Bioingenieria, Biomateriales y Nanomedicina (CIBER-BBN), University of Zaragoza, Spain Background: The purpose of this study is to identify patients with coronary artery disease (CAD) by means of the instantaneous power and frequency of heart rate variability (HRV) components during stress testing. Materials and Methods: A database of treadmill stress testing was analyzed including the recordings of 78 patients with CAD (positive coronary angiography), 48 patients with low risk of a cardiac event (Framingham index<5%) and 66 asymptomatic volunteers. First, an integral pulse frequency modulation model with time-varying threshold was used to estimate the HRV signal. Second, the instantaneous power and frequency of the low frequency (LF) and high frequency (HF) HRV components were derived using a parametric decomposition of the Smoothed Pseudo Wigner Ville distribution which makes use of respiratory information, which was indirectly derived from the ECG. Third, a Wilcoxon rank sum test was used to compare every pair of study groups regarding indices derived from the power and frequency of the LF and HF components at different time instants: the first minute of the exercise (nr), three minutes before peak stress (n1), one minute before peak stress (n2), one minute after peak stress (n3), and three minutes after peak stress (n4). Fourth, a linear discriminant analysis (LDA) was applied to classify subjects in every pair of study groups. Results: The null hypothesis of equal medians between the CAD and low risk groups is rejected (p-value<0.01) for indices derived from the HF power at n1, n3 and n4, the LF power at n1, n2 and n3, and the HF frequency at n1 and n2. A LDA classified patients in the CAD and low risk groups with a sensitivity (SE) of 75% and a specificity (SP) of 63% with only one variable and with SE of 81% and SP of 79% with four variables. Conclusion: Indices derived from HRV analysis during exercise stress testing may improve the diagnosis of CAD.

43
O40 High Resolution ECG for Evaluation of Heart Function During Exposure to Subacute Hypobaric Hypoxia Petra Zupet1,2, Zarko Finderle1, Todd T. Schlegel3, Tanja Princi4, Vito Starc1 1 Institute of Physiology, Faculty of Medicine, University of Ljubljana, Ljubljana, Slovenia 2 Sports Medicine Unit, University Medical Center Ljubljana, Ljubljana, Slovenia 3 NASA Johnson Space Center, Houston, TX, USA 4 Department of Life Sciences, University of Trieste, Italy Background: High altitude climbing presents a wide spectrum of health risks, including exposure to hypobaric hypoxia. Risks are also typically exacerbated by the difficulty in appropriately monitoring for early signs of organ dysfunction in remote areas. We investigated whether high resolution advanced ECG analysis might be helpful as a non-invasive and easy-to-use tool (e.g., instead of Doppler echocardiography) for evaluating early signs of heart overload in hypobaric hypoxia. Methods: Nine non-acclimatized healthy trained alpine rescuers (age 43.7 ± 7.3 years) climbed in four days to the altitude of 4,200 m on Mount Ararat. Five-minute high-resolution 12-lead electrocardiograms (ECGs) were recorded (Cardiosoft) in each subject at rest in the supine position on different days but at the same time of day at four different altitudes: 400 m (reference altitude), 1,700 m, 3,200 m and 4,200 m. Changes in conventional and advanced resting ECG parameters, including in beat-to-beat QT and RR variability, waveform complexity, signal-averaged, high-frequency and spatial/spatiotemporal ECG was estimated by calculation of the regression coefficients in independent linear regression models. A p-value of less than 0.05 was adopted as statistically significant. Results: As expected, the RR interval and its variability both decreased with increasing altitude, with trends k = -96 ms/1000 m with p = 0.000 and k = -9 ms/1000 m with p = 0.001, respectively. Significant changes were found in P-wave amplitude, which nearly doubled from the lowest to the highest altitude (k = 41.6 microvolt/1000 m with p = 0.000), and nearly significant changes in P-wave duration (k = 2.9 ms/1000 m with p = 0.059). Changes were less significant or non-significant in other studied parameters including those of waveform complexity, signal-averaged, high-frequency and spatial/spatiotemporal ECG. Conclusions: High resolution ECG analysis, particularly of the P wave, shows promise as a tool for monitoring early changes in heart function due to exposure to high altitude.

44
O41 The Prognostic Capacity of Clinically Indicated Exercise Test is Enhanced by Combined Analysis of Exercise Capacity, Heart Rate Recovery and T-wave Alternans Mikko Minkkinen1, Tuomo Nieminen2,3, Richard L. Verrier2, Johanna Leino1, Terho Lehtimäki4, Jari Viik5, Rami Lehtinen1,6, Kjell Nikus7, Tiit Kööbi1, Mika Kähönen1 1 Department of Clinical Physiology, Tampere University Hospital; and Medical School, University of Tampere, Finland 2 Beth Israel Deaconess Medical Center, Harvard Medical School, Boston, MA, USA 3 Department of Pharmacological Sciences, Medical School, University of Tampere, Finland, and Department of Internal Medicine, Päijät-Häme Central Hospital, Lahti, Finland
4 Laboratory of Atherosclerosis Genetics, Department of Clinical Chemistry, Tampere University Hospital, Finland; and Medical School, University of Tampere, Finland
5 Department of Biomedical Engineering, Tampere University of Technology, Finland 6 Tampere Polytechnic – University of Applied Sciences, Finland 7 Heart Centre, Department of Cardiology, Tampere University Hospital, Finland Background: We tested the hypothesis that the prognostic capacity of clinically indicated exercise test is enhanced by combined analysis of exercise capacity, heart rate recovery (HRR) and T-wave alternans (TWA). Material and methods: A total of 3,611 consecutive patients (2,157 men) with a routine clinically indicated bicycle exercise test were included in the study from the Finnish Cardiovascular Study cohort. Patients with atrial fibrillation or flutter as well as patients with implantable cardiac devices were excluded. Exercise capacity was measured in metabolic equivalents (METs), HRR as decrease in heart rate from maximum to one minute post-exercise, and TWA by time-domain Modified Moving Average method. All the TWA values over 46 microvolts were over-read by a physician. Cox regression analysis was performed with adjustment for sex, age, smoking, beta-blocker therapy and other common coronary risk factors. Results: During the median follow-up period of 56 months (interquartile range 35-78 months) there were 233 deaths. Of those 96 were further categorized as cardiovascular deaths (primary endpoint). All three parameters were independent predictors of death. The relative risk (RR) for cardiovascular death of low exercise capacity (MET <8) was 2.5 (95% CI: 1.4-4.7, P=0.003), for reduced HRR (<19 beats per minute) was 2.1 (95% CI: 1.3-3.3, P=0.002), and for elevated TWA (at least 60 microvolts) was 3.5 (95% CI: 1.5-8.0, P=0.003). The combination of the three parameters yielded RR for cardiovascular mortality of 11.1 (2.9-42.6, P<0.001) (Figure) and for all-cause mortality of 5.0 (1.5-17.2, p=0.01) over patients with none of the factors. Conclusion: Exercise capacity, HRR, an index of parasympathetic activity, and TWA, a marker of cardiac electrical instability, both singly and in combination are strong predictors for cardiovascular mortality in patients referred for exercise testing.

45
Abstract number is: A1139
F igure. Adjusted survival curves by Cox regression among patients according to exercise
capacity in metabolic equivalents (MET <8), heart rate recovery (HRR !19 beats per minute)
and exercise-based T-wave alternans (TWA at least 60 microvolts) for cardiovascular
mortality. Numbers 0, 1, 2 and 3 in the figure indicates the number of the positive parameters.
Note that the scale for the y-axis is from 0.875 to 1.00.
0 1
2
3

46
O42 ST-Segment Depression/Heart Rate Hysteresis Improves Detection of Coronary Artery Disease in Women Kati Svart1, Rami Lehtinen3, Tuomo Nieminen4, Kjell Nikus5, Terho Lehtimäki6, Tiit Kööbi2, Kari Niemelä5, Väinö Turjanmaa2, Mika Kähönen2, Jari Viik1 1 Department of Biomedical Engineering, Tampere University of Technology, Finland 2 Department of Clinical Physiology, Tampere University Hospital and Medical School, University of Tampere, Finland
3 Tampere Polytechnic —University of Applied Sciences, Finland 4 Department of Pharmacological Sciences, Medical School, University of Tampere and Department of Internal Medicine, Päijät-Häme Central Hospital, Lahti, Finland
5 Heart Centre, Department of Cardiology, Tampere University Hospital, Finland 6 Laboratory of Atherosclerosis Genetics, Department of Clinical Chemistry, Tampere University Hospital, Finland; and Medical School, University of Tampere, Finland
Background: The performance of exercise electrocardiography (ECG) for the detection of coronary artery disease (CAD) in women has been limited. ST-segment depression/heart rate (ST/HR) hysteresis has been proved to detect CAD in men more accurately than traditional methods, but the diagnostic performance of ST/HR hysteresis in women is unclear. Materials and methods: The study population comprised 161 female patients from the Finnish Cardiovascular Study (FINCAVAS). All patients were referred for a routine bicycle exercise test. The maximum values of ST/HR hysteresis, ST/HR index, ST-segment depression at peak exercise (STpeak), were determined. Significant CAD was present in 48, while 65 women showed no angiographic CAD. Also a group of 48 women with low likelihood of CAD (LLC) was formed. Diagnostic performance of variables was assessed by receiver operating characteristic (ROC) analysis. Furthermore, sensitivity values at 80% specificity and specificities at 80% sensitivity were determined. Results: In a comparison between CAD and LLC groups, the ROC areas for ST/HR hysteresis, ST/HR index and STpeak were 0.89, 0.74 and 0.65, and sensitivities at 80% specificity were 88%, 67% and 52%, respectively. Comparing CAD and no-CAD groups, the ROC areas were 0.73, 0.67 and 0.56, and specificities at 80% sensitivity were 60%, 38% and 27%. Conclusions: ST/HR hysteresis is a more competent method in the detection of CAD in women than ST-segment depression or ST/HR index.

47
O43 Spinal Cord Stimulation Effects on Myocardial Ischemia, Infarct Size, Ventricular Arrhythmia and Non-invasive Electrophysiology in a Porcine Ischemia-reperfusion Model Jacob Odenstedt1, Bengt Linderoth3, Lennart Bergfeldt1, Olof Ekre2, Lars Grip1, Clas Mannheimer2, Paulin Andréll2 1 Dept of Cardiology, Sahlgrenska University Hospital, Gothenburg, Sweden 2 Multidisciplinary Pain Center, Sahlgrenska University Hospital/Östra, Gothenburg, Sweden 3 Neurosurgery, Karolinska Institute, Karolinska University Hospital, Stockholm, Sweden Background: Susceptibility to ventricular arrhythmias and sudden cardiac death can be reduced via modulation of autonomic tone. Spinal cord stimulation (SCS) presumably affects both the autonomic tone and reduces myocardial ischemia. The aim was to investigate whether SCS could reduce myocardial ischemia, infarct size and the occurrence of ventricular arrhythmias as well as repolarisation alterations in a porcine ischemia-reperfusion model. Methods: Anaesthetised common land-race pigs were randomised to SCS (n=10) or sham treatment (n=10) before, during and after 45 minutes of coronary occlusion. Area at risk (AAR), infarct size (IS) and the amount of spontaneous ventricular arrhythmias were analysed. Continuous 3-D vectorcardiography (VCG) was recorded and analysed with respect to ECG intervals, the ST-segment, and the T vector and T vector loop morphology. Results: In the SCS group, ventricular arrhythmias occurred less frequently (p=0.039) and the increase in ST-vector magnitude was less pronounced (p=0.024). However, SCS showed no effect on AAR, IS or IS/AAR. Tamplitude and Tarea increased in response to ischemia suggesting increased repolarisation gradients, but SCS reduced these changes (p<0.01 for both). No other parameters differed between the groups. Conclusions: SCS reduced the accumulated incidence of spontaneous ventricular arrhythmias during ischemia-reperfusion in association with a reduction of repolarisation alterations. Furthermore, VCG signs of myocardial ischemia were reduced by SCS, but this phenomenon was not accompanied by any effect on infarct size.

48
O44 The Cost-Effectiveness of Stress Testing using High-Frequency QRS Analysis Yizhar Toren1, Linda R. Davrath1, Shimon Abboud2, Guy Amit1 1 Biological Signal Processing Ltd, Tel-Aviv, Israel 2 Tel-Aviv University, Tel-Aviv, Israel Background: Exercise ECG testing (EET), the first-line diagnostic for ischemic heart disease (IHD), is limited in accuracy, often leading to superfluous imaging and angiography procedures. The HyperQ™ stress test, based on computerized analysis of high-frequency QRS components of the ECG, provides an accurate index of myocardial ischemia, significantly improving the performance of EET. We analyzed the potential economic and healthcare benefits of the improved diagnostic accuracy in the short- and long-term. Methods: A decision tree model (Fig 1) was used to describe the diagnostic workup for IHD: All patients undergo either EET or HyperQ. Patients in whom IHD is not ruled out are referred to cardiac imaging (e.g. SPECT), followed by invasive coronary angiography for positive cases. Confirmed IHD patients receive treatment, whereas those misdiagnosed as healthy remain untreated. Based on the proportions of treated and untreated patients, a prognostic Markov model (Fig 2) was used to estimate cost of treatment during a given period. The model stratifies the population into six outcome groups, by the occurrence of acute coronary events, heart failure, or death. Using parameters estimated from published data, the model was used to calculate short- and long-term benefits of incorporating the HyperQ stress test into the standard of care. Results: Sensitivity and specificity were 71% and 86%, respectively, for the HyperQ stress test, and 67% and 72% for EET, as previously reported. With a disease prevalence of 10%, the improved specificity of HyperQ results in a reduction of 13% in unnecessary imaging and 4% in angiographies. With an estimated 6 million yearly EET tests in the US, the potential immediate annual savings amount to $1.2B. The long-term prognostic model, simulated over 20 years, demonstrated that the improved sensitivity of HyperQ entails a 4% reduction in the incidence of acute coronary events, 5% reduction in heart failure and 5% fewer deaths among IHD patients. These valuable effects are accompanied by a slight reduction in the overall long-term medical costs and an increase in the quality-adjusted life years. Conclusions: The HyperQ™ stress test is a promising new tool for diagnosing IHD. Its improved performance compared to EET can reduce the number of unnecessary cardiac imaging tests, thus lowering both medical costs and the population’s exposure to hazardous procedures while providing favorable prognostic consequences.

49
Holter Monitoring and Implantable Loop Recorders O45 When the Heart Stops a While: Reflex Asystole During the Head-up Tilt Test Artur Fedorowski, Philippe Burri, Steen Juul-Möller3, Olle Melander 1 Lund University, Department of Clinical Sciences, Malmö, Sweden 2 Skåne University Hospital, Center for Emergency Medicine, Malmö, Sweden 3 Skåne University Hospital, Department of Cardiology, Malmö, Sweden Background: Head-up tilt test (HUT) is a useful but still underused tool in identifying syncopal patients with underlying reflex asystole, who may potentially benefit from pacing. Materials and methods: We analyzed data from a case series consisting of 144 patients (66 men, mean age 64.2±18.7 yrs, range 20-93 yrs) who presented with an unexplained syncope to the Emergency Department (ED) of Skåne University Hospital, Malmö. Patients were diagnosed at the newly started Syncope Unit using HUT protocol recommended by European Society of Cardiology. The protocol included carotid sinus massage and nitroglycerine challenge if needed. Syncope was classified as related to vasovagal (VV) reflex, carotid sinus hypersensitivity (CSH) or orthostatic hypotension, if the test was positive. Reflex asystole was defined as R-R pause ≥ 3 s due to sinus arrest or AV block. Correlates of asystolic type of provoked syncopal attacks were analyzed using multivariable logistic regression. Results: HUT was diagnostic in 129 cases (82.6%). Of these, 67 were classed as VV syncope and 33 as CSH. In general, patients with VV syncope were younger than those with CSH (mean age, 56.0±18.5 vs. 76.0±9.7 yrs).There was an overlap between groups as in eight patients both mechanisms, VV reflex and CSH, were found. Thirteen patients demonstrated reflex asystole during HUT. Nine of the asystolic episodes were triggered by VV reflex (13.4% of all cases), and four by CSH (12.1% of all cases). Mean asystole duration was 14.4±14.7 s (range from 3 to 46 s). In a multivariable logistic regression analysis adjusted for age and gender the asystolic response was associated with longer anamnestic duration of symptoms (per yr, odds ratio: 1.06, 95% confidence interval 1.02-1.10, p=0.001). Conclusion: Patients presenting to EDs with a suspected syncopal attack may be efficiently diagnosed by HUT and carotid sinus massage. The test protocol allows identifying individuals with asystolic response, which can be found in approximately one of eight patients with VV syncope or CSH. A long anamnestic duration of syncopal symptoms seems to be an important predictor of reflex asystole.

50
O46 Surface ECG Ventricular Arrhythmia Synthesis from Intracardiac Signals: an Animal Study Fabienne Porée1, Christophe Leclercq1, Amar Kachenoura1, Gaelle Kervio2, Christine Henry3, Guy Carrault1,2, Alfredo Hernandez1 1 INSERM, U642, Rennes, France 2 INSERM, CIC-IT 804, Rennes, France 3 Sorin Group ELA Medical, Le Plessis-Robinson, France Context: Follow-up of patients with an implantable cardiac device (ICD) requires regular outpatient visits where, the clinician analyses a standard surface ECG. On the other hand, the pacemaker records electrograms (EGM), acquired from intracardiac electrodes. Since both EGM and ECG are different representations of the electrical activity of the heart, we recently investigated the feasibility of synthesizing the surface ECG from EGM recordings and proposed a dedicated non-linear approach, based on a Time Delay artificial Neural Network (TDNN). Although preliminary results obtained from human data are encouraging, the generalization properties of the proposed method have shown to be limited. Indeed, the quality of the reconstructed QRS complex morphologies that were not present on the training sets are generally unsatisfactory. In this work, we propose an animal experimental protocol and methods to quantitatively evaluate the generalization properties of the proposed reconstruction approach. Method: The aim here is to generate different beat morphologies that can be used to evaluate the TDNN method. During the protocol 3 ECG and 6 EGM signals from a female pig weighting 45kgs applying intra-cardiac stimulation on different sites (1 atrial, 3 on the right ventricle and 5 on the left ventricle) and up to four different pacing rates were simultaneously acquired, giving a total of 29 different pacing configurations. Using these data, two experiments were conducted: The first one evaluates the sensitivity of the TDNN method to reproduce unlearned beats at different pacing rates and from the same site. The second one, evaluates the reconstruction of unlearned beats at different sites, using the same pacing rate. Results: Results from experiment 1 show that our method is robust during the changes in pacing rate and, thus, their associated morphology variations (QT adaptation, etc.). Lead-by-lead correlation coefficients between the real ECG and the synthesized ECG are greater that 0.90. Regarding experiment 2, we observed that, at least, one ECG lead was always well reconstructed (correlation coefficient greater than 0.85). Discussion: Preliminary results are encouraging regarding the generalization properties of the TDNN method. They suggest that upcoming ICD would be able to synthesize a surface ECG from EGM, even during multifocal ventricular arrhythmias at different rates.

51
O47 Implantable Loop Recorders in Diagnostics of Mechanisms of Unexplained Syncope in Children with Apparently Normal Heart Maria Shkolnikova, Ekaterina Polyakova, Sergey Termosesov, Tatyana Vakhmistrova Moscow Institute for Pediatrics and Pediatric Surgery, Moscow, Russian Federation Background: Syncope (S) is a common symptom in children without structural heart abnormalities. Analysis of personal and family history, physical examination, ECG, stress test, Holter monitoring, echocardiogram, and even tilt-test could not identify the cause of S in about 15 to 30% of pediatric cases. The optimal diagnostic tool should allow to analyze the symptom-rhythm correlation. The Implantable Loop Recorder (ILR) technology offer the long-term monitoring of the good quality ECG for capturing infrequent S of relatively short duration. Unfortunately ILR experience in children is still very limited. We study: 1) mechanisms of unexplained S in children with apparently normal heart with a particular focus on cardiogenic S; 2) the diagnostic efficiency of ILR for identification of unexplained S mechanisms in children. Patients and Methods. 630 children with unexplained S without structural heart abnormalities aged from 2 to 18 (12.8±6.5) with recurrent S (at least three episodes or two within last 3 years) were studied. Evaluation of symptoms, ECG, Echo-cardiography, 24-hour Holter monitoring, exercise test, and ortostatic and tilt-test (if needed) were performed. ILR was implanted in 86 children with unexplained syncope. The mean follow up is 8.5 ± 6.2 month. Results. Symptoms recurred in 32 pts (83% of pts with complete protocol of ILR) within one day to 16 months after the implantation (mean = 6.5 months). Of the 17 pts (52%) with arrhythmogenic S, 16 had asystole lasting 3 to 30 s. Before the ILR implantation, incidence of non-arrhythmogenic S was about 5-fold higher than that for arrhythmogenic S. After the implantation their incidence significantly drops (a placebo effect). Incidence of arrhythmogenic S does not change after the ILR implantation. The median time to arrhythmogenic S was shorter than that for non-arrhythmogenic S. Conclusion. About 50% of Syncope of unknown origin in children are cardiogenic and associated with life-threatening arrhythmias. They are mostly caused by asystole. ILR showed itself as an efficient way for identifying mechanisms of S unexplained after extensive investigation.In this study ILR monitoring led to positive or negative arrhythmic diagnoses in 83% of cases.

52
O48 Does IRIS Merely Show a Switch of the Mode of Death? Georg Schmidt1, Marek Malik2 1 Technische Universität München, Munich, Germany 2 St George's University of London, England Background: IRIS showed no survival benefit by prophylactic ICD implantation in selected survivors of AMI. Increase of non-sudden death rate compensated reduction of sudden death cases. The authors suggested that IRIS patients protected from arrhythmic death were prone to non-sudden death. We applied the IRIS criteria to a large cohort of post-MI patients and suggest alternative interpretations. Methods: ISAR-Risk included 2,597 consecutive AMI survivors (≤80y, sinus rhythm). IRIS-positive patients (LVEF ≤40%&heart rate ≥90bpm, or non-sustained ventricular tachycardia≥150bpm) were stratified by “severe autonomic failure” (SAF) defined as abnormal heart rate turbulence and abnormal deceleration capacity. 1° endpoint was 5y mortality. Results: IRIS criteria identified 102 patients (3.9%) with a 5y-mortality rate of 34.1% comparable to that observed in the IRIS trial. Sensitivity of the IRIS criteria for prediction of 5y total mortality was 12.6%. SAF separated IRIS-positive patients into 2 subgroups with substantially different prognosis. While 71 of the 102 IRIS positive patients (69.6%) were SAF-negative and had a good prognosis (5y mortality rate 17.5%), 31 of the 102 patients (30.4%) were SAF-positive and had a very poor prognosis (5y mortality rate 72.8 %). Conclusions: In unselected post-MI patients, IRIS criteria identify a small but highly heterogeneous group of patients. ICD-related switch of mode of death is conceivable in the high-risk IRIS sub-group. However, ICD-related harm is more likely in the low-risk IRIS sub-group that included >2/3 of IRIS positive patients. IRIS findings should not be extrapolated to other risk stratification strategies.

53
ISHNE Corner: ECG-based Predictors of Clinical Outcome O49 Which QTc Interval Estimate is Better for Predicting Sudden Death? Siegfried Perz, Roswitha Küfner, Moritz Sinner, Christine Meisinger, Martina Müller, Arne Pfeufer, Annette Peters, Karl-Hans Englmeier, H.-Erich Wichmann, Stefan Kääb 1 Institute for Biological and Medical Imaging, Helmholtz Zentrum München - German Research Center for Environmental Health, Neuherberg, Germany 2 Institute of Epidemiology, Helmholtz Zentrum München - German Research Center for Environmental Health, Neuherberg, Germany 3 Institute of Human Genetics, Helmholtz Zentrum München - German Research Center for Environmental Health, Neuherberg, Germany 4 Department of Medicine I, University Hospital Munich, Campus Großhadern, Munich, Germany Background: It is a well-known phenomenon that the QT interval corrected for heart rate is associated with the development of severe rhythm disturbances and mortality. Objective: In order to investigate the association between the risk of sudden death (SD) with different QT interval estimates corrected for heart rate we used data from the two population based surveys MONICA/KORA S1 and S2 conducted in 1984/85 and 1989/90. Methods: The computerized QT interval and RR interval measurements were derived from 12 lead resting ECGs of 20 sec duration (Sicard 803 ECG system) in a standardized manner after 10 minutes at rest in supine position. The QT interval correction was performed according to the formulas of Bazett, Fridericia and the Framingham Heart Study. S1 subjects were followed for 24 years, S2 subjects for 19 years. SD was assessed by death certificates ICD-9 code: 798.1). The different QT interval estimates of 27 individuals suffering from SD during the follow-up were compared with QT interval estimates of 27 survivors (still alive at the end of the observation time) matched by age and sex. Results: The mean age of both groups was 53.0±7.4 years at the time of the survey examination, 29.6% (8/27) were females. The average follow-up time in the SD group was 9.1 (min=1, max=17) years, for the controls 19 years. The uncorrected QT intervals in the SD group were very similar to those in the control group (388.3±39.6 ms vs. 389.3±23.3 ms; ns), however heart rate was significantly higher in the SD group (70.4±13.0 bpm vs. 63.8±10.8 bpm, p<0.05). As a consequence, QT correction for heart rate resulted in increased QTc intervals in the SD group in comparison to the control group: of 11.4 ms according to Fridericia and of 12.0 ms according to the formula of the Framing Heart Study. However, only the application of Bazett’s QT correction resulted in a statistically highly significant increased QTc interval estimate in the SD group (416.1±31.2 ms vs. 398.6±20.0 ms, p<0.01). Conclusion: Several investigations performed during the last decades pointed out major limitations of Bazett’s formula with respect to minimizing intra- and inter-observer variability of QT interval estimates. However, with respect to risk prediction, the application of Bazett’s formula seems to be superior for predicting SD

54
Computational Cardiology O50 A Non-dimensional Study of the Passive Bidomain Equation Peter Johnston Griffith University, Nathan, Australia Background: Simulation studies of ST depression arising from subendocardial ischaemia show a marked difference in the resulting epicardial potential distributions depending on which of the three common experimentally determined bidomain conductivity data sets is chosen. Materials and Methods: The passive bidomain equation allows the prediction of the extracellular potential distribution based on a knowledge of the transmembrane potential distribution and the various tissue conductivity values. Here, the equation was normalised by dividing by the difference in normal and ischaemic transmembrane potentials during the ST segment and by the sum of the intra and extracellular conductivities in the transverse direction. Simulations were then performed using the finite volume method on a block of cardiac tissue attached to a blood mass to determine the epicardial potential distribution. Results: The non-dimensional form of the bidomain equations described yields the ratio of the sum of the intra and extracellular longitudinal conductivities divided by the sum of the intra and extracellular transverse conductivities. Averaging this ratio over the three sets of experimentally determined data from Clerc (1976), Roberts et al. (1979) and Roberts and Scher (1982) gives the value of 3.21 +/- 0.08. This standard deviation is much smaller than for other published combinations of these sets of conductivities. The effect of this narrow range means that the left hand side of the governing equation can be considered, as a good approximation, to be equal for all these sets of conductivity data. Hence, it is the right hand side of the differential equation which contains all the necessary information to compare the effect different conductivity data sets have on the epicardial potential distribution. Conclusion: The results from the non-dimensional formulation allow the passive bidomain equation to be studied simply by analysing the behaviour of its right hand side. In particular, an explanation can now be offered as to why the data of Roberts and Scher gives rise to epicardial distributions which are markedly different from those obtained from the other two data sets. For a rectangular block of cardiac tissue with a region of 50% subendocardial ischaemia and no fibre rotation, analysis shows that the important factor is the ratio of the intracellular longitudal and transverse conductivities. For the three data sets this ratio is 9.0, 10.8 and 5.7.

55
O51 Combining Initialization and Solution Inverse Methods for Inverse Electrocardiography Burak Erem1, Alireza Ghodrati2, Gilead Tadmor1, Robert MacLeod3, Dana Brooks1 1 Northeastern University, Boston, USA 2 Saadat Co 3 University of Utah, USA Many methods have been developed over the last 25 years for the inverse problem of electrocardiography. The two main classes of such methods which have been of recent interest use two alternative equivalent source formulations. Activation-based methods use as a source model a dipole layer on the heart surface with identical known transmembrane potential waveforms at each node. Potential-based methods use as a source model potential values at each time instant at each node on a closed surface surrounding the sources. The former is highly constrained, nonlinear, and non-convex, while the latter is loosely constrained but linear. Recent interest in activation-based iterative solutions has focused on initialization. Much recent interest in potential-based solutions has focused on devising constraints which impose physiologically meaningful waveform shapes. Here we describe work using one method to initialize a second for both formulations. For activation-based solutions, we initialize by embedding the solution set for the non-convex optimization problem, which results from fixing waveforms and allowing only activation sample times to vary, into a less constrained solution set, thus formulating a convex problem. To do so we replace the hard constraints on waveform shape by softer constraints. We solve this convex optimization problem combining constraints on the residual with the waveform shape constraints and imposing smoothness of the activation surface. The resulting optimal solution will not be a feasible set of activation waveforms, but we use it to obtain a good initialization for subsequent Newton-type iterations for the nonlinear, non-convex problem. For the potential-based problem we employ a recent method from our group, Wavefront-Based Potential Reconstruction (WBPR). WPBR uses a constraint based on segmenting the reconstructed potentials from a previous iteration or time step into three spatial regions: activated, not yet activated, and transition. The first two are modeled as spatially constant, the third by a specified transition function. This constraint is used in a Tikhonov-like regularization, producing wavefronts without the typical regularized smoothing. WBPR requires an initialization to remove reference drift to create the three-region segmentation. We use a different potential-based method, the "isotropy method" from Huiskamp and Greensite, to estimate the required initialization parameters. In both cases the combination of these two inverse methods shows, in simulations based on measured canine heart surface data and data from the ECGSim software package, improved results compared to standard approaches.

56
O52 Influence of Torso Inhomogeneities on Inverse Localization of Two Ischemic Lesions Jana Svehlikova, Jana Macugova, Marie Turzova, Milan Tysler Institute of Measurement Science, Slovak Academy of Sciences, Bratislava, Slovakia Introduction: Changes of the cardiac electric field due to ischemia can be characterized by differences between body surface potentials obtained under normal conditions and conditions with manifestation of the disease. They can be described by single difference integral map (DIM). If the changes in the myocardium occur in a small area, equivalent electrical generator can be represented by a dipole. For localization of ischemia, the inverse problem with two dipoles was solved and criteria for identification of cases with two lesions were proposed. The aim of this study was to compare inverse solutions obtained in inhomogeneous and homogeneous torso model. Method: In an analytical ventricular model, ischemic lesions were simulated by changing action potentials in areas typical for stenosis of main coronary vessels. Subepicardial and subendocardial lesions of different size and pairs of such lesions were simulated. For normal activation and for simulated ischemic lesions, potentials on surface of inhomogeneous torso model including heart cavities and lungs were computed in 64 points representing the measured leads. QRST integral maps and corresponding DIM were then used for the inverse solution with two dipoles. All possible pairs of dipoles located in 168 predefined locations within the ventricles were examined. Best dipole pair that generated DIM with minimal rms difference from the original DIM and pairs giving DIMs with rms difference within 1% from the best solution were analyzed. Gravity centers of two obtained clusters of dipoles were considered the positions of identified lesions. Proper dipole clustering and mutual position of clusters were used to decide whether they represent one or two real lesions. In the inverse solution, inhomogeneous torso model and homogeneous torso where only mean electrical conductivity of the torso was assumed were used. Results: Two parameters of the inverse solutions were compared: (1) the mean lesion localization error as the distance between the center of the simulated lesion and the center of the inversely obtained cluster of dipoles and (2) percentage of correctly identified cases with two lesions. The obtained parameters were 1.5 cm and 78 % when inhomogeneous torso model was used and 2.1 cm and 69 % in homogeneous torso. Discussion and Conclusions: For observed parameters, better results were obtained when inhomogeneous torso model was used. This suggests that for solving the inverse problem of electrocardiography with two dipoles, besides sufficient number of leads and basic configuration of the torso also information about important torso inhomogeneities is desirable.

57
O53 What Does Reflect the Tpeak-Tend Interval? Model Study Natalia Arteyeva, Jan Azarov Institute of Physiology Komi Science Centre, Ural Division Russian Academy of Sciences, Syktyvkar, Russia Background: There are two viewpoints concerning the Tpeak-Tend interval nowadays: the first, that it is an index of transmural dispersion of repolarization, and the second, that this interval reflects the total dispersion of repolarization in the heart ventricles. The aim of the present work was to examine the time correlation between the dispersion of repolarization in the heart ventricles and the Tpeak-Tend interval with the help of the mathematical modelling. Materials and methods: We used the cellular automata model adapted to the heart ventricles of a rabbit. The model included transmural, apicobasal and left-to-right gradients of action potential durations (APD) as well as M-cells. The values of APD gradients corresponded to our experimental data; besides, we used an increased transmural APD gradient. The model output were the components of the resultant electrical heart vector and the body surface potential distributions. Results: (1) The peak of T-wave corresponded to the earliest end of repolarization, taking place on the epicardium of the ventricles’ apex. (2) The end of the T-wave corresponded to the latest end of repolarization, taking place in the M-cells of the ventricles’ base. So, the length of the Tpeak-Tend interval corresponded to the time interval beteween the latest and the eairliest end of repolarization, i.e. the total dispersion of repolarization. (3) The length of the Tpeak-Tend interval was a sum of three components – the transmural APD gradient, the apicobasal (epicardial) APD gradient and the difference in activation time between the apex and the base of the ventricles. In the case when the T-wave is formed not by the whole ventricles but by a segment of ventricular wall, the time difference between the earliest and the latest repolarization of epicardium is small as well as apicobasal APD gradient and the difference in activation time between the upper and the lower edges of the segment. In that case the peak of T-wave would correspond to the complete repolarization of epicardium, and the Tpeak-Tend interval would be an index of transmural dispersion of repolarization. Conclusion: The modelling showed that the contradictory conclusions of different authors concerning the time correlation between the repolarization sequence of ventricular myocardium and the Tpeak-Tend interval in fact are not conflicting but they were made on the base of different experimental materials.

58
O54 Source Identification in Atrial Fibrillation by Velocity Field Analysis Michela Masè1, Maurizio Del Greco2, Flavia Ravelli1 1 Department of Physics, University of Trento, Povo - Trento, Italy 2 Division of Cardiology, S. Chiara Hospital, Trento, Italy Introduction: The identification of localized sources in atrial fibrillation (AF) is crucial for a successful outcome of ablation therapy. Despite the introduction of new multispine mapping systems in the clinical setting, source identification in AF may be doubtful. In this paper a new method for an objective identification of AF sources, based on the quantification of the divergence of the velocity field in the mapping area, is introduced and validated in a simulation model of arrhythmia and in a patient with permanent AF. Methods: The algorithm reconstructed the activation process in the mapping area by a radial basis function interpolation (RBF) of the activation time series estimated at the recording sites of a 20-pole multispine catheter (PentaRay). Following RBF interpolation the velocity field and its divergence were analytically determined and spatially mapped. The response of divergence maps to different arrhythmic patterns (i.e. focal activity in homogeneous and inhomogeneous media, and wavefront collision) was investigated in a multistate cellular automaton model composed of 150x150 square units. The reliability of source identification was tested against the effects of missing recording sites and inaccuracy in activation time estimation (modeled as uniformely distributed random jitters added to activation times). The method was then applied to real AF electrograms, recorded during a PentaRay mapping study performed in a patient with permanent AF. Results: Divergence maps objectively distinguished arrhythmic patterns, associating focal activity with sources (positive divergence values) and collision lines with sinks (negative divergence values) of the velocity field. The method provided accurate identification of arrhythmic foci (distance between estimated and true source < 10 cells, p<0.05) even with just 60% of recording sites available and despite inaccuracies in activation time estimation corresponding to 20% of the cycle length. Performances in presence of noise were sensitively improved by averaging maps over few beats, which allowed the localization of the source with a precision of 1.8+/-1.6 cells in presence of 20% inaccuracy. Vector field analysis applied to AF electrograms recorded in a patient with permanent AF identified focal activity in the complex fibrillating context, disclosing focal areas in proximity of the pulmonary veins. Conclusions: These results suggest the potentialities of integrating multispine mapping systems with velocity field analysis for an objective identification of localized sources and optimization of ablation procedure.

59
O55 In Silico Simulation of Fibrillation in Canine Atrial Tissue Using Detailed Ion-channel Models Including Drug Interaction Effects Joachim Almquist1, Mikael Wallman1, Ingemar Jacobson2, and Mats Jirstrand1 1Fraunhofer-Chalmers Research Centre, Göteborg, Sweden 2Bioscience, AstraZeneca R&D Mölndal, Sweden Atrial fibrillation is the most common form of heart arrhythmia and is associated with a 5-6 fold increase in the incidence of stroke. Computer models describing the temporal evolution of the action potential over realistic atrial geometries are very useful to understand or predict the effect of drugs acting as inhibitors on single or multiple ion-channels. In particular, these models make it possible to relate the dynamics of the action potential propagation to drug effects on the single cell level. This in turn permits in silico reconstruction and investigation of phenomena like atrial flutter and fibrillation. In previous studies we have implemented mathematical models of canine heart muscle cells, describing the time evolution of canine atrial action potentials, performed simulations of the electrical activity of the canine atria on a tissue level, and extended the performed simulations to realistic atrial geometries, where flutter and fibrillation behaviors have been reproduced. Furthermore, successful termination of these behaviors has been observed when perturbing the conductance of particular ion-channels mimicking expected drug effects. The main objective of this study has been to replace the Hodgkin-Huxley based mechanistic model of an ion-channel of particular interest with a detailed Markov type model including drug interaction effects. The result is a electrochemical canine atrial simulation model including realistic geometry, muscle fiber directions, varying cell types over the atrial surfaces, and ‘turning knobs’ for quantitative studies of effects on fibrillation by drug properties (association/dissociation rates) and levels. The canine atrial model framework is expected to be of great value for future focused studies and virtual screening and also demonstrates how submodels of varying and appropriate resolution can be put together to form a simulation model with reasonable run time for the question at hand.

60
JUNE 5, 2010 10.30-12.00 ECG in STEMI O56 Normal Limits of STj in African Blacks – Implications for STEMI P. Macfarlane, E. Clark, B. Devine, S. Lloyd, I. Katibi University of Glasgow, Scotland and University of Ilorin, Nigeria Introduction: The most recent criteria for ST elevation myocardial infarction (STEMI) are age and gender dependent. However, the effect of race on these criteria has not yet been studied to any significant extent. The normal limits of the ECG derived from a large population of healthy individuals living in Nigeria have recently been derived in our lab and so the effect on criteria for STEMI can be assessed. Methods: 12 lead ECGs were recorded in and around Ilorin, Nigeria using a Burdick Atria 6100 electrocardiograph. Volunteers were recruited from the University of Ilorin and from surrounding villages. Each participant was examined by a physician and a detailed medical history obtained. ECGs were transferred locally to a PC and sent to Glasgow for further analysis. All were reviewed to exclude any that were technically unsatisfactory or had an unexpected abnormality. ECGs were analysed by the Glasgow program which provided measurements of the STj amplitude. The ECG data underwent statistical analysis using SAS v9.1. Plots and summary statistics were used to assess, informally, the relationship with age and sex. Regression techniques addressed formal relationships. Normal ranges were established by splitting the data into age-sex subgroups and by calculating the 96th percentile range within each subgroup. Results: A total of 1261 persons (782 males and 479 females), all apparently healthy, were recruited. There was a relatively even spread of ages between 20 and 87 years. The mean STj amplitude was highest in V2, V3 in males and significantly higher in males than in females. The mean value of STj in V2 for males under 30 years was 210+80 V which is in excess of the 200 V threshold for STEMI in the current guidelines (Universal Definition of Myocardial Infarction). The corresponding figure for females was 76+39 V. At 50-59 years, the upper limit of normal STj in V2 was 252 V in males and 156 V in females. Both limits exceed the current threshold for abnormal ST elevation in STEMI criteria. The upper limit of normal STj in V5 in those aged 50 – 59 years was 110 V in males and 73 V in females. Conclusion: This is the first large study of automated ECG recording in healthy blacks living in West Africa. The fact that the mean STj exceeded the STEMI thresholds for lead V2 indicates clearly that criteria for STEMI require to have another dimension added namely, race.

61
O57 Dynamic ECG changes in acute STEMI Markku J. Eskola Heart Center, Tampere University Hospital, Finland The ECG recorded during acute ischemia as well as during the ensuing recovery phase is an objective reflection of the series of events which occur in the myocardium. Sclarovsky has defined the stages of the dynamic ischemic process by two distinct ECG patterns: the pre-infarction syndrome (PIS) and evolving myocardial infarction (EMI). These patterns reflect the myocardial response to acute ischemia and reperfusion and to the infarctation of the jeopardized myocardium. The grade of coronary artery patency in the infarct related artery (IRA) may be predicted by the ST-T pattern. Early inversion of the T waves after fibrinolysis in patients with elevated ST segments indicates a better degree of reperfusion and ventricular function compared to cases with ST-segment elevation and positive T wave. Studies in which predischarge ECG and patency of IRA have been correlated have shown that the presence of a combination of negative T wave and isoelectric ST segment indicates good coronary flow. In contrast to this finding, the presence of a combination of positive T wave and elevated ST segment shows impaired coronary flow. Pre-infarction syndrome, PIS: Pre-infarction syndrome is the initial ECG manifestation of acute ischemia in STEMI. It occurs before the development of acute infarction. It is of the utmost importance to identify the distinct ECG characteristics at this window of opportunity before irreversible myocardial damage develops. The ECG of the PIS is defined as positive, tall T waves and ST-segment elevation without new or old Q waves. Evolving myocardial infarction, EMI: Typically, during the evolution of STEMI, pathological Q waves evolve and T-wave inversions develop. The T waves comprise two limbs, T1 and T2. The ECG can recognize three stages of effective reperfusion. In the first stage, inversion of the T2 waves appears, while T1 is still upright and elevated (biphasic T wave) along with the ST segment. The second stage is represented by inversion of the two limbs of the T waves, with the peak inverted and beneath the isoelectric line (completely inverted T wave), while the ST segment still remains elevated above the isoelectric line. In the third stage, inversion of the T waves with an isoelectric ST segment is evident. The ECG patterns of the EMI are shown in the Table.
Table. The ECG patterns of evolving myocardial infarction. Modified from Sclarovsky (1999a). Evolving MI with Q wave ST segment T wave
No reperfusion Yes Elevated Positive
Incomplete reperfusion Yes or no Elevated Biphasic
Complete reperfusion Yes or no Isoelectric or mildly elevated Completely inverted
MI, myocardial infarction
Clinical implications: More detailed ECG analysis, involving PIS and EMI, is useful for rapid identification of high-risk patients, for whom every effort should be made to arrange transportation for primary PCI, or vice versa, in order to identify low-risk patients for whom FT might be an alternative option.

62
O58 ECGs of Men and Women with Suspected Acute Coronary Syndrome in the Emergency Department Catarina Ellehuus Hilmersson1, Jakob Lundager Forberg1, Mattias Ohlsson2, Ulf Ekelund1 1 Emergency Medicine, Department of Clinical Sciences at Lund, Skåne University Hospital, Lund Sweden 2 Department of Theoretical Physics, Lund University, Lund, Sweden Background: More than 180 000 Swedes annually present at the emergency department (ED) with chest pain suspicious of acute coronary syndrome (ACS; unstable angina pectoris and myocardial infarction). This study compared the ED ECGs of men and women with suspected and confirmed ACS. Materials and methods: In a database containing all patients (n=11219) who presented at the Skåne University Hospital Lund ED with chest pain during 2006 and 2007, electronically saved ECGs and discharge diagnoses (ACS or not) were evaluated. Cases meeting traditional ECG criteria for ACS (ST elevation ≥ 2 mm in two or more contiguous leads (leads V1, V2 and V3) or ≥ 1 mm (other leads), ST depression > 1 mm in two or more contiguous leads and T-wave inversion >1 mm in more than one lead with predominant R-waves) were identified by electronic measurement, and data were analyzed using MS Excel and SPSS software. Results: 9411 patients (4514 women) had electronically saved ECGs, and of these 705 patients (246 women) had ACS. Among the 9411 patients, average QRS-duration was longer in men than in women (100 vs 91 ms), and QRS axis somewhat more leftward (16 vs 22 degrees). In the patients with a QRS duration <120 ms (n=8519), 1174 males and 247 females met ST-elevation criteria for ACS, but only 8 % of these males compared to 17 % of these females had ACS. ST-depression criteria for ACS were met by 230 women and 214 men, of which 26 % and 37 % had ACS. T inversion criteria for ACS were met by 451 females and 428 males, of which 21 % and 25 % had ACS. Any ECG criteria for ACS was met by 813 women and 1606 men, and of these 19 % and 13 % had ACS. Conclusion: Many more men than women met ST elevation criteria or any criteria for ACS, but the likelihood of ACS in these patients was clearly lower in the men. However, among patients with ST depression and T wave inversion, males were more likely to have ACS than women. There may be a need for different ECG criteria for ACS for men and women.
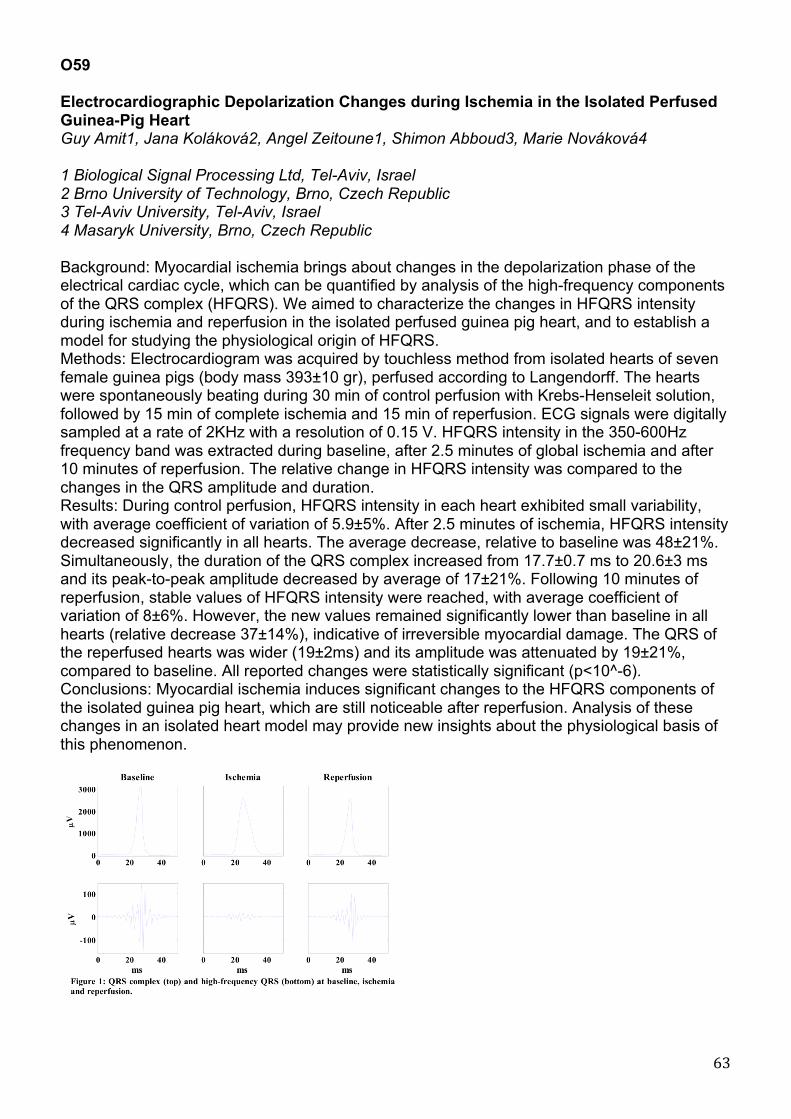
63
O59 Electrocardiographic Depolarization Changes during Ischemia in the Isolated Perfused Guinea-Pig Heart Guy Amit1, Jana Koláková2, Angel Zeitoune1, Shimon Abboud3, Marie Nováková4 1 Biological Signal Processing Ltd, Tel-Aviv, Israel 2 Brno University of Technology, Brno, Czech Republic 3 Tel-Aviv University, Tel-Aviv, Israel 4 Masaryk University, Brno, Czech Republic Background: Myocardial ischemia brings about changes in the depolarization phase of the electrical cardiac cycle, which can be quantified by analysis of the high-frequency components of the QRS complex (HFQRS). We aimed to characterize the changes in HFQRS intensity during ischemia and reperfusion in the isolated perfused guinea pig heart, and to establish a model for studying the physiological origin of HFQRS. Methods: Electrocardiogram was acquired by touchless method from isolated hearts of seven female guinea pigs (body mass 393±10 gr), perfused according to Langendorff. The hearts were spontaneously beating during 30 min of control perfusion with Krebs-Henseleit solution, followed by 15 min of complete ischemia and 15 min of reperfusion. ECG signals were digitally sampled at a rate of 2KHz with a resolution of 0.15 V. HFQRS intensity in the 350-600Hz frequency band was extracted during baseline, after 2.5 minutes of global ischemia and after 10 minutes of reperfusion. The relative change in HFQRS intensity was compared to the changes in the QRS amplitude and duration. Results: During control perfusion, HFQRS intensity in each heart exhibited small variability, with average coefficient of variation of 5.9±5%. After 2.5 minutes of ischemia, HFQRS intensity decreased significantly in all hearts. The average decrease, relative to baseline was 48±21%. Simultaneously, the duration of the QRS complex increased from 17.7±0.7 ms to 20.6±3 ms and its peak-to-peak amplitude decreased by average of 17±21%. Following 10 minutes of reperfusion, stable values of HFQRS intensity were reached, with average coefficient of variation of 8±6%. However, the new values remained significantly lower than baseline in all hearts (relative decrease 37±14%), indicative of irreversible myocardial damage. The QRS of the reperfused hearts was wider (19±2ms) and its amplitude was attenuated by 19±21%, compared to baseline. All reported changes were statistically significant (p<10^-6). Conclusions: Myocardial ischemia induces significant changes to the HFQRS components of the isolated guinea pig heart, which are still noticeable after reperfusion. Analysis of these changes in an isolated heart model may provide new insights about the physiological basis of this phenomenon.

64
O60 A Simple Strategy Improves Pre-Hospital ECG Utilization and Hospital Treatment for Patients with Acute Coronary Syndrome: Results of the ST SMART Study Barbara Drew1, Claire Sommargren1, Kent Benedict2, James Glancy3 1 University of California San Francisco, CA, USA 2 Santa Cruz Emergency Medical Services, CA, USA 3 Dominican Hospital, Santa Cruz, CA, USA 4 University of California San Francisco, CA, USA Background: Although the American Heart Association recommends a pre-hospital ECG be recorded for all patients who access the Emergency Medical System (EMS) with symptoms of acute coronary syndrome (ACS), widespread utilization of pre-hospital ECG has not been achieved in the United States. Methods and Results: A 5-year prospective randomized clinical trial was conducted in a predominately rural county in Northern California to test a simple strategy for acquiring and transmitting pre-hospital ECGs that involved minimal EMS training and decision-making. A 12-lead ECG was synthesized from 5 rapidly-applied electrodes and continuous ST-segment monitoring was performed with ST event ECGs automatically transmitted to the destination hospital emergency department (ED). Patients randomized to the experimental group had their ECGs printed out in the ED with an audible voice alarm whereas control patients had an ECG after hospital arrival, as was the standard of care in the county. The result was that nearly three-quarters (73.5%) of patients with symptoms of ACS had a pre-hospital ECG transmission without a clinically significant increase in EMS scene time (average 2-minute increase). Patients with non-STEMI or unstable angina had a faster time to first intravenous drug and there was a suggested trend for a faster door-to-balloon time and lower risk of mortality in STEMI patients. Anecdotal evidence was observed for the potential value of pre-hospital ECGs and ST-segment monitoring in the field for patients with non-STEMI or unstable angina. Conclusions: Better EMS utilization of pre-hospital ECGs and better hospital treatment times for ACS are feasible with a simple approach that is tailored to the characteristics of the local geographic region.

65
O61 Prediction of Microvascular Obstruction following Primary Percutaneous Coronary Intervention Jonas Hallén, Maria Sejersten1, Per Johanson2, Dan Atar3, Peter Clemmensen 1 Department of Cardiology, The Heart Center, Copenhagen University Hospital, Copenhagen, Denmark 2 Department of Cardiology, Sahlgrenska University Hospital, Gothenburg, Sweden 3 Department of Cardiology, Oslo University Hospital, Ullevål and Faculty of Medicine, University of Oslo, Oslo, Norway Background: In patients with ST-elevation myocardial infarction (STEMI), presence of microvascular obstruction (MVO) confers a higher risk of left-ventricular (LV) dysfunction, adverse LV remodeling and clinical outcomes. We compared two different measures of ST-segment recovery for prediction of microvascular obstruction (MVO) following primary percutaneous coronary intervention (PPCI) for STEMI. Materials and methods: 144 patients were included in a post hoc analysis of the Efficacy of FX06 in Ischemia-Reperfusion Injury (FIRE) trial. MVO determined by contrast-enhanced cardiac magnetic resonance imaging at 5-7 days after the index event. Electrocardiograms obtained at baseline and 90 minutes after PPCI. Two methods for calculating and categorizing ST-segment recovery were used: (1) Sum ST-segment deviation ( STD) resolution (percent resolution of STD from baseline to post-PCI) analyzed in 3 categories ( 70 %, 30% to <70%, 30%); (2) worst-lead residual STD (the absolute magnitude of residual STD in the most affected lead on the post-PCI ECG, without reference to the baseline ECG) analyzed in 3 categories (< 1 mm, 1 to < 2 mm, and ≥ 2 mm). Results: For prediction of MVO, worst-lead residual defined the highest risk-group (table 1). In addition, this group was more than twice as large as the highest risk group defined by STD resolution. By multivariable logistic regression analysis, STD resolution was not associated with presence of MVO (adjusted for age, gender, infarct location, TIMI flow, time-to-therapy). In same analysis, worst-lead residual STD >= 2 mm was strongly associated with presence of MVO (odds ratio [95% CI]=9.2 [2.5-33.4], p=0.001). Conclusion: Following PPCI, worst-lead residual STD defines a wider spectrum of risk for MVO than STD resolution; and worst-lead residual ≥ 2 mm at 90 minutes is strongly associated with MVO determined by CMR.
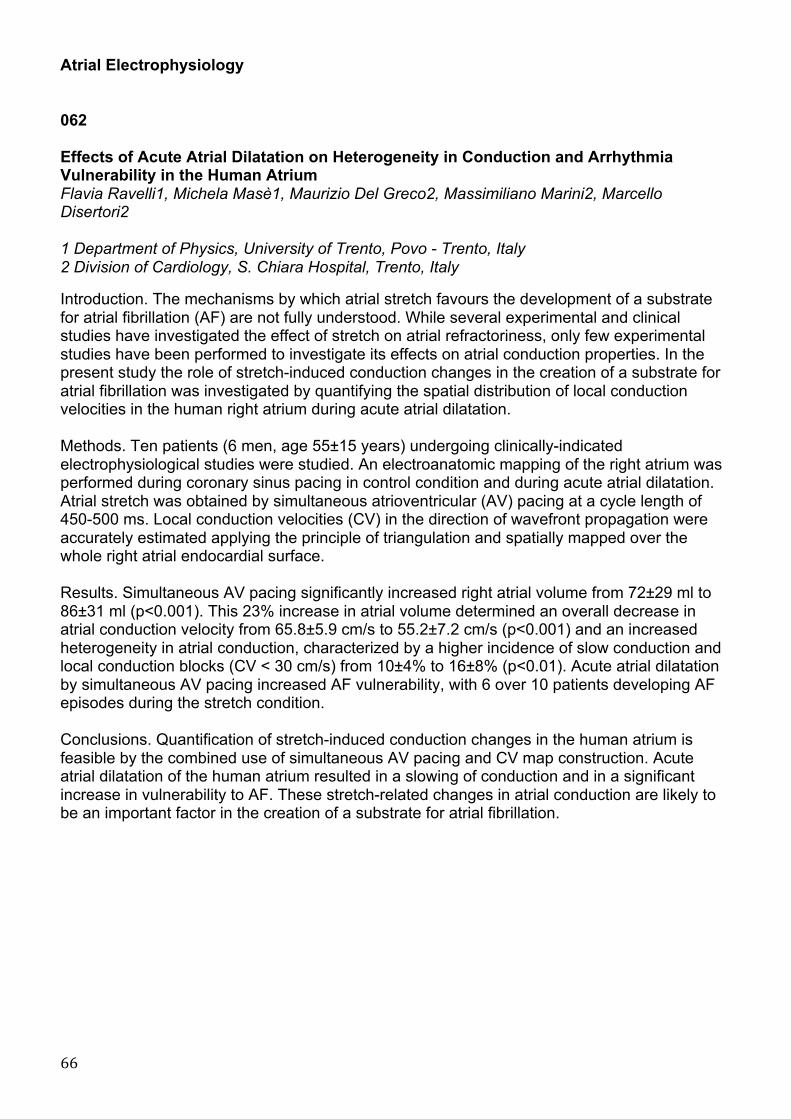
66
Atrial Electrophysiology 062 Effects of Acute Atrial Dilatation on Heterogeneity in Conduction and Arrhythmia Vulnerability in the Human Atrium Flavia Ravelli1, Michela Masè1, Maurizio Del Greco2, Massimiliano Marini2, Marcello Disertori2 1 Department of Physics, University of Trento, Povo - Trento, Italy 2 Division of Cardiology, S. Chiara Hospital, Trento, Italy Introduction. The mechanisms by which atrial stretch favours the development of a substrate for atrial fibrillation (AF) are not fully understood. While several experimental and clinical studies have investigated the effect of stretch on atrial refractoriness, only few experimental studies have been performed to investigate its effects on atrial conduction properties. In the present study the role of stretch-induced conduction changes in the creation of a substrate for atrial fibrillation was investigated by quantifying the spatial distribution of local conduction velocities in the human right atrium during acute atrial dilatation. Methods. Ten patients (6 men, age 55±15 years) undergoing clinically-indicated electrophysiological studies were studied. An electroanatomic mapping of the right atrium was performed during coronary sinus pacing in control condition and during acute atrial dilatation. Atrial stretch was obtained by simultaneous atrioventricular (AV) pacing at a cycle length of 450-500 ms. Local conduction velocities (CV) in the direction of wavefront propagation were accurately estimated applying the principle of triangulation and spatially mapped over the whole right atrial endocardial surface. Results. Simultaneous AV pacing significantly increased right atrial volume from 72±29 ml to 86±31 ml (p<0.001). This 23% increase in atrial volume determined an overall decrease in atrial conduction velocity from 65.8±5.9 cm/s to 55.2±7.2 cm/s (p<0.001) and an increased heterogeneity in atrial conduction, characterized by a higher incidence of slow conduction and local conduction blocks (CV < 30 cm/s) from 10±4% to 16±8% (p<0.01). Acute atrial dilatation by simultaneous AV pacing increased AF vulnerability, with 6 over 10 patients developing AF episodes during the stretch condition. Conclusions. Quantification of stretch-induced conduction changes in the human atrium is feasible by the combined use of simultaneous AV pacing and CV map construction. Acute atrial dilatation of the human atrium resulted in a slowing of conduction and in a significant increase in vulnerability to AF. These stretch-related changes in atrial conduction are likely to be an important factor in the creation of a substrate for atrial fibrillation.

67
O63 Evaluation of Anaesthetic Effects with Propofol during Atrial Fibrillation Raquel Cervigón1, Javier Moreno2, Julián Pérez-Villacastín2, José Millet3, Francisco Castells3 1 Universidad de Castilla La Mancha 2 Hospital Clínico San Carlos 3 Universitat Politècnica de València Background: the effects of the autonomic nervous system (ANS) on atrial fibrillation (AF) have been reported in previous studies such as circadian rhythms and stress tests. On another hand, previous to an AF ablation procedure, an anaesthetic agent (usually propofol) is given to the patients for procedural sedation. Since propofol affects the ANS, this study attemps to respond if propofol exerts any significant influence on AF. Materials: the study includes 27 AF patients (21 paroxysmal AF and 6 persistent AF) submitted to an AF ablation procedure. Previous to the ablation procedure, propofol was administered to each patient. Recordings were acquired both in basal state and under the effects of propofol. For each patient a set of 12 intra-atrial recordings (at the right atrium (RA), left atrium (LA) and septum) and three surface electrocardiograms (ECGs) were registered. Methods: the effects of propofol were evaluated using different parameters: 1) dominant rate of the atrial electrical activity; 2) Shannon entropy; 3) delay and synchronisation indexes between adjacent sites and 4) atrio-ventricular conduction ratio (in terms of the ratio between the atrial rate at the septum and the RR rate). These parameters were computed at both RA and LA and compared before and after propofol infusion. Results: the dominant atrial rate exhibited a slight but significative decrease in the RA from 5.85±0.54Hz in basal to 5.71±0.61Hz during propofol infusion (p=0.045). However, no significative differences were found in the LA. The Shannon entropy showed a downward trend in the RA (i.e. more organised) from 3.56±0.19 to 3.51±0.19 and an upward trend in the LA from 3.62±0.19 to 3.67±0.16 (p=0.001). Furthermore, the delay index decreased in the RA from 33.56±16.51ms to 26.61±10.32ms but increased in the LA from 27.32±11.34 to 31.19±15.17ms (p=0.018). Consistently, the synchronisation index increased in the RA from 0.58±0.27 to 0.69±0.20, whereas decreased in the LA from 0.67±0.21 to 0.62±0.28 (p=0.022). Finally, the mean RR interval decreased from 579±140ms to 554±131ms (p=0.045), and the atrio-ventricular conduction ratio decreased from 3.31±0.83 to 3.17±0.75 (p=0.033). Conclusions: this study shows that propofol causes opposite effects on the RA and LA. Specifically, the atrial electrical activity at the RA becomes more organised, whereas at the LA becomes more disorganised. Although only slight differences were observed, the fact that all parameters behaved consistently reinforces this conclusion. This study may contribute to a better knowledge about the effects of the ANS on the electrophysiological properties during AF.

68
O64 A New Algorithm for Estimating the Atrial Activity in the Frequency Domain Raul Llinares1,2, Jorge Igual1,2, Julio Miro-Borras1,2, Andres Camacho1,2 1 Universidad Politecnica de Valencia, Valencia, Spain 2 Departamento de Comunicaciones, Spain Background: In this work we present a fixed point algorithm to extract the atrial rhythm in atrial tachyarrhythmias from the surface 12-leads electrocardiogram (ECG) Materials and methods: The materials correspond to 14 synthetic recordings and 40 real recordings from the Clinical University Hospital, Valencia, Spain. The proposed method (Frequency Domain Algorithm – FDA) maximizes the power content in the range of frequencies [3-10] Hz for the first uncorrelated recordings in order to assure the decoupling between the atrial and ventricular activities. The central frequency of this range of frequencies corresponds to an initial estimation of the atrial frequency from the T-Q intervals of lead V1. Figure 1 shows the corresponding block diagram. The performance measures used to assess the quality are correlation (rho), spectral concentration (SC) and kurtosis. In the case of real recordings, we also estimate the peak frequency of the extracted atrial activity. To compare the results, FastICA and PCA were also applied to the same recordings. Results: We have analyzed the performance of the three algorithms with synthetic and real recordings. The results are shown in Table 1 (statistical analysis in the last line). The new method outperforms the classical blind source separation methods applied to the estimation of atrial activity, FastICA and PCA. We have also analyzed the behavior of the methods under realistic noise conditions. In this case, in terms of correlation, SC and kurtosis, FDA is specially robust compared to other algorithms. In the last experiment, we have checked that FDA does not require an accurate prior estimation of the initial atrial rate to extract the atrial activity successfully. Conclusion: The proposed method presents the following advantages: simplicity and efficiency in computational time, since it is a fixed-point algorithm and a source extraction method, i.e., it does not require the computation of the whole set of sources and the postprocessing identification of the atrial component among them. It has been applied successfully to non-noisy and noisy simulated ECG and to real ECG, obtaining better results than other algorithms in terms of the proposed quality parameters. These results show that (i) the use of higher order statistics is not necessary to solve the problem (FastICA) and (ii) the use of decorrelation can be enhanced (PCA). Finally, the algorithm is robust to deviations in the initial estimation of the central frequency.
This work was supported in part by the Universidad Politécnica de Valencia under grant no. PAID-06-09-003-382.

69
O65 Non-invasive Estimation of Organization Evidences Differences between Paroxysmal and Persistent Atrial Fibrillation Frida Sandberg1, Raúl Alcaraz2, José Joaquín Rieta3, Leif Sörnmo1 1 Dept. of Electrical and Information Technology, Lund University, Sweden 2 Innovation in Bioengineering Research Group, University of Castilla-La Mancha, Spain 3 Biomedical Synergy, Electronic Engineering Department, Universidad Politécnica de Valencia, Spain Background: The aim of this study is to noninvasively assess the degree of atrial fibrillation (AF) organization using sample entropy for the purpose of discriminating ECG segments containing paroxysmal and persistent AF. Materials and methods: In this work, the sample entropy of the dominant atrial wave (SampEn) is employed to estimate the degree of AF organization. The sample entropy quantifies the degree of similarity in a time series, with larger values corresponding to more irregularities. Since SampEn is sensitive to noise, it is applied to the dominant atrial wave, which is obtained from the atrial activity (AA) of the ECG by selective filtering around the dominant AF frequency (DAF). The DAF is tracked using a method based on a hidden Markov model, designed for robust frequency tracking of noisy signals; the AA is extracted from the ECG using spatiotemporal QRST cancellation. The dataset consists of long-term ECG recordings from 50 patients; 24 with persistent AF and 26 with paroxysmal AF. The recordings with persistent AF are 24-h long, while the paroxysmal episodes of AF ranged from 3.2 min to 10.2 h (median 39.5 minutes). New values of DAF and SampEn are computed each 10 s. To evaluate the performance of each parameter, a leave-one-out strategy was employed: one recording was used to test the classifier, whereas the remaining recordings were used as training data. The error rate when classifying each recording was obtained by dividing the number of incorrectly classified 10-s segments by the total number of segments in that recording. Results: The results show that segments with paroxysmal AF were consistently associated with lower values of both SampEn and DAF than were segments with persistent AF. Paroxysmal Persistent SampEn 0.085±0.010 0.110±0.015 p<0.0001 DAF 5 .56±0.69 Hz 6.73±0.84 Hz p<0.0001 The thresholds, established from the training data, for discrimination between paroxysmal and persistent AF were 0.097±0.00 for the SampEn classifier and 6.19±0.01 Hz for the DAF classifier. The median error rate of the classifier based on SampEn was 0.012, and the 25th/75th percentile error 0/0.089, compared to the error rate of the classifier based on DAF (0.033 and 0.002/0.214). Although the median error rate was lower for the classifier based on SampEn, the difference in performance was not significant. Conclusion: The SampEn measure can be helpful in predicting the timing and progression of AF from paroxysmal to persistent.

70
O66 A Novel Approach to Investigating Propagation Patterns in Endocardial Atrial Fibrillation Signals Ulrike Richter, Luca Faes, Alessandro Cristoforetti, Michela Masé, Flavia Ravelli, Martin Stridh, Leif Sörnmo 1 Dept. of Electrical and Information Technology and Center for Integrative Electrocardiology (CIEL), Lund University, Lund, Sweden
2 Dept. of Physics & BioTech, University of Trento, Italy Purpose: Knowledge about the propagation patterns of the electrical activity in the atria during atrial fibrillation (AF) can provide information about the underlying AF mechanisms and is of interest, e.g., during ablation procedures. The purpose of this study is to investigate propagation patterns using a novel approach that simultaneously evaluates multiple endocardial signals. Materials and methods: The propagation of electrical activity is evaluated by fitting the observed multiple signals with a multivariate autoregressive model, and then measuring the directional coupling between pairs of signals from the frequency domain representation of the model coefficients. The resulting measure, denoted as Generalized Partial Directed Coherence (GPDC), quantifies the strength of coupling from site A to B as a function of frequency, being 0 in absence of coupling from A to B and 1 if A is coupled exclusively to B and to none of the remaining sites. The GPDC is evaluated in the range of the dominant frequency of the AF signals, and its values are tested for significance using a surrogate data approach. For significantly coupled sites, the delay in propagation is also estimated. The method’s potential is illustrated on two simulation scenarios based on a detailed ionic model of the human atrial cell. In the first scenario the propagation resembles an anatomical reentry, while in the second scenario a point source regularly excites the tissue and initiates a propagation that becomes less organized as fibrillatory behavior is provoked. From each scenario, N=5 simulated bipolar electrograms are obtained during 5s. The method is further evaluated on real data, including a 5-s recording of right atrial flutter from the coronary sinus (N=5) and two 5-s recordings of AF from the right atrium with a one- and two-dimensional catheter, respectively (N=5/N=26). Results: In both simulation scenarios the significant GPDCs correctly reflect the direction of coupling and thus the propagation between all recording sites. For the anatomical reentry, the significant GPDCs assume values from 0.61 to 0.82 and thus indicate strong coupling, while for the partly fibrillatory behavior, the significant GPDCs assume lower values between 0.15 and 0.59. For the recording of right atrial flutter, the significant GPDCs reflect a propagation from right to left atrium. Also during AF, significant GPDCs up to 0.30 indicate clear propagation patterns, e.g., in the upper right atrium and the lateral wall. Conclusion: The results illustrate the ability of the novel approach to identify propagation patterns from endocardial signals during AF.

71
Ventricular Repolarisation O67 QT Interval Prolonging Factors in Liver Cirrhosis Patients Ioana Mozos, Corina Serban, Camelia Costea, Lelia Susan University of Medicine and Pharmacy "Victor Babes", Timisoara, Romania Background: Our aim was to identify QT interval prolonging factors in liver cirrhosis patients. Materials and methods: We enrolled 38 patients in our study, aged 58±12 years, diagnosed with liver cirrhosis, Child-Pugh class A (42%), B (34%) and C (24%). They underwent 12-lead ECG and we assessed: the QT interval (QTmax), QTc (heart rate corrected QT interval) and QTm (mean QT interval). Laboratory tests like: serum albumin, bilirubin, protrombine time, serum cholesterol and triglycerides, transaminases, gama-glutamyl-transpeptidase, glycemia, blood urea nitrogen, serum uric acid (SUA), serum creatinine, glomerular filtration rate, white blood cell count, red blood cell count, were also assessed. We tried to correlate the QT interval with cirrhosis etiology, severity and the laboratory results and to compare the QT interval in patients with normal and pathological laboratory values. Results: QT max was: 435±43 ms (mean±SD), QTc: 493±46 ms and QTm: 400±40 ms. 26% (10) patients had a prolonged QTmax (>450ms) and 71% (27) a prolonged QTc. The highest values were obtained for QTmax, QTc and QTm in alcoholic cirrhosis and Child-Pugh class C patients. QTc was significant longer in class C patients (520±45 ms) compared to those in class A (462±25 ms) (p=0.027). A good correlation was obtained between QTmax and SUA (7.6±2.27 mg/dl) (r=0.504). Conclusion: Liver disease severity, alcoholic etiology and serum uric acid are QT interval prolonging factors in patients with liver cirrhosis.

72
O68 Primary and Secondary Repolarization Changes in Left Ventricular Hypertrophy: a Model Study Ljuba Bacharova1, Vavrinec Szathmary2, Anton Mateasik1 1 International Laser Center, Bratislava, Slovak Republic 2 Institute of Normal and Pathological, Physiology SAS, Bratislava, Slovak Republic Background: In this model study we present primary and secondary changes of repolarization obtained by means of a model simulation of anatomical and electrical changes attributed to left ventricular hypertrophy (LVH). Material and Methods: The model defines the geometry of cardiac ventricles analytically as parts of ellipsoids, and allows changing the dimensions of ventricles, the conduction velocity (CV) in myocardium and the duration of action potential (AP). Three types of anatomical LVH were simulated: concentric and eccentric hypertrophy, and dilatation. Primary repolarization changes were simulated by prolongation of the AP duration. Secondary repolarization changes were simulated by slowing the CV in layers of the left ventricle representing the Purkinje fiber mesh and the working myocardium. The outcomes of the model are presented as time courses of the spatial T vector magnitude, vectorcardiographic T loops and derived 12-lead ECGs. Results: The sole changes in anatomy had only a minor effect on the duration of T wave and/or QT interval, and only a slight increase in the spatial T vectors magnitude was observed in the eccentric LVH. The AP prolongation caused T wave and QT prolongation with a minor effect on the T vectors magnitude (the primary repolarization changes). The slowed CV affected the T wave and QT duration as well as the T vector magnitude (the secondary repolarization changes). The primary repolarization changes were characterized by wide T loops especially in the sagittal plane. The secondary repolarization changes resulted in narrow T loops with increased maximum T vector magnitude, the T loop orientation was shifted to the right, anteriorly and upward. Conclusion: We demonstrated that both AP duration and CV changes remarkably affected T wave duration and morphology, and QT duration. The primary and secondary repolarization changes differed in the pattern of repolarization changes. The LVH affects both depolarization and repolarization; therefore the interplay of these two processes needs to be considered in the interpretation of the T wave and QT interval changes in patients with LVH.

73
O69 Ventricular Repolarization Durations in Fibrillating and Nonfibrillating Cats under Experimental Coronary Occlusion Olesya Bernikova1,2, Ksenia Sedova1, Natalia Kibler1, Jan Azarov1,2 1 Institute of Physiology, Komi Science Center Ural Branch Russian Academy of Sciences, Syktyvkar, Russia 2 Komi Branch of Kirov State medical Academy Objective: The aim of the present study was to estimate the repolarization durations in ischemic, borderline and normal zones and dispersion of repolarization under experimental coronary occlusion in order to detect predictors of fatal ventricular rhythm disturbances. Methods: Using needle plunge electrodes, unipolar electrograms were recorded in subepicardial, midmyocardial, and subendocardial ventricular layers in spontaneously beating hearts of 11 anesthetized open-chest cats. Activation times as dV/dt min during QRS, end of repolarization times as dV/dt max during ST-T, and activation-recovery intervals (ARIs), as the time interval between the activation and end of repolarization times were measured in total of 88 myocardial leads. The data were obtained at baseline, at 1 and 30 min after left anterior descending artery (LAD) ligation, and at 1 and 30 min of reperfusion. Results: Four out of eleven cats demonstrated ventricular fibrillation within first 5 min of reperfusion. During coronary occlusion and at 1 min of reperfusion, a significant uniform ARI shortening (P < 0.05) was found in all myocardial layers of the ischemic zone of fibrillating as well as nonfibrillating animals while no significant changes of ARIs were observed in the normal zone. In nonfibrillating cats, the borderline ARIs did not change significantly with only slight tendency to shortening. In contrast, in fibrillating cats, the ARIs in the borderline zone increased significantly in the subepicardium at 30 min of occlusion and 1 min of reperfusion, and in the midmyocardium at 30 min of occlusion (P < 0.05). The opposite changes of ARIs in the ischemic and borderline zones led to a greater dispersion of repolarization durations in fibrillating animals as compared to nonfibrillating animals. Conclusion: Thus, the data of the present study suggested that the local prolongation of repolarization in the borderline zone could predispose to ventricular fibrillation in the setting of myocardial ischemia-reperfusion presumably due to the increase of repolarization dispersion.
74
O70 Variability of Early and Late Phases of Repolarization as Prognostic Markers of Cardiac Death in Patients with Anterior Myocardial Infarction treated with Primary PCI- Results of Prospective 36 Months Follow-up. Krzysztof Szydlo, Krystian Wita, Maria Trusz-Gluza, Zbigniew Tabor Medical University of Silesia, Katowice, Poland Recent studies showed, that repolarization variability might be regarded as a marker of unfavorable prognosis in patients after acute myocardial infarction (MI). However, there is still a lack of data on the variability of early (QT peak) and late phase (TpeakTend) of repolarization. Methods of repolarization variability measurement are also under discussion. The purpose of this study was to analyze prospectively if repolarization variability measured from one hour of nighttime period, may be useful as a predictor of cardiac death in patients with anterior AMI treated with primary PCI. Methods: The study population consisted of 115 patients with first anterior MI (87 males, age: 58±11 years, LVEF: 41±7%) treated with primary PCI of LAD. Holter recordings were performed in the 5th day of AMI. Repolarization variability was measured as a standard deviation of QT, QTpeak and TpeakTend uncorrected and corrected to the heart rate (QTSD, QTpeakSD, TpeakTendSD), and was assessed from 1 hour (between 1-4 a.m.) in which ST-T segment facilitated automatic beat-to-beat analysis of more than 95% of recording. All subjects were observed prospectively during 36 months follow-up. Results: During follow-up 10 cardiac deaths occurred and 105 subjects were alive: age- 63±13 vs. 58±11 years, p=0.22 and LVEF: 35±7% vs. 41±7%, p=0.01; respectively. All study parameters were significantly higher in patients who died: QTSD- 13.5±4 ms vs. 10.2±4 ms, p=0.007; QTpeakSD- 12.3±4 ms vs. 10.2±4 ms, p=0.045; TpeakTendSD- 11.2±2.8 ms vs. 8.7±1.7 ms, p=0.051. Receiver Operating Characteristics and Univariate logrank Cox analyses for continuous variables were performed to obtain predictive values of study parameters. Cut-off value for QTSD= 15 ms with sensitivity= 30%, specificity= 94%, positive predictive values= 33%, negative predictive value= 93%; hazard ratio= 1.08 (95%CI: 1.01-1.16; p=0.03). Cut-off value for QTpeakSD= 15 ms with: sensitivity= 30%, specificity= 95%, positive predictive values= 38%, negative predictive value= 94%; hazard ratio= 1.07 (95%CI: 0.99-1.17; p=0.06). Cut-off value for TpeakTendSD= 11 ms with: sensitivity= 50%, specificity= 96%, positive predictive values= 75%, negative predictive value= 88%; hazard ratio= 1.34 (95%CI: 1.23-1.49; p=0.001). Conclusions: Variability of the entire, early and late phases of repolarization processes were found to be powerful prognostic markers of cardiac death in patients after acute anterior infarction. Data from one hour of analysis seem to be sufficient for the stratification in such patients.

75
O71 QT Dynamicity is Increased in the Conscious Rabbit with Heart Failure during Heart Rate Increase. Mari Watanabe, Noriko Niwa, Tomofumi Kimotsuki, Martin Hicks, Michael Dunne, Mark Knuepfer, Stuart Cobbe 1 St. Louis University 2 Washington University in St. Louis 3 Glasgow Royal Infirmary Background: An increased QT/RR slope, also called QT dynamicity, should increase susceptibility to sudden cardiac death based on mathematical modeling. There is clinical data to support this theory in post-AMI patients. We recently showed that QT dynamicity was significantly greater in conscious rabbits with ischemic heart failure compared to sham operated rabbits, when heart rate was increased using intravenous isoproterenol. We questioned whether the same were true during heart rate increased by startle. Methods: New Zealand White rabbits underwent coronary ligation (n=8) or sham surgery (n=8), and implantation of a pediatric pacemaker lead in the right ventricle. Eight weeks after surgery, ECG recordings were made from the pacemaker lead while the unsedated rabbit sat in an enclosed box. Heart rate was increased by suddenly shaking the box. RR and Q to T peak (QT) intervals were measured from the ECG, and the QT/TQ slope was calculated. Results were analyzed with that obtained during isoproterenol-induced heart rate increase using two-way ANOVA with repeated measures. Results: The ligated rabbits had lower LVEF (p<.0001) and higher baseline heart rate (p<.05) than sham rabbits as expected. Minimum RR and RR change achieved by drug and startle was similar between ligated and sham rabbits (p=0.1). For the segment of the QT vs RR plot where both were decreasing, rate of change of RR (dRR/dt) was smaller for ligated rabbits (F=6.8, p=.02). Nevertheless, QT/RR slope was steeper for ligated rabbits (1.13 +/- s.d. 1.09 vs .38 +/- .27, F=7.7, p=.02). We observed continued shortening of QT after minimum RR was reached. For that segment of the plot, dRR/dt was similar (F=3.7, p=.08), but the QT/RR slope of ligated rabbits was again steeper (-.65 +/- .52 vs -.32 +/- .20, F=6.8, p=.02). Post-hoc tests revealed no significant differences between subgroups. In contrast to previous results with isoproterenol, startle data analyzed independently showed no significant difference in QT/RR slope between sham and ligated rabbits. Conclusion: The QT/RR slope during a heart rate increase is greater in heart failure rabbits, suggesting a mechanism for the increased propensity for arrhythmic death in heart failure in man.

76
O72 Characterization of the Electrocardiographic Pattern of Individuals with Cerebral Palsy Carlos Alberto Pastore, Nelson Samesima, Rodrigo Imada, Marta Reis, Maria Teresa Santos, Maria Cristina Ferreira, Cesar Grupi, Fernanda Fumagalli, Jaqueline Wagenfuhr, Maira Chammas Heart Institute (InCor) - Hospital das Clinicas da Faculdade de Medicina - Universidade de Sao Paulo, Brazil Background: This study aims to define the electrocardiographic aspects of individuals with cerebral palsy (CP), since little is known about this subject, despite the high prevalence of the disease found in the literature (2.08 to 3.6/1000 individuals). Methods: Ninety two children with CP underwent clinical examination and 12-lead rest ECG. Electrocardiographic data on rhythm, heart rate (HR), PR interval, QRS duration, P/QRS/T axis, and QT, QTc and Tpeak-end intervals (minimum, mean, maximum, and dispersion) were manually measured by a trained cardiologist blinded to the clinical data, then analyzed and compared with those from 35 normal children (C). Fisher’s and Mann-Whitney’s tests were used respectively to compare categorical and continuous data. Results: Groups CP and C did not significantly differ in age (9 plus/minus 3 vs 9 plus/minus 4) and male gender (65 percent vs 49 percent). Results from Group CP were all within the normal range. ECG findings are displayed in Table 1. Significant differences were seen in HR, PR interval, QRS duration, QRS axis, T-wave axis, QTc mean interval, and minimum and mean Tpeak-end intervals. Conclusion: ECG results from this cerebral palsy population, despite being within normal values, showed increased HR, higher QTc mean interval, lower PR interval, shorter QRS duration, and lower minimum and mean Tpeak-end intervals when compared to a population of normal children. Also, QRS axis and T axis were found to be in a more horizontal position.

77
POSTER ABSTRACTS JUNE 03, 2010 09.00-17.00 P1 L-NAME Inhibits Spontaneous Constriction and Relaxation Induced by Elaidic Acid in Isolated Human Coronary Arterial Tissue Jeng Wei1,5, Yi-Hsuan Huang1, Chien-Song Tsai3, Chih-Hsueng Hsu4, Yao-Chang Chen2, Fu-Chi Chan1, Cheng-I Lin1 1 Institute of Physiology, National Defense Medical Center, Taipei, Taiwan, ROC 2 Dept. of Biomedical Engineering, National Defense Medical Center, Taipei, Taiwan, ROC 3 Dept. of Surgery, Tri-Service General Hospital, Taipei, Taiwan, ROC 4 Dept. of Medicine, Tri-Service General Hospital, Taipei, Taiwan, ROC 5 Heart Center, Cheng-Hsin General Hospital, Taipei, Taiwan, ROC Background: Human coronary arterial (HCA) tissue is known to develop spontaneous phasic constrictions in vitro. The present investigations aimed to explore the action of elaidic acid (monounsaturated trans fatty acid) on HCA tissues obtained from 11 patients with dilated cardiomyopathy and one with ischemic heart disease underwent cardiac transplantation. We also used the HCA smooth muscle cells (purchased from Cell Applications, USA) to study the cellular effects of elaidic acid. Materials and methods: Twenty-four arterial rings 3-4 mm in length were cut vertically and connected to a force transducer. The preparations were perfused in normal [K]o (4 mM) Tyrode solution at 37 degree centigrade and subjected to a steady resting tension of 1 gram for at least 30 min before experiment. Results: In 9 out of 20 HCA preparations, rhythmic phasic contractions developed with a peak contractile tension of 335±83 mg (mean±SE) and a spontaneous cycle length of 6.9±0.7 min. In 5 HCA preparations, spontaneous constrictions occurred when [K]o of the perfusate was elevated to 20 mM (cycle length 4±0.6 min). Seven preparations developed only steady tonic constriction. Whole-cell voltage-clamp technique used on single HCA smooth muscle cells revealed absence of a Cs+-sensitive pacemaker current on hyperpolarizing voltage step from -80 to -120 mV. Voltage-dependent outward K+ currents (IKV) on depolarization from a holding potential of -80 mV to test potentials ranging from -50 ~ +80 mV were significantly enhanced in the presence of elaidic acid, indicating an increased outward K+ currents by elaidic acid. But inward rectifier K+ currents (IK1) induced by hyperpolarizing steps from a holding potential of -40 mV to test potentials ranging from -20 to -120 mV were not changed by exposure to elaidic acid, in contrast to the enhanced IK1 currents in the HCA smooth muscle cells exposed to 10 M docosahexaenoic acid (DHA, a polyunsaturated FA). In another series of experiments, 3 out of 4 HCA preparations develop spontaneous constrictions when treated with 1 M PGF2-alpha in normal [K]o Tyrode solution (cycle length 3±0.6 min). Elaidic acid (100-300 µM) induced relaxation of tonic constriction by 29±5 and the spontaneous cycle length became longer (18±4 min). NG-nitro-L-arginine methyl ester (L-NAME, 30-100 µM), an inhibitor of nitric oxide (NO) synthase, could inhibit both tonic and phasic constriction in the presence of elaidic acid in 8 preparations. Conclusion: Our results suggested that NO may be involved in the relaxing and constrictive responses to elaidic acid through changes in K+ conductance in HCA.

78
P2 Peculiarities of ECG P-wave Morphology Analysis Using Principal Component Analysis Algimantas Krisciukaitis, Renata Simoliuniene, Alfonsas Vainoras, Liudas Gargasas Kaunas University of Medicine ECG P-wave reflects propagation of electrical excitation wave through the atria, which could be varying due to the autonomous heart control in aim to adapt the heart rate to meet the momentary needs of the organism. This rate is the result of permanent interplay between sympathetic and parasympathetic influences, realized as release of neuromediators impacting spontaneous automaticity of pacemaker cell groups. The most active cell groups are located in the sinoatrial node, where excitation normally starts from. The innervation of this anatomical site is highest in the atria and it can suppress automaticity of its pacemaker cell groups. Enough active pacemaker groups of the other sites in right atria then will take over the action. As result we will get changes in electrical excitation propagation, reflected as changes in ECG P-wave. We can observe it during changes of postural position (orthostatic test), gravity (weightlessness or hyper gravity during flight) or extreme surrounding conditions (fetal hypoxia). In all cases quantitative evaluation of morphological changes in P-wave could be of great clinical importance. Principal component analysis (PCA) is concentrating interrelated variables (original samples of ECG cardiocycles) into few orthonormal vectors. Coefficients of these vectors are quantitative estimates of the shape. The aim of this study is to illustrate how PCA could be used for ECG P-wave shape evaluation. We used from one to twelve lead ECG recordings of cardiological patients during active orthostatic test and of healthy persons during passive orthostatic test. We found formation of array of P-wave samples as one of the most important procedures in all analysis. Morphological variation we interested in must remain the only or major variation in the arrays of P-waves because PCA works effectively only with few first components. Exact alignment in time of excerpts with P-wave samples maximizing correlation was absolutely necessary for the analysis. PCA revealed morphological variation in the first half of the P-wave correlating with most external factors which should evoke changes of excitation propagation. It complies with the data that only first half (or first third) of P-wave represents excitation propagation in the right atria. Excitation of the left atria, which usually remains stable, joins the game during the second half. We also found that in some cases even one lead ECG is enough to reveal important morphological changes showing features of autonomous regulation of cardiac activity.

79
P3 Detection of Fiducial Points in Synchronous Recordings of Electrocardiogram, Seismocardiogram and Impedance Cardiogram by the use of Signal Interrelations Arturas Januauskas1, Arunas Lukosevicius1,2, Liudas Gargasas3, Rimtautas Ruseckas4 1 Biomedical Engineering Institute, Kaunas University of Technology, Lithuania 2 Faculty of Telecomunications and Electronics, Kaunas University of Technology, Lithuania 3 Cardiovascular Research Automation Laboratory, The Institute of Cardiology, Kaunas University of Medicine, Lithuania 4 Cardiovascular Research Automation Laboratory, The Institute of Cardiology, Kaunas University of Medicine, Lithuania Background: Study presents an application of fiducial point’s detection in synchronously recorded ECG, SCG and ICG signals by the use of signal interrelations. Materials and methods: An algorithm consists of signal de-noising and feature enhancement by the means of ensemble empirical mode decomposition method (EEMD) and the following finding of 20 fiducial points in ECG, SCG and ICG signals using interrelations of these signals. All these cardiological signals are closely related to each other and reflect function of the heart in a different way, which allow to evaluate its electric (ECG), blood circulation (ICG) and mechanical (SCG) properties. Signals were synchronously recorded under usual clinical conditions using portable ECG, SCG, and ICG recording device from the patients in the various wards. Stored signals were off-line processed, including EEMD based feature enhancement in order to enhance signal to noise ratio, and fiducial points were detected in a beat to beat basis by using time relations between all three signals. QRS onset, QRS offset, R peak, T peak, T peak end were found in ECG signals. AS, MC, IM, AO, RE, AC, MO, RF fiducial points were found in SCG signals. Q, B, dZ/dt maximum, F, X, Y, O fiducial points were found in ICG and its derivative signals. The following time intervals were automatically calculated based on detection results: - preejection period (PEP), - left ventricular ejection time (LVET), - left ventricular filling time (LVFT), - isovolumetric contraction time (IVCT), - isovolumetric relaxation time (IVRT), - rapid ventricular filling time (RVFT). Results: The method was applied to 40 ECG, SCG and ICG records. In some of the cases clinical experts marked all mentioned fiducial points in 1-2 cardiac cycles and this information was used for comparison with automatically calculated results. In majority of the cases automatically calculated time intervals fall in 10% accuracy limits. This is acceptable result since beat to beat fluctuations is normal and reference was found only for 1-2 cycles. Detection of AC, MO and RF fiducial points in SCG was the most problematic because of unclear definition of position in the signal and because of signal forms variety. Automatic calculation of IVRT and RVFT time intervals is thus still problematic. Conclusions: Presented application showed acceptable results in automatical detection of ECG, SCG and ICG fiducial points in a beat to beat basis. Results allows for conclusion that on the basis of this investigation a clinical device could be developed and used in clinical practice.

80
P4 Early Repolarization – an Independent ECG Signature? Siegfried Perz1, Christian Hengstenberg, Roswitha Küfner1, Annette Peters2, Wibke Reinhard, Moritz Sinner, Karl-Hans Englmeier1, H.-Erich Wichmann2, Stefan Kääb 1 Institute for Biological and Medical Imaging, Helmholtz Zentrum München - German Research Center for Environmental Health, Neuherberg, Germany
2 Institute of Epidemiology, Helmholtz Zentrum München - German Research Center for Environmental Health, Neuherberg, Germany 3 Klinik und Poliklinik für Innere Medizin II, Universitätsklinikum Regensburg, Regensburg, Germany 4 Medical Department I, University Hospital Munich, Campus Großhadern, Munich, Germany Background: Early repolarization (ER) – a common electrocardiographic finding defined by J point elevation >0.1 mV in at least two leads with slurring or notching morphology – was considered benign until it has been recently associated with idiopathic ventricular fibrillation and sudden cardiac arrest. Objective: In order to investigate whether ER is an independent ECG signature, we aimed to examine whether ER patterns are associated with other measurements derived from the conventional computerized ECG analysis. Methods: Twelve lead resting ECGs of 889 men and women aged 35-74 years – from the population-based MONICA/KORA studies S1 and S2 - were manually analyzed by two cardiologists for the presence of ER. The computerized ECG measurements (time intervals, amplitudes, axis) of the ER positive group (n=192) were compared with those of the ER negative group (n=697). Results: Several ECG variables were associated with the presence of ER. The best discriminating computerized measurements for the entire study group were R durations in the leads II, aVR, V5 and V6, S duration in lead V6, R’ duration in lead aVR, R amplitude in lead aVR, S amplitude in lead V6, QRS area in lead aVR (p<0.001 for all analyses). Interestingly, some measures derived from lead aVR, which was not considered for visual analysis, showed highly discriminating power between the ER positive and the ER negative group. In addition, the ECG variables associated with the presence of ER differed between men and women, although identical ER criteria were used. Out of the 176 quantitatively assessed ECG parameters, significant differences between ER positive and ER negative subjects were observed for 66 parameters in men and only 33 parameters in women, respectively (p<0.05). Conclusion: ER is to a major extent associated with ECG characteristics beyond the changes at the ST-T junction in specific leads. This result supports the hypothesis that ER is caused by a general transmural heterogeneity which affects many ECG parameters, however, to a certain extent with differences between men and women.

81
P5 Performance Improvement of a Phase Space Detection Algorithm for ECG Wave Morphology Classification Alberto Herreros, Enrique Baeyens, Pedro Riverta, Rolf Johansson 1 Automatic Control. Institute of Advanced Manufacturing Technologies. University of Valladolid. Spain 2 Division of Biomedical Engineering. CARTIF Foundation. Spain 3 Department of Automatic Control. Lund University. Sweden An algorithm based on embedding phase space signal was developed by the authors in previous works. The algorithm detects the characteristic points of the waves of a multi-lead ECG. In the present work, the parameters of this algorithm are optimized in order to improve its performance. The algorithm uses two configurable parameters to obtain the phase space---the dimension of the phase space and the delay---and a threshold to select the points of the ECG. By a proper selection of these parameters the algorithm obtains all the points in the ECG that are similar to a reference one that was selected by the analyst. Several strategies have been developed and incorporated in the phase space algorithm to obtain the optimal values of these parameters based on the sampling rate and the number of leads in the records. The professional only needs to mark the reference point and the associated wave to it, for example, the start and end of a P wave and its peak. The algorithm obtains every P wave of the ECG record and a classification of their morphology using clustering techniques. Moreover, a simple graphical interface has been developed to ease its use. The algorithm was applied to detect the start, peak and end of the P waves of a collection of ECG records of six minutes. Using this information, the algorithm extracts and classifies the P waves by applying clustering techniques to study their variability. The algorithm can also be used online to detect and classify different types of morphologies in any ECG wave. A future use of this algorithm will be the detection of several extra-cardiac pathologies in the ECG Holter, as for example sleep apnea.
82
P6 Descriptors for Complex Fractionated Atrial Electrograms: a Comparison of Three Different Descriptors Christopher Schilling1, Armin Luik2, Claus Schmitt2, Olaf Dössel1 1 Institute of Biomedical Engineering, Karlsruhe Institute of Technology (KIT), Karlsruhe, Germany 2 IV. Medizinische Klinik, Städtisches Klinikum Karlsruhe, Karlsruhe, Germany Catheter ablation of persistent atrial fibrillation (AF) is challenging. The underlying mechanisms are mostly unknown and discussed very controversially. Automated detection and signal analysis of complex fractionated atrial electrograms (CFAEs) is essential in supporting the physicians during the ablation procedure. To investigate the clinical value of descriptors for CFAEs, we calculate their value before and after pulmonary vein isolation (PVI). PVI effects the excitation propagation of AF. This should be detected by every descriptor. We calculated the dominant frequency (DF), the fractionation index (CFE-Idx) and the activity ratio (AR) before and after PVI. Methods: (1) A common analysis technique of AF is DF analysis. It is an estimation of the atrial activation rates. (2) Ensite-NavX provides an algorithm that delivers a CFE-Idx based on the cycle length of distinguishable local activities in one electrogram. (3) A third method calculates atrial activity with a segmentation algorithm based on a non-linear energy operator. CFAEs are marked as active segments. The AR is then defined as the ratio between the length of active segments and the total length of the signal. DF, CFE-Idx and AR were compared on data sets of 17 patients suffering from persistent AF. All patients were sent to hospital for catheter ablation. Electrograms of five seconds were recorded before and after PVI at customary 46 locations per patient in the left atrium. Nine patients terminated during ablation (A), whereas eight patients did not terminate (B) and underwent an external cardioversion. Results: The mean DF decreased from 5.7±0.6 Hz to 5.5±0.3 Hz (A) and increased from 5.3±0.5 Hz to 5.5±0.5 Hz (B). Mean CFE-Idx increased from 157±68 ms to 223±51 ms (A) and from 222±88 ms to 273±72 ms (B). Mean AR decreased from 0.65±0.1 to 0.63±0.04 (A) and increased from 0.69±0.5 to 0.72±0.1 (B). Conclusion: More regular excitation should result in higher CFE-Idx and lower DF and AR. We found intergroup differences and could show the influence of PVI on the excitation during AF. CFE-Idx has shown the most distinct results in differentiation of the two states of PVI (before/after) and also in differentiation of group A to B. Nevertheless, AR and DF are promising alternatives. Removal of outliers will increase performance of AR and DF.
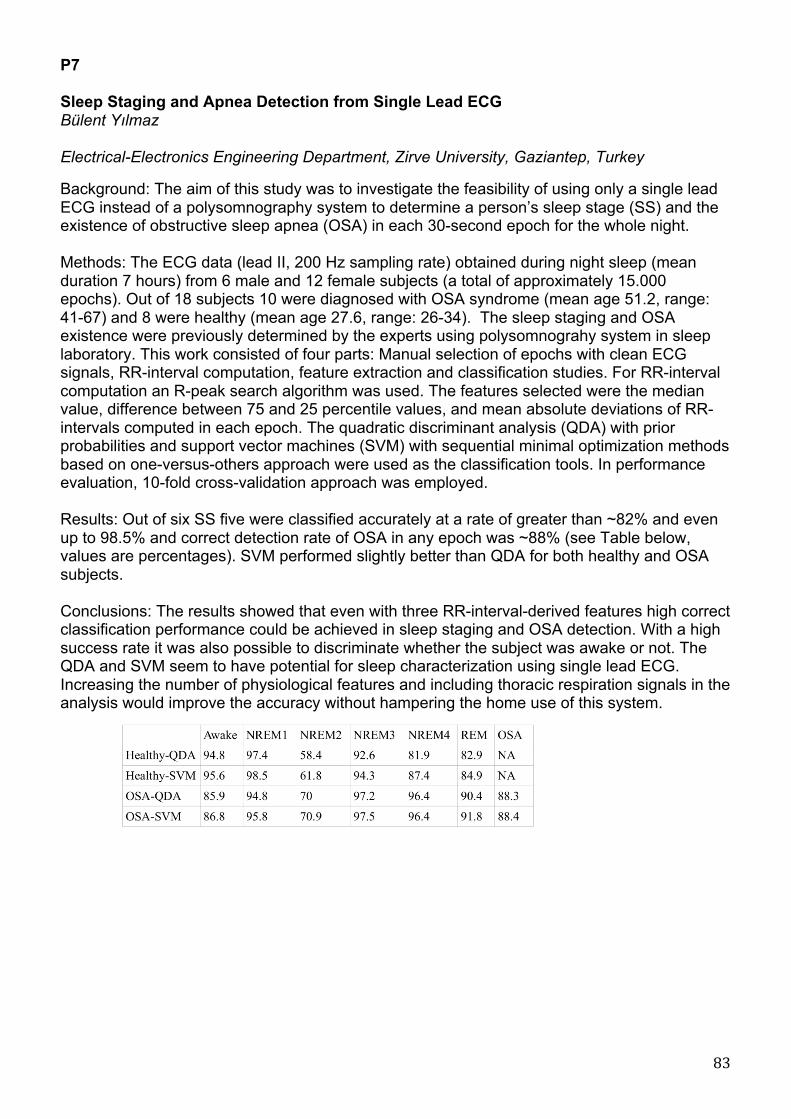
83
P7 Sleep Staging and Apnea Detection from Single Lead ECG Bülent Yılmaz Electrical-Electronics Engineering Department, Zirve University, Gaziantep, Turkey Background: The aim of this study was to investigate the feasibility of using only a single lead ECG instead of a polysomnography system to determine a person’s sleep stage (SS) and the existence of obstructive sleep apnea (OSA) in each 30-second epoch for the whole night. Methods: The ECG data (lead II, 200 Hz sampling rate) obtained during night sleep (mean duration 7 hours) from 6 male and 12 female subjects (a total of approximately 15.000 epochs). Out of 18 subjects 10 were diagnosed with OSA syndrome (mean age 51.2, range: 41-67) and 8 were healthy (mean age 27.6, range: 26-34). The sleep staging and OSA existence were previously determined by the experts using polysomnograhy system in sleep laboratory. This work consisted of four parts: Manual selection of epochs with clean ECG signals, RR-interval computation, feature extraction and classification studies. For RR-interval computation an R-peak search algorithm was used. The features selected were the median value, difference between 75 and 25 percentile values, and mean absolute deviations of RR-intervals computed in each epoch. The quadratic discriminant analysis (QDA) with prior probabilities and support vector machines (SVM) with sequential minimal optimization methods based on one-versus-others approach were used as the classification tools. In performance evaluation, 10-fold cross-validation approach was employed. Results: Out of six SS five were classified accurately at a rate of greater than ~82% and even up to 98.5% and correct detection rate of OSA in any epoch was ~88% (see Table below, values are percentages). SVM performed slightly better than QDA for both healthy and OSA subjects. Conclusions: The results showed that even with three RR-interval-derived features high correct classification performance could be achieved in sleep staging and OSA detection. With a high success rate it was also possible to discriminate whether the subject was awake or not. The QDA and SVM seem to have potential for sleep characterization using single lead ECG. Increasing the number of physiological features and including thoracic respiration signals in the analysis would improve the accuracy without hampering the home use of this system.

84
P8 The Role of the Vagosympathetic Tone in the Repolarization Gradient Development Ksenia Sedova, Sergey Goshka, Jan Azarov, Dmitry Shmakov Institute of Physiology, Komi Science Center Ural Branch Russian Academy of Sciences, Syktyvkar, Russia Objective. It is known that in normal heart there is an electrical spatial heterogeneity of repolarization duration that includes apicobasal and interventricular gradients. In the present study, the effects of -adrenergic and -cholinergic blockade on repolarization gradient of epicardium in rabbit heart in situ were investigated. Methods. The experiments were carried out on nine anaesthetized rabbits (urethane, 1.5 g/kg, ip). Unipolar electrograms were simultaneously recorded from 64 ventricular epicardial leads at spontaneous sinus rhythm at 38°C at baseline state and under pharmacological vagosympathetic blockade. Activation-recovery intervals (ARIs) served as a measure of local repolarization durations. The blockade of -adreno- and -cholinoreceptors in the heart was produced by the administration of propranolol (0.3 mg/kg i.v.) and atropine (0.5 mg/kg i.v.), respectively. Results. Vagosympathetic blockade led to reduction heart rate from 284±51 to 219±34 bpm (p<0.02) and increase of the activation duration of the ventricular surface (p<0.05). The activation sequence of ventricles did not change significantly. Repolarization durations assessed by corrected activation-recovery interval (ARIc) prolonged in left ventricular apex (p<0.02) and posterolateral area (p<0.02), but there were no significant changes in other epicardial regions as compared with baseline state. The blocking of -adreno- and -cholinoreceptors caused the increase of the repolarization time in right and left ventricular zones and the reduction of interventricular gradient of repolarization which is pronounced in the baseline state. Conclusion. The present study demonstrated that cardiac autonomic tone is critical for the development of interventricular repolarization heterogeneity. The study was supported by the Ural Branch of the Russian Academy of Sciences (project No. 09-C-4-1018).
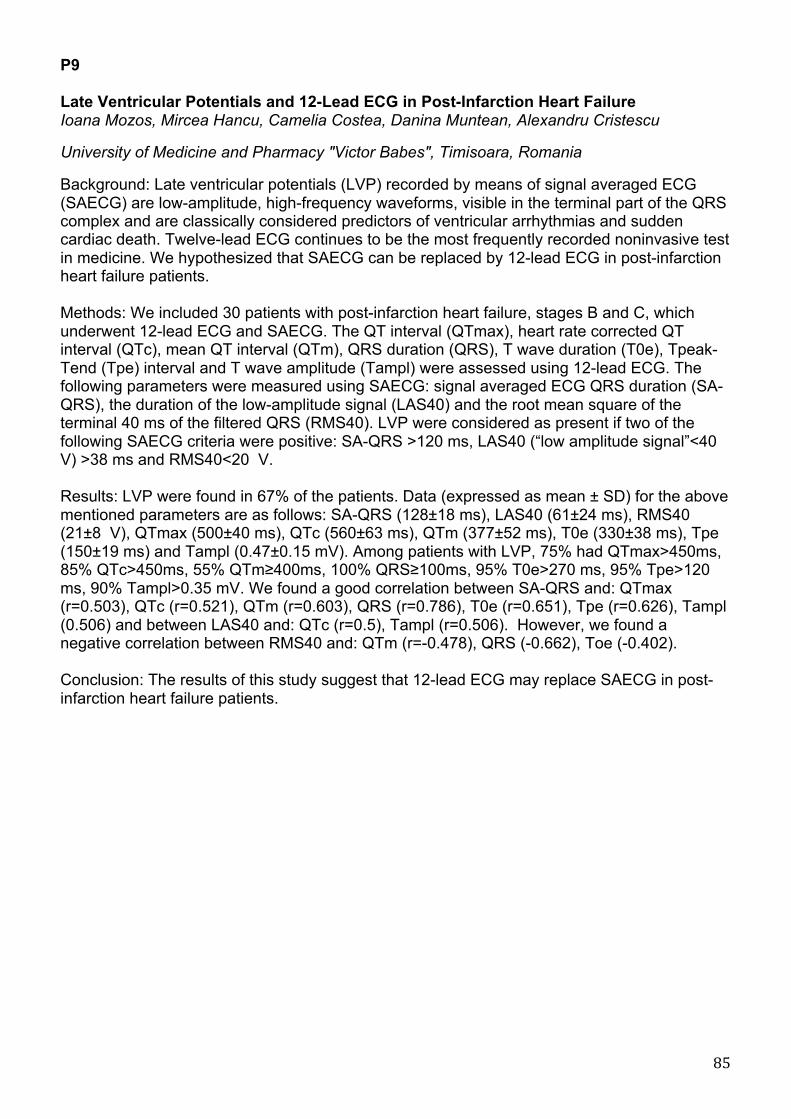
85
P9 Late Ventricular Potentials and 12-Lead ECG in Post-Infarction Heart Failure Ioana Mozos, Mircea Hancu, Camelia Costea, Danina Muntean, Alexandru Cristescu University of Medicine and Pharmacy "Victor Babes", Timisoara, Romania Background: Late ventricular potentials (LVP) recorded by means of signal averaged ECG (SAECG) are low-amplitude, high-frequency waveforms, visible in the terminal part of the QRS complex and are classically considered predictors of ventricular arrhythmias and sudden cardiac death. Twelve-lead ECG continues to be the most frequently recorded noninvasive test in medicine. We hypothesized that SAECG can be replaced by 12-lead ECG in post-infarction heart failure patients. Methods: We included 30 patients with post-infarction heart failure, stages B and C, which underwent 12-lead ECG and SAECG. The QT interval (QTmax), heart rate corrected QT interval (QTc), mean QT interval (QTm), QRS duration (QRS), T wave duration (T0e), Tpeak-Tend (Tpe) interval and T wave amplitude (Tampl) were assessed using 12-lead ECG. The following parameters were measured using SAECG: signal averaged ECG QRS duration (SA-QRS), the duration of the low-amplitude signal (LAS40) and the root mean square of the terminal 40 ms of the filtered QRS (RMS40). LVP were considered as present if two of the following SAECG criteria were positive: SA-QRS >120 ms, LAS40 (“low amplitude signal”<40 V) >38 ms and RMS40<20 V. Results: LVP were found in 67% of the patients. Data (expressed as mean ± SD) for the above mentioned parameters are as follows: SA-QRS (128±18 ms), LAS40 (61±24 ms), RMS40 (21±8 V), QTmax (500±40 ms), QTc (560±63 ms), QTm (377±52 ms), T0e (330±38 ms), Tpe (150±19 ms) and Tampl (0.47±0.15 mV). Among patients with LVP, 75% had QTmax>450ms, 85% QTc>450ms, 55% QTm≥400ms, 100% QRS≥100ms, 95% T0e>270 ms, 95% Tpe>120 ms, 90% Tampl>0.35 mV. We found a good correlation between SA-QRS and: QTmax (r=0.503), QTc (r=0.521), QTm (r=0.603), QRS (r=0.786), T0e (r=0.651), Tpe (r=0.626), Tampl (0.506) and between LAS40 and: QTc (r=0.5), Tampl (r=0.506). However, we found a negative correlation between RMS40 and: QTm (r=-0.478), QRS (-0.662), Toe (-0.402). Conclusion: The results of this study suggest that 12-lead ECG may replace SAECG in post-infarction heart failure patients.

86
P10 Antiarrhythmic Efficiency of Hybrid Therapy in Patients with Atrial Fibrillation Tatiana Novikova1,2, Vladimir Novikov1, Dmitry Perchatkin2 1 Medical Academy of postgraduate studies, St.Petersburg, Russia 2 City Pokrovsky Hospital, St.Petersburg, Russia Purpose of the study: to assess the antiarrhythmic efficiency of hybrid therapy on a background of a permanent cardiac pacing in AAI-mode at fixing an electrode in inferior-posterior part of interatrial septum (IAS) and in the right atrium appendage (RAA). Materials and methods: 20 patients with tachycardia-bradycardia syndrome were inspected. The patients were divided into two groups: 1st group - 10 patients with the electrode in RAA, 2nd group - 10 patients with the electrode in IAS. The interatrial contractility delay (IACD) was calculated by using echocardiography before and after 7 days of pacing. The number of atrial fibrillation episodes per 1 month (AFE) were assessed during 1 month before pacing, after 1 month of pacing (without antiarrhythmic therapy) and after two months of pacing (with the sotalol treatment for 1 month – hybrid therapy). Results: The average of IACD in the 1st group was increased: 40,9±23,3 after 7 days of pacing vs. 23,6±10,2 before pacing (p=0,040) while in the 2nd group IACD was decreased: 2,8±11,9 vs. 24,0±8,8 (p<0,001), respectively. The average number of AFE after 1 month of pacing did not changed in the 1st group: 2,1±0,8 after pacing vs. 2,2±0,8 before pacing (p=0,780) while it was decreased in the 2nd group: 1,6±0,9 vs. 2,1±1,0, respectively (p=0,016). The average number of AFE after two month of pacing (1 month of hybrid therapy) was decreased in both groups. In the 1st group it was 0,8±0,7 after 2 months of pacing vs. 2,1±0,8 after 1 month of pacing (p=0,006), in the 2nd group 0,6±0,6 vs. 1,6±0,9 (p<0,001), respectively. Conclusion: AAI-mode cardiac pacing with the electrode fixation in IAS increase the atrium contraction synhronization and reduce the number of AFE. Hybrid therapy reduce the number of AFE with no dependence of the electrode fixation place.

87
P11 Effects of Short-Term Versus Two-hour Pacing of the Right Ventricular Apex on Repolarization and Hemodynamics of the Canine Heart Alena Tsvetkova, Natalya Kibler, Alexey Ovechkin, Jan Azarov, Dmitry Shmakov Institute of Physiology Komi SC UB RAS, Syktyvkar, Russian Federation Purpose: We hypothesized, that in comparison with short-term stimulation an increasing of the pacing time of the right ventricular (RV) apex could modify the electrical properties of the ventricular myocardium resulting in the decrease of cardiac pump function. Materials and methods: Epicardial monofocal RV apex pacing was done (3.5 V, 2 ms, 150 bpm) in 8 mongrel anesthetized dogs. The unipolar ventricular electrograms were recorded in 1 minute (short-term pacing) and in every 15 minutes during the two-hour pacing with the aid of multiple plunge electrodes (total 64 leads). Hemodynamic patterns and ECG were registered using Prucka Mac-Lab 2000 (GE Medical System, GmbH) simultaneously. Results: The activation-recovery intervals (ARIs) in the RV apical myocardium were significantly shorter than those in the RV basal zone under the supraventricular rhythm. At short-term pacing, the prolongation of the ARIs in the early-activated area (the pacing site) was found; however, those changes did not result in the modification of the apex-to-base ARI distribution. At the same time, the short-term pacing led to a significant decrease of the maximal systolic pressure, dP/dtmax and dP/dtmin in both ventricles, but was not associated with the changes of cardiac output. In the course of the two-hour pacing, phasic alterations of the repolarization durations in the early-activated area (shortening in 30 min, prolongation in 75 min, and shortening in 90 min after the pacing onset) resulting in the modification of the apex-to-base ARI distribution were observed. Moreover, the two-hour pacing of RV apex led to a significant decrease of the maximal systolic pressure, dP/dtmax and dP/dtmin in the left ventricle, as well as to the mean arterial pressure and cardiac output reduction. Conclusions: Thus, the two-hour pacing of the right ventricular apex led to the deterioration of both cardiac and systemic hemodynamics in contrast to the short-term pacing that did not result in the cardiac output reduction. These hemodynamic changes were accompanied by the phasic alterations of the repolarization durations.

88
P12 Experimental Study of using Thermovision Method in Interventive Cardiology and Cardiac Surgery Practise Vincentas Veikutis, Tomas Mickevicius, Aurimas Peckauskas, Kristina Morkunaite, Andrius Rackauskas, Augusta Petrusaite, Simonita Maciulskyte Kaunas university of medicine, Lithuania Background: The aim of the study was to determine optimal characteristics of new non-contact micro temperature registration method and possibilities to estimate the destruction effect of RF energy to different heart structures in animal model. Methods: 10 unisex mongrel dogs and 6 pigs were used for experimental study. RF ablation procedure was performed by using RF energy generator OSYPKA HAT 200S and standard endocardial and refrigerate epicardial ablation electrodes (Medtronic). The effects of ablation on cardiac tissues and vessels were observed visually, whereas the microtemperature changes on epicardial surface were supervised and registered as thermogramme with thermovision device “A20V”(FLIR Systems), resolution ≤0.2°C. Results: The left coronary descending artery and bilateral pulmonary veins of different diameter were chosen to observe the RF energy effect. We used 7-12W energy diapason for testing isolation procedure in pulmonary vein zone. It was enough to use 10W energy at 15-30 sec. exposition to get stabile isolation line and effect in 2-3 mm tissue diameter through its depth on epicardial surface of atrium that was correctly observed in thermogramme. During the RFA procedures thermoeffect parameters in the area of pulmonary veins were similar as in the free wall of the atria, but the area of destruction was 20-30 % greater and directed parallel to pulmonary veins inflow into the atrium. It appears that energy spread configuration is not equal in different cardiac tissues: complete and especially partial damage area is not dotted but really wider. After ligation of coronary artery we observed a correctly contrasted place in thermogram, it was the nutritional basin of ligated coronary artery, which was visibly cooler. Investigation showed that comparatively inconsiderable tissue temperature anisotropy originating after acute myocardial ischemia or infarction. In 4 cases, when temperature anisotropy overrun 2°C we observed ventricular fibrillation. Conclusions: We determined optimal RF energy parameters and characteristics of different electrodes by effecting heart vessels, epicardial atria and ventricle structures by using of thermovision system. We approved the objective way of early perioperative thermoangiography, which allows localization and grade of coronary stenosis or occlusion, function and throughput of autovenous bypass grafts in cardiac surgery practice.

89
P13 Ablation of Left Atrial Tachycardia with Cycle Length Alternans Occurring after Atrial Fibrillation Ablation: Significance of Fractionated Electrogram Mapping Evgeny Mikhaylov, Dmitry Lebedev Almazov Federal Heart, Blood and Endocrinology Centre, St.Petersburg, Russia Background: Atrial tachycardia (AT) with cycle length alternans occurring after ablation of longstanding persistent atrial fibrillation (LSPAF) has not been described. We sought to investigate significance of 3D activation, entrainment and fractionated electrogram mappings as guidance in ablation of stable left AT with alternating cycle length developing after AF ablation. Materials and methods: Between April 2007 and January 2010 56 patients underwent 68 ablation procedures for left AT developed after AF ablation. In 5 (7.3%) cases stable AT consisted of two alternating cycles was registered. Cycle alternans was considered when two cycles followed one after another, and difference between cycles was at least 15 ms. All 5 patients had previously underwent 1-2 ablations of LSPAF with pulmonary vein isolation, roof and mitral isthmus ablation, coronary sinus ablation and ablation of sites with complex fractionated electrograms in left and right atria. During the procedure consecutive 3D activation mapping of both AT cycles was initially performed. Then an attempt of entrainment mapping was performed. Mapping of sites with fractionated and double electrograms was carried out as the last approach. In a case of clear mechanism of an AT, radiofrequency ablation was performed according to activation and/or entrainment mapping. Otherwise sites with fractionated activity were targeted for ablation. Results: The mean AT alternating cycles were 246±25 and 285±36 ms. Extended entrainment mapping was complicated in all patients due to lack of sites with stable capture and appearance of postpacing interval shorter than any AT cycle. In one patient entrainment pacing transiently changed the AT into another AT. The activation maps of an AT fully covered both cycles only in 1 patient, however ablation at a common for both cycles area (septal wall), converted the AT into a different AT. In another patient the activation map revealed centrifugal propagation of both cycles from the same point. The activation map in third patient showed centrifugal propagation of one cycle. Fractionated electrogram-guided ablation successfully terminated AT in 4 (80%) patients. Thus, in 2 patients the initial activation map facilitated fractionated signal mapping and successful ablation. A mean number of ablations for termination was 3.25. Conclusion: AT with cycle length alternans developing after excessive LSPAF ablation is a complex tachyarrhythmia, usually is unmappable utilizing activation and entrainment approaches. Fractionated electrogram-guided ablation seems to be a reasonable approach in treatment of this type of AT.

90
P14 Age-specific Changes of Electrical Heart Activity of ISIAH Rats Anastasia Rasputina1, Irina Roshchevskaya1, Lyudmila Ivanova2, Arkady Markel2 1 Komi Science Centre, UD,RAS 2 Institute of Cytology and Genetics, SD, RAS Background. The goal of this work was to investigate age-specific alterations of heart ventricular depolarization and repolarization in rats with inherited stress-induced arterial hypertension (ISIAH). Materials and methods. Body surface potential mapping was done in ISIAH rats at the age of 1, 14 and 28 days of postnatal ontogenesis. Cardiopotentials were recorded from 32 needle subcutaneous electrodes uniformly distributed on the chest. Results. Body surface cardioelectric field during ventricular depolarization formed in ISIAH rats at the age of 1, 14 and 28 days on -7-11 ms before the RII-peak. Three phases of depolarization were detected by the beginning and ending of two inversions of cardiopotentials. The initial and terminal phases decreased from 1 to 14 days from 7±1.5 and 6.78±2.32 ms to 4.69±0.78 and 4.44±0.81 ms, correspondingly (p<0.05), and then increased to the age of 28 days to 6.78±2.15 and 5.56±1.53 ms; the middle phase didn’t change with age. Depolarization decreased from 1 to 14 days (from 19.63±2.32 to 15.63±1.41 ms, p<0.05) and then increased to 18.78±2.14 ms (p<0.05). Before 3.65 ms (1-day old rats) and 0.89-0.61 ms (14- and 28-days old rats) to the end of depolarization positive and negative zones of cardiopotentials began to shift and this moment was suggested as the beginning of ventricular repolarization. Cardioelectric field that is typical for repolarization formed in ISIAH rats of 1, 14 and 28 days in different moments. In 1 day-old rats cardioelectric field with cranial situation of electronegativity and caudal distribution of electropositivity formed on 28.4±3.6 ms after the repolarization beginning – at the moment of TII-wave beginning; during STII segment the distribution of cardiopotentials’ zones had an unstable character. In 14- and 28-days old rats cardioelectric field formed on 2.53±1.1 and 1.72±0.9 ms after the repolarization beginning; during STII segment and TII-wave positive area was situated caudally and negative – cranially. STII segment decreased from 1 to 14 days from 24.34±4.14 to 12.88±1.86 ms (p<0.05) and then to 2.72±2.3 ms in 28-days old rats, TII-wave didn’t change with age. Conclusion. In ISIAH rats significant age-specific changes of ventricular depolarization and repolarization were revealed that might be the evidence of morpho-functional development of the heart during postnatal ontogenesis with coexisting of an influence of inherited stress-induced arterial hypertension. The age of 14 days was determined as the critical period for development of ventricular electrical activity in ISIAH rats.

91
P15 Pattern of Ventricular Activation on Difference Maps in Children with Chronic Kidney Disease Malgorzata Sobieszczanska1, Krystyna Laszki-Szczachor1, Dorota Polak-Jonkisz2, Anna Janocha3, Leslaw Rusiecki1, Danuta Zwoli ska2 1 Department of Pathophysiology, Wroclaw Medical University, Wroclaw, Poland 2 Department of Pediatric Nephrology Wroclaw Medical University, Wroclaw, Poland 3 Department of Physiology Wroclaw Medical University, Wroclaw, Poland Background. In children with chronic kidney disease (CKD), the cardiovascular complications, mainly heart conduction impairments and arrhythmias, are the most common direct cause of death. A method of body surface potential mapping (BSPM) permits the early detection of disturbances in propagation of cardiac activity within the conduction system, comparing the standard 12-lead ECG. A goal of the study was to demonstrate the differences in heart depolarization propagation in the children affected with chronic renal failure. Material and methods.A study group consisted of 42 patients with CKD (mean age: 15.5±2.1 years) who were subdivided to the following groups: I – patients treated with replacement therapy; IA: 10 hemodialysed patients and IB: 7 patients on peritoneal dialysis; II – 12 patients treated conservatively. The control group comprised 26 healthy children with normal BP and ECG. In the all children, the BSPM registration was performed, providing the isochrones maps of ventricular active activation time (VAT maps). The varying areas of activation propagation in the heart was finally presented using the difference maps showing a result of the comparison between the mean VAT values obtained in the particular pairs of the examined groups. Results. Basing on the isochrone lines distribution, it was found that in the patient groups IB and II, a pattern of heart conduction was similar to that typical for incomplete left bundle branch block (LBBB), and the VAT values were slightly prolonged. In the group IA, the pattern of propagation was like in complete LBBB, and the VAT values were significantly prolonged. Creating the maps presenting the significant differences between the mean VAT values in the compared pairs of the patient groups, resulted in finding the areas revealing the essential disparities. Conclusions. In the children with chronic kidney disease treated conservatively and with replacement therapy, conduction disturbances was localized in the left bundle branch, and in the hemodialysed patients, the complete LBBB occurred. BSPM seems to be a useful method in very early diagnosing the changes affecting the heart conduction system in patients with chronic renal failure.

92
P16 Multipolar Maps in Post-infarction Heart Failure Patients Ioana Mozos, Mircea Hancu, Alexandru Cristescu University of Medicine and Pharmacy "Victor Babes", Timisoara, Romania Background: We aimed to assess the changes in body surface maps in post-infarction heart failure patients. Materials and methods: Body surface mapping was performed in 22 post-infarction heart failure patients, stage B and C, and 20 age-matched healthy controls, using a 64 electrodes vest. A card index was made for every patient and person of the control group, containing: isopotential (IPST and IPQRS) and isointegral (IQ40, IQRS, IQRST, IST and ISTT) maps. The number and absolute value of maxima and minima were assessed for every map. Results: Only bipolar maps (bp) were recorded in the healthy control group; mp were found in 55% (12) of the heart failure patients (mp with multiple minima, multiple maxima or both multiple minima and maxima). All patients with mp IQRST, had also mp IPST, 67% mp IPQRS, 33% mp IQ40, 17% mp IQRS, 67% mp ISTT, 50% mp IST maps. Significant differences were noticed in maxima and minima in heart failure patients compared to healthy controls (IQ40 maxima: 14±9 mV.ms in heart failure patients vs. 16±3.8 mV.ms in healthy controls, p=0.014). We found significant different IPST minima and IST maxima in heart failure patients with mp IQRST maps compared to those with bp IQRST maps. IQRST maxima (119±48 mV.ms vs. 68±17 mV.ms, p=0.0026) and minima (-72±28 mV.ms vs. -40±10 mV.ms, p=0.0057) were also significant different in patients with mp IQRST maps compared to those with bp IQRST maps. IQ40 maxima (7.5±3.4 mV.ms vs. 17±7.8 mV.ms, p=0.00054) and minima (-5±2.44 vs. -19±11.7 mV.ms, p=0.006) and IQRS minima (-26±11 mV.ms vs. -47±28 mV.ms, p=0.038) were significant different in heart failure patients with mp IQ40 vs. IQRS maps compared to those with bp maps . Ventricular arrhythmia appeared in 18% (4) of the heart failure patients. Patients with mp IST maps were more likely to die suddenly than patients with mp IQRST maps (OR=2.5, 95%CI=0.125-49.86), mp IPST maps (OR=3, 95%CI=0.153-58.74) and mp IPQRS maps (OR=2, 95%CI=0.097-41). Conclusion: Post-infarction heart failure is associated with an increased prevalence of multipolar maps and causes significant changes of maxima and minima. Multipolar isointegral ST maps are better predictors of sudden cardiac death compared to multipolar IQRST, IPST or IPQRS maps.

93
P17 T-wave Alternans Simulation by Change in Action Potential Time Duration Dariusz Janusek1, Michal Kania1, Roman Kepski2, Roman Maniewski1 1 Institute of Biocybernetics and Biomedical Engineering PAS, Warsaw, Poland 2 Institute of Cardiology, Warsaw, Poland Background: T-wave alternans (TWA) magnitude distribution maps were simulated on the body surface with use of ECGSIM program and compared with recordings obtained from patients. Materials and methods: The new toolbox for ECGSIM program was developed which allows TWA simulation by change of action potential time duration (APD) in heart cells. T-wave alternans was calculated using time domain method - Differential Method. For the comparison electrocardiographic signals were recorded by multi-lead high resolution ECG system. Sixty four ECG active electrodes were placed on the patient’s body according to the University of Amsterdam lead system. Two-minute recordings were made during the ventricular pacing at 100 bpm. Implanted cardioverter-defibrillator electrodes were used for heart rate stimulation. The study group consists of four patients with detected TWA. T-wave alternans was simulated by changing APD between reference and modified beat (two simulated beats). Discordant T-wave alternans was simulated by extending the action potential duration in the second beat by 10 ms in a single node (located on the heart). Different nodes were selected on the heart surface for analysis of distribution of TWA on the body surface. Concordant T-wave alternans was also simulated. APD was extended from beat to beat in all heart ventricular cells. In signals recorded from the patients TWA magnitude was calculated in all leads and the map of distribution of its value on the surface of body was calculated. Body surface distributions of the magnitude of TWA similar to the recorded maps were simulated by changing APD in a selected set of nodes (different for each simulation). Results: For discordant TWA simulations different patterns of TWA magnitude distribution on the body surface were obtained for different locations of nodes with prolonged APD. For concordant TWA simulations similar patterns were obtained. It is possible to obtain simulated TWA magnitude distributions similar to those recorded in signals from patients. It was shown that V2 is the best lead for TWA calculation. Standard 12-lead ECG system can not detect TWA for every case. Conclusion: ECGSIM program can be used for approximate location of disturbances in action potentials of the heart cells which correspond to TWA signal measured in electrocardiograms on the body surface. Probably it can help in approximate location of the heart regions with conduction problems for example for recognition of the heart region where ablation should be performed. The new, optimal lead system is needed to ensure better TWA detection
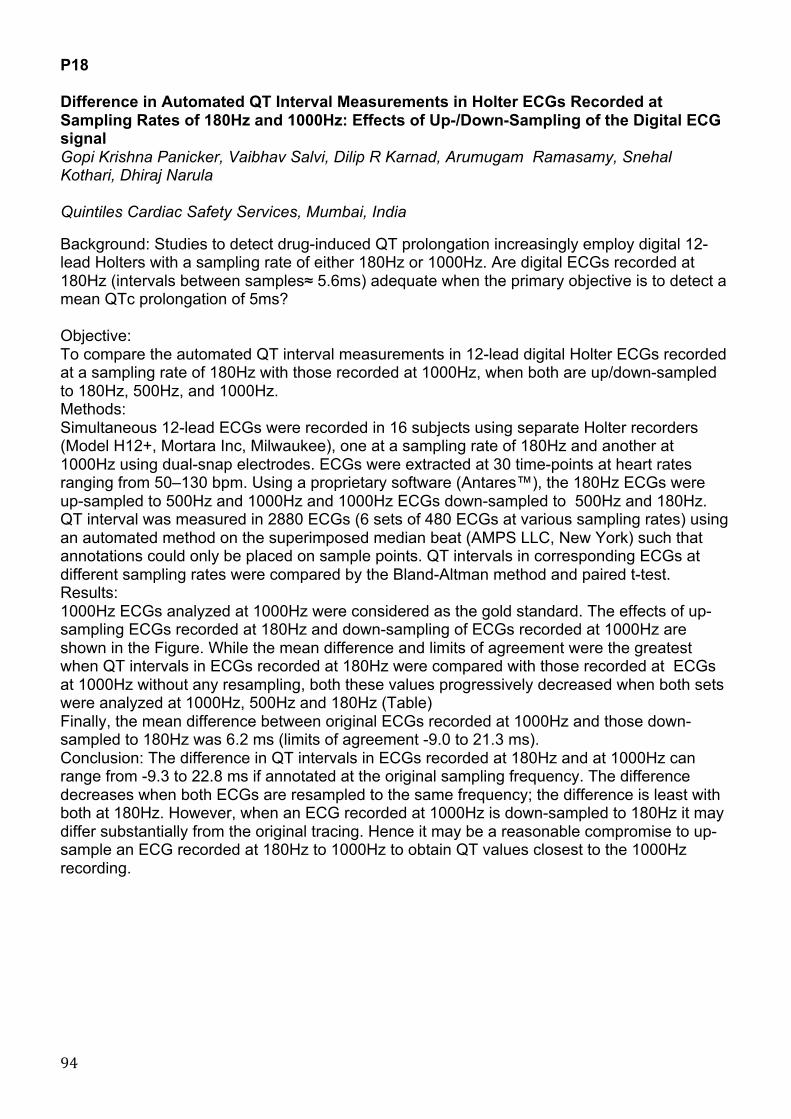
94
P18 Difference in Automated QT Interval Measurements in Holter ECGs Recorded at Sampling Rates of 180Hz and 1000Hz: Effects of Up-/Down-Sampling of the Digital ECG signal Gopi Krishna Panicker, Vaibhav Salvi, Dilip R Karnad, Arumugam Ramasamy, Snehal Kothari, Dhiraj Narula Quintiles Cardiac Safety Services, Mumbai, India Background: Studies to detect drug-induced QT prolongation increasingly employ digital 12-lead Holters with a sampling rate of either 180Hz or 1000Hz. Are digital ECGs recorded at 180Hz (intervals between samples≈ 5.6ms) adequate when the primary objective is to detect a mean QTc prolongation of 5ms? Objective: To compare the automated QT interval measurements in 12-lead digital Holter ECGs recorded at a sampling rate of 180Hz with those recorded at 1000Hz, when both are up/down-sampled to 180Hz, 500Hz, and 1000Hz. Methods: Simultaneous 12-lead ECGs were recorded in 16 subjects using separate Holter recorders (Model H12+, Mortara Inc, Milwaukee), one at a sampling rate of 180Hz and another at 1000Hz using dual-snap electrodes. ECGs were extracted at 30 time-points at heart rates ranging from 50–130 bpm. Using a proprietary software (Antares™), the 180Hz ECGs were up-sampled to 500Hz and 1000Hz and 1000Hz ECGs down-sampled to 500Hz and 180Hz. QT interval was measured in 2880 ECGs (6 sets of 480 ECGs at various sampling rates) using an automated method on the superimposed median beat (AMPS LLC, New York) such that annotations could only be placed on sample points. QT intervals in corresponding ECGs at different sampling rates were compared by the Bland-Altman method and paired t-test. Results: 1000Hz ECGs analyzed at 1000Hz were considered as the gold standard. The effects of up-sampling ECGs recorded at 180Hz and down-sampling of ECGs recorded at 1000Hz are shown in the Figure. While the mean difference and limits of agreement were the greatest when QT intervals in ECGs recorded at 180Hz were compared with those recorded at ECGs at 1000Hz without any resampling, both these values progressively decreased when both sets were analyzed at 1000Hz, 500Hz and 180Hz (Table) Finally, the mean difference between original ECGs recorded at 1000Hz and those down-sampled to 180Hz was 6.2 ms (limits of agreement -9.0 to 21.3 ms). Conclusion: The difference in QT intervals in ECGs recorded at 180Hz and at 1000Hz can range from -9.3 to 22.8 ms if annotated at the original sampling frequency. The difference decreases when both ECGs are resampled to the same frequency; the difference is least with both at 180Hz. However, when an ECG recorded at 1000Hz is down-sampled to 180Hz it may differ substantially from the original tracing. Hence it may be a reasonable compromise to up-sample an ECG recorded at 180Hz to 1000Hz to obtain QT values closest to the 1000Hz recording.

95
!
"#$%&'!!"#$%!&'((#)#%*#!$%&!+','-.!/(!$0)##,#%-!/(!12!'%-#)3$+.!,#$.4)#&!'%!567+#$&!&'0'-$+!8/+-#)!9:;.!)#*/)&#&!$-!5<=8>!$%&!5===8>?!,#$.4)#&!$-!&'((#)#%-!)#.$,@+'%0!)$-#.A!
()*+,-&.!#/!012345!-&6#78%&.!/9!
()*+,-&.!#/!0222345!-&6#78%&.!/9!
:&#;!.,<<&-&;)&!
=76>!
?,7,/6!9<!#@-&&7&;/!
=76>!A!B#%+&C!
B/-!)#.$,@+#&!!C5<=8>D! B/-!)#.$,@+#&!C5===8>D! DEF! GHEI!/9!JJE1! K2E220!5===8>! B/-!)#.$,@+#&!C5===8>D! IEI! GHE1!/9!0DEL! K2E220 E==8>! E==8>! 0E1! GHEH!/9!!0IEM! K2E220
B/-!)#.$,@+#&!C5<=8>D! 5<=8>! 2ED! G02EJ!/9!00EL! K2E220 F! !
!
N,@+-& !
!

96
P19 Surface Atrial Frequency Analysis as a Useful Tool in Patients Undergoing Catheter Ablation of Atrial Fibrillation Anastasya Kanidieva, Edvard Berngardt, Dmitry Lebedev Almazov Federal Heart, Blood and Endocrinology Centre, Saint Petersburg, Russia INTRODUCTION: Predictors of arrhythmia recurrence after catheter ablation of atrial fibrillation (AF) are still unclear. The aim of this study was to determine the relationship between dominant atrial cycle lengths (DACL) obtained from surface ECG and clinical outcome after catheter ablation. METHODS: In twenty one patients (mean age 52±9 years) left atrial radiofrequency ablation was performed for paroxysmal (n = 9) or persistent (n = 12) AF. DACL was assessed before ablation from the V1 lead surface ECG using digital signal processing (filtering, subtraction of averaged QRST complexes and power spectral analysis). All patients underwent pulmonary vein isolation (PVI). Linear ablation was performed in 12 patients. RESULTS: DACL was significantly higher in paroxysmal (186±31 ms) than persistent AF (146±17 ms) and in PVI - only - treated patients (182±33 ms) than in patients underwent additional linear ablation (149±21 ms). Follow-up was 11±5 month. DACL was significantly greater in patients without recurrence AF (176±28 vs. 152±31 ms). CONCLUSIONS: Higher baseline fibrillatory rates are associated with recurrence AF which suggests advanced electrical remodeling and reduced atrial refractoriness.

97
P20 Robustness Analysis of Processing Blocks in T-wave Alternans Detection Rebeca Goya-Esteban, Manuel Blanco-Velasco, Inmaculada Mora-Jiménez, Óscar Barquero-Pérez, Arcadi García-Alverola, José Luis Rojo-Álvarez 1 Department of Sygnal Theory and Communications, University Rey Juan Carlos, Fuenlabrada, Spain. 2 Department of Sygnal Theory and Communications, University of Alcalá, Alcalá de Henares, Spain. 3 Arrhythmia Unit, Hospital Virgen de la Arrixaca, Murcia, Spain. Background. A number of sophisticated methods have been proposed to detect microvolt T-Wave Alternans (TWA), however, the robustness of the detection systems with respect to the processing stages has not always been analyzed and quantified in detail. Materials and Methods. We used a nonparametric method to detect and estimate the presence of TWA: (1) Baseline cancellation; (2) High frequency noise removal; (3) R wave detection, (4) T-wave segmentation; (5) Windowing and normalization; (6) Template generation; (7) Bootstrap hypothesis test and TWA estimation. An ECG synthesizer was used to obtain simulated ECG signals considering four possible noise sources, namely, noise-free, muscular activity, electrode motion, and baseline wandering, with SNR from 5 to 30 dB. TWA episodes were included in the signal by adding an alternan waveform of 35microV amplitude with different patterns: patt1, no TWA; patt2, patt3, and patt4, alternans in the 100%, 50%, and 25% of the signal, respectively. We removed only one processing stage at each experiment. Up to 100 simulations were generated for each pattern, each SNR, and each noise. Results. (A) With all the processing stages. Estimated amplitudes were biased, with no alternans presence, amplitude was overestimated (2.4microV instead of 0microV), and with increasing noise the overestimation was higher. With alternans in the ECG, amplitude was underestimated (29microV, 27.8microV, 24.8microV, for patt2, patt3, patt4, respectively, instead of 35microV). Without noise, sensitivity was 1 when alternans were present, but specificity was 0.87 when alternans were not present, both decreased until 0.26 and 0.65, respectively, for SNR=5dB. (B) Removing block (1). With no alternans and without noise, amplitude was actually estimated as 0microV, but it was overestimated with noise presence. Sensitivity and specificity were 1 without noise and decreased until 0.3 and 0.64, respectively, for SNR=5dB. (C) Removing block (2). Amplitude estimations were almost not biased without noise, but they were markedly overestimated in the presence of noise. Sensitivity and specificity were 1 and 0.97 without noise and decreased until 0.44 and 0.5, respectively, for SNR=5dB. (D) Removing the bandpass filter in block (3). Sensitivity and specificity were 0.98 and 0.86, respectively, without noise and decreased until 0.51 and 0.52 for SNR=5db. The R wave detection was not correctly done for about a 5% of the realizations without the bandpass filter, in these cases the alternan amplitude was extremely overestimated. Conclusion. Interactions among processing blocks in TWA detection and estimation can be complex and not obvious, and they can affect significantly the performance.

98
P21 Blind Signal Separation of Fetal ECG Using Prior Information Oleksii Zaderykhin, Vjacheslav Shulgin, Anton Tokarie Scientific and Technical Center, of Radio-Electronic Medical Equipment and Technologies XAI-MEDICA National Aerospace University KhAI, Kharkov, Ukraine Background: The purpose of this study is to derive separation algorithm that can use a priori information about signals of sources. The advantage of the algorithm was studied experimentally on fetal ECG. Materials and methods: Solution of the blind signal separation problem suggests that based on the observed mixture of signals we can determine the parameters of a linear mixing system, using the limited information about this mixing system and signals of sources. For extraction of fetal ECG can be used regular signal separation algorithm which use only criterion of statistical independence of the components within the mixture. In this case extracted fetal ECG has significant noise component because separating matrix is not optimal for the fetal ECG. If we can detect QRS complexes on the fetal ECG, we can compute average QRS-complex. This average QRS-complex has good a priori information, which we can include in separation algorithm. Using Bayesian approach we construct the score function witch is the logarithm of the posteriori probability density function. This function includes a priori probability density function of the source signals. Using this score function we derived the stochastic update rule for determining the separating matrix. We included information about mean QRS-complex of fetal ECG into a priori probability density function. Derived algorithm consists of two stages. On the first stage Bell-Sejnowski ICA signal separation algorithm is used. Then on the separated fetal ECG R-peaks were detected and the average QRS-complex was computed. On the second stage the separation algorithm which takes into account information about the probability density function of the fetal ECG average QRS-complex is used. For experimental investigation of the derived algorithm we used the model of ECG signals for synthesis of fetal and mother ECGs. Then we created independent sources of bandpass noise which is typical for the ECG signal and than we derived mixture using a random mixing matrix. Results: The power of noise we choose in such a way that the ratio of the square amplitude of the fetal ECG to the noise power (SNR) in mixture was equal to 10. On the first stage we extracted the fetal component with SNR approximately 12.5. But on the second stage, when we used our separation algorithm, we had SNR equal to 67.9, i.e. more than 5 times bigger. Conclusion: The experimental data show that the usage of a priori information about the source signals can significantly increase the quality of its separation.

99
P22 Magnetocardiographic Phenotyping Andrey Vasnev, Yuri Maslennikov, Mikhail Primin, Igor Nedayvoda, Oksana Sitnikova, Andrey Nogovitsin, Yuri Gulyaev 1 CRYOTON Co.Ltd, Troitsk, Moscow Region, Russia 2 Institute of Radio-engineering and Electronics, Russian Academy of Sciences, Moscow, Russia 3 Institute of Cybernetics, Ukrainian Academy of Sciences, Kiev, Ukraine 4 Institute of Cybernetics, Ukrainian Academy of Sciences, Kiev, Ukraine 5 CRYOTON Co.Ltd, Troitsk, Moscow Region, Russia 6 7th Central Military Clinical Aviation Hospital, Moscow, Russia 7 Institute of Radio-engineering and Electronics, Russian Academy of Sciences, Moscow, Russia Purpose: We aimed to determine the main morphological types of PQRST magnetocardiocomplexes and corresponding integral energy QT curves (IECQTs) in healthy subjects. Material and Methods: 9-channel MCG recordings were performed in an unshielded space at rest. We investigated 6 professional athletes (aged 19-25 years) and 82 unselected healthy subjects (aged 17-45 years) not engaged in sports activities, with normal ECG. The registered PQRST magnetocardiocomplexes were averaged and synchronized. We assessed the S-wave, ST-segment and T-wave morphology, a shape of the IECQT and transition patterns of instantaneous maximal current density vectors (IMCDVs) from ventricular base depolarization to ventricular repolarization (VBD-to-VR). Results: We determined the four main morphological QRST complexes types. The "high-energy beta-type" was predominantly observed in the athletes group. The positive QRST complexes and IECQTs were, respectively, characterized by the presence of a marked S-wave/S-peak, significant j-point/"high-energy j-point" elevation, prominent steeply upsloping ST segment/j-point–Tpeak curve elevation and tall asymmetric T waves. VBD-to-VR transition was characterized by a rapid discontinuous change of the corresponding IMCDVs directions at the j-point, steady position and basal-to-apical direction of the IMCDVs in the normal sector during the entire ST interval. "Low-energy beta-type" subjects had less prominent QRST morphological features compared to the "high-energy beta-type". All QRST complexes and IECQTs of the "low-energy alpha-type" were, respectively, characterized by: the absence of the S waves/S-peak ("zero or no S-wave/S-peak" pattern); the appearance of the low-amplitude/low-energy "alpha-plateau", close to symmetric low-amplitude T-waves and "low-energy j-point" on IECQTs. VBD-to-VR transition corresponded to a delayed VB depolarization pattern extending over the part of the ST segment followed by a quick change of the IMCDVs in the opposite normal basal-to-apical direction during the rest of the ST interval. The "transitional beta-to-alpha type" differed by the upsloping/downsloping ST segment depression in the positive/negative QRST complexes, respectively, and the "alpha-plateau" appearance on IECQTs. VBD-to-VR transition was accompanied by a stepwise clockwise/counterclockwise rotation of the ventricular base IMCDVs in the normal basal-to-apical direction during the ST segment. Conclusions: The differences in the QRST morphology are due to differences in instantaneous transmural summary current density gradients of the ventricles which determine the shape of the QRST complexes and IECQTs. We hypothesize that the "high-energy beta-phenotype" subjects have the highest density gradient of beta1-adrenoreceptors decreasing from subendocardium to subepicardium while the "low-energy alpha-phenotype" subjects have the highest density gradient of alpha1-adrenoreceptors decreasing from subepicardium to subendocardium which determines the "alpha-plateau" shape of their magnetocardiocomplexes and IECQTs.
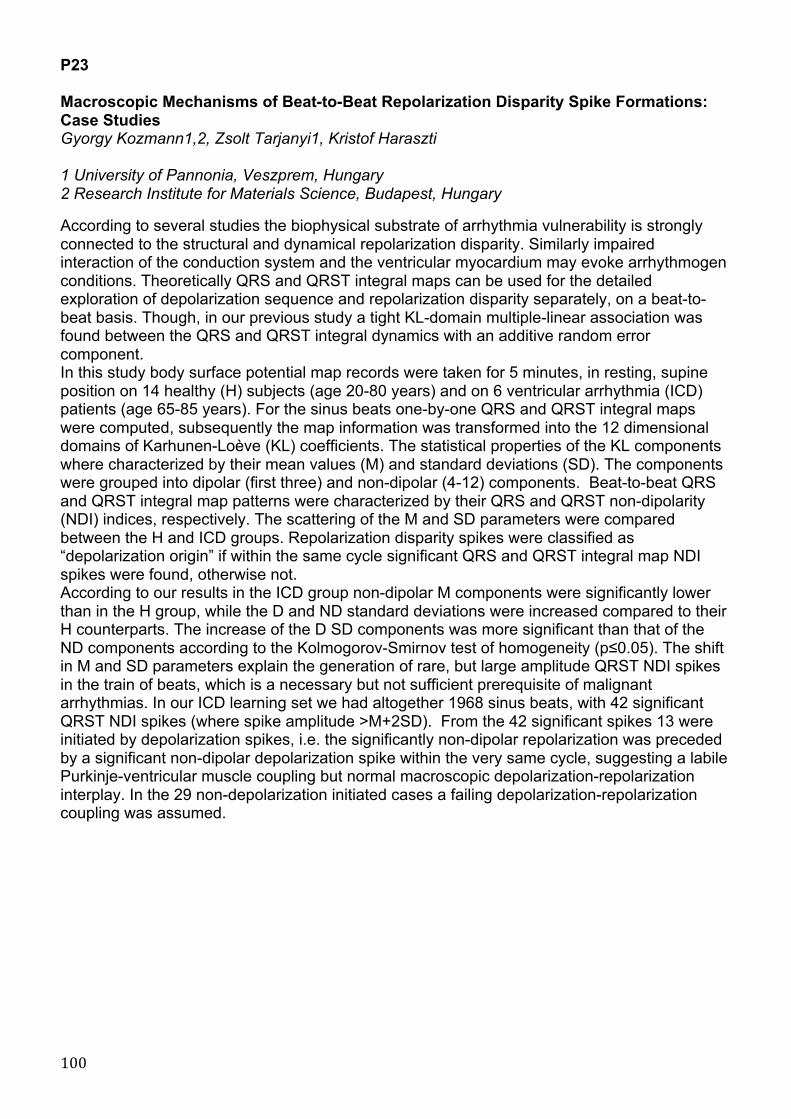
100
P23 Macroscopic Mechanisms of Beat-to-Beat Repolarization Disparity Spike Formations: Case Studies Gyorgy Kozmann1,2, Zsolt Tarjanyi1, Kristof Haraszti 1 University of Pannonia, Veszprem, Hungary 2 Research Institute for Materials Science, Budapest, Hungary According to several studies the biophysical substrate of arrhythmia vulnerability is strongly connected to the structural and dynamical repolarization disparity. Similarly impaired interaction of the conduction system and the ventricular myocardium may evoke arrhythmogen conditions. Theoretically QRS and QRST integral maps can be used for the detailed exploration of depolarization sequence and repolarization disparity separately, on a beat-to-beat basis. Though, in our previous study a tight KL-domain multiple-linear association was found between the QRS and QRST integral dynamics with an additive random error component. In this study body surface potential map records were taken for 5 minutes, in resting, supine position on 14 healthy (H) subjects (age 20-80 years) and on 6 ventricular arrhythmia (ICD) patients (age 65-85 years). For the sinus beats one-by-one QRS and QRST integral maps were computed, subsequently the map information was transformed into the 12 dimensional domains of Karhunen-Loève (KL) coefficients. The statistical properties of the KL components where characterized by their mean values (M) and standard deviations (SD). The components were grouped into dipolar (first three) and non-dipolar (4-12) components. Beat-to-beat QRS and QRST integral map patterns were characterized by their QRS and QRST non-dipolarity (NDI) indices, respectively. The scattering of the M and SD parameters were compared between the H and ICD groups. Repolarization disparity spikes were classified as “depolarization origin” if within the same cycle significant QRS and QRST integral map NDI spikes were found, otherwise not. According to our results in the ICD group non-dipolar M components were significantly lower than in the H group, while the D and ND standard deviations were increased compared to their H counterparts. The increase of the D SD components was more significant than that of the ND components according to the Kolmogorov-Smirnov test of homogeneity (p≤0.05). The shift in M and SD parameters explain the generation of rare, but large amplitude QRST NDI spikes in the train of beats, which is a necessary but not sufficient prerequisite of malignant arrhythmias. In our ICD learning set we had altogether 1968 sinus beats, with 42 significant QRST NDI spikes (where spike amplitude >M+2SD). From the 42 significant spikes 13 were initiated by depolarization spikes, i.e. the significantly non-dipolar repolarization was preceded by a significant non-dipolar depolarization spike within the very same cycle, suggesting a labile Purkinje-ventricular muscle coupling but normal macroscopic depolarization-repolarization interplay. In the 29 non-depolarization initiated cases a failing depolarization-repolarization coupling was assumed.

101
P24 A Robust Ventricular Ectopic Canceller to Improve Atrial Activity Extraction from Holter Recordings Arturo Martinez1, Raul Alcaraz2, Jose Joaquín Rieta3 1 Innovation in Bioengineering Research Group, University of Castilla-La Mancha 2 Innovation in Bioengineering Research Group, University of Castilla-La Mancha 3 Biomedical Synergy, Universidad Politécnica de Valencia Background: Ectopic beats are a very frequent and challenging problem in atrial fibrillation (AF) long time monitoring that still is unsolved. Their presence is a serious handicap for atrial activity (AA) extraction from ECG recordings. Normally, they provoke important ventricular residua in the AA signal when methods based on average QRST cancellation are used. In this work, a new method to improve ectopics cancellation in template-based QRST AF cancellation techniques is proposed. Materials and methods: Twenty 5 hour-length segments extracted from 24-hour Holter ECG recordings of 20 different AF patients were used for the analysis. The selected intervals were intentionally chosen to present a high percentage of ectopic beats. First, the proposed method distinguished between normal and ectopic beats through a forward/backward level windowing strategy. In this manner, both positive and negative ectopics were detected. Next, for each ectopic under cancellation, the most similar 15 ectopic beats were clustered by using an adaptive correlation index, which provides a robust and efficient measure of morphological similarity among signals than Pearson correlation. Next, the eigenvector matrix of the selected beats was obtained by singular value decomposition (SVD). In this way, the highest variance eigenvector (HVE) was considered as the ventricular template for cancellation. On the other hand, to validate this ectopic cancellation, a new index is proposed, called reduction ectopic rate (RER). The index is obtained by computing the root mean square value of the ratio between each ectopic in the original ECG and its residue in the AA signal after ectopic cancellation. Results: The performance of the proposed method was compared with a previously published average QRST cancellation technique, in which ventricular template was also generated by applying SVD to normal beats. For the proposed ectopic cancellation, RER was 3.57 ± 0.25 in average, whereas mean value of RER was 1.11 ± 0.25 when ectopic beats were considered as normal beats. Moreover, as can be appreciated in Fig. 1, when ectopics are considered as normal beats, high residua are present in the AA signal both for ectopic and normal complexes. Contrarily, a notable reduction of ectopic residua is reached with the proposed method, see Fig. 1(c), thus allowing a higher quality AA signal extraction free of QRST normal beats and ectopics as well. Conclusions: Results showed that the proposed ventricular ectopic cancellation method is able to improve the atrial activity extraction from Holter ECG recordings by reducing notably the residua provoked by the presence of ectopic beats.

102
P25 Data Mining Methods for the Classification of High Resolution ECGs Maik Götze, Christian Wolff, Bernd Krause, Dietrich Romberg Anhalt University of Applied Sciences, Department of Information Science, Köthen, Germany Background: Classification of different types of heartbeats is an essential step for risk stratification. This study presents results of a Data Mining based approach for assigning individual heartbeats to patients or groups of patients. Materials and Methods: Long-term (24 h) high-resolution recordings (3 leads, 1000 Hz, 12 bit) were obtained from 14 patients after myocardial infarction. Four additional leads were derived as a combination of the three original leads. From all leads, 847 normalized low-scale and high-scale coefficients were calculated using the Discrete Wavelet Transform. Furthermore, 462 statistical features of these coefficients were generated. Thus, including parameters generated by the Lund ECG Toolbox we finally obtained 1392 features per heartbeat for the mining tasks. Depending on the quantity of beat classes a group number was assigned to each patient. Group 1 consisted of patients with only one prevalent beat class whereas group 2 included patients with more dominant beat classes. Supervised Data Mining methods (Artificial Neural Networks (ANN), C5-Decision Tree (C5), Support Vector Machine (SVM)) as well as unsupervised Data Mining methods (Self Organizing Maps (SOM), K-Means, TwoStep clustering) were used to generate models assigning all given heart beats to the patient group (1 or 2) and to the patient ID. A stepwise iteration process reduced the number of involved features. Additionally features generated by the SOM algorithm were used to improve the number of correctly identified patients. Results: The assignment of individual beats to the group number can be accomplished adequately using ANN and C5 Data Mining algorithms with only few features (Fig.1). The type of wavelet does not significantly influence the results. The final models reveal the relevant features for the classification: normalized wavelet coefficients (level) and their statistical parameters. SOM and TwoStep as unsupervised methods generated well separated and nearly pure clusters of heartbeats from individual patients (Fig.2). Here, the results are highly depended on the used wavelet type. Including a high number of features SVM, C5 and ANN as supervised methods assign all heartbeats to the individual patients correctly. Improved models with only few features were generated using SOM features (Fig.3). Conclusion: Data Mining methods based on wavelet features are applicable alternatives for annotating ECGs without time domain features. This is motivating for further studies focusing on classification and prediction of ventricular arrhythmias.
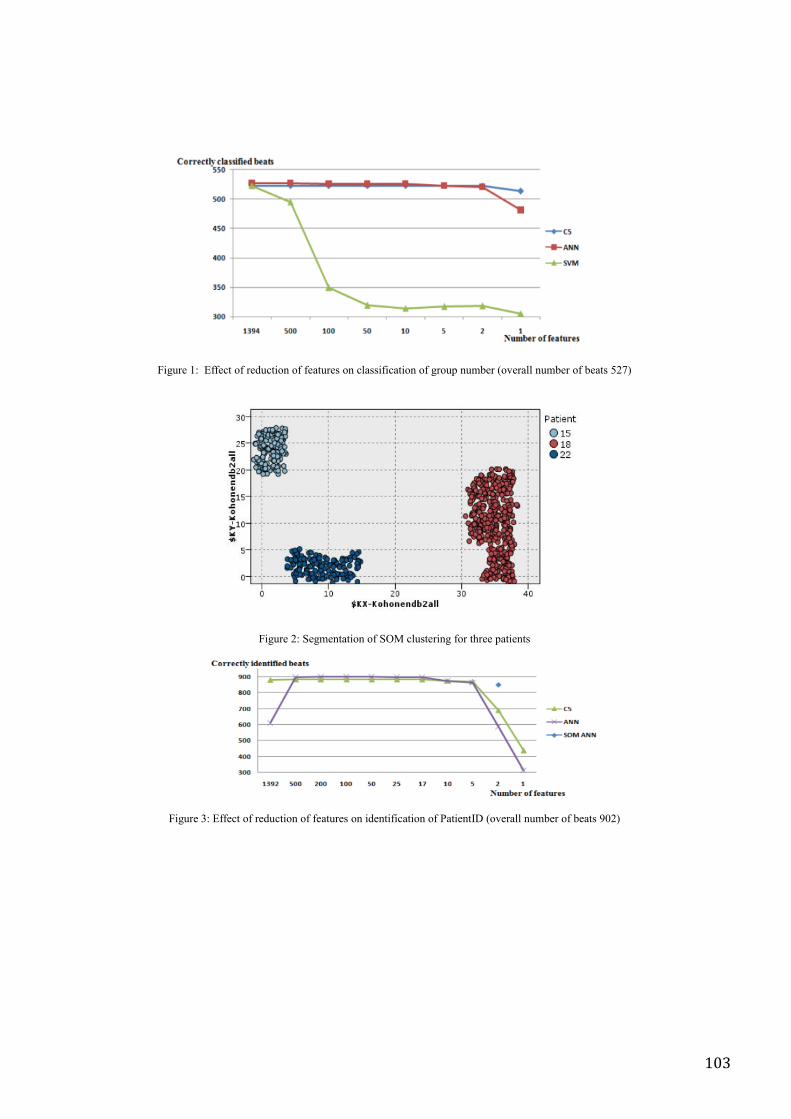
103
!"#$%&'()''*++&,-'.+'%&/$,-".0'.+'+&1-$%&2'.0',3122"+",1-".0'.+'#%.$4'0$56&%'7.8&%133'0$56&%'.+'6&1-2'9:;<'
!"#$%&':)'=&0-1-".0'.+'=>?',3$2-&%"0#'+.%'-@%&&'41-"&0-2'
!"#$%&'A)'*++&,-'.+'%&/$,-".0'.+'+&1-$%&2'.0'"/&0-"+",1-".0'.+'B1-"&0-CD'7.8&%133'0$56&%'.+'6&1-2'EF:<'

104
P26 Cardioelectric Field during Ventricular Repolarization under Occlusion and Reperfusion of the Left Coronary Artery in Wistar Rats Maria Blazhkevich, Yurij Shorohov, Irina Roshchevskaya 1 Komi Science Center, Lab. of comparative cardiology, Syktuvkar, Russia 2 Syktuvkar College of Medicine, Komi Science Center, Lab. of comparative cardiology, Syktuvkar, Russia 3 Komi Science Center, Lab. of comparative cardiology, Syktuvkar, Russia Background: The aim of this work was to analyze changes of temporal and amplitude characteristics of cardioelectric field during experimental occlusion and reperfusion of the left coronary artery. Materials and methods: body surface potential mapping (BSPM) was carried out in Wistar rats (n=20). Potentials were recorded before occlusion, at 15 min of occlusion, at 60 min of coronary artery reperfusion. Results: Under occlusion QTII interval increased from 80,3±6,7 ms to 91,4±11,9 ms, ST-TII interval increased from 62,4±6,9 ms to 72,8±11,7 ms ( <0,05). At 60 min of reperfusion QTII increased to 102,3±11,1 ms, STII-T to 83,2±10,3 ms. The II amplitude increased from 0,19 ± 0,04 mV to 0,25±0,08 mV ( <0,05) under occlusion, under reperfusion the II amplitude didn’t not change. For the analyses of temporal characteristics of cardioelectric field during ventricular repolarization 3 time periods were defined (relatively to the RII-peak): tb – time of formation of cardioelectric field that’s typical for ventricular repolarizaton; tpeak – time when extrema reach maximal values during ventricular repolarization; tend – time of termination of ventricular repolarization. Cardioelectric field formed during the ascending phase of II-wave, tb was 9,61±1,88 ms before and 8,9±2,2 ms under occlusion, 8,85±1,95 ms at 60 min of reperfusion. Before occlusion tpeak was 22,6±3,10 ms, under occlusion - 22,3±3,5 ms, at 60 min of reperfusion – 24,0±3,6 . Before occlusion tend was 67,6 ± 9,3 ms, under 72,9 ± 6,6 ms. Under coronary artery reperfusion tend increased to 83,5 ± 10 ms, in comparison with the value before occlusion. The duration of the period tb –tend didn’t change under occlusion. Under reperfusion the period tb –tend significantly increased ( <0,05) due to periods tb –tPeak and tpeak –tend. Under occlusion of the coronary artery the maximum of BSPM significantly increased in comparison with values before occlusion during tb –tend ( <0,05). Under reperfusion the maximum decreased relative to values under occlusion during tb –tPeak ( <0,05) and at the period tpeak –tend it didn’t not change in comparison with values under occlusion. Under occlusion the minimum of BSPM increased compared with values before occlusion during the period tb –tend ( <0,05). At 60 min of reperfusion BSPM minimum didn’t change. Conclusion: Revealed on BSPM at 60 min of reperfusion after coronary occlusion increase of duration of initial and final phases of ventricular repolarization and decrease maximum on initial phase of repolarization, reflected reducing process in damaged myocardium. This work is support SS-4857.2010.4, «Fundamental Sciences for Medicine», grant Ural Division.

105
P27 Clinical, ECG and Echocardiographic Characteristics in Hypertensive Men and Women with and without Paroxysmal Atrial Fibrillation Réginald Nadeau1, Georgeta Sas1, Alain Vinet1, Réal Lebeau1, Paola A. Lanfranchi1, Aimé-Robert Leblanc1, Denis Roy2, Pierre Larochelle3, Jacques de Champlain (deceased)3 1 Hopital du Sacre-Coeur de Montreal, Montreal, Canada 2 Institut de Cardiologie de Montreal, Montreal, Canada 3 Institut de Recherches Cliniques de Montreal, Montreal, Canada Background: It has become increasingly apparent that there are important differences in the clinical presentation of paroxysmal atrial fibrillation (PAF) in men and women. Women have a higher risk of AF-related stroke than men, but are referred less often for therapeutic management of AF in a specialized arrhythmia clinic. There is only limited information specifically focused on hypertensive patients (HT) with PAF. Our purpose was to assess as whether sex influences clinical, electrocardiographic and echocardiographic characteristics in HT outpatients with and without PAF. Materials and methods: One hundred sixty treated essential HT patients (92 men and 68 women) in sinus rhythm were included in the study. Clinical characteristics included resting blood pressure (BP) and waist circumference measurement. A 12-lead ECG was recorded at 50 mm/s with 1mV/cm standardization. P-wave and P-R duration were measured manually with calipers in lead II. QT duration and corrected QT intervals were assessed by computerized algorithms. Echocardiographic measures, obtained according to standard methods, included: indexed left atrial (LA) volume and ejection fraction (LAEF), left ventricular ejection fraction (LFEF), E/A ratio and mitral early deceleration time. Comparisons were performed separately in men and women with previously documented PAF (HT+PAF) versus those without PAF (HT-PAF). Results: Among men, HT + PAF subjects (N=44) had a higher systolic BP (SBP) (mean 139+22 vs. 127+13, p=0.002), pulse pressure (mean 55+19 vs. 42+13, p=0.05), larger LA volume (mean 37+12 vs. 31+9, p=0.012), longer P wave (mean 118+22 vs. 102+16, p=0.0003), PR interval (mean 178+28 vs. 167+20, p=0.04) and QT interval (mean 442+42 vs. 419+24, p=0.002) as compared to HT-PAF subjects (N=48). HT + PAF men also had lower heart rate (mean 57+9 vs. 61+8, p=0.05), EF (mean 64+5 vs. 66+4, p=0.04) and LAEF (mean 46+12 vs. 52+10, p=0.01) than HT-PAF men. Among women, only higher waist circumference (mean 94+13 vs. 88+9, p=0.002) and an increased E/A ratio (mean 1.3+0.5 vs. 0.9+0.3, p=0.002) was featured in HT+PAF subjects (N=35) when compared with HT-PAF subjects (N=33). Conclusion. In our study higher SBP, LA enlargement associated with lower atrial contraction and reduced EF, as well as prolonged P wave, PR and QT interval durations seem to characterize HT men with PAF. On the contrary only abdominal obesity and diastolic dysfunction seem to be significant characteristics related to PAF in HT women. These gender differences should be keep in mind for a careful assessment of HT patients to recognize the risk of AF.

106
P28 The Reproducibility of the Ventricular SAECG During Atrial Fibrillation and Sinus Rhythm in the Same Patients Christer Gottfridsson, Thomas Karlsson, Nils Edvardsson Dept. of Molecular and Clinical Medicine/Cardiology, Sahlgrenska Academy, University of Gothenburg, Gothenburg, Sweden. The signal averaged ECG (SAECG) was performed twice during atrial fibrillation (AF) before planned cardioversion (DC) and twice 2 hours after DC in 82 patients with persistent AF. Sixty-nine patients had sinusrhythm (SR) and 13 patients remained in AF during the second pair of SAECGs. The SAECG was analysed for late potentials and the variables FQRSD, RMS40 and HFLAS40 and spectral turbulence variables interslice correlation mean (ISCM), intersclice correlation standard deviation (ISCSD), low slice correlation ratio (LSCR) spectral entropy (SE) and mean peaks per slice (MPPS) were calculated. The coefficient of repeatability (COR)was calculated as 2 SD of the differences in a variable calculated in the pair of SAECG recordings during AF and during SR in the 69 patients who had got SR. The COR during AF were 8.2, 15.7, 8.8 and 2.9, 5.5, 1.7, 55.7, 5.0 for FQRSD, RMS40 and HFLAS40 after 40 Hz filtering and ISCM, ISCSD, LSCR, SE and MPPS, respectively, and during SR 5.9, 12.8, 16.8 and 3.7, 6.4, 1.8, 52.0, 4.8 for FQRSD, RMS40 and HFLAS40 after 40 Hz filtering and ISCM, ISCSD, LSCR, SE and MPPS, respectively. Conclusion: The reproducibility of the SAECG during AF was not inferior to that during SR and AF should not disqualify from performing ventricular SAECG.

107
JUNE 04, 2010 09.00-17.00 P29 Heart Rate Variability in Patients with Syncopes Tatyana Mironova, Vladimir Mironov, Yury Shamurov, Tatyana Barikova, Olga Toropova Chelyabinsk Medical Academy, Chelyabinsk, Russia Purpose of the study was definition the particularities of the peripheral autonomic regulation of the heart sinoatrial node (SN) in patients (pts) with some syncopes. 194 pts with syncopes in anamnesis were ex-amined in the neurocardiology department. Except standard examinations, the high-resolution rhythmo-cardiography (RCG) was used. Heart rate variability (HRV) analysis was in Time- and Frequency-Domain, at rest and 4 tests. Synchronous with RCG ECG registered in the current real times. RCG-idices were defined: average RR-interval, it standard deviation (SDNN), quadratic dispersion of humoral, sym-pathetic and vagal HRV waves ( l, m, s), also shares of their spectral analogous - VLF%, LF%, HF%, accordingly. In 35 (42%) pts the final diagnosis referred to the neurological diseases - an epilepsy (EP) in 18 pts. The dynamic breaches of brain circulation (DB) were in 17pts. HRV in EP was characterized by the variety and the independency on autonomic influences. In pts with DB the different HRV breaches correlated to expression of the hemodynamic breaches. The HRV particularities of the neurological pts were ultralow HRV waves of period 53.648±10.2 sec. and spectral peak of 0.001-0.003Hz in the one of post stimulant position. In 7pts with vascular pathology the dominating HRV periodicity was the sympa-thetic m-waves with spectral peak 0.08-0.12 Hz (LF%). In 1 case the Govers vaso-vagal syncope HRV was registered during RCG. The paroxysm was appeared in period of change lying posture to active or-tostase and it was accompanied by the synchronous increase of RR- interval to 1.3 sec. and reduction blood pressure to 80/40 mm of Hg. Before paroxysm there were supraventricular extrasystoles and al-lorhythmia. The sick sinus syndrome (92 pts) characterized on RCG by the autonomic cardioneuropathy with HRV-stabi-lization, absence of any reactions to stimuli in tests and independence to atropine. In 20 pts syncopes were connected with sinus node dysfunction (SND). In 17 pts (age 18-21 years, men) was the positive reaction to atropine, paroxysms disappeared. During period between syncopes Venckebach periodicity, bradycardia (RR=1.344±0.108 sec) and s-waves (HF) were registered. The average amplitude of s-waves was 0.160±0.023 sec. vs normal -0.072±0.008 sec.(p< 0.001).In 19 pts with syncopes and ischemic heart failure there were increase of the sympathetic share (LF%) or autonomic cardioneuropathy with HRV stabilization. Thus, high-resolution HRV analysis has possibilities for decision problem of the syncopes and has capability to define the direction of diagnostic searching in pts with paroxysms.

108
P30 High-resolution HRV-analysis in Patients with Ischemic Cardioarrhythmias Tatyana Mironova, Vladimir Mironov, Olga Nokhrina Chelyabinsk Medical Academy, Chelyabinsk, Russia For estimation of the diagnostic possibilities of the heart rate variability (HRV) under ischemic cardioarrhythmias (CA) 971 patients (pts) with coronary artery disease (CAD) were examined by the standard methods and rhythmocardiography (RCG). The peculiarities of the HRV estimation were: high-resolution (1000 Hz) registration of HRV, statistic and nonpara-metric spectral analyses of the wave structure of the sinus heart rhythm. The ECG was registered synchronously to RCG, arrhythmic episodes ana-lyzed in detailed. RCG recorded in 4 stimulant tests. HRV-indices corre-sponded to Russian recommendations (2002).17-year experience of the HRV using and databases in more 55 thousand of pts are proving that the majority of cardioarrhythmias is registered by RCG. The short 25 min. con-trol RCG-monitoring is suitable and has the row advantages, which aren’t realized by ECG and Holter monitoring.CA have differentiated RCG symp-toms, which may be evaluated on frequency, appearance in diastole, their clinical variant, the autonomic background and hemodynamic value of every CA. CA were recognized on RCG visually at the value of pre- and postectopic intervals. On the RCG intervals were obtained more exact, than on the ECG. The main advantage RCG was the possibility of the estimation of the multivariate autonomic background of CA. For example, the sick si-nus syndrome differs from the sinus node (SN) dysfunction by the HRV stabilization, reduced reaction to atropine, independence CA from auto-nomic sympathetic and parasympathetic stimulant tests. In the every case these differences determined adrenomimetic or adrenolitic pharmacother-apy. CA in pts with the CAD registered on the HRV reduction, the decrease of reactions in tests, correlated (r=0,64-0,83) with expression of the ischemic pathology, that proved the participation of SN in CAD. The rela-tionship CA and the autonomic dysregulation in SN revealed in a number variant of the regulative breaches in SN during the period between parox-ysms and directly before arrhythmic episode. The HRV changes allowed to value influence of each CA on the hemodynamic. The heaviest cases of CAD and CA were on the background autonomic cardioneuropathy with HRV stabilization. The electronic microscopic estimation of the SN in de-ceased such pts showed the necrobiosis and necrocytosis in the SN cells – the destructions of mitochondrial structures, tissue vacuolization and calci-nosis. The high-resolution HRV-analysis consists extensive possibilities for diagnostics of CA in pts with CAD. Some of them aren’t realized in the standard cardiology methods. Also RCG data can determine rational phar-macotherapy.

109
P31 Postural Changes Influences on Heart Rate Variability in an Apparently Healthy Taiwanese Population Yueh Chen1, Yu-Shan Chen1, Chia-Chun Lu1, Ming-Ju Tsai1, Ching-Shiun Chang1, Ing-Fang Yang2,3, Ten-Fang Yang1,3 1 College of Biological Science and Technology, National Chiao Tung University, Hsin-Chu City, Taiwan. 2 Department of Internal Medicine, Jen-Chi General Hospital, Taipei city, Taiwan. 3 Institute of Biomedical informatics, Taipei Medical University, Taipei city, Taiwan. Introduction: Heart rate variability (HRV) analysis has been used for many years to measure ANS activities for its simplicity, accuracy, and non-invasiveness. Recent studies show that HRV may be a powerful technique to measure the modulation and balance between parasympathetic nervous system (PNS) and sympathetic nervous system (SNS) by time and frequency domain analysis. It’s believed that decreased HRV is a sign of autonomic imbalance, which may be caused by diseases, and with aging, the HRV decreases. Gender specific normal limits of HRV should be established to distinguish the normal decrease of HRV from pathological decreases in diseased conditions. The aim of the present study is to analyze the posture differences of short term (5 minutes) time domain and frequency domain HRV parameters in an apparently healthy Taiwanese population. Materials and Methods: The study was performed at College of Biological Science and Technology, National Chao Tung University from September 2008 to December 2009. A total of 115 healthy students from the university (57 males, aged 24 ± 1 years, and 58 females, aged 23 ± 5 years) without evidence of any heart disease by history and routine medical checkup were recruited for this study. The short term HRV recording was derived from the Modified Lead II-ECG, by a locally developed and manufactured device, DailyCare BioMedical’s ReadMyHeart. All subjects were asked for lying, sitting, and standing each for 5-minute recording, and all of them must rest for at least 5 minutes before the measurement. Results: The statistically significant results differences from lying to sitting, lying to standing, and sitting to standing and the difference between genders on different postures were demonstrated. SDNN and RMSSD also decreased from lying to standing(P 0.01, table 1), except lying to sitting of SDNN(P 0.05). Total power, representing the autonomic tone, also declined from lying to standing (P 0.01, table 2 and 3), except lying to sitting. Both the HF and HF norm decreased from lying to standing (P 0.05). The LF norm and LF/HF ratio increased from lying to standing (P 0.01). Conclusions: (1) There was a statistically significant posture difference in both time and frequency domain HRV parameters. (2) The results show that different postures strongly affect the autonomic tone from lying to standing. The HF component of the lying is greater than standing, this means that higher activity of parasympathetic tone while lying.

110
!!"#$%&'()'*+,-./&'01'234'5"-&670-,"8',87'1%&9$&8:;670-,"8'01'-,/&<'
!
!
!!"#$%&'()'*+,-./&'01'234'5"-&670-,"8',87'1%&9$&8:;670-,"8'01'1&-,/&<'
' '
!"#$%&'!"#$%&'()*+,(-")."-)+'/0$"')"1#2")."'(3$"4)3&(*5"67'"(+"+(8*(.(9&*'"4(..$0$*9$+":,(%$";"
<&%/$"=">5>?5";@A"(+"',$";"<&%/$")."%B(*8"')"+(''(*8C";@D"(+"',$";"<&%/$")."%B(*8"')"+'&*4(*8C"&*4";AD"(+"
',$";"<&%/$")."+(''(*8"')"+'&*4(*85E"
" ;)+'/0$" F$&*" AG" F(*(3/3" F&H(3/3" ;"<&%/$"
F$&*"##" @B(*8" IJK5LM" LN?5OL" POJ5>?" LNML5MO" ;@A" >5>>L"
" A(''(*8" INL5??" L>N5KN" ?MN5KO" L>II5??" ;@D" =>5>>L"
" A'&*4(*8" PMO5ML" M?5MK" ?N>5?N" L>LO5IO" ;AD" =>5>>L"
AGQQ" @B(*8" ?L5N?" NL5OL" LP5>K" LON5>N" ;@A" >5OL?"
" A(''(*8" KM5K?" LM5?O" LO5N" LLN5P" ;@D" =>5>>L"
" A'&*4(*8" OJ5P>" L?5NP" L?5LO" MI5KL" ;AD" =>5>>L"
#FAAG" @B(*8" KL5>M" LJ5IL" M5OL" JI5JJ" ;@A" >5>LJ"
" A(''(*8" O?5JL" LP5LL" I5PO" I?5L?" ;@D" =>5>>L"
" A'&*4(*8" LI5MP" L>5NK" P5LK" J>5L" ;AD" =>5>>L"
"
" "
!"#$%&'!"#$%&'()*+,(-")."-)+'/0$"')"1#2").".0$3/$*45"6)7&(*")."889:";<'"(+"+(=*(.(4&*'"6(..$0$*4$+"
>,(%$"?"@&%/$"A"B:BC:"?DE"(+"',$"?"@&%/$")."%5(*="')"+(''(*=F"?D9"(+"',$"?"@&%/$")."%5(*="')"+'&*6(*=F"
&*6"?E9"(+"',$"?"@&%/$")."+(''(*="')"+'&*6(*=:G"
" ?)+'/0$" H$&*" EI" H(*(7/7" H&J(7/7" ?"@&%/$"
')'&%"-)>$0" D5(*=" KLMK:BN" OCL:BP" KMB" QBBR" ?DE" B:RNC"
" E(''(*=" KLLN:QC" OCQ:RR" OQ" MRNK" ?D9" AB:BBK"
" E'&*6(*=" OBM:KO" NKK:QO" KKK" MMLB" ?E9" AB:BBK"
2D8" " D5(*=" QQQ:LN" MRM:KK" LO" KROB" ?DE" B:PP"
" E(''(*=" CKR:L" POL:RR" ML" LKOM" ?D9" B:BOP"
" E'&*6(*=" MCQ:LQ" MRM:LQ" MR" LCOB" ?E9" B:BML"
D8" D5(*=" MRP:B" MMR:QP" MP" KNRQ" ?DE" B:LCR"
" E(''(*=" QCM:ML" QKP:NP" LR" LNOQ" ?D9" B:KCM"
" E'&*6(*=" MMM:NN" MKM:CM" LO" KPNQ" ?E9" B:BKC"
18" D5(*=" QMQ:MC" MCN:PO" LN" KOMP" ?DE" B:BKO"
" E(''(*=" MMM:BL" LOB:LL" LL" KMLC" ?D9" AB:BBK"
" E'&*6(*=" KKQ:KQ" KMB:BO" Q" OPO" ?E9" AB:BBK"
D8"*)07" D5(*=" QR:OK" KP:LM" KB:KM" OR:KR" ?DE" B:BBK"
" E(''(*=" CN:CB" KN:NM" KO:LN" RB:OP" ?D9" AB:BBK"
" E'&*6(*=" NQ:KN" KC:LB" LK:CM" RN:BL" ?E9" AB:BBK"
18"*)07" D5(*=" CB:KN" KP:LL" KB:OK" OR:ON" ?DE" B:BBK"
" E(''(*=" QL:QR" KN:NL" R:KQ" OK:NM" ?D9" AB:BBK"
" E'&*6(*=" LC:OM" KC:KR" L:RO" NO:QN" ?E9" AB:BBK"
D8S18" D5(*=" K:LM" B:ON" B:KK" Q:RR" ?DE" AB:BBK"
" E(''(*=" K:RC" K:NP" B:LL" R:RQ" ?D9" AB:BBK"
" E'&*6(*=" Q:QQ" M:CP" B:LN" KR:RQ" ?E9" AB:BBK"
"
" "!"#$%&'!"#$%&'()*+,(-")."-)+'/0$"')"1#2").".0$3/$*45"6)7&(*")."8# +(9*(.(4&*'"6(..$0$*4$+"
:,(%$";"<&%/$"=">?>@?";AB"(+"',$";"<&%/$")."%5(*9"')"+(''(*9C";AD"(+"',$";"<&%/$")."%5(*9"')"+'&*6(*9C"
&*6";BD"(+"',$";"<&%/$")."+(''(*9"')"+'&*6(*9?E"
" ;)+'/0$" F$&*" BG" F(*(7/7" F&H(7/7" ;"<&%/$"
')'&%"-):$0" A5(*9" IJKJ?LL" MKJ?NL" ILI" LIJL" ;AB" >?OKO"
" B(''(*9" IJPJ?>M" M@@?LL" KI" NONJ" ;AD" =>?>>I"
" B'&*6(*9" MIK?>L" PMI?J@" IIN" NP@M" ;BD" =>?>>I"
2AQ" " A5(*9" LPO?KO" NKN?NK" JK" JIPP" ;AB" >?N@L"
" B(''(*9" @J>?>@" L@O?>>" NM" J@IP" ;AD" >?JIN"
" B'&*6(*9" NKO?ON" LPI?K>" NK" JKL>" ;BD" >?>L@"
AQ" A5(*9" NKN?NK" NLI?PN" NN" IM@M" ;AB" >?JNP"
" B(''(*9" L@O?PO" LJO?II" N>" JMJM" ;AD" >?JI>"
" B'&*6(*9" NL>?I@" NNI?OO" JK" IOK@" ;BD" >?>JI"
1Q" A5(*9" LL>?MNN" NPN?>O" IM" IMLM" ;AB" >?>JJ"
" B(''(*9" NL>?NI" JKJ?NJ" JN" I@J@" ;AD" =>?>>I"
" B'&*6(*9" IIN?J@" IJM?PK" L" MIN" ;BD" =>?>>I"
AQ"*)07" A5(*9" LK?PO" @>?NI" II?>P" MM?KO" ;AB" >?>>I"
" B(''(*9" @O?NN" IM?>L" IM?JN" KI?IK" ;AD" =>?>>I"
" B'&*6(*9" OL?NP" I@?@>" IK?>L" KP?@P" ;BD" =>?>>I"
1Q"*)07" A5(*9" @>?NI" IP?@>" II?>N" MM?KL" ;AB" >?>>I"
" B(''(*9" LJ?PP" IM?>I" M?MI" MI?OO" ;AD" =>?>>I"
" B'&*6(*9" J@?PL" I@?@>" N?LL" M>?KP" ;BD" =>?>>I"
AQR1Q" A5(*9" I?JN" >?MO" >?IJ" L?JP" ;AB" =>?>>I"
" B(''(*9" I?KM" I?MP" >?JJ" I>?N@" ;AD" =>?>>I"
" B'&*6(*9" L?O>" L?IL" >?JL" JI?PP" ;BD" =>?>>I"
&
&

111
P32 Standard 12-lead Electrocardiogram in Taiwanese Mitral Valve Prolapse Patients and Normal Healthy Controls Yu-Shan Chen1, Yueh Chen1, Ching-Shiun Chang1, Ming-Ju Tsai1, Chia-Chun Lu1, Ing-Fang Yang2,3, Ten-Fang Yang1,3 1 College of Biological Science and Technology, National Chiao Tung University, Hsin-Chu City, Taiwan. 2 Department of Internal Medicine, Jen-Chi General Hospital, Taipei city, Taiwan. 3 Institute of Biomedical Informatics, Taipei Medical University, Taipei city, Taiwan. Background: According to 2008 Taiwan health statatics,cardiovascular diseases rank the second in 10 major causes of death.Standard 12-lead ECG has traditionally been used in the clinical setting as a non-invasive tool for the evaluation of cardiovascular diseases. MVPS (Mitral Valve Prolapse Syndrome) was reported to have various abnormal presentations of ECG findings.Therefore it was thought these different presentations between normal healthy person and MVPS could be researched. Materials and Methods: A total of 591 normal controls(316 women, aged 40.16±14.66 years, and 275 men, aged 42.20±15.35 years) and 55 MVPS(53 women, aged 40.32±11.98 years, and 2 men, aged 26.50±6.36 years) have been recruited for the study from National Chiao Tung University and Taipei Veterans General Hospital as reported previously(Table 1), All the ECG Data was recorded and analysed using Atria 6100 Machine implemented with Glasgow Programme.The ECGs were subsequently stored in a server then retrieved for statistical analysis using Excel.Student s t-test was used to find the differenes between the two groups;The parameters used are heart rate(bpm) PR Interval(ms) QRS duration(ms) QT Interval(ms) P,QRS,T Axis QRS-T angle 4 kinds of Heart Rate related QTc correction formulae(including Bazett Hodges Framingham Fridericia). Results: All ECG parameters were observed to have no significant statistical differences between the MVPS and Normal except PR interval and QRS-T angle(P<0.05)(Table 2). Whereas,QRS-T angle(Fig 1) and Four Heart Rate Corrected QT intervals were found to be statistically significantly different(P<0.05) only in female(Table 3). Couclusions: Generally speaking ,MVPS occurred more frequently in women, all corrected QTc and QRS-T angle appeared to be statistically significantly different,this might be of clinical implications in the future research. Keyword: standard 12-lead ECG, mitral valve prolapsed, QTc formula

112
!"#"$"#$#%&
#&&
Table3: Quantitate comparison of 12-lead ECG parameters between Norml and MVPS only in female. (Two tail Student,s t-test)
Normal(316) MVP(53) P value
HR(bpm) 71.18±9.97 69.66±8.99 0.29
PR interval(ms) 153.21±18.72 151.05±21.74 0.44
QRS duration(ms) 87.31±9.58 86.18±11.68 0.50
QT interval(ms) 401.91±27.37 398.94±22.83 0.45
P axis 50.39±23.40 51.98±24.84 0.65
QRS axis 55.78±25.59 57.88±26.14 0.59
T axis 39.40±20.74 42.90±19.94 0.27
QRS-T angle 25.74±19.70 20.52±13.19 0.01
QTc Bazett(ms) 435.25±21.63 428.00±21.85 0.02
QTc Hodges(ms) 421.49±18.91 415.84±17.41 0.04
QTc Fridericia(ms) 423.62±19.75 417.90±18.44 0.04
QTc Framingham(ms) 423.66±18.96 418.17±17.83 0.04
Table 1.The age and sex distributions of the Normals and MVPS in
the present study (Mean±SD,in years).
Normal healthy MVPS
Gender Age(years)
Gender Age(years)
Total(591) 41.11 ±15.01 Total (55) 39.82± 12.07
Male(275) 42.20 ±15.35 Male(2) 26.50± 6.36
Female(316) 40.16 ±14.66 Female(53) 40.32± 11.98
Table2: Quantitate comparison of 12-lead ECG parameters between Norml and MVPS. (Two tail Student,s t-test)
Normal(591) MVP(55) P value
HR(bpm) 69.73±10.51 69.50±8.89 0.87
PR interval(ms) 156.36±20.25 150.61±22.17 0.04
QRS duration(ms) 90.56±10.59 86.94±13.34 0.05
QT interval(ms) 395.64±28.34 399.56±23.27 0.24
P axis 51.42±21.15 51.52±25.30 0.97
QRS axis 55.07±24.58 57.92±26.07 0.49
T axis 41.69±19.64 42.72±20.30 0.73
QRS-T angle 25.47±20.32 20.54±12.94 0.01
QTc Bazett(ms) 423.80±24.38 428.20±21.73 0.19
QTc Hodges(ms) 412.68±20.77 416.20±17.69 0.22
QTc Fridericia(ms) 413.95±21.71 418.25±18.64 0.15
QTc Framingham(ms) 414.23±21.11 418.55±18.04 0.14
!"#"$"#$#%&
!&&
F ig 1:An example of Normal ECG and MVPS ECG revealed significant QRS-T angle
differences.
Normal 12-lead ECG
MVPS 12-lead ECG
113
P33 The Construction of Protein-protein Interactions Networks of the Congenital QT Interval Syndromes Ching-Shiun Chang1, Chia-Chun Lu1, Ming-Ju Tsai1, Yu-Shan Chen1, Yueh Chen1, Ing-Fang Yang2,3, Ten-Fang Yang1,3 1 College of Biological Science and Technology, National Chiao Tung University, Hsin-Chu City, Taiwan. 2 Department of Internal Medicine, Jen-Chi General Hospital, Taipei City, Taiwan. 3 Institute of Biomedical Informatics, Taipei Medical University, Taipei City, Taiwan. Background: The abnormal repolarization of congenital QT interval syndromes (CQTS) which comprise long QT syndromes (LQTS) and short QT syndromes (SQTS) (Table 1) are usually associated with sudden cardiac death. These monogenic mutations lead to the production of malfunctioning proteins. From the identification of protein-protein interactions (PPI) and metabolic pathways can trace back to ion channels associated genes. The construction of the PPI networks (PPIN) could explore the affected proteins and metabolic pathways that had not been discovered before. Materials and Methods: The Data was obtained from publicly accessible databases (Table 2). The tools to establish the PPIN were Cytoscape and Perl. The PPIN consisted of: (1) PPIN of the CQTS proteins, (2) PPIN of every main protein. Then PPI is searched to find the primary proteins of main protein, and subsequently discover the secondary proteins through the same process. Certain “Hub Proteins” could be found in PPIN to bridge the gaps between individual CQTS (Figure 1). Step 1. Searching the CQTS genes from OMIM first and then main proteins were categorized from SWISS-Prot. For instance, gene of LQTS type 1(LQT1) is KCNQ1 and main protein is KVLQT1. Step 2. Searching main proteins PPI from PPI databases (Table 2) and defining them from the primary proteins. Step 3. Screening the primary proteins from Human species and Heart origin only. Step 4. Repeating the Step 3 to discover the secondary and tertiary proteins. Step 5. Connecting the PPINs of all CQTS and establishing the complete PPIN (Figure 2). Results: The CQTS subtypes were observed to interrelate with each other after PPIN integrated and constructed. All the CQTS has been interconnected with several main proteins and primary proteins to complete the PPIN (Figure 2). After connecting the secondary proteins, the next layer of the networks could be built. Simultaneously, certain “hub” genes or proteins between CQTS subtypes could be discovered. These hub genes or proteins interconnected among the main proteins of each CQTS subtypes. The hub proteins could also be the main proteins, for instance, the KCNE1 (LQT5) and KCNE2 (LQT6) are also the hub proteins of KCNQ1 and KCNH2 formed the component proteins of potassium ion channel. Conclusion: Through PPIN construction, all the CQTS related proteins and metabolic pathways can be clearly illustrated. More hub proteins being discovered might lead to the discovery of novel metabolic pathways. Therefore, this platform might provide a new direction for clinical CQTS genomics research.

114
Table 1. Types of Long QT Syndromes and Short QT Syndromes.
Type G enotype Protein G ene Location Ion channel Function
LQT1 KCNQ1 KvLQT1 11p15.5 Potassium Loss
LQT2 KCNH2 HERG 7q35-q36 Potassium Loss
LQT3 SCN5A Nav1.5 3p21 Sodium Gain
LQT4 ANK2 Ankyrin B 4q25-q27 Sodium, Potassium Loss
LQT5 KCNE1 minK 21q22.1-q22.2 Potassium Loss
LQT6 KCNE2 MiRP1 21q22.1 Potassium Loss
LQT7 KCNJ2 Kir2.1 17q23.1-q24.2 Potassium Loss
LQT8 CACNA1C Cav1.2 12p13.3 L-type Calcium Gain
LQT9 CAV3 Caveolin3 3p25 Sodium Gain
LQT10 SCN4B 11q23.3 Sodium Gain
LQT11 AKAP9 AKAP 7q21-q22 Potassium Loss
LQT12 SNTA1 TACIP1 20q11.2 Sodium Loss
SQT1 KCNH2 HERG 7q35-q36 Potassium Gain
SQT2 KCNQ1 KvLQT1 11p15.5 Potassium Gain
SQT3 KCNJ2 Kir2.1, IRK1 17q23.1-q24.2 Potassium Gain
Table 2. Publicly Accessible Databases.
Databases Descriptions
A. Online Mendelian Inheritance in Man (OMIM) Inherited Disorder Database B. National Center for Biotechnology Information (NCBI)
Gene Database C. European Bioinformatics Institute (EBI)
D. SWISS-Prot Protein Database
E. IntAct
#PPI Database
F. Database of Interacting Proteins (DIP)
G. Human Protein Reference Database (HPRD)
H. Biomolecular Interaction Network Database (BIND)
I. Molecular INTeraction database (MINT)
J. Reactome PPI and Metabolic Pathway
Database K. Biological General Repository for Interaction Datasets (BioGRID) #PPI: Protein-Protein Interactions
F igure 1. The flow diagram of the Protein-Protein Interactions Networks established.
F igure 2. The Protein-Protein Interactions Networks of Congenital QT interval Syndromes.

115
P34 Establishing a Protein-protein Interaction Networks for Hypertrophic Cardiomyopathy Chia-Chun Lu1, Ching-Shiun Chang1, Ming-Ju Tsai1, Yu-Shan Chen1, Yueh Chen1, Ing-Fang Yang2,3, Ten-Fang Yang1,3 1 College of Biological Science and Technology, National Chiao Tung University, Hsin-Chu City, Taiwan. 2 Department of Internal Medicine, Jen-Chi General Hospital, Taipei city, Taiwan. 3 Institute of Biomedical Informatics, Taipei Medical University, Taipei city, Taiwan. Background: Primary Cardiomyopathy is defined by WHO for “myocardial diseases with an unknown cause.” At present, Ventricular muscle structural abnormalities without the evidence of congenital heart disease, coronary artery disease, and hypertensive heart, valve disorders, etc. are categorized as primary Cardiomyopathy. According to WHO Task Force classification, there are Dilated Cardiomyopathy (DCM), Hypertrophic Cardiomyopathy (HCM), Restrictive Cardiomyopathy (RCM), Endomyocardial Fibrosis (EMF). For children, the most common cardiomyopathy is DCM which often leads to heart failure, sudden death or arrhythmia related death. In addition, Arrhythmogenic right ventricular dysplasia can also be attributed to cardiomyopathy, which may lead to severe or fatal supraventricular or ventricular arrhythmias. This study integrates a number of databases with HCM-related genes and proteins (Table 1), through this Protein-Protein Interaction Network (PPIN) to find related genes and proteins. Therefore, to understand the complex interactions between genes and proteins as well as the relationship between metabolic pathways is of clinical significance to identify HCM causes and mechanisms. Materials and Methods: HCM is used as an example in this preliminary study in order to locate genes and proteins that related to HCM and to establish the PPIN (Figure1). Step 1. Publically Accessible Databases used are shown in Table2. Searching the HCM genes from OMIM first and then their corresponding main proteins were categorized from SWISS-Prot. For instance, the gene of HCM type 1 is MYH7 and its corresponding main protein is DISC1 that categorized the main protein. Step 2. Searching the main proteins PPI from the PPI database and then define them from the primary proteins. The database used can be seen in Table2. Step 3. Screening the primary proteins from Human species and Heart origin only. Step 4. Repeating the Step 3 to find out the secondary and tertiary proteins. Step 5. Connecting the PPINs of all HCM subtypes and establishing the complete PPIN in Figure2. Results: PPIN for identified gene MYH7 was established though Cytoscape. Proteins are divided into three layers, the first layer is main proteins (octagonal painted respectively), and the second layer extended from the main proteins are square forms. The third layer were sorted out form those PPI proteins as the round shapes. The establishment of HCM PPIN platform is shown in Figure 2. Conclusion: HCM PPIN is established to demonstrate the inter relationship between all proteins. This might implied in the future that the completion of the full CM PPIN can be of clinical significance.

116
Table 1.!"#$%&!'(!)*+,!
Type Gene Protein Gene Locus Gene Function
*+)-! +.)/! *012304! 56#'&37!8%09#!48037! -:;-<! "834=!(3>06%7?!('14%!@%7%10?3'7!
*+)<! "AA"<! *012304!?1'$'737!"! -;B<! "837!(3>06%7?!1%@C>0?3'7!
*+)B! "D+-! 5"1'$'6#'&37! -E;<<,-! "837!(3>06%7?!1%@C>0?3'7!
*+):! +.FD*B! *012304!6#'&37!G37237@!$1'?%37!*! --$--,<! *012304!6#'&37!G37237@! !
*+)H! DIJKL<! 5MCGC73?N!K+D5=370&%! /;BH! 1%@C>0?'1#!&CGC73?!
*+)/! "AAOB! *012304!?1'$'737!O! -P;-B,:! "837!(3>06%7?!1%@C>0?3'7!
*+)Q! +.RB! S&&%7?30>!6#'&37!>3@8?!48037! B$<-! I%@C>0?'1#!>3@8?!48037!'(!6#'&37!
*+)P! ""A! "3?37! <;B-! "3?37!
*+)-T! +.R<! I%@C>0?'1#!6#'&37!>3@8?!48037! -<;<B5;<:! "834=!(3>06%7?!
*+)--! K*"*-! K4?37! -E;-:! "837!(3>06%7?!('14%!@%7%10?3'7!
*+)-<! *MIDB! *#&?%37%!072!@>#437%51348!$1'?%37!B --$-E,-! D'&3?39%!1%@C>0?'1!'(!6#'@%7%&3&!
Table 2.!"#$%&'%(!)''*++&$%*!,-.-$-+*+/!
Databases Descriptions )/ 01%&1*!2*13*%&-1!415*6&.-1'*!&1!2-1!702428! 415*6&.*3!,&+963*6!,-.-$-+*!
:/ ;-.&91-%!<*1.*6!=96!:&9.*'519%9>(!41=96?-.&91!7;<:48! @*1*!,-.-$-+*!
@*1*!,-.-$-+*!</ A#69B*-1!:&9&1=96?-.&'+!41+.&.#.*!7A:48!
,/ CD4CCE"69.! "69.*&1!,-.-$-+*!
A/ 41.)'.! ""4!,-.-$-+*!
""4!,-.-$-+*!
""4!,-.-$-+*!
""4!,-.-$-+*!
""4!,-.-$-+*!
F/ ,-.-$-+*!9=!41.*6-'.&1>!"69.*&1+!7,4"8!
@/ G#?-1!"69.*&1!H*=*6*1'*!,-.-$-+*!7G"H,8!
G/ :&9?9%*'#%-6!41.*6-'.&91!;*.I96J!,-.-$-+*!7:4;,8!
4/ 29%*'#%-6!4;K*6-'.&91!3-.-$-+*!724;K8!
L/ H*-'.9?*! ""4!-13!2*.-$9%&'!"-.5I-(!,-.-$-+*!
""4!-13!2*.-$9%&'!"-.5I-(!,-.-$-+*!M/ :&9%9>&'-%!@*1*6-%!H*B9+&.96(!=96!41.*6-'.&91!,-.-+*.+!7:&9@H4,8!
!
! ! ! ! ! ! ! ! ! ! !!!!!!!!!!!!!!!!!!!!!!!
!
! ! ! ! ! ! ! ! ! ! ! ! !
Figure 1.!"#$%&$'!()!**+!,-./(&0!-1.$23#14-56!!!!!!!!!!!!!!!! !
Figure 2.!"#$!%%&'!()!*+,-.!

117
P35 Evaluation of Central Hemodynamics by Means of Independent Component Analysis of Thoracic Impedance Signal Renata Simoliuniene1, Algimantas Krisciukaitis1, Andrius Macas1, Kestutis Dregunas, Giedre Baksyte1 1 Kaunas University of Medicine, Kaunas, Lithuania 2 Vilnius University, Vilnius, Lithuania Cardiac output is one of the core parameters in assessing the status of the patient in acute phase of myocardial infarction. The results of non-invasive impedance cardiography method in critical cases are usually controversial. Invasive thermo dilution methods unfortunately are related with risk of complications. Development of information technologies inspired new wave of investigations aiming to improve non-invasive methods. Multivariate analysis methods are giving impressive results when used for decomposition of biomedical signals and images. Thoracic impedance signal (ICG) is a complex signal, components of which reflect respiratory changes of lung impedance and blood volume changes (BVC) in the thorax vessels. Our previous results have shown that structural analysis of simultaneously recorded ICG and ECG is able to separate these two components. Moreover component reflecting BVC reflects a result of left and right ventricle outputs, i.e. it is also a complex signal. Decomposition of which could realize a possibility to evaluate the efficiency of functions of ventricles separately. It could be of great value in cardiac output monitoring in acute phase of myocardial infarction. In this study we illustrate how independent component analysis (ICA) could be used to decompose the ICG into the components reflecting left and right ventricular output. ICA is able to separate independent source signals from the mixtures which are the linear combination of them. The minimal amount of mixtures given for ICA should be equal to the number of independent source signals we want to extract. BVC reflecting component of ICG consists of two components reflecting: a) pulmonary (lesser) blood circulation and b) systemic (greater) circulation. It was used as first mixture. As second mixture we used pulse wave signal simultaneously registered from the limb, which mainly reflects systemic (greater) circulation. ICA extracted two independent components and we used averaged cardiocycle excerpts of them as basis functions for decomposition of every single cardiocycle of BVC reflecting component of ICG. Only one of the coefficients of basis functions showed variation in regard to the respiratory movements. We suppose that this could be a component reflecting pulmonary blood circulation, while morphological variations correlated with respiratory movements were visually observed in BVC component of ICG and not in pulse wave. It is too early to state that we can measure pulmonary circulation, but even monitoring of the dynamics of it in regard to the respiratory movement could be a valuable clinical result.

118
P36 Quantification of Nonlinear Causal Interactions Among Short-term Heart Period, Systolic Pressure and Respiration Variability in Healthy Humans Luca Faes, Giandomenico Nollo Department of Physics, University of Trento, Italy Background: The complexity of cardiovascular and cardiorespiratory control systems prompts for the introduction of multivariate nonlinear techniques to assess directional interactions reflecting short-term spontaneous regulatory mechanisms. On the other hand, the existing multivariate nonlinear approaches lack of reliability when applied on the short (few hundred samples) variability series usually available in practical cardiovascular applications. Materials and methods: We introduce a novel approach to quantify the strength of nonlinear causal interactions in short term cardiovascular variability analysis. The approach is based on embedding the considered multivariate time series through a sequential, non-uniform procedure, and on computing the causal coupling from x to y as the normalized loss of information occurring with the inclusion of samples of x into the embedding vectors used for the description of y (information is quantified by the conditional entropy). It is applied to short variability series (stationary windows of 300 samples) of heart period (HP), systolic pressure (SP) and respiratory flow (RF) synchronously measured in young healthy humans (15 subjects, 25+-3 yrs) in the supine position (Su) and in the upright position (Up) after passive head-up tilt. Results: During Su, a significant unidirectional causal coupling is observed from RF to SP (mean+-SD: 0.071+-0.054) and from RF to HP (0.108+-0.044), documenting the respiratory driving on the cardiovascular variables. Moreover, the causal coupling is higher from HP to SP (0.034+-0.039) than from SP to HP (0.017+-0.022), suggesting a prevalence of the mechanical effects of heart rate on the vasculature over the baroreflex neural effects of arterial pressure on heart rate. During Up, the causal coupling is preserved from RF to SP (0.058+-0.045) but decreases significantly from RF to HP (0.019+-0.040), indicating that head-up tilt induces a dampening of respiratory sinus arrhythmia. Moreover, the causal coupling is increased significantly from SP to HP (0.101+-0.051) leading to a statistically significant prevalence over the opposite coupling from HP to SP (0.046+-0.045); this result can be ascribed to the activation of the baroreflex control of circulation solicited by the activation of the sympathetic nervous system occurring in the Up position. Conclusion: The proposed approach based on non-uniform multivariate embedding and conditional entropy evaluation is feasible to assess nonlinear causality in short-term cardiac variability signal analysis. The obtained results describe complex cardiovascular and cardiorespiratory interactions in accordance with known physiological regulatory mechanisms.

119
P37 Effects of the Tilt Training on Neurally Mediated Syncope - a Study on the Autonomic Nervous Activities in Normal Subjects Hideki Kumagai1, Machiko Yamamoto1, Kana Yamada, Kentarou Kaneko, Yu Ogata 1 Ibaraki Christian University, Japan 2 Glaxo Smith Kline, Japan 3 Yamagata Universitu Hospital, Japan Background: Although tilt training is known to be a medical treatment of neurally mediated syncope, the mechanism of effects is not clear. Purpose of the study was to investigate the changes of the autonomic nervous activities after tilt training. Objects and methods: Nine healthy males (mean age 22.2years) performed tilt training for four weeks (30minute 2times/day), and the head-up tilt test (75-degrees, 15 minutes) was done every week. Heart rate, heart rate variability (Coarse Graining Spectral Analysis method : high frequency, low frequency/high frequency) and baroreflex sensitivity (sequential method) before tilt training were compared with those after tilt training. Result: The results were showed following the table. After tilt training, heart rate showed significant decrease (68 62 P<0.05), and high frequency showed significant increase (464 1137 P<0.05) at rest tilt training, an increase of low frequency/high frequency during tilt training was suppressed 5.8 4.4 P<0.05 . Actually, these subjects performing rates of tilt training were 74% at frequency and 57% at duration. Conclusion: It was confirmed that tilt training made reserve of the parasympathetic nervous activities increase, and an increase of sympathetic nervous activities during head-up tilt training was suppressed. This might be the mechanism of tilt training effects in neurally mediated syncope.

120
P38 HRV Analyzer with Time and Shape Variation-Based Qualifier Piotr Augustyniak AGH University of Science and Technology, Kraków, Poland Background: In wearable ECG-based health monitors, the energy consumption is of primary importance and thus low-power solutions for data processing and transmission are highly desirable. Considerable energy savings may be also achieved by using of low complexity algorithms, but unfortunately the assessment of the heart rate variability, a crucial factor of human activity, requires complicated qualification of heartbeats and further processing of the tachogram. The aim of our research is to split the computational task into two processes: low-power signal analysis and tachogram analysis performed by the wearable system and by the workstation respectively. The data stream linking both processes consists of beat attributes (RR and type) and requires low-bandwidth wireless connection. Materials and methods: The signal analysis is performed by a wearable server integrating the body sensor network (BSN) including the ECG acquisition module and providing long distance communication with the external workstation. In the prototype application the PDA was used, however the target platform is a Bluetooth-enabled smartphone. The split of the HRV analysis is determined by the point of significant data reduction which occurs after the beats qualification. From the extended autonomy viewpoint is thus important to use energy-optimized algorithms for beat detection and qualification. The latter is not expected to distinguish all beat types, but to discriminate the sinus rhythm from the episodes and arrhythmias. For this purpose, the analysis of beat-to-beat shape variations and RR-interval variation is used. Once the detection point is determined, signal samples of two adjacent heart beats are compared. Large differences in beat shapes and in RR intervals indicate the occurrence of extra beats that need to be excluded from HRV analysis. Erroneous exclusion of a true sinus beat is not influencing the HRV parameters if occurs occasionally. Results: Two implementations of the beat qualifier were made: one replacing the standard procedure of a pre-commercial software with an aim to evaluate the accuracy, and second in a PDA to assess the power requirements. With a custom-collected dataset of thirty 24-hours recording, the 37521 beats (out of 3219742, i.e. 1.17%) were misclassified, influencing the accuracy of SDNN, RMSSD and SDANN by 0.35%, 0.12% and 0.09% respectively. The power requirement increased by the beat qualifier-related calculation was estimated to 37 microwatts. Conclusion: Time and shape variation-based qualifier is sufficiently accurate for home monitoring and applicable in a low-power wearable device such as smartphone.
121
P39 Low Heart Rate Variability in Children with Fontan Circulation Palliated with Extracardiac Conduit Jenny Alenius Dahlqvist, Marcus Karlsson , Urban Wiklund, Rolf Hörnsten, Eva Strömvall-Larsson, Katarina Hanseus, Annika Rydberg 1 Department of Clinical,University Hospital of Umeå Sciences,Pediatric Cardiology,University Hospital of Umeå 2 Department of Biomedical Engineering,University Hospital of Umeå 3 Department of Surgical and Perioperative SciencesUniversity Hospital of Umeå 4 Queen Silvia Children´s Hospital, Sahlgrenska University Hospital, Gothenburg 5 Department of Pediatrics Clinical Science, Lund University Background: The surgical technique in Fontan operation for univentricular heart has developed from lateral tunnel towards extracardiac conduit in order to reduce long-term complications. Earlier studies have shown lower heart rate variability (HRV) in patients with Fontan circulation palliated with lateral tunnel (LT) as compared to healthy controls. This study investigates HRV parameters in children with Fontan circulation including both patients palliated with LT and extracardiac conduit (EC). Material and methods: During a national inventory of children who had undergone a Fontan procedure, 110 patients, 71 boys and 39 girls (66 LT and 44 EC) underwent Holter-ECG analysis including RR-intervals and power spectrum analysis of HRV (Total power TP, Low frequency LF, high frequency HF). Results: The mean age at Holter for the whole patient group was 9.0 years (range 0.7-16.4); LT 10.1 years (range 0.7-16.4) and EC 7.3 years (range 2.2-12.2). Children with Fontan circulation (both LT and EC) showed significantly longer RR interval as compared to controls (p= 0,0015) and sinus node dysfunction was found in 38 patients (34.5%). Regarding HRV, the children with Fontan circulation showed significantly lower total power (p<0.001); VLF (p=0.009); LF (p<0.001) and HF (p<0.001) as compared to healthy controls (Fig 1). As there were no patient with EC older than 13 years, comparisons between EC and LT were performed for three groups of subjects under 13 years: 52 patients with LT, 43 patients with EC and 46 controls. We found a significant reduction in HF and LF/HF in both LT (p=0.040 and p=0.014) and EC (p=0.009 and p=0.006) as compared to controls. There was also a tendency to lower HRV among the patients with EC compared to controls in total HRV (p=0.1108) and LF (p=0.057). We could not find any significant difference in HRV between the children palliated with LT and EC (total HRV, p= 0.312; HF, p= 0.258; LF, p= 0.208). An interesting finding was that 4 patients with extremely low HRV were operated with extracardiac connection (Fig 1). Conclusion: A new finding in this study was the significantly lower HRV parameters found in children with extracardiac conduit as compared to healthy controls. Four patients with extremely low HRV were palliated with extracardiac conduit - a finding that needs to be further investigated.

122
P40 Risk of ECG and Pain Symptoms for Mortality Among Adult Moscow Cohort Galina Muromtseva, Alexander Deev, Svetlana Shalnova, Anna Kapustina, Vladimir Konstantinov National Research Center for Preventive Medicine, Moscow, Russia The aim was to estimate the relative risk of ECG changes and specific pain symptoms on coronary heart disease (CHD), cardiovascular (CVD) and total mortality (CHDM, CVDM, TM). The results of the prospective follow up study of 9393 men and 3334 women aged 25-64 for randomly selected cohorts from Moscow free living population examined by standard epidemiologic methods in 1975 to 2001 years were investigated. To the middle of 2009 in follow up 242718 person-years was observed with 5765 deaths identified. The mortality data was received from the reliable official city source. The causes of death were coded by ICD-8 and classified into CHD, CVD and TM groups. ECGs were coded by Minnesota code (MC). The pain was classified according to WHO (Rose) questionnaire. A relative mortality risk (RR) was estimated using single-factor age-adjusted Cox model. The results were presented as RR and 95% CI. The TM in cohort was 23.8±0.3 TPY. Among men the maximal RR for CHDM was in the following groups: A.“major QQS codes” (MC 1-1-1 to 1-1-7 or 1-2-1 to 1-2-7) – RR=5.6 (4.5-6.8); B.“pain and ischemic ECG abnormalities” – RR=9.3 (6.8-12.6); C.“pain and minor QQS codes or nonspecific ECG abnormalities” (Rose+, MC 1-2-8, 1-3-1 to 1-3-6, 3-1, 3-3, 4- or 5- codes) – RR=3.3 (2.5-4.3); D.“major ST-T abnormalities” ( C 4-1, 4-2, 5-1, 5-2 without 3-1, 3-3) – RR=3.1 (2.4-4.1); F.“major arrhythmias/conduction defects” ( C 6-1, 6-8, 7-1, 8-3) – RR=3.8 (2.5-5.9). A risk for CVDM was lower except D and F groups as comparison for CHDM. TM risk was 1.4-2.3 times lower than CHDM risk. Among women maximal RR’s for CHDM were in D, F and B groups: RR=3.7, 3.1 and 3.1, respectively. For CVDM maximal RR’s remained only in two first groups – 2.9 and 3.1, respectively. In group A minimal RR for CHDM was 0.8, and for TM – 1.7. Men had higher RR for TM in A and B groups as compared with women. The ECG and pain groups were combined into the variable “CHD screening symptoms” with 3 states “no CHD/possible CHD/definite CHD”. For all mortality groups RR’s in “definite CHD” were higher than in “possible CHD” regardless of sex. Conclusion. As provided by the analysis above this classification may be used as CHD prevalence criteria for both sexes.

123
P41 Irregular Heart Rate Patterns during the Deep Breathing Test in Patients with Familial Amyloidotic Polyneuropathy Urban Wiklund1, Rolf Hörnsten2, Ole B Suhr3 1 Department of Biomedical Engineering, University Hospital, Umeå, Sweden 2 Department of Clinical Physiology, University Hospital, Umeå, Sweden 3 Department of Medicine, University Hospital, Umeå, Sweden Background: In healthy subjects, the heart rate is highly synchronised with respiration during deep breathing at low rates. Therefore, cardiac autonomic function is often assessed during deep breathing, as in several on-going pharmacological trials in patients with Familial Amyloidotic Polyneuropathy (FAP). These patients often present reduced heart rate variability (HRV) due to severe autonomic dysfunction. However, subtle arrhythmias are also common, resulting in “falsely” increased HRV that can be misinterpreted as normal findings. Material and methods: The study is based on previously performed clinical examinations in 61 FAP-patients (age 25-66 years) and 88 recordings from healthy subjects (age 25-65 years). ECG and respiration was recorded during one minute of paced deep breathing (6 breaths/min, with inspiration for approximately 5 s). HRV was quantified by the variance of all R-R intervals (RR_var), and by the average of the differences between the maximum and minimum heart rate within each of the six 10-s respiratory cycles (DB_index). The regularity in the 1-min sequences was assessed as follows. R-R intervals and respiration were synchronised by cubic spline interpolation and re-sampling at 5 Hz. A Fourier series model with 18 harmonics was estimated for each signal, with the first component at 1/60 Hz. The power Pi of each harmonic was determined from the amplitude of the sinusoidal components. Since many of the recorded breathing and heart rate patterns were not purely sinusoidal, several harmonics was expected: a main component at 0.1 Hz (corresponding to the 6th harmonic) and components at 0.2 Hz (12th harmonic) and 0.3 Hz (18th harmonic). The relative power of these three harmonics was used as an index of the regularity of the signals (RI, regularity index), where RI=(P6+P12+P18)/RR_var. Results: We excluded 28 recordings (10 patients and 18 controls) with irregular breathing signals (RI for respiration <0.70). Table 1 shows the results. Note that 11/51 (22%) of patients presented both low values of RI and normal values of both HRV indices, indicating highly irregular fluctuations in R-R intervals (Figure 1). Conclusion: FAP patients presenting high HRV during deep breathing may have highly irregular heart rate patterns, even though they maintained a steady rhythm in respiration during the test. Further studies are needed to examine whether these abnormalities reflect parasympathetic dysregulation or cardiac arrhythmias, and if they are triggered by the deep breathing test.

124
!!"#$%&!'(!)&#*+,&*!-.!/01!#23!45&!3&4&,672&3!,&8+%#,749!723&:!.-,!;<=!>#47&24*!#23!?-24,-%*!! ;<=!>#47&24*!@2AB'C! D-24,-%*!@2AEFC!/01!6&#*+,&*! 0G F(H! F(HI0G F(E! 0GJF(E! 0G F(H! F(HI0G F(E! 0GJF(E!KLM723&:! E!$*N672! 'H! 'O! B! F! P! O!KLM723&:JE!$*N672! ''! P! Q! '! P'! PP!00MR#, 'FFF!6*O 'P! 'O! Q! F! P! O!00MR#,J'FFF!6*O 'O! P! B! '! P'! PP!!!!
!
!! ! ! Time (seconds) !!;78+,&!'(!SDT!,&?-,3&3!3+,728!3&&>!$,늠(!"->U!5&#%459!*+$V&?4!@KLM723&:APF!$*N672C(!L-44-6U!;<=!>#47&24!W745!,&%#47R&%9!2-,6#%!6&#*+,&*!-.!/01!@KLM723&:A'B!$*N672C!$+4!7,,&8+%#,!5&#,4!,#4&!.%+?4+#47-2*(!!

125
P42 Peculiarities of ECG Parameters Variability during Two Relaxation Techniques in Men After Myocardial Infarction Aura Leonaite, Alfonsas Vainoras Department of Kinesiology and Sports Medicine, Kaunas University of Medicine, Lithuania Background: There is little information regarding the dynamics of ECG parameters during any relaxation technique in post-MI patients. We sought to determine whether there are any distinctive dynamics in ECG parameters variability during two different relaxation techniques. Materials and methods: 20 hospitalized men (age 58 +/- 7,07) participated in two laboratory sessions in which they practiced mindfulness body scan meditation (MBSM) and progressive muscular relaxation (PMR). A computerized ECG analysis system “Kaunas-load W03”, developed by the Institute of Cardiology of Kaunas Medical University, was applied for 12 lead ECG recording and analysis. ECG was recorded for 30 min lying quietly: 5 min before, 20 min during and 5 min after each performed technique. Participants listened via headphone to audio recorded relaxation instructions: first practiced MBSM, during the second session participants practiced PMR. The dynamics in variability of durational indices (RR, dJT, dQRS) and amplitude indices (aR, aST1, aT1) were analyzed. All the data is presented as M ± SEM. Results: Both relaxation techniques produce significant changes in analyzed ECG parameters. These changes in high, low and very low frequency bands are significantly different from those produced by a period of just lying quietly. Total RR variability during MBSM increased 98,25 +/- 20,72 ms^2, during PMR 107,25 +/- 58,05 ms^2. Total dJT variability increased 16,8 +/- 4,88 ms^2 during MBSM and 19,8 +/- 6,51 ms^2 during PMR. Accordingly total variability of dQRS increased 6,15 +/- 1,48 ms^2 and 11,55 +/- 3,32 ms^2, of aR: 50,75 +/- 10,96 ms^2 and 101,75 +/- 15,91 ms^2; of aST1: 22,15 +/- 1,06 ms^2 and 37,1 +/- 7,78 ms^2; aT1: 10,45 +/- 3,01 ms^2 and 19,8 +/- 6,15 ms^2. Conclusion: Both relaxation techniques increase the variability of analyzed ECG parameters. The results indicate similarities in the ECG parameters variability responses to two different relaxation techniques.

126
P43 Heart Rate Turbulence in Patients with Previous Myocardial Infarction and History of Malignant Ventricular Arrhythmias- with Regard to Left Ventricle Function. Krzysztof Szydlo, Witold Orszulak, Maria Trusz-Gluza, Michal Orszulak, Katarzyna Kniewska-Jarzabek, Michal Marzec Medical University of Silesia, Katowice, Poland Heart rate turbulence (HRT) is well known, simple risk stratification method very often used in patients with previous myocardial infarction (MI). However, up to date, the relationship between different levels of impairment of the left ventricle (LV) function and HRT stratification ability in patients after MI is still not well assessed. Purpose of the study was to find out what, if any, differences in HRT might be found between patients with previous MI with and without history of malignant ventricular arrhythmias (ventricular tachycardia and/or ventricular fibrillation- VT/VF), and with different impairment of LV function measured with standard echocardiography (LV ejection fraction- LVEF). Methods: The cohort of 158 patients with MI was examined retrospectively. Two groups of patients were compared: 94 patients with VT/VF, all with ICD implanted as secondary prevention (83 males, age: 67±9 years, LVEF: 34±11%, VT/VF group) and 64 patients without VT/VF (55 males, age: 65±10 years, LVEF: 42±12%, NoVT/VF group). HRT was assessed from Holter recordings using HRTView software (commercial version). Turbulence onset (TO) and turbulence (TS) were used. HRT parameters were calculated if the number of PVC was >5 and <2400/recording. LVEF<35% was regarded as severe LV function impairment. Results: Study groups did not differ in age, gender and treatment. LVEF was lower in VT/VF group (p<0.005). The significant, but weak, relationships between LVEF and HRT were found (r=-0.3, p<0.05 for TO and r=0.34, p<0.05 for TS, respectively). There were none remarkable relationships between the number of PVCs and HRT. VT/VF patients had higher TO: -0.22±1% vs. –0.8±2%, p<0.005 and lower TS: 2.6±1.9 ms/rri vs. 4.1±3.5 ms/rri, p<0.025 than NoVT/VF group. Similar differences were found for patients with LVEF≥35%- TO: -0.5±1% vs. –1.1±2%, p=0.07 and TS: 2.6±1.5 ms/rri vs. 4.9±3.7 ms/rri, p<0.005; respectively. HRT parameters did not differentiate patients with LVEF<35%: - TO: 0.01±1% vs. 0.1±1.5%, p=0.92 and TS: 2.5±2.2 ms/rri vs. 2.0±1.3 ms/rri, p=0.60 for VT/VF vs. NoVT/VF respectively, however 29/53 (55%) VT/VF patients had HRT2 class (both TO and TS abnormal) vs. 7/19 (37%) patients in NoVT/VF group (p=0.16). Conclusions: Heart rate turbulence is diminished in post-MI patients with the history of malignant ventricular arrhythmias. It is especially observed in patients with preserved LV function.

127
P44 Correlation between Norepinephrine Plasma Levels and Poincarè Plot Indexes of Heart Rate Variability in Heart Failure Patients Gianni D'Addio1, Gian Domenico Pinna2, Mario Cesarelli3, Roberto Maestri2, Maria Teresa La Rovere2, Graziamaria Corbi4, Tanja Princi5, Nicola Ferrara1, Franco Rengo1 1 S. Maugeri Foundation, IRCCS - Telese Terme, Italy 2 S. Maugeri Foundation, IRCCS - Montescano, Italy 3 Department of Biomedical, Electronic and Telecommunication Engineering, University "Federico II", Naples, Italy 4 Department of Health Sciences, University of Molise, Campobasso, Italy 5 Department of LIfe Sciences, University of Trieste, Trieste, Italy Background. Higher neurohormonal activation levels are known markers of severity and adverse prognosis in heart failure (HF) patients. Classical linear indexes of heart rate variability (HRV) have been shown to be associated with neurohormonal activation. Whether and to what extent non linear Poincarè plot indexes (PPI) of HRV reflect similar relationship is not known. Purpose of the study was to assess the association of PPI with plasma norepinephrine (NPE) levels as compared to classical linear indexes of HRV. Methods. Ninety-nine stable mild-to-moderate HF patients in sinus rhythm (age: 51±8 years, NYHA class II-III 88%, LVEF 24±6 %, VO2max during exercise tests 14±4 ml/Kg/min) were studied. Each patient had a 24-hour Holter recording and, besides standard clinical and laboratory examinations, underwent within one week plasma NPE assay. The SDNN and the power in the low frequency band (LFP, 0.04-0.15 Hz) were computed on consecutive 5-min RR sequences, these linear indexes have been shown to have the highest prognostic value in HF patients. PPI were obtained by automated quantification of the bi-dimensional length (L) and tri-dimensional (peak’s number Np, radii of the semi-ellipse of inertia Px, Py, Pz) morphological characteristics, with a technique whose good reproducibility has been previously shown by the authors. The association between HRV and neurohormonal indexes was assessed by Spearman’s correlation coefficient. Results. NPE, LFP and SDNN were respectively (mean ± SD): 363±210 pg/l, 162±171 ms2, 36±15 ms. PPI were L=576.5±189.9 ms; Np=28.01±19.38; Px=56.36±21.31 ms; Py=113.1±29.44 ms; Pz=101.6 ±43.36 ms. Both SDNN and LFP showed a moderate but significant negative correlation with NPE levels (r=-0.37 and -0.44 respectively, p<0.0001), while a weaker association was found for L, Np and Py ranging from r=-0.33 to -0.25, p<0.0001). Conclusions. These findings suggest that, although patterns of beat-to-beat variability quantified by PPI provide useful information in the assessment of cardiac autonomic control impairments, the power in the low frequency band appears to reflect more closely the level of adrenergic activation of HF patients.

128
P45 The Diagnostic of ARVD in Patients with Nonishemic Right Ventricular Arrhythmia Elena Parmon, Tatiana Treshkur, Dmitry Lebedev, Lyubov Mitrofanova, Nikolay Mitrofanov, Eugene Shlyakhto The Federal Heart, Blood and Endocrinology centre named after V.A.Almazov, Saint-Petersburg, Russia The course of frequent ventricular ectopy is sometimes an arrhythmogenic right ventricular dysplasia (ARVD). Accurate analysis of history, ECG, endomiocardial byopsy and magnetoresonance tomography (MRI) is necessary. Right ventricular outflow tract (RVOT) ectopy is the most common arrhythmia seen in individuals with ARVD. Materials and methods: We made follow-up of 411 patients with nonishemic ventricular arrhythmia during 9±3,5 years. Medical history, ECG, ETT, echocardiography were performed in all cases, MRI - in 32 patients, endomyocardial biopsy (EMB) during catheter ablation - in 28 patients. On 09.2009 ARVD diagnosis was established in 8 patients (3 men, 38,9±16,5 y.o.). A diagnosis was based on a combination of major and minor criteria (McKenna W.J. et al, 1994). In all cases RVOT tachycardia with mean ventricular rate=180±23 per minute were observed, mainly in day time. ETT revealed an exercise-induced ventricular arrhythmia in all cases. Conduction abnormalities in the right leads were present in 5 patients. Significant right ventricular dilatation and decreased RV ejection fraction (EF) were – in 2, family history – in 2 patients. EMB revealed specific tissue characterization for ARVD in 6 and MRI – local adipose loci – in 6 cases. 2 major diagnostic criteria were in 4 patients (50%), 1 major and 2 minor – also in 4 (50%). From 8 patients in 4 there were 4 minor criteria. It is important to note that 1 women with RV dilatation and decreased EF, epsilon wave, prolongation of QRS in V1-V3 died suddenly 3 years after diagnosis establishment, in other cases arrhythmia did not progress (duration of disease 10,5±2,3 years). All patients used beta-blockers by individual doses. Clear diagnosis of ARVD might be established in more number of cases if MRI and EMB were performed more often.

129
P46 Gender Influences on the Autonomic Nervous System in Patients with Sudden Cardiac Death. Elena Parmon, Anna Tsvetnikova, Edward Berngardt, Tatiana Treshkur, Eugene Shlyakhto The Federal Heart, Blood and Endocrinology centre named after V.A.Almazov, Saint-Petersburg, Russia At present according to the literature heart rate turbulence (HRT), heart rate variability (HRV), circadian index (CI) dependant on a gender in healthy subjects are studied actively. However, gender features of these parameters in patients with ventricular arrhythmias (VA) and subsequent sudden cardiac death (SCD) have been investigated insufficiently. The aim of the study: to study influence of a gender on parameters of a autonomic cardiac regulation in patients with VA and SCD. Methods: Holter recordings ("INCART", Russia) from 16 patients died suddenly with VA of high grades have been analyzed: 4 women formed I group, mean age = 61,5±16,6 years (1 – without IHD (idiopathic VA), 3 – with IHD (myocardial infarction); II group included 12 men, 55,4±14,5 year, (2 - without IHD (1 – with arterial hypertension, arrhythmogenic right ventricular dysplasia, 1 – idiopathic VA, with implanted cardioverter-defibrillator), 10 – with IHD (myocardial infarction)). Average values of HRT numerical parameters (TO and TS), HR for a day and night, CI, HRV parameters (SDNN, SDANN, rMSSD) were calculated. Obtained values were compared with normal ones and between the groups. Results: pathological values of TO parameter were met in II-nd group, in comparison with I-st group - 67 % vs 33%. Analyzing TS parameter, it is revealed, that it also with the greater frequency pathological in II-nd group in 17%. In I-st group the TO values were normal. TO absolute values in I-st group were higher for double PVC (2,80±8,08% vs -0,02±2,45 %), and TS were lower for double PVC and VT (3,60±1,41 and 5,67±0,01 ms/beat vs 6,80±5,13 and 8,30±9,05 ms/beat, accordingly). HR within a day (76,0±15,5 beat/min – during the day and 65,3±13,5 beat/min – during the night) and reduced CI (1,18±0,11) were identical in the both groups. Lower values of HRV parameters were observed in I-st group of patients, in comparison with II-nd group: SDNN – 87,5±13,4 ms vs 120,6±57,8 ms, SDANN – 81,5±16,3 ms vs 110,7±59,5 ms, rMSSD – 19,0±4,2 ms vs 21,7±9,7 ms. Conclusions: among patients with SCD men had a pathological response of sinus node as the abnormal HRT for all grades of VA more often, than women, but in women TO and TS absolute values were lower in the presence of similar HR and lower HRV. Gender differences on the autonomic nervous system in patients with sudden death exist and need to study.
130
P47 Comparison of Subjects with QTc Values Exceeding Pre-specified Upper Limits in a Thorough QT (TQT) Study using Five Different Methods of QT Interval Measurement Vaibhav Salvi, Gopi Krishna Panicker, Pooja Hingorani, Arumugam Ramasamy, Mili Natekar, Dilip R Karnad, Snehal Kothari1, Dhiraj Narula Quintiles Cardiac Safety Services, Mumbai, India Background: Various methods are used to measure the QT interval in TQT studies; absolute QT/QTc intervals may vary with different methods although change from baseline may be similar. Whether the method of QT measurement influences the incidence of outliers is not known. Objective: To compare the frequency of categorical outliers when QT interval was measured by 5 different methods in ECGs recorded in volunteers treated with placebo and moxifloxacin (a drug that prolongs the QT interval). Methods: Five replicate digital ECGs recorded 1 minute apart at 14 time-points in 39 subjects during placebo and moxifloxacin treatment in a TQT study with a crossover design were analyzed in a core ECG laboratory; pre-dose ECGs were considered as baseline. QT interval was obtained by (1) threshold method in Lead II (end of T = point where T wave reaches baseline), (2) longest QT (QT by threshold method measured in all 12 leads), (3) tangent method in Lead II (end of T = point where line drawn through the maximum slope point of the descending limb of the T wave intersects the baseline obtained by joining q wave onset of consecutive beats), (4) global median beat GMB (automated output from the ELI 250 electrocardiograph) and (5) superimposed median beat (SMB). QT interval was corrected for heart rate by Bazett’s (QTcB) and Fridericia’s (QTcF) formulae. Results: For the 2730 ECGs analyzed, QTcF corrected for heart rate better than QTcB. The proportions of outliers for absolute QTcF (Table I) and QTcF change from baseline (Table II) were comparable by Lead II threshold, SMB and GMB methods. The proportion of outliers as well as numbers in the higher categories was significantly higher with the Lead II tangent method than these three methods. Number of outliers was highest by the Longest QT method. Proportions of outliers for change from baseline in QTcF were significantly greater in the moxifloxacin group than in the placebo group for all methods. Similar results were observed with absolute values of QTcF with all QT measurement methods, except for the Lead II threshold and longest QT methods, where the difference between placebo and moxifloxacin did not reach statistical significance. Outliers in the highest categories (QTcF >480ms and change from baseline >60ms) were observed only with the Lead II tangent and Longest QT methods. Conclusion: The method of QT interval measurement must be taken into account when interpreting outlier data from TQT studies.
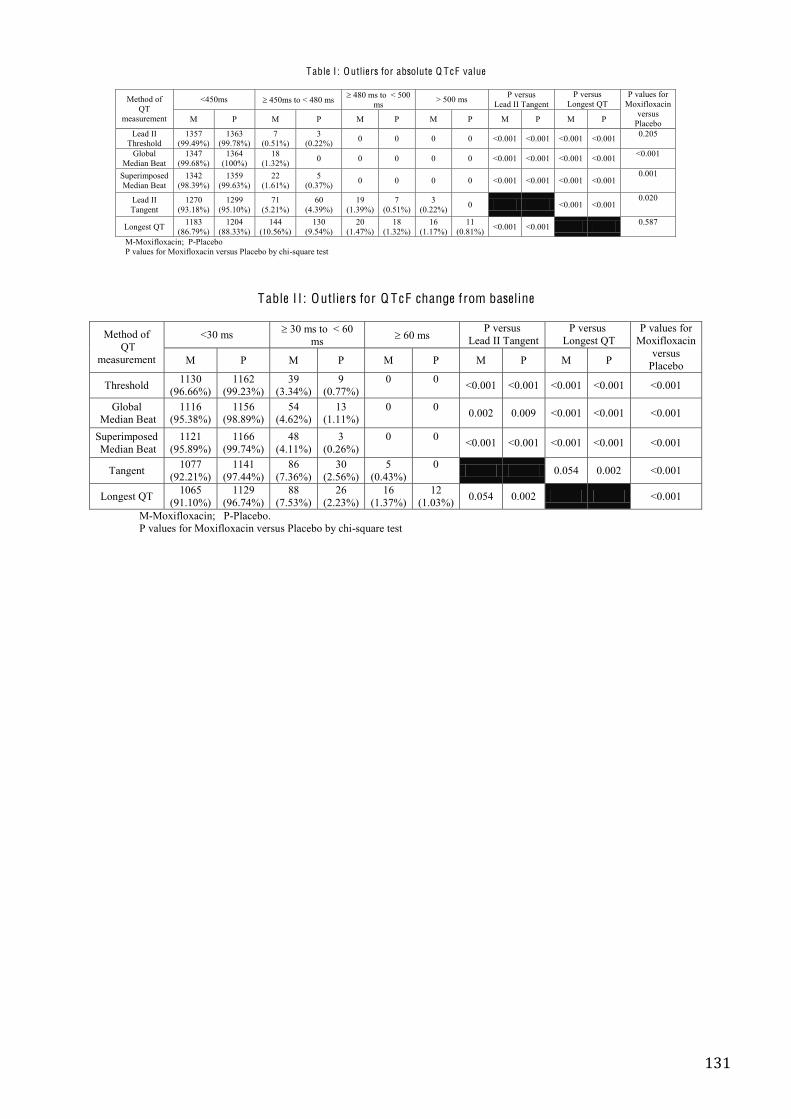
131
Table I : Outliers for absolute Q T cF value
Method of
QT measurement
<450ms 450ms to < 480 ms 480 ms to < 500 ms > 500 ms P versus
Lead II Tangent P versus
Longest QT P values for
Moxifloxacin versus
Placebo M P M P M P M P M P M P
Lead II Threshold
1357 (99.49%)
1363 (99.78%)
7 (0.51%)
3 (0.22%) 0 0 0 0 <0.001 <0.001 <0.001 <0.001 0.205
Global Median Beat
1347 (99.68%)
1364 (100%)
18 (1.32%) 0 0 0 0 0 <0.001 <0.001 <0.001 <0.001 <0.001
Superimposed Median Beat
1342 (98.39%)
1359 (99.63%)
22 (1.61%)
5 (0.37%) 0 0 0 0 <0.001 <0.001 <0.001 <0.001
0.001
Lead II Tangent
1270 (93.18%)
1299 (95.10%)
71 (5.21%)
60 (4.39%)
19 (1.39%)
7 (0.51%)
3 (0.22%) 0 <0.001 <0.001
0.020
Longest QT 1183 (86.79%)
1204 (88.33%)
144 (10.56%)
130 (9.54%)
20 (1.47%)
18 (1.32%)
16 (1.17%)
11 (0.81%) <0.001 <0.001 0.587
M-Moxifloxacin; P-Placebo P values for Moxifloxacin versus Placebo by chi-square test
Table I I : Outliers for Q T cF change from baseline
Method of
QT measurement
<30 ms 30 ms to < 60 ms 60 ms
P versus Lead II Tangent
P versus Longest QT
P values for Moxifloxacin
versus Placebo M P M P M P M P M P
Threshold 1130 (96.66%)
1162 (99.23%)
39 (3.34%)
9 (0.77%)
0
0 <0.001 <0.001 <0.001 <0.001 <0.001
Global Median Beat
1116 (95.38%)
1156 (98.89%)
54 (4.62%)
13 (1.11%)
0
0 0.002 0.009 <0.001 <0.001 <0.001
Superimposed Median Beat
1121 (95.89%)
1166 (99.74%)
48 (4.11%)
3 (0.26%)
0
0 <0.001 <0.001 <0.001 <0.001 <0.001
Tangent 1077 (92.21%)
1141 (97.44%)
86 (7.36%)
30 (2.56%)
5 (0.43%)
0 0.054 0.002 <0.001
Longest QT 1065 (91.10%)
1129 (96.74%)
88 (7.53%)
26 (2.23%)
16 (1.37%)
12 (1.03%) 0.054 0.002 <0.001
M-Moxifloxacin; P-Placebo. P values for Moxifloxacin versus Placebo by chi-square test

132
P48 Model-Based Interpretation for Two Types of Distribution Patterns of Bigeminy and Trigeminy in Long-Term ECG Noriaki Ikeda1, Kan Takayanagi2, Akihiro Takeuchi1, Kai Ishida1, Noritaka Mamorita1, Hideo Miyahara1 1 Department of Medical Informatics, Kitasato University, Sagamihara, Kanagawa, Japan 2 Dept. of Cardiology, Dokkyo Medical University Koshigaya Hospital, Saitama, Japan Background: The rate of appearance of ventricular premature contraction (VPC) is known to depend on the heart rate (HR) in analyses of Holter ECG, the exercise stress test of ECG, etc. Different patterns of HR-dependency of the VPC appearance have been reported: increase in VPC frequency as the HR increases, decrease in VPC frequency, non-monotonous changes, and disappearance of VPC. Takayanagi et al. reported two types of distribution patterns of bigeminy and trigeminy when they plotted VPC frequency of Holter ECG data using the coupling interval between a VPC and the next normal sinus beat (XN) as the abscissa. They defined, on this histogram, the trigeminy-bigeminy order of appearance (with increasing XN) as type S (standard) and the bigeminy-trigeminy order as type R (reverse). The purpose of this study is to give an interpretation to this phenomenon using a mathematical model of parasystole. Materials and methods: We assumed a modulated parasystole model and formulated the model as a system of difference equation, tn+1 = f (tn, Ts, Te, PRC), in a phase tn of the sinus pacemaker’s stimulus on the ectopic pacemaker, where Ts is the sinus cycle length, Te, the ectopic pacemaker's cycle length, and PRC, the phase response curve of the ectopic pacemaker. A symbolic formula processor (MathCad) was employed to obtain the stable solutions of ECG patterns, bigeminy, trigeminy, etc. Results: We theoretically obtained a map of existence regions (Fig. 1) of bigeminy (two types), trigeminy (four types), quadrigeminy, and apparently normal ECG as two-dimensional areas on a w-Ts/Te plane, where w is a break point of the phase response curve. We also derived a linear relationship between XN and Ts, and produced a solution map on w-XN plane. Clinically observed VPC distributions were explained from these maps; when w was large and Ts/Te<0.5, bigeminy was followed by trigeminy as XN increased, and when w was small and Ts/Te>0.5, the order was reversed. Conclusion: We have shown that the two types of distribution patterns of bigeminy and trigeminy and the related properties were explained by the modulated parasystole model, although other mechanisms such as reentry, delayed afterdepolarization, etc. might not be excluded.
[ Fig.1 Existence region of stable solution on the w -Ts/Te plane. There are two bigeminy (cyan), four trigeminy (yellow), two quadrigeminy (green), and between them, the combinations of these patterns (grey) and the silent (dot) are recognized. ]

133
P49 Method of Holter Monitoring in the Epydemiological Study of Elderly People with Experience of Starvation in the Childhood during the Siege of Leningrad in 1941-1944 Maria Shkolnikova1, Maria Baturova2, Michael Medvedev2, Irina Aparina2, Yuri Shubik2, Vladidmir Shkolnikov3, James Vaupel3 1 Russian Federal Center for children’s arrhythmia, Moscow, Russia 2 North-West Centre for Diagnostics and Treatment of Arrhythmias of St-Petersburg State Medical Academy by I.I.Mechnikov, St-Petersburg, Russia
3 Max Planck Institute for Demographic Research, Rostock, Germany The study uses the Holter monitoring for evaluation of the effects of the Leningrad Siege of (1941-1944) experienced in different periods of childhood on the cardiovascular system in later life. Methods and materials: The study is a part of the pilot project “Stress and siege-effects on biomarkers of health in aging men and women of St-Petersburg”, which was conducted in 2008-2009 within the framework of the international survey “Stress, Aging and Health in Russia”. 200 participants of the pilot study born in 1941-1943 and in 1928-1930 (120 women and 80 men) were randomly selected from the current population of St-Petersburg. Among them, there were 64 people with experience of being in the Siege: 21 of them were born in 1941-1943 and experienced malnutrition and stress in utero and in early childhood; another 43 were born in 1928-1930 and have the same experience in the puberty period. 136 individuals belonging to the same age groups have no experience of starvation. In order to estimate the cardiovascular events we apply the method of 24-hour ECG monitoring. It is performed by a 3-channel Holter system. The heart rate (HR) parameters (the mean, maximum and minimum daytime and nighttime HR values, arrhythmia events, ST- trends and QT dynamics) are examined. Results and conclusion: Individuals born during the Siege (1941-1943) significant differ from those with no experience of the Siege in prevalence of ischemic episodes on Holter (episodes of ST depression > 1 mm in > 1 ECG lead, duration of episodes more than 1 min.). They are also characterized by higher risk of ischemic repolarization abnormalities and elevated heart rate (24-hour mean HR > 90 bpm). No difference in other analyzed Holter parameters is found. Individuals who were in the Siege in their puberty have no difference in comparison with their counterparts without such experience. Our Holter data suggest that people who had malnutrition and stress in utero and early childhood have higher cardiovascular risk and should be monitored for ischemia. Our data do not support earlier results suggesting elevated cardiovascular risk among people being in Siege during the puberty.

134
P50 QT-intervals in Two-channel Holter Recordings: a New Automatic Analysis Performs Equal to Manual Analysis in Children with the Long QT Syndrome Ola Gustavsson1, Annika Winbo2, Marcus Karlsson1, Annika Rydberg2, Urban Wiklund1 1 Department of Biomedical Engineering, University Hospital, Umeå, Sweden 2 Department of Pediatrics, Umeå University Hospital, Sweden Background: Ambulatory 24-hour electrocardiographic recordings (Holter) provide information useful for diagnosis and risk stratification in children with the long QT syndrome (LQTS). Manual measurements are time-consuming and systems for automatic QT-analysis often suboptimal in performance. This pilot study evaluates a new automatic system for QT-analysis in 2-lead pediatric Holter recordings developed at the Department of Biomedical Engineering at Umeå University Hospital. Method: QT–intervals were measured manually and automatically in 2-lead (V2 and V5) Holter recordings from 10 pediatric patients with genotype-positive LQTS (age 11.2±4.8 years) and 10 healthy controls (age 11.3±5.0 years). ECG data and R-R intervals was exported from the Holter system, and two 5-minute segments (day- and night time, respectively) were chosen with respect to optimal signal quality. A QT expert used custom-developed software to manually mark Q-onset and T-end for all normal heartbeats (approximately 14 000 beats). Automatic detection of Q-onset was performed in two steps: first an initial estimate was derived of the Q-onset point by using a length-transform approach, then the estimate was adjusted using a tangent-based method. An area-based algorithm calculated T-end. Outliers in the series of automatically determined QT intervals were removed using a filtering algorithm. QT intervals were corrected for heart rate using Bazetts´s formula (QTc). The median value of QTc during 5 minutes was used for classification of LQTS (positive if QTc≥450 ms). Results: The average difference between all manual and automatic measurements of QTc was 4 ms (SD±16 ms, n=13800 heartbeats). There was excellent agreement between genotype, manual and automatic measurements in both day and night segments (R2=0.91 and R2=0.89 respectively, Figure 1). The automatic analysis correctly classified all day-time recordings (10 normal, 10 LQTS) and 18/20 of the night time recordings (two healthy controls were classified as having LQTS in the night recording). Conclusion: In this pilot study, a new system for analysis of QTc in 2-lead Holter recordings has been evaluated in genotype-positive LQTS children and healthy controls. The system’s performance was equal to manual assessment, both in absolute measurements and in correct classification of LQTS.

135
P51 Longer QTc in Y111C Carriers Ulla-Britt Diamant, Annika Winbo, Annika Rydberg, Eva-Lena Stattin, Milos Kesek, Steen M Jensen 1 Heart Centre Clinical Physiology, Department of Surgical and Perioperative Sciences 2 Division of Pediatric, Department of Clinical Sciences, 3 Division of Pediatric, Department of Clinical Sciences, 4 Department of Medical Biosciences, Medical and Clinical Genetics, 5 Heart Centre Cardiology, Department of Public Health and Clinical Medicine, 6 Heart Centre Cardiology, Department of Public Health and Clinical Medicine, Umeå University Hospital, Umeå, Sweden Background: The aim of this study was to investigate if there was any difference in corrected QT interval (QTc) between carriers of the Y111C and R518X mutations. These two point mutations in the KCNQ1 gene are currently among the most common mutations causing the Long QT Syndrome in Sweden. Methods: QTc measurements were performed in an adult population consisting of known Swedish carriers of the mutations Y111C or R518X. QTc were automatically measured by Mida®1000/CoroNet, Ortivus AB. From the 3 orthogonal leads X, Y and Z (Frank leads) complexes were sampled in periods of 60” during 3-4 minutes and an averaged vector magnitude complex was computed. Based on changes in the calculated derivative of the vector magnitude signal the end of the T wave was determined. Bazett's formula was used for rate correction; the recording was performed in rest and supine position. Result: Thirty-nine Y111C mutation-carriers (15 male; 24 female) and 25 R518X mutation-carriers (7 male; 18 female) were included. Mean age of the Y111C carriers was 38±16y (males 33±15 y; female 42±17y) and of the R518X carriers 42±14y (males 42±18y; female 42±12y). Mean QTc for the Y111C carriers was 482 ms ±36 ms; median 457 ms (males 464 ms ±26 ms; median 458 ms; females 493 ms ±38 ms; median 485 ms). Mean QTc for the R518X carriers was 464 ms ±28 ms; median 457 ms (males 460 ms ±46 ms; median 450 ms; females 465 ms ±20 ms; median 463 ms). The Y111C mutation-carriers had a significantly longer mean QTc, as compared to the R518X mutation-carriers (482 ±36 ms vs. 464 ±28 ms, p=0.01). There was moreover a significant difference between mean QTc in female Y111C and R518X mutation-carriers (p=0.001). Conclusion: Carriers of the Y111C mutation have longer QTc as compared to carriers of the R518X mutation. The difference seen in mean QTc was explained by the prolonged mean QTc of the female Y111C mutation-carriers. The clinical consequence of this apparent mutation-specific phenotypic effect, and the possible influence of gender on this, has to be determined in further studies using larger study populations, over time.
136
P52 Gender Differences in the Long QT Syndrome: Computer Simulation Study Elena Ryzhii, Maxim Ryzhii University of Aizu, Aizu-Wakamatsu, Japan Background. Sex-related differences in L-type Ca current (ICaL), transient outward current (Ito), rapid delayed rectifier K current (IKr), and fast sodium current (INa) may explain the gender disparities in human cardiac electrophysiology. Method. We present a computer simulation study of cellular mechanisms of gender differences in long QT syndrome (LQT) using modified ten Tusscher and Panfilov 2006 human ventricular cellular model combined with a biventricular model. To simulate action potentials (APs) for male and female models, we implemented gender differences adjusting densities of INa, Ito, IKr, and ICaL according to experimental findings on animals. We calculate gender specific APs for LQT superimposing variations of ICaL, IKr, and INa currents with the male and female cellular models. Inputting the obtained APs into biventricular model we simulated normal and LQT ECG waveforms. Results. Action potentials in female cells have longer durations and steeper duration-frequency relationships than male cells. In the female cells, electrical transmural heterogeneity is larger and the susceptibility to early afterdepolarizations is higher than in male cells following mild reductions in net repolarizing forces. Combined with greater electrical heterogeneity of female cells, it makes them more vulnerable to torsade de pointes (TdP). Conclusions. This study provides some insights into the cellular and ionic basis for the gender-related distinction in the incidence of TdP and can explain the fact that QT interval prolongation is less manifested in men than in women and underlines significance of ionic current differences in female prevalence in the LQT.
137
P53 Using of Portative Recorder of r-r Intervals (Heart Monitor "Wrist Watch") in the Epydemiological Study for the Estimation of Heart Rate Variability Maria Shkolnikova1, Maria Baturova2, Michael Medvedev2, Olga Veleslavova2, Yuri Shubik2, Dmitri Jdanov3, Vladimir Shkolnikov3 1 Russian Federal Center for children’s arrhythmia, Moscow, Russia 2 North-West Centre for Diagnostics and Treatment of Arrhythmias of St-Petersburg State Medical Academy named after I.I.Mechnikov, St-Petersburg, Russia
3 Max Planck Institute for Demographic Research, Rostock, Germany The aim of the study was to evaluate the possibility of using portative “wrist watch” recorder of R-R intervals for the estimation of heart rate variability. Methods and materials: The study is a part of the pilot project “Stress and siege-effects on biomarkers of health in aging men and women of St-Petersburg”, which was conducted in 2008-2009 within the framework of the international survey “Stress, Aging and Health in Russia”. 200 participants of the study were randomly selected from the population of St-Petersburg. 162 of them were monitored during 24 hours for both Holter monitor and the portable “wrist watch”. In both cases we analysed exported files of RR intervals for estimation of heart rate and heart rate variability parameters. Holter monitor was performed by a 3-channel Holter system KARDIOTECHNIKA. The POLAR RS800 heart monitor was used as a simpler and cheaper device for registration of RR intervals. It is used in training of sportsmen and not designed for a 24-hour monitoring. The heart rate parameters (the mean, maximum and minimum daytime and nighttime HR values) and also the parameters of heart rate variability (time domain and frequency domain) were examined. Results: Out of the total of 162 heart monitor recordings, 28 recordings with the length shorter than 18 hours were excluded from the further analysis. 89 of the remaining 134 recordings were taken for comparison with the corresponding Holter data. No significant differences were found between the average heart rate values (day, night, 24 hours). The original heart monitor series were too shaky and we had to filter and smooth them before computation of the heart rate variability parameters. The resulting SDNN, SDANN, and mean NN values were quite close to the respective Holter outcomes with the mean differences of 7%, 6%, and 3% correspondingly. According to the K-S test, distributions of these parameters across the study subjects do not statistically differ. Very significant differences (with the mean differences of up to 80%) were found for the more sensitive parameters such as pNN50, SDNNi5, RMSSD, and all HRV parameters of the frequency domain. Conclusion: The portative WW recorders can be potentially used in studies of HR. Some of the time domain HRV parameters such as SDNN, SDANN, and mean NN can be also estimated from the filtered and smoothed WW recordings. The WW device should be further improved for 24-hr long recordings.

138
JUNE 05, 2010 09.00-14.00 P54 Pulmonary Arterial Hypertension in Children with Congenital Heart Diseases: Serotonin and its Receptors in Heart Contraction Regulation Razina Nigmatullina, Alvar Mustafin, Aidar Nigmatullin Kazan State Medical University, Russia Serotonin (5-hydroxy-triptamine, (5-HT) is involved in pathogenesis of atrial fibrillation, heart failure. 5-HT influences the embryogenesis, ontogenesis, inotropic and chronotropic myocardial functions. The occurrence of congenital heart disease (CHD) is 6-8 from 1000 of live-borns. The main causes of mortality in CHD are heart failure and pulmonary arterial hypertension (PAH). However, the role of 5-HT in treatment of those critical conditions is not considered. In current study we measured the 5-HT concentration in blood plasma ([5-HT]p) and platelets ([5-HT]pt), investigated the effects of 5-HT2 and 5-HT4 receptor (R) agonists on the myocardium inotropic function, evaluated the 5-HT2bR, 5-HT4R and serotonin transporter (SERT) expression in myocardium. The study was performed on 99 CHD (ages: 2 months – 17 years). Members of the control group were aged between 4 and 16 years with no cardio-vascular diseases as confirmed by anamnesis. All patients gave written consent for participating in the study, which was approved by the Ethical Committee of Tatarstan Republic (Kazan, Russia). The measurement of [5-HT]p, ([5-HT]pt 5-hydroxy-indole-acetic acid concentration ([5-HIAA]p) was performed by HPLC. The contractility of right auricle myocardium, obtained during operation on account of CHD, was evaluated using the PowerLab setup with force transducer MLT 050/D (ADInstruments). The 5- 2R agonist mCPP hydrochloride and 5- 4R agonist 5-methoxytryptamine (0.1, 1.0 and 10.0 µM, Tocris) were used. For immunohystochemistry antibodies to SERT, 5- 2 R, 5- 4R were used. We determined the expression of 5-HT2bR, 5-HT4R and SERT in human right atria strips by immunohistochemistry. It was established that the serotoninergic system actively participates in the pathogenesis of PAH in children with CHD. Concentrations of 5-HT in the plasma of children with CHD showed an increase in PAH. Concentrations of 5-HIAA in the plasma of children with CHD having PAH increased and correlates with the degree of PAH, and thus can serve as a marker for an estimation of efficiency of therapy for these patients. For children with CHD from 2 months to 17 years, the role of 5HT2R in atrium contraction is decreased, but the 5HT4R is active during all this period. Thus, these results may be important in relation to decreasing the high mortality in this group of sick children; 5-HT2 and 5-HT4 agonists and blockers which may be very effective are not currently used in the clinic.

139
P55 New Method of Haemodynamic Monitoring for Determination of the Best Site for Right Ventricle Lead during DDDR or CRT Device Implantation Didenko Maxim, Bobrov Andrey, Tsyganov Alexey, Fedyainova Anastasiya, Khubulava Gennady, Shulenin Sergey, Bobrov Lev Military Medical Academy, St.Petersburg, Russia Introduction. One of the problems of modern pacing therapy is individualization of positioning of the ventricle lead. The existing methods can’t evaluate haemodynamics response to the site of the ventricle lead during pacemaker implantation. We propose the new method to access cardiac function during the operation to evaluate the optimal site of ventricle lead. During the pacemaker implantation it is necessary to position lead to several site. At the each position stroke volume (SV) and cardiac output (CO) are calculated during overdrive pacing step by step from 80 until 150 bpm with interval 10 bpm. The best position will be accompanied with the maximal increasing of CO at maximal heart rate. Aim is to evaluate the optimal position of right ventricular (RV) lead in patients with DDDR pacemaker or cardiac resynchronization therapy (CRT) devices. Methods. We enrolled 10 patients. 5 of them underwent DDDR pacemaker implantation and 5 patients were treated by CRT device. After implantation of atrial and left ventricular leads we studied two different site of RV lead with temporal fixation: apex and interventricular septum (IVS) in middle part of right ventricular output tract region. At the each position we measured SV and CO by two methods. The first was ultrasound Doppler (measuring of blood flow in the ascending aorta). The second was PiCCO technology (Pulse Contour Cardiac Output). CO was calculated at the rest and at the increased values of heart rate (HR): 80, 90, 100, 110, 120, 130, 140, 150 bpm. Results. Apex stimulation in patients with DDDR resulted to increasing of CO up to 29%, IVS stimulation – 45%. CRT device apex stimulation resulted to 27% growth of CO at 137 bpm, IVS stimulation resulted to 25% growth of CO at 125 bpm. In our cases the best haemodynamic location of RV lead for DDDR device was IVS position. The best position of RV lead in patient with CRT device was apex. Conclusions. The new method of haemodynamic monitoring during the pacemaker implantation can show the best position of RV lead with maximal myocardial reserve. Furthermore this method can provide individual approach for determination of the best site for permanent pacing for each patient.

140
P56 Electrocardiographic Markers of Successful Fibrinolysis in Patients with Acute Myocardial Infarction Leonid Berstein1, Alexander Vishnevsky2, Vladimir Novikov1, Yuri Grishkin1 1 Department of Cardiology, Medical Academy of Postgraduate Studies, St.Petersburg, Russia 2 Pokrovskaya Hospital, St.Petersburg, Russia Background. In patients with ST-elevation myocardial infarction, prompt electrocardiographic assessment of fibrinolysis results helps the decision-making on the rescue percutaneous coronary intervention and is valuable for prognosis. Materials and methods. In 106 patients with ST-elevation myocardial infarction, mean age 59±1 years, we analyzed electrocardiograms obtained prior to and 3 and 48 hours after fibrinolysis (ECG-1, 2 and 3). Separately for anterior and non-anterior infarctions (AMI and NAMI), the degrees of ST-segment resolution in the lead with its maximal baseline elevation (STmax), and total ST-segment resolution in leads with its elevation (STsum) were estimated from ECGs 1 and 2. The sums of T-wave amplitudes in leads with ST elevation for all three ECGs (sumT1, sumT2, sumT3) were measured and the changes of these between baseline and successing ECGs (‘sum 2-sum 1’ and ‘sum 3-sum 1’) were calculated. Echocardiographic left ventricular wall motion score index (WMSI) was obtained prior to fibrinolysis and on discharge (at 10±3 days). The decrease in WMSI due to resolved stunning served as an integral marker of successful “myocardium-level” reperfusion. Results. Predictors of successful reperfusion along with their cut-off values providing the best differentiation of patients by the reperfusion result, and sensitivities and specificities of the resultant variables are listed below (only those with p <0.05). ‘Sum 3-sum 1 < -28 mm’: sensitivity 68%, specificity 76%; ‘STsum AMI > 44%’ - 81 and 62%; ‘STsum NAMI > 59%’ - 100 and 42%; ‘STmax NAMI > 67%’ - 83 and 53%; ‘STmax AMI > 33%’ - 81 and 54%; ‘sum 2-sum 1 < -28 mm’ - 39 and 86%. Conclusion. Total ST-segment resolution is more accurate in prediction of reperfusion results than ST-segment resolution in the ‘worse’ lead, though the former is not specific in non-anterior infarctions. Successful reperfusion is marked by smaller ST-segment resolution in anterior than in non-anterior infarctions. Deep T-wave inversion 48 hours after fibrinolysis is indicative of successful reperfusion while early T-wave analysis is lacking sensitivity.
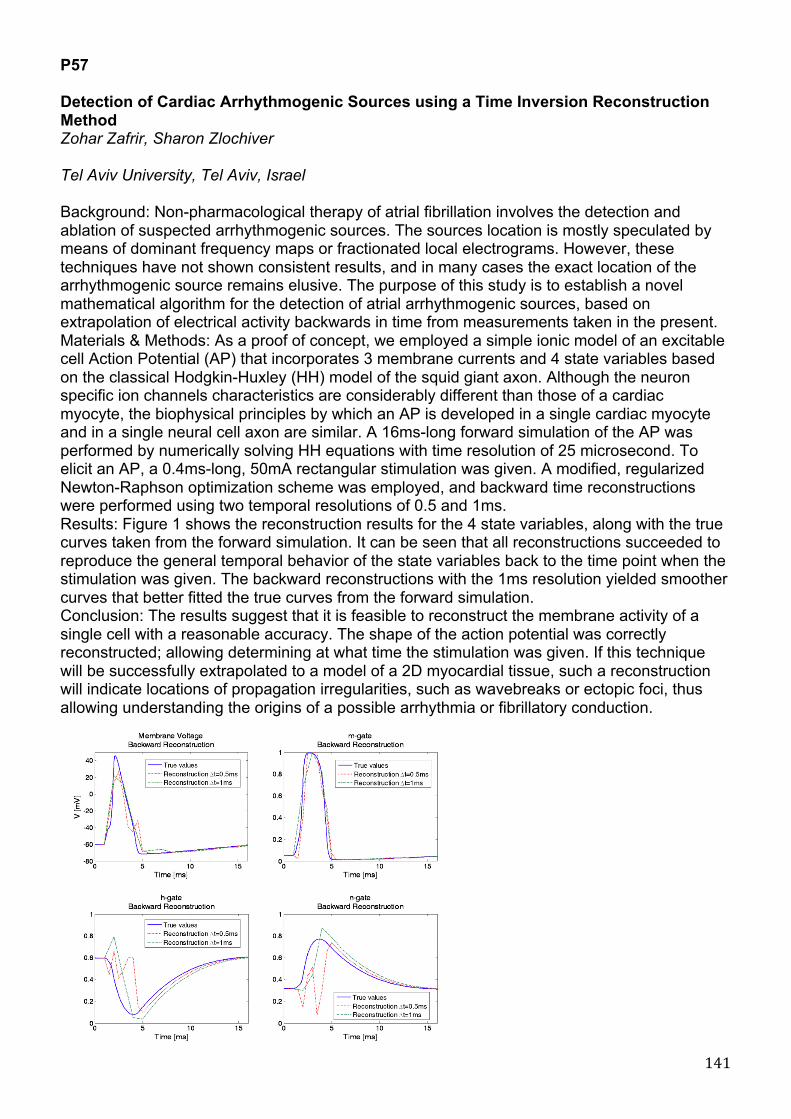
141
P57 Detection of Cardiac Arrhythmogenic Sources using a Time Inversion Reconstruction Method Zohar Zafrir, Sharon Zlochiver Tel Aviv University, Tel Aviv, Israel Background: Non-pharmacological therapy of atrial fibrillation involves the detection and ablation of suspected arrhythmogenic sources. The sources location is mostly speculated by means of dominant frequency maps or fractionated local electrograms. However, these techniques have not shown consistent results, and in many cases the exact location of the arrhythmogenic source remains elusive. The purpose of this study is to establish a novel mathematical algorithm for the detection of atrial arrhythmogenic sources, based on extrapolation of electrical activity backwards in time from measurements taken in the present. Materials & Methods: As a proof of concept, we employed a simple ionic model of an excitable cell Action Potential (AP) that incorporates 3 membrane currents and 4 state variables based on the classical Hodgkin-Huxley (HH) model of the squid giant axon. Although the neuron specific ion channels characteristics are considerably different than those of a cardiac myocyte, the biophysical principles by which an AP is developed in a single cardiac myocyte and in a single neural cell axon are similar. A 16ms-long forward simulation of the AP was performed by numerically solving HH equations with time resolution of 25 microsecond. To elicit an AP, a 0.4ms-long, 50mA rectangular stimulation was given. A modified, regularized Newton-Raphson optimization scheme was employed, and backward time reconstructions were performed using two temporal resolutions of 0.5 and 1ms. Results: Figure 1 shows the reconstruction results for the 4 state variables, along with the true curves taken from the forward simulation. It can be seen that all reconstructions succeeded to reproduce the general temporal behavior of the state variables back to the time point when the stimulation was given. The backward reconstructions with the 1ms resolution yielded smoother curves that better fitted the true curves from the forward simulation. Conclusion: The results suggest that it is feasible to reconstruct the membrane activity of a single cell with a reasonable accuracy. The shape of the action potential was correctly reconstructed; allowing determining at what time the stimulation was given. If this technique will be successfully extrapolated to a model of a 2D myocardial tissue, such a reconstruction will indicate locations of propagation irregularities, such as wavebreaks or ectopic foci, thus allowing understanding the origins of a possible arrhythmia or fibrillatory conduction.

142
P58 Assessment of a Prototype Equipment for Cuff-less Measurement of Systolic and Diastolic Arterial Blood Pressure Giandomenico Nollo1, Michela Masè1, Walter Mattei1, Roberta Cucino2, Luca Faes1 1 Department of Physics and BIOtech Centere, University of Trento, Italy 2 FBK Trento, Italy Background: While non-invasive estimation of blood pressure (BP) is an issue of great interest in both clinical and experimental research, standard measurement systems using inflation cuffs present severe practical limitations. This study introduces the validation of a prototypal cuff-less device for non-invasive BP estimation based on a beat-to-beat measure of the arterial blood pulse transit time (PTT). Materials and Methods: The system under analysis is based on the linear relationship between BP and the inverse of PTT. Following a calibration step, estimating subject-specific regression line parameters, BP values are determined from PTTs, defined as time intervals between the R-wave on the ECG and the onset of the peripheral pulse wave on a finger photopletismographic signal. The study was conducted on 33 healthy subjects (39+/-13 yrs) according to the guidelines of the International Protocol of the European Society of Hypertension. Our protocol included a resting condition, four steps of bicycle exercise with increasing stress, and a recovery condition. In each condition, ECG and photopletismographic signals were acquired for three consecutive 10-second recording frames and corresponding systolic and diastolic BPs were estimated from average beat-to-beat PTTs. Traditional oscillometric BP measures were simultaneously collected as reference. Two recording frames were retained for device calibration, and the third used for validation. Results: Linear regression analysis between test and reference BPs evidenced a good overall agreement, with slope and intercept of the regression line equal to 0.96 and 4.76 for systolic BP (R2=0.89) and 0.91 and 6.73 for diastolic BP (R2=0.87). The system fulfilled the criteria for accuracy based on test-reference difference classification. Indeed the percentage of reference and device values which agreed within 5, 10, and 15 mmHg was 58%, 87% and 98% for systolic BP, and 68%, 89% and 97% for diastolic BP. Conclusion: These results suggest the suitability of the device for a non-invasive BP monitoring and its potentiality for clinical applications, although improvements may concern calibration procedure and sensor placement.

143
P59 A Comparison of Conductive Textile Based and Silver / Silver-chloride Gel Electrodes in Exercise ECG Recordings Vaidotas Marozas, Saulius Daukantas, Arunas Lukosevicius Kaunas university of technology, Lithuania Background. Increasing applications of ambulatory recording of ECG signals (sports, wellness monitoring) calls for long time wearable, reusable biopotential registration solutions. The aim of this study was to quantitatively compare disposable Ag/AgCl and conductive textile based electrodes in ECG monitoring during exercises. Materials and methods. The conductive textile based electrodes were made by using thin silver plated nylon 117/17 2ply conductive thread (Statex GmbH) sewed with sewing machine on chest belt. Integrated Velcro straps helped to fit the chest belt to different chest sizes. It is convenient to wear even on daily basis. The disposable Ag/AgCl electrodes (BIOPAC Systems, Inc) were attached to the chest of the subject as close as possible to conductive thread electrodes. MP35 data acquisitioning system (BIOPAC Systems, Inc) with high sampling frequency 10kHz was used for recording of synchronous ECG signals. Ten volunteer participants were included in this study with range of ages 20-39 years. Test protocol: a) rest - 2 min., b) work on elliptical trainer until 80% of maximum permissible heart rate value, c) recovery - 3 min. Entire experiment lasted about 10 minutes for each participant. Results. The synchronously recorded ECGs were compared using these parameters: mean of differences (bias), standard deviation of differences and zero lag correlation. The following database averaged results were obtained for the entire experiment: bias – 0.021+-0.008 (mV), std of differences – 0.203+-0.03(mV), correlation coefficient - 0.86. In addition, signals were segmented to three intervals (rest, exercise, recovery) and correlation coefficients were estimated as being for rest interval – 0.98, exercise – 0.82, recovery – 0.90. Conclusion. Very high correlation values at rest and recovery phases were obtained showing good agreement between both types of biopotential electrodes. Lower correlation value in exercise phase can be explained by differences in area of electrodes and susceptibility of disposable electrodes to local miographic noise. Textile electrodes have larger area and they are able to average local miographic noises also they appear less disturbed by instantaneous detachments of the electrodes from the skin.

144
P60 Repolarization Dynamicity Measured as QT/RR Relationship as an Index in Differentiation of Malignant Ventricular Arrhythmias Occurrence in Patients with History of Anterior Myocardial Infarction, with Respect to the Interlead Differences in Holter Recordings. Krzysztof Szydlo, Krystian Wita, Maria Trusz-Gluza Medical University of Silesia, Katowice, Poland Repolarization dynamicity, measured as QT/RR relationship, is supposed to be a prognostic marker in patients after myocardial infarction (MI) and in patients with malignant ventricular arrhythmias (VT/VF). However, there is still no paper on relationship between early and late phases of QT and RR intervals (QTpeak/RR and TpeakTend/RR), and which ECG lead should be used to the most powerful and accurate analysis of QT/RR relation. The purpose of this study was to analyze if repolarization dynamicity parameters may be useful in differentiation of patients after anterior MI with and without VT/VF in history, with respect to two basic leads used in Holter recordings- V5 and V2. Methods: The study population consisted of 54 patients after first anterior MI (41 males, age: 59±11 years, LVEF: 34±7%; all >6 months from MI). There were 24 patients without VT/VF (16 males; age: 57±11 years; LVEF: 39±4%; NoVT/VF) and 30 patients with VT/VF in history, with ICD implanted using secondary prevention criteria (25 males; age: 62±11 years; LVEF: 30±7%; VT/VF). QT/RR, QTpeak/RR and TpeakTend/RR were measured from Holter recordings- automatic beat-to-beat analysis of more than 90% of recording. Data were analyzed in V5 and V2 leads separately. Absolute differences between V5 and V2 were also calculated (_diff). None of subjects was treated with amiodarone or high doses of sotalol. Results: Patients with VT/VF had lower LVEF (p=0.001). There were no differences in age and gender. VT/VF group was characterized by steeper QT/RR, QTpeak/RR and TpeakTend/RR than NoVT/VF subjects, both in V5 and V2 leads; for V5: 0.209±0.04 vs. 0.138±0.04, p=0.0001, 0.171±0.04 vs. 0.110±0.03, p=0.0001, 0.040±0.02 vs. 0.027±0.02, p=0.02 and for V2: 0.197±0.03 vs. 0.134±0.04, p=0.0001, 0.159±0.03 vs. 0.103±0.03, p=0.0001, 0.040±0.01 vs. 0.030±0.02, p=0.11; respectively. Absolute differences were significantly higher in VT/VF group- QT/RR_diff: 0.027±0.024 vs. 0.008±0.008, p=0.0001, QTpeak/RR_diff: 0.031±0.026 vs. 0.009±0.008 ms, p=0.008, TpeakTend/RR_diff: 0.014±0.01 vs. 0.004±0.006, p=0.001, respectively. Conclusions: Patients with malignant ventricular arrhythmias are characterized by steeper relationships between repolarization duration (entire, early and late phase) and RR intervals. These findings were more evident in V5 lead.

145
P61 The New Approach to Selection of Patients for Cardiac Resynchronization Therapy Tatiana Novikova1,2, Vladimir Novikov1, Dmitry Perchatkin2 1 Medical Academy of Postgraduate Studies, St.Petersburg, Russia 2 City Pokrovsky hospital, St.Petersburg, Russia Purpose of the study: to estimate the advantage of new 2D-strain mode versus tissue synchronization imaging mode (TSI) in the assessment of interventricular dyssynchrony (IVD) as a predictor of cardiac resynchronization therapy (CRT) effect in patients with refractory chronic heart failure (RCHF). Materials and methods: the analysis of clinical aspects and echocardiographic images was carried out in 19 patients with RCHF treated by CRT. NYHA Class was assessed before and after 6 month in CRT. Echocardiography was used for estimation of ejection fraction (EF) and IVD measured by TSI and 2D-strain modes. Patients were considered responders to CRT if after 6 month their functional class improved by at least one and EF increased by more than 10%. The criterions of severe IVD measured by TSI were maximal time between the onset of QRS and peak systolic motion of left ventricle 12 segments (Ts) ≥ 100 ms and SD of 12 segments Ts ≥ 33 ms. The criterion of severe IVD measured by 2D-strain was the time between interventricular septum and posterior wall radial deformation peaks ≥ 130 ms. Results: The positive result of CRT (responders) was observed in 15 patients. 11 patients had severe IVD by TSI. 4 patients were non-responders (3 with severe IVD by TSI). Thus the sensitivity of TSI was 73%, specificity – 25%, positive predictive value – 78,6% and negative predictive value – 20%. The 2D-strain analysis was possible in 17 patients. 13 of them were responders (12 with severe IVD by 2D-strain). 4 patients were non-responders (1 with severe IVD by 2D-strain). The sensitivity of 2D-strain was 92,3%, specificity – 75%, positive predictive value – 92,3%% and negative predictive value – 75%. Conclusion: this results demonstrates that new 2D-strain mode can predict the response to CRT better than TSI-mode and can be one of the best echocardiographic methods for quantifying the effect of CRT in patients with RCHF.

146
P62 Left Ventricle Remodeling after Valve Replacement in Patients with Aortic Stenosis is Weakly Related with ECG Changes. Ewa Orlowska-Baranowska, Rafal Baranowski, Lidia Greszata, Patryk Stoklosa Institute of Cardiology, Warsaw, Poland Aortic valve replacement [AVR] in pts with aortic stenosis [AS] leads to left ventricle remodeling. Paralelly evolution in ECG is observed. The aim of our study was to analyze the relationship between left ventricle remodeling and ECG evolutions in pts after AVR due to AS. Patients and methods: In group of 149pts with AS (59 women and 90 men) Echo and ECG was done before and 12-36months after AVR. Wall thickness [WT], LVDD and left ventricle mass index [LVMI] were echocardiographically measured. In the ECG we analyzed QRS duration [QRSd], sokolov index [SI], R amplitude in aVL [RL], sum of QRS amplitude in 12 leads[SQRS], T wave amplitude in V5 [TV5] and QTc. Results: Results are presented in table 1. Reduction of LVMI correlated with reduction of: SQRS (r=0.23,p=0.005), QTc (r=0.26, p=0.002), RL (r=0.17, p=0.04), IS (r=0.17, p=0.04). WT reduction correleted with reduction of: TV5 (r=0.23, p=0.006), SQRS (r=0.21, p=0.009), IS (r=0.17, p=0.04). LVDD reduction correleted with reduction of: RL (r=0.18, p=0.03), QTc (r=0.26, p=0.001). Conclusion: In pts with AS after AVR significant remodeling is observed, however these changes only weakly correlated with dynamic changes in ECG parameters. The most prominent ECG changes are observed in repolarisation.
147
P63 Spontaneous Atrial Tachy-arrhythmias Can Not Beget Ventricular Tachy-arrhythmias in Patients with Acute Myocardial Infarction Wangden Carson, Yung-Zu Tseng Cardiovascular Laboratory, Cardiovascular Division, Department of Internal Medicine, Taipei, Taiwan Background. Paroxysmal Atrial tachycardia or Atrial fibrillation (Af) occurs commonly in patients who receive implantable cardioverter defibrillator( ICD) for the treatment of life-threatening ventricular tachycardia (VT) or ventricular fibrillation (VF). Atrial tachy-arrhythmias are heart “reactions” to the negative sequence voltage in physics (Int J Cardiol 2008, 130:357-366). Ventricular tachy-arrhythmias are in much or less the same situation. It has been suggested that VT or VF is common in ICD recipients with a history of atrial tachycardia or Af. Would it be possible that spontaneous atrial flutter (AF) and/or Af beget VT and/or VF in patients with acute myocardial infarction (AMI) without ICD? Methods. One hundred and seventy eight consecutive patients with suspect acute coronary heart disease within 24 hrs of their admission into the Coronary Care Unit enrolled in this serial emergency vectorcardiographic study. Results. A total of 473 emergency Frank vectorcardiographic tracings was recorded by one physician from 148 patients with AMI. Their age was 61+ 9.8 years, and 129 were male, 19 female. Total 109 among 148 patients had no Af / AF or VT / VF during AMI. Sixteen had VT or VF without Af or AF. Seventeen had Af or AF without VT or VF. Six had both Af or AF and VT or VF (Chi-square test = 2.71, p = 0.10). Conclusions. Spontaneous atrial tachy-arrhythmias can not beget ventricular tachy-arrhythmias in patients with AMI without ICD. Atrial tachy-arrhythmias beget ventricular tachy-arrhythmias in patients with ICD could be due to iatrogenic factors, such as the ICD itself. This is similar to anti-arrhythmia medications which cause pro-arrhythmia effect documented in the literature.
148
P64 Amplatzer Occluder in Alteration of Negative Sequence Voltages in the Atria of Patients with Atrial Septal Defect Wangden Carson1, Jou-Kou Wang2, Yung-Zu Tseng1 1 Cardiovascular Laboratory, Cardiovascular Division, Department of Internal Medicine 2 Paediatric Cardiology, Department of Paediatrics Background. The types of figure-of-eight or clockwise rotation of the P-loop, which are linked with the partial negative sequence (PNS) or complete negative sequence (CNS) in physics have been documented (Int J Cardiol 2008;130:357-366). Can they be found in patients with atrial septal defect (ASD), and can they be altered by the Amplatzer occluder (AO)? Methods. Fourty-five patients with secundum ASD received transcatheter occlusion of the ASD. They had pre and post-operation Frank vectorcardiographic (VCG) and ECG examinations. Results. A total of 41 patients was studied. Their age was 33 + 19.9 years, and 14 were male, 27 female. The pre-VCG test of the P-loop showed that the Right Sagittal plane had three PNS and three CNS (15%). Four of these six, their post-VCG returned to normal, one persisted in PNS, one was downgraded from PNS to CNS. However, five normal P-loop in the pre-VCG, one changed into CNS, the rest four appeared as PNS type after AO. The pre-VCG test showed that the Frontal plane had eight PNS and five CNS (20%). Six of these 13 returned to normal P-loop in the post-VCG test, two from PNS into CNS, two from CNS into PNS, two PNS and one CNS still persisted after AO. However, 10 normal P-loop, among them seven downgraded into PNS, and remaining three in CNS after AO. None of the 41 patients had abnormal inscription direction of the P-loop ( 0%) in the the Horizontal plane in pre-VCG test. Only one patient had post-VCG CNS P-loop in the Horizontal plane after AO .The AO can make some PNS or CNS P-loop returned to normal rotation. However, the AO can also make some normal P-loops changed to either PNS or CNS type, and PNS downgraded into CNS pattern. Conclusion. In patho-electro-physics-physiology, AO can alter negative sequence voltages from ASD, but AO itself can also contribute to iatrogenic negative sequence voltages in the atria. Foreign body such as the AO itself may be responsible for these changes in the atria.

149
P65 Antiarrhythmic Therapy Might Depend on Autonomic Regulation of the Heart. Tatiana Treshkur, Elena Parmon, Maria Ovetchkina The Federal Heart, Blood and Endocrinology centre named after V.A.Almazov, St.Petersburg, Russia Definition of legitimacy of appointment of antiarrhythmic therapy ( ) on the basis of a condition of autonomic nervous system (ANS) in patients with ventricular arrhythmia (VA) was the aim of the study. 183 patients (105 men, from 18 till 62 years, mean age=45.2±1.2 years) with nonischemic VA: allorhythmia - in 146 (79 %) patients, double VA - in 76 (41 %), unstable ventricular tachycardia (VT) - in 86 (46 %); stress-induced VT - in 87 (47 %) have been examined with the help of Holter monitoring, exercise training test (ETT), pharmacological tests with beta-adrenoblocker - 60 mg Propranololi (P) per os. By results patients have been divided into three groups: I - 96 patients with exercise-induced VA, progressing at ETT up to VA, and the good answer to P. Group II - 72 patients with mainly rest VA which disappeared during ETT, and group III - 15 patients with mix VA (both exercise-induced and rest VA). On the basis of behavior of VA during ETT and taking into account the effect of AAT, beta-blocker (betaxololi, metoprololi) have been appointed to patients of the I-st group (with exercise-induced VA), I class AAT with anticholinergic properties (disopyramidi) - to patients of the II-nd group (with prevalence of vagal VA), and a combination of beta-blocker in the morning and dizopyramidi in the evening - to patients of the III-rd (mixed) group. efficiency has made 89, 85 and 67 % accordingly on groups in two weeks. Thus, the differentiated approach to appointment of T depending on prevailing influence of ANS on arrhythmogenesis is justified, allows to predict more precisely efficiency of treatment of patients with nonischemic VA, and the success of such approach testifies that infringements of autonomic regulation play an important role in arrhythmogenesis.

150
P66 Comparative Analysis of Radiofrequency and Cryoenergy Destructive Impact on Myocardial Damage Vincentas Veikutis, Gintautas Dzemyda, Aurimas Peckauskas, Andrius Rackauskas, Tomas Mickevicius, Aras Puodziukynas Kaunas University of medicine, Lithuania Background: Most of the cardiac disorders are corrected by using destructive energy sources, mostly radiofrequency ablation (RFA). Unfortunately, despite the use of the new technologies, the rate of early and late post-operative complications remains fair. The aim of this study was to measure and determine the optimal characteristics of RFA, during endocardic and epicardic destructive procedures in different structures of the heart and compare it with the characteristics of the cryo- destruction. Methods: Unisex mongrel adult dogs (n-9) were used for experimental study. Destruction of various heart areas was performed on the endocardic surface, inserting the electrode through the incision on the apex of the right ventricle. Standard 4 and 8 mm „Biosense Webster“(Johnson&Johnson,USA) intracardiac electrodes were used. RF destruction parameters: energy – 20-50 W, time – 10-30 sec. Cryo destruction: temperature -80°C, time – 60-120 sec. Dynamic changes of temperature were registered with thermocamera ThermaCAM T400 (resolution ≤0.06°C). The results were estimated by using modifications or their combinations of data analysis methods based on temperature anisotropy for experimental heart tissues. Results. Performing RFA on the epicardial and endocardial surface of atria, destructive thermoeffect (> 46°C ) was observed after 5-7 sec., independently from energy power and the type of the electrode. Using 20-30W energy showed elipse form full destruction area 3-4 mm in the diameter, using 50W – 4-5 mm. Complete and partial destruction zone mostly coincide when destruction parameters were 30W and 30 s. 50W and over 30 s exposition produced serious damage of surrounding tissues including nervous pathways or ganglion fields. RFA from endocardial side of the ventricles produced power and time depended destruction area through the whole depth of the myocardium, formed 7-10 mm and was irregular-oval-shaped with interstitiums longitudinal to apex. RFA from epicardial surface showed wide 10-15 mm ellipse-shaped partial destruction area. In 3 cases we observed "crater" fenomenon. In opposite cryoablation produced local and homogenous cardiac tissue destruction in all cardiac tissues. Conclusions: Partial and atypic myocardium damage areas are a lot greater than was thought earlier. Our determined interstitial damage fenomenon is useful in explaining the origin of most post-ablation complications. Thermovision allows us to see the margins and features of destructive impact, optimize RFA parameters, due to avoiding and minimizing adverse effects and retain the structures, that could influence traumatising outcomes.

151
P67 High-frequency ECG during Reperfusion Therapy of Acute Inferior Myocardial Infarction Elin Trägårdh Johansson1, Jonas Pettersson2, Galen S Wagner3, Leif Sörnmo4, Hans Öhlin5, Olle Pahlm2 1 Dept of Clinical Physiology, Lund University, Malmö, Sweden 2 Dept of Clinical Physiology, Lund University, Lund, Sweden 3 Dept of Cardiology, Duke University Research Institute, Durham, USA 4 Electrical and Information Technology, Faculty of Engineering, Lund University, Lund, Sweden 5 Dept of Cardiology, Lund University, Lund, Sweden Background: Resolution of ST-segment elevation in ECG is used as a reperfusion sign during thrombolytic therapy in acute myocardial infarction (MI). Previous studies have shown that acute myocardial ischemia is accompanied by reduced amplitude of high-frequency QRS components (HF-QRS) in the frequency range of 150-250 Hz. Studies during thrombolytic therapy, using few electrocardiographic leads, in patients with acute MI suggest that analysis of the HF-QRS also may have the ability to detect reperfusion. In these studies, reperfusion was accompanied by an increase in HF-QRS. The present study compares changes in HF-QRS to ST-segment changes in the standard ECG during thrombolytic therapy. Methods: Twelve patients receiving intravenous thrombolytic therapy due to acute inferior MI were included. A continuous 12-lead ECG recording was acquired for 4 hours. The HF-QRS were extracted from the signal-averaged ECGs in the range of 150-250 Hz, and were expressed as root-mean-square values for each individual lead during the entire QRS duration. The precordial leads V1-V6 showed lower noise levels than the limb leads; therefore, leads V1-V6 were primarily considered. A change in HF-QRS exceeding 0.6 microV was considered significant. For standard ECGs, the ST-segment level above or below the PR-segment baseline at 60 ms after the J point was automatically measured in each lead. An ST-elevation resolution ≥ 50% after 1 hour of therapy was taken as an indication of early reperfusion. Results: After 1 hour of therapy 3 patients showed ST-elevation resolution as well as an increase in HF-QRS. These changes in ST and HF-QRS occurred simultaneously. No other patient showed significant changes in ST or HF-QRS after 1 hour. After 2 and 4 hours there were more disparate results from the standard and high-frequency ECG, e.g. some of the patients showed ST-elevation resolution but no increase in HF-QRS and vice versa. The discrepancy between standard and high-frequency ECG in these patients could in part be explained by the ST-elevation resolution due to cellular death in the infarcted area, which is not expected to result in an increase in HF-QRS. Conclusions: Continuous monitoring of HF-QRS is feasible in patients undergoing intravenous thrombolytic therapy. The standard and high-frequency ECG seem to show similar results in patients with an early, rapid ST-elevation resolution. Later changes seem to be more disparate. A non-ECG method and a larger study population are necessary to determine the performance of the two ECG methods regarding reperfusion and the ability to provide prognostic information.

152
P68 Equivalent Dipoles Derived from the Principal Component Analysis of the 12-lead Surface ECG Vito Starc University of Ljubljana, Slovenia Background: Electrocardiographic (ECG) signals from the body surface have been perpetually shown to be represented by equivalent dipoles (ED) that reproduced the body surface potential distribution with given accuracy. When relating properties of ED to those of principal components (PC) obtained by the principal component analysis (PCA), we speculated that ED parameters are related to the transformation coefficients provided by PCA. Methods: Here we describe a method for determination of ED parameters corresponding to each PC signal of a given ECG signal segment. The method consists of the sequential forward and inverse problem solving, using the cost function (the optimization procedure) that represents the RNMS error of determination. In calculations, we assumed a standard thorax dimensions of an adult person with homogenous and isotropic distribution of thorax conductance (infinite and bounded conductor model), and standard preset positions of ECG leads on the thorax (leads V1..V6, aVL and aVF instead of lead I and II). To test the method we measured a 12-lead conventional ECG (5-min supine, 1kHz sampling rate, bandwidth 0-300 Hz) in a mixed group of 100 healthy and diseased subjects to search for ED location of different PC signals in the thorax. Results: We derived a relationship that ascribes ED parameters (the dipole strength, its 3D location and spatial orientation) to the PC signals obtained from the surface ECG. Next, using the conventional 12-lead ECG in the group of 100 subjects we showed that ED parameters can be successfully determined. Specifically, PC signals exhibited one significant minimum of the cost function in the searched volume of the thorax in nearly two thirds of cases and in the rest more than one minimum. The RNMS error was the smallest when the signal amplitude was high, and was around 5% for the first PC of the QRS complex and the T wave and 10% for the 2nd PC of both QRS and T waves, whereas it was much greater for the P wave. The error was independent of the subject subgroup. Conclusions: Though resembling the classic ECG vector analysis, the new method offers additional information: it provides separate EDs for different PC signals and a 3D location of EDs in the thorax, which may further help to interpret the conventional ECG.

153
P69 The Relationship between ST-dynamics during Reperfusion and the Infarct Size in Experimental Myocardial Infarction Marina Demidova1, Jesper van der Pals2, David Erlinge2, Victor Tichonenko3, Pyotr Platonov4 1 Federal Center of Heart, Blood and Endocrinology, St.Petersburg, Russia 2 Lund University and Lund University Hospital, Lund, Sweden 3 Mechnikov Medical Academy, St.Petersburg, Russia 4 Lund University Hospital and Center for Integrative Electrocardiology at Lund University, Lund, Sweden Exacerbation of ST-elevation associated with reperfusion has been reported in patients with myocardial infarction. However, the cause of the ‘reperfusion peak’ and its relation to the size of myocardial damage has not been explored. The aim of our study was to assess the correlation between the ST-behavior during reperfusion, the area at risk (AAR) and infarct size (IS) during experimental myocardial infarction (MI) Methods: In 15 anesthetized pigs (40-50 kg) ischemia was induced by 40-min long inflation of a PCI balloon placed in LAD immediately distal to the first diagonal branch. LAD occlusion and restoration of blood flow was verified by coronary angiography. ST segment elevation dynamics analysis was based on continuous 12-lead ECG initiated prior to the occlusion and ended 4 hours following reperfusion. AAR and IS were evaluated by ex-vivo Single photon emission computed tomography (SPECT) and magnetic resonance imaging (MRI), respectively. Results. The occlusion caused anteroseptal MI. The AAR was 42±9% and IS - 26±7% of left ventricular mass. Reperfusion was always accompanied by transitory exacerbation of ST elevation that reached 1299±503 µV vs 570±220 µV at the end of occlusion, p<0,001, exceeded the maximal ST elevation during occlusion (918±417 µV, p<0,05) and resolved by the end of reperfusion period (90±30 µV, p<0,001). Exacerbation of ST elevation during reperfusion strongly correlated with the final infarct size (r=0,64, p=0,025) but not with AAR (r=0,43, p=0,17). Conclusion: Restoration of blood flow in the infarct-related artery is accompanied by transitory exacerbation of the ST segment elevation that exceeds the level reached during occlusion. Marked correlations between ST elevation exacerbation and the final infarct size were found.

154
P70 A Computationally-efficient Patient-specific Simulation Model for the Investigation of Arrhythmia Mechanisms Alessandro Cristoforetti, Michela Masè, Flavia Ravelli Department of Physics, University of Trento, Povo - Trento, Italy Introduction: Computer simulation has become a valuable tool for the study and comprehension of arrhythmia mechanisms and the prediction of treatment outcome. The development of models with detailed patient-specific anatomy and electrophysiology is essential to improve predictive accuracy, nevertheless the high computational load of realistic models hinders their clinical application. In this work we introduce a patient-specific computational model combined with a novel fast solving algorithm based on a multiresolution approach, in order to perform computationally-efficient realistic simulations. Representative simulations are shown in a case study of a patient developing post-operative left atrial flutter. Methods: The personalization of the model was achieved by fusion of high quality 3D-CT cardiac imaging and electroanatomic mapping data. Specifically, a detailed reconstruction of the left atrial surface was semi-automatically obtained from CT data by a marker-controlled watershed segmentation. The electrophysiological information and ablation points were correctly positioned on the atrial geometry by an automatic registration based on a best-matching stochastic approach. Single cell electrophysiology was modeled by the Courtemanche human atrial ionic model, and integrated on the atrial mesh using a finite volume numerical scheme. A novel adaptive mesh refinement algorithm (AMRA) for unstructured triangular grids was implemented to increase computational efficiency. AMRA adapted the local resolution of the mesh to the local trend of the state variables by means of a nested triangle subdivision. Results: Although performed on a detailed left atrial mesh of 350K nodes, 10 seconds of left atrial flutter simulation (time step 0.05 ms) required 9 hours of calculation using Matlab® programming platform on a 2x2660 MHz processor. This was accomplished by AMRA implementation which, keeping 15 % of the nodes computationally active, reduced the overall calculation time under 20% of the full resolution integration time, without affecting significantly the propagation accuracy. Similarly to patient data, the simulation model accurately reproduced a clockwise reentrant circuit rotating around the common trunk of the left pulmonary veins and involving the ridge between the veins and left atrial appendage. Simulations evidenced the role of ablation lines as critical pathways of the reentry, suggesting their involvement in the creation of a substrate in post-ablative arrhythmias. Conclusions: These results demonstrate the feasibility of fast patient-specific arrhythmia simulations by combining an anatomically and electrophysiologically personalized computer model with an innovative computationally-efficient solving algorithm. Efficient realistic models may improve the understanding of specific arrhythmia mechanisms in the single patient, thus optimizing therapy planning and guidance.

155
P71 Time-frequency Analysis of Venous Stenosis: A Comparative Study Pablo Vasquez1,2, Marco Munguia1,2, Elisabeth Mattsson3, Bengt Mandersson1 1 Electrical and Information Technology Department, Lund University, Sweden 2 National University of Engineering, Managua, Nicaragua 3 Department of Nephrology, SUS Skåne University Hospital, Sweden A common complication in hemodialysis patients is that of thrombosis. Very often the reason of thrombosis is stenosis. Stenosis is an abnormal narrowing of a bodily canal which can be caused by calcification or when the vessel’s wall is exposed to abnormal physical stress like turbulence or high blood pressure. Previous research results have shown that stenosis has two basic acoustical effects: a general increase in the sound level and an introduction of new high frequency components in the power spectra. Phonoangiography, the quantitative analysis of sound produced by blood flow, is an inexpensive and non–invasive tool that can be used for monitoring the vessels functioning. Time-frequency analysis tools have been found to be helpful in characterizing the murmurs produced by occluded veins and arteries, for example in the diagnosis of coronary and carotid arteries diseases. In the present work we apply three different time frequency techniques to exploit the spectral content of the murmurs: Empirical Mode Decomposition, Wavelet Packets and Principal Component Analysis (PCA). A database of recordings form a group of patients currently undergoing hemodialysis treatment three times a week at the Department of Clinical Physiology, Lund University Hospital are used in this study for testing the different algorithms. A set of features taken from the coefficients obtained from the three methods is selected, in a second step, two pattern recognition schemes with supervised learning are used to classify the selected features and label the recording as coming from a stenotic or non-stenotic segment, in an automatic way. As a summary, a comparison of the results is presented.

156
P72 Improved Detection of Ischemic Heart Disease by Combining High-Frequency ECG Analysis with Stress Echocardiography Jin-Oh Choi1 1, Guy Amit2, Linda R. Davrath2, Ga Yeon Lee1, Eunkyung Kim1, Sung-A Chang1, Sung-Ji Park1, Sang-Chol Lee1, Seung Woo Park1, Jae K. Oh1 1 Sunkyunkwan University School of Medicine, Samsung Medical Center, Seoul, South Korea 2 Biological Signal Processing Ltd, Tel-Aviv, Israel Background: Analysis of high-frequency QRS components (HFQRS) were recently reported to improve the diagnostic accuracy of ECG treadmill test (ETT). We sought to evaluate the clinical usefulness of HFQRS analysis during exercise echocardiography (echoCG) in detecting ischemic heart disease (IHD). Methods: We evaluated 156 pts (age 58±10, 103 men) who performed stress echoCG and either invasive angiography (n=57) or CT angiography (CTA, n=99), which were used as the gold standard for comparison. Exclusion criteria included indeterminate CTA, QRS>120ms, significant valve disease, resting wall motion abnormalities, previous cardiac surgery and insufficient maximal HR. ETT was performed using the HyperQ System (BSP Ltd, Tel-Aviv, Israel) that enables automatic ST-segment analysis and measures changes in HFQRS intensity during exercise. Pts with HFQRS intensity reduction of 50% or more in at least 3 leads were considered ischemic. Results: Significant IHD was found in 48 pts (31%). HFQRS was significantly more sensitive than ST segment analysis, with similar specificity (Table 1). Stress echoCG combined with HFQRS was more sensitive than the conventional combination with ETT. HFQRS provided an incremental diagnostic value (p<0.001) over pre-test, ETT and echoCG parameters (Figure 1). Using optimized cut-off points, the combined model achieved sensitivity and specificity of 86% and 80%, respectively. Conclusions: HFQRS analysis during stress echoCG is feasible and may provide additional information for the detection of significant IHD.
!!"#$%&'(&)*"+,-./*0&1%23-24",0%&-3&56789:&;!!&",<&./2%..&%0=-0"2<*-+2"1=>?&&! !"#$%&%'%&()*+,) !-".%/%.%&()*+,)0123!)4#45($%$) 67+)) 89+)"#$%&'()*+(,!-.!/0/123*3! 456!7! 586!-')(33!(9:#";!<!=>?@-! AB6!! AC6!!-')(33!(9:#";!<!D..! C56!77! 5E6!7!-'/'*3'*9/112F3*G0*H*9/0'!,*HH()(09(3!I%!J!8K8CL!M3K!=>?@-!!77!-'/'*3'*9/112F3*G0*H*9/0'!,*HH()(09(3!I%!J!8K8CL!M3K!D9:#!<!=>?@-!!!!
!!

157
P73 Influence of Individual Torso Geometry on Inverse Solution to Two Dipoles Jana Svehlikova1, Jana Macugova1, Marie Turzova1, Milan Tysler1, Michal Kania2, Roman Maniewski2 1 Institute of Measurement Science SAS, Bratislava, Slovakia 2 Institute of Biocybernetics and Biomedical Engineering PAS, Warsaw, Poland Purpose. Recently, body surface potentials measured on patients with coronary artery disease were used for testing the method for identification of local ischemic lesions by an inverse solution with two dipoles. A standard torso model with main inhomogeneities and 154 predefined positions of dipoles was used. Now the 15 different realistic individual models of torso were used to evaluate their influence on the result of the inverse identification. Materials and Methods. Difference QRST integral maps (DIMs) computed for 8 male patients by subtracting the integral map at rest from the map during exercise at load of 75W were considered as the representation of possible local repolarization changes induced by stress. For each patient inverse solutions with 2 dipoles were computed from 64 measured leads using 15 realistically shaped torso models provided by prof. A. van Oosterom and R. Hoekema. The individual models were created from MRI images of real male subjects and include the heart and main torso inhomogeneities such as lungs and ventricular cavities. The position of lead V2 was assigned with respect to the 4th intercostal level. The reference point (RP) at the base of the left ventricular septum was defined on each heart model and the difference of the z coordinate of the RP and V2 position was evaluated. The predefined positions of dipoles were established in each model of ventricles. The results of inverse solutions obtained using these realistic models and the standard torso model were compared. Results. The mean vertical difference between positions of RP and V2 computed as zV2-zRP was 2.45 cm (from -1.81 to 4.53). For the standard torso model this value was -1.25 cm, so for most of the observed models the position of heart in relation to lead V2 was considerably lower than in recently used standard model. Therefore we compared the inverse results obtained with previous standard model and at least 3 most similar individual models with vertical differences -1.81, -1.23 and - 0.18cm. Despite that we got the same locations only for 4 of the 8 tested cases/patients. Conclusions. The proposed inverse solution is very sensitive to the vertical position of the heart in the torso model. The 4th intercostal level generally used for positioning of leads V1 and V2 on the torso was apparently not in constant relationship with internal position of the heart. For inverse solution this relationship should be necessarily known for each particular patient.

158
P74 Utility of Heart Simplicity Inspection with Pocket Size Event ECG in the Citizens Marathon Rally Yukio Ozawa1, Kouji Matsubara2, Yuji Kasamaki3, Masakatsu Ota3 1 MJG Cardiovascular Institute, Saitama City, Japan 2 Card Guard Japan 3 Nihon Univ.School of Med, Japan Purpose : We have enforced the simple heart examination with a pocket size event ECG on that day of the marathon rally, for predicting heart problem. Object and method: The examination corner was installed in the starting point of 5 big marathon rallies in Japan, and Lead I of the ECG in CG-2100 pocket size event ECG corresponding was recorded for 32 seconds for 2,596 applicant total people (1,558 men and 1,038 women: 10 80 years old). The ECG specialist made out the ECG later and classified it according to the severity of ECG findings. Results: It was classified from normality to abnormality into G0-G5 according to the severity of ECG findings, and as GN about noise without diagnosis. The results were G0:2,224 ( 85.7 %), G1: 49 ( 1.9 %), G2: 113 ( 4.4 %) and G3: 7 ( 0.3 %), and did not have G4 or G5. Moreover, the judgment of GN was performed by 203 ( 7.7 %).Content of abnormal findings was 16 SVPC, 33 VPC, 19 AF, 1 A-V Brock, 7 negative T wave, 50 RBBB, 1 LBBB, 2 WPW syndrome and 9 ST-T abnormalities, etc. were seen. The subject of being not able to make out the electrocardiogram was drift and low voltage of lead I. Discussion : In the marathon rally participant, a lot of abnormal ECG such as atrial fibrillations and abnormal ST-T were seen more than the expectation. A pocket size event ECG can inspect a lot of ECGs for easy way to use in short time. As for this ECG, it was confirmed to be able to diagnose other abnormal findings though it was especially useful for the diagnosis of arrhythmia. It was suggested for a noise and a low potential to improve it considerably as a record condition by the re-record and other lead (II etc.). Conclusion : The simple method of inspection using the event electrocardiograph was enforced to the applicant on the day when the citizens marathon rally was held, and an abnormal findings were admitted to 169/2596 people (6.5%) more than we expected. The pocket size event ECG is useful as a lot of handy heart screening immediately before beginning of the marathon rally for the participant.

159
P75 Equivalent Dipole Vector Analysis for Detecting Pulmonary Hypertension Matevz Harlander1,4, Barbara Salobir1, Janez Toplisek2, Todd T. Schlegel3, Vito Starc4 1 Department of pulmonary diseases, University Medical Centre Ljubljana, Slovenia 2 Department of cardiology, University Medical Centre Ljubljana, Slovenia 3 NASA Johnson Space Center, Houston, TX, USA 4 Institute of Physiology, Faculty of Medicine, University of Ljubljana, Slovenia Background: Various 12-lead ECG criteria have been established to detect right ventricular hypertrophy as a marker of pulmonary hypertension (PH). While some criteria offer good specificity they lack sensitivity because of a low prevalence of positive findings in the PH population. We hypothesized that three-dimensional equivalent dipole (ED) model could serve as a better detection tool of PH. Methods: We enrolled: 1) 17 patients (12 female, 5 male, mean age 57 years, range 19-79 years) with echocardiographically detected PH (systolic pulmonary arterial pressure > 35 mmHg) and no significant left ventricular disease; and 2) 19 healthy controls (7 female, 12 male, mean age 44, range 31-53 years) with no known heart disease. In each subject we recorded a 5-minute high-resolution 12-lead conventional ECG and constructed principal signals using singular value decomposition. Assuming a standard thorax dimension of an adult person with homogenous and isotropic distribution of thorax conductance, we determined moving equivalent dipoles (ED), characterized by the 3D location in the thorax, dipolar strength and the spatial orientation, in time intervals of 5 ms. We used the sum of all ED vectors in the second half of the QRS complex to derive the amplitude of the right-sided ED vector (RV), if the orientation of ED was to the right side of the thorax, and in the first half the QRS to derive the amplitude of the left-sided vector (LV), if the orientation was leftward. Finally, the parameter RV/LV ratio was determined over an average of 256 complexes. Results: The groups differed in age and gender to some extent. There was a non-significant trend toward higher RV in patients with PH (438 ± 284 units) than in controls (280 ± 140 units) (p = 0.066) but the overlap was such that RV alone was not a good predictor of PH. On the other hand, the RV/LV ratio was a better predictor of PH, with 11/17 (64.7%) of PH patients but only in 1/19 (5.3%) control subjects having RV/LV ratio > 0.70 (p < 0.001). Conclusions: The use of ED for evaluating PH shows good specificity at a reasonable sensitivity. The results are limited due to the small study groups and differences in age and gender, but further investigations are warranted, including of ED’s diagnostic accuracy for PH versus that of other proposed ECG and VCG criteria.

160
P76 Cardia Mediated Bradycardia in the Fetus Parvin Dorostkar, Shanti Sivanandam University of Minnesota, Minneapolis, USA Fetal cardiac arrhythmias have been recognized with increasing frequency. Fetal tachycardia is one of the most common causes of non-immune fetal hydrops resulting in high fetal morbidity and mortality. The most significant fetal arrhythmias are supraventricular tachycardias, occurring at a rate of 47-68%. Severe bradycardias, in contrast, account for approximately 5% of all fetal arrhythmias. Fetal bradycardia is diagnosed when the fetal heart rate is less than 100 beats/minute and is usually associated with non-conducted premature atrial contractions and less commonly with fetal heart block. When fetal heart block is immune mediated the mortality is as high as 20%, therefore, an accurate diagnosis is imperative. We describe a unique cause of fetal bradycardia where fetal “echo” beats were diagnosed by inference supporting a bradycardia, which should be self-limited, requiring no treatment. In two fetuses bradycardia with a heart rate of 70-90 beats/minute was noted in association with a history of intermittent fetal supraventricular tachycardia. Careful echocardiographic evaluation of the heart rhythm revealed retrograde pulmonary blood flow in a bigeminal fashion in association with nonconducted atrial extrasystoles. The diagnosis of blocked “echo” beats was contemplated. This diagnosis should be considered when intermittent fetal tachycardia and bradycardia co-exist, supporting coupled atrial extrasystoles causing bigeminal sinus node suppression, resulting in relative bradycardia. The bradycardia rate is about half the rate of the underlying sinus rhythm with eventual spontaneous resolution to sinus rhythm. The diagnoses of this tachycardia mediated bradycardia should prevent unnecessary therapy.

161
P77 An Open-source Extensible Software Toolkit for Forward and Inverse Problems in Electrocardiography Dana Brooks1, Burak Erem1, Mike Steffen2, Jeroen Stinstra2, Robert MacLeod2 1 Northeastern University, Boston, USA 2 University of Utah, USA We introduce an extensible open-source software toolkit for forward and inverse problems in electrocardiography within the framework of the SCIRun package from the Center for Integrative Biomedical Computing. There is a dearth of such tools for the forward and inverse ECG problems. By contrast, there are a number of well-known and frequently-used software packages, both academic and commercial, for solving forward and inverse problems in brain source localization using electroencephalographic and magnetoencephalographic measurements. The availability of such packages has greatly aided progress in this field by facilitating validation and fair comparison of algorithms and enhancing the scientific acceptance of new algorithms through increasing reproducibility of results. Our goal is for our toolkit to play a similar role in advancing the acceptance and utility of forward and inverse electrocardiography. We have designed our toolkit to allow flexibility in problem formulation and solution approach by leveraging the dataflow network structure of SCIRun. This structure along with its built-in network editor provides flexible choice of geometric model, equivalent source model, forward solution approach, and inverse solution method. In particular the toolkit integrates access to epicardial and heart surface geometric models, activation-based (equivalent dipole layer) and surface potential based source models, finite element and boundary element forward solutions, and a variety of standard and novel inverse algorithms. It exploits SCIRun interfaces to both ECGSim and Matlab, with easy incorporation of geometries, data, and forward models from the former and provided and user-designed algorithms written in the latter. The toolkit leverages the ability of CIBC's BioMesh3d software to build multi-material computational meshes from segmented image data, as well as CIBC's Seg3D segmentation software, but can also read computational geometries produced outside the toolkit (including ECGSim geometries). Since SCIRun gives easy access to critical algorithm parameters (which can also be passed to Matlab algorithms), the toolkit provides interactive control of all aspects of the processing pipeline. Finally, the advanced visualization capabilities of both SCIRun and the CIBC visualization software map3d allow the user to flexibly and rapidly examine many aspects of the computational process and results. With support of the toolkit in both compiled and source code formats, varied investigators can compare algorithms and share data and geometries, thus facilitating increased progress, confidence, and eventually clinical application of results in this field. Future versions will integrate other bioelectric modeling capabilities such as defibrillation modeling and electrical impedance tomography.
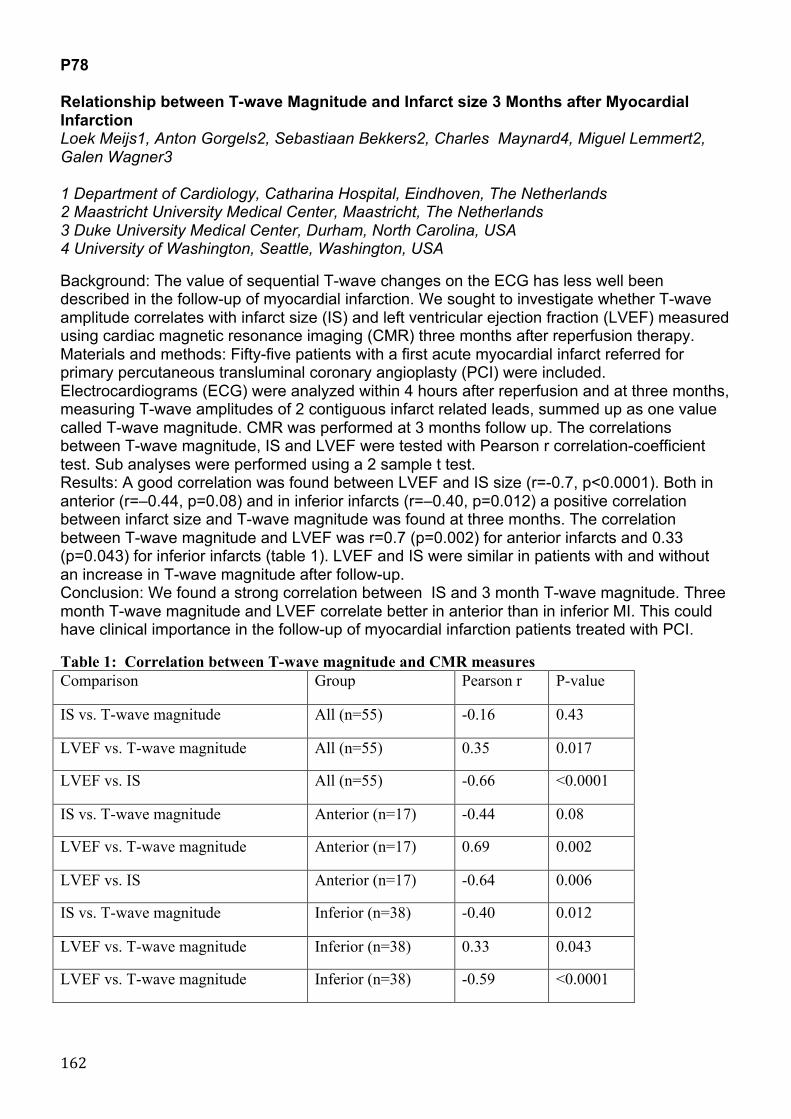
162
P78 Relationship between T-wave Magnitude and Infarct size 3 Months after Myocardial Infarction Loek Meijs1, Anton Gorgels2, Sebastiaan Bekkers2, Charles Maynard4, Miguel Lemmert2, Galen Wagner3 1 Department of Cardiology, Catharina Hospital, Eindhoven, The Netherlands 2 Maastricht University Medical Center, Maastricht, The Netherlands 3 Duke University Medical Center, Durham, North Carolina, USA 4 University of Washington, Seattle, Washington, USA Background: The value of sequential T-wave changes on the ECG has less well been described in the follow-up of myocardial infarction. We sought to investigate whether T-wave amplitude correlates with infarct size (IS) and left ventricular ejection fraction (LVEF) measured using cardiac magnetic resonance imaging (CMR) three months after reperfusion therapy. Materials and methods: Fifty-five patients with a first acute myocardial infarct referred for primary percutaneous transluminal coronary angioplasty (PCI) were included. Electrocardiograms (ECG) were analyzed within 4 hours after reperfusion and at three months, measuring T-wave amplitudes of 2 contiguous infarct related leads, summed up as one value called T-wave magnitude. CMR was performed at 3 months follow up. The correlations between T-wave magnitude, IS and LVEF were tested with Pearson r correlation-coefficient test. Sub analyses were performed using a 2 sample t test. Results: A good correlation was found between LVEF and IS size (r=-0.7, p<0.0001). Both in anterior (r=–0.44, p=0.08) and in inferior infarcts (r=–0.40, p=0.012) a positive correlation between infarct size and T-wave magnitude was found at three months. The correlation between T-wave magnitude and LVEF was r=0.7 (p=0.002) for anterior infarcts and 0.33 (p=0.043) for inferior infarcts (table 1). LVEF and IS were similar in patients with and without an increase in T-wave magnitude after follow-up. Conclusion: We found a strong correlation between IS and 3 month T-wave magnitude. Three month T-wave magnitude and LVEF correlate better in anterior than in inferior MI. This could have clinical importance in the follow-up of myocardial infarction patients treated with PCI. Table 1: Correlation between T-wave magnitude and CMR measures Comparison Group Pearson r P-value
IS vs. T-wave magnitude All (n=55) -0.16 0.43
LVEF vs. T-wave magnitude All (n=55) 0.35 0.017
LVEF vs. IS All (n=55) -0.66 <0.0001
IS vs. T-wave magnitude Anterior (n=17) -0.44 0.08
LVEF vs. T-wave magnitude Anterior (n=17) 0.69 0.002
LVEF vs. IS Anterior (n=17) -0.64 0.006
IS vs. T-wave magnitude Inferior (n=38) -0.40 0.012
LVEF vs. T-wave magnitude Inferior (n=38) 0.33 0.043
LVEF vs. T-wave magnitude Inferior (n=38) -0.59 <0.0001

163
P79 Analysis of QRS slopes as a measure of depolarization changes during acute myocardial ischemia Michael Ringborn1,2 , Daniel Romero3,4, Olle Pahlm5, Galen S Wagner6, Pablo Laguna3,4, Esther Pueyo3,4, Pyotr Platonov1 1Department of Cardiology, Lund University, Lund, Sweden, 2Thoracic Center, Blekingesjukhuset, Karlskrona, Sweden, 3Communications Technology Group, I3A, University of Zaragoza, Spain, 4CIBER de Bioingenieria, Biomateriales y Nanomedicina (CIBER-BBN), Zaragoza, Spain, 5Department of Clinical Physiology, Lund University, Lund, Sweden, 6Duke University Medical Center, Durham, NC. Background: Risk stratification of acute myocardial ischemia could be improved by adding depolarization changes to the conventionally used ST-T changes. No QRS method has, however reached clinical use yet .We assessed the value of analyzing QRS slope changes to evaluate and quantify ischemia. Methods: In 79 patients undergoing prolonged elective percutaneous coronary intervention (25 LAD, 38 RCA and 16 LCX occlusions), upward (US) and downward (DS) slopes of the R wave, as well as upward slope of the S wave (TS) were determined at baseline and continuously during the procedure among the 12 standard ECG leads. In 38 of the patients (8 LAD, 21 RCA and 9 LCX) myocardial scintigraphic imaging was additionally performed during the occlusion and as a control the following day to quantify the ischemia. Results: For the total population (n=79), DS changes were more pronounced than US changes in all leads but V1. In subgroup analysis, LAD and RCA occlusions showed more pronounced changes of DS than US in anteriorly (V1-V5) and inferiorly (II, aVF and III) oriented leads, respectively. For typical leads with S waves (V1-V3), TS showed equal amount of change as DS. The amount of DS change showed a clear spatial pattern, with LAD occlusions showing most changes in leads V2-V4, RCA occlusions in leads II, aVF and III and LCX occlusions in leads V5-V6. In the subgroup with scintigraphic imaging (n=38) the sum of absolute, positive DS change among all leads displayed a significant correlation to both extent and severity of ischemia (r= 0.70, p<0.0001 and r=0.73, p<0.0001 respectively). The corresponding correlation between sum of R-wave amplitude increase among all leads, as well as QRS duration change and extent/severity, was r=0.41, p=0.011; r=0.46, p=0.004 and r=0.43, p=0.007; r=0.48, p=0.003, respectively. Conclusion: We conclude that analysis of QRS slopes offers a robust depolarization parameter that could be used to evaluate myocardial ischemia in addition to conventional repolarization changes.