Embed Size (px)
Citation preview
1
Oracle® Communications Performance Intelligence Center Planning Guide Release 10.2.1 E77481-01
June 2017

2
Oracle® Communications Performance Intelligence Center Planning Guide, Release 10.2.1 Copyright © 2003, 2017 Oracle and/or its affiliates. All rights reserved. This software and related documentation are provided under a license agreement containing restrictions on use and disclosure and are protected by intellectual property laws. Except as expressly permitted in your license agreement or allowed by law, you may not use, copy, reproduce, translate, broadcast, modify, license, transmit, distribute, exhibit, perform, publish, or display any part, in any form, or by any means. Reverse engineering, disassembly, or decompilation of this software, unless required by law for interoperability, is prohibited. The information contained herein is subject to change without notice and is not warranted to be error-free. If you find any errors, please report them to us in writing. If this is software or related documentation that is delivered to the U.S. Government or anyone licensing it on behalf of the U.S. Government, the following notices are applicable: U.S. GOVERNMENT END USERS: Oracle programs, including any operating system, integrated software, any programs installed on the hardware, and/or documentation, delivered to U.S. Government end users are "commercial computer software" pursuant to the applicable Federal Acquisition Regulation and agency-specific supplemental regulations. As such, use, duplication, disclosure, modification, and adaptation of the programs, including any operating system, integrated software, any programs installed on the hardware, and/or documentation, shall be subject to license terms and license restrictions applicable to the programs. No other rights are granted to the U.S. Government. This software or hardware is developed for general use in a variety of information management applications. It is not developed or intended for use in any inherently dangerous applications, including applications that may create a risk of personal injury. If you use this software or hardware in dangerous applications, then you shall be responsible to take all appropriate fail-safe, backup, redundancy, and other measures to ensure its safe use. Oracle Corporation and its affiliates disclaim any liability for any damages caused by use of this software or hardware in dangerous applications. Oracle and Java are registered trademarks of Oracle and/or its affiliates. Other names may be trademarks of their respective owners. Intel and Intel Xeon are trademarks or registered trademarks of Intel Corporation. All SPARC trademarks are used under license and are trademarks or registered trademarks of SPARC International, Inc. AMD, Opteron, the AMD logo, and the AMD Opteron logo are trademarks or registered trademarks of Advanced Micro Devices. UNIX is a registered trademark of The Open Group. This software or hardware and documentation may provide access to or information about content, products, and services from third parties. Oracle Corporation and its affiliates are not responsible for and expressly disclaim all warranties of any kind with respect to third party content, products, and services unless otherwise set forth in an applicable agreement between you and Oracle. Oracle Corporation and its affiliates will not be responsible for any loss, costs, or damages incurred due to your access to or use of third-party content, products, or services, except as set forth in an applicable agreement between you and Oracle.
CAUTION: Use only the guide downloaded from Oracle Help Center (OHC).
Refer to Appendix section for instructions on accessing My Oracle Support and Oracle Help Center.
3
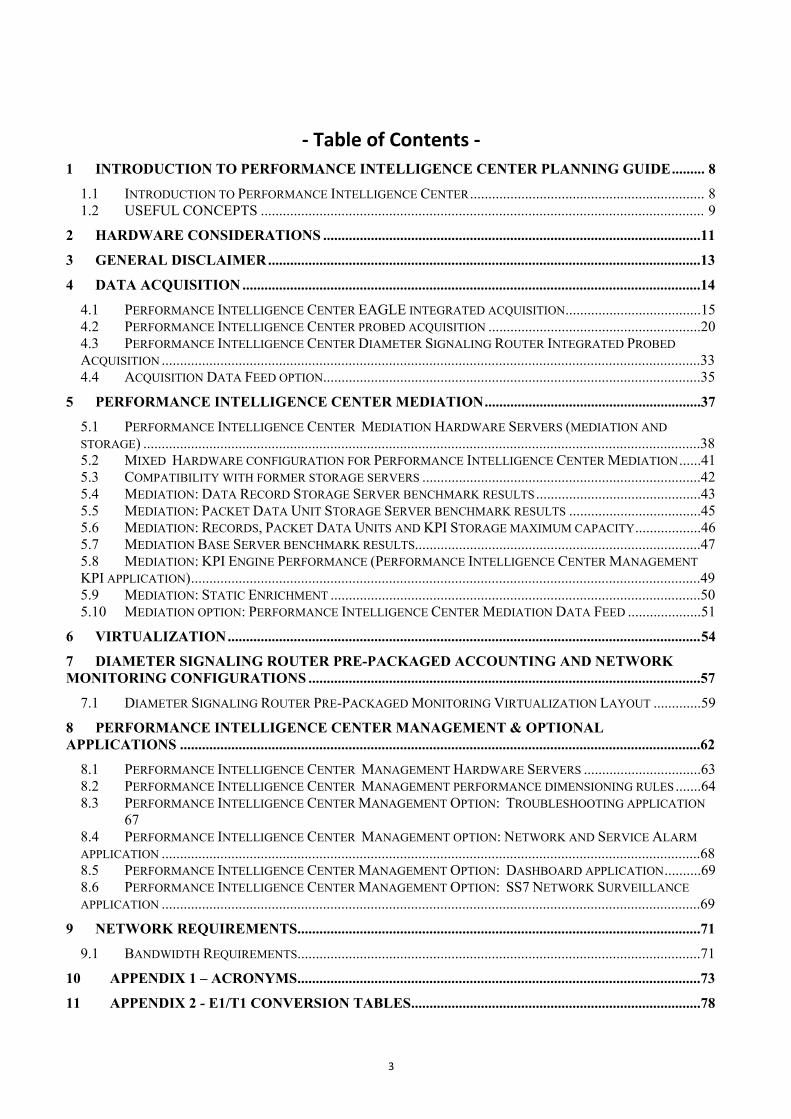
- Table of Contents -
1 INTRODUCTION TO PERFORMANCE INTELLIGENCE CENTER PLANNING GUIDE ......... 8
1.1 INTRODUCTION TO PERFORMANCE INTELLIGENCE CENTER ................................................................ 8 1.2 USEFUL CONCEPTS ......................................................................................................................... 9
2 HARDWARE CONSIDERATIONS .......................................................................................................11
3 GENERAL DISCLAIMER ......................................................................................................................13
4 DATA ACQUISITION .............................................................................................................................14
4.1 PERFORMANCE INTELLIGENCE CENTER EAGLE INTEGRATED ACQUISITION .....................................15 4.2 PERFORMANCE INTELLIGENCE CENTER PROBED ACQUISITION ..........................................................20 4.3 PERFORMANCE INTELLIGENCE CENTER DIAMETER SIGNALING ROUTER INTEGRATED PROBED ACQUISITION ...................................................................................................................................................33 4.4 ACQUISITION DATA FEED OPTION.......................................................................................................35
5 PERFORMANCE INTELLIGENCE CENTER MEDIATION ...........................................................37
5.1 PERFORMANCE INTELLIGENCE CENTER MEDIATION HARDWARE SERVERS (MEDIATION AND STORAGE) ........................................................................................................................................................38 5.2 MIXED HARDWARE CONFIGURATION FOR PERFORMANCE INTELLIGENCE CENTER MEDIATION ......41 5.3 COMPATIBILITY WITH FORMER STORAGE SERVERS ............................................................................42 5.4 MEDIATION: DATA RECORD STORAGE SERVER BENCHMARK RESULTS .............................................43 5.5 MEDIATION: PACKET DATA UNIT STORAGE SERVER BENCHMARK RESULTS ....................................45 5.6 MEDIATION: RECORDS, PACKET DATA UNITS AND KPI STORAGE MAXIMUM CAPACITY ..................46 5.7 MEDIATION BASE SERVER BENCHMARK RESULTS..............................................................................47 5.8 MEDIATION: KPI ENGINE PERFORMANCE (PERFORMANCE INTELLIGENCE CENTER MANAGEMENT KPI APPLICATION) ...........................................................................................................................................49 5.9 MEDIATION: STATIC ENRICHMENT .....................................................................................................50 5.10 MEDIATION OPTION: PERFORMANCE INTELLIGENCE CENTER MEDIATION DATA FEED ....................51
6 VIRTUALIZATION .................................................................................................................................54
7 DIAMETER SIGNALING ROUTER PRE-PACKAGED ACCOUNTING AND NETWORK MONITORING CONFIGURATIONS ...........................................................................................................57
7.1 DIAMETER SIGNALING ROUTER PRE-PACKAGED MONITORING VIRTUALIZATION LAYOUT .............59
8 PERFORMANCE INTELLIGENCE CENTER MANAGEMENT & OPTIONAL APPLICATIONS ..............................................................................................................................................62
8.1 PERFORMANCE INTELLIGENCE CENTER MANAGEMENT HARDWARE SERVERS ................................63 8.2 PERFORMANCE INTELLIGENCE CENTER MANAGEMENT PERFORMANCE DIMENSIONING RULES .......64 8.3 PERFORMANCE INTELLIGENCE CENTER MANAGEMENT OPTION: TROUBLESHOOTING APPLICATION 67 8.4 PERFORMANCE INTELLIGENCE CENTER MANAGEMENT OPTION: NETWORK AND SERVICE ALARM APPLICATION ...................................................................................................................................................68 8.5 PERFORMANCE INTELLIGENCE CENTER MANAGEMENT OPTION: DASHBOARD APPLICATION ..........69 8.6 PERFORMANCE INTELLIGENCE CENTER MANAGEMENT OPTION: SS7 NETWORK SURVEILLANCE APPLICATION ...................................................................................................................................................69
9 NETWORK REQUIREMENTS..............................................................................................................71
9.1 BANDWIDTH REQUIREMENTS ..............................................................................................................71
10 APPENDIX 1 – ACRONYMS ..............................................................................................................73
11 APPENDIX 2 - E1/T1 CONVERSION TABLES ...............................................................................78

4
12 APPENDIX 3 – EAGLE TPS TO PERFORMANCE INTELLIGENCE CENTER MBPS CONVERSION ................................................................................................................................................. 79
13 APPENDIX 4 – HOW TO CONFIGURE AN PERFORMANCE INTELLIGENCE CENTER FOR DIAMETER SIGNALING ROUTER MONITORING ...................................................................... 80
14 APPENDIX 5 – BUILDERS CONTENT OF MEDIATION PROTOCOL LICENSES ............... 81
15 APPENDIX 6 – MY ORACLE SUPPORT (MOS) ........................................................................... 84
16 APPENDIX 7 – ORACLE HELP CENTER ...................................................................................... 85
5
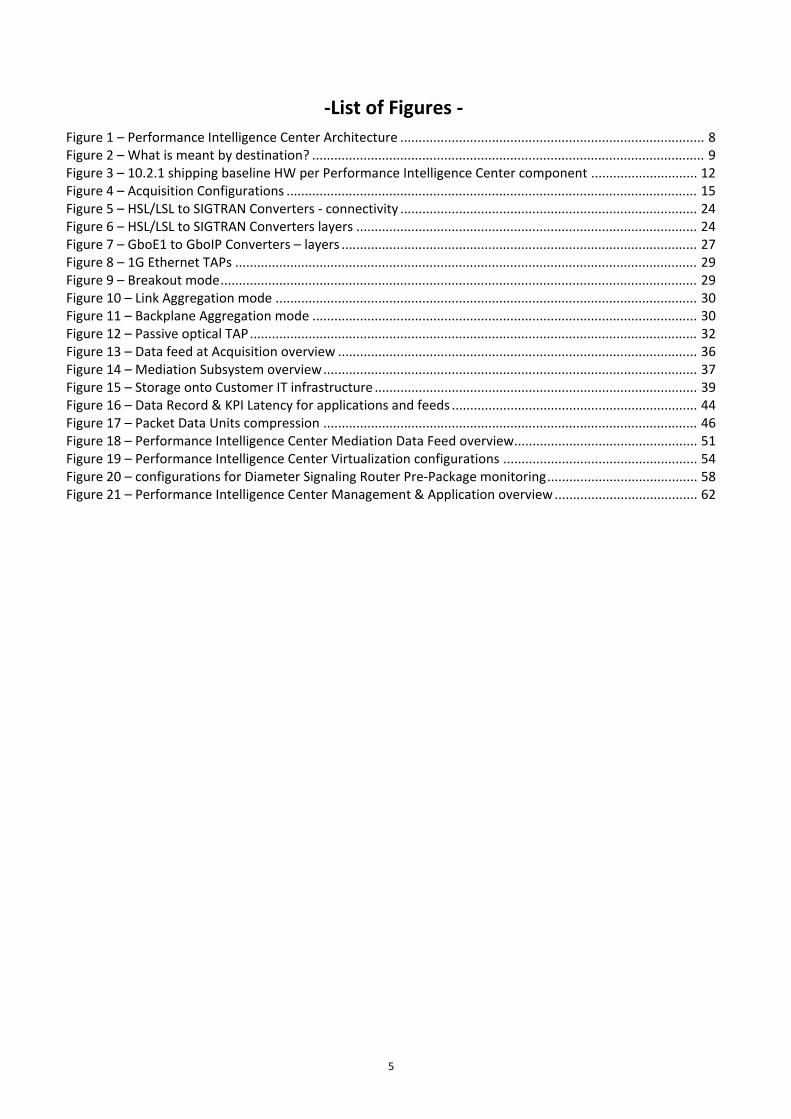
-List of Figures - Figure 1 – Performance Intelligence Center Architecture ................................................................................... 8 Figure 2 – What is meant by destination? ........................................................................................................... 9 Figure 3 – 10.2.1 shipping baseline HW per Performance Intelligence Center component ............................. 12 Figure 4 – Acquisition Configurations ................................................................................................................ 15 Figure 5 – HSL/LSL to SIGTRAN Converters - connectivity ................................................................................. 24 Figure 6 – HSL/LSL to SIGTRAN Converters layers ............................................................................................. 24 Figure 7 – GboE1 to GboIP Converters – layers ................................................................................................. 27 Figure 8 – 1G Ethernet TAPs .............................................................................................................................. 29 Figure 9 – Breakout mode .................................................................................................................................. 29 Figure 10 – Link Aggregation mode ................................................................................................................... 30 Figure 11 – Backplane Aggregation mode ......................................................................................................... 30 Figure 12 – Passive optical TAP .......................................................................................................................... 32 Figure 13 – Data feed at Acquisition overview .................................................................................................. 36 Figure 14 – Mediation Subsystem overview ...................................................................................................... 37 Figure 15 – Storage onto Customer IT infrastructure ........................................................................................ 39 Figure 16 – Data Record & KPI Latency for applications and feeds ................................................................... 44 Figure 17 – Packet Data Units compression ...................................................................................................... 46 Figure 18 – Performance Intelligence Center Mediation Data Feed overview .................................................. 51 Figure 19 – Performance Intelligence Center Virtualization configurations ..................................................... 54 Figure 20 – configurations for Diameter Signaling Router Pre-Package monitoring ......................................... 58 Figure 21 – Performance Intelligence Center Management & Application overview ....................................... 62
6
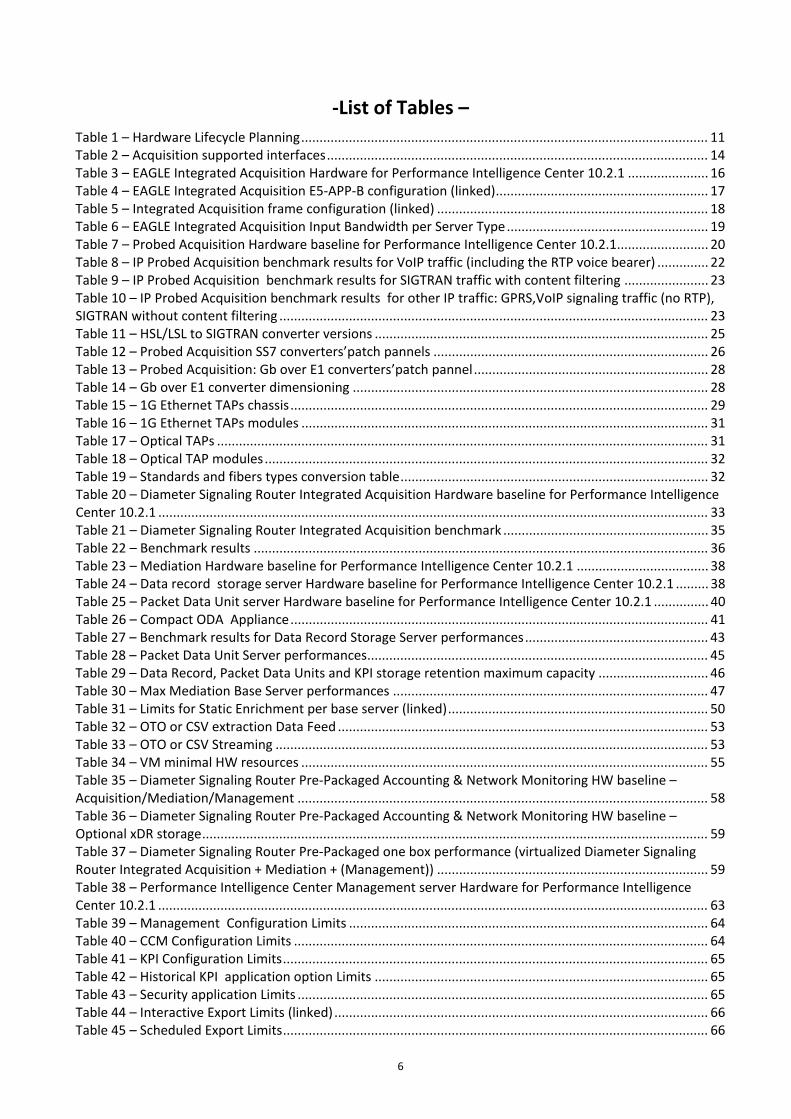
-List of Tables – Table 1 – Hardware Lifecycle Planning ............................................................................................................... 11 Table 2 – Acquisition supported interfaces ........................................................................................................ 14 Table 3 – EAGLE Integrated Acquisition Hardware for Performance Intelligence Center 10.2.1 ...................... 16 Table 4 – EAGLE Integrated Acquisition E5-APP-B configuration (linked) .......................................................... 17 Table 5 – Integrated Acquisition frame configuration (linked) .......................................................................... 18 Table 6 – EAGLE Integrated Acquisition Input Bandwidth per Server Type ....................................................... 19 Table 7 – Probed Acquisition Hardware baseline for Performance Intelligence Center 10.2.1......................... 20 Table 8 – IP Probed Acquisition benchmark results for VoIP traffic (including the RTP voice bearer) .............. 22 Table 9 – IP Probed Acquisition benchmark results for SIGTRAN traffic with content filtering ....................... 23 Table 10 – IP Probed Acquisition benchmark results for other IP traffic: GPRS,VoIP signaling traffic (no RTP), SIGTRAN without content filtering ..................................................................................................................... 23 Table 11 – HSL/LSL to SIGTRAN converter versions ........................................................................................... 25 Table 12 – Probed Acquisition SS7 converters’patch pannels ........................................................................... 26 Table 13 – Probed Acquisition: Gb over E1 converters’patch pannel ................................................................ 28 Table 14 – Gb over E1 converter dimensioning ................................................................................................. 28 Table 15 – 1G Ethernet TAPs chassis .................................................................................................................. 29 Table 16 – 1G Ethernet TAPs modules ............................................................................................................... 31 Table 17 – Optical TAPs ...................................................................................................................................... 31 Table 18 – Optical TAP modules ......................................................................................................................... 32 Table 19 – Standards and fibers types conversion table .................................................................................... 32 Table 20 – Diameter Signaling Router Integrated Acquisition Hardware baseline for Performance Intelligence Center 10.2.1 ...................................................................................................................................................... 33 Table 21 – Diameter Signaling Router Integrated Acquisition benchmark ........................................................ 35 Table 22 – Benchmark results ............................................................................................................................ 36 Table 23 – Mediation Hardware baseline for Performance Intelligence Center 10.2.1 .................................... 38 Table 24 – Data record storage server Hardware baseline for Performance Intelligence Center 10.2.1 ......... 38 Table 25 – Packet Data Unit server Hardware baseline for Performance Intelligence Center 10.2.1 ............... 40 Table 26 – Compact ODA Appliance .................................................................................................................. 41 Table 27 – Benchmark results for Data Record Storage Server performances .................................................. 43 Table 28 – Packet Data Unit Server performances ............................................................................................. 45 Table 29 – Data Record, Packet Data Units and KPI storage retention maximum capacity .............................. 46 Table 30 – Max Mediation Base Server performances ...................................................................................... 47 Table 31 – Limits for Static Enrichment per base server (linked) ....................................................................... 50 Table 32 – OTO or CSV extraction Data Feed ..................................................................................................... 53 Table 33 – OTO or CSV Streaming ...................................................................................................................... 53 Table 34 – VM minimal HW resources ............................................................................................................... 55 Table 35 – Diameter Signaling Router Pre-Packaged Accounting & Network Monitoring HW baseline – Acquisition/Mediation/Management ................................................................................................................ 58 Table 36 – Diameter Signaling Router Pre-Packaged Accounting & Network Monitoring HW baseline – Optional xDR storage .......................................................................................................................................... 59 Table 37 – Diameter Signaling Router Pre-Packaged one box performance (virtualized Diameter Signaling Router Integrated Acquisition + Mediation + (Management)) .......................................................................... 59 Table 38 – Performance Intelligence Center Management server Hardware for Performance Intelligence Center 10.2.1 ...................................................................................................................................................... 63 Table 39 – Management Configuration Limits .................................................................................................. 64 Table 40 – CCM Configuration Limits ................................................................................................................. 64 Table 41 – KPI Configuration Limits .................................................................................................................... 65 Table 42 – Historical KPI application option Limits ........................................................................................... 65 Table 43 – Security application Limits ................................................................................................................ 65 Table 44 – Interactive Export Limits (linked) ...................................................................................................... 66 Table 45 – Scheduled Export Limits .................................................................................................................... 66
7
Table 46 – System Alarms Limits ........................................................................................................................ 67 Table 47 – Audit Viewer Limits .......................................................................................................................... 67 Table 48 – Troubleshooting application Option Limits ..................................................................................... 67 Table 49 – Troubleshooting application Option responsiveness ...................................................................... 67 Table 50 – Network and Service Alarm Limits .................................................................................................. 68 Table 51 – Network and Service Alarm Forwarding Limits ............................................................................... 68 Table 52 – Typical Network and Service Alarm responsiveness ....................................................................... 68 Table 53 – Dashboard application Limits ........................................................................................................... 69 Note: each dashboard panel uses one simultaneous user license .................................................................... 69 Table 54 – Typical Dashboard application responsiveness ................................................................................ 69 Table 55 – SS7 Network Surveillance application for TDM Limits ..................................................................... 70 Table 56 – SS7 Network Surveillance application for SIGTRAN Limits ............................................................... 70 Table 57 – Acronyms table ................................................................................................................................. 73 Table 58 – LSL at 64000 bps equivalence ........................................................................................................... 78 Table 59 – LSL at 56000 bps equivalence ........................................................................................................... 78 Table 60 – Average MSU size ............................................................................................................................. 79
8
1 INTRODUCTION TO PERFORMANCE INTELLIGENCE CENTER PLANNING GUIDE
This document intent is to provide readers with best practices and rules to configure and design its Performance Intelligence Center system.
Dimensioning rules are derived from benchmark tests results performed in lab. The assumptions in performance tables are the conditions used during benchmark, and represent a fair usage of the system. They are as close as possible to real traffic based on Performance Intelligence Center usage experience. But they can’t be always extrapolate to customer real traffic case.
This document covers the various aspects of each Performance Intelligence Center component including:
• dimensioning rules & limits for the following functional areas o Acquisition for collecting signaling data from the network o Mediation for correlating and storing the data o Data feeds to export xDRs & KPIs to flat files or external DB o Performance Intelligence Center Management & Applications for accessibility to the data
• Frames configurations • Network requirements
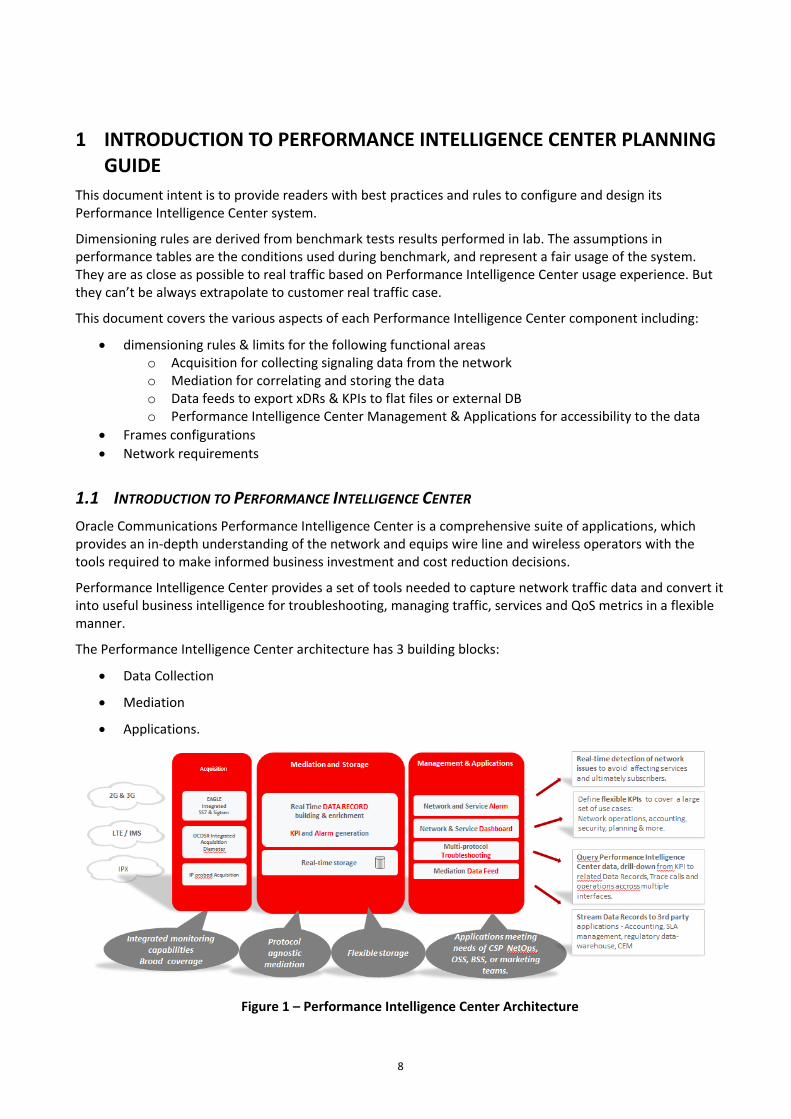
1.1 INTRODUCTION TO PERFORMANCE INTELLIGENCE CENTER Oracle Communications Performance Intelligence Center is a comprehensive suite of applications, which provides an in-depth understanding of the network and equips wire line and wireless operators with the tools required to make informed business investment and cost reduction decisions.
Performance Intelligence Center provides a set of tools needed to capture network traffic data and convert it into useful business intelligence for troubleshooting, managing traffic, services and QoS metrics in a flexible manner.
The Performance Intelligence Center architecture has 3 building blocks:
• Data Collection
• Mediation
• Applications.
Figure 1 – Performance Intelligence Center Architecture
9
1.2 USEFUL CONCEPTS
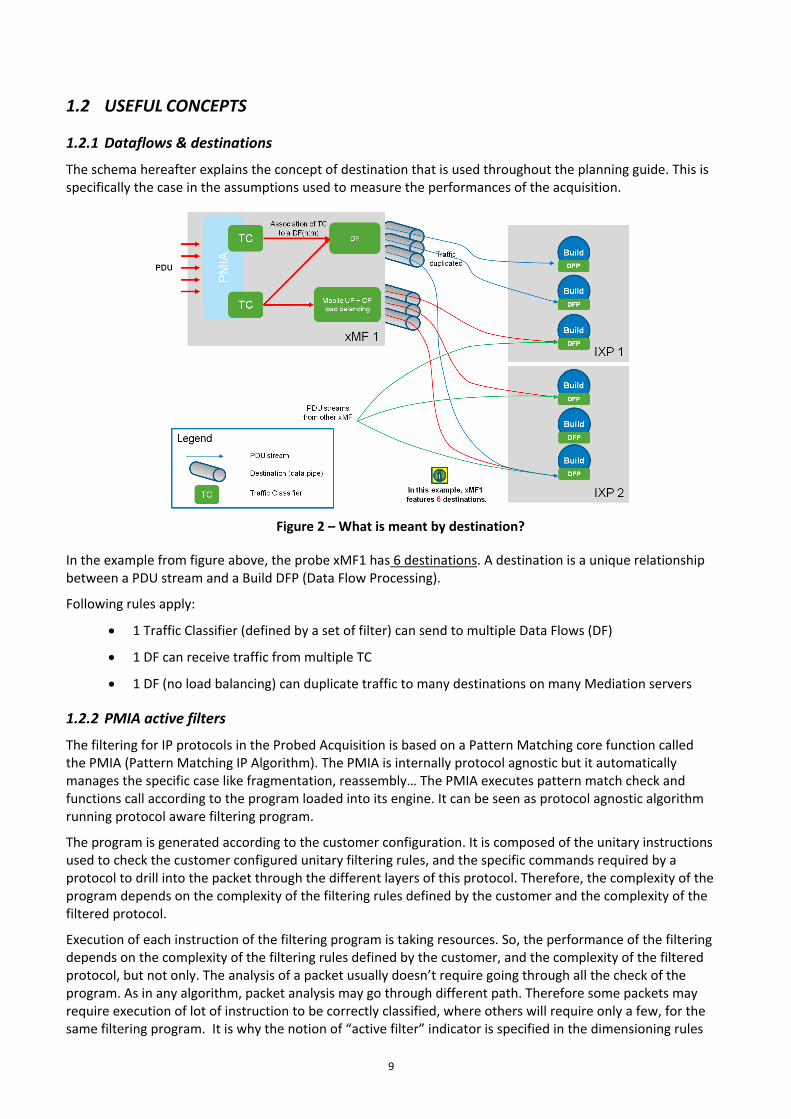
1.2.1 Dataflows & destinations
The schema hereafter explains the concept of destination that is used throughout the planning guide. This is specifically the case in the assumptions used to measure the performances of the acquisition.
Figure 2 – What is meant by destination?
In the example from figure above, the probe xMF1 has 6 destinations. A destination is a unique relationship between a PDU stream and a Build DFP (Data Flow Processing).
Following rules apply:
• 1 Traffic Classifier (defined by a set of filter) can send to multiple Data Flows (DF)
• 1 DF can receive traffic from multiple TC
• 1 DF (no load balancing) can duplicate traffic to many destinations on many Mediation servers
1.2.2 PMIA active filters
The filtering for IP protocols in the Probed Acquisition is based on a Pattern Matching core function called the PMIA (Pattern Matching IP Algorithm). The PMIA is internally protocol agnostic but it automatically manages the specific case like fragmentation, reassembly… The PMIA executes pattern match check and functions call according to the program loaded into its engine. It can be seen as protocol agnostic algorithm running protocol aware filtering program.
The program is generated according to the customer configuration. It is composed of the unitary instructions used to check the customer configured unitary filtering rules, and the specific commands required by a protocol to drill into the packet through the different layers of this protocol. Therefore, the complexity of the program depends on the complexity of the filtering rules defined by the customer and the complexity of the filtered protocol.
Execution of each instruction of the filtering program is taking resources. So, the performance of the filtering depends on the complexity of the filtering rules defined by the customer, and the complexity of the filtered protocol, but not only. The analysis of a packet usually doesn’t require going through all the check of the program. As in any algorithm, packet analysis may go through different path. Therefore some packets may require execution of lot of instruction to be correctly classified, where others will require only a few, for the same filtering program. It is why the notion of “active filter” indicator is specified in the dimensioning rules

10
provided in this document. It is the average number of unitary PMIA Engine instruction performed per packet for complete filtering.
11
2 HARDWARE CONSIDERATIONS
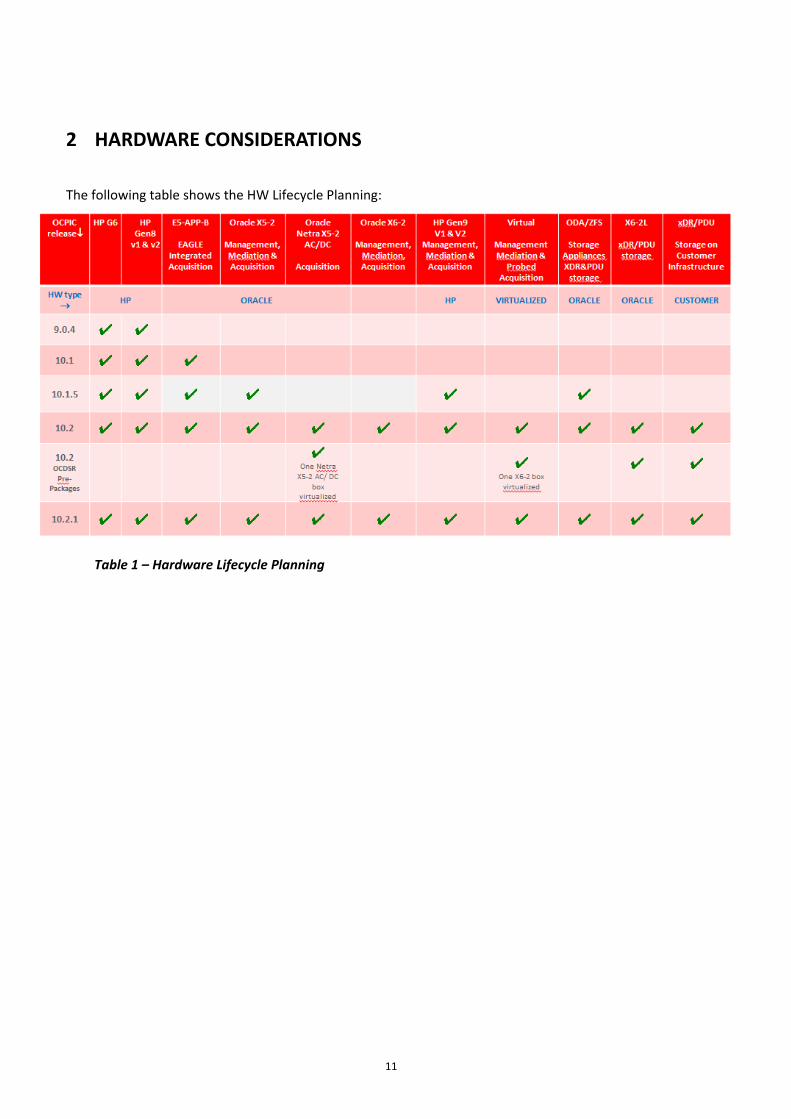
The following table shows the HW Lifecycle Planning:
Table 1 – Hardware Lifecycle Planning
12
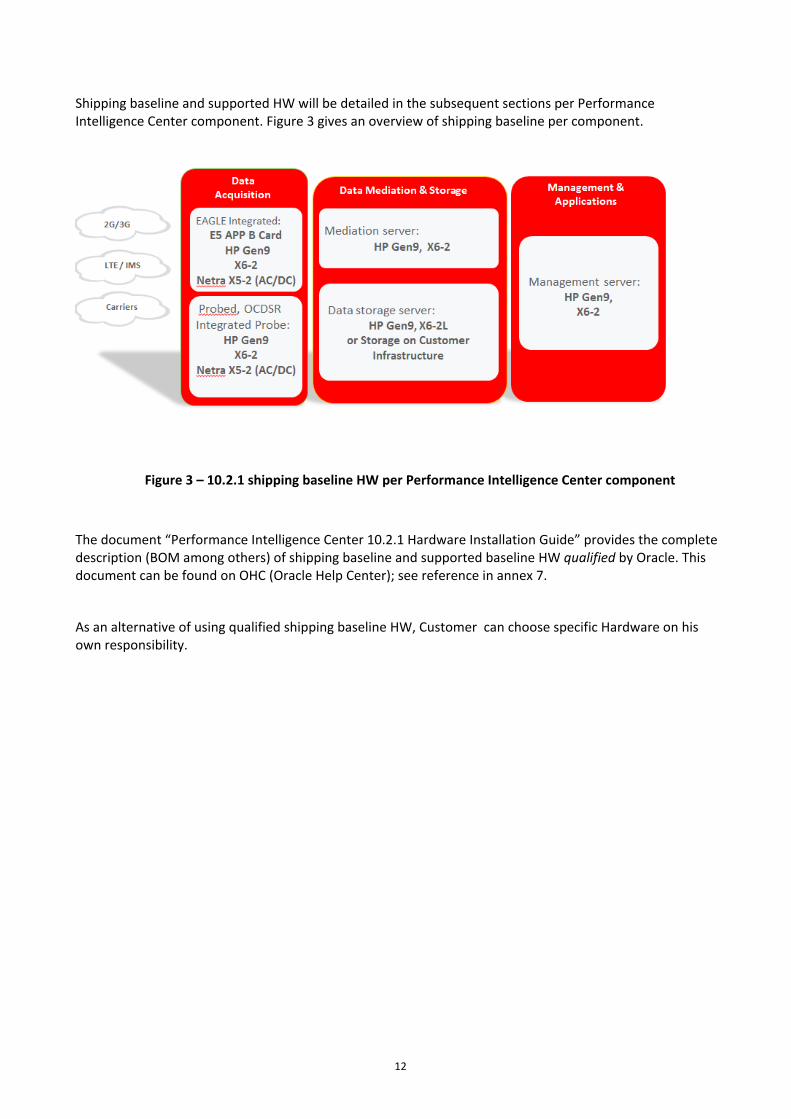
Shipping baseline and supported HW will be detailed in the subsequent sections per Performance Intelligence Center component. Figure 3 gives an overview of shipping baseline per component.
Figure 3 – 10.2.1 shipping baseline HW per Performance Intelligence Center component
The document “Performance Intelligence Center 10.2.1 Hardware Installation Guide” provides the complete description (BOM among others) of shipping baseline and supported baseline HW qualified by Oracle. This document can be found on OHC (Oracle Help Center); see reference in annex 7.
As an alternative of using qualified shipping baseline HW, Customer can choose specific Hardware on his own responsibility.

13
3 GENERAL DISCLAIMER All dimensioning information, performance figures (Mbps, nb of Users…) and rules provided in this document are derived from benchmark tests results performed in lab on qualified HW shipping baseline. Actual results may differ according to Customer case. Important notes on all performance figures presented in this document: - they are given for current shipping baseline HW - they are not applicable for virtualized HW except for Oracle Diameter Signaling Router Pre-Packaged Monitoring configurations - they are not applicable for xDR and PDU storage on Customer IT Storage Infrastructure (Cloud)
14
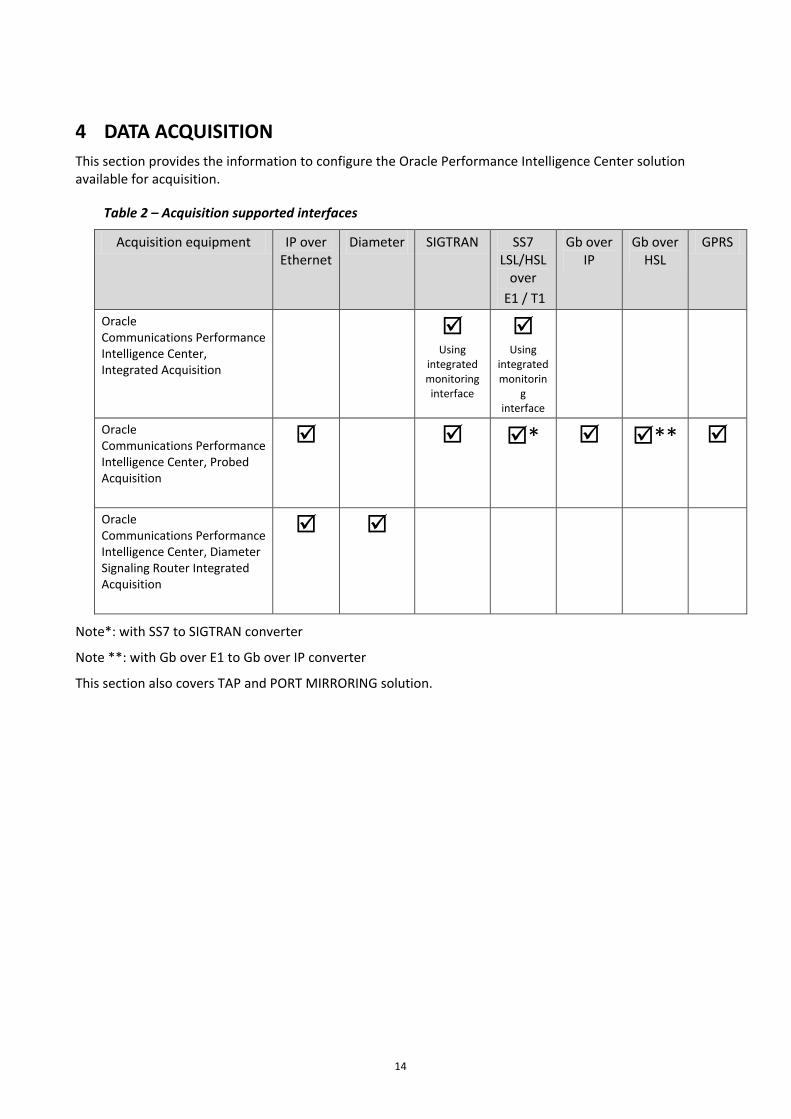
4 DATA ACQUISITION This section provides the information to configure the Oracle Performance Intelligence Center solution available for acquisition.
Table 2 – Acquisition supported interfaces
Acquisition equipment IP over Ethernet
Diameter SIGTRAN SS7 LSL/HSL
over E1 / T1
Gb over IP
Gb over HSL
GPRS
Oracle Communications Performance Intelligence Center, Integrated Acquisition
Using
integrated monitoring interface
Using
integrated monitorin
g interface
Oracle Communications Performance Intelligence Center, Probed Acquisition
* **
Oracle Communications Performance Intelligence Center, Diameter Signaling Router Integrated Acquisition
Note*: with SS7 to SIGTRAN converter
Note **: with Gb over E1 to Gb over IP converter
This section also covers TAP and PORT MIRRORING solution.
15
Data Acquisition
EAGLE Integrated Acquisition
Data Acquisition
ProbedAcquisition
converter
Data Mediation & Storage
Mediation
PDUs
PDUsSS7-
TDM/SIGTRAN
Diameter
2G/3G/4G/IMS
Gb - TDM
SS7 - TDM
converter
OCDSR Integrated Acquisition
PDUs
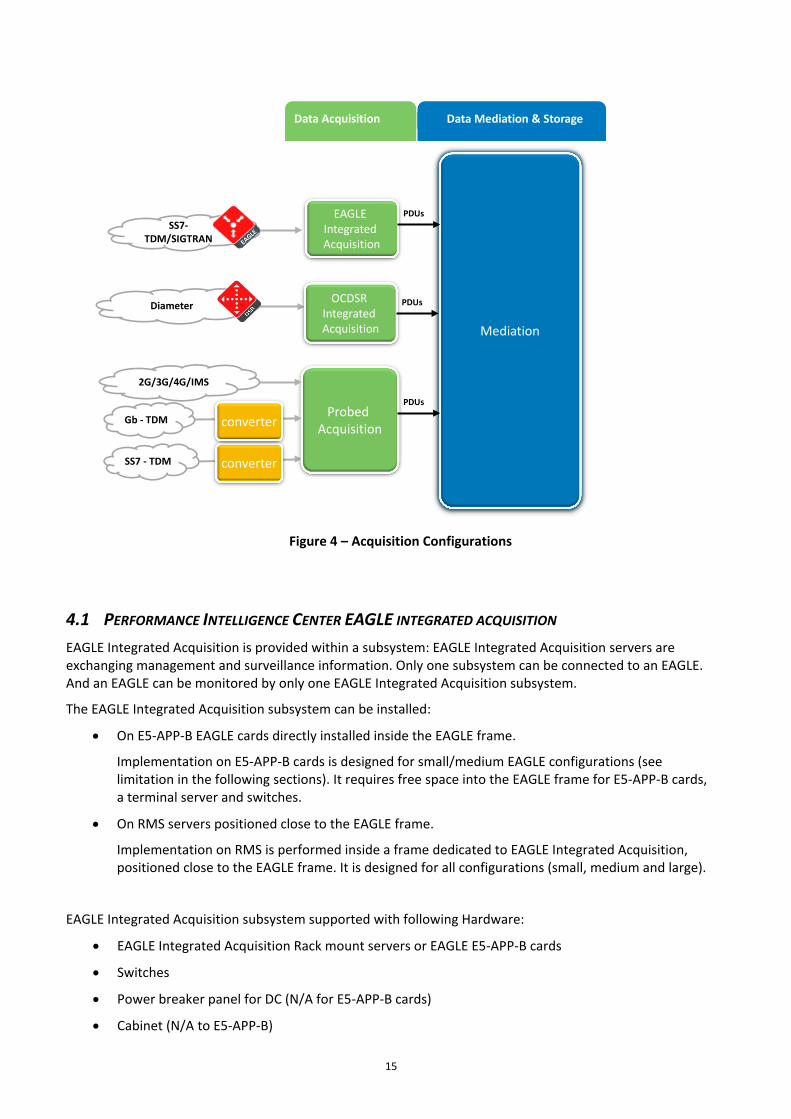
Figure 4 – Acquisition Configurations
4.1 PERFORMANCE INTELLIGENCE CENTER EAGLE INTEGRATED ACQUISITION EAGLE Integrated Acquisition is provided within a subsystem: EAGLE Integrated Acquisition servers are exchanging management and surveillance information. Only one subsystem can be connected to an EAGLE. And an EAGLE can be monitored by only one EAGLE Integrated Acquisition subsystem.
The EAGLE Integrated Acquisition subsystem can be installed:
• On E5-APP-B EAGLE cards directly installed inside the EAGLE frame.
Implementation on E5-APP-B cards is designed for small/medium EAGLE configurations (see limitation in the following sections). It requires free space into the EAGLE frame for E5-APP-B cards, a terminal server and switches.
• On RMS servers positioned close to the EAGLE frame.
Implementation on RMS is performed inside a frame dedicated to EAGLE Integrated Acquisition, positioned close to the EAGLE frame. It is designed for all configurations (small, medium and large).
EAGLE Integrated Acquisition subsystem supported with following Hardware:
• EAGLE Integrated Acquisition Rack mount servers or EAGLE E5-APP-B cards
• Switches
• Power breaker panel for DC (N/A for E5-APP-B cards)
• Cabinet (N/A to E5-APP-B)
16
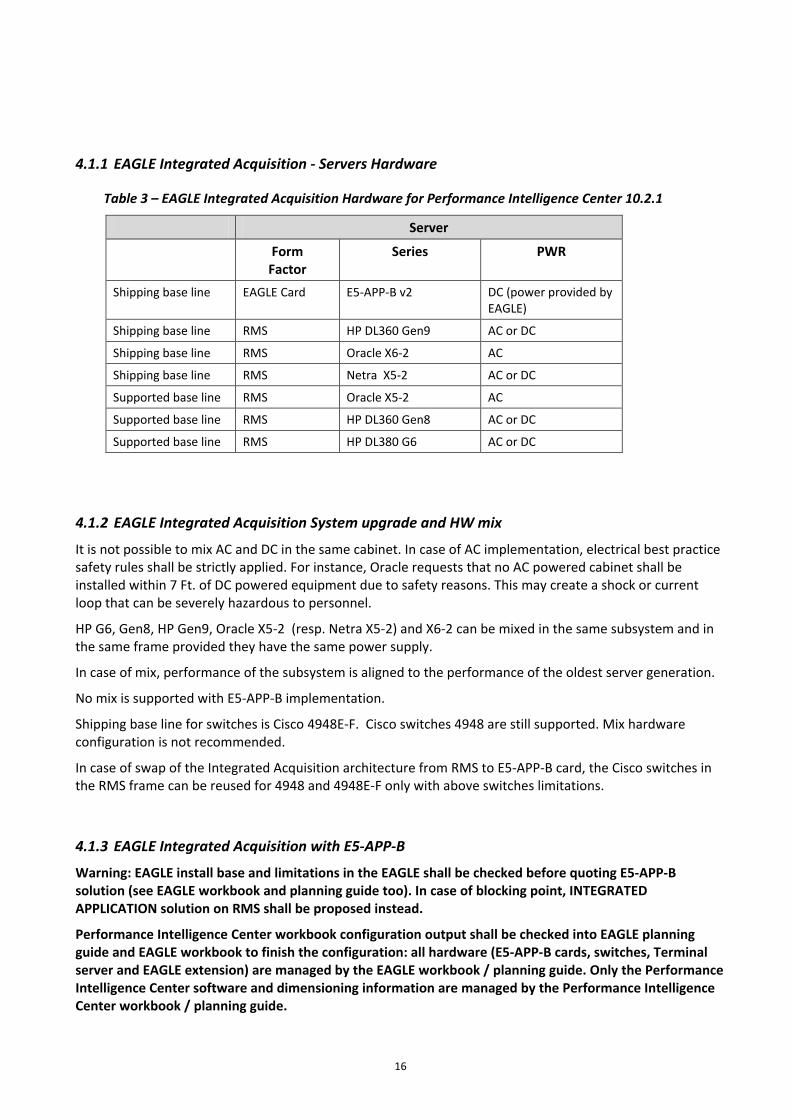
4.1.1 EAGLE Integrated Acquisition - Servers Hardware
Table 3 – EAGLE Integrated Acquisition Hardware for Performance Intelligence Center 10.2.1
Server
Form Factor
Series PWR
Shipping base line EAGLE Card E5-APP-B v2 DC (power provided by EAGLE)
Shipping base line RMS HP DL360 Gen9 AC or DC
Shipping base line RMS Oracle X6-2 AC
Shipping base line RMS Netra X5-2 AC or DC
Supported base line RMS Oracle X5-2 AC
Supported base line RMS HP DL360 Gen8 AC or DC
Supported base line RMS HP DL380 G6 AC or DC
4.1.2 EAGLE Integrated Acquisition System upgrade and HW mix
It is not possible to mix AC and DC in the same cabinet. In case of AC implementation, electrical best practice safety rules shall be strictly applied. For instance, Oracle requests that no AC powered cabinet shall be installed within 7 Ft. of DC powered equipment due to safety reasons. This may create a shock or current loop that can be severely hazardous to personnel.
HP G6, Gen8, HP Gen9, Oracle X5-2 (resp. Netra X5-2) and X6-2 can be mixed in the same subsystem and in the same frame provided they have the same power supply.
In case of mix, performance of the subsystem is aligned to the performance of the oldest server generation.
No mix is supported with E5-APP-B implementation.
Shipping base line for switches is Cisco 4948E-F. Cisco switches 4948 are still supported. Mix hardware configuration is not recommended.
In case of swap of the Integrated Acquisition architecture from RMS to E5-APP-B card, the Cisco switches in the RMS frame can be reused for 4948 and 4948E-F only with above switches limitations.
4.1.3 EAGLE Integrated Acquisition with E5-APP-B
Warning: EAGLE install base and limitations in the EAGLE shall be checked before quoting E5-APP-B solution (see EAGLE workbook and planning guide too). In case of blocking point, INTEGRATED APPLICATION solution on RMS shall be proposed instead.
Performance Intelligence Center workbook configuration output shall be checked into EAGLE planning guide and EAGLE workbook to finish the configuration: all hardware (E5-APP-B cards, switches, Terminal server and EAGLE extension) are managed by the EAGLE workbook / planning guide. Only the Performance Intelligence Center software and dimensioning information are managed by the Performance Intelligence Center workbook / planning guide.
17
E5-APP-B cards are directly installed in the EAGLE frame. E5-APP-B cards can be installed exclusively in EAGLE heavy duty frame. The Free slots shall be available in the EAGLE to install the E5-APP-B cards. In addition to E5-APP-B cards, a terminal server and 1 or 2 Cisco switches shall be inside the EAGLE frame. Both shall be installed inside an available shelve.
Note that the terminal server is shared with other EAGLE application (like EPAP). If one is already installed for other EAGLE applications, it will be shared with Performance Intelligence Center.
Verification of the install base for free slot and potential future evolution shall be studied with the customer.
Maximum of 6 E5-APP-B cards are supported (or 4 if no switch redundancy). The number of cards depends on monitored traffic volume (see below).
1 to maximum of 2 switches are supported. The number of Cisco switches depends on the number of EAGLE cards (STC and IPGW or IPSG in Fast copy mode) and E5-APP-B cards to connect.
Shall be use in the computational of the number of EAGLE cards to connect, the sum of:
• The number of STC cards
• The number of all IPSG cards in the EAGLE if fast copy is activated on IPSG, or zero otherwise
• Number of all IPGW cards in the EAGLE if fast copy is activated on IPGW, or zero otherwise
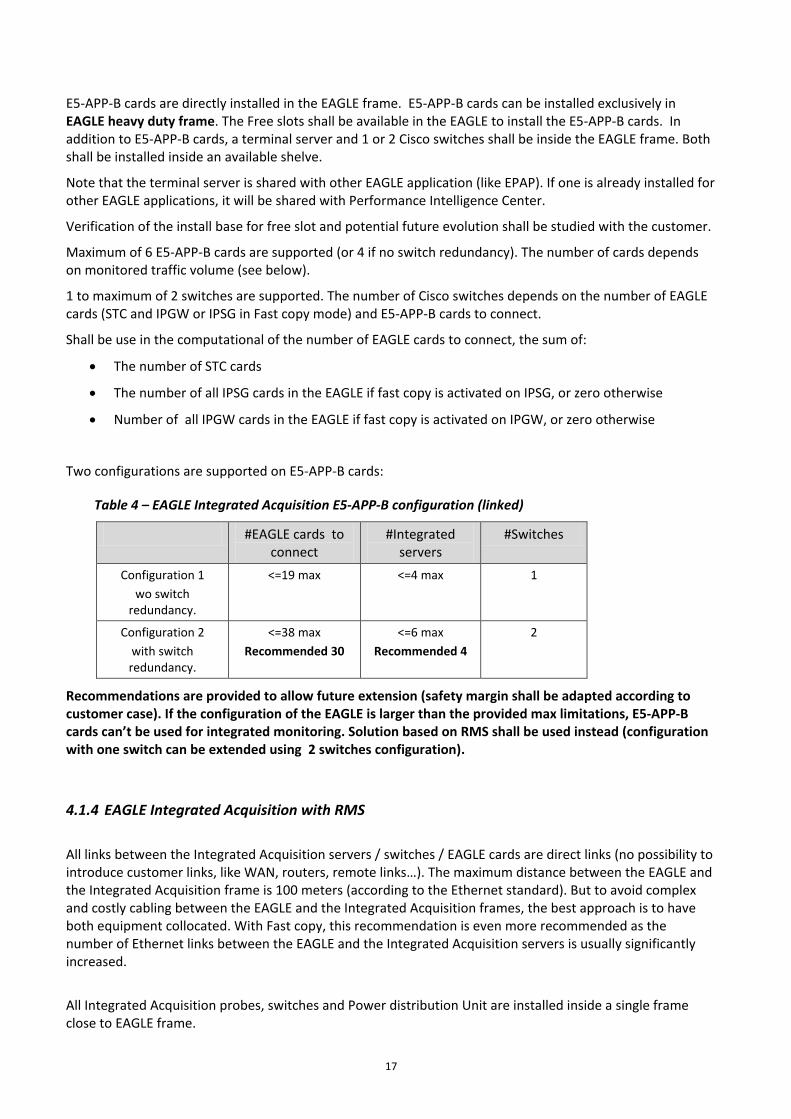
Two configurations are supported on E5-APP-B cards:
Table 4 – EAGLE Integrated Acquisition E5-APP-B configuration (linked)
#EAGLE cards to connect
#Integrated servers
#Switches
Configuration 1 wo switch
redundancy.
<=19 max <=4 max
1
Configuration 2 with switch redundancy.
<=38 max Recommended 30
<=6 max Recommended 4
2
Recommendations are provided to allow future extension (safety margin shall be adapted according to customer case). If the configuration of the EAGLE is larger than the provided max limitations, E5-APP-B cards can’t be used for integrated monitoring. Solution based on RMS shall be used instead (configuration with one switch can be extended using 2 switches configuration).
4.1.4 EAGLE Integrated Acquisition with RMS
All links between the Integrated Acquisition servers / switches / EAGLE cards are direct links (no possibility to introduce customer links, like WAN, routers, remote links…). The maximum distance between the EAGLE and the Integrated Acquisition frame is 100 meters (according to the Ethernet standard). But to avoid complex and costly cabling between the EAGLE and the Integrated Acquisition frames, the best approach is to have both equipment collocated. With Fast copy, this recommendation is even more recommended as the number of Ethernet links between the EAGLE and the Integrated Acquisition servers is usually significantly increased.
All Integrated Acquisition probes, switches and Power distribution Unit are installed inside a single frame close to EAGLE frame.
18
Maximum of 12 servers (HP G6, Gen8, HP Gen 9, Oracle X5-2, X6-2, Netra X5-2, or mixed HP G6/HP Gen8/HP Gen9/Oracle X5-2/Netra X5-2/X6-2) and 8 Cisco switches are supported in the frame.
The number of servers depends on monitored traffic (see below).
The number of Cisco switches depends on the number of EAGLE cards (STC and IPGW or IPSG in Fast copy mode) and Integrated Acquisition servers to connect.
Shall be use in the computational of the number of EAGLE cards to connect, the sum of :
• The number of STC cards
• The number of all IPSG cards on the EAGLE if fast copy is activated on IPSG, or zero otherwise
• Number of all IPGW cards on the EAGLE if fast copy is activated on IPGW, or zero otherwise
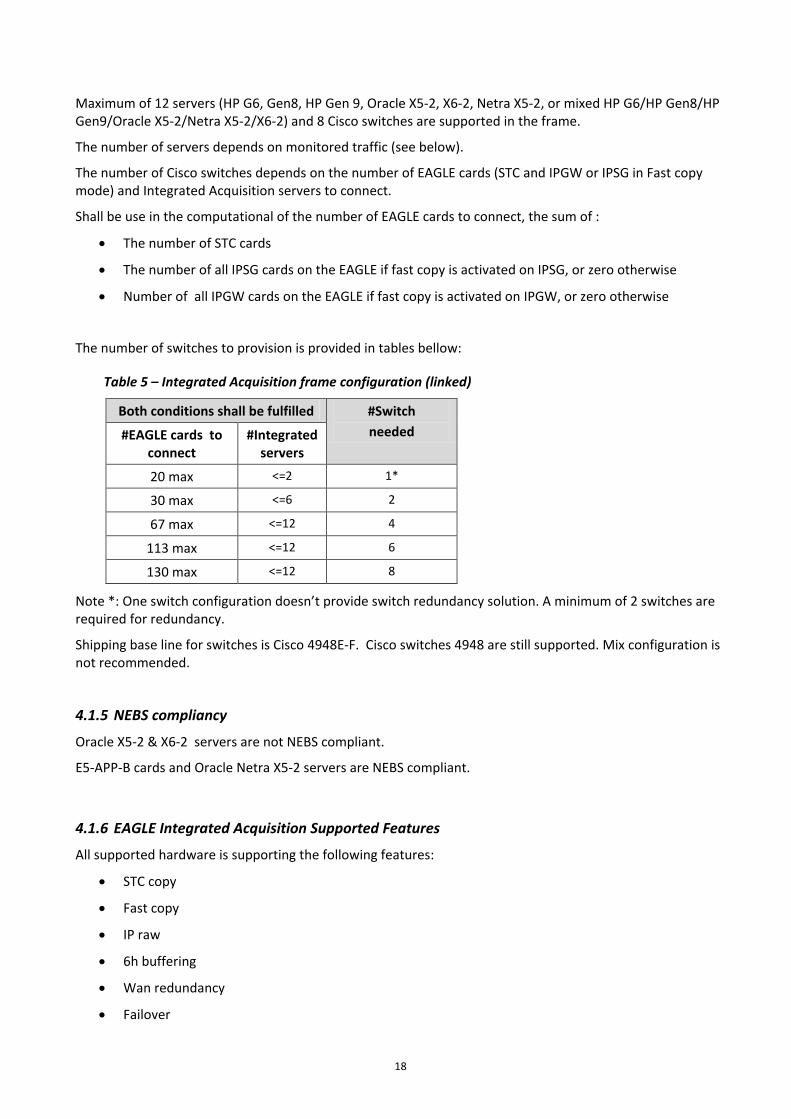
The number of switches to provision is provided in tables bellow:
Table 5 – Integrated Acquisition frame configuration (linked)
Both conditions shall be fulfilled #Switch needed #EAGLE cards to
connect #Integrated
servers
20 max <=2 1*
30 max <=6 2
67 max <=12 4
113 max <=12 6
130 max <=12 8
Note *: One switch configuration doesn’t provide switch redundancy solution. A minimum of 2 switches are required for redundancy.
Shipping base line for switches is Cisco 4948E-F. Cisco switches 4948 are still supported. Mix configuration is not recommended.
4.1.5 NEBS compliancy
Oracle X5-2 & X6-2 servers are not NEBS compliant.
E5-APP-B cards and Oracle Netra X5-2 servers are NEBS compliant.
4.1.6 EAGLE Integrated Acquisition Supported Features
All supported hardware is supporting the following features:
• STC copy
• Fast copy
• IP raw
• 6h buffering
• Wan redundancy
• Failover
19
• Traffic filtering and load balancing:
Monitoring is performed per linkset. Inside a linkset, filters are available on:
o SSN
o Global Title
o Point Code
o Combination between filters is possible
4.1.7 EAGLE Integrated Acquisition performance dimensioning
Integrated Acquisition dimensioning shall respect simultaneously 2 rules:
• Input bandwidth rule for the traffic entering in each Integrated Acquisition server
AND
• the number of entries rule
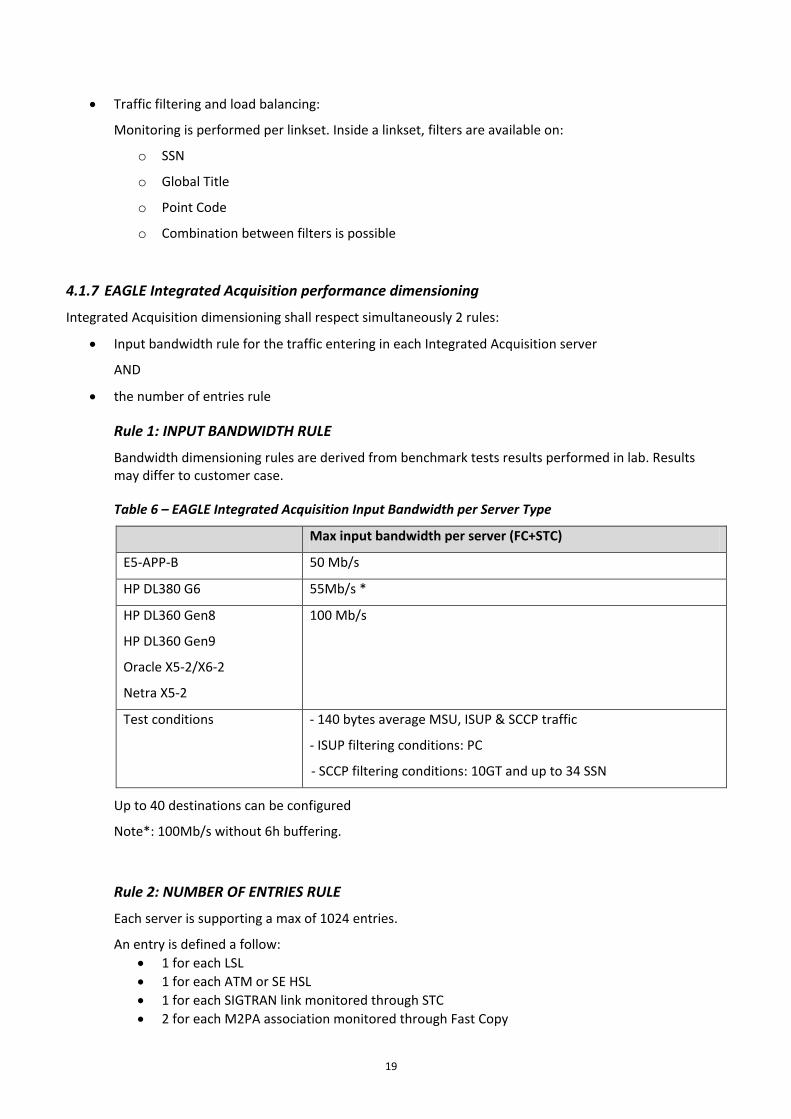
Rule 1: INPUT BANDWIDTH RULE
Bandwidth dimensioning rules are derived from benchmark tests results performed in lab. Results may differ to customer case.
Table 6 – EAGLE Integrated Acquisition Input Bandwidth per Server Type
Max input bandwidth per server (FC+STC)
E5-APP-B 50 Mb/s
HP DL380 G6 55Mb/s *
HP DL360 Gen8
HP DL360 Gen9
Oracle X5-2/X6-2
Netra X5-2
100 Mb/s
Test conditions - 140 bytes average MSU, ISUP & SCCP traffic
- ISUP filtering conditions: PC
- SCCP filtering conditions: 10GT and up to 34 SSN
Up to 40 destinations can be configured
Note*: 100Mb/s without 6h buffering.
Rule 2: NUMBER OF ENTRIES RULE
Each server is supporting a max of 1024 entries.
An entry is defined a follow: • 1 for each LSL • 1 for each ATM or SE HSL • 1 for each SIGTRAN link monitored through STC • 2 for each M2PA association monitored through Fast Copy
20
• 1 for each M3UA association monitored through Fast Copy • 1 for each M3UA link (inside the M3UA association) monitored through Fast Copy
Performance Intelligence Center probed acquisition
4.2 PERFORMANCE INTELLIGENCE CENTER PROBED ACQUISITION
Probed Acquisition server is available in standalone mode only. Each Probed Acquisition server is independent from the others. They shall not be configured in subsystem mode even if they are on the same physical site.
Probes Acquisition is used for capturing network traffic from TAP or port mirroring.
It is also used by the OCSDR Integrated Acquisition. Only differences are it communicates with Diameter Signaling Router for retrieving Diameter Signaling Router configuration and it captures Diameter traffic only.
Servers are provided in rack mount form. They can be installed in any cabinet with following limitation: Oracle does not recommend to mix AC and DC equipment in the same cabinet (specifically, AC and DC equipment shall not use a common ground and AC equipment shall not be closer than 7 feets to any DC equipment for safety reason).
If required, Probed Acquisition DC on HP or Oracle Netra X5-2 can be installed into an Integrated Acquisition DC frame (G6, Gen8, Gen9 or Netra X5-2). Total Server number (Integrated and Probed Acquisition) can’t exceed max number of EAGLE Integrated Acquisition servers for the frame (see EAGLE Integrated Acquisition section).
The Probed Acquisition server is IP Ethernet only as shipping baseline.
Previous Probed Acquisition SS7 and Probed Acquisition Gb versions are no more shipping baseline since Performance Intelligence Center 10.2. They are replaced by an IP Probed Acquisition + a converter (see converter section below) .
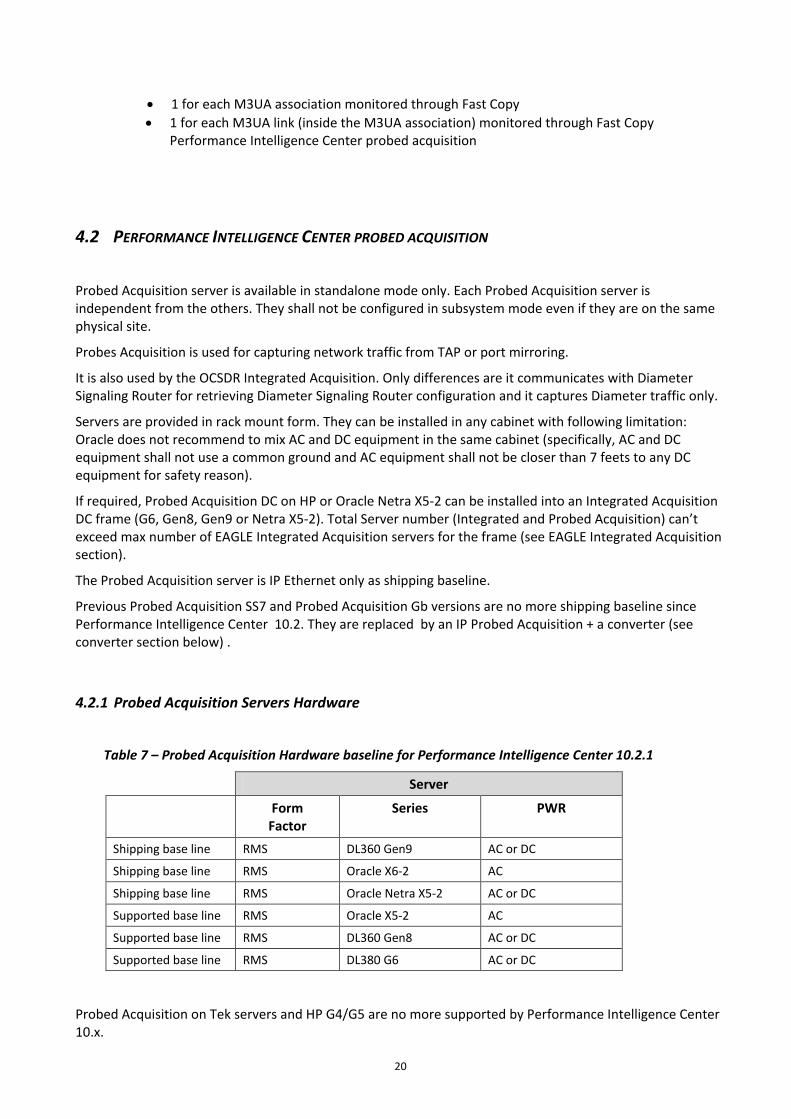
4.2.1 Probed Acquisition Servers Hardware
Table 7 – Probed Acquisition Hardware baseline for Performance Intelligence Center 10.2.1
Server
Form Factor
Series PWR
Shipping base line RMS DL360 Gen9 AC or DC
Shipping base line RMS Oracle X6-2 AC
Shipping base line RMS Oracle Netra X5-2 AC or DC
Supported base line RMS Oracle X5-2 AC
Supported base line RMS DL360 Gen8 AC or DC
Supported base line RMS DL380 G6 AC or DC
Probed Acquisition on Tek servers and HP G4/G5 are no more supported by Performance Intelligence Center 10.x.
21
4.2.2 IP Probed Acquisition supported interfaces
Probed Acquisition server interfaces are divided in 3 categories:
• Acquisition interfaces
• Northbound interfaces to customer management network (for management and traffic upload to the mediation)
• Optional northbound interfaces for production (PDU traffic flows)
Acquisition interfaces:
X6-2, Netra X5-2:
• 1G/10G copper: 4 port 10G Base T compatible 1G 1000 Base T RJ45
• 1G/10G optical: 4 port SFP+ (SFP+ modules shall be ordered in addition to the server):
- 1G/10G optical: Dual 1000BASE-SX/10G base SR (MM Fibers)
- 1G/10G optical: Dual 1000BASE-LX/10G base LR (SM Fibers)
HP Gen9:
• 1G/10G copper/optical: 4 port SFP+ (SFP+ module shall be ordered in addition to the server):
- 1G/10G Electrical: 1G 1000 Base T
- 1G/10G optical: Dual 1000BASE-SX/10G base SR (MM Fibers)
- 1G/10G optical: Dual 1000BASE-LX/10G base LR (SM Fibers)
Northbound interfaces to customer management network:
For northbound interfaces to customer management network, the IP Probed Acquisition requires
• one 1G Ethernet port and IP address to the customer monitoring network
• one 1G Ethernet port and IP address to the management network (ILO port)
Only native mode is supported for northbound interfaces (no VLAN tagging).
4.2.3 Probed Acquisition Supported Features
All supported Probed Acquisition hardware is supporting the following features:
• Packet truncation dataflow (each dataflow can be configured with a different value).
• 6h buffering:
For performance reason, buffering is by default deactivated for IP Probed Acquisition. It is not recommended to activate 6h buffering on Probed Acquisition to avoid severe performance degradation. In case of communication loss with the Mediation (for duration longer than few seconds), there may be traffic loss.
• Traffic filtering and load balancing:
22
Probed Acquisition IP supports filtering function on IPv4 packet on the following fields:
o IP source/destination host address or subnet
o IP TCP or UDP destination port
o IP TCP or UDP source port
o IP TCP or UDP port ranges with odd/even option
o IP protocol number for SCTP, TCP, ICMP, UDP or all IP.
o VLAN number or multiple numbers
o Probe physical interface
For GPRS, filters are available for encapsulation and encapsulated packets inside GTP tunnels
For SIGTRAN traffic, extended filters are available for:
o Point Code filtering (including OPC/DPC)
o SSN
o SIO
o Global Title
For IPv6, filters on IPv6 addresses, protocol, ports… are not applicable. All IPv6 packets are identified by a unique filter: IP v6 traffic type. It means that all IPv6 traffic can be sent to a unique destination.
Filters may be combined using parenthesized group of filters and operators.
Negation (Not), Concatenation (and), and Alternation (or) are also supported.
4.2.4 IP Probed Acquisition - 1G/10G performance dimensioning rules
IP Probed Acquisition server performances are variable according to filtered protocol and hardware type.
Benchmark results are applicable for Probed Acquisition 1G and 10G.
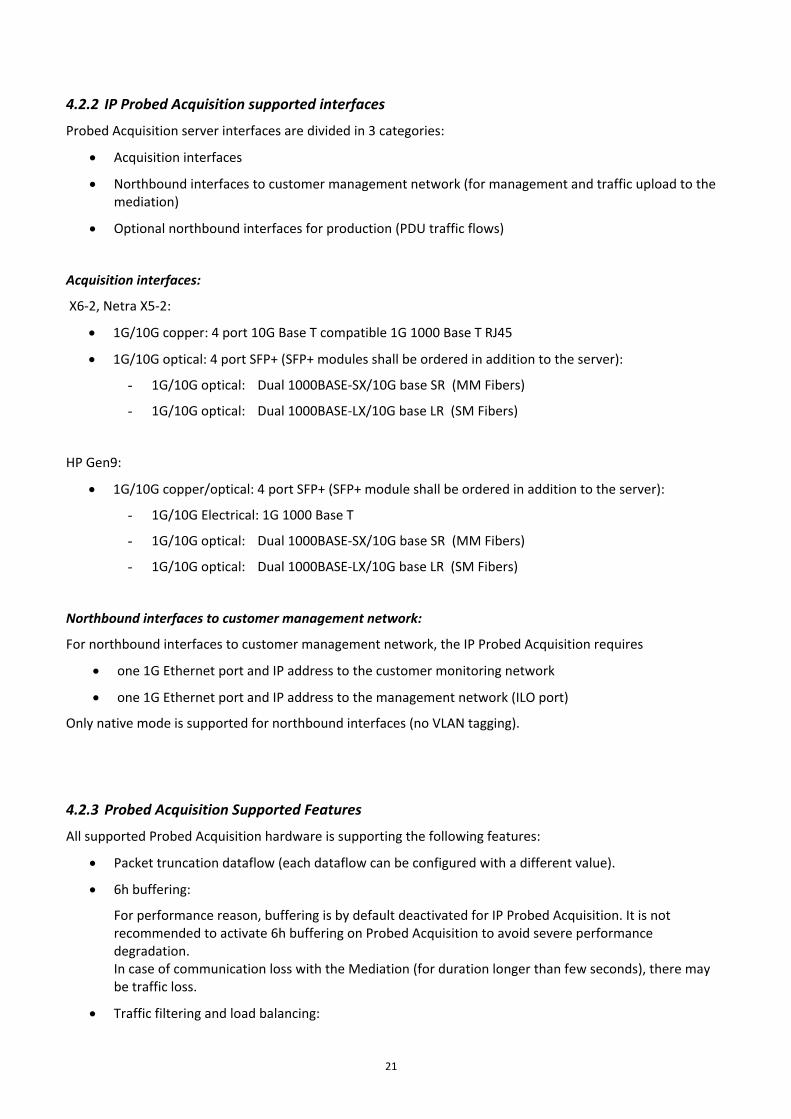
Table 8 – IP Probed Acquisition benchmark results for VoIP traffic (including the RTP voice bearer)
VoIP
Max input bandwidth per port (8 ports) 170 Mb/s
Max input bandwidth per port (4 ports) 250 Mb/s
Max bandwidth per server 900 Mb/s
Max output bandwidth per server 300 Mb/s
Max destinations for this output 40 dest.
Assumptions - buffering function deactivated, - 80 Byte PDU (average) - no IP fragmentation - up to 20 matching filter patterns per PDU in average
Note: If RTP bearer is not present on the monitored links, Probed Acquisition performances shall be used according to monitored traffic.
23
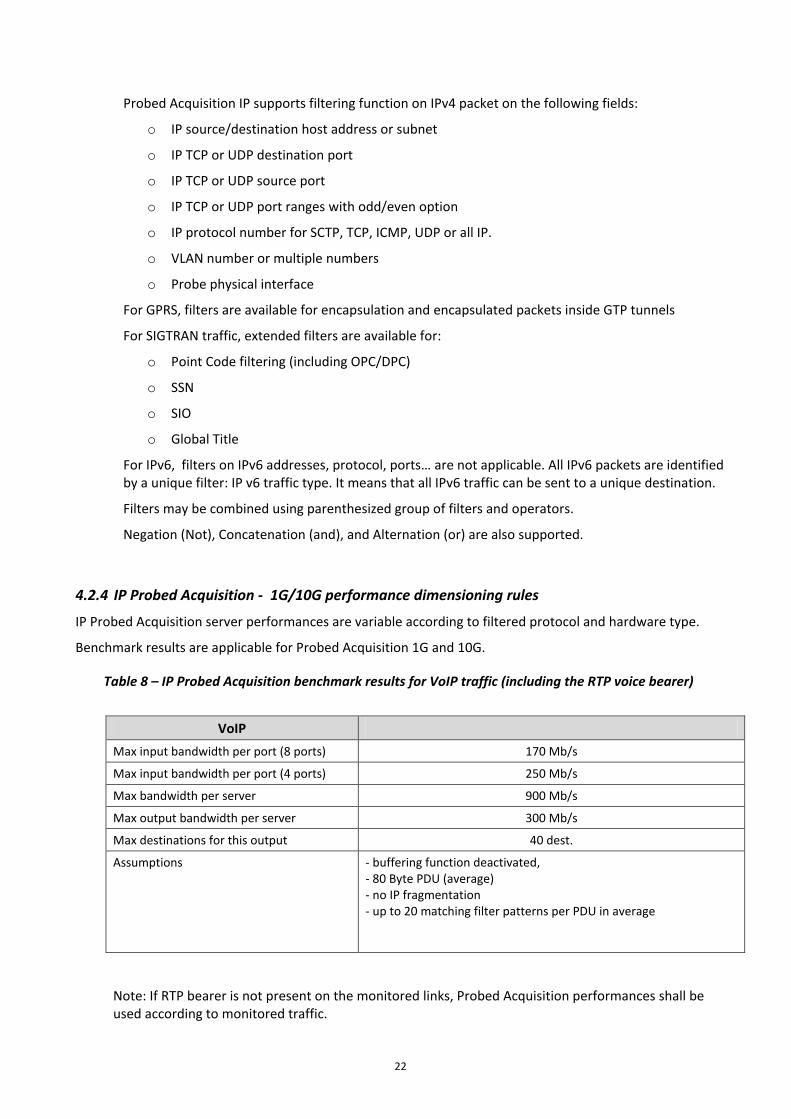
Note: if 6h buffering function activated, decrease output performance to 100Mb/s
Table 9 – IP Probed Acquisition benchmark results for SIGTRAN traffic with content filtering
SIGTRAN Max input bandwidth per server 300 Mb/s
Max output bandwidth per server 300 Mb/s
Maximum destinations 40 dest.
Assumptions - buffering function deactivated - PDU average size has minimal impact because filtering applies on chunks - no IP fragmentation - up to 100 matching filter patterns per PDU in average
Note: Complex TC filtering lines along with many destinations will impact overall performance
Note: if 6h buffering function activated, decrease output performance to 100Mb/s
Table 10 – IP Probed Acquisition benchmark results for other IP traffic: GPRS,VoIP signaling traffic (no RTP), SIGTRAN without content filtering
IP & GPRS Max input bandwidth per server IP filtering 4000 Mb/s
Max output bandwidth per server 1500 Mb/s
Maximum destinations 40 dest.
Control Plane output / total input ratio 0,5%
Assumptions - buffering function deactivated, - up to 40 matching filter patterns per PDU in average
Note: if 6h buffering function activated, decrease output performance to 100Mb/s
24
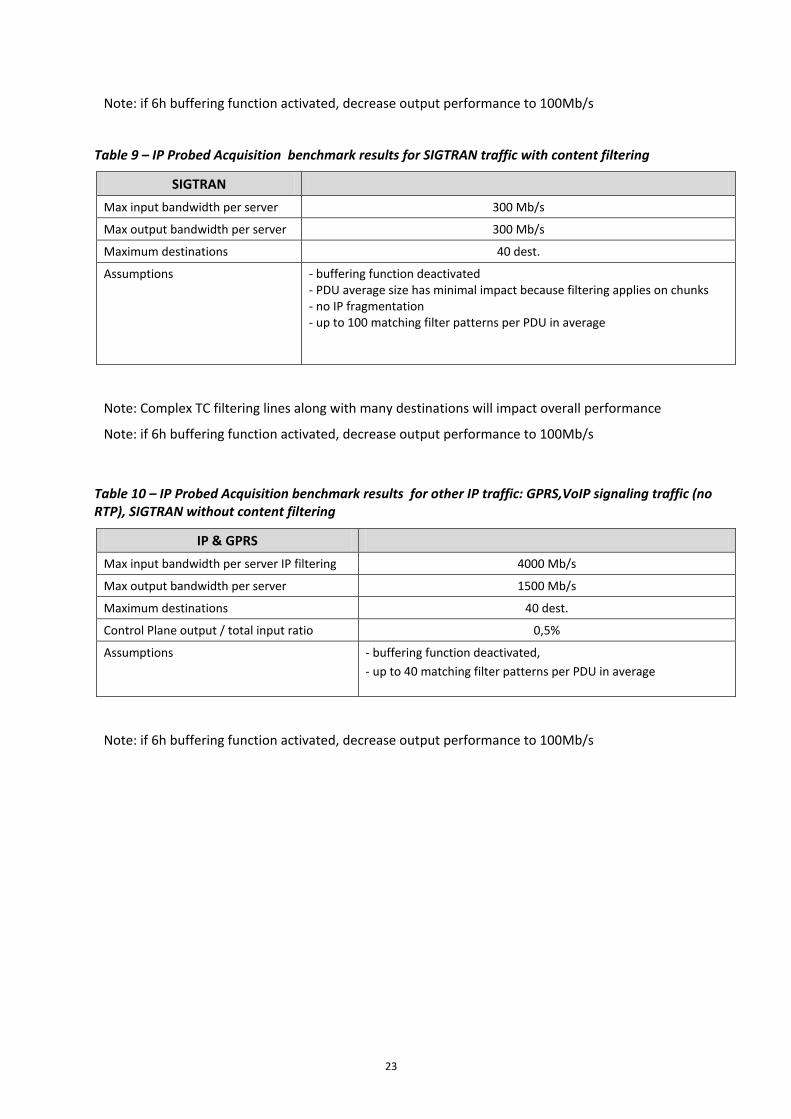
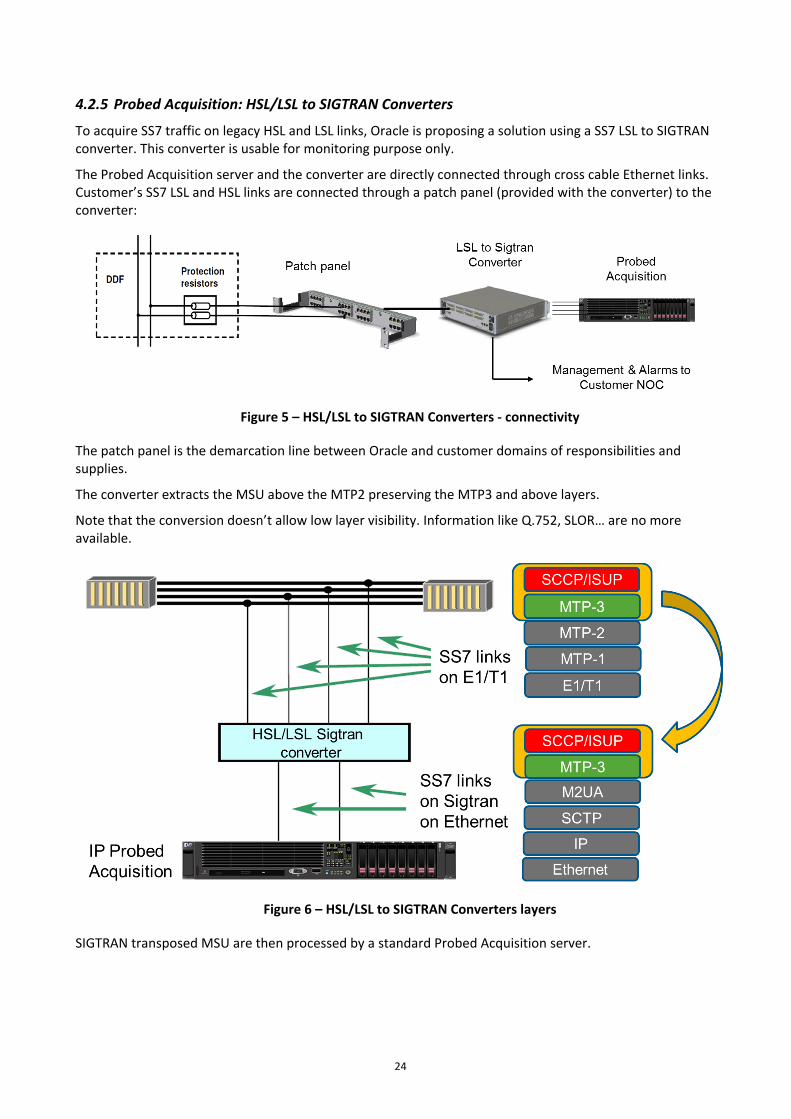
4.2.5 Probed Acquisition: HSL/LSL to SIGTRAN Converters
To acquire SS7 traffic on legacy HSL and LSL links, Oracle is proposing a solution using a SS7 LSL to SIGTRAN converter. This converter is usable for monitoring purpose only.
The Probed Acquisition server and the converter are directly connected through cross cable Ethernet links. Customer’s SS7 LSL and HSL links are connected through a patch panel (provided with the converter) to the converter:
Figure 5 – HSL/LSL to SIGTRAN Converters - connectivity
The patch panel is the demarcation line between Oracle and customer domains of responsibilities and supplies.
The converter extracts the MSU above the MTP2 preserving the MTP3 and above layers.
Note that the conversion doesn’t allow low layer visibility. Information like Q.752, SLOR… are no more available.
Figure 6 – HSL/LSL to SIGTRAN Converters layers
SIGTRAN transposed MSU are then processed by a standard Probed Acquisition server.
25
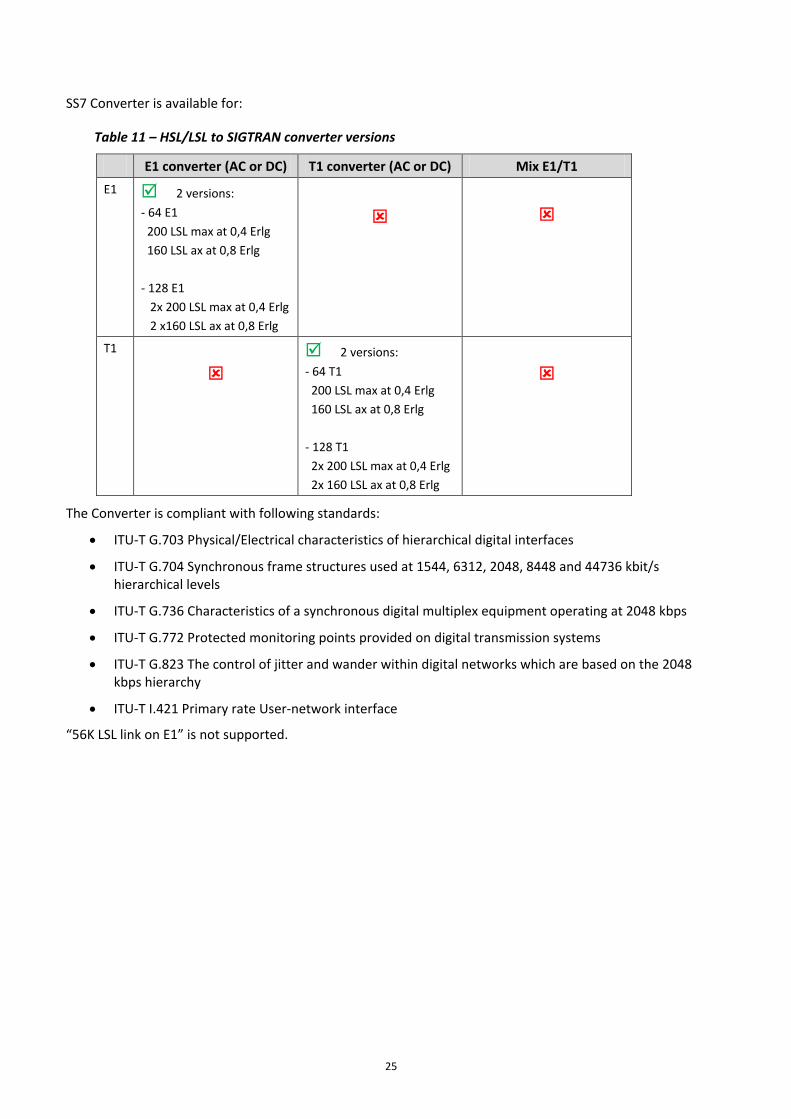
SS7 Converter is available for:
Table 11 – HSL/LSL to SIGTRAN converter versions
E1 converter (AC or DC) T1 converter (AC or DC) Mix E1/T1 E1 2 versions:
- 64 E1 200 LSL max at 0,4 Erlg 160 LSL ax at 0,8 Erlg - 128 E1 2x 200 LSL max at 0,4 Erlg 2 x160 LSL ax at 0,8 Erlg
T1
2 versions: - 64 T1 200 LSL max at 0,4 Erlg 160 LSL ax at 0,8 Erlg - 128 T1 2x 200 LSL max at 0,4 Erlg 2x 160 LSL ax at 0,8 Erlg
The Converter is compliant with following standards:
• ITU-T G.703 Physical/Electrical characteristics of hierarchical digital interfaces
• ITU-T G.704 Synchronous frame structures used at 1544, 6312, 2048, 8448 and 44736 kbit/s hierarchical levels
• ITU-T G.736 Characteristics of a synchronous digital multiplex equipment operating at 2048 kbps
• ITU-T G.772 Protected monitoring points provided on digital transmission systems
• ITU-T G.823 The control of jitter and wander within digital networks which are based on the 2048 kbps hierarchy
• ITU-T I.421 Primary rate User-network interface
“56K LSL link on E1” is not supported.
26
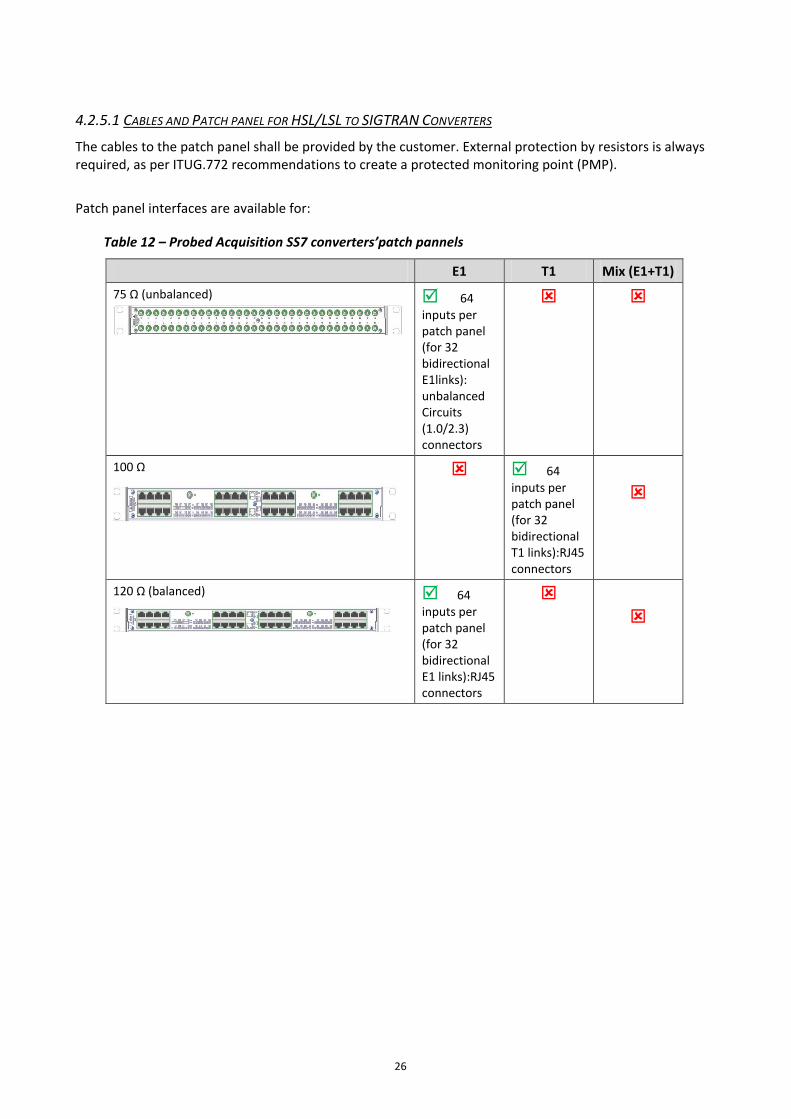
4.2.5.1 CABLES AND PATCH PANEL FOR HSL/LSL TO SIGTRAN CONVERTERS
The cables to the patch panel shall be provided by the customer. External protection by resistors is always required, as per ITUG.772 recommendations to create a protected monitoring point (PMP).
Patch panel interfaces are available for:
Table 12 – Probed Acquisition SS7 converters’patch pannels
E1 T1 Mix (E1+T1) 75 Ω (unbalanced)
64 inputs per patch panel (for 32 bidirectional E1links): unbalanced Circuits (1.0/2.3) connectors
100 Ω
64 inputs per patch panel (for 32 bidirectional T1 links):RJ45 connectors
120 Ω (balanced)
64 inputs per patch panel (for 32 bidirectional E1 links):RJ45 connectors
27
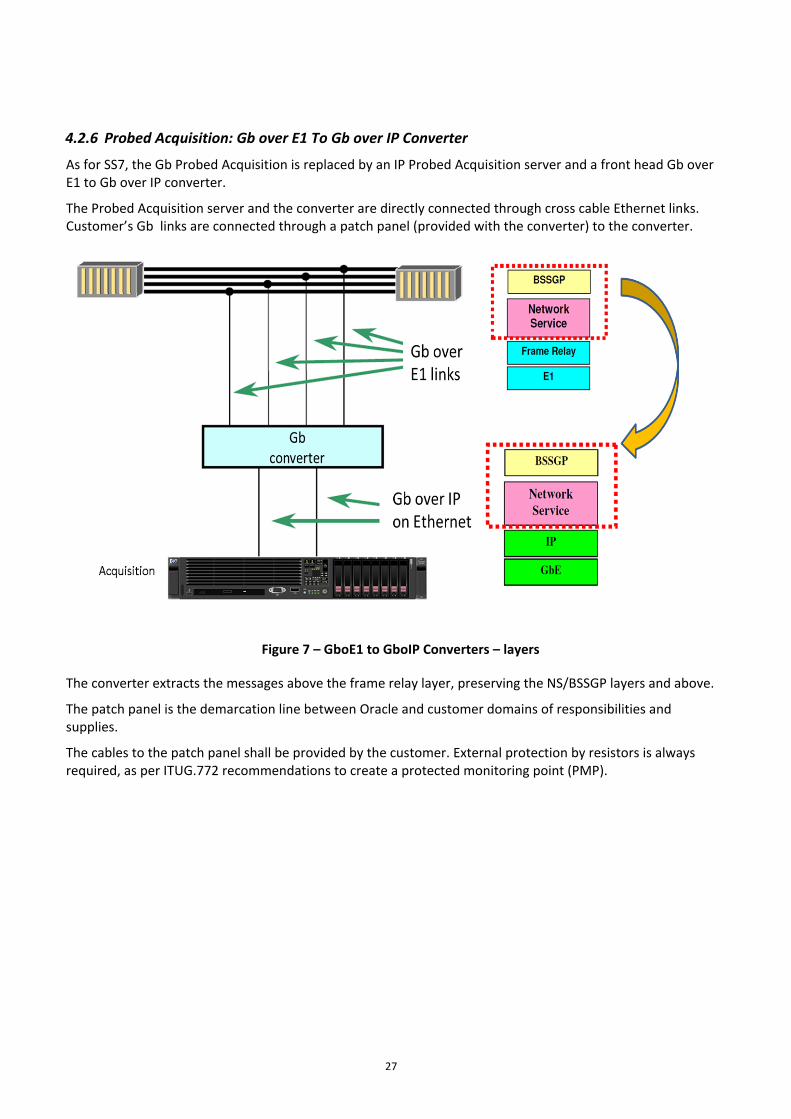
4.2.6 Probed Acquisition: Gb over E1 To Gb over IP Converter
As for SS7, the Gb Probed Acquisition is replaced by an IP Probed Acquisition server and a front head Gb over E1 to Gb over IP converter.
The Probed Acquisition server and the converter are directly connected through cross cable Ethernet links. Customer’s Gb links are connected through a patch panel (provided with the converter) to the converter.
Figure 7 – GboE1 to GboIP Converters – layers
The converter extracts the messages above the frame relay layer, preserving the NS/BSSGP layers and above.
The patch panel is the demarcation line between Oracle and customer domains of responsibilities and supplies.
The cables to the patch panel shall be provided by the customer. External protection by resistors is always required, as per ITUG.772 recommendations to create a protected monitoring point (PMP).
28
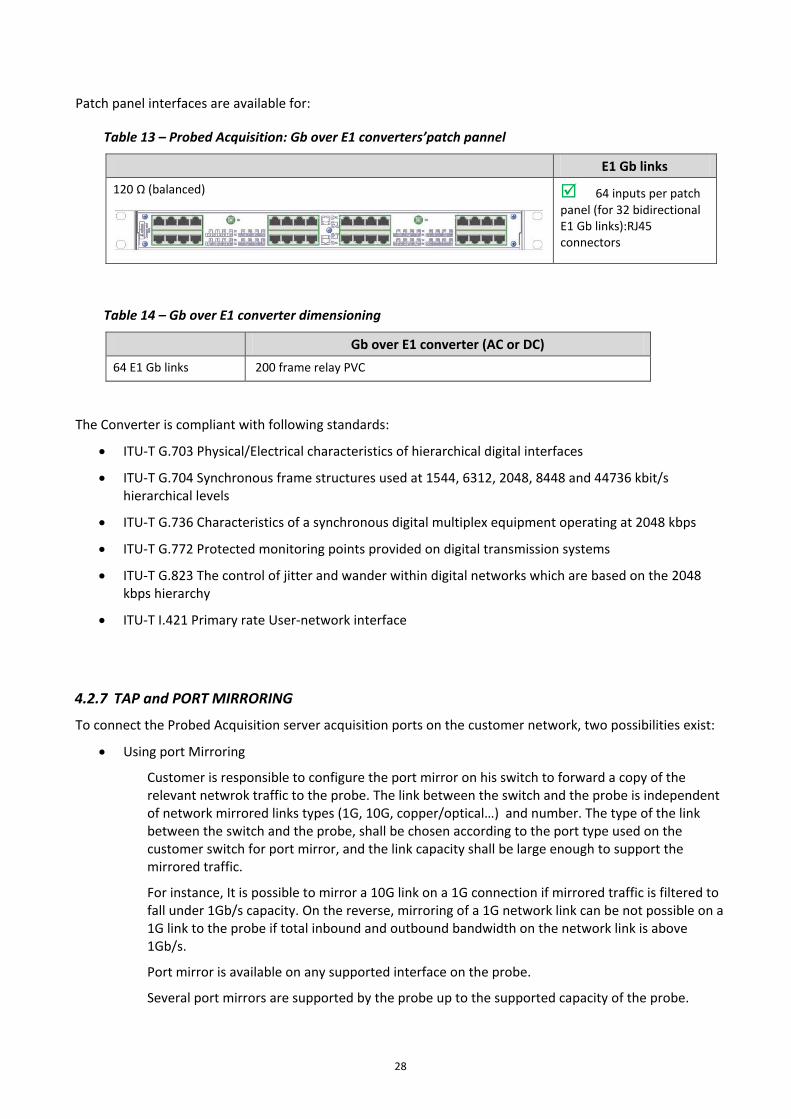
Patch panel interfaces are available for:
Table 13 – Probed Acquisition: Gb over E1 converters’patch pannel
E1 Gb links 120 Ω (balanced)
64 inputs per patch panel (for 32 bidirectional E1 Gb links):RJ45 connectors
Table 14 – Gb over E1 converter dimensioning
Gb over E1 converter (AC or DC) 64 E1 Gb links 200 frame relay PVC
The Converter is compliant with following standards:
• ITU-T G.703 Physical/Electrical characteristics of hierarchical digital interfaces
• ITU-T G.704 Synchronous frame structures used at 1544, 6312, 2048, 8448 and 44736 kbit/s hierarchical levels
• ITU-T G.736 Characteristics of a synchronous digital multiplex equipment operating at 2048 kbps
• ITU-T G.772 Protected monitoring points provided on digital transmission systems
• ITU-T G.823 The control of jitter and wander within digital networks which are based on the 2048 kbps hierarchy
• ITU-T I.421 Primary rate User-network interface
4.2.7 TAP and PORT MIRRORING
To connect the Probed Acquisition server acquisition ports on the customer network, two possibilities exist:
• Using port Mirroring
Customer is responsible to configure the port mirror on his switch to forward a copy of the relevant netwrok traffic to the probe. The link between the switch and the probe is independent of network mirrored links types (1G, 10G, copper/optical…) and number. The type of the link between the switch and the probe, shall be chosen according to the port type used on the customer switch for port mirror, and the link capacity shall be large enough to support the mirrored traffic.
For instance, It is possible to mirror a 10G link on a 1G connection if mirrored traffic is filtered to fall under 1Gb/s capacity. On the reverse, mirroring of a 1G network link can be not possible on a 1G link to the probe if total inbound and outbound bandwidth on the network link is above 1Gb/s.
Port mirror is available on any supported interface on the probe.
Several port mirrors are supported by the probe up to the supported capacity of the probe.
29
• Using TAPs
Oracle’s TAP portfolio is composed of TAP for 1G and TAP for 10G links.
Taps are installed inserted on customer links. They are passive and provide network link protection in case of TAP failure.
4.2.7.1 ETHERNET 1G TAP
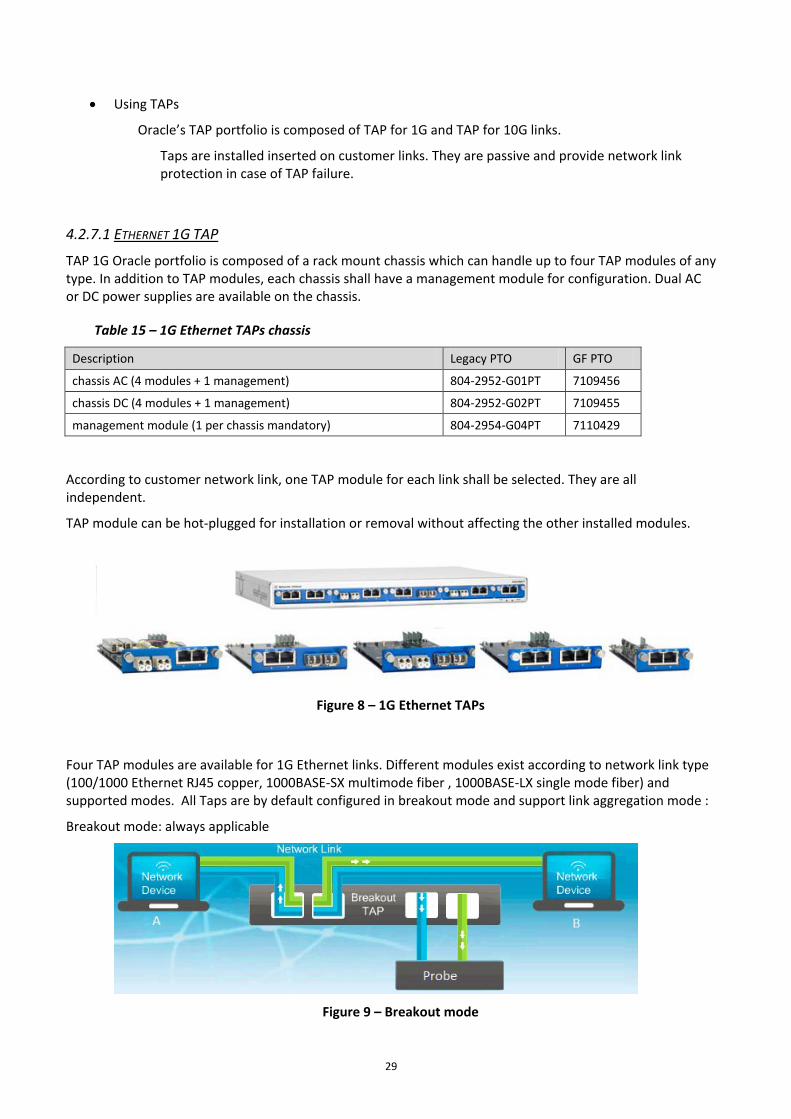
TAP 1G Oracle portfolio is composed of a rack mount chassis which can handle up to four TAP modules of any type. In addition to TAP modules, each chassis shall have a management module for configuration. Dual AC or DC power supplies are available on the chassis.
Table 15 – 1G Ethernet TAPs chassis
Description Legacy PTO GF PTO
chassis AC (4 modules + 1 management) 804-2952-G01PT 7109456
chassis DC (4 modules + 1 management) 804-2952-G02PT 7109455
management module (1 per chassis mandatory) 804-2954-G04PT 7110429
According to customer network link, one TAP module for each link shall be selected. They are all independent.
TAP module can be hot-plugged for installation or removal without affecting the other installed modules.
Figure 8 – 1G Ethernet TAPs
Four TAP modules are available for 1G Ethernet links. Different modules exist according to network link type (100/1000 Ethernet RJ45 copper, 1000BASE-SX multimode fiber , 1000BASE-LX single mode fiber) and supported modes. All Taps are by default configured in breakout mode and support link aggregation mode :
Breakout mode: always applicable
Figure 9 – Breakout mode
30
Traffic from A to B is sent on one output port.
Traffic from B to A is sent on another output port.
2 ports are needed on the probe for each tapped link
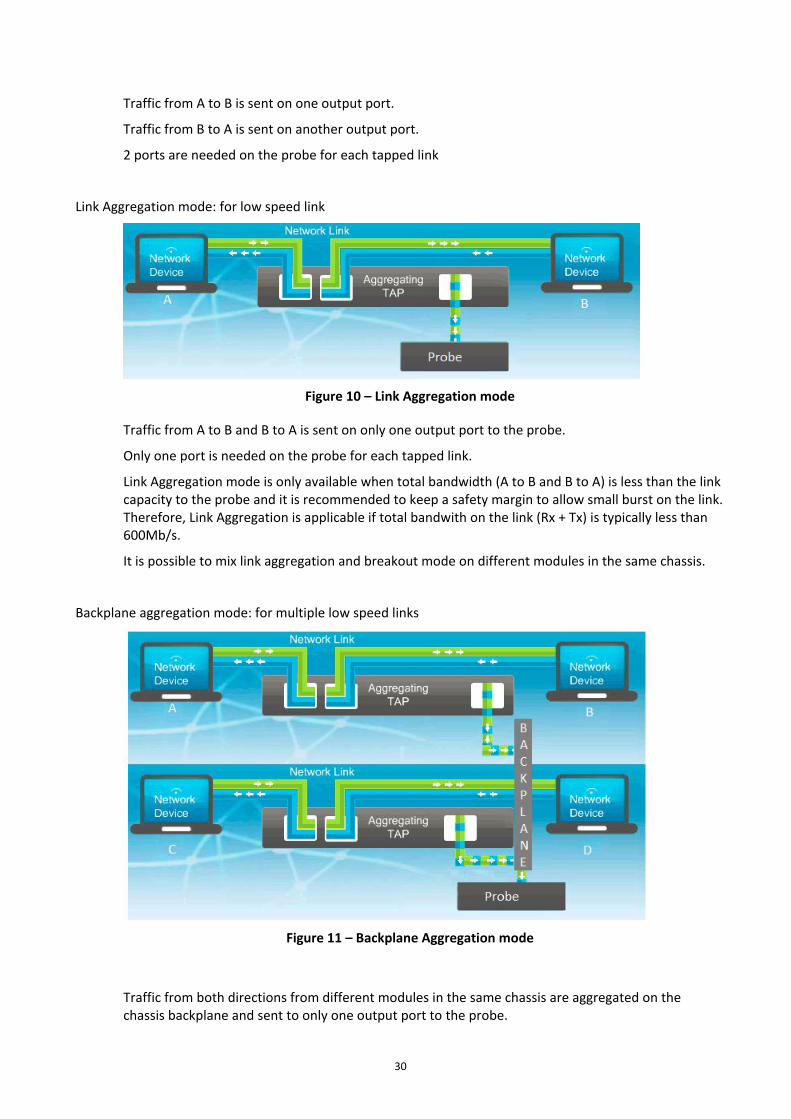
Link Aggregation mode: for low speed link
Figure 10 – Link Aggregation mode
Traffic from A to B and B to A is sent on only one output port to the probe.
Only one port is needed on the probe for each tapped link.
Link Aggregation mode is only available when total bandwidth (A to B and B to A) is less than the link capacity to the probe and it is recommended to keep a safety margin to allow small burst on the link. Therefore, Link Aggregation is applicable if total bandwith on the link (Rx + Tx) is typically less than 600Mb/s.
It is possible to mix link aggregation and breakout mode on different modules in the same chassis.
Backplane aggregation mode: for multiple low speed links
Figure 11 – Backplane Aggregation mode
Traffic from both directions from different modules in the same chassis are aggregated on the chassis backplane and sent to only one output port to the probe.
31
Only one port is needed on the probe for all backplane aggregated tapped links on the chassis.
Backplane aggregation mode is per chassis only.
It is possible to mix backplane aggregation and breakout or link aggregation mode in the same chassis.
Backplane Aggregation mode is only available for small banditdh links. The total bandwidth (Rx and Tx for all modules configured in Backplane Aggregation mode) shall be is less than 600Mb/s.
Note that all modules are connected to the probe through 1000BASE-T Gigabit Ethernet links.
Table 16 – 1G Ethernet TAPs modules
Description Legacy PTO GF PTO
Network link: fiber 1000BASE-SX Multimode fiber (1 link) ratio 50/50 Link to probe: 1000BASE-T RJ45 copper
804-2953-G01PT 7110447
Network link: 100Base-TX or 1000BASE-T RJ45 coppper (1 link) Link to probe: 1000BASE-T RJ45 copper
804-2953-G02PT 7110444
Network link: fiber 1000BASE-LX Single mode fiber (1 link) ratio 50/50 Link to probe: 1000BASE-T RJ45 copper Backplane aggregation option supported
804-2954-G02PT 7110446
Network link: 100Base-TX or 1000BASE-T RJ45 coppper (1 link) Link to probe: 1000BASE-T RJ45 copper Backplane aggregation option supported
804-2954-G03PT 7110443
4.2.7.2 OPTICAL PASSIVE TAP
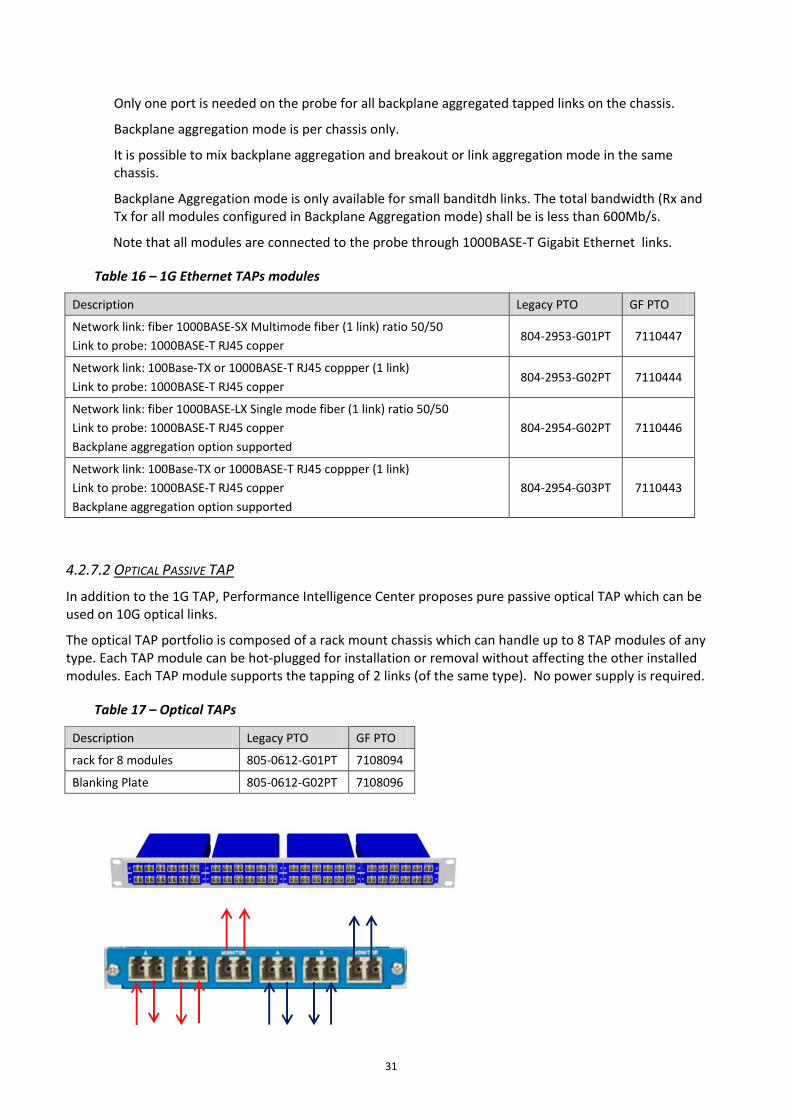
In addition to the 1G TAP, Performance Intelligence Center proposes pure passive optical TAP which can be used on 10G optical links.
The optical TAP portfolio is composed of a rack mount chassis which can handle up to 8 TAP modules of any type. Each TAP module can be hot-plugged for installation or removal without affecting the other installed modules. Each TAP module supports the tapping of 2 links (of the same type). No power supply is required.
Table 17 – Optical TAPs
Description Legacy PTO GF PTO
rack for 8 modules 805-0612-G01PT 7108094
Blanking Plate 805-0612-G02PT 7108096
32
Figure 12 – Passive optical TAP
Modules are available for:
• Multi-mode fiber, 850/1310 dual wavelengths, 50 micron OM3
• Multi-mode fiber, 850/1310 dual wavelengths, 62.5 micron
• Single mode fiber, 1310/1550 dual wavelengths, 9 micron
By default, the splitter ratio is set to 50/50.
Each module is dual: it allows connection of 2 links (4 fibers).
They are not configurable. Breakout is the only supported option.
Table 18 – Optical TAP modules
Short Description Legacy PTO GF PTO Network link: Multi-mode fiber, 850/1300 dual wavelengths, 62.5 micron (2 links) ratio 50/50 Link to TAP: same as Network link
805-0598-G03PT 7108050
Network link: Multi-mode fiber, 850/1300 dual wavelengths, 50 micron OM3(2 links) ratio 50/50 Link to TAP: same as Network link
805-0598-G01PT 7108048
Network link: 0:50 Single mode fiber, 1310/1550 dual wavelengths, 9 micron, ratio 50/50 Link to TAP: same as Network link
805-0598-G05PT 7108053
As a reminder, the correspondence table between fibers type and Ethernet standards is the following:
Table 19 – Standards and fibers types conversion table
1G 10G
Cable Type Copper Single-mode Multi-mode Single-mode Multi-mode Super Single-mode
TAP TYPE T LX SX LR SR ER
Laser N/A 1270–1355 nm 770-860 nm 1310nm 850nm 1550nm
CORE Ø N/A 9/125µm 50/125 µm 9/125µm 50/125 µm 9/125 µm
62.5/125 µm 62.5/125 µm
Passive optical TAP modules are not powered. It means there is no signal regeneration. Therefore, max distance between equipment shall be checked with the customer and power budget shall be verified for the different equipment connected on the passive optical TAP modules.
33
4.2.8 PCAP Capture on Probed Acquisition
The Probed Acquisition server allows Ethereal like capture and storing directly on the probe. Filters can be defined to extract only the relevant data for the capture.
Capture has been tested up to 250Mb/s of filtered traffic to store in the capture file.
Capture file is limited to 2GB (captured traffic overlapping in case of bigger capture size).
The monitoring, main objective of the probe, is protected against probe capture overloading. If captured traffic exceeds probe performance limits, capture may be incomplete. If this happens, a message is logged in the probe.
4.3 PERFORMANCE INTELLIGENCE CENTER DIAMETER SIGNALING ROUTER INTEGRATED PROBED ACQUISITION
In the Diameter Signaling Router monitoring case, Performance Intelligence Center can take benefit of a management link to Diameter Signaling Router enabling to acquire the configuration tables from Diameter Signaling Router. This allows Performance Intelligence Center LTE Diameter xDRs (generic) to be populated with the explicit names of the Diameter Signaling Router peers equipement which is very convenient for trace and troubleshooting.
This configuration is fully dedicated to Diameter Signaling Router monitoring and only Diameter Signaling Router Diameter traffic can be monitored here.
HW configuration is based on Probed Acquisition HW (see §4.2.1)
PCAP capture (§4.2.8) and Acquisition Data Feed (§4.4) functions are still valid for Diameter Signaling Router Integrated Acquisition (Diameter traffic).
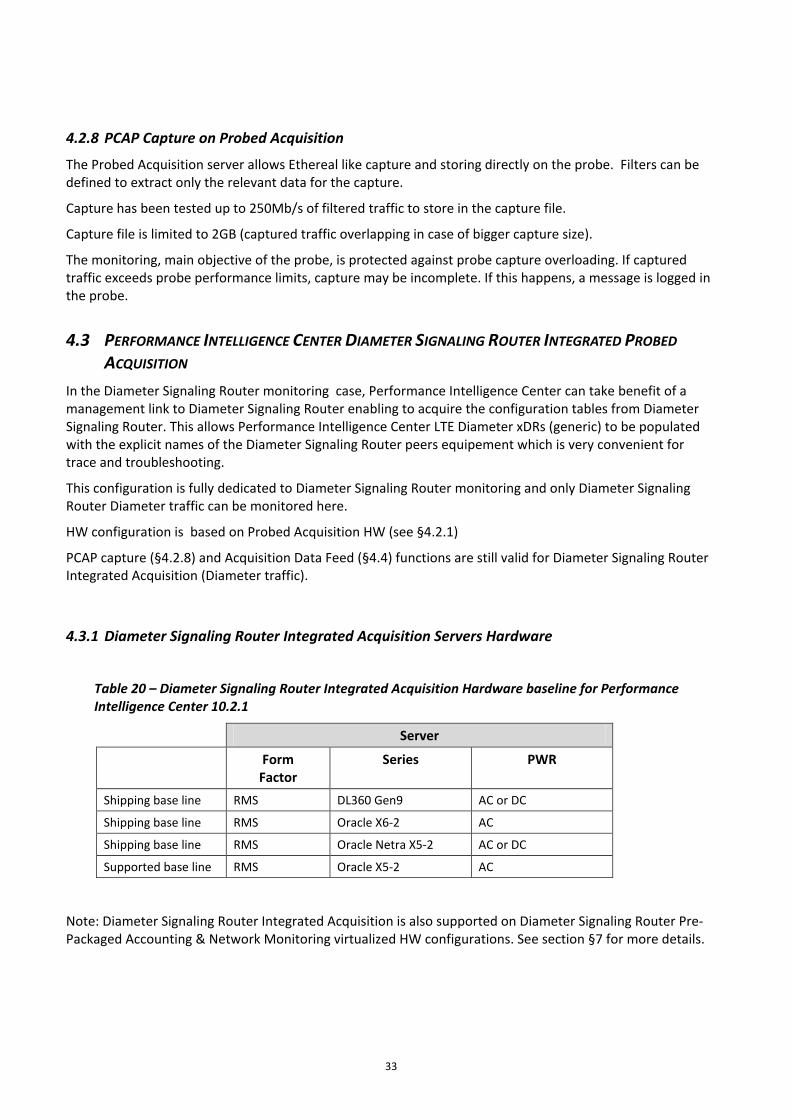
4.3.1 Diameter Signaling Router Integrated Acquisition Servers Hardware
Table 20 – Diameter Signaling Router Integrated Acquisition Hardware baseline for Performance Intelligence Center 10.2.1
Server
Form Factor
Series PWR
Shipping base line RMS DL360 Gen9 AC or DC
Shipping base line RMS Oracle X6-2 AC
Shipping base line RMS Oracle Netra X5-2 AC or DC
Supported base line RMS Oracle X5-2 AC
Note: Diameter Signaling Router Integrated Acquisition is also supported on Diameter Signaling Router Pre-Packaged Accounting & Network Monitoring virtualized HW configurations. See section §7 for more details.
34
4.3.2 Diameter Signaling Router Integrated Acquisition supported interfaces
Probed Acquisition server interfaces are divided in 3 categories:
• Acquisition interfaces
• Northbound interfaces to customer management network (for management and traffic upload to the mediation)
• Optional northbound interfaces specifically assigned to production (PDU traffic flows)
Acquisition interfaces:
X6-2, Netra X5-2:
• 1G/10G copper: 4 port 10G Base T compatible 1G 1000 Base T RJ45
• 1G/10G optical: 4 port SFP+ (SFP+ modules shall be ordered in addition to the server):
- 1G/10G optical: Dual 1000BASE-SX/10G base SR (MM Fibers)
- 1G/10G optical: Dual 1000BASE-LX/10G base LR (SM Fibers)
HP Gen9:
• 1G/10G copper/optical: 4 port SFP+ (SFP+ module shall be ordered in addition to the server):
- 1G/10G Electrical: 1000 Base T
- 1G/10G optical: Dual 1000BASE-SX/10G base SR (MM Fibers)
- 1G/10G optical: Dual 1000BASE-LX/10G base LR (SM Fibers)
Northbound interfaces to customer management network:
For northbound interfaces to customer management network, the IP Probed Acquisition requires
• one 1G Ethernet port and IP address to the customer monitoring network
• one 1G Ethernet port and IP address to the management network (ILO port)
Only native mode is supported for northbound interfaces (no VLAN tagging).
4.3.3 Diameter Signaling Router Integrated Acquisition Supported Features
All supported Probed Acquisition hardware is supporting the following features:
• Packet truncation dataflow (each dataflow can be configured with a different value).
• 6h buffering:
For performance reason, buffering is by default deactivated for Diameter Signaling Router Integrated Acquisition. It is not recommended to activate 6h buffering on Diameter Signaling Router Integrated Acquisition to avoid severe performance degradation. In case of communication loss with the Mediation (for duration longer than few seconds), there may be traffic loss.
• Traffic filtering and load balancing are automatic, there is no need of manual configuration (except Mediation destinations).
35
Diameter traffic loadsharing to Mediation servers/DFPs is based on automatic roundrobin rule on Session Id.
For IPv6, filters on IPv6 addresses, protocol, ports… are not applicable. All IPv6 packets are identified by a unique filter: IP v6 traffic type. It means that all IPv6 traffic can be sent to a unique destination.
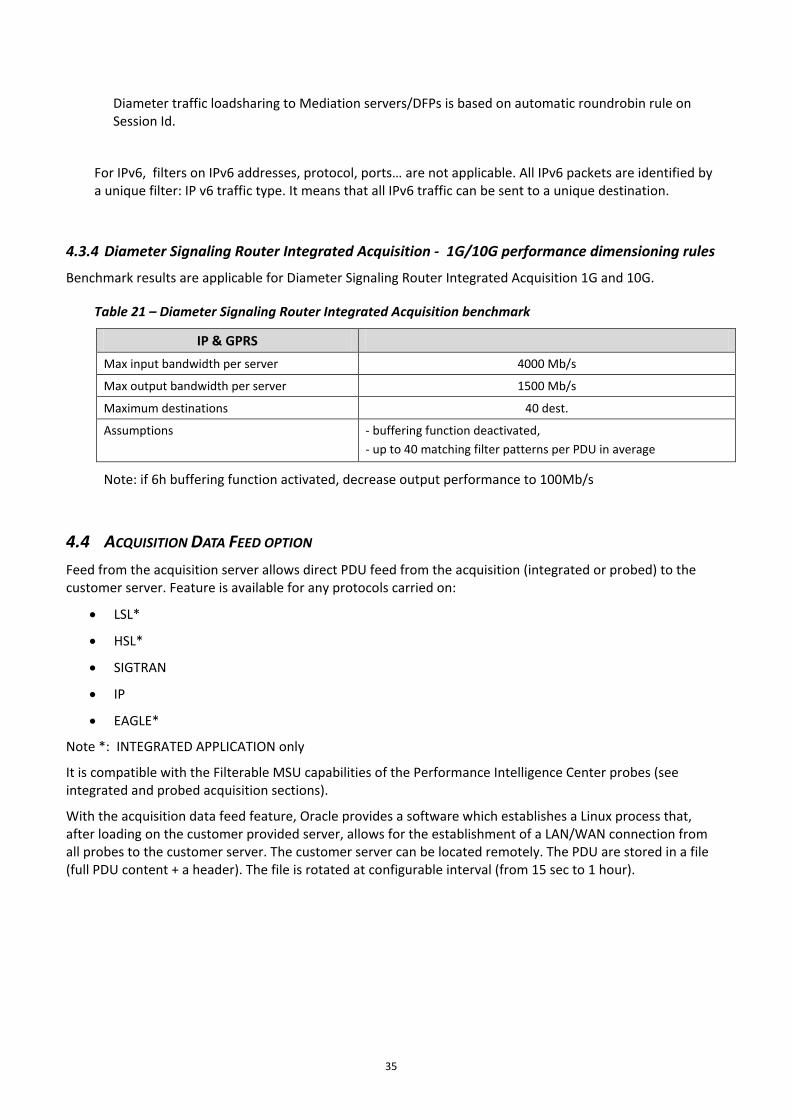
4.3.4 Diameter Signaling Router Integrated Acquisition - 1G/10G performance dimensioning rules
Benchmark results are applicable for Diameter Signaling Router Integrated Acquisition 1G and 10G.
Table 21 – Diameter Signaling Router Integrated Acquisition benchmark
IP & GPRS Max input bandwidth per server 4000 Mb/s
Max output bandwidth per server 1500 Mb/s
Maximum destinations 40 dest.
Assumptions - buffering function deactivated, - up to 40 matching filter patterns per PDU in average
Note: if 6h buffering function activated, decrease output performance to 100Mb/s
4.4 ACQUISITION DATA FEED OPTION Feed from the acquisition server allows direct PDU feed from the acquisition (integrated or probed) to the customer server. Feature is available for any protocols carried on:
• LSL*
• HSL*
• SIGTRAN
• IP
• EAGLE*
Note *: INTEGRATED APPLICATION only
It is compatible with the Filterable MSU capabilities of the Performance Intelligence Center probes (see integrated and probed acquisition sections).
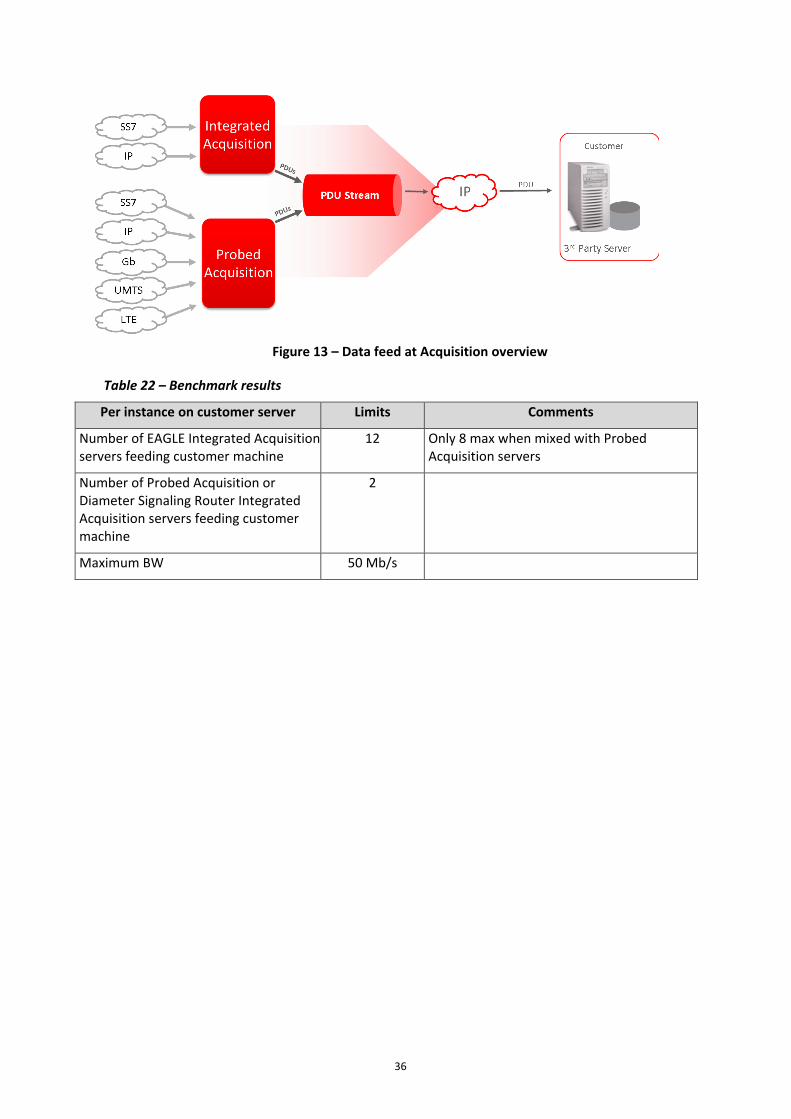
With the acquisition data feed feature, Oracle provides a software which establishes a Linux process that, after loading on the customer provided server, allows for the establishment of a LAN/WAN connection from all probes to the customer server. The customer server can be located remotely. The PDU are stored in a file (full PDU content + a header). The file is rotated at configurable interval (from 15 sec to 1 hour).
36
Figure 13 – Data feed at Acquisition overview
Table 22 – Benchmark results
Per instance on customer server Limits Comments
Number of EAGLE Integrated Acquisition servers feeding customer machine
12 Only 8 max when mixed with Probed Acquisition servers
Number of Probed Acquisition or Diameter Signaling Router Integrated Acquisition servers feeding customer machine
2
Maximum BW 50 Mb/s
37
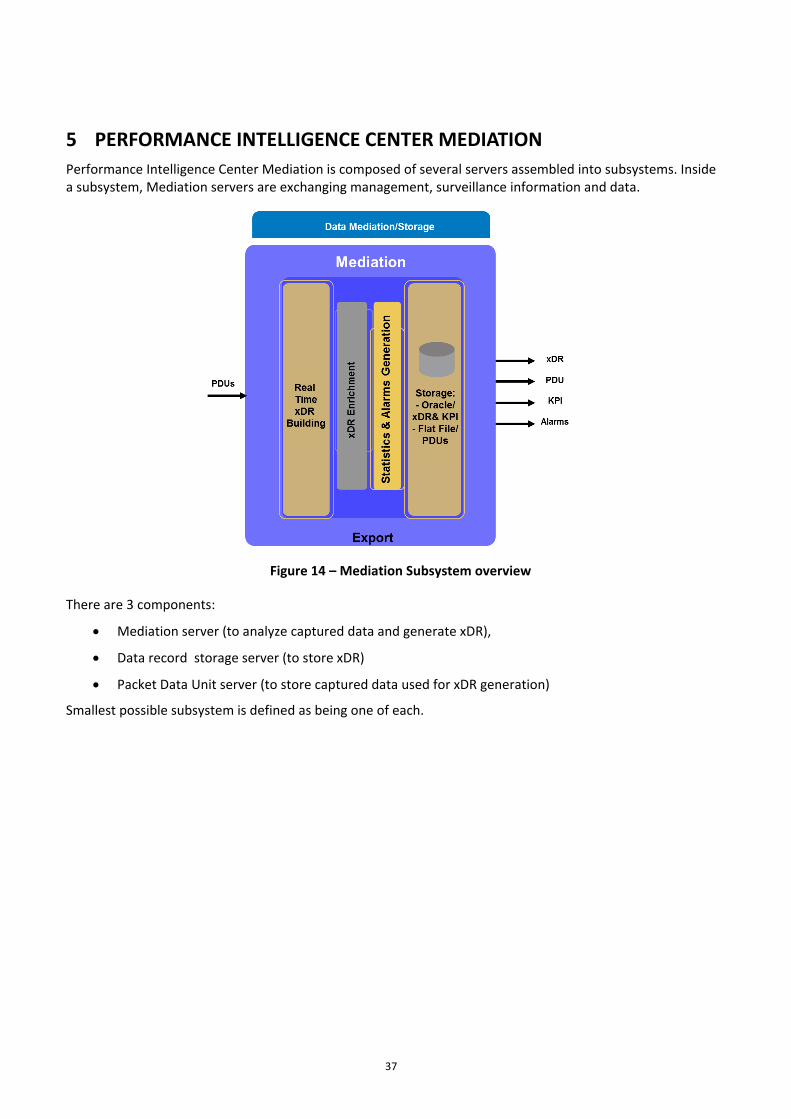
5 PERFORMANCE INTELLIGENCE CENTER MEDIATION Performance Intelligence Center Mediation is composed of several servers assembled into subsystems. Inside a subsystem, Mediation servers are exchanging management, surveillance information and data.
Figure 14 – Mediation Subsystem overview
There are 3 components:
• Mediation server (to analyze captured data and generate xDR),
• Data record storage server (to store xDR)
• Packet Data Unit server (to store captured data used for xDR generation)
Smallest possible subsystem is defined as being one of each.
38
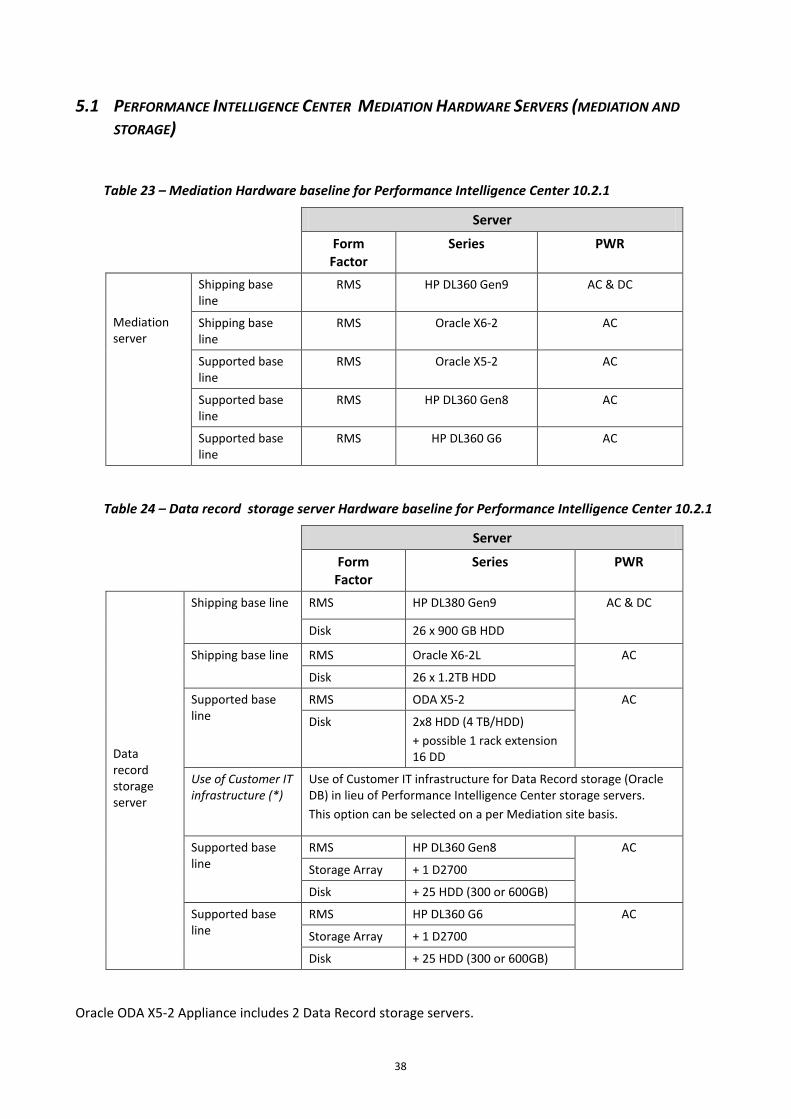
5.1 PERFORMANCE INTELLIGENCE CENTER MEDIATION HARDWARE SERVERS (MEDIATION AND STORAGE)
Table 23 – Mediation Hardware baseline for Performance Intelligence Center 10.2.1
Table 24 – Data record storage server Hardware baseline for Performance Intelligence Center 10.2.1
Server
Form Factor
Series PWR
Data record storage server
Shipping base line
RMS HP DL380 Gen9 AC & DC
Disk 26 x 900 GB HDD
Shipping base line
RMS Oracle X6-2L AC
Disk 26 x 1.2TB HDD
Supported base line
RMS ODA X5-2 AC
Disk 2x8 HDD (4 TB/HDD) + possible 1 rack extension 16 DD
Use of Customer IT infrastructure (*)
Use of Customer IT infrastructure for Data Record storage (Oracle DB) in lieu of Performance Intelligence Center storage servers. This option can be selected on a per Mediation site basis.
Supported base line
RMS HP DL360 Gen8 AC
Storage Array + 1 D2700
Disk + 25 HDD (300 or 600GB)
Supported base line
RMS HP DL360 G6 AC
Storage Array + 1 D2700
Disk + 25 HDD (300 or 600GB)
Oracle ODA X5-2 Appliance includes 2 Data Record storage servers.
Server
Form Factor
Series PWR
Mediation server
Shipping base line
RMS HP DL360 Gen9 AC & DC
Shipping base line
RMS Oracle X6-2 AC
Supported base line
RMS Oracle X5-2 AC
Supported base line
RMS HP DL360 Gen8 AC
Supported base line
RMS HP DL360 G6 AC
39
No disk capacity mix is allowed in the same subsystem.
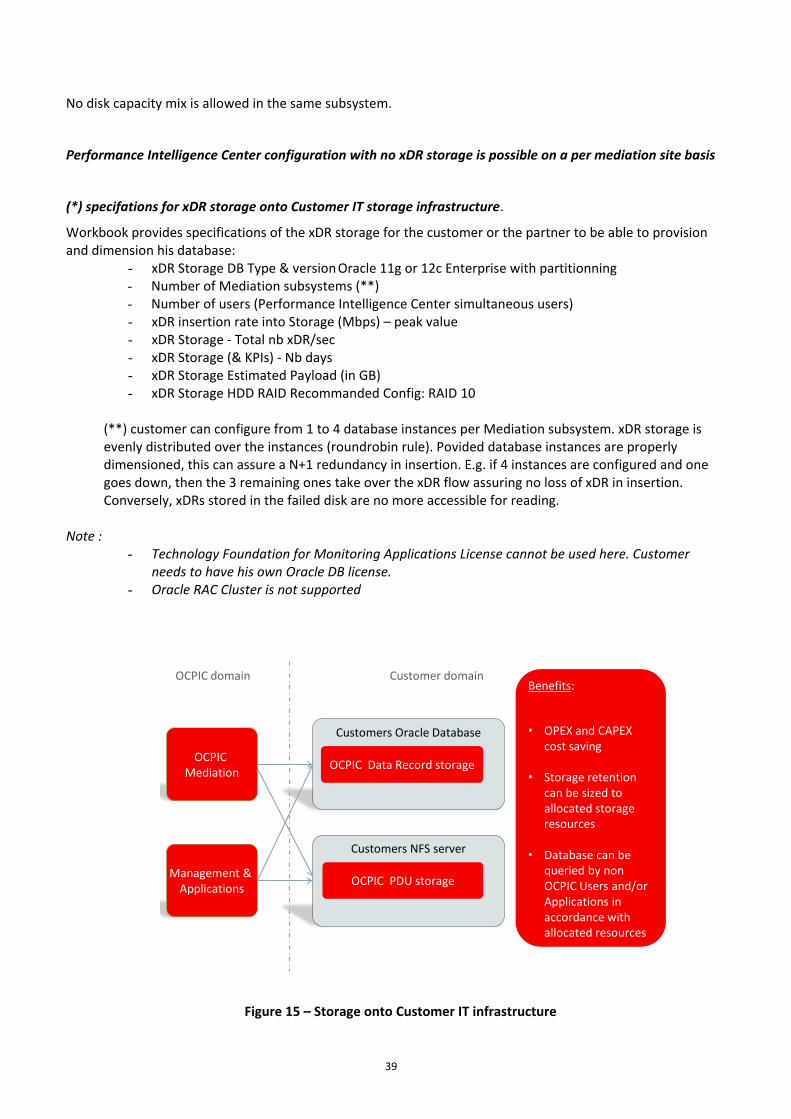
Performance Intelligence Center configuration with no xDR storage is possible on a per mediation site basis
(*) specifations for xDR storage onto Customer IT storage infrastructure.
Workbook provides specifications of the xDR storage for the customer or the partner to be able to provision and dimension his database:
- xDR Storage DB Type & version Oracle 11g or 12c Enterprise with partitionning - Number of Mediation subsystems (**) - Number of users (Performance Intelligence Center simultaneous users) - xDR insertion rate into Storage (Mbps) – peak value - xDR Storage - Total nb xDR/sec - xDR Storage (& KPIs) - Nb days - xDR Storage Estimated Payload (in GB) - xDR Storage HDD RAID Recommanded Config: RAID 10
(**) customer can configure from 1 to 4 database instances per Mediation subsystem. xDR storage is evenly distributed over the instances (roundrobin rule). Povided database instances are properly dimensioned, this can assure a N+1 redundancy in insertion. E.g. if 4 instances are configured and one goes down, then the 3 remaining ones take over the xDR flow assuring no loss of xDR in insertion. Conversely, xDRs stored in the failed disk are no more accessible for reading.
Note :
- Technology Foundation for Monitoring Applications License cannot be used here. Customer needs to have his own Oracle DB license.
- Oracle RAC Cluster is not supported
Customers Oracle Database
OCPIC Mediation OCPIC Data Record storage
Customers NFS server
OCPIC PDU storageManagement & Applications
OCPIC domain Customer domainBenefits:
• OPEX and CAPEX cost saving
• Storage retentioncan be sized to allocated storageresources
• Database can bequeried by non OCPIC Users and/or Applications in accordance withallocated resources
Figure 15 – Storage onto Customer IT infrastructure
40
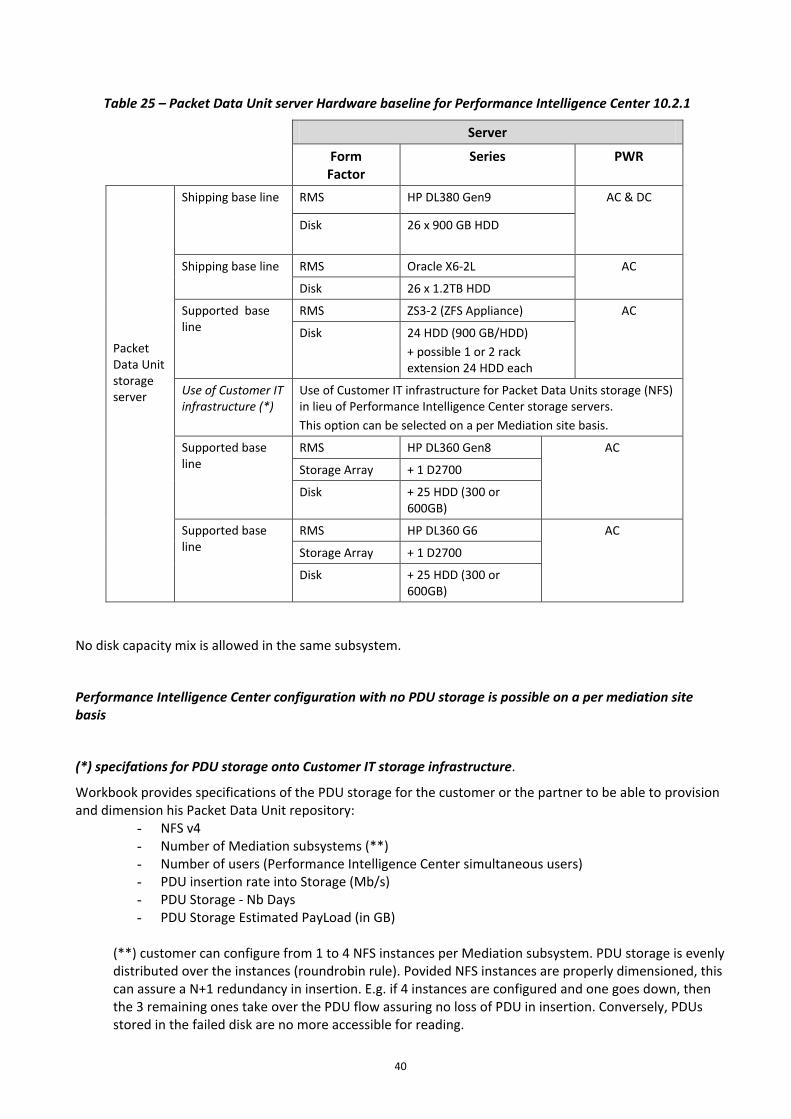
Table 25 – Packet Data Unit server Hardware baseline for Performance Intelligence Center 10.2.1
Server
Form Factor
Series PWR
Packet Data Unit storage server
Shipping base line
RMS HP DL380 Gen9 AC & DC
Disk 26 x 900 GB HDD
Shipping base line
RMS Oracle X6-2L AC
Disk 26 x 1.2TB HDD
Supported base line
RMS ZS3-2 (ZFS Appliance) AC
Disk 24 HDD (900 GB/HDD) + possible 1 or 2 rack extension 24 HDD each
Use of Customer IT infrastructure (*)
Use of Customer IT infrastructure for Packet Data Units storage (NFS) in lieu of Performance Intelligence Center storage servers. This option can be selected on a per Mediation site basis.
Supported base line
RMS HP DL360 Gen8 AC
Storage Array + 1 D2700
Disk + 25 HDD (300 or 600GB)
Supported base line
RMS HP DL360 G6 AC
Storage Array + 1 D2700
Disk + 25 HDD (300 or 600GB)
No disk capacity mix is allowed in the same subsystem.
Performance Intelligence Center configuration with no PDU storage is possible on a per mediation site basis
(*) specifations for PDU storage onto Customer IT storage infrastructure.
Workbook provides specifications of the PDU storage for the customer or the partner to be able to provision and dimension his Packet Data Unit repository:
- NFS v4 - Number of Mediation subsystems (**) - Number of users (Performance Intelligence Center simultaneous users) - PDU insertion rate into Storage (Mb/s) - PDU Storage - Nb Days - PDU Storage Estimated PayLoad (in GB)
(**) customer can configure from 1 to 4 NFS instances per Mediation subsystem. PDU storage is evenly distributed over the instances (roundrobin rule). Povided NFS instances are properly dimensioned, this can assure a N+1 redundancy in insertion. E.g. if 4 instances are configured and one goes down, then the 3 remaining ones take over the PDU flow assuring no loss of PDU in insertion. Conversely, PDUs stored in the failed disk are no more accessible for reading.
41
Note : A given NFS mount can be used by only one mediation subsystem
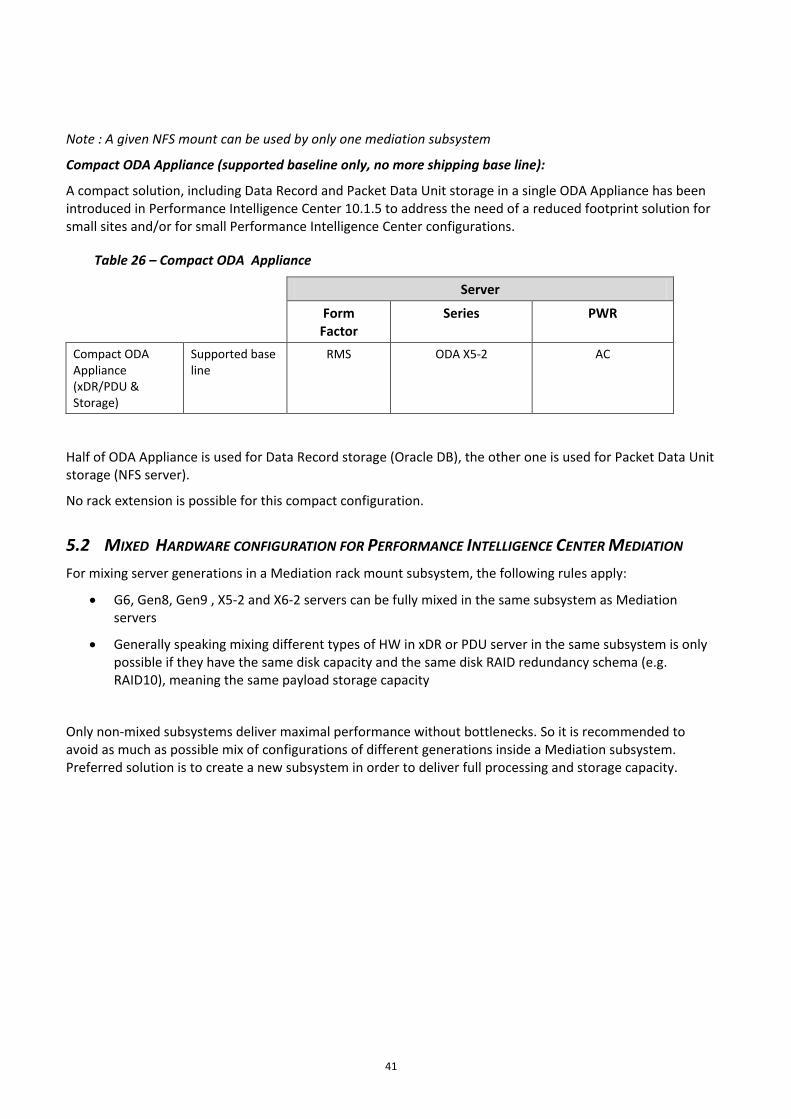
Compact ODA Appliance (supported baseline only, no more shipping base line):
A compact solution, including Data Record and Packet Data Unit storage in a single ODA Appliance has been introduced in Performance Intelligence Center 10.1.5 to address the need of a reduced footprint solution for small sites and/or for small Performance Intelligence Center configurations.
Table 26 – Compact ODA Appliance
Server
Form Factor
Series PWR
Compact ODA Appliance (xDR/PDU & Storage)
Supported base line
RMS ODA X5-2 AC
Half of ODA Appliance is used for Data Record storage (Oracle DB), the other one is used for Packet Data Unit storage (NFS server).
No rack extension is possible for this compact configuration.
5.2 MIXED HARDWARE CONFIGURATION FOR PERFORMANCE INTELLIGENCE CENTER MEDIATION For mixing server generations in a Mediation rack mount subsystem, the following rules apply:
• G6, Gen8, Gen9 , X5-2 and X6-2 servers can be fully mixed in the same subsystem as Mediation servers
• Generally speaking mixing different types of HW in xDR or PDU server in the same subsystem is only possible if they have the same disk capacity and the same disk RAID redundancy schema (e.g. RAID10), meaning the same payload storage capacity
Only non-mixed subsystems deliver maximal performance without bottlenecks. So it is recommended to avoid as much as possible mix of configurations of different generations inside a Mediation subsystem. Preferred solution is to create a new subsystem in order to deliver full processing and storage capacity.
42
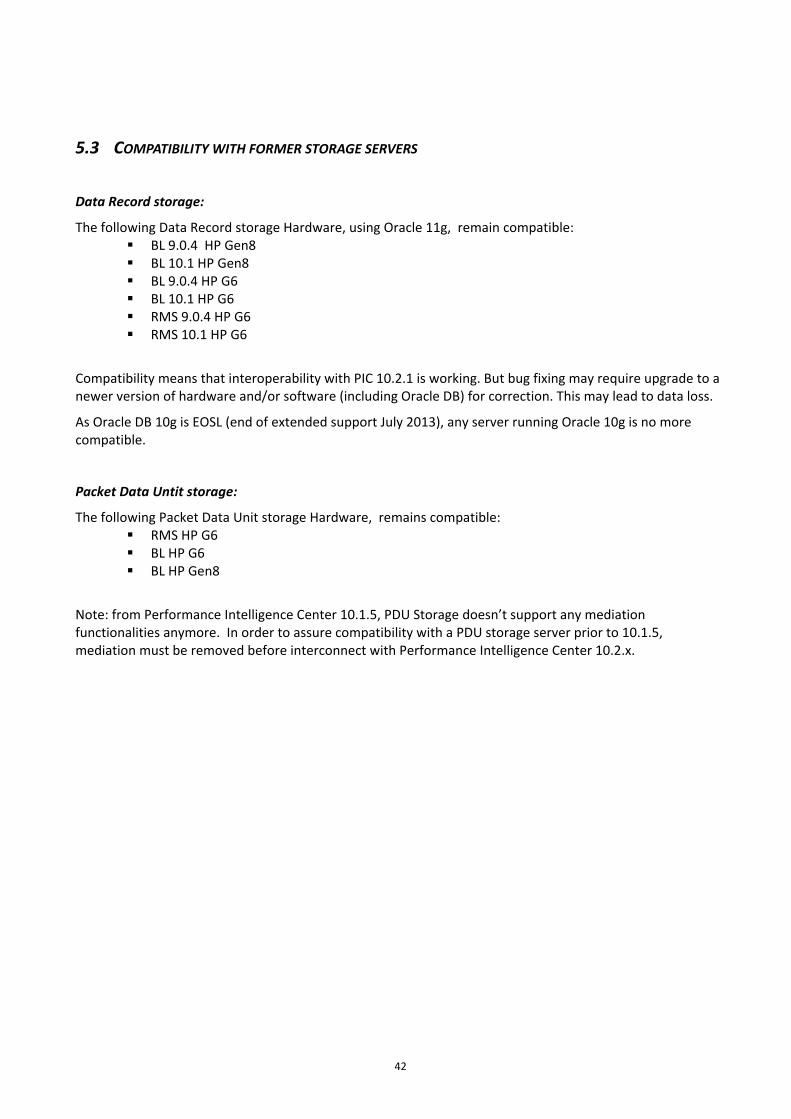
5.3 COMPATIBILITY WITH FORMER STORAGE SERVERS
Data Record storage:
The following Data Record storage Hardware, using Oracle 11g, remain compatible: BL 9.0.4 HP Gen8 BL 10.1 HP Gen8 BL 9.0.4 HP G6 BL 10.1 HP G6 RMS 9.0.4 HP G6 RMS 10.1 HP G6
Compatibility means that interoperability with PIC 10.2.1 is working. But bug fixing may require upgrade to a newer version of hardware and/or software (including Oracle DB) for correction. This may lead to data loss.
As Oracle DB 10g is EOSL (end of extended support July 2013), any server running Oracle 10g is no more compatible.
Packet Data Untit storage:
The following Packet Data Unit storage Hardware, remains compatible: RMS HP G6 BL HP G6 BL HP Gen8
Note: from Performance Intelligence Center 10.1.5, PDU Storage doesn’t support any mediation functionalities anymore. In order to assure compatibility with a PDU storage server prior to 10.1.5, mediation must be removed before interconnect with Performance Intelligence Center 10.2.x.
43
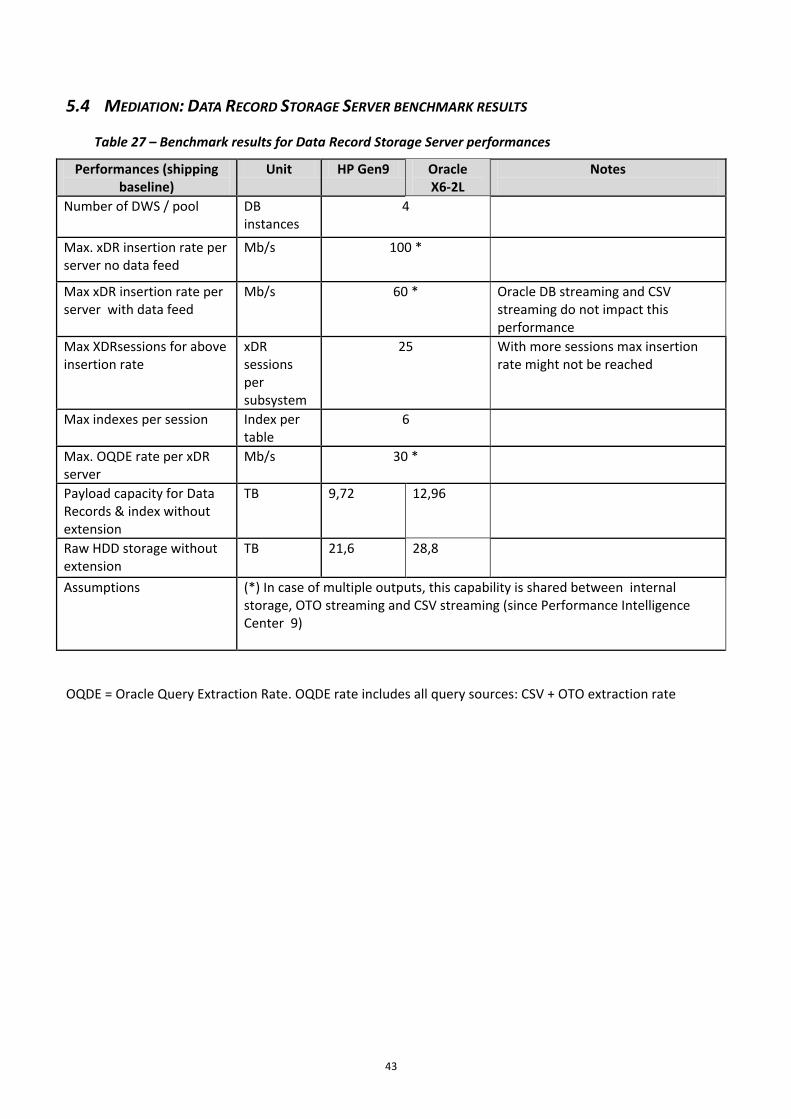
5.4 MEDIATION: DATA RECORD STORAGE SERVER BENCHMARK RESULTS
Table 27 – Benchmark results for Data Record Storage Server performances
Performances (shipping baseline)
Unit HP Gen9 Oracle X6-2L
Notes
Number of DWS / pool DB instances
4
Max. xDR insertion rate per server no data feed
Mb/s 100 *
Max xDR insertion rate per server with data feed
Mb/s 60 * Oracle DB streaming and CSV streaming do not impact this performance
Max XDRsessions for above insertion rate
xDR sessions per subsystem
25 With more sessions max insertion rate might not be reached
Max indexes per session Index per table
6
Max. OQDE rate per xDR server
Mb/s 30 *
Payload capacity for Data Records & index without extension
TB 9,72 12,96
Raw HDD storage without extension
TB 21,6 28,8
Assumptions (*) In case of multiple outputs, this capability is shared between internal storage, OTO streaming and CSV streaming (since Performance Intelligence Center 9)
OQDE = Oracle Query Extraction Rate. OQDE rate includes all query sources: CSV + OTO extraction rate
44
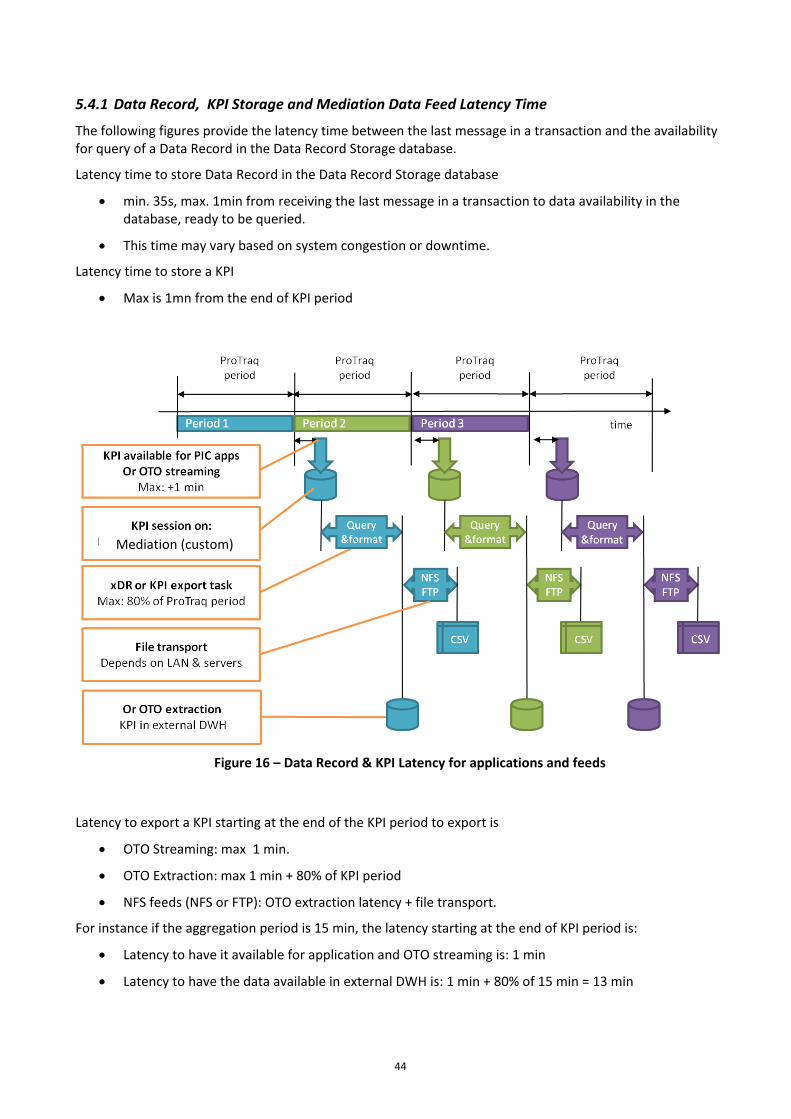
5.4.1 Data Record, KPI Storage and Mediation Data Feed Latency Time
The following figures provide the latency time between the last message in a transaction and the availability for query of a Data Record in the Data Record Storage database.
Latency time to store Data Record in the Data Record Storage database
• min. 35s, max. 1min from receiving the last message in a transaction to data availability in the database, ready to be queried.
• This time may vary based on system congestion or downtime.
Latency time to store a KPI
• Max is 1mn from the end of KPI period
Figure 16 – Data Record & KPI Latency for applications and feeds
Latency to export a KPI starting at the end of the KPI period to export is
• OTO Streaming: max 1 min.
• OTO Extraction: max 1 min + 80% of KPI period
• NFS feeds (NFS or FTP): OTO extraction latency + file transport.
For instance if the aggregation period is 15 min, the latency starting at the end of KPI period is:
• Latency to have it available for application and OTO streaming is: 1 min
• Latency to have the data available in external DWH is: 1 min + 80% of 15 min = 13 min
Mediation (custom)
45
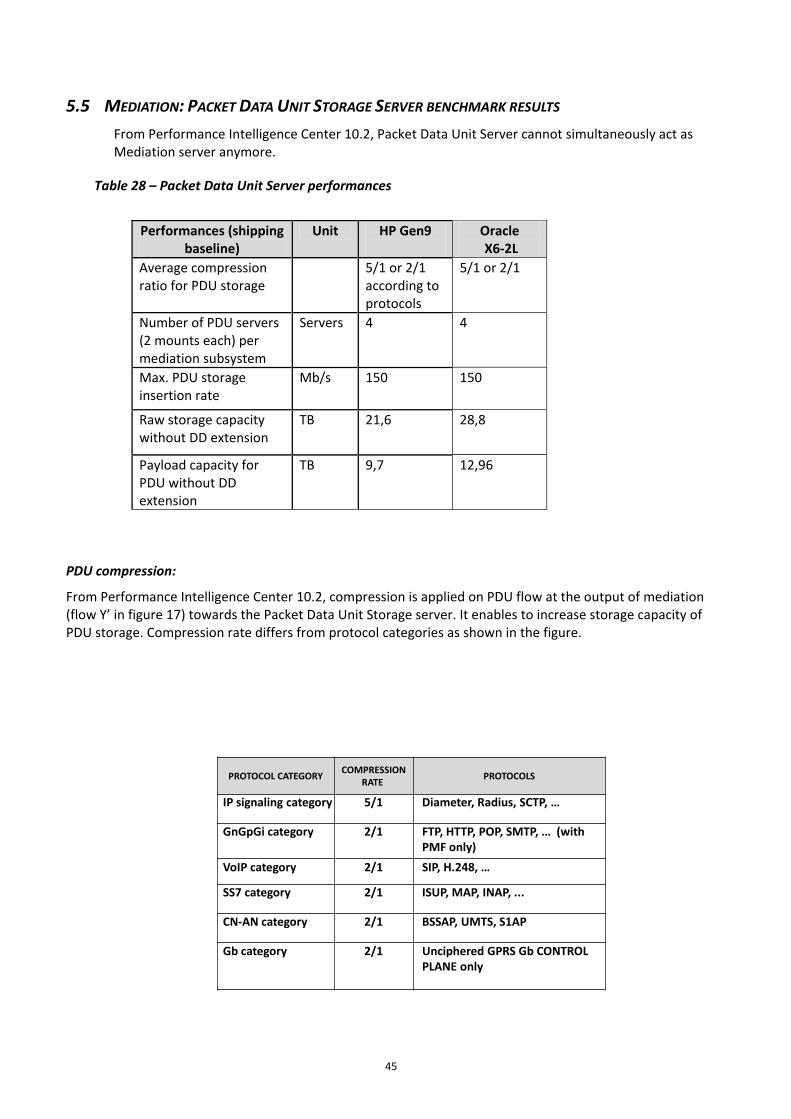
5.5 MEDIATION: PACKET DATA UNIT STORAGE SERVER BENCHMARK RESULTS From Performance Intelligence Center 10.2, Packet Data Unit Server cannot simultaneously act as Mediation server anymore.
Table 28 – Packet Data Unit Server performances
Performances (shipping
baseline) Unit HP Gen9
Oracle X6-2L
Average compression ratio for PDU storage
5/1 or 2/1 according to protocols
5/1 or 2/1
Number of PDU servers (2 mounts each) per mediation subsystem
Servers 4 4
Max. PDU storage insertion rate
Mb/s 150 150
Raw storage capacity without DD extension
TB 21,6 28,8
Payload capacity for PDU without DD extension
TB 9,7 12,96
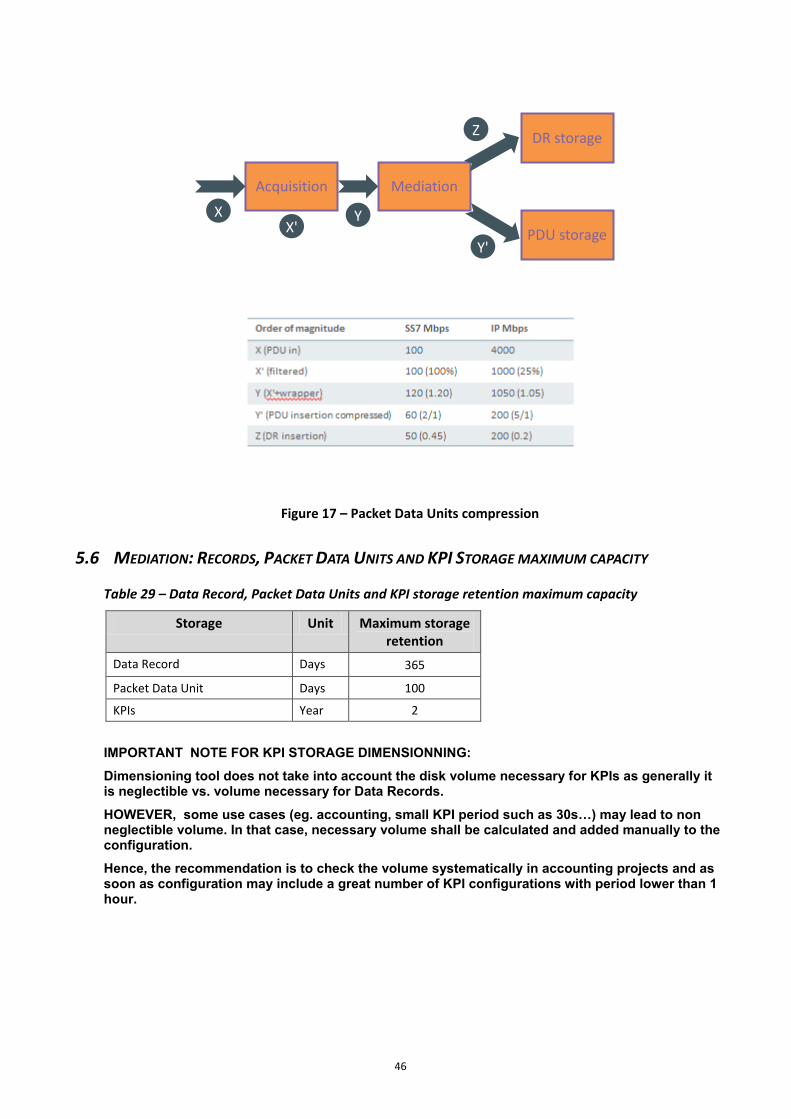
PDU compression:
From Performance Intelligence Center 10.2, compression is applied on PDU flow at the output of mediation (flow Y’ in figure 17) towards the Packet Data Unit Storage server. It enables to increase storage capacity of PDU storage. Compression rate differs from protocol categories as shown in the figure.
PROTOCOL CATEGORY COMPRESSION RATE PROTOCOLS
IP signaling category 5/1 Diameter, Radius, SCTP, …
GnGpGi category 2/1 FTP, HTTP, POP, SMTP, … (with PMF only)
VoIP category 2/1 SIP, H.248, …
SS7 category 2/1 ISUP, MAP, INAP, ...
CN-AN category 2/1 BSSAP, UMTS, S1AP
Gb category 2/1 Unciphered GPRS Gb CONTROL PLANE only
46
Figure 17 – Packet Data Units compression
5.6 MEDIATION: RECORDS, PACKET DATA UNITS AND KPI STORAGE MAXIMUM CAPACITY
Table 29 – Data Record, Packet Data Units and KPI storage retention maximum capacity
Storage Unit Maximum storage retention
Data Record Days 365
Packet Data Unit Days 100
KPIs Year 2 IMPORTANT NOTE FOR KPI STORAGE DIMENSIONNING: Dimensioning tool does not take into account the disk volume necessary for KPIs as generally it is neglectible vs. volume necessary for Data Records. HOWEVER, some use cases (eg. accounting, small KPI period such as 30s…) may lead to non neglectible volume. In that case, necessary volume shall be calculated and added manually to the configuration. Hence, the recommendation is to check the volume systematically in accounting projects and as soon as configuration may include a great number of KPI configurations with period lower than 1 hour.
Acquisition Mediation
DR storage
PDU storage X Y
Z
Y' X'
47
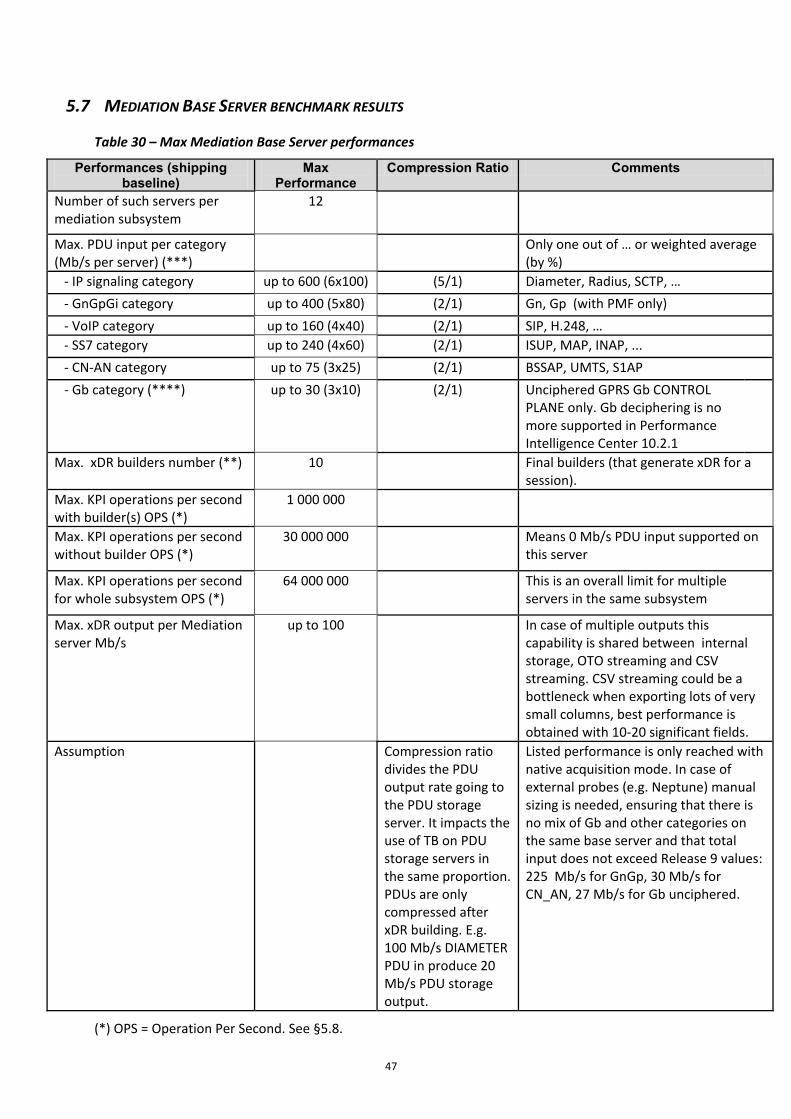
5.7 MEDIATION BASE SERVER BENCHMARK RESULTS
Table 30 – Max Mediation Base Server performances
Performances (shipping baseline)
Max Performance
Compression Ratio Comments
Number of such servers per mediation subsystem
12
Max. PDU input per category (Mb/s per server) (***)
Only one out of … or weighted average (by %)
- IP signaling category up to 600 (6x100) (5/1) Diameter, Radius, SCTP, … - GnGpGi category up to 400 (5x80) (2/1) Gn, Gp (with PMF only) - VoIP category up to 160 (4x40) (2/1) SIP, H.248, … - SS7 category up to 240 (4x60) (2/1) ISUP, MAP, INAP, ... - CN-AN category up to 75 (3x25) (2/1) BSSAP, UMTS, S1AP - Gb category (****) up to 30 (3x10) (2/1) Unciphered GPRS Gb CONTROL
PLANE only. Gb deciphering is no more supported in Performance Intelligence Center 10.2.1
Max. xDR builders number (**) 10 Final builders (that generate xDR for a session).
Max. KPI operations per second with builder(s) OPS (*)
1 000 000
Max. KPI operations per second without builder OPS (*)
30 000 000 Means 0 Mb/s PDU input supported on this server
Max. KPI operations per second for whole subsystem OPS (*)
64 000 000 This is an overall limit for multiple servers in the same subsystem
Max. xDR output per Mediation server Mb/s
up to 100 In case of multiple outputs this capability is shared between internal storage, OTO streaming and CSV streaming. CSV streaming could be a bottleneck when exporting lots of very small columns, best performance is obtained with 10-20 significant fields.
Assumption Compression ratio divides the PDU output rate going to the PDU storage server. It impacts the use of TB on PDU storage servers in the same proportion. PDUs are only compressed after xDR building. E.g. 100 Mb/s DIAMETER PDU in produce 20 Mb/s PDU storage output.
Listed performance is only reached with native acquisition mode. In case of external probes (e.g. Neptune) manual sizing is needed, ensuring that there is no mix of Gb and other categories on the same base server and that total input does not exceed Release 9 values: 225 Mb/s for GnGp, 30 Mb/s for CN_AN, 27 Mb/s for Gb unciphered.
(*) OPS = Operation Per Second. See §5.8.
48
(**) Total number of final builders whatever the number of DFPs. Final builders corresponds to builders listed in the dimensioning tool.
(***) Differences per protocol are caused by differences in size of PDU, differences in PDU correlated as one xDR and complexity of protocol coding. Examples:
• 10 Mbps of ISUP = 30 000 frames
• 10 Mbps of SIP = 2 000 frames
• BSSAP : up to 20 frames for 1 xDR
• Diameter: 2 frames for 1 xDR
(****) Sizing assumes that all Gb User Plane is filtered out at Probed Acquisition level.
IMPORTANT NOTE : performances in general and especially max. PDU input (Mbps) Mediation server are given for nominal usage of the system. In particular, low correlation rate due to network topology (eg. asymmetrical traffic routing - eg. if 2 IPX carriers are involved - preventing the system to capture all messages of a given call or transaction and thus leading to a low correlation rate which hits the memory limit of the server and increase disk space for storage) may severely degrade the announced performance.
49
5.8 MEDIATION: KPI ENGINE PERFORMANCE (PERFORMANCE INTELLIGENCE CENTER MANAGEMENT KPI APPLICATION)
This section details the maximum KPI performance of a Mediation base server and the calculation to estimate the performance required by customer and consequently, to determine the number of necessary mediation base servers.
KPIs performance is calculated as number of OPS/s (Operation Per Second), which is dependent on three factors row operations, column operations and xDR/s.
The next sections explain the calculation of OP/s.
It is worth noting static enrichment consumes also OP/s. Calculation of the contribution of static enrichment to OP/s is explained in section §5.9 (static enrichment).
IMPORTANT NOTE ON ACCOUNTING BASED PROJECTS:
Accounting (eg. SS7 accounting) generally requires extensive number of dimension combinations and as a result a huge number of Performance Intelligence Center Management KPI raws with extensive use of TOP Performance Intelligence Center Management KPI application function.
As TOP function is favorable in term of MOPS performance, generally in this case, MOPs result is misleading because the number of Mbps xDR forwarded to the KPI server reach its limit before the max MOPs is hit. But the limit in term of Mbps xDR for feeding a KPI server is not known and not modeled in the dimensioning tool.
So recommendation is to systematically work with PLM for dimensioning any configuration dealing with accounting.
5.8.1 Row operations are calculated as below
Row operations = number of rows X average number of conditions X Top criteria
Average number of conditions gives the average number of filter conditions over Performance Intelligence Center Management KPI cells. Eg. “OPC = x” is one condition; “OPC=x OR OPC=y” are 2 conditions.
TOP criteria for TOP N Performance Intelligence Center Management KPI configuration provides an equivalent number of Performance Intelligence Center Management KPI rows as log2(N) (e g. for TOP 1000, the number of equivalent rows is log2(1000) = 10)
TOP criteria for standard Performance Intelligence Center Management KPI will be 1.
5.8.2 Column operations are calculated as below
column operations = number of columns X average number of conditions
xDR per second is the number of records selected by the “corner filter”
5.8.3 Number Operations per second (OPS) is calculated as below
OPS/s rate = (rows operations + column operations) X (xDR/sec)
NOTE: Performance Intelligence Center KPI Management OPS/s is monitored in Capacity Management statistics which is very helpful to check a posteriori the actual performance supported by each Mediation base module.
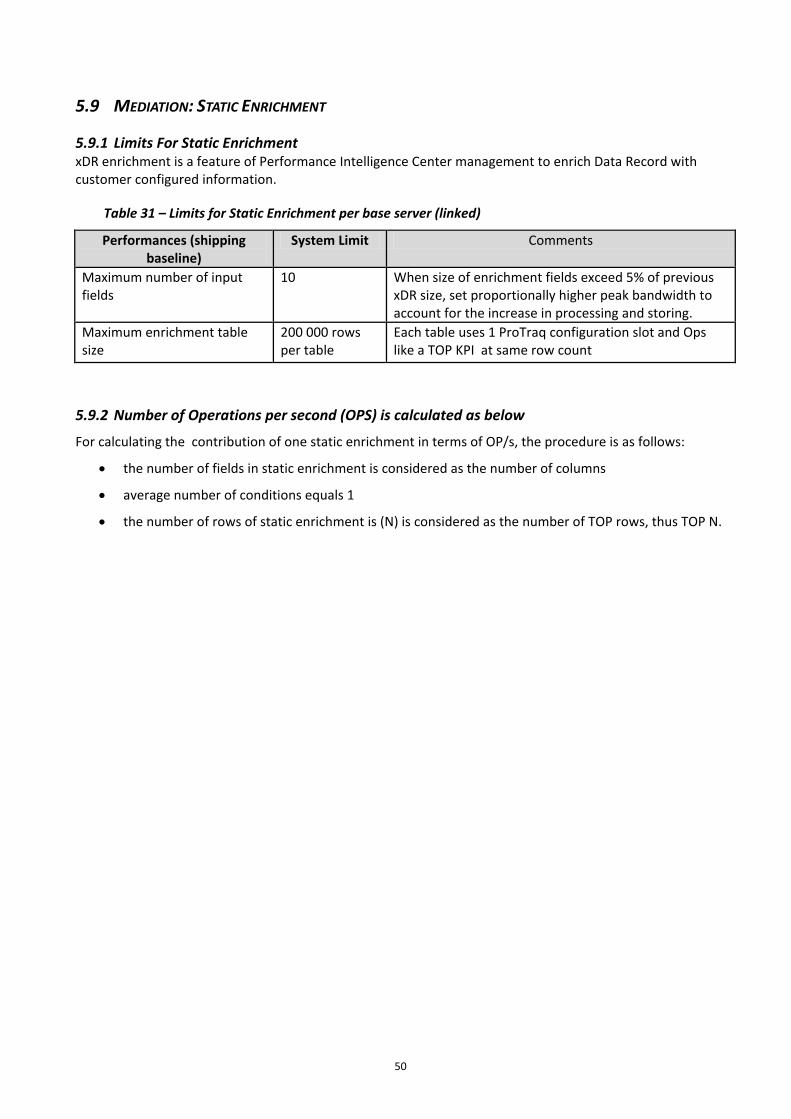
50
5.9 MEDIATION: STATIC ENRICHMENT
5.9.1 Limits For Static Enrichment xDR enrichment is a feature of Performance Intelligence Center management to enrich Data Record with customer configured information.
Table 31 – Limits for Static Enrichment per base server (linked)
Performances (shipping baseline)
System Limit Comments
Maximum number of input fields
10 When size of enrichment fields exceed 5% of previous xDR size, set proportionally higher peak bandwidth to account for the increase in processing and storing.
Maximum enrichment table size
200 000 rows per table
Each table uses 1 ProTraq configuration slot and Ops like a TOP KPI at same row count
5.9.2 Number of Operations per second (OPS) is calculated as below
For calculating the contribution of one static enrichment in terms of OP/s, the procedure is as follows:
• the number of fields in static enrichment is considered as the number of columns
• average number of conditions equals 1
• the number of rows of static enrichment is (N) is considered as the number of TOP rows, thus TOP N.
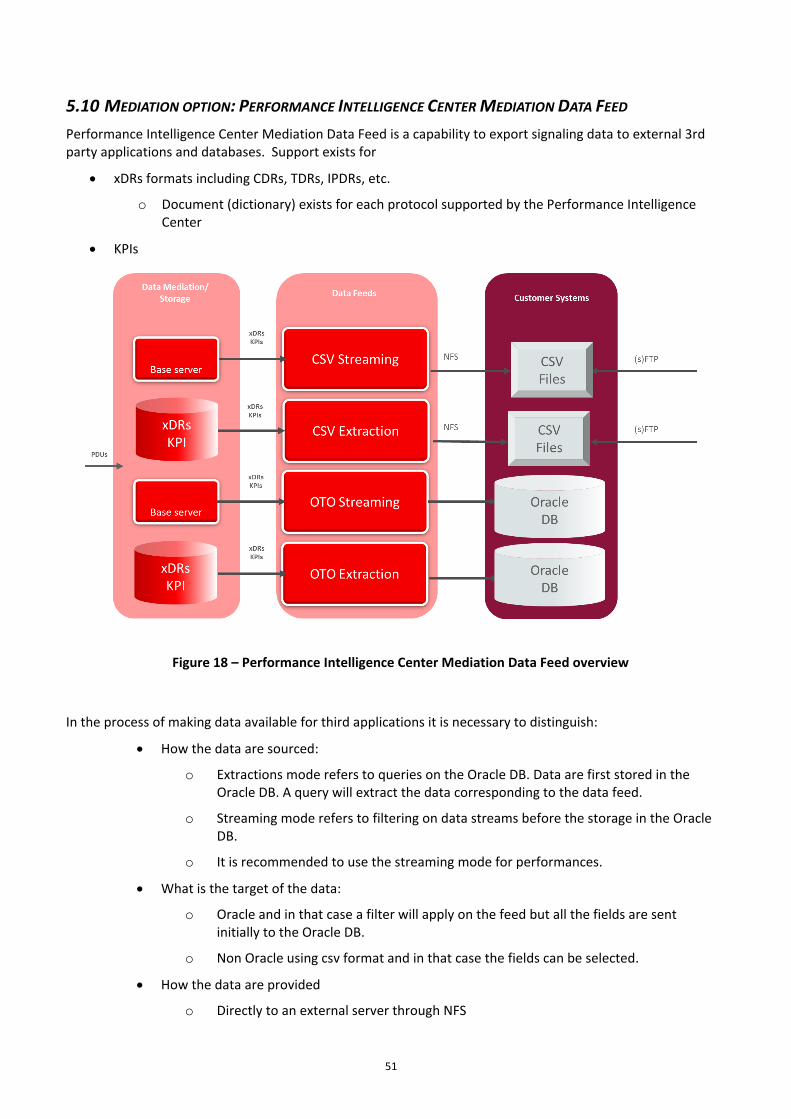
51
5.10 MEDIATION OPTION: PERFORMANCE INTELLIGENCE CENTER MEDIATION DATA FEED Performance Intelligence Center Mediation Data Feed is a capability to export signaling data to external 3rd party applications and databases. Support exists for
• xDRs formats including CDRs, TDRs, IPDRs, etc.
o Document (dictionary) exists for each protocol supported by the Performance Intelligence Center
• KPIs
Figure 18 – Performance Intelligence Center Mediation Data Feed overview
In the process of making data available for third applications it is necessary to distinguish:
• How the data are sourced:
o Extractions mode refers to queries on the Oracle DB. Data are first stored in the Oracle DB. A query will extract the data corresponding to the data feed.
o Streaming mode refers to filtering on data streams before the storage in the Oracle DB.
o It is recommended to use the streaming mode for performances.
• What is the target of the data:
o Oracle and in that case a filter will apply on the feed but all the fields are sent initially to the Oracle DB.
o Non Oracle using csv format and in that case the fields can be selected.
• How the data are provided
o Directly to an external server through NFS
52
o Stored still using NFS to an Export Server that can be configured to be a FTP server. The third party application will read the data either using NFS or FTP.
The following policy and guidelines apply to all the Performance Intelligence Center Mediation Data Feeds:
• The maximum data that can be extracted from the system cannot exceed the maximum input capacity and rate.
• The PDU Server(s) can be used to setup and execute the data feed, however the output rate and performance will be low.
• Max Oracle Query Data Extraction rate (OQDE rate) represents: PPS query rate + NFS Feed query rate + FTP Feed query rate + OTO extraction query rate
Specific policy and guidelines for Oracle streaming target:
• Oracle recommends a Linux / Unix based external data warehouse
• Customer to provide Oracle DB license, server and Oracle DBA for initial setup.
• The target Oracle database must be 11g compatible, enterprise edition with partitionning option
• The external data warehouse must support a sufficient amount of storage capacity.
• Purging the data on the external data warehouse is the responsibility of the customer.
• 6 hour buffering for xDR and KPIs at the Mediation
Specific policy and guidelines for Oracle extraction target:
• Oracle recommends a Linux / Unix based external data warehouse
• Customer to provide Oracle DB license, server and Oracle DBA for initial setup.
• The target Oracle database must be 11g compatible, enterprise edition with partitionning option
• The external data warehouse must support a sufficient amount of storage capacity.
• The data older than the lifetime will be automatically removed during the nightly automatic purge
• Buffering of the xDRs / KPI is up to session lifetime (configurable)
Specific policy and guidelines when exporting CSV directly to an external server using NFS:
• Oracle recommends a Linux / Unix based target server (3rd party server)
• The target server must support NFS (Network File System) protocol. The necessary configuration, setup and the security administration of the server is the responsibility of the customer.
• The target server must support a sufficient amount of storage capacity.
• The maximum file size on the target server depends upon the architecture of the server. The data feed has no restriction or limitation on the size of the file.
• Purging the data on the target server is the responsibility of the customer.
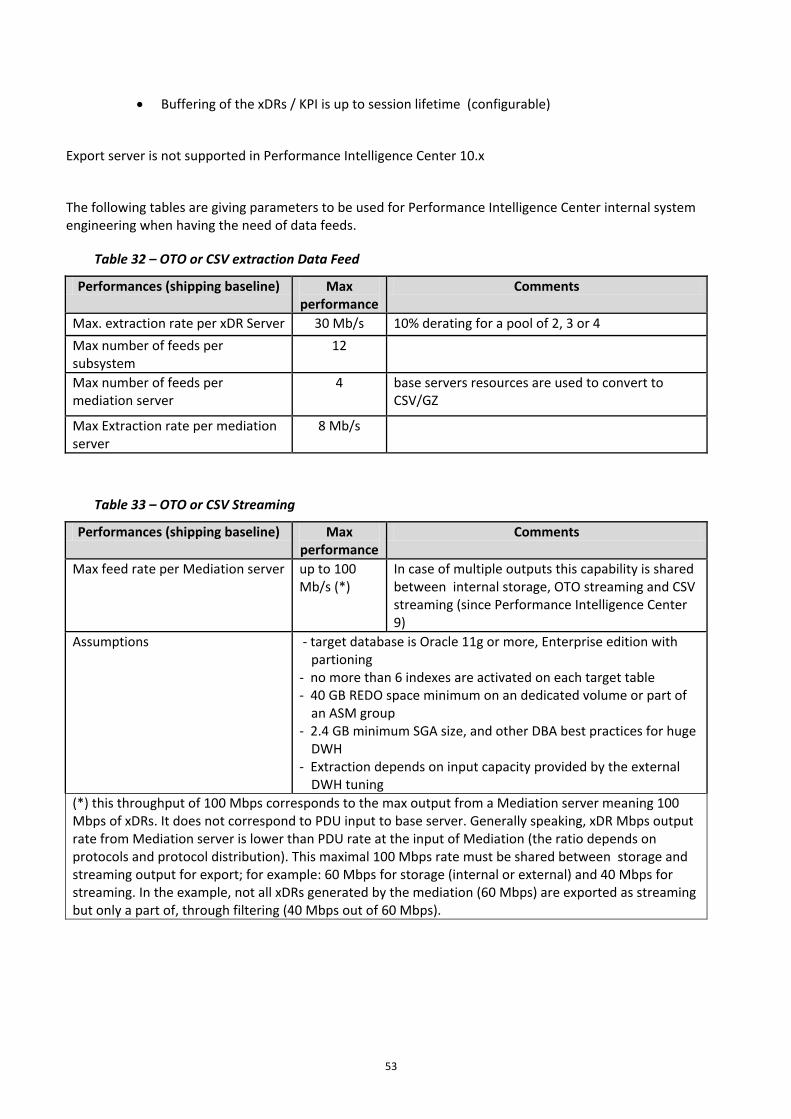
53
• Buffering of the xDRs / KPI is up to session lifetime (configurable)
Export server is not supported in Performance Intelligence Center 10.x
The following tables are giving parameters to be used for Performance Intelligence Center internal system engineering when having the need of data feeds.
Table 32 – OTO or CSV extraction Data Feed
Performances (shipping baseline) Max performance
Comments
Max. extraction rate per xDR Server 30 Mb/s 10% derating for a pool of 2, 3 or 4 Max number of feeds per subsystem
12
Max number of feeds per mediation server
4 base servers resources are used to convert to CSV/GZ
Max Extraction rate per mediation server
8 Mb/s
Table 33 – OTO or CSV Streaming
Performances (shipping baseline) Max performance
Comments
Max feed rate per Mediation server up to 100 Mb/s (*)
In case of multiple outputs this capability is shared between internal storage, OTO streaming and CSV streaming (since Performance Intelligence Center 9)
Assumptions - target database is Oracle 11g or more, Enterprise edition with partioning
- no more than 6 indexes are activated on each target table - 40 GB REDO space minimum on an dedicated volume or part of
an ASM group - 2.4 GB minimum SGA size, and other DBA best practices for huge
DWH - Extraction depends on input capacity provided by the external
DWH tuning (*) this throughput of 100 Mbps corresponds to the max output from a Mediation server meaning 100 Mbps of xDRs. It does not correspond to PDU input to base server. Generally speaking, xDR Mbps output rate from Mediation server is lower than PDU rate at the input of Mediation (the ratio depends on protocols and protocol distribution). This maximal 100 Mbps rate must be shared between storage and streaming output for export; for example: 60 Mbps for storage (internal or external) and 40 Mbps for streaming. In the example, not all xDRs generated by the mediation (60 Mbps) are exported as streaming but only a part of, through filtering (40 Mbps out of 60 Mbps).
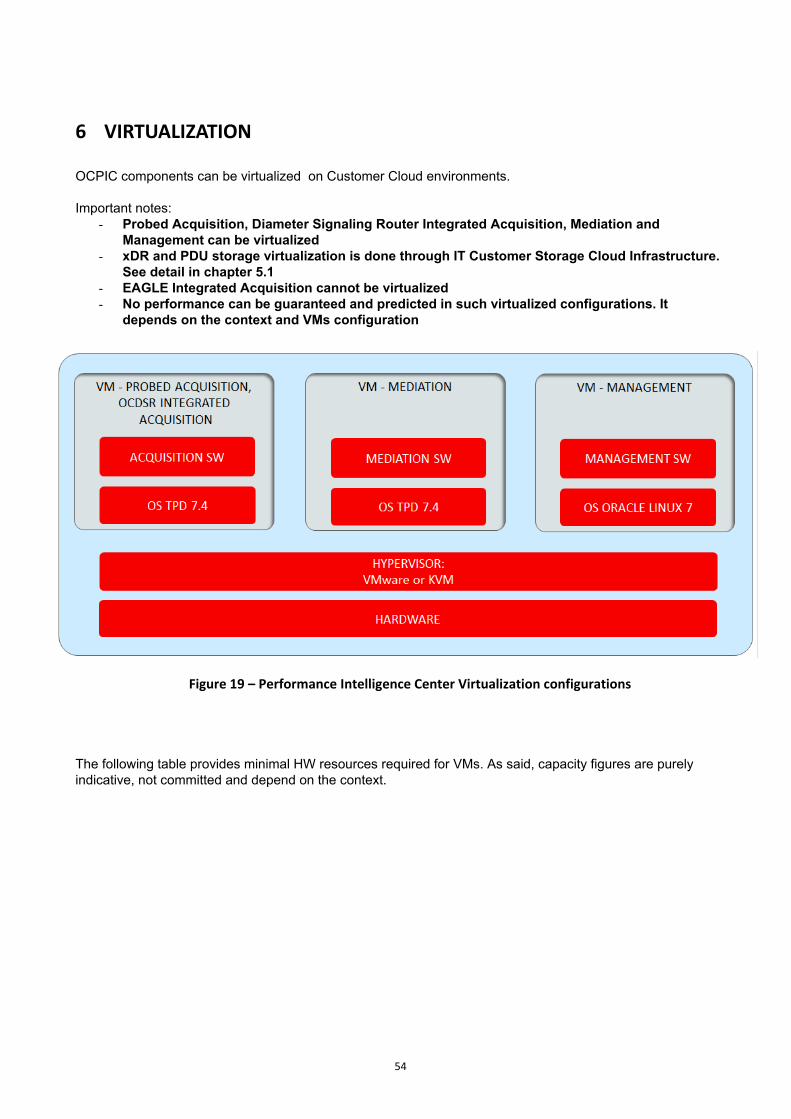
54
6 VIRTUALIZATION OCPIC components can be virtualized on Customer Cloud environments. Important notes:
- Probed Acquisition, Diameter Signaling Router Integrated Acquisition, Mediation and Management can be virtualized
- xDR and PDU storage virtualization is done through IT Customer Storage Cloud Infrastructure. See detail in chapter 5.1
- EAGLE Integrated Acquisition cannot be virtualized - No performance can be guaranteed and predicted in such virtualized configurations. It
depends on the context and VMs configuration
Figure 19 – Performance Intelligence Center Virtualization configurations
The following table provides minimal HW resources required for VMs. As said, capacity figures are purely indicative, not committed and depend on the context.
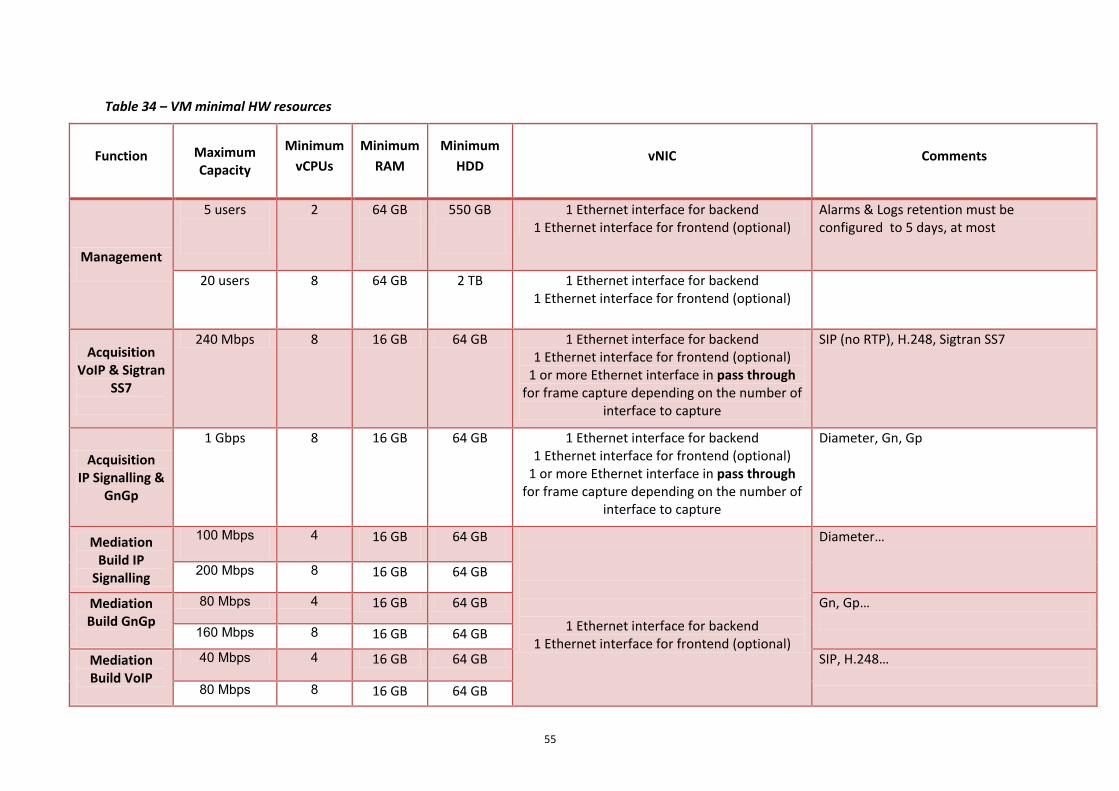
55
Table 34 – VM minimal HW resources
Function Maximum Capacity
Minimum vCPUs
Minimum RAM
Minimum HDD
vNIC Comments
Management
5 users
2
64 GB
550 GB
1 Ethernet interface for backend 1 Ethernet interface for frontend (optional)
Alarms & Logs retention must be configured to 5 days, at most
20 users 8 64 GB 2 TB 1 Ethernet interface for backend 1 Ethernet interface for frontend (optional)
Acquisition VoIP & Sigtran
SS7
240 Mbps 8 16 GB 64 GB 1 Ethernet interface for backend 1 Ethernet interface for frontend (optional)
1 or more Ethernet interface in pass through for frame capture depending on the number of
interface to capture
SIP (no RTP), H.248, Sigtran SS7
Acquisition IP Signalling &
GnGp
1 Gbps 8 16 GB 64 GB 1 Ethernet interface for backend 1 Ethernet interface for frontend (optional)
1 or more Ethernet interface in pass through for frame capture depending on the number of
interface to capture
Diameter, Gn, Gp
Mediation Build IP
Signalling
100 Mbps 4 16 GB 64 GB
1 Ethernet interface for backend 1 Ethernet interface for frontend (optional)
Diameter…
200 Mbps 8 16 GB 64 GB
Mediation Build GnGp
80 Mbps 4 16 GB 64 GB Gn, Gp…
160 Mbps 8 16 GB 64 GB
Mediation Build VoIP
40 Mbps 4 16 GB 64 GB SIP, H.248…
80 Mbps 8 16 GB 64 GB
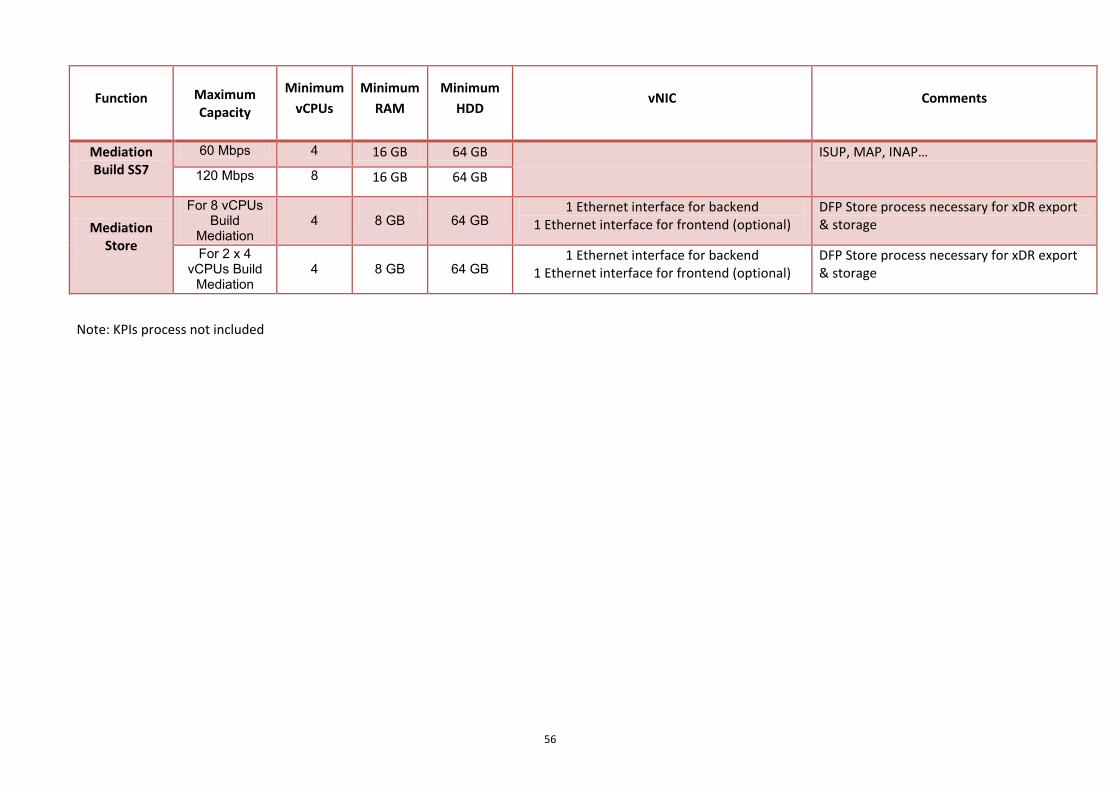
56
Function Maximum Capacity
Minimum vCPUs
Minimum RAM
Minimum HDD
vNIC Comments
Mediation Build SS7
60 Mbps 4 16 GB 64 GB ISUP, MAP, INAP… 120 Mbps 8 16 GB 64 GB
Mediation Store
For 8 vCPUs Build
Mediation
4
8 GB
64 GB
1 Ethernet interface for backend 1 Ethernet interface for frontend (optional)
DFP Store process necessary for xDR export & storage
For 2 x 4 vCPUs Build
Mediation
4
8 GB
64 GB
1 Ethernet interface for backend 1 Ethernet interface for frontend (optional)
DFP Store process necessary for xDR export & storage
Note: KPIs process not included
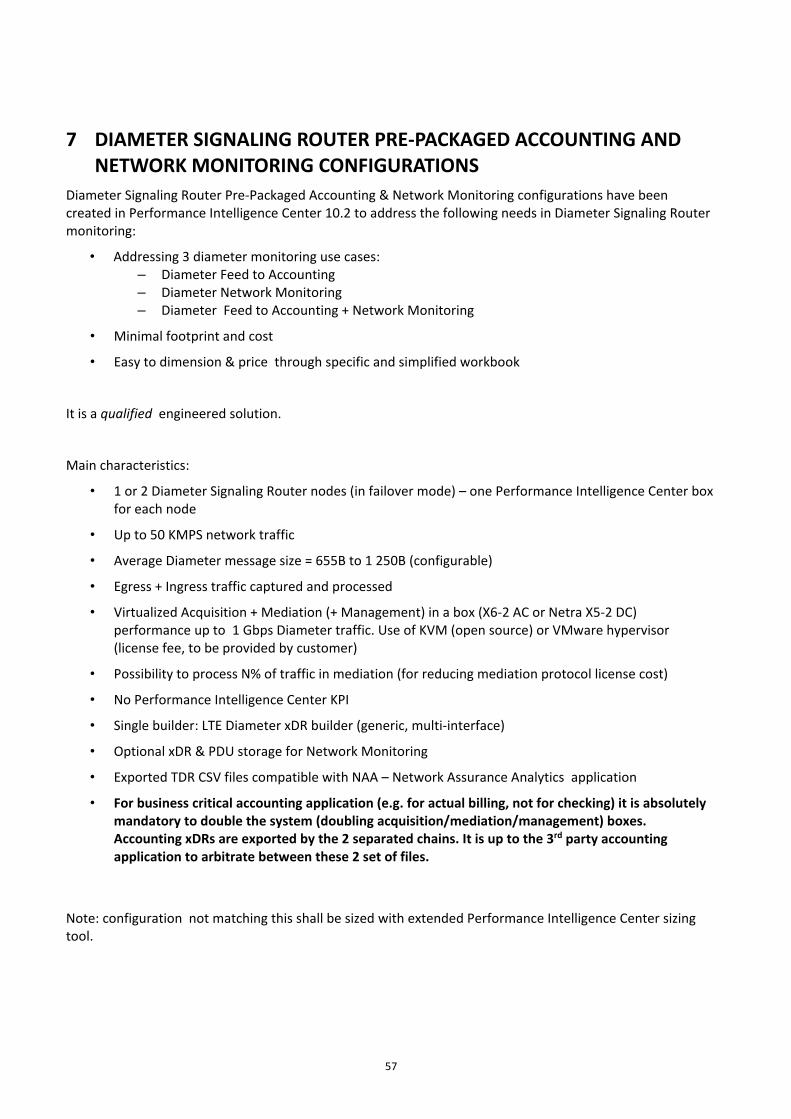
57
7 DIAMETER SIGNALING ROUTER PRE-PACKAGED ACCOUNTING AND NETWORK MONITORING CONFIGURATIONS
Diameter Signaling Router Pre-Packaged Accounting & Network Monitoring configurations have been created in Performance Intelligence Center 10.2 to address the following needs in Diameter Signaling Router monitoring:
• Addressing 3 diameter monitoring use cases: – Diameter Feed to Accounting – Diameter Network Monitoring – Diameter Feed to Accounting + Network Monitoring
• Minimal footprint and cost
• Easy to dimension & price through specific and simplified workbook
It is a qualified engineered solution.
Main characteristics:
• 1 or 2 Diameter Signaling Router nodes (in failover mode) – one Performance Intelligence Center box for each node
• Up to 50 KMPS network traffic
• Average Diameter message size = 655B to 1 250B (configurable)
• Egress + Ingress traffic captured and processed
• Virtualized Acquisition + Mediation (+ Management) in a box (X6-2 AC or Netra X5-2 DC) performance up to 1 Gbps Diameter traffic. Use of KVM (open source) or VMware hypervisor (license fee, to be provided by customer)
• Possibility to process N% of traffic in mediation (for reducing mediation protocol license cost)
• No Performance Intelligence Center KPI
• Single builder: LTE Diameter xDR builder (generic, multi-interface)
• Optional xDR & PDU storage for Network Monitoring
• Exported TDR CSV files compatible with NAA – Network Assurance Analytics application
• For business critical accounting application (e.g. for actual billing, not for checking) it is absolutely mandatory to double the system (doubling acquisition/mediation/management) boxes. Accounting xDRs are exported by the 2 separated chains. It is up to the 3rd party accounting application to arbitrate between these 2 set of files.
Note: configuration not matching this shall be sized with extended Performance Intelligence Center sizing tool.
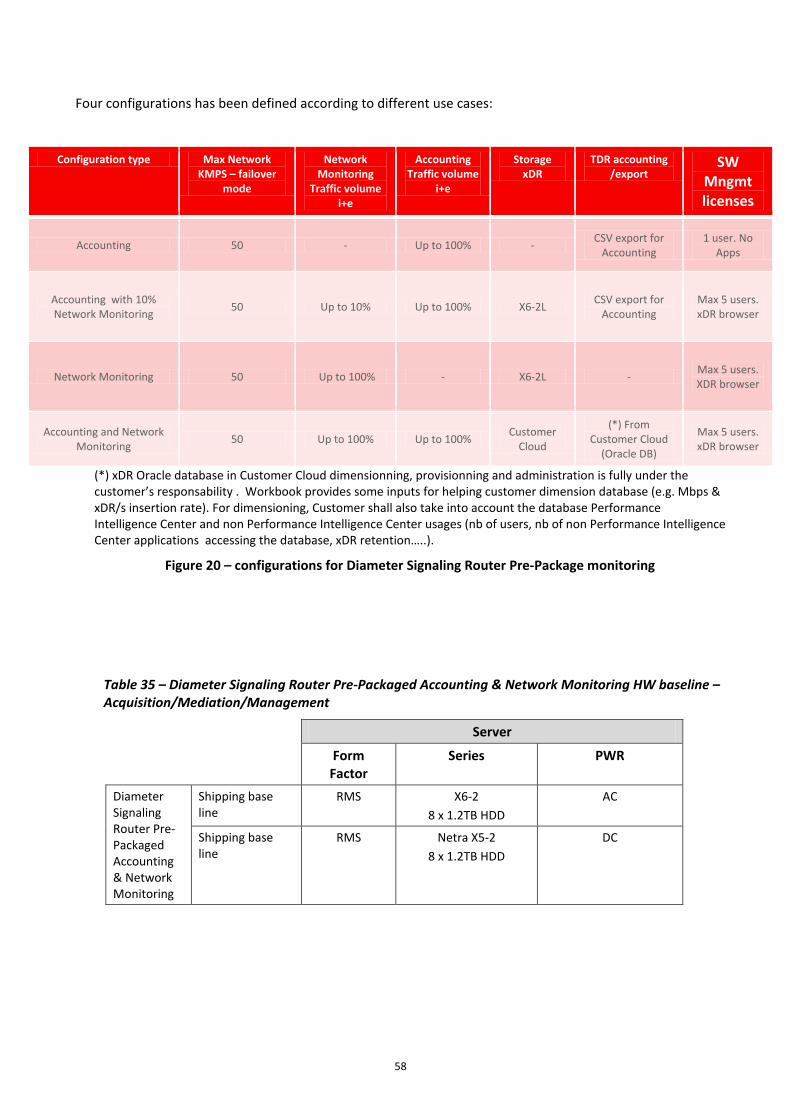
58
Four configurations has been defined according to different use cases:
Configuration type Max Network KMPS – failover
mode
Network Monitoring
Traffic volume i+e
Accounting Traffic volume
i+e
Storage xDR
TDR accounting /export
SW Mngmt licenses
Accounting 50 - Up to 100% - CSV export for Accounting
1 user. No Apps
Accounting with 10% Network Monitoring 50 Up to 10% Up to 100% X6-2L CSV export for
Accounting Max 5 users. xDR browser
Network Monitoring 50 Up to 100% - X6-2L - Max 5 users. XDR browser
Accounting and Network Monitoring 50 Up to 100% Up to 100% Customer
Cloud
(*) From Customer Cloud
(Oracle DB)
Max 5 users. xDR browser
(*) xDR Oracle database in Customer Cloud dimensionning, provisionning and administration is fully under the customer’s responsability . Workbook provides some inputs for helping customer dimension database (e.g. Mbps & xDR/s insertion rate). For dimensioning, Customer shall also take into account the database Performance Intelligence Center and non Performance Intelligence Center usages (nb of users, nb of non Performance Intelligence Center applications accessing the database, xDR retention…..).
Figure 20 – configurations for Diameter Signaling Router Pre-Package monitoring
Table 35 – Diameter Signaling Router Pre-Packaged Accounting & Network Monitoring HW baseline – Acquisition/Mediation/Management
Server
Form Factor
Series PWR
Diameter Signaling Router Pre-Packaged Accounting & Network Monitoring
Shipping base line
RMS X6-2 8 x 1.2TB HDD
AC
Shipping base line
RMS Netra X5-2 8 x 1.2TB HDD
DC
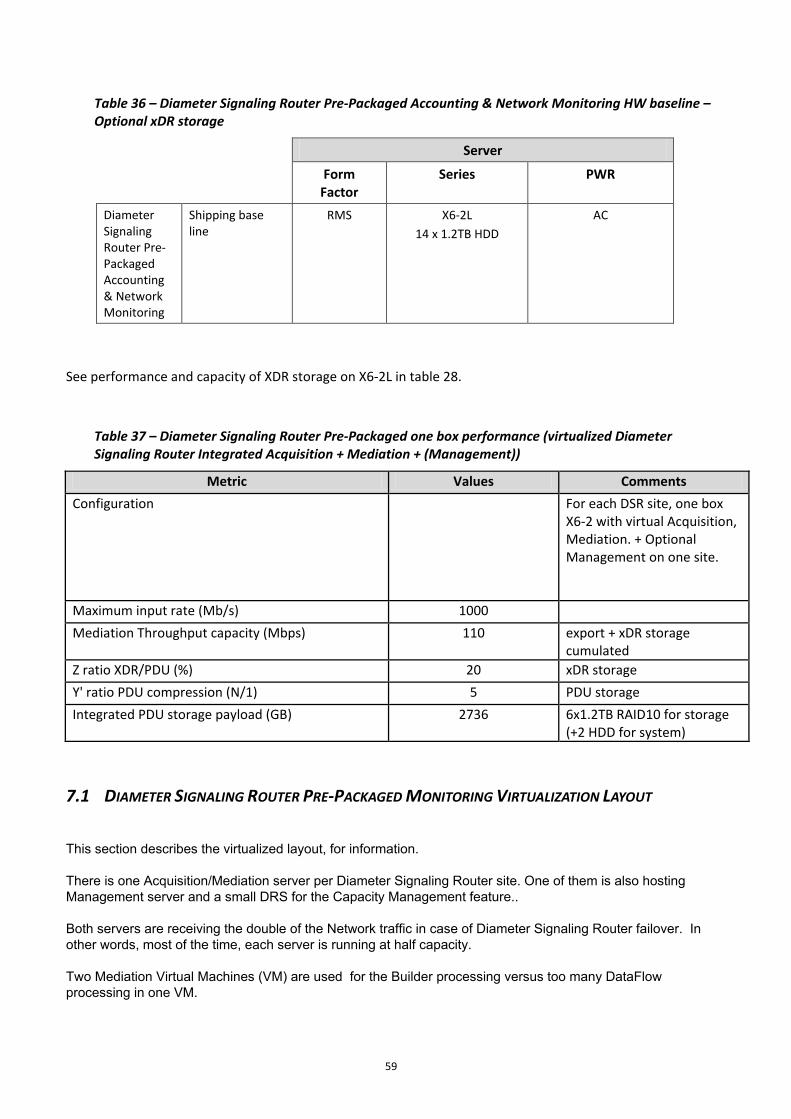
59
Table 36 – Diameter Signaling Router Pre-Packaged Accounting & Network Monitoring HW baseline – Optional xDR storage
See performance and capacity of XDR storage on X6-2L in table 28.
Table 37 – Diameter Signaling Router Pre-Packaged one box performance (virtualized Diameter Signaling Router Integrated Acquisition + Mediation + (Management))
Metric Values Comments Configuration For each DSR site, one box
X6-2 with virtual Acquisition, Mediation. + Optional Management on one site.
Maximum input rate (Mb/s) 1000 Mediation Throughput capacity (Mbps) 110 export + xDR storage
cumulated Z ratio XDR/PDU (%) 20 xDR storage Y' ratio PDU compression (N/1) 5 PDU storage Integrated PDU storage payload (GB) 2736 6x1.2TB RAID10 for storage
(+2 HDD for system)
7.1 DIAMETER SIGNALING ROUTER PRE-PACKAGED MONITORING VIRTUALIZATION LAYOUT
This section describes the virtualized layout, for information. There is one Acquisition/Mediation server per Diameter Signaling Router site. One of them is also hosting Management server and a small DRS for the Capacity Management feature.. Both servers are receiving the double of the Network traffic in case of Diameter Signaling Router failover. In other words, most of the time, each server is running at half capacity. Two Mediation Virtual Machines (VM) are used for the Builder processing versus too many DataFlow processing in one VM.
Server
Form Factor
Series PWR
Diameter Signaling Router Pre-Packaged Accounting & Network Monitoring
Shipping base line
RMS X6-2L 14 x 1.2TB HDD
AC
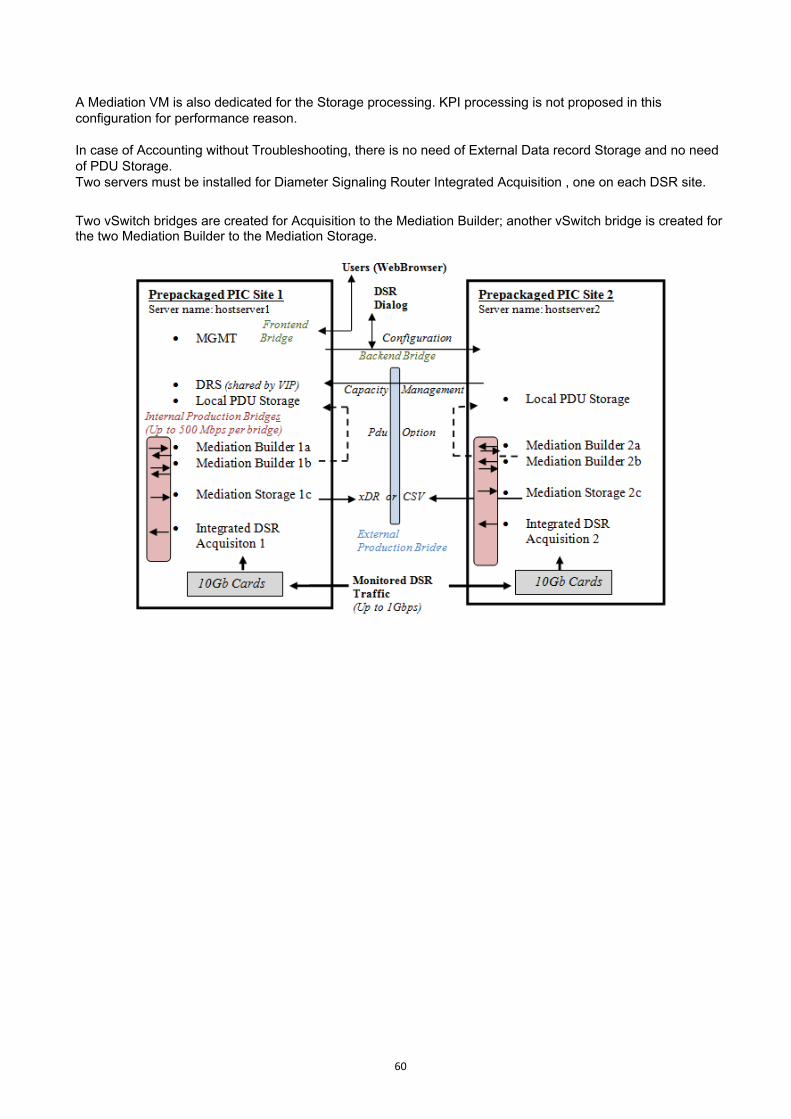
60
A Mediation VM is also dedicated for the Storage processing. KPI processing is not proposed in this configuration for performance reason. In case of Accounting without Troubleshooting, there is no need of External Data record Storage and no need of PDU Storage. Two servers must be installed for Diameter Signaling Router Integrated Acquisition , one on each DSR site.
Two vSwitch bridges are created for Acquisition to the Mediation Builder; another vSwitch bridge is created for the two Mediation Builder to the Mediation Storage.
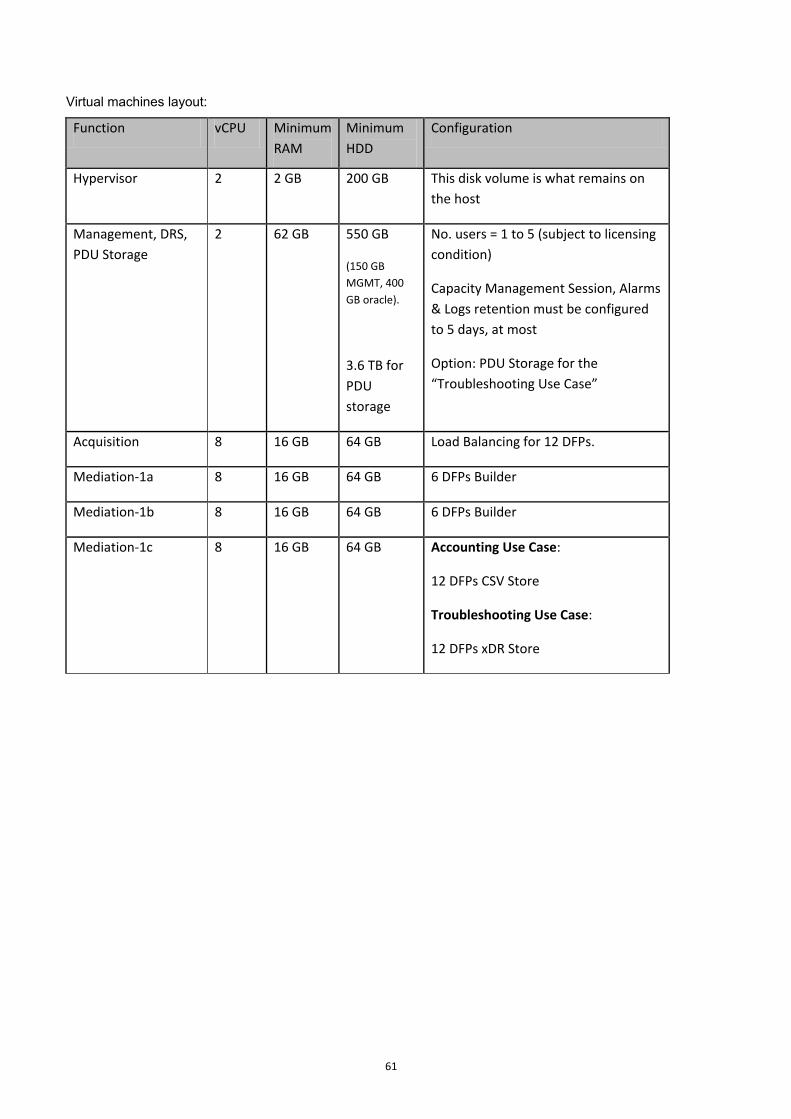
61
Virtual machines layout:
Function vCPU Minimum RAM
Minimum HDD
Configuration
Hypervisor 2 2 GB 200 GB This disk volume is what remains on the host
Management, DRS, PDU Storage
2 62 GB 550 GB
(150 GB MGMT, 400 GB oracle).
3.6 TB for PDU storage
No. users = 1 to 5 (subject to licensing condition)
Capacity Management Session, Alarms & Logs retention must be configured to 5 days, at most
Option: PDU Storage for the “Troubleshooting Use Case”
Acquisition 8 16 GB 64 GB Load Balancing for 12 DFPs.
Mediation-1a 8 16 GB 64 GB 6 DFPs Builder
Mediation-1b 8 16 GB 64 GB 6 DFPs Builder
Mediation-1c 8 16 GB 64 GB Accounting Use Case:
12 DFPs CSV Store
Troubleshooting Use Case:
12 DFPs xDR Store
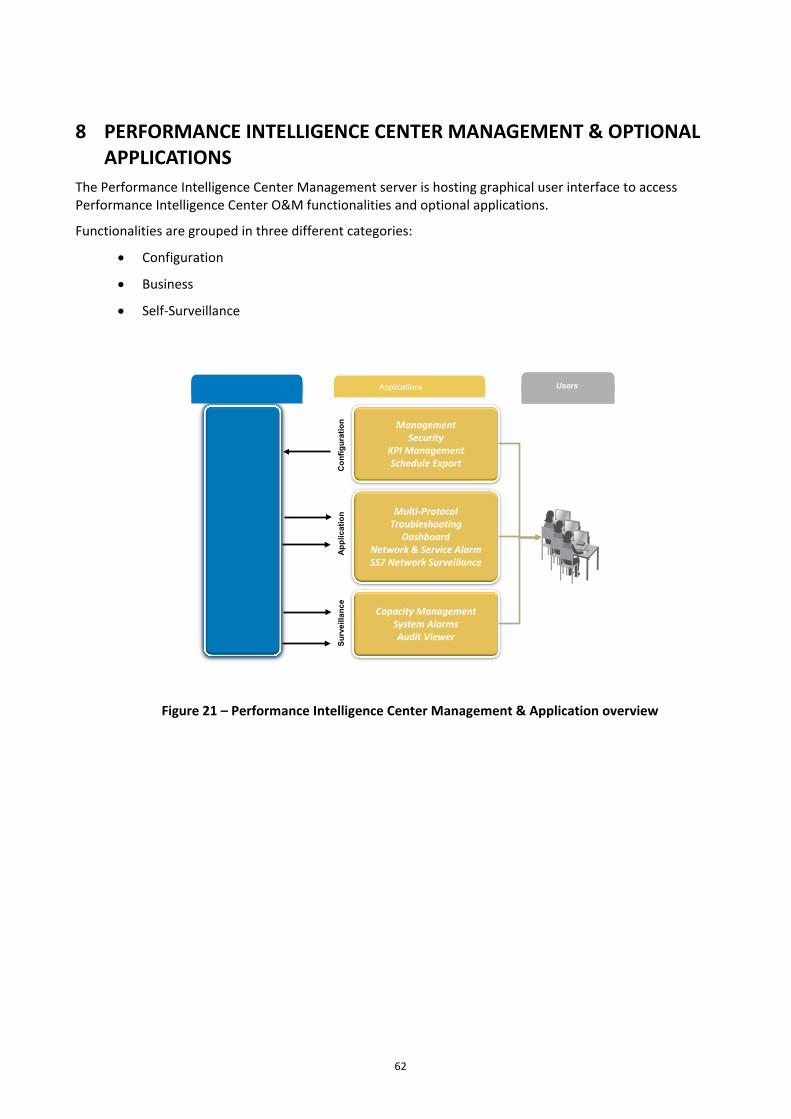
62
8 PERFORMANCE INTELLIGENCE CENTER MANAGEMENT & OPTIONAL APPLICATIONS
The Performance Intelligence Center Management server is hosting graphical user interface to access Performance Intelligence Center O&M functionalities and optional applications.
Functionalities are grouped in three different categories:
• Configuration
• Business
• Self-Surveillance
ManagementSecurity
KPI ManagementSchedule Export
Multi-Protocol Troubleshooting
DashboardNetwork & Service AlarmSS7 Network Surveillance
Capacity ManagementSystem AlarmsAudit Viewer
Applications Users
Con
figur
atio
nAp
plic
atio
nSu
rvei
llanc
e
Figure 21 – Performance Intelligence Center Management & Application overview
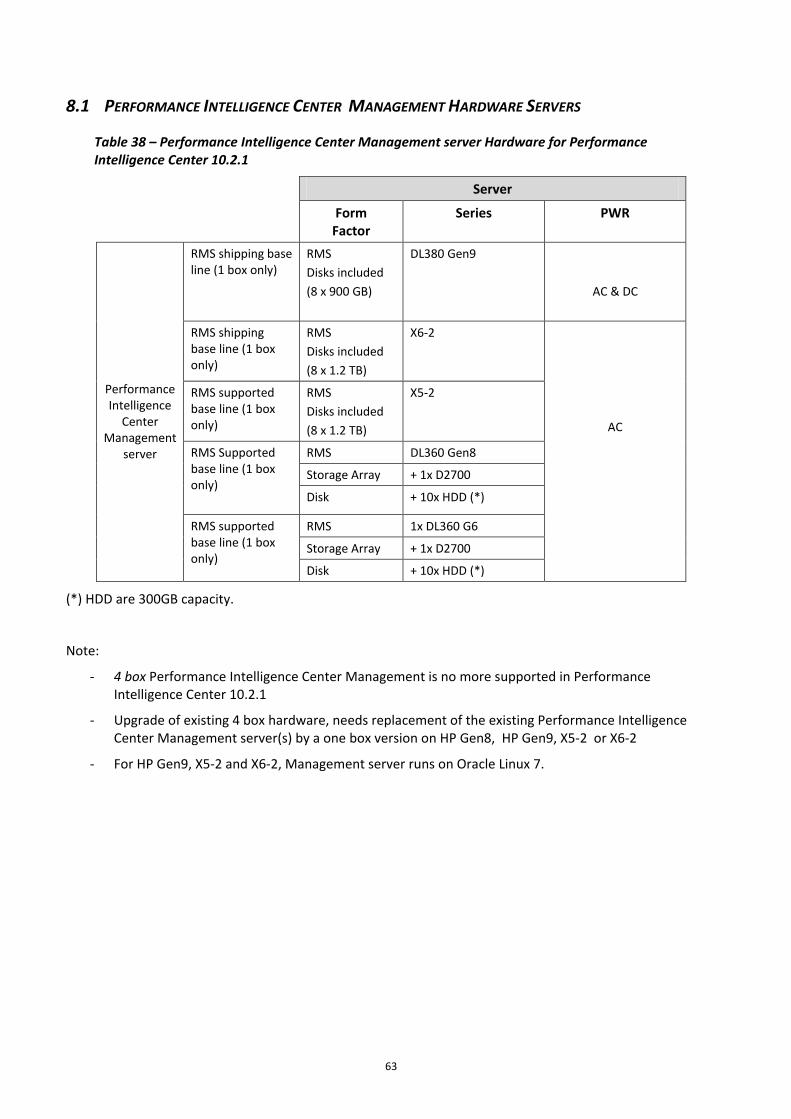
63
8.1 PERFORMANCE INTELLIGENCE CENTER MANAGEMENT HARDWARE SERVERS
Table 38 – Performance Intelligence Center Management server Hardware for Performance Intelligence Center 10.2.1
Server
Form Factor
Series PWR
Performance Intelligence
Center Management
server
RMS shipping base line (1 box only)
RMS Disks included (8 x 900 GB)
DL380 Gen9
AC & DC
RMS shipping base line (1 box only)
RMS Disks included (8 x 1.2 TB)
X6-2
AC
RMS supported base line (1 box only)
RMS Disks included (8 x 1.2 TB)
X5-2
RMS Supported base line (1 box only)
RMS DL360 Gen8
Storage Array + 1x D2700
Disk + 10x HDD (*)
RMS supported base line (1 box only)
RMS 1x DL360 G6
Storage Array + 1x D2700
Disk + 10x HDD (*)
(*) HDD are 300GB capacity.
Note:
- 4 box Performance Intelligence Center Management is no more supported in Performance Intelligence Center 10.2.1
- Upgrade of existing 4 box hardware, needs replacement of the existing Performance Intelligence Center Management server(s) by a one box version on HP Gen8, HP Gen9, X5-2 or X6-2
- For HP Gen9, X5-2 and X6-2, Management server runs on Oracle Linux 7.
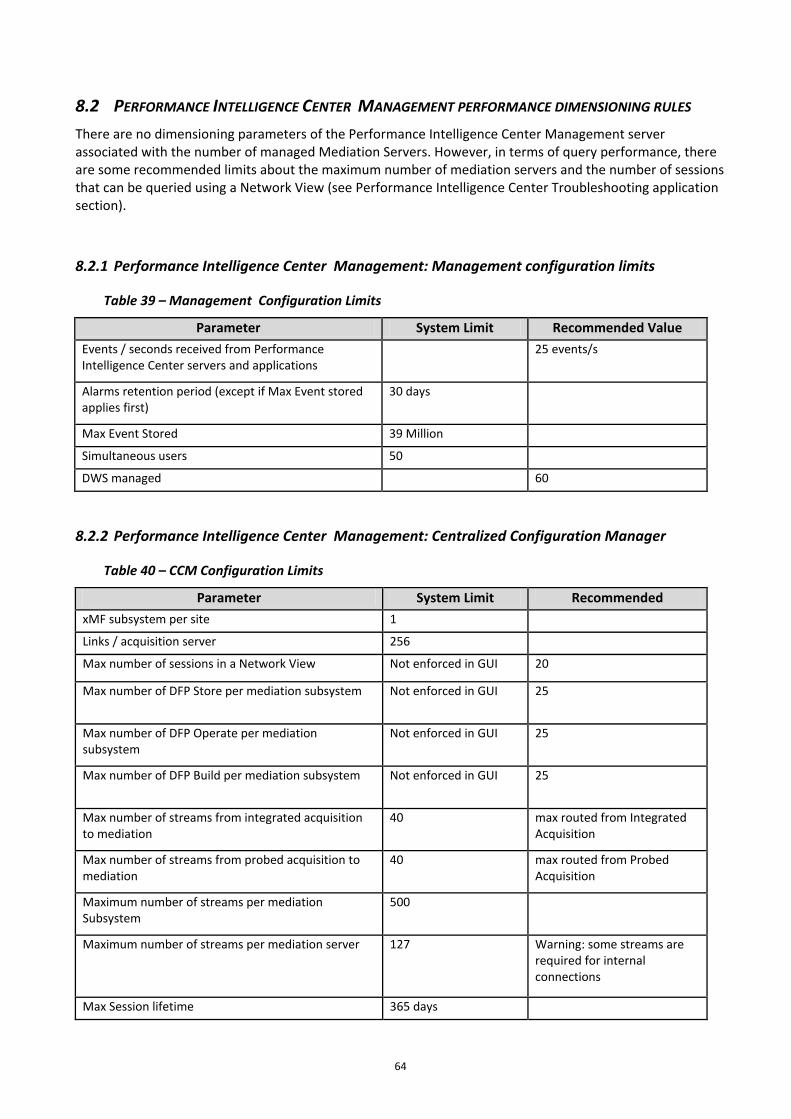
64
8.2 PERFORMANCE INTELLIGENCE CENTER MANAGEMENT PERFORMANCE DIMENSIONING RULES There are no dimensioning parameters of the Performance Intelligence Center Management server associated with the number of managed Mediation Servers. However, in terms of query performance, there are some recommended limits about the maximum number of mediation servers and the number of sessions that can be queried using a Network View (see Performance Intelligence Center Troubleshooting application section).
8.2.1 Performance Intelligence Center Management: Management configuration limits
Table 39 – Management Configuration Limits
Parameter System Limit Recommended Value Events / seconds received from Performance Intelligence Center servers and applications
25 events/s
Alarms retention period (except if Max Event stored applies first)
30 days
Max Event Stored 39 Million
Simultaneous users 50
DWS managed 60
8.2.2 Performance Intelligence Center Management: Centralized Configuration Manager
Table 40 – CCM Configuration Limits
Parameter System Limit Recommended xMF subsystem per site 1
Links / acquisition server 256
Max number of sessions in a Network View Not enforced in GUI 20
Max number of DFP Store per mediation subsystem Not enforced in GUI 25
Max number of DFP Operate per mediation subsystem
Not enforced in GUI 25
Max number of DFP Build per mediation subsystem Not enforced in GUI 25
Max number of streams from integrated acquisition to mediation
40 max routed from Integrated Acquisition
Max number of streams from probed acquisition to mediation
40 max routed from Probed Acquisition
Maximum number of streams per mediation Subsystem
500
Maximum number of streams per mediation server 127 Warning: some streams are required for internal connections
Max Session lifetime 365 days
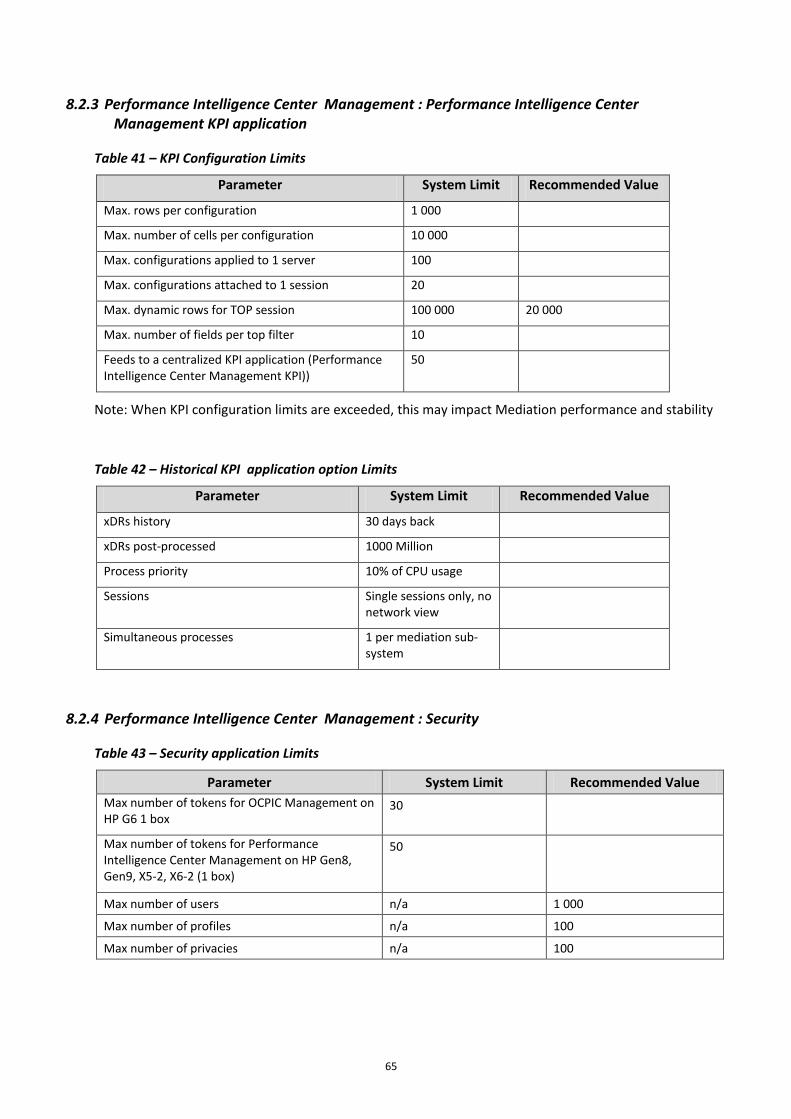
65
8.2.3 Performance Intelligence Center Management : Performance Intelligence Center Management KPI application
Table 41 – KPI Configuration Limits
Parameter System Limit Recommended Value
Max. rows per configuration 1 000
Max. number of cells per configuration 10 000
Max. configurations applied to 1 server 100
Max. configurations attached to 1 session 20
Max. dynamic rows for TOP session 100 000 20 000
Max. number of fields per top filter 10
Feeds to a centralized KPI application (Performance Intelligence Center Management KPI))
50
Note: When KPI configuration limits are exceeded, this may impact Mediation performance and stability
Table 42 – Historical KPI application option Limits
Parameter System Limit Recommended Value
xDRs history 30 days back
xDRs post-processed 1000 Million
Process priority 10% of CPU usage
Sessions Single sessions only, no network view
Simultaneous processes 1 per mediation sub-system
8.2.4 Performance Intelligence Center Management : Security
Table 43 – Security application Limits
Parameter System Limit Recommended Value Max number of tokens for OCPIC Management on HP G6 1 box
30
Max number of tokens for Performance Intelligence Center Management on HP Gen8, Gen9, X5-2, X6-2 (1 box)
50
Max number of users n/a 1 000
Max number of profiles n/a 100
Max number of privacies n/a 100
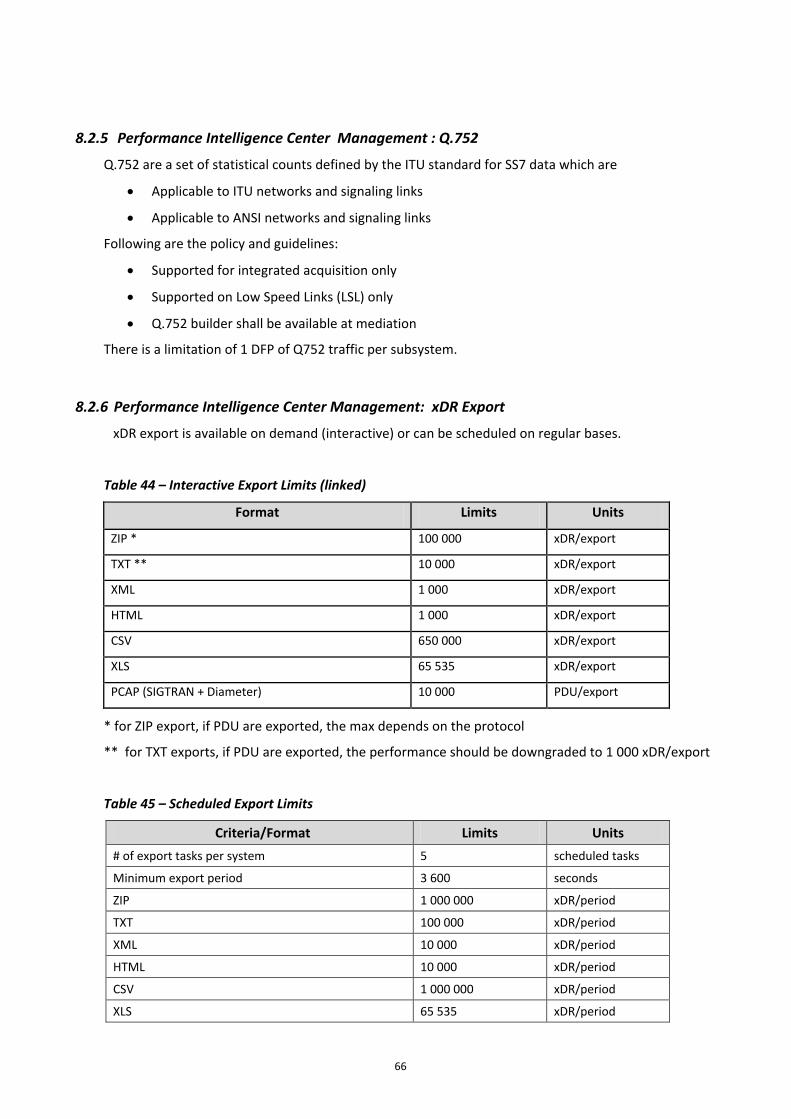
66
8.2.5 Performance Intelligence Center Management : Q.752
Q.752 are a set of statistical counts defined by the ITU standard for SS7 data which are
• Applicable to ITU networks and signaling links
• Applicable to ANSI networks and signaling links
Following are the policy and guidelines:
• Supported for integrated acquisition only
• Supported on Low Speed Links (LSL) only
• Q.752 builder shall be available at mediation
There is a limitation of 1 DFP of Q752 traffic per subsystem.
8.2.6 Performance Intelligence Center Management: xDR Export
xDR export is available on demand (interactive) or can be scheduled on regular bases.
Table 44 – Interactive Export Limits (linked)
Format Limits Units
ZIP * 100 000 xDR/export
TXT ** 10 000 xDR/export
XML 1 000 xDR/export
HTML 1 000 xDR/export
CSV 650 000 xDR/export
XLS 65 535 xDR/export
PCAP (SIGTRAN + Diameter) 10 000 PDU/export
* for ZIP export, if PDU are exported, the max depends on the protocol
** for TXT exports, if PDU are exported, the performance should be downgraded to 1 000 xDR/export
Table 45 – Scheduled Export Limits
Criteria/Format Limits Units # of export tasks per system 5 scheduled tasks
Minimum export period 3 600 seconds
ZIP 1 000 000 xDR/period
TXT 100 000 xDR/period
XML 10 000 xDR/period
HTML 10 000 xDR/period
CSV 1 000 000 xDR/period
XLS 65 535 xDR/period
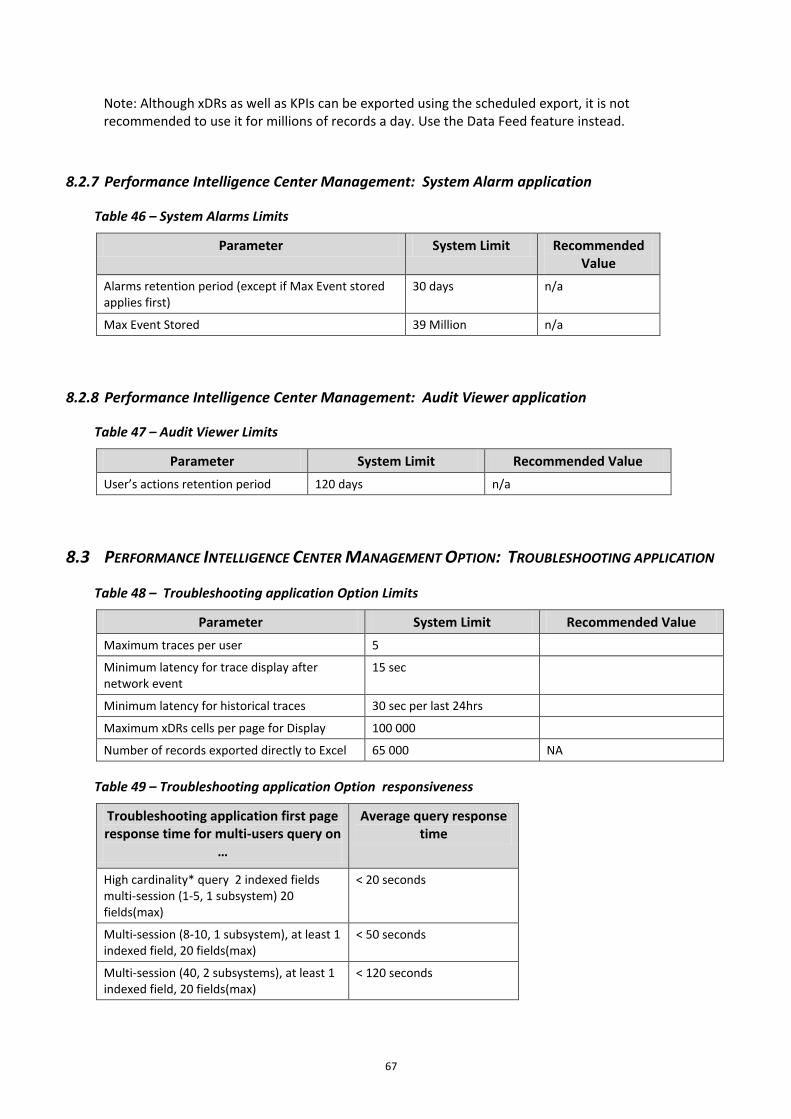
67
Note: Although xDRs as well as KPIs can be exported using the scheduled export, it is not recommended to use it for millions of records a day. Use the Data Feed feature instead.
8.2.7 Performance Intelligence Center Management: System Alarm application
Table 46 – System Alarms Limits
Parameter System Limit Recommended Value
Alarms retention period (except if Max Event stored applies first)
30 days n/a
Max Event Stored 39 Million n/a
8.2.8 Performance Intelligence Center Management: Audit Viewer application
Table 47 – Audit Viewer Limits
Parameter System Limit Recommended Value User’s actions retention period 120 days n/a
8.3 PERFORMANCE INTELLIGENCE CENTER MANAGEMENT OPTION: TROUBLESHOOTING APPLICATION
Table 48 – Troubleshooting application Option Limits
Parameter System Limit Recommended Value Maximum traces per user 5
Minimum latency for trace display after network event
15 sec
Minimum latency for historical traces 30 sec per last 24hrs
Maximum xDRs cells per page for Display 100 000
Number of records exported directly to Excel 65 000 NA
Table 49 – Troubleshooting application Option responsiveness
Troubleshooting application first page response time for multi-users query on
…
Average query response time
High cardinality* query 2 indexed fields multi-session (1-5, 1 subsystem) 20 fields(max)
< 20 seconds
Multi-session (8-10, 1 subsystem), at least 1 indexed field, 20 fields(max)
< 50 seconds
Multi-session (40, 2 subsystems), at least 1 indexed field, 20 fields(max)
< 120 seconds
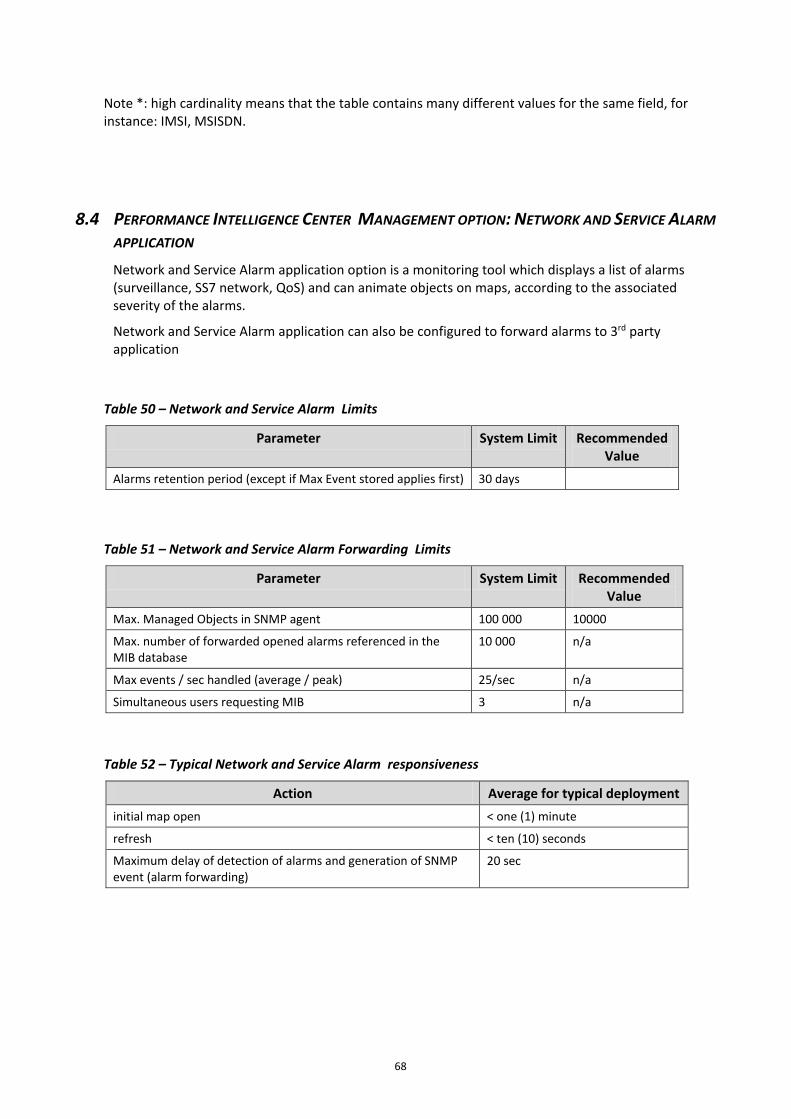
68
Note *: high cardinality means that the table contains many different values for the same field, for instance: IMSI, MSISDN.
8.4 PERFORMANCE INTELLIGENCE CENTER MANAGEMENT OPTION: NETWORK AND SERVICE ALARM APPLICATION Network and Service Alarm application option is a monitoring tool which displays a list of alarms (surveillance, SS7 network, QoS) and can animate objects on maps, according to the associated severity of the alarms.
Network and Service Alarm application can also be configured to forward alarms to 3rd party application
Table 50 – Network and Service Alarm Limits
Parameter System Limit Recommended Value
Alarms retention period (except if Max Event stored applies first) 30 days
Table 51 – Network and Service Alarm Forwarding Limits
Parameter System Limit Recommended Value
Max. Managed Objects in SNMP agent 100 000 10000
Max. number of forwarded opened alarms referenced in the MIB database
10 000 n/a
Max events / sec handled (average / peak) 25/sec n/a
Simultaneous users requesting MIB 3 n/a
Table 52 – Typical Network and Service Alarm responsiveness
Action Average for typical deployment initial map open < one (1) minute
refresh < ten (10) seconds
Maximum delay of detection of alarms and generation of SNMP event (alarm forwarding)
20 sec
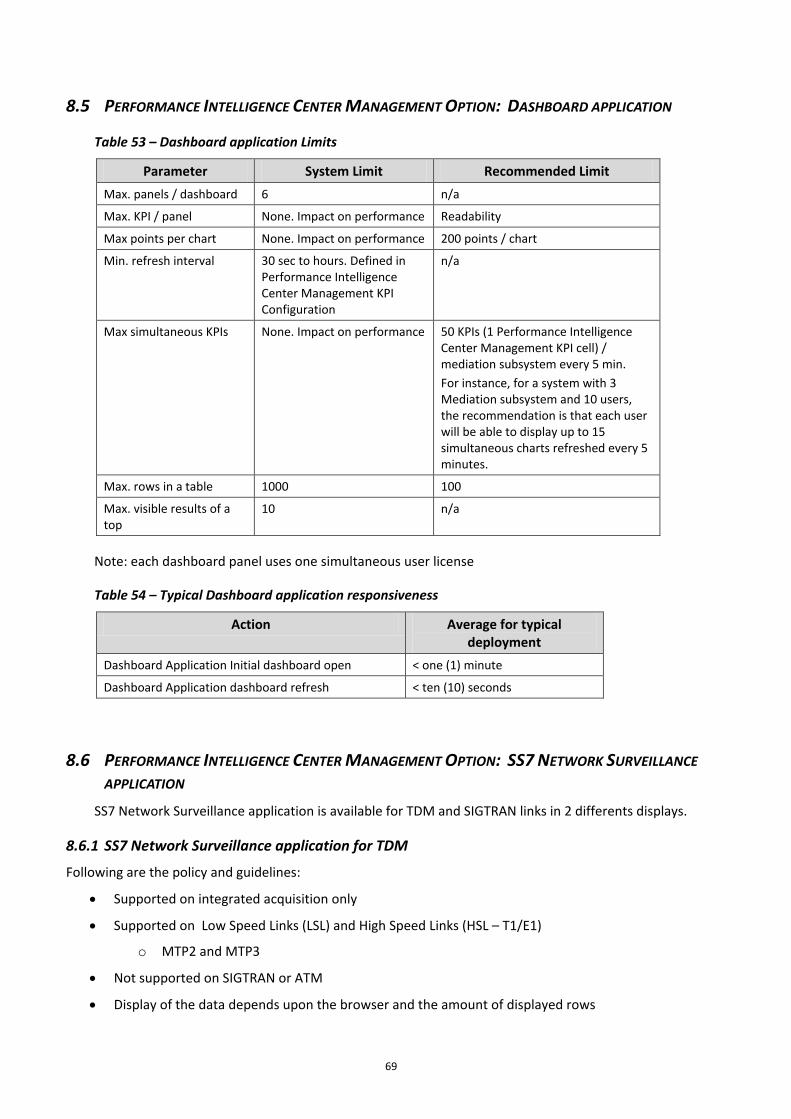
69
8.5 PERFORMANCE INTELLIGENCE CENTER MANAGEMENT OPTION: DASHBOARD APPLICATION
Table 53 – Dashboard application Limits
Parameter System Limit Recommended Limit Max. panels / dashboard 6 n/a
Max. KPI / panel None. Impact on performance Readability
Max points per chart None. Impact on performance 200 points / chart
Min. refresh interval 30 sec to hours. Defined in Performance Intelligence Center Management KPI Configuration
n/a
Max simultaneous KPIs None. Impact on performance 50 KPIs (1 Performance Intelligence Center Management KPI cell) / mediation subsystem every 5 min. For instance, for a system with 3 Mediation subsystem and 10 users, the recommendation is that each user will be able to display up to 15 simultaneous charts refreshed every 5 minutes.
Max. rows in a table 1000 100
Max. visible results of a top
10 n/a
Note: each dashboard panel uses one simultaneous user license
Table 54 – Typical Dashboard application responsiveness
Action Average for typical deployment
Dashboard Application Initial dashboard open < one (1) minute
Dashboard Application dashboard refresh < ten (10) seconds
8.6 PERFORMANCE INTELLIGENCE CENTER MANAGEMENT OPTION: SS7 NETWORK SURVEILLANCE APPLICATION
SS7 Network Surveillance application is available for TDM and SIGTRAN links in 2 differents displays.
8.6.1 SS7 Network Surveillance application for TDM
Following are the policy and guidelines:
• Supported on integrated acquisition only
• Supported on Low Speed Links (LSL) and High Speed Links (HSL – T1/E1)
o MTP2 and MTP3
• Not supported on SIGTRAN or ATM
• Display of the data depends upon the browser and the amount of displayed rows
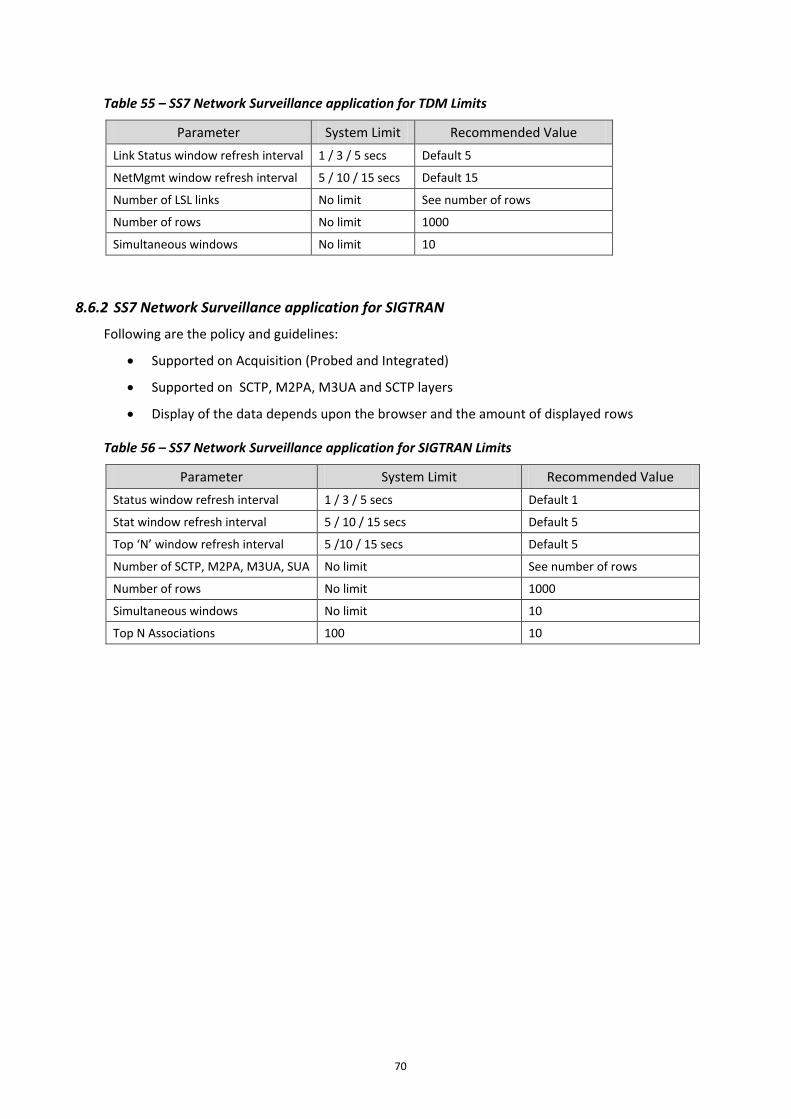
70
Table 55 – SS7 Network Surveillance application for TDM Limits
Parameter System Limit Recommended Value Link Status window refresh interval 1 / 3 / 5 secs Default 5
NetMgmt window refresh interval 5 / 10 / 15 secs Default 15
Number of LSL links No limit See number of rows
Number of rows No limit 1000
Simultaneous windows No limit 10
8.6.2 SS7 Network Surveillance application for SIGTRAN
Following are the policy and guidelines:
• Supported on Acquisition (Probed and Integrated)
• Supported on SCTP, M2PA, M3UA and SCTP layers
• Display of the data depends upon the browser and the amount of displayed rows
Table 56 – SS7 Network Surveillance application for SIGTRAN Limits
Parameter System Limit Recommended Value Status window refresh interval 1 / 3 / 5 secs Default 1
Stat window refresh interval 5 / 10 / 15 secs Default 5
Top ‘N’ window refresh interval 5 /10 / 15 secs Default 5
Number of SCTP, M2PA, M3UA, SUA No limit See number of rows
Number of rows No limit 1000
Simultaneous windows No limit 10
Top N Associations 100 10
71
9 NETWORK REQUIREMENTS This chapter contains information to help answer IT requests. It contains information on:
• Bandwidth requirements
• IP addresses requirements
9.1 BANDWIDTH REQUIREMENTS
9.1.1 Performance Intelligence Center Management server to Workstation
The MINIMUM requirements for a network are:
1 Mb/s per simultaneous user between the Performance Intelligence Center Management server and the user workstation
Less than 250ms round trip delay (50 ms recommended). From workstation to Server and server to Mediation.
Note: 250 ms round trip delay can impact some applications that require a query/response mechanism that normally occurs on a LAN network, however some response time can be higher than on a normal LAN.
9.1.2 Performance Intelligence Center Mediation server to Performance Intelligence Center management server
1 Mb/s per simultaneous user between the Performance Intelligence Center Management server (NSP) and the Mediation subsystem
9.1.3 Acquisition (Integrated or Probed) server to Mediation
The bandwidth between Acquisition and Mediation depends on the traffic. It is calculated based on customer’s assumptions. Please note that there is a traffic overhead from Acquisition server to Mediation server due to transport protocol headers. In some case it can be up to the double. Detailed values of bandwidth can be found as an output of the sizer.
When Q752 is activated, the MSUs have to be sent twice, thus doubling the traffic.
Warning: Network connections are relying on TCP protocol to provide high reliability. Even if TCP implementation on probes is optimized for high speed and potentially high latency network, embedded TCP congestion avoidance mechanisms (present in all TCP code), may limit the bandwidth. Whatever is the network capacity, the achieved bandwidth performance on a TCP session can be much lower than expected, specifically with high packet loss probability. So to achieve high transmission performance between the probe and the mediation, it is mandatory to control network QOS to optimize the TCP max bandwidth. A fair assumption of the theoretical TCP bandwidth capacity can be defined using following formula:
Max TCP bandwidth = MSS / (RTT x SQRT (PLP))
• MSS: Max Segment Size (of TCP)
• RTT: Round Trip Time
• PLP: Packet Loss Probability

72
Formula shall be used during to get an indication of the network QoS requirements to customer to insure a safe implementation of the Performance Intelligence Center components.
For instance, to achieve 300 Mbps probe output bandwidth on Probed Acquisition, application of the formula gives the following customer network QoS requirement (MSS is typically 1460 bytes on Ethernet):
• RTT shall be less than 100 msec
• PLP shall be less than 10-7
Important note: long distance (eg. intercontinental) between Acquisition and Mediation is prohibited. It that case, it is imperative Acquisition and Mediation servers be collocated at the same location.
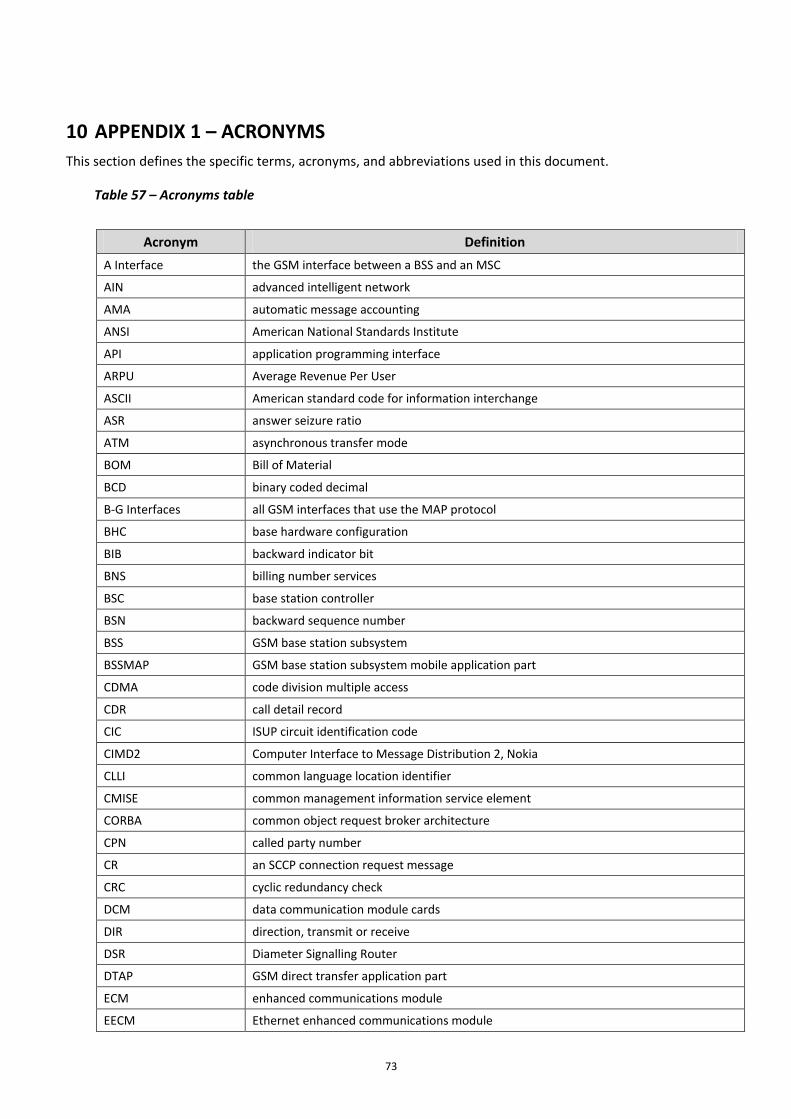
73
10 APPENDIX 1 – ACRONYMS This section defines the specific terms, acronyms, and abbreviations used in this document.
Table 57 – Acronyms table
Acronym Definition
A Interface the GSM interface between a BSS and an MSC
AIN advanced intelligent network
AMA automatic message accounting
ANSI American National Standards Institute
API application programming interface
ARPU Average Revenue Per User
ASCII American standard code for information interchange
ASR answer seizure ratio
ATM asynchronous transfer mode
BOM Bill of Material
BCD binary coded decimal
B-G Interfaces all GSM interfaces that use the MAP protocol
BHC base hardware configuration
BIB backward indicator bit
BNS billing number services
BSC base station controller
BSN backward sequence number
BSS GSM base station subsystem
BSSMAP GSM base station subsystem mobile application part
CDMA code division multiple access
CDR call detail record
CIC ISUP circuit identification code
CIMD2 Computer Interface to Message Distribution 2, Nokia
CLLI common language location identifier
CMISE common management information service element
CORBA common object request broker architecture
CPN called party number
CR an SCCP connection request message
CRC cyclic redundancy check
DCM data communication module cards
DIR direction, transmit or receive
DSR Diameter Signalling Router
DTAP GSM direct transfer application part
ECM enhanced communications module
EECM Ethernet enhanced communications module
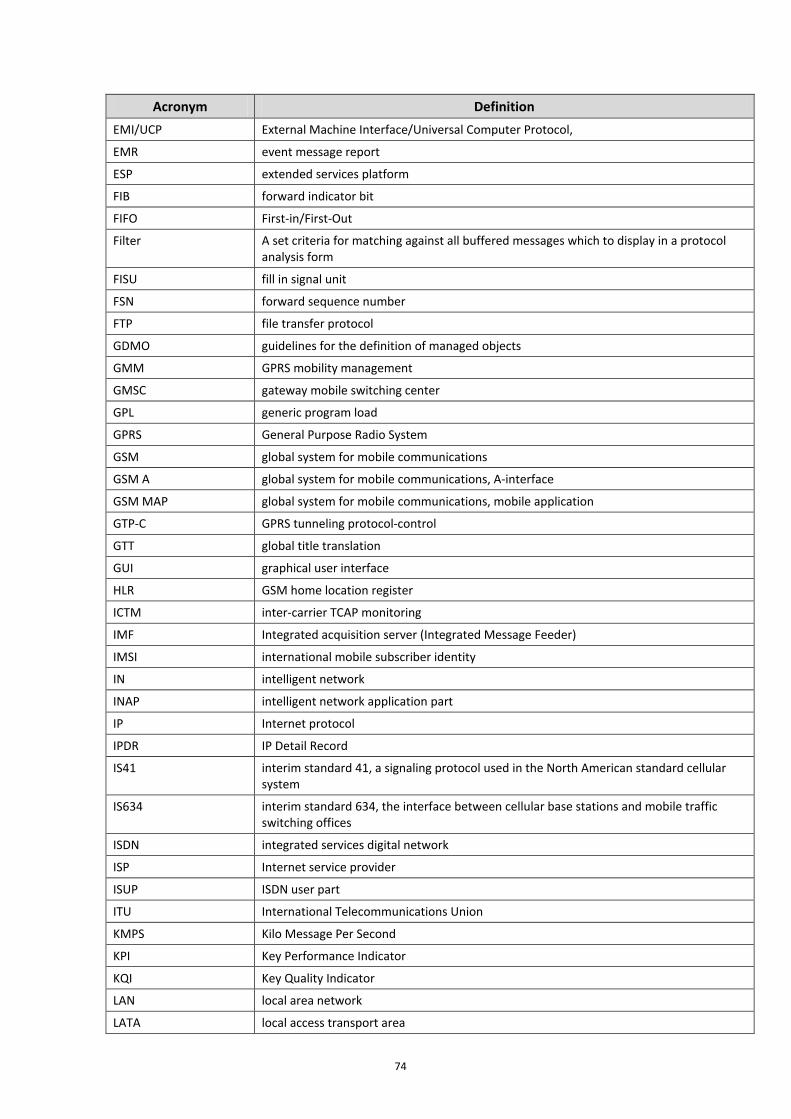
74
Acronym Definition EMI/UCP External Machine Interface/Universal Computer Protocol,
EMR event message report
ESP extended services platform
FIB forward indicator bit
FIFO First-in/First-Out
Filter A set criteria for matching against all buffered messages which to display in a protocol analysis form
FISU fill in signal unit
FSN forward sequence number
FTP file transfer protocol
GDMO guidelines for the definition of managed objects
GMM GPRS mobility management
GMSC gateway mobile switching center
GPL generic program load
GPRS General Purpose Radio System
GSM global system for mobile communications
GSM A global system for mobile communications, A-interface
GSM MAP global system for mobile communications, mobile application
GTP-C GPRS tunneling protocol-control
GTT global title translation
GUI graphical user interface
HLR GSM home location register
ICTM inter-carrier TCAP monitoring
IMF Integrated acquisition server (Integrated Message Feeder)
IMSI international mobile subscriber identity
IN intelligent network
INAP intelligent network application part
IP Internet protocol
IPDR IP Detail Record
IS41 interim standard 41, a signaling protocol used in the North American standard cellular system
IS634 interim standard 634, the interface between cellular base stations and mobile traffic switching offices
ISDN integrated services digital network
ISP Internet service provider
ISUP ISDN user part
ITU International Telecommunications Union
KMPS Kilo Message Per Second
KPI Key Performance Indicator
KQI Key Quality Indicator
LAN local area network
LATA local access transport area
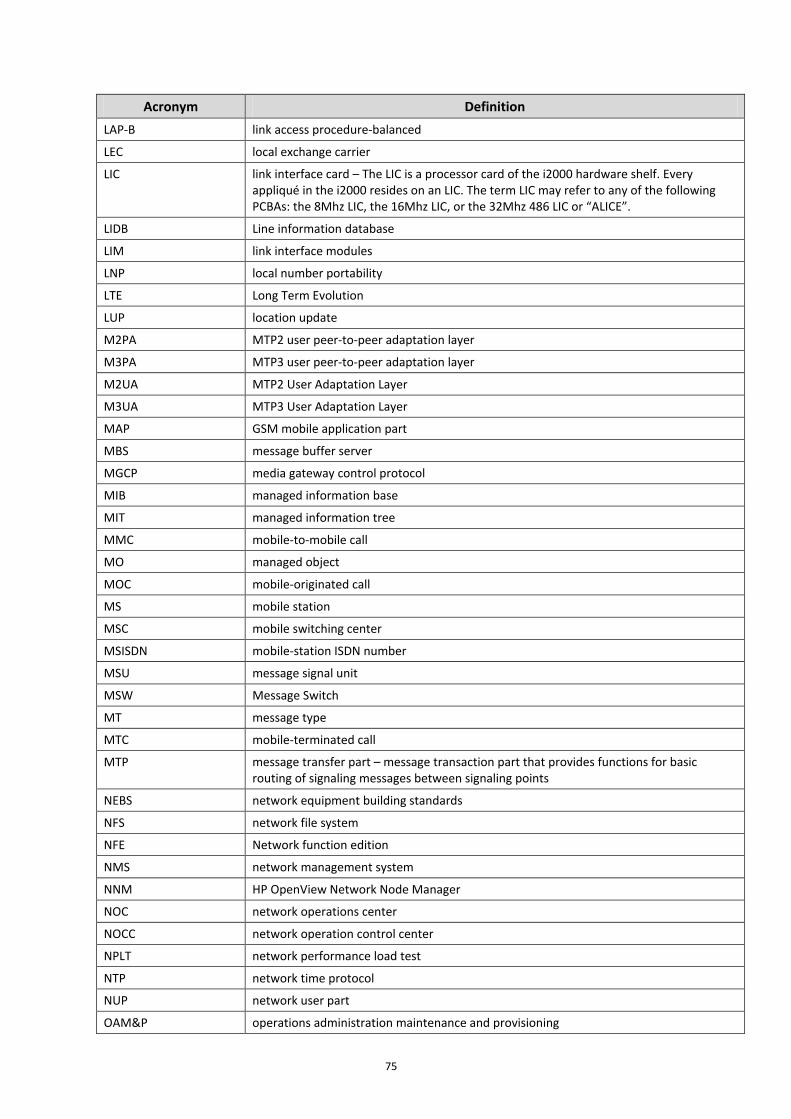
75
Acronym Definition LAP-B link access procedure-balanced
LEC local exchange carrier
LIC link interface card – The LIC is a processor card of the i2000 hardware shelf. Every appliqué in the i2000 resides on an LIC. The term LIC may refer to any of the following PCBAs: the 8Mhz LIC, the 16Mhz LIC, or the 32Mhz 486 LIC or “ALICE”.
LIDB Line information database
LIM link interface modules
LNP local number portability
LTE Long Term Evolution
LUP location update
M2PA MTP2 user peer-to-peer adaptation layer
M3PA MTP3 user peer-to-peer adaptation layer
M2UA MTP2 User Adaptation Layer
M3UA MTP3 User Adaptation Layer
MAP GSM mobile application part
MBS message buffer server
MGCP media gateway control protocol
MIB managed information base
MIT managed information tree
MMC mobile-to-mobile call
MO managed object
MOC mobile-originated call
MS mobile station
MSC mobile switching center
MSISDN mobile-station ISDN number
MSU message signal unit
MSW Message Switch
MT message type
MTC mobile-terminated call
MTP message transfer part – message transaction part that provides functions for basic routing of signaling messages between signaling points
NEBS network equipment building standards
NFS network file system
NFE Network function edition
NMS network management system
NNM HP OpenView Network Node Manager
NOC network operations center
NOCC network operation control center
NPLT network performance load test
NTP network time protocol
NUP network user part
OAM&P operations administration maintenance and provisioning
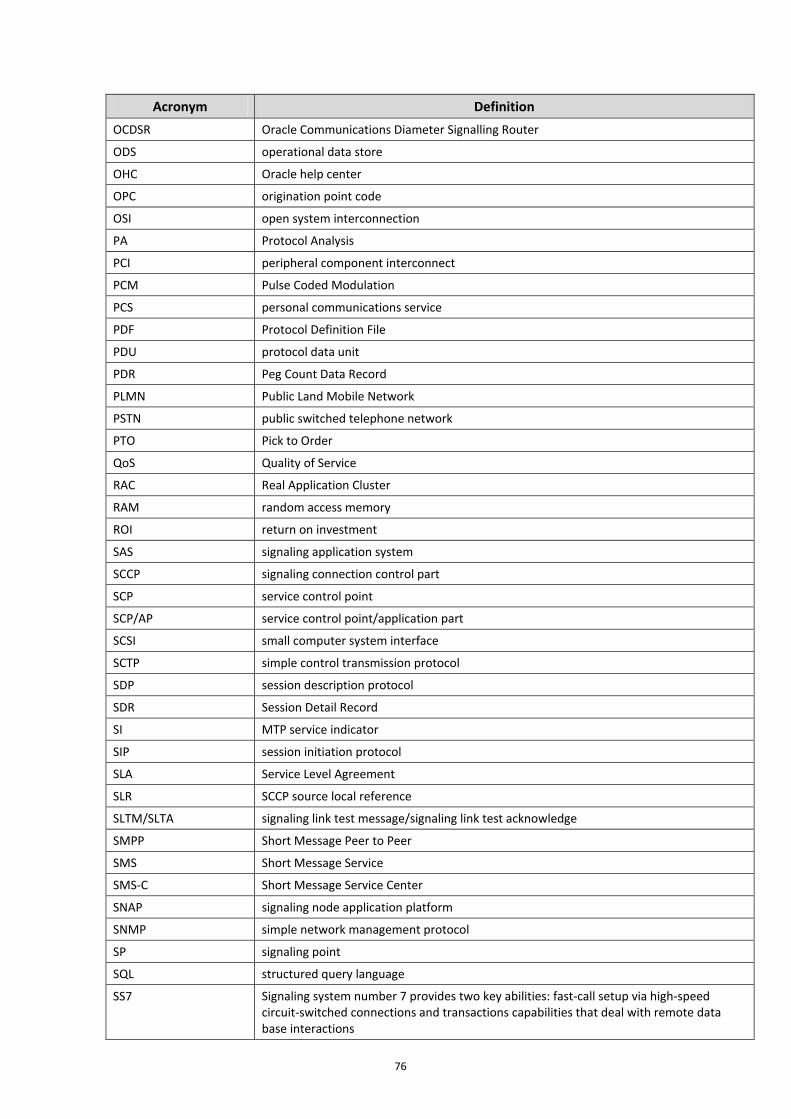
76
Acronym Definition OCDSR Oracle Communications Diameter Signalling Router
ODS operational data store
OHC Oracle help center
OPC origination point code
OSI open system interconnection
PA Protocol Analysis
PCI peripheral component interconnect
PCM Pulse Coded Modulation
PCS personal communications service
PDF Protocol Definition File
PDU protocol data unit
PDR Peg Count Data Record
PLMN Public Land Mobile Network
PSTN public switched telephone network
PTO Pick to Order
QoS Quality of Service
RAC Real Application Cluster
RAM random access memory
ROI return on investment
SAS signaling application system
SCCP signaling connection control part
SCP service control point
SCP/AP service control point/application part
SCSI small computer system interface
SCTP simple control transmission protocol
SDP session description protocol
SDR Session Detail Record
SI MTP service indicator
SIP session initiation protocol
SLA Service Level Agreement
SLR SCCP source local reference
SLTM/SLTA signaling link test message/signaling link test acknowledge
SMPP Short Message Peer to Peer
SMS Short Message Service
SMS-C Short Message Service Center
SNAP signaling node application platform
SNMP simple network management protocol
SP signaling point
SQL structured query language
SS7 Signaling system number 7 provides two key abilities: fast-call setup via high-speed circuit-switched connections and transactions capabilities that deal with remote data base interactions
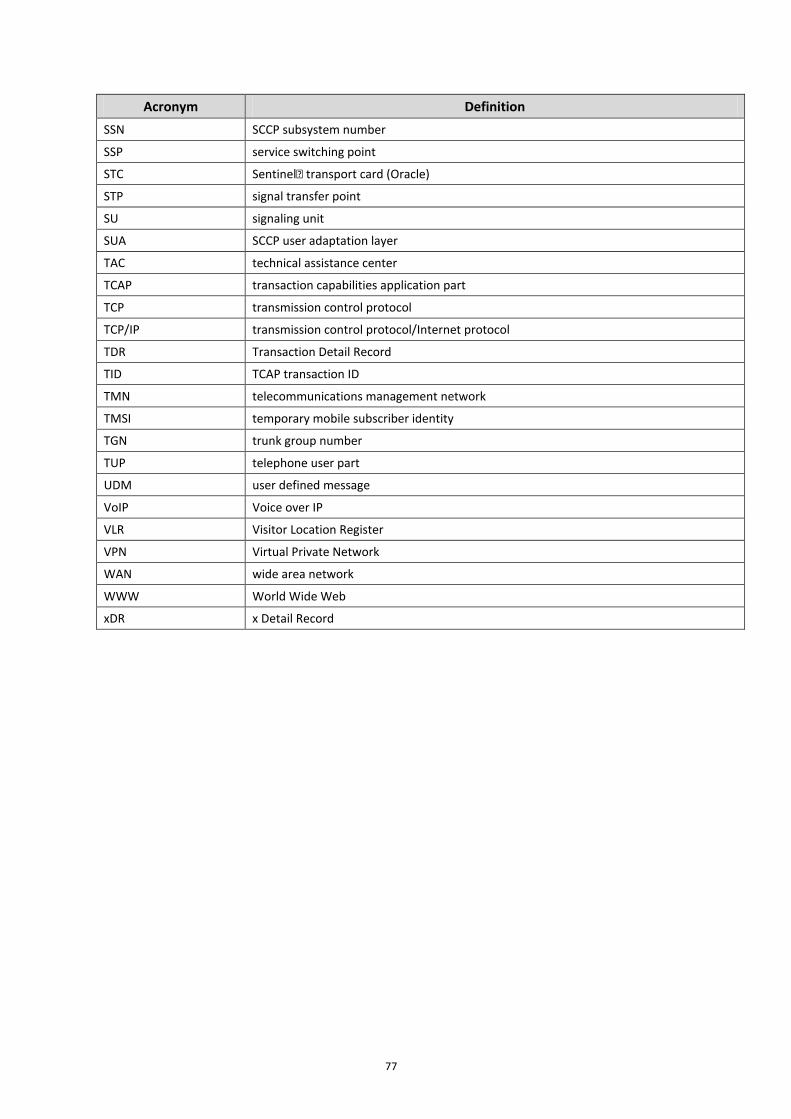
77
Acronym Definition SSN SCCP subsystem number
SSP service switching point
STC Sentinel transport card (Oracle)
STP signal transfer point
SU signaling unit
SUA SCCP user adaptation layer
TAC technical assistance center
TCAP transaction capabilities application part
TCP transmission control protocol
TCP/IP transmission control protocol/Internet protocol
TDR Transaction Detail Record
TID TCAP transaction ID
TMN telecommunications management network
TMSI temporary mobile subscriber identity
TGN trunk group number
TUP telephone user part
UDM user defined message
VoIP Voice over IP
VLR Visitor Location Register
VPN Virtual Private Network
WAN wide area network
WWW World Wide Web
xDR x Detail Record
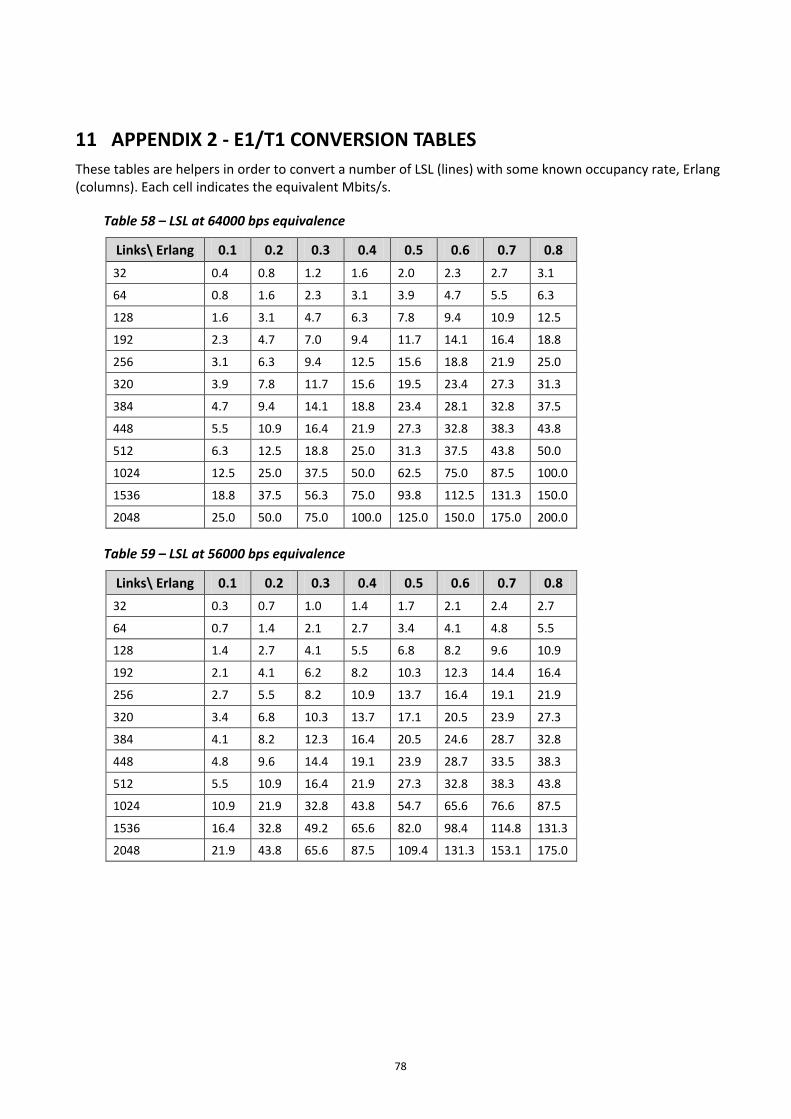
78
11 APPENDIX 2 - E1/T1 CONVERSION TABLES These tables are helpers in order to convert a number of LSL (lines) with some known occupancy rate, Erlang (columns). Each cell indicates the equivalent Mbits/s.
Table 58 – LSL at 64000 bps equivalence
Links\ Erlang 0.1 0.2 0.3 0.4 0.5 0.6 0.7 0.8 32 0.4 0.8 1.2 1.6 2.0 2.3 2.7 3.1
64 0.8 1.6 2.3 3.1 3.9 4.7 5.5 6.3
128 1.6 3.1 4.7 6.3 7.8 9.4 10.9 12.5
192 2.3 4.7 7.0 9.4 11.7 14.1 16.4 18.8
256 3.1 6.3 9.4 12.5 15.6 18.8 21.9 25.0
320 3.9 7.8 11.7 15.6 19.5 23.4 27.3 31.3
384 4.7 9.4 14.1 18.8 23.4 28.1 32.8 37.5
448 5.5 10.9 16.4 21.9 27.3 32.8 38.3 43.8
512 6.3 12.5 18.8 25.0 31.3 37.5 43.8 50.0
1024 12.5 25.0 37.5 50.0 62.5 75.0 87.5 100.0
1536 18.8 37.5 56.3 75.0 93.8 112.5 131.3 150.0
2048 25.0 50.0 75.0 100.0 125.0 150.0 175.0 200.0
Table 59 – LSL at 56000 bps equivalence
Links\ Erlang 0.1 0.2 0.3 0.4 0.5 0.6 0.7 0.8 32 0.3 0.7 1.0 1.4 1.7 2.1 2.4 2.7
64 0.7 1.4 2.1 2.7 3.4 4.1 4.8 5.5
128 1.4 2.7 4.1 5.5 6.8 8.2 9.6 10.9
192 2.1 4.1 6.2 8.2 10.3 12.3 14.4 16.4
256 2.7 5.5 8.2 10.9 13.7 16.4 19.1 21.9
320 3.4 6.8 10.3 13.7 17.1 20.5 23.9 27.3
384 4.1 8.2 12.3 16.4 20.5 24.6 28.7 32.8
448 4.8 9.6 14.4 19.1 23.9 28.7 33.5 38.3
512 5.5 10.9 16.4 21.9 27.3 32.8 38.3 43.8
1024 10.9 21.9 32.8 43.8 54.7 65.6 76.6 87.5
1536 16.4 32.8 49.2 65.6 82.0 98.4 114.8 131.3
2048 21.9 43.8 65.6 87.5 109.4 131.3 153.1 175.0
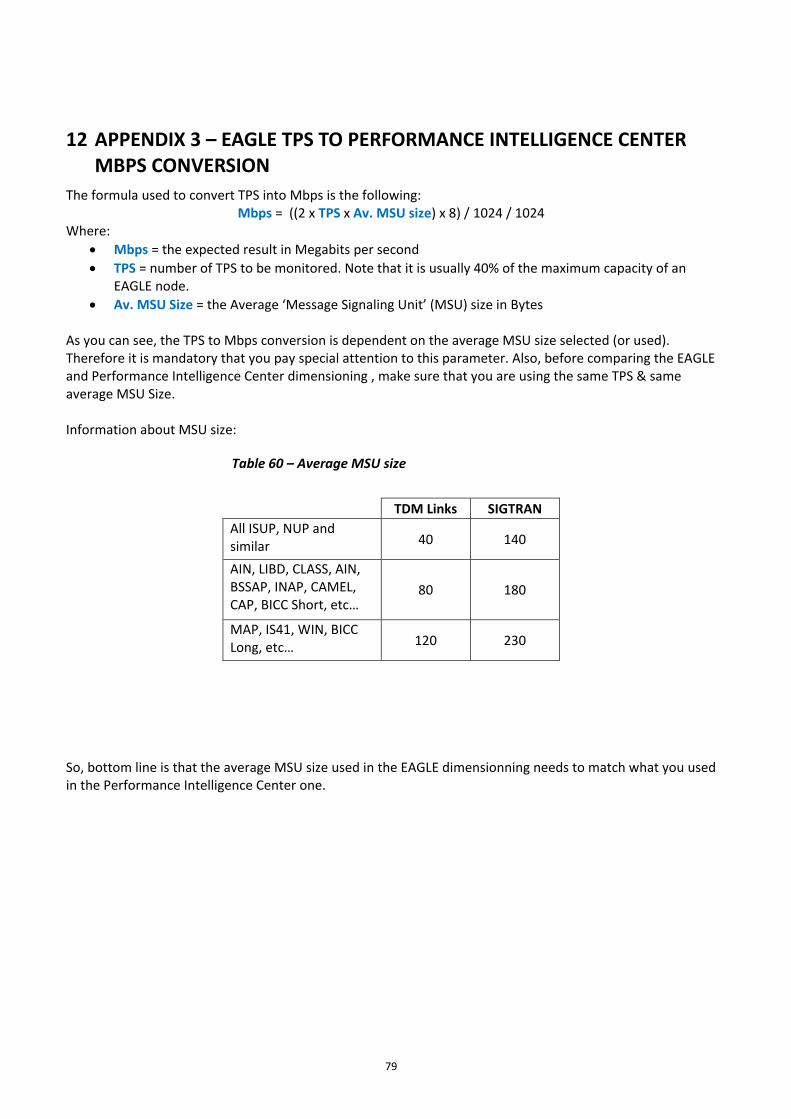
79
12 APPENDIX 3 – EAGLE TPS TO PERFORMANCE INTELLIGENCE CENTER MBPS CONVERSION
The formula used to convert TPS into Mbps is the following: Mbps = ((2 x TPS x Av. MSU size) x 8) / 1024 / 1024
Where: • Mbps = the expected result in Megabits per second • TPS = number of TPS to be monitored. Note that it is usually 40% of the maximum capacity of an
EAGLE node. • Av. MSU Size = the Average ‘Message Signaling Unit’ (MSU) size in Bytes
As you can see, the TPS to Mbps conversion is dependent on the average MSU size selected (or used). Therefore it is mandatory that you pay special attention to this parameter. Also, before comparing the EAGLE and Performance Intelligence Center dimensioning , make sure that you are using the same TPS & same average MSU Size. Information about MSU size:
Table 60 – Average MSU size
TDM Links SIGTRAN All ISUP, NUP and similar 40 140
AIN, LIBD, CLASS, AIN, BSSAP, INAP, CAMEL, CAP, BICC Short, etc…
80 180
MAP, IS41, WIN, BICC Long, etc… 120 230
So, bottom line is that the average MSU size used in the EAGLE dimensionning needs to match what you used in the Performance Intelligence Center one.

80
13 APPENDIX 4 – HOW TO CONFIGURE AN PERFORMANCE INTELLIGENCE CENTER FOR DIAMETER SIGNALING ROUTER MONITORING
For a Diameter Signaling Router monitoring opportunity it is possible to use Performance Intelligence Center, find here how to translate the Diameter Signaling Router MPS traffic information into Mbps required to size the Performance Intelligence Center solution. Follow the following instructions:
1. Get the MPS Max capacity used to size the Diameter Signaling Router. 2. Use the following formula to convert the MPS capacity to convert it into Mbps
Mbps = ((2 x MPS x Av. MSU size x 40%) x 8) / 1024 / 1024
Where: • Mbps = the expected result in Megabits per second • MPS = the maximum MPS capacity of the DSR node. Note that it is usually assumed that the
node will run at 40% of this maximum capacity of the DSR node. • Av. MSU Size = the Average ‘Message Signaling Unit’ (MSU) size in Bytes (usually between
750 to 3,000 Bytes) • Why a 2x factor: this factor is used because all messages that are getting into the DSR will
also get out of the DSR (as it is a Diameter Signaling Router) -> therefore the acquisition (-ie: probe) will see the same message twice: one time on its’ way in & one time on its’ way out.
• Why 40% load factor: like on Eagle STP, the Diameter Signaling Router is sized for a max MPS capacity (let’s say 10,000 MPS) but most of the time it is running in pair, so the traffic (the 10,000 MPS) is splitted across each node (so 5,000 MPS per node) and finally we usually account for a 20% extract traffic buffer (for peak traffic & other) -> Typically we end up having 4,000 MPS per node, which represent 40% of the max MPS capacity of the Diameter Signaling Router pair.
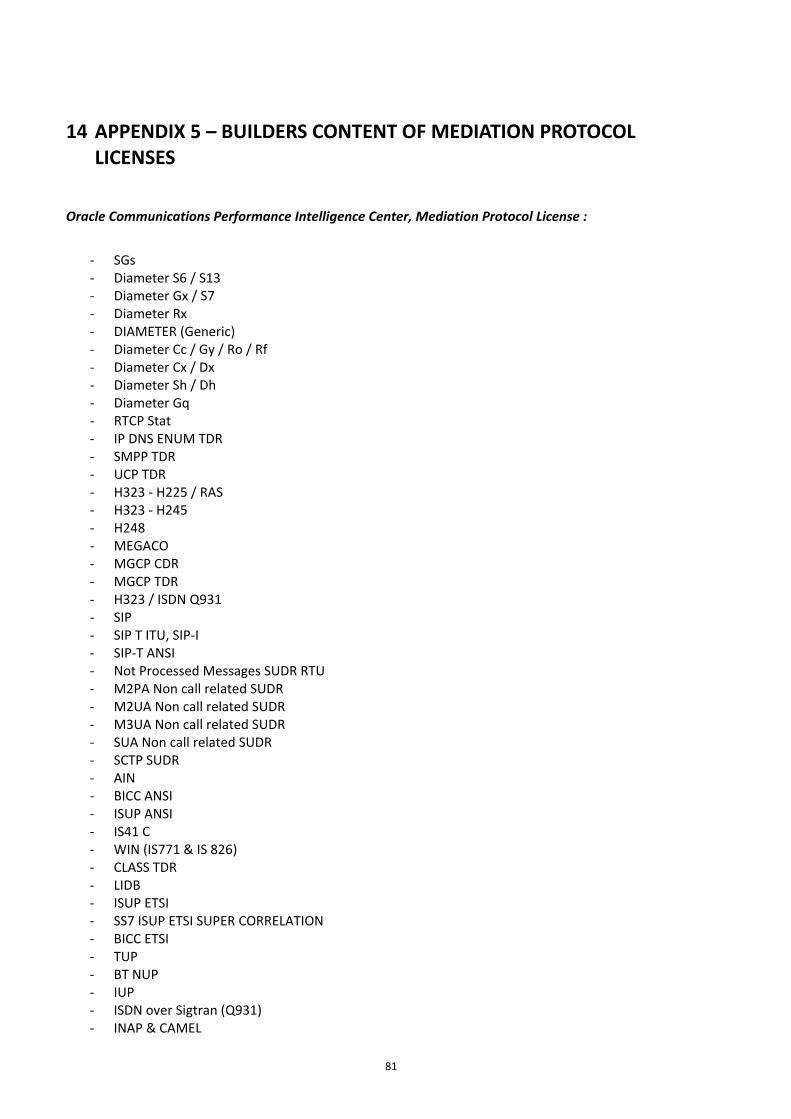
81
14 APPENDIX 5 – BUILDERS CONTENT OF MEDIATION PROTOCOL LICENSES
Oracle Communications Performance Intelligence Center, Mediation Protocol License :
- SGs - Diameter S6 / S13 - Diameter Gx / S7 - Diameter Rx - DIAMETER (Generic) - Diameter Cc / Gy / Ro / Rf - Diameter Cx / Dx - Diameter Sh / Dh - Diameter Gq - RTCP Stat - IP DNS ENUM TDR - SMPP TDR - UCP TDR - H323 - H225 / RAS - H323 - H245 - H248 - MEGACO - MGCP CDR - MGCP TDR - H323 / ISDN Q931 - SIP - SIP T ITU, SIP-I - SIP-T ANSI - Not Processed Messages SUDR RTU - M2PA Non call related SUDR - M2UA Non call related SUDR - M3UA Non call related SUDR - SUA Non call related SUDR - SCTP SUDR - AIN - BICC ANSI - ISUP ANSI - IS41 C - WIN (IS771 & IS 826) - CLASS TDR - LIDB - ISUP ETSI - SS7 ISUP ETSI SUPER CORRELATION - BICC ETSI - TUP - BT NUP - IUP - ISDN over Sigtran (Q931) - INAP & CAMEL
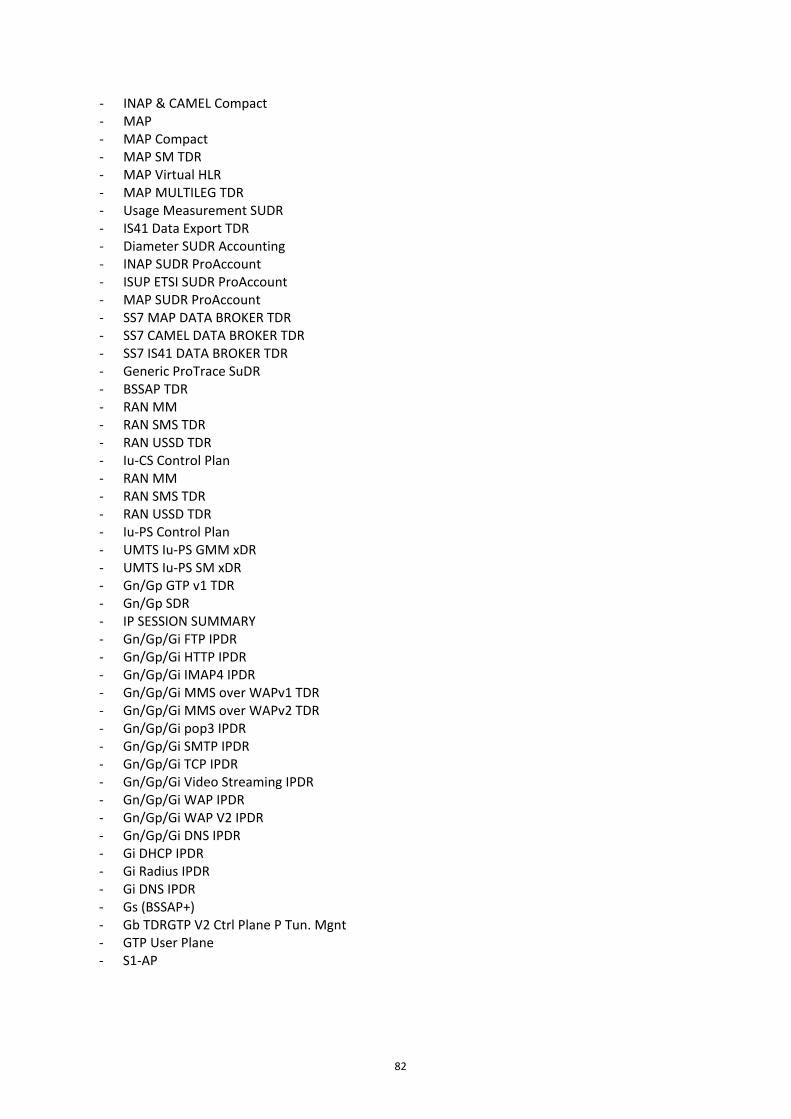
82
- INAP & CAMEL Compact - MAP - MAP Compact - MAP SM TDR - MAP Virtual HLR - MAP MULTILEG TDR - Usage Measurement SUDR - IS41 Data Export TDR - Diameter SUDR Accounting - INAP SUDR ProAccount - ISUP ETSI SUDR ProAccount - MAP SUDR ProAccount - SS7 MAP DATA BROKER TDR - SS7 CAMEL DATA BROKER TDR - SS7 IS41 DATA BROKER TDR - Generic ProTrace SuDR - BSSAP TDR - RAN MM - RAN SMS TDR - RAN USSD TDR - Iu-CS Control Plan - RAN MM - RAN SMS TDR - RAN USSD TDR - Iu-PS Control Plan - UMTS Iu-PS GMM xDR - UMTS Iu-PS SM xDR - Gn/Gp GTP v1 TDR - Gn/Gp SDR - IP SESSION SUMMARY - Gn/Gp/Gi FTP IPDR - Gn/Gp/Gi HTTP IPDR - Gn/Gp/Gi IMAP4 IPDR - Gn/Gp/Gi MMS over WAPv1 TDR - Gn/Gp/Gi MMS over WAPv2 TDR - Gn/Gp/Gi pop3 IPDR - Gn/Gp/Gi SMTP IPDR - Gn/Gp/Gi TCP IPDR - Gn/Gp/Gi Video Streaming IPDR - Gn/Gp/Gi WAP IPDR - Gn/Gp/Gi WAP V2 IPDR - Gn/Gp/Gi DNS IPDR - Gi DHCP IPDR - Gi Radius IPDR - Gi DNS IPDR - Gs (BSSAP+) - Gb TDRGTP V2 Ctrl Plane P Tun. Mgnt - GTP User Plane - S1-AP
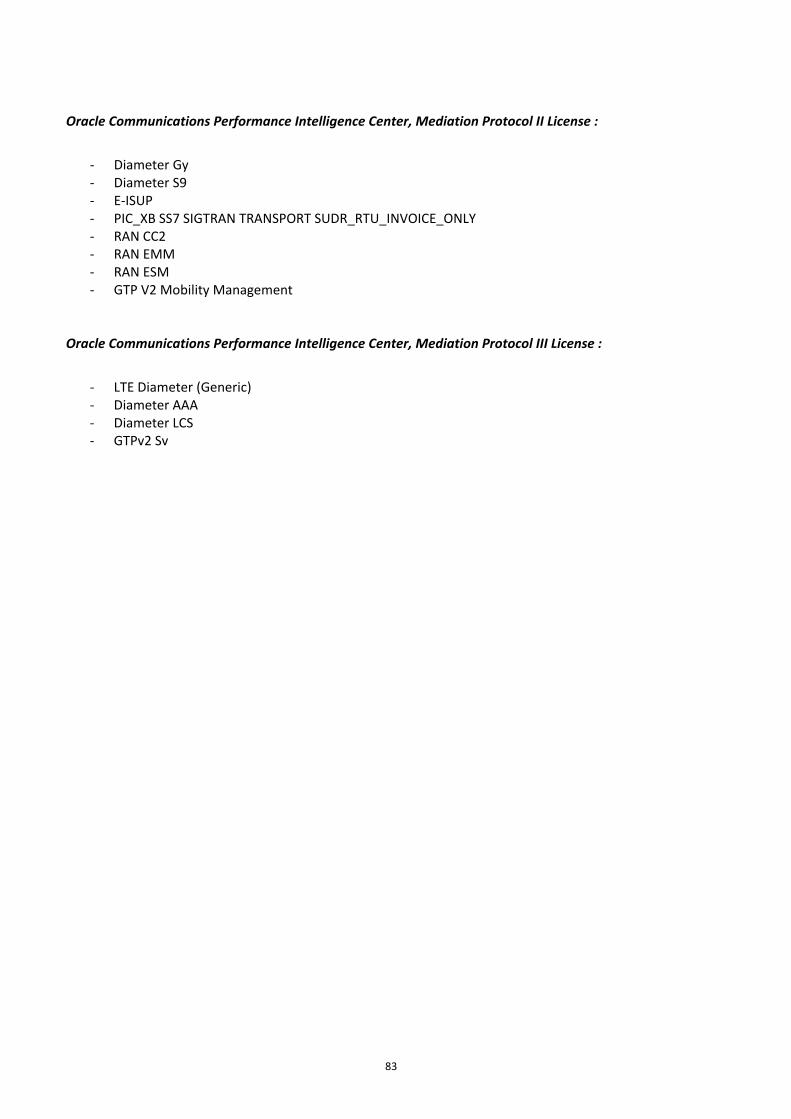
83
Oracle Communications Performance Intelligence Center, Mediation Protocol II License :
- Diameter Gy - Diameter S9 - E-ISUP - PIC_XB SS7 SIGTRAN TRANSPORT SUDR_RTU_INVOICE_ONLY - RAN CC2 - RAN EMM - RAN ESM - GTP V2 Mobility Management
Oracle Communications Performance Intelligence Center, Mediation Protocol III License :
- LTE Diameter (Generic) - Diameter AAA - Diameter LCS - GTPv2 Sv

84
15 APPENDIX 6 – MY ORACLE SUPPORT (MOS) MOS (https://support.oracle.com) is your initial point of contact for all product support and training needs. A representative at Customer Access Support (CAS) can assist you with MOS registration. Call the CAS main number at 1-800-223-1711 (toll-free in the US), or call the Oracle Support hotline for your local country from the list at http://www.oracle.com/us/support/contact/index.html. When calling, make the selections in the sequence shown below on the Support telephone menu: 1. Select 2 for New Service Request 2. Select 3 for Hardware, Networking and Solaris Operating System Support 3. Select 2 for Non-technical issue You will be connected to a live agent who can assist you with MOS registration and provide Support Identifiers. Simply mention you are a Tekelec Customer new to MOS.
MOS is available 24 hours a day, 7 days a week, 365 days a year.

85
16 APPENDIX 7 – ORACLE HELP CENTER Oracle customer documentation is available on the web at the Oracle Help Center (OHC) site, http://docs.oracle.com. You do not have to register to access these documents. Viewing these files requires Adobe Acrobat Reader, which can be downloaded at www.adobe.com. 1. Log into the Oracle Help Center site at http://docs.oracle.com. 2. Under Industries, click the link for Oracle Communications documentation. The Oracle Communications Documentation window opens with Tekelec shown near the top. 3. Click Oracle Communications Documentation for Tekelec Products. 4. Navigate to your Product and then the Release Number, and click the View link (the Download link will retrieve the entire documentation set). 5. To download a file to your location, right-click the PDF link and select Save Target As.