Embed Size (px)
Citation preview

heart 119
OPTN/SRTR 2011 Annual Data Report:
heart
I want to do everything possible, because I don’t want to waste any of the time I’ve been given. I am lucky, and I will do everything I can to make sure others get the same chance at life as I have been given. I tell everyone how important it is to be a donor. It really is about giving life.
Lacey, heart recipient
wait list 126deceased donation 131transplant 133donor-recipient matching 136outcomes 138immunosuppression 141pediatric transplant 142transplant center maps 146
ABSTRACT Since 2005, the number of new active adult candidates on the heart transplant waiting list increased by 19.2%. The transplant rate peaked at 78.6 per 100 wait-list years in 2007, and declined to 67.8 in 2011. Wait-list mortality declined over the past decade, including among patients with a ventricular assist device at listing; in 2010 and 2011, the mortality rate for these patients was comparable to the rate for patients without a device. Median time to transplant was lowest for candidates listed in 2006-2007, and increased by 3.8 months for patients listed in 2010-2011. Graft survival has gradually improved over the past two decades, though acute rejection is common. Hospitalizations are frequent and increase in frequency over the life of the graft. In 2011, the rate of pediatric heart transplants was 124.6 per 100 patient-years on the waiting list; the highest rate was for patients aged less than 1 year. The pre-transplant mortality rate was also highest for patients aged less than 1 year. Short- and long-term graft survival has continued to improve. The effect on wait-list outcomes of a new pediatric heart allocation policy implemented in 2009 to reduce pediatric deaths on the waiting list cannot yet be determined.
Key words End-stage heart failure, heart transplant, transplant outcomes, ventricular assist device.

120 OPTN & SRTR Annual Data Report 2011
IntroductionHeart transplant has long been the best option for selected patients with end-stage heart failure. However, improvements in ventricular assist device (VAD) technology and increased experience with mechanical circulatory support have led to 1-year survival rates approaching those of heart transplant (1). The projected duration of current VADs is at least 5 years, and complications such as stroke and infection have declined substantially compared with complications related to older-generation devices. VADs bridge patients with end-stage heart failure safely to transplant and effectively treat heart failure. Thus, for many patients whose conditions are stable with a VAD, there is no urgency to proceed with listing for heart transplant. Durable devices have dramatically changed the way end-stage heart failure is managed and have resulted in shifts in post-transplant and wait-list trends.
Over the past decade, there have been minor fluctuations in the number of transplants performed per year, with a rela-tively consistent increase since 2004 (Figure 3.1). This increase in transplants has been mirrored by increases in donation rates, new listings, and transplant rates during the same period (Figures 1.1, 1.4, 2.1). This trend may be explained by policy changes that promote broader sharing. Substantial geographic variation in transplant rates still exists (Figure 3.4). Although geographic variations in donation rates may explain this trend, other factors may include regional donor use, access to the waiting list, geographic variations in listing practices, and death on the waiting list. Over the past decade, two major revisions to heart allocation policy have affected current trends: 1) in 2002, the policy regarding candidates with a VAD was changed to allow listing as status 1A for 30 days at any time after implant; 2) in 2006, the Organ Procurement and Transplantation Net-work (OPTN) implemented a broader sharing policy to prefer-entially allocate hearts to combined local and zone A status 1A and 1B candidates (2). In this report, when possible, we high-light trends that may have been influenced by these revisions.
Under the current allocation system, which was revised in 2002, all VAD patients, including those with complications as well as those who are stable, may accrue 30 days of status 1A
time without a requirement for hospital admission. If patients with a VAD are not listed as status 1A, they can be listed indefi-nitely as status 1B. This revision, combined with the growing number of candidates with a VAD, has contributed to the increased proportion of status 1A and 1B registrations over the past decade and the decline in the proportion of status 2 registrations (Figures 1.2, 1.3, 1.12). Although candidates using intravenous inotropes can be listed as status 1A, the propor-tion of recipients receiving inotropes has declined over the past decade from 51% to 35%, presumably due to increased use of VADs in candidates who previously may have been pre-scribed inotropic therapy and the recognized survival benefit of VADs compared with inotropic therapy (3,4) (Figure 3.7). While these policies were developed during the early era of mechanical circulatory support, there have been substantial gains in VAD survival; thus the policies may need to be revised to reflect current clinical practice. Disease severity may vary widely among VAD patients. Variability in stability among VAD patients may contribute to differences in wait-list survival and possibly post-transplant survival. Currently, the OPTN Tho-racic Organ Transplantation Committee is reassessing alloca-tion policies in favor of a system that can better distinguish severity of illness among VAD patients. Furthermore, status 2 candidates are waiting longer due to changing trends in listing practices and the downstream effects of the broader sharing initiative. It remains to be seen whether longer waiting times will be detrimental to wait-list survival of status 2 candidates.
Adult Heart Transplant Waiting List TrendsNew Listings, Wait-List Mortality, and Time to TransplantSince 2004, the number of new active adult (aged 18 years or older at listing) candidates on the waiting list has increased by 19.2% (Figure 1.1). As expected, implementation of the broader geographic sharing policy and revision of the VAD policy have affected listing practices. Since 2006, the proportions of can-didates who were first listed as status 1A and status 1B have increased by 5.4% and 7.3%, respectively, and the proportion initially listed as status 2 has declined by 11.7% (Figure 1.3).

heart 121
The transplant rate peaked at 78.6 per 100 wait-list years in 2007 and has been declining since; in 2011, the rate was 67.8 per 100 wait-list years (Figure 1.4). Among candidates who were listed for transplant in 2008, 60.0% underwent trans-plant within 12 months of listing, 25.0% were still waiting at 12 months, and 9.5% had died. By 36 months, 69.7% had under-gone transplant, 8.2% were still waiting, and 11.6% had died (Figure 1.6).
Wait-list mortality declined over the past decade, from 16.9 deaths per 100 wait-list years in 2001 to 11.6 per 100 wait-list years in 2011 (Figure 1.10). Trends were similar for men and women (data not shown), all age groups, all race categories, and all medical urgency status categories. In 2011, mortality by age was lowest for candidates aged 35 to 49 years; mortality was comparable for women and men (data not shown), and lowest for Asians. Wait-list mortality declined to approxi-mately 10 deaths per 100 wait-list years for all diagnoses (Figure 1.10). Trends among candidates with a VAD at listing are notable. VAD survival has improved greatly. Historically, wait-list mortality has been substantially lower for candidates without a VAD than for candidates with a VAD; however, over the past decade, wait-list mortality improved dramatically among candidates with a VAD at listing, declining from 102.2 per 100 wait-list years in 2001 to 12.9 per 100 wait-list years in 2011. In 2010 and 2011, the mortality rate was comparable to the rate for candidates without a VAD at listing, a testament to improvements in VAD technology, experience, and appli-cation over the past 10 years (Figure 1.10). These data should be interpreted cautiously, however, as a marked proportion of candidates without a VAD received a VAD after listing; these candidates were included in the analysis as patients without a VAD at listing.
As expected with the broader sharing policy implemented in 2006, wait-list mortality declined substantially. Between 2006 and 2011, wait-list mortality for candidates listed as sta-tus 1A and 1B declined from 92.1 and 32.4 deaths per 100 wait-list years, respectively, to 36.9 and 11.0 deaths per 100 wait-list years. Wait-list mortality remains low for status 2 candidates, declining from 9.7 to 8.1 deaths per 100 wait-list years during
this same time period (Figure 1.10). Mortality among candi-dates listed as inactive remained stable at 12.3 deaths per 100 wait-list years in 2011. Wait-list mortality remains highest for status 1A candidates compared with other medical urgency status categories.
Over the past decade, median time to transplant was low-est for candidates listed in 2006-2007, and has been increasing since. Overall, the duration of waiting time to transplant for candidates listed in 2010-2011 was 3.8 months longer than for the 2006-2007 cohort. In candidates listed as status 1A, median time to transplant increased from less than 1 month to 1.7 months. The trend was notable in candidates listed initially as status 1B and 2, for whom median waiting time increased by 3.5 months and 9.3 months, respectively (Figure 1.7). This trend does not, however, account for status upgrades or down-grades after listing. Median waiting time for candidates with a VAD at listing was 2.2 months less than for candidates without a VAD. Although waiting time also increased in recent years for candidates with a VAD, the magnitude was slightly less than for candidates without a VAD at listing, at 3.4 months compared with 4.4 months (Figure 1.7). As stated before, this analysis included candidates initially listed without a VAD who received a VAD after listing as candidates without a VAD at listing. The proportion of candidates listed in 2010 who underwent transplant within 1 year of listing varied widely by donation service area (DSA), from 27.1% to 81.0% (Figure 1.8). This variability may be due at least in part to differences among DSAs in listing practices and status changes after listing. Nationwide, the proportion of candidates undergoing trans-plant within 1 year of listing declined to 54.6% in recent years (Figure 1.9). Transplant within 1 year of listing was most likely for candidates with blood group AB and least likely for candi-dates with blood group O (Figure 1.9).
Candidate Characteristics Since 2001, the proportion of candidates aged 18 to 34 years increased from 8.8% to 10.7%, and the proportion of those aged 65 years or older increased from 12.5% to 19.2%. While candidates aged 50 to 64 years compose the largest proportion

122 OPTN & SRTR Annual Data Report 2011
of heart transplant candidates, 49.5% in 2011, the size of this age group has declined in recent years (Figure 1.2). Over the past decade, the proportion of women increased by 4.2%. The proportions of ethnic minorities also increased; most notably, the proportion of black candidates increased substantially, from 13.8% to 21.2% between 2001 and 2011 (Figure 1.2). This increase may in part reflect the disproportionate and earlier occurrence of heart failure in black patients (5). The propor-tion of candidates with cardiomyopathy surpassed the propor-tion with coronary artery disease in 2003, and the proportion with congenital heart disease increased to 3.9% in 2011. In 2011, a smaller proportion of candidates (14.4%) waiting for heart transplant spent 3 or more years on the waiting list, compared with 2001 (23.2%). Listing practices, that is, centers electing to list candidates only when they qualify at a higher urgency status, may be partially responsible for shorter waits. Finally, the proportions of status 1A and 1B candidates on the waiting list have grown remarkably from 2001 to 2011, increasing from 9.6% to 14.1% for status 1A and from 17.2% to 35.0% for status 1B (Figure 1.2). These trends may be a consequence of increased use of VADs and of centers listing only candidates who qualify for higher urgency statuses. The increasing proportions of candidates awaiting heart transplant at a higher urgency sta-tus suggest increased morbidity among candidates, although the impact of VAD availability cannot be discounted. A com-parison of candidates on the waiting list on December 31, 2001, and December 31, 2011, reveals similar trends (Figure 1.12).
DonationThe rate of heart donation among people aged less than 65 years has not changed substantially over the past decade; in 2010 this rate was 3.6 per 1,000 patient deaths. Donation rates since 2000 increased by approximately 20% in groups aged 0 to 14, 15 to 34, and 35 to 44 years, and declined by 23.0% and 40.0% in groups aged 45 to 54 and 55 to 64 years, respectively (Figure 2.1). Donation rates among blacks and Hispanics increased (Figure 2.1). Donors aged 18 to 34 years have consistently composed the greatest proportion of heart donors, and in 2011 represented 48.6% (Figure 2.7). The pro-
portion of hearts recovered per organ donor declined from 0.37 in 2001 to 0.28 in 2004 and has since plateaued (Figure 2.3). The proportion of recovered hearts that are discarded has been declining over the past decade, and in 2011 ranged from 0.2% (1 heart) among heart donors aged 0 to 17 years to 1.8% (3 hearts) among heart donors aged 50 to 64 years (Figure 2.5). For the 17 recovered hearts discarded in 2011, the most common reason for discard was other (47.1%), followed by anatomical abnormalities (17.6%) (Figure 2.6). The most com-mon cause of death among donors is head trauma (52.8%). For heart transplant donors, the prevalence of head trauma as a cause of death is slowly declining over time while the preva-lence of anoxia is increasing (Figure 2.8).
Adult Heart Transplant Trends in Transplant RatesOverall, the number of adult heart transplants performed was stable between 2000 and 2011 (1,926 and 1,949, respectively). However, in 2004, this number reached a nadir of 1,724 (Figure 3.1). The transplant rate peaked in 2007 and has since declined for all status codes except status 1A (Figure 3.3). The anticipated effect of the broader sharing policy was more rapid transplants in status 1A and 1B candidates. Although the transplant rate for candidates listed at status 1A increased to 315 per 100 patient-years in 2011, the rate declined for status 1B candidates, from 267 to 103 transplants per 100 patient-years between 2007 and 2011. As expected, the transplant rate for status 2 candidates also declined, from 59 to 35 transplants per 100 patient-years. Among candidates with a VAD at the time of listing, the trans-plant rate decreased from 203 to 99 transplants per 100 patient-years between 2007 and 2011 (Figure 3.3). Despite this dramatic decline, candidates with a VAD continue to undergo transplant at higher rates than candidates without a VAD at listing, in part due to shorter waiting times. Candidates who received a VAD after listing are not accounted for in this analysis; these candi-dates were included in the analysis as patients without a VAD at listing; therefore, caution is warranted in interpretation.
Geographic trends in transplant rates are highly variable due to variations in center listing practices, donor availability

heart 123
and perhaps DSA practices (Figure 3.4). Transplant rates var-ied from 0 to more than 200 transplants per 100 patient-years.
Trends in life support, including respiratory support and circulatory support, are also changing. Since 2001, the pro-portions of recipients who received intravenous inotropes immediately before transplant decreased from 51.1% to 35.1%. Since 2004, the proportion of recipients who received a left-VAD before transplant more than doubled, from 16.0% to 35.4% in 2011. Intra-aortic balloon pump use and ventilator use have been stable, as has right-VAD use (Figure 3.7).
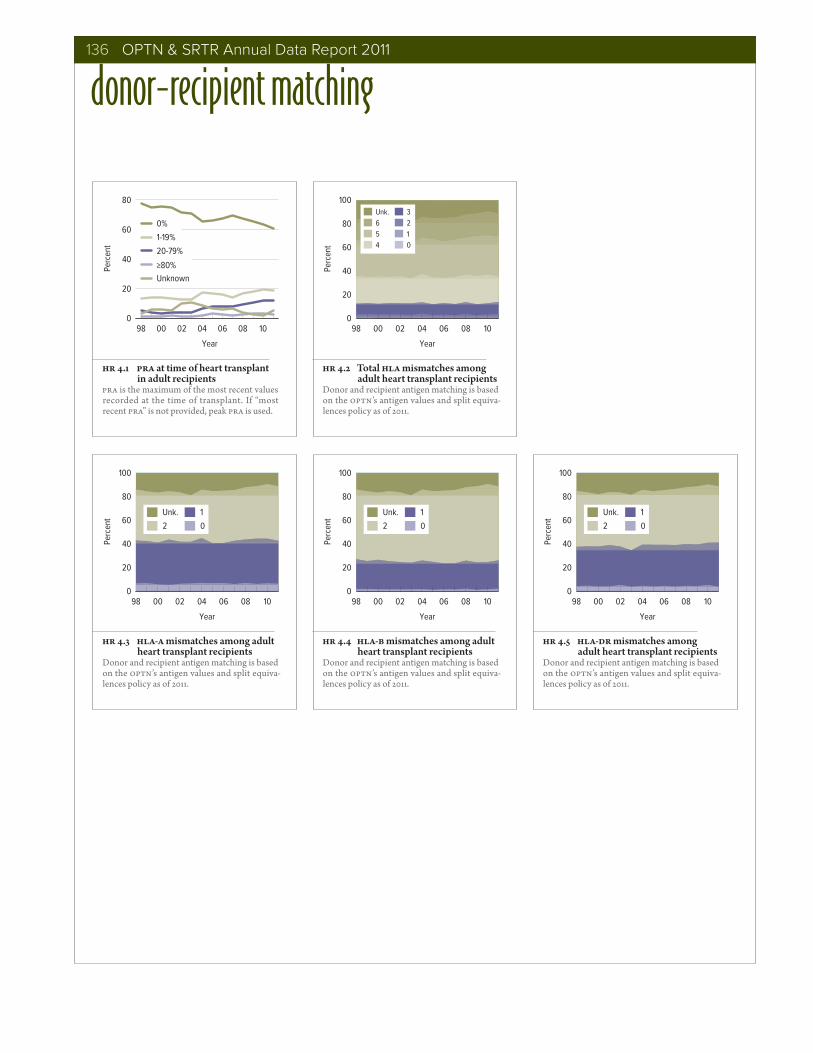
Recipient CharacteristicsThe mean age of adult heart transplant recipients is 50.9 years and has not changed appreciably over the past decade (Figure 3.5); however, an increasing number of recipients are aged 65 years or older. Increasing proportions of recipients are female, are members of ethnic minorities, have cardiomyopathy, and have a VAD at the time of transplant (Figures 3.2, 3.9). Sen-sitization of heart transplant candidates remains a challenge and has increased since 2007. Increased use of VADs, evolving diagnostic methods to detect and quantify anti-HLA antibody, and increasing use of virtual cross-match, which may help increase access of sensitized candidates to heart transplant, have contributed to the growing number of sensitized candi-dates (Figure 4.1).
Transplant OutcomesAside from minor fluctuations, the overall adjusted probabil-ity of short-term graft failure (6 months and 1 year, adjusted for age, sex, and race) has been declining over the past decade, and in general is low, 0.07 at 6 months and 0.09 at 1 year for patients who underwent transplant in 2010. In addition, graft failure at 3, 5, and 10 years post-transplant has steadily declined (Figure 5.1). Early graft failure, within the first 6 weeks post-transplant, has declined, and occurred in only 4.9% of heart transplant recipients in 2011 (Figure 5.2). Overall, 5-year graft survival was 74.9%, and was similar among all status codes and disease groups (Figure 5.3). The greatest decline in graft survival occurred within the first 12 months post-transplant,
when survival decreased by 12.7% (Figure 5.3). Graft survival has gradually improved over the past two decades. In recipi-ents who underwent transplant in 2009 and had a functioning graft at 1 year, the predicted half-life, conditional on 1 year of survival, was 14.0 years (Figure 5.4). The number of heart transplant survivors is increasing; in 2011, 21,457 adult recipi-ents were alive with a functioning graft, compared with 16,259 in 2001 (Figure 5.5). Among patients who underwent trans-plant between 2005 and 2006, 5-year survival was reduced in blacks compared with whites (68.2% vs. 77.9%); in recipients aged 18 to 34 years compared with those aged 35 to 49, 50 to 64, and 65 years or older (69.9%, 77.4%, 76.3%, and 73.9%, respectively); and in recipients with a non-durable VAD com-pared with those without a VAD and those with a durable VAD (54.9%, 76.6%, and 73.5%, respectively) (Figure 5.9). Only 51 recipients were included in the non-durable VAD category. Recipients with biventricular assist devices involving both durable and non-durable VADs were included in the durable category: 6 patients had a Heartmate XVE combined with a non-durable device. Among recipients in whom the cause of death post-transplant is known, cardiovascular disease remains the most common primary cause (Figure 5.10).
Post-Transplant MorbidityAcute rejection during the first year post-transplant is com-mon, occurring in 24.5% of recipients who underwent trans-plant 2005-2009. By 5 years post-transplant, 50.9% of recipients had at least one episode of rejection (Figure 5.6). Hospitaliza-tions are frequent during the first year, occurring in 39.3% of recipients who underwent transplant 2006-2011, and continue to increase over the life of the graft; within 4 years post-trans-plant, 65.3% of recipients have been hospitalized (Figure 5.7). Post-transplant lymphoproliferative disorder (PTLD) is rela-tively infrequent in adults and is closely linked to Epstein-Barr virus (EBV) status (Figure 5.8).
SummaryThis year’s report highlights several successes, including notable improvements in wait-list survival and in patient and

124 OPTN & SRTR Annual Data Report 2011
graft survival. The broader sharing policy and increased VAD use have contributed to these successes but have introduced new challenges regarding allocation of donor hearts. Median time to transplant is increasing, particularly among status 2 candidates. Numbers of candidates listed as status 2 are declining; the appropriateness of performing transplants in status 2 candidates is even being questioned (6). Transplant rates are declining for status 1B and status 2 candidates. To continue allocating hearts to the highest urgency candidates, the allocation policy will need to further distinguish severity of illness between status 1A and status 1B candidates. Revi-sions to the heart allocation policy are currently being con-sidered; these revisions are anticipated to further define VAD complications to ensure that criteria used for justification of medical urgency are more uniform. Finally, wide geographic variations persist in donation rates, transplant rates, and wait-list mortality. While these analyses are currently not adjusted for medical urgency, which may contribute to the perceived variations, the causes of these disparate trends warrant further investigation to assess equitable access to donor hearts around the country.
Pediatric Heart TransplantPediatric Waiting List TrendsSince 1998, the number of new pediatric candidates added to the heart transplant waiting list has increased slightly, and few candidates have been added as inactive. The number of preva-lent wait-list candidates remained stable between 250 and just over 300 in the past decade. Historically, more candidates were listed as inactive than as active, but in a shift since 2008, 57.1% of candidates are now listed as active (Figure 7.1). The age distribution changed over the past 3 years; the percent-age of wait-listed candidates aged 11 to 17 years increased, with a corresponding decrease in the percentage aged less than 1 year (Figure 7.2). Eight percent of candidates on the waiting list in 2010-2011 were waiting for a re-transplant. Among all candidates on the list, 2.3% of those aged 0 to 5 years were waiting for a re-transplant, as were 15.8% of those aged 6 to 10 years and 14.7% of those aged 11 to 17 years (Figure 7.3). Of
candidates newly listed in 2008, 70.2% underwent transplant within 3 years; 14.7% died, 11.8% were removed from the list, and 3.3% were still waiting (Figure 7.5). Pre-transplant mor-tality decreased for all age groups. The pre-transplant mortal-ity rate was highest for candidates aged less than 1 year, at 49 deaths per 100 wait-list years in 2010-2011 (Figure 7.7).
Pediatric TransplantThe number of pediatric heart transplants performed each year increased from 274 in 1998 to 375 in 2011 (Figure 7.8). In 2011, the rate of pediatric heart transplant was 124.6 per 100 patient-years on the waiting list; the highest rate was for recipients aged less than 1 year, at 271.3 transplants per 100 patient-years on the waiting list (Figure 7.9). Over the past decade, congen-ital defects remain the most common primary cause of disease, affecting 43.4% of recipients in 2009-2011 (Figure 7.10). The percentage of patients who underwent transplant as status 1A increased from 62.2% in 1999-2001 to 87.1% in 2009-2011. This increase may reflect the policy implemented in 2009 that pri-oritized pediatric candidates awaiting heart transplant as status 1A in the combined local DSA and zone A as the first unit of allocation. This policy also preferentially allocates all pediat-ric hearts to pediatric recipients, a change from the previous policy, which prioritized adolescent donor hearts for pediat-ric candidates. VAD use increased from only 7.6% of pediatric transplant recipients in 1999-2001 to 18.3% in 2009-2011. Devel-opment of the Berlin Heart, a VAD for pediatric patients; the HeartMate II, a left VAD smaller than its predecessor; and other newer-generation devices allowed expansion of durable and non-durable support to pediatric candidates.
Pediatric Immunosuppression and OutcomesSubstantial changes in maintenance immunosuppression have occurred. Tacrolimus use increased from 23.8% in 1998 to 83.2% in 2011. Mycophenolate mofetil use increased from 33.2% in 1998 to 90.0% in 2011. In 2010, mammalian target of rapamycin inhibitors were used in 1.4% of patients at the time of transplant and in 7.2% at 1 year post-transplant. Steroids were used in 75.2% of patients at the time of transplant in 2010,

heart 125
and use decreased to 36.1% at 1 year (Figure 7.13). In 2011, no induction immunosuppression was used in 32.0% of recipients, T cell depleting agents were used in 48.0%, and interleukin-2 receptor antagonists were used in 25.7% (Figure 7.13).
Graft survival, both long-term and short-term, has contin-ued to improve. Graft survival for heart transplants performed in 2005 was 87.5% at 6 months, 84.6% at 1 year, and 72.1% at 5 years (Figure 7.14). Graft survival for heart transplants per-formed in 2010 was 92.7% at 6 months and 91.2% at 1 year. The rate of late graft failure is traditionally measured by the graft half-life conditional on 1-year survival, defined as the time to when half of grafts surviving at least 1 year are still functioning. For heart transplants performed in 2009-2010, the 1-year con-ditional graft half-life was 17.4 years (Figure 7.15). Incidence of first acute rejection increased over time post-transplant; 24.4% of patients experienced rejection in the first 12 months and 38.2% by 24 months post-transplant (Figure 7.16). The highest risk for EBV infection and PTLD occurred in EBV-neg-ative recipients. Incidence of PTLD was 8.4% at 5 years post-transplant among EBV-negative recipients and 2.7% among EBV-positive recipients (Figure 7.12).
Policy Updates In 2009, a new pediatric heart allocation sequence was imple-mented that preferentially allocates pediatric hearts to status 1A pediatric candidates in a combined allocation unit com-posing the local DSA and zone A before local adult status 1A candidates and status 1B pediatric candidates; compared with the previous policy, which prioritized local status 1A pediatric candidates, the new policy prioritizes both local and zone A status 1A pediatric candidates. The ultimate goal of this policy is to reduce pediatric deaths on the waiting list and to expedite allocation of pediatric hearts to pediatric candidates at highest risk of wait-list mortality. Although it is too early to determine the effect of this policy on wait-list outcomes, during 2010-2011, wait-list mortality appeared to decline among pediatric candidates in all age categories compared with 2008-2009 (Figure 7.7). Future OPTN/SRTR data reports will focus on the impact of these allocation policy changes.
References1. Starling RC, Naka Y, Boyle AJ, Gonzalez-Stawinski G, John R, Jorde U, Russell SD, Conte JV, Aaronson KD, McGee EC Jr, Cotts WG, DeNofri D, Pham DT, Farrar DJ, Pagani FD. Results of the post-US Food and Drug Administration-approval study with a continuous flow left ventricular assist device as a bridge to heart transplantation: A prospective study using the INTER-MACS (Interagency Registry for Mechanically Assisted Circu-latory Support). J Am Coll Cardiol 2011;57:1890-1898.
2. Organ Procurement and Transplantation Network Policy 3.7: Allocation of Thoracic Organs. November 15, 2011. Avail-able at: http://optn.transplant.hrsa.gov/policiesandbylaws/policies.asp. Accessed August 13, 2012.
3. Lietz K, Long JW, Kfoury AG, Slaughter MS, Silver MA, Milano CA, Rogers JG, Naka Y, Mancini D, Miller LW. Out-comes of left ventricular assist device implantation as desti-nation therapy in the post-REMATCH era: Implications for patient selection. Circulation 2007; 116: 497-505.
4. Rose EA, Gelijns, AC, Moskowitz AJ, Heitjan DF, Ste-venson LW, Dembitsky W, Long JW, Ascheim DD, Tierney AR, Levitan RG, Watson JT, Meier P, Ronan NS, Shapiro PA, Lazar RM, Miller LW, Gupta L, Frazier OH, Desvigne-Nickens P, Oz MC, Poirier VL, Randomized Evaluation of Mechanical Assistance for the Treatment of Congestive Heart Failure (REMATCH) Study Group. Long-term use of a left ventricular assist device for end-stage heart failure. N Engl J Med 2001; 345:1435-1443.
5. Bibbins-Domingo K, Pletcher MJ, Lin F, Vittinghoff E, Gardin JM, Arynchyn A, Lewis CE, Williams OD, Hulley SB. Racial differences in incident heart failure among young adults. N Engl J Med 2009; 360: 1179-1190.
6. Lietz K, Miller LW. Improved survival of patients with end-stage heart failure listed for heart transplantation: Analy-sis of Organ Procurement and Transplantation Network/US United Network of Organ Sharing Data, 1990 to 2005. J Am Coll Cardiol 2007; 50: 1282-1290.

126 OPTN & SRTR Annual Data Report 2011
wait list
98 00 02 04 06 08 10Pa
tient
s (in
thou
sand
s)0
1
2
3
4
98 00 02 04 06 08 10
Year
New patients Patients on the list on 12.31 of the given year
Active
Inactive
Active
Inactive
HR 1.1 Adult patients waiting for a heart transplantPatients waiting for a transplant. A “new patient” is one who first joins the list during the given year, without having listed in a previous year. However, if a patient has previously been on the list, has been removed for a transplant, and has relisted since that transplant, the patient is considered a “new patient.” Patients con-currently listed at multiple centers are counted only once. Those with concurrent listings and active at any program are considered active; those inactive at all programs at which they are listed are considered inactive.
HR 1.2 Distribution of adult patients waiting for a heart transplantPatients waiting for a transplant any time in the given year. Age determined on the earliest of listing date or December 31 of the given year. Concurrently listed patients are counted once. Ventricular assist device information comes from the OPTN Transplant Candidate Registration form at the time of listing, and includes LVAD, RVAD, TAH, and LVAD + RVAD. Medical urgency status is the earliest available per year for each patient.

heart 127
HR 1.3 Distribution of adult patients newly listed for a heart transplant A newly listed patient is one who first joins the list during the given year, without having listed in a previous year. However, if a patient has previously been on the list, has been removed for a transplant, and has relisted since that transplant, the patient is considered a newly listed patient. Patients concurrently listed at multiple centers are counted only once. Ventricular assist device information comes from the OPTN Transplant Candidate Registration form at the time of listing, and includes LVAD, RVAD, TAH, and LVAD + RVAD.
Year
18-34
35-49
50-64
65+
All
98 00 02 04 06 08 10
Tran
spla
nts
per 1
00 w
ait-l
ist y
ears
0
20
40
60
80
100
HR 1.4 Heart transplant rates among adult waiting list candidates, by age
Patients waiting for a transplant; age as of Janu-ary 1 of the given year. Yearly period-prevalent rates computed as the number of deceased donor transplants per 100 patient years of waiting time in the given year. All waiting time per patient per listing is counted, and all listings that end in a transplant for the patient are con-sidered transplant events.
data behind the figures can be downloaded from our website, at www.srtr.org
wait list
HR 1.6 Outcomes for adult patients waiting for a heart transplant among new listings in 2008
Patients waiting for a transplant and first listed in 2008. Patients with concurrent listings at more than one center are counted once, from the time of the earliest listing to the time of lat-est removal.
2009 2010 2011Patients at start of year 2,409 2,668 2,867 Patients added during year 2,890 2,916 2,783 Patients removed during year 2,625 2,710 2,837 Patients at end of year 2,674 2,874 2,813 Removal reason
Deceased donor transplant 1,840 1,965 1,931 Patient died 435 400 441Patient refused transplant 14 12 18Improved, tx not needed 193 164 166Too sick to transplant 55 61 92Other 88 108 189
HR 1.5 Heart transplant waiting list activity among adult patients
Patients with concurrent listings at more than one center are counted once, from the time of earliest listing to the time of latest removal. Patients listed, transplanted, and re-listed are counted more than once. Patients are not considered “on the list” on the day they are removed. Thus, patient counts on January 1 may be different from patient counts on December 31 of the prior year.

128 OPTN & SRTR Annual Data Report 2011
98-99 00-01 02-03 04-05 06-07 08-09 10-110
10
20
30
40
Status 1A Status 1B
Status 2
Inactive
98-99 00-01 02-03 04-05 06-07 08-09 10-11
No VAD
VAD
All
Status at listing VAD at listing
Year
Med
ian
mon
ths
to tr
ansp
lant
HR 1.7 Median months to heart transplant for wait-listed adult patientsPatients waiting for a transplant, with observations censored at December 31, 2011; Kaplan-Meier method used to estimate time to transplant. If an estimate is not plotted for a certain year, 50% of the cohort listed in that year had not been transplanted at the censoring date. Only the first transplant is counted.
41.7 50.3 61.8 66.7
34.4 72.7No tx program
HR 1.8 Percent of adult wait-listed patients, 2010, who received a deceased donor heart transplant within one year, by DSA
Patients with concurrent listings in a single DSA are counted once in that DSA, and those listed in multiple DSAs are counted separately per DSA.
Year of listing
98 00 02 04 06 08 10
Perc
ent
0
20
40
60
80
100
White
Black
Hispanic
Other/unk.
All
Race Blood type
98 00 02 04 06 08 10
A
B
AB
O
HR_1_866.8 - 81.0 (72.7)
61.9 - 66.7
50.4 - 61.8
41.8 - 50.3
27.1 - 41.7 (34.4)
Data n/a
wait list
HR 1.9 Adult wait-listed patients who received a deceased donor heart transplant within one year
Patients with concurrent listings at more than one center are counted once, from the time of earliest listing to the time of latest removal. Patients listed, transplanted, and re-listed are counted more than once.

heart 129
Deat
hs p
er 10
0 w
ait-l
ist y
ears
0
10
20
30
Year
18-34
35-49
50-64
65+
All
Age Race Primary cause of disease
VAD at listing0
10
20
30
White
Black
Hispanic
Asian 0
5
10
15
20
25 Coronary artery dis.
Cardiomyopathy
Congenital disease
Valvular disease
98 00 02 04 06 08 100
30
60
90
120
150
No VAD
VAD
98 00 02 04 06 08 100
10
20
30
40 A
B
AB
O
Blood type
98 00 02 04 06 08 100
50
100
150
2001A
1B
2
Inactive
Medical urgency status
wait list
HR 1.10 Pre-transplant mortality rates among adult patients wait-listed for a heart transplantPatients waiting for a transplant. Mortality rates are computed as the number of deaths per 100 patient-years of waiting time in the given year. For rates shown by dif-ferent characteristics, waiting time is calculated as the total waiting time in the year for patients in that group. Only deaths that occur prior to removal from the waiting list are counted. Age is calculated on the latest of listing date or January 1 of the given year. Other patient characteristics come from the OPTN Transplant Candidate Registration form. Medical urgency status is the earliest known status in the given year.

130 OPTN & SRTR Annual Data Report 2011
4.2 5.5 7.0 10.0
2.2 23.2No tx program
HR_1_1110.1 - 100.0 (23.2)
7.1 - 10.0
5.6 - 7.0
4.3 - 5.5
0.0 - 4.2 (2.2)
Data n/a
wait list
HR 1.11 Mortality within 90 days of listing for heart transplant, by DSA, 2009–2010
Patients with concurrent listings in a single DSA are counted once in that DSA, and those listed in multiple DSAs are counted separately per DSA. Deaths occuring within 90 days, but after transplant or removal from the waiting list, are included.
Level2001
N %2011
N %Age 18-34
35-4950-6465+
270859
2,081421
7.423.757.311.6
305632
1,401481
10.822.449.717.1
Sex FemaleMale
7592,872
20.979.1
7052,114
25.075.0
Race WhiteBlackHispanic AsianOther/unknown
2,863489206
6013
78.913.5
5.71.70.4
1,952602178
6126
69.221.4
6.32.20.9
Primary causeof disease
Cor. artery diseaseCardiomyopathyCongenital diseaseValvular diseaseOther/unknown
1,6801,634
8785
145
46.345.0
2.42.34.0
1,0791,414
12653
147
38.350.2
4.51.95.2
Transplanthistory
Listed/first transplant Listed/subseq. transplant
3,53299
97.32.7
2,706113
96.04.0
Blood type ABABO
1,164348
672,052
32.19.61.9
56.5
906301
601,552
32.110.7
2.155.1
Time onwait list
<1 year1-<22-<33-<44-<55+
1,282722457356237577
35.319.912.6
9.86.5
15.9
1,387626323166
71246
49.222.211.5
5.92.58.7
Medicalurgencystatus
1A1B2Inactive
83315
1,7591,405
2.38.8
49.439.4
203901936779
2,819
7.232.033.227.6
100.0Total 3,631 100.0
HR 1.12 Characteristics of adult patients on the heart transplant waiting list on December 31, 2001 & December 31, 2011
Patients waiting for a transplant on December 31, 2001 and December 31, 2011, regardless of first listing date; active/inactive status is on this date, and mul-tiple listings are not counted.

heart 131
deceased donation
Year
00 02 04 06 08 10
Dona
tions
per
1,00
0 de
aths
0
5
10
15
20
0-14
15-34
35-44
45-54 55-64
Age SexMale
Female
All
Race
00 02 04 06 08 10 00 02 04 06 08 10
White
Black
Hispanic
Asian
Other/unk.
HR 2.1 Deceased donor heart donation ratesNumerator: Deceased donors age less than 65 whose organ(s) were recovered for transplant. Denominator: US deaths per year, age less than 65. (Death data available at http://www.cdc.gov/nchs/products/nvsr.htm.)
0.70 0.83 0.95 1.12
0.58 1.31
0.70 0.83 0.95 1.12
0.53 1.29
2005–2007 2008–2010
n/a n/a
HR 2.2 Deceased donor heart donation rates (per 1,000 deaths), by stateNumerator: Deceased donors residing in the 50 states whose heart was recovered for transplant in the given year range. Denominator: US deaths by state during the given year range (death data available at http://www.cdc.gov/nchs/products/nvsr.htm). Rates are calculated within ranges of years for more stable estimates.
Year
98 00 02 04 06 08 10
Mea
n nu
mbe
r of o
rgan
s
0.0
0.1
0.2
0.3
0.4Hearts recovered
Hearts transplanted
HR 2.3 Hearts recovered per donor & hearts transplanted per donor
Denominator: all deceased donors with at least one organ of any type recovered for transplant. Numerator for recovery rate: number of hearts recovered for transplant in the given year; hearts recovered for other purposes are not included. Numerator for transplant rate: all deceased donor hearts transplanted in given year.
HR_2_2_08_101.13 - 1.89 (1.29)
0.96 - 1.12
0.84 - 0.95
0.71 - 0.83
0.28 - 0.70 (0.53)
Data n/a
HR_2_2_05_071.13 - 1.89 (1.31)
0.96 - 1.12
0.84 - 0.95
0.71 - 0.83
0.14 - 0.70 (0.58)
Data n/a

132 OPTN & SRTR Annual Data Report 2011
Year
98 00 02 04 06 08 10
Perc
ent
0
1
2
3
4
5
Kidney
Liver
Lung
Any
HR 2.4 Deceased donor hearts transplanted with another organ
All patients receiving a deceased donor heart transplant. A transplant is considered multi-organ if any organ of a different type is trans-planted at the same time. A multi-organ trans-plant may include more than two different organs in total; if so, each non-heart organ will be considered separately.
Year
98 00 02 04 06 08 10Pe
rcen
t0
2
4
6
8
100-17
18-34
35-49
50-64
HR 2.5 Discard rates for hearts recovered for transplant, by age
Percent of hearts discarded out of all hearts recovered for transplant.
Reasons for discard Percent NOther, specify 47.06 8Anatomical abnormalities 17.65 3Diseased organ 5.88 1Donor medical history 5.88 1Missing 5.88 1Organ trauma 5.88 1Poor organ function 5.88 1Too old on ice 5.88 1
HR 2.6 Reasons for discards, 2011Reasons for discard among hearts recovered for transplant but not transplanted in 2011.
Year
98 00 02 04 06 08 100
20
40
60
80
100
0
10
20
30
40
50
Perc
ent
Mea
n
65+
50-64
35-49
18-34
0-17
HR 2.7 Heart donor ageTransplanted hearts from US donors; age calcu-lated at date of donation.
98 00 02 04 06 08 100
20
40
60
80
Anoxia
Cerebrovascular/stroke
Head trauma
Year
Perc
ent
CNS tumor Other
deceased donation
HR 2.8 Cause of death among deceased heart donors
Deceased donors whose heart was transplanted. CNS = central nervous system.

heart 133
transplant
Year
98 00 02 04 06 08 10
Tran
spla
nts
0
500
1,000
1,500
2,000
2,500
HR 3.1 Total adult heart transplantsPatients receiving a transplant. Retransplants are counted.
98 00 02 04 06 08 10
Tran
spla
nts
0
300
600
900
1,200
1,500
1,800
50-64 18-34
35-49
65+
Age Sex
Race
98 00 02 04 06 08 10
Male
Female
Year98 00 02 04 06 08 10
0
300
600
900
1,200
1,500
1,800
White
Black
Hispanic
Asian
Other/unk.
98 00 02 04 06 08 10
Coronary artery disease
Cardiomyopathy
Congenital disease
Valvular disease
Other/unknown
Primary cause of disease
HR 3.2 Adult heart transplantsPatients receiving a transplant. Retransplants are counted.

134 OPTN & SRTR Annual Data Report 2011
Year
98 00 02 04 06 08 10
Tran
spla
nts
per 1
00 w
ait-l
ist y
ears
0
50
100
150
200
250
No VAD
VAD
All
98 00 02 04 06 08 100
100
200
300
400
500
600
1A
1B
2
VAD at listing Medical urgency status
HR 3.3 Heart transplant rates in adult waiting list candidatesPatients waiting for a transplant. Transplant rates are computed as the number of transplants per 100 patient-years of waiting time in the given year. For rates by VAD and status, waiting time is calculated as the total waiting time in the given year for patients in each VAD/status group. All waiting time per patient per listing is counted, and all listings that end in a transplant for the patient are considered transplant events. Medical urgency status is updated each year, using the earliest known status in the given year.
42.7 57.6 87.2 124.4
29.6 249.9No txprogram
HR 3.4 Deceased donor heart transplant rates per 100 patient years on the waiting list among adult candidates, by DSA, 2010–2011
Transplant rates by DSA of the listing center, limited to those on the waiting list in 2010 and 2011; deceased donor transplants only. Maxi-mum time per listing is two years.
Year
98 00 02 04 06 08 10
Mea
n ag
e
0
20
40
60
80
25th percentile
Mean age
75th percentile
HR 3.5 Age at transplant for adult heart recipients
Patients receiving a transplant in the given year. Retransplants are included.
Year
98 00 02 04 06 08 10
Mea
n to
tal i
sche
mia
tim
e (h
ours
)
0
1
2
3
4
25th percentile
Mean ischemia time
75th percentile
124.5+ (249.9)
87.3 - 124.4
57.7 - 87.2
42.8 - 57.6
below 42.7 (29.6)
Data n/a
transplant
HR 3.6 Total ischemia time for adult heart transplants
Patients receiving a transplant in the given year. Retransplants are included. Total ischemia time includes cold, warm, and anastomotic time.

heart 135
Year
98 00 02 04 06 08 10
Perc
ent
0
10
20
30
40
50
60
LVAD
Balloon pump
IV inotropes RVAD Ventilator
Other
None
HR 3.7 Adult heart recipients on circulatory support prior to transplant
Patients may have more than one type of circu-latory support. The “other” category includes types of circulatory support found in less than 2% of patients each year: total artificial heart, ECMO, inhaled NO, prostaglandins, and others.
98 00 02 04 06 08 100
20
40
60
80
100
Year
Perc
ent
Other/unk.
Private
Other gvmt.
Medicare
Medicaid
HR 3.8 Insurance coverage among adult heart transplant recipients at time of transplant
Patients receiving a transplant. Retransplants are counted.
2001 2011 Level N % N %Age 18-34 194 10.1 220 11.3
35-49 457 23.7 384 19.750-64 1,070 55.5 1,013 52.065+ 208 10.8 332 17.0
Sex Female 461 23.9 544 27.9Male 1,468 76.1 1,405 72.1
Race White 1,485 77.0 1,324 67.9Black 264 13.7 406 20.8Hispanic 125 6.5 154 7.9Asian 47 2.4 57 2.9Other/unk. 8 0.4 8 0.4
Primary cause of disease
Coronary artery dis. 925 48.0 738 37.9Cardiomyopathy 884 45.8 1,060 54.4Congenital disease 61 3.2 71 3.6Valvular disease 50 2.6 27 1.4Other/unknown 9 0.5 53 2.7
Transplant history
First 1,876 97.3 1,869 95.9Subsequent 53 2.7 80 4.1
Blood type A 842 43.6 792 40.6B 261 13.5 276 14.2AB 118 6.1 105 5.4O 708 36.7 776 39.8
Primary payor Private 1,160 60.1 941 48.3Medicaid 204 10.6 191 9.8Medicare 447 23.2 714 36.6Other government 70 3.6 55 2.8Other/unknown 48 2.5 48 2.5
Time on wait list <30 days 485 25.1 531 27.231-60 days 241 12.5 238 12.261-90 days 195 10.1 199 10.23-<6 months 325 16.8 304 15.66-<12 months 299 15.5 323 16.61-<2 years 228 11.8 232 11.92-<3 years 82 4.3 73 3.73+ years 74 3.8 49 2.5
Medical urgency 1A 676 35.0 1,097 56.3status 1B 766 39.7 728 37.4
2 486 25.2 124 6.4Other 1 0.1 0 0.0
Reported history of cigarette smoking at listing
No n/a n/a 1,044 53.6Yes n/a n/a 898 46.1Unknown n/a n/a 7 0.4
VAD status No VAD 63 3 1,116 57.3VAD 513 27 819 42.0Unknown 1,353 70 14 0.7
Total 1,929 100.0 1,949 100.0
HR 3.9 Characteristics of adult heart transplant recipients, 2001 & 2011
Patients receiving a transplant. Retransplants are counted. Ventricular assist device information comes from the OPTN Transplant Recipient Registration form and includes LVAD, RVAD, TAH, and LVAD + RVAD. Smoking history and VAD status were not collected on the TRR form in 2001.
transplant
136 OPTN & SRTR Annual Data Report 2011
donor-recipient matching
Year
98 00 02 04 06 08 10
Perc
ent
0
20
40
60
80
0%
1-19%
20-79%
≥80%Unknown
HR 4.1 PRA at time of heart transplant in adult recipients
PRA is the maximum of the most recent values recorded at the time of transplant. If “most recent PRA” is not provided, peak PRA is used.
98 00 02 04 06 08 100
20
40
60
80
100
Perc
ent
Unk.6 5 4
3 2 1 0
Year
HR 4.2 Total HLA mismatches among adult heart transplant recipients
Donor and recipient antigen matching is based on the OPTN’s antigen values and split equiva-lences policy as of 2011.
98 00 02 04 06 08 100
20
40
60
80
100
Perc
ent
Unk.
2
1
0
Year
HR 4.3 HLA-A mismatches among adult heart transplant recipients
Donor and recipient antigen matching is based on the OPTN’s antigen values and split equiva-lences policy as of 2011.
98 00 02 04 06 08 100
20
40
60
80
100
Perc
ent
Unk.
2
1
0
Year
HR 4.4 HLA-B mismatches among adult heart transplant recipients
Donor and recipient antigen matching is based on the OPTN’s antigen values and split equiva-lences policy as of 2011.
98 00 02 04 06 08 100
20
40
60
80
100
Year
Perc
ent
Unk.
2
1
0
HR 4.5 HLA-DR mismatches among adult heart transplant recipients
Donor and recipient antigen matching is based on the OPTN’s antigen values and split equiva-lences policy as of 2011.

heart 137
donor-recipient matching
HR 4.8 Adult heart donor-recipient hepatitis B core antibody (HBcAb) serology matching, 2007–2011
Adult transplant cohort from 2007–2011. Donor serology is reported on the OPTN Donor Registration forms; recipient serology is reported on the OPTN Recipient Registration forms. Any evidence for a positive serology is taken to indicate that the person is positive for the given serology; if all fields are unknown, not done, or pending the person is considered to be “unknown” for that serology; otherwise, serology is assumed negative.
HR 4.6 Adult heart donor-recipient cytomegalovirus (CMV) serology matching, 2007–2011
Adult transplant cohort from 2007–2011. Donor serology is reported on the OPTN Donor Registration forms; recipient serology is reported on the OPTN Recipient Registration forms. Any evidence for a positive serology is taken to indicate that the person is positive for the given serology; if all fields are unknown, not done, or pending the person is considered to be “unknown” for that serology; otherwise, serology is assumed negative.
HR 4.10 Adult heart donor-recipient hepatitis C serology matching, 2007–2011
Adult transplant cohort from 2007–2011. Donor serology is reported on the OPTN Donor Registration forms; recipient serology is reported on the OPTN Recipient Registration forms. Any evidence for a positive serology is taken to indicate that the person is positive for the given serology; if all fields are unknown, not done, or pending the person is considered to be “unknown” for that serology; otherwise, serology is assumed negative.
HR 4.9 Adult heart donor-recipient hepatitis B surface antigen (HBsAg) serology matching, 2007–2011
Adult transplant cohort from 2007–2011. Donor serology is reported on the OPTN Donor Registration forms; recipient serology is reported on the OPTN Recipient Registration forms. Any evidence for a positive serology is taken to indicate that the person is positive for the given serology; if all fields are unknown, not done, or pending the person is considered to be “unknown” for that serology; otherwise, serology is assumed negative.
HR 4.7 Adult heart donor-recipient Epstein-Barr virus (EBV) serology matching, 2007–2011
Adult transplant cohort from 2007–2011. Donor serology is reported on the OPTN Donor Registration forms; recipient serology is reported on the OPTN Recipient Registration forms. Any evidence for a positive serology is taken to indicate that the person is positive for the given serology; if all fields are unknown, not done, or pending the person is considered to be “unknown” for that serology; otherwise, serology is assumed negative.
HR 4.11 Adult heart donor-recipient human immunodeficiency virus (HIV) serology matching, 2007–2011
Adult transplant cohort from 2007–2011. Donor serology is reported on the OPTN Donor Registration forms; recipient serology is reported on the OPTN Recipient Registration forms. Any evidence for a positive serology is taken to indicate that the person is positive for the given serology; if all fields are unknown, not done, or pending the person is considered to be “unknown” for that serology; otherwise, serology is assumed negative.
DONORRECIPIENT Negative Positive Unknown Total
Negative 82.8 1.7 0.1 84.6
Positive 4.2 0.2 0.0 4.4
Unknown 10.9 0.1 0.0 11.0
Total 97.9 2.0 0.1 100
DONORRECIPIENT Negative Positive Unknown Total
Negative 14.1 22.6 0.1 36.8
Positive 22.2 36.8 0.2 59.2
Unknown 1.7 2.4 0.0 4.1
Total 38.0 61.8 0.3 100
DONORRECIPIENT Negative Positive Unknown Total
Negative 91.2 0.0 0.0 91.2
Positive 1.9 0.0 0.0 2.0
Unknown 6.8 0.0 0.0 6.8
Total 99.9 0.1 0.0 100
DONORRECIPIENT Negative Positive Unknown Total
Negative 94.7 0.0 0.1 94.8
Positive 1.7 0.0 0.0 1.7
Unknown 3.5 0.0 0.0 3.5
Total 99.9 0.0 0.1 100
DONORRECIPIENT Negative Positive Unknown Total
Negative 0.9 13.0 0.4 14.4
Positive 3.9 60.6 1.7 66.2
Unknown 0.9 17.9 0.7 19.5
Total 5.7 91.5 2.8 100
DONORRECIPIENT Negative Positive Unknown Total
Negative 92.0 0.0 0.1 92.1
Positive 0.2 0.0 0.0 0.2
Unknown 7.7 0.0 0.0 7.7
Total 99.9 0.0 0.1 100

138 OPTN & SRTR Annual Data Report 2011
outcomes
Year
91 93 95 97 99 01 03 05 07 09 Pr
obab
ility
of g
raft
failu
re0.0
0.1
0.2
0.3
0.4
0.5
0.6
6 months 1 year 3 years 5 years 10 years
HR 5.1 Graft failure among adult heart transplant recipients
Cox proportional hazards models reporting probability, adjusting for age, sex, and race.
98 00 02 04 06 08 100
2
4
6
8
10
Year
Perc
ent
HR 5.2 Graft failure within the first 6 weeks after transplant among adult heart transplant recipients
All-cause graft failure is identified from multiple data sources, including the OPTN Transplant Recipient Registration, OPTN Transplant Recip-ient Follow-up, as well as death dates from the Social Security Administration.
Months post-transplant
0 12 24 36 48 60
Perc
ent g
raft
surv
ival
70
80
90
100Coronary artery disease
Cardiomyopathy
Other
All
0 12 24 36 48 60
Status 1A
Status 1B
Status 2
Medical urgency status at transplantPrimary cause of disease
HR 5.3 Graft survival among adult heart transplant recipients transplanted in 2006Graft survival estimated using unadjusted Kaplan-Meier methods.

heart 139
91 93 95 97 99 01 03 05 07 09 0
3
6
9
12
15
Year
Half-
life
(in y
ears
)
Deceased donor
Deceased donor (1-year conditional survival)
HR 5.4 Half-lives for adult heart transplant recipients
Estimated graft half-lives and conditional half-lives. Half-lives are interpreted as the estimated median survival of grafts from the time of trans-plant. Conditional half-lives are interpreted as the estimated median survival of grafts which survive the first year.
Year
98 00 02 04 06 08 10
Patie
nts
(in th
ousa
nds)
0
5
10
15
20
25
Adult
Pediatric
All
HR 5.5 Recipients alive & with a functioning heart transplant on June 30 of the year
Transplants before June 30 of the year that are still functioning. Patients are assumed alive with function unless a death or graft failure is recorded. A recipient can experience a graft fail-ure and drop from the cohort, then be retrans-planted and re-enter the cohort.
0 12 24 36 48 600
20
40
60
Months post-transplant
Perc
ent
HR 5.6 Incidence of first acute rejection among adult patients receiving a heart transplant in 2005–2009
Acute rejection defined as a record of acute or hyperacute rejection, or a record of an anti-rejection drug being administered on either the Transplant Recipient Registration form or the Transplant Recipient Follow-up Form. Only the first rejection event is counted, and patients are followed for acute rejection only until graft failure, death, or loss to follow-up. Cumulative incidence, defined as the probability of acute rejection at any time prior to the given time, is estimated using Kaplan-Meier methods.
1 yr 2 yrs 3 yrs 4 yrs0
20
40
60
80
Time post-transplant
Perc
ent
HR 5.7 Reported cumulative incidence of rehospitalizations among adult patients receiving a heart transplant in 2006–2011
Cumulative incidence of rehosptalization post-transplant; hospitalization identified from the OPTN Transplant Recipient Follow-up form. Patients required to be alive with graft function at each time period, so denominators reduce over time.
0 12 24 36 48 600
1
2
3Recipient EBV-
Recipient EBV+ Recipient EBV unk. All
Months post-transplant
Perc
ent
outcomes
HR 5.8 Incidence of PTLD among adult patients receiving a heart transplant in 2005–2009, by recipient Epstein-Barr virus (EBV) status at transplant
The cumulative incidence, defined as the prob-ability of post-transplant lymphoproliferative disorder (PTLD) being diagnosed between the time of transplant and the given time, is estimated using Kaplan-Meier methods. PTLD is identified as either a reported complication or cause of death on the Transplant Recipi-ent Follow-up forms or on the Post-transplant Malignancy form as polymorphic PTLD, mono-morphic PTLD, or Hodgkin’s Disease. Only the earliest date of PTLD diagnosis is considered, and patients are followed for PTLD until graft failure, death, or loss to follow-up. Patients are censored at graft failure because malignancies are not reliably reported after graft failure.

140 OPTN & SRTR Annual Data Report 2011
Perc
ent p
atie
nt s
urvi
val
50
60
70
80
90
100
Female
Male
All
Gender
18-34
35-49
50-64
65+
Months post-transplant
0 12 24 36 48 6050
60
70
80
90
100
White
Black
Other/unk.
0 12 24 36 48 60
Durable VAD
No VAD
Non-durable VAD
Age
Race Ventricular assist device
HR 5.9 Patient survival among adult heart transplant recipients, 2005–2006Percent patient survival using unadjusted Kaplan-Meier methods. For patients with more than one trans-plant during the period, only their first transplant is considered. VAD status for each patient comes from time of transplant. Patients with both durable and non-durable VADs are included in the durable group.
Year
98 00 02 04 06 08 100
20
40
60
80
100 Other/unknown
Organ failure
Malignancy
Cardiovascular
Infection
Graft failure: chronic
Graft failure: acute technical
Perc
ent
outcomes
HR 5.10 Cause of death among adult heart transplant recipientsPatients who died in a given year are included regardless of when transplant was received. Primary cause of death is as reported by the OPTN from the Transplant Follow-up forms. Other causes of death include hemorrhage, trauma, non-compliance, unspecified other, unknown, etc.

heart 141
immunosuppression
0 10 20 30 40 50 60 70 80
Percent
With steroids
Steroid-free
TAC + MMF/MPA
Cyclo + MMF/MPA
None reported
All others
HR 6.1 Initial immunosuppression regimen in adult heart transplant recipients, 2011
Patients transplanted in 2011 and discharged with a functioning graft. Top three baseline immunosuppression regimens are given, plus the “all others” group. Regimens are defined by use of calcineurin inhibitors (TAC=Tacrolimus, Cyclo=Cyclosporine), anti-metabolites (AZA=Azathioprine, MMF/MPA=Mycophenolate), and mTOR inhibitors (mTOR). Data within each regimen are reported separately by steroid use.
0 10 20 30 40 50 60
Percent
II2-RA
II2-RA & T-cell depleting
T-cell depleting
None
HR 6.2 Induction agents used at time of heart transplant, adult recipients, 2011
Patients transplanted in 2011 and discharged with a functioning graft.
0 10 20 30 40 50 60 70 80
Percent
With steroids
Steroid-free
TAC + MMF/MPA
Cyclo + MMF/MPA
TAC
All others
HR 6.3 Immunosuppression at one year in adult heart transplant recipients, 2010
Patients transplanted in 2010 and remaining alive with graft function one year post-transplant. Top three one-year immunosuppression regimens are given, plus the “all others” group. Regimens are defined by use of calcineu-rin inhibitors (TAC=Tacrolimus, Cyclo=Cyclosporine), anti-metabolites (AZA=Azathioprine, MMF/MPA=Mycophenolate), and mTOR inhibitors (mTOR). Data within each regimen are reported separately by steroid use.
98 02 06 100
20
40
60
80
100
98 02 06 10 98 02 06 10 98 02 06 10 98 02 06 10
IL2-RA
T-cell depleting
None
Perc
ent
Calcineurin inhibitors (at tx) Anti-metabolites (at transplant) mTOR inhibitors
Year
At transplant 1 year post-tx
At transplant 1 year post-tx
Steroids Induction agents
Cyclosporine
Tacrolimus
Azathioprine
Mycophenolate
HR 6.4 Immunosuppression use in adult heart transplant recipientsOne-year post-transplant data for mTOR inhibitors and steroids limited to patients alive with graft function one year post-transplant. One-year post-transplant data are not reported for 1998 transplant recipients, as follow-up data were very sparse.

142 OPTN & SRTR Annual Data Report 2011
pediatric transplant
Year
98 00 02 04 06 08 10
Patie
nts
0
200
400
600
Active
Inactive
New patients
98 00 02 04 06 08 10
Patients on the list on 12.31 of the given year
HR 7.1 Pediatric patients waiting for a heart transplantPatients waiting for a transplant. A “new patient” is one who first joins the list during the given year, without having listed in a previous year. However, if a patient has previously been on the list, has been removed for a transplant, and has relisted since that transplant, the patient is considered a “new patient”. Patients con-currently listed at multiple centers are counted only once. Those with concurrent listings and active at any program are considered active; those inactive at all programs at which they are listed are considered inactive.
HR 7.2 Distribution of pediatric patients waiting for a heart transplantPatients waiting for a transplant any time in the given year. Age determined on the lastest of listing date or January 1 of the given year. Concurrently listed patients are counted once.
98-99 00-01 02-03 04-05 06-07 08-09 10-110
10
20
30
0-5
6-10
11-17
All
Year
Perc
ent
HR 7.3 Prior heart transplant in pediatric patients waiting for a heart transplant, by age
Prior transplant is obtained from the OPTN Transplant Candidate Registration form.

heart 143
2009 2010 2011Patients at start of year 287 304 293Patients added during year 537 487 544Pts removed during year 518 497 536Patients at end of year 306 294 301Removal reason
Received a transplant 365 364 384Patient died 82 65 69Patient refused transplant 1 1 0Improved, tx not needed 47 43 47Too sick to transplant 19 19 23Other 4 5 13
HR 7.4 Heart transplant waiting list activity among pediatric patients
Patients with concurrent listings at more than one center are counted once, from the time of earliest listing to the time of latest removal. Patients listed, transplanted, and re-listed are counted more than once. Patients are not considered “on the list” on the day they are removed. Thus, patient counts on January 1 may be different from patient counts on December 31 of the prior year.
HR 7.5 Outcomes for pediatric patients waiting for a heart transplant among new listings in 2008
Patients waiting for a transplant and first listed in 2008. Patients with concurrent listings at more than one center are counted once, from the time of the earliest listing to the time of lat-est removal.
Year of listing
98-99 00-01 02-03 04-05 06-07 08-09 2010
Perc
ent
0
20
40
60
80
A
B
AB
O
All
HR 7.6 Pediatric wait-listed patients who receive a deceased donor heart transplant within one year, by blood type
Patients with concurrent listings at more than one center are counted once, from the time of earliest listing to the time of latest removal. Patients listed, transplanted, and re-listed are counted more than once.
0
20
40
60
80
100
Year
98-9900-01
02-0304-05
06-0708-09
10-11
Deat
hs p
er 10
0 w
ait-l
ist y
ears <1
1-5
6-10
11-17
All
HR 7.7 Pre-transplant mortality rates among pediatric patients wait-listed for a heart transplant, by age
Patients waiting for a transplant. Mortality rates are computed as the number of deaths per 100 patient-years of waiting time in the given 2-year interval. Waiting time is calculated as the total waiting time per age group in the interval. Only deaths that occur prior to removal from the waiting list are counted. Age is calculated on the latest of listing date or January 1 of the given period.
Year
98 00 02 04 06 08 10
Tran
spla
nts
0
25
50
75
100
125<1
1-5
6-11
12-17
HR 7.8 Pediatric heart transplants (including heart-lung), by age
Patients receiving a heart or heart-lung transplant.
Year
98 00 02 04 06 08 10
Tran
spla
nts
per 1
00 p
t yea
rs o
n W
L
0
100
200
300
400
<1
1-5
6-10
11+
All
pediatric transplant
HR 7.9 Heart transplant rates in pediatric waiting list candidates, by age
Patients waiting for transplant. Transplant rates are computed as the number of transplants per 100 patient-years of waiting time in the given year. Patients with concurrent listings at mul-tiple centers are counted once.

144 OPTN & SRTR Annual Data Report 2011
1999-2001 2009-2011 Level N % N %Age <1 197 24.7 331 30.3
1-5 206 25.8 246 22.56-10 111 13.9 147 13.511-17 284 35.6 367 33.6
Sex Female 349 43.7 511 46.8Male 449 56.3 580 53.2
Race White 492 61.7 595 54.5Black 157 19.7 225 20.6Hispanic 111 13.9 195 17.9Asian 33 4.1 54 4.9Other/unk. 5 0.6 22 2.0
Primary cause Congenital defect 332 41.6 473 43.4of disease Dilated myopathy: idiopathic 264 33.1 320 29.3
Restrictive myopathy: idiopathic 42 5.3 47 4.3Dilated myopathy: myocarditis 15 1.9 49 4.5All others 145 18.2 202 18.5
Transplant history First transplant 739 92.6 1018 93.3Subsequent 59 7.4 73 6.7
Blood type A 310 38.8 403 36.9B 91 11.4 150 13.7AB 37 4.6 55 5.0O 360 45.1 483 44.3
Primary payer Private 432 54.1 509 46.7Medicaid 280 35.1 476 43.6Other public 53 6.6 76 7.0Other 33 4.1 30 2.7
Time on wait list <30 days 349 43.7 407 37.331-60 days 144 18.0 228 20.961-90 days 83 10.4 128 11.73-<6 months 107 13.4 190 17.46-<12 months 75 9.4 100 9.21-<2 years 29 3.6 29 2.72-<3 years 9 1.1 2 0.23+ years 2 0.3 7 0.6
Status 1A 496 62.2 950 87.11B 136 17.0 78 7.12 155 19.4 63 5.8Unknown 11 1.4 0 0.0
Patient on VAD No 30 3.8 889 81.5Yes 61 7.6 200 18.3Unknown 707 88.6 2 0.2
All patients 798 100.0 1091 100.0
HR 7.10 Characteristics of pediatric heart transplant patients, 1999–2001 & 2009–2011
Patients receiving a transplant. Retransplants are counted.
98 00 02 04 06 08 100
20
40
60
80
100
Year
Perc
ent
Other
Other public
Medicaid
Private
HR 7.11 Insurance coverage among pediatric heart transplant recipients at time of transplant
Patients receiving a transplant in given year; reported primary insurance payor at time of transplant. Retransplants are counted.
0 12 24 36 48 600
2
4
6
8
10
Recipient EBV-
Months post-transplant
Perc
ent Recipient EBV+
Recipient EBV unk. All
pediatric transplant
HR 7.12 Incidence of PTLD among pediatric patients receiving a heart transplant, 1999–2009, by recipient Epstein-Barr virus (EBV) status at transplant
The cumulative incidence, defined as the prob-ability of post-transplant lymphoproliferative disorder (PTLD) being diagnosed between the time of transplant and the given time, is estimated using Kaplan-Meier methods. PTLD is identified as either a reported complication or cause of death on the Transplant Recipi-ent Follow-up forms or on the Post-transplant Malignancy form as polymorphic PTLD, mono-morphic PTLD, or Hodgkin’s Disease. Only the earliest date of PTLD diagnosis is considered, and patients are followed for PTLD until graft failure, death, or loss to follow-up. Patients are censored at graft failure because malignancies are not reliably reported after graft failure.

heart 145
98 02 06 100
20
40
60
80
100
98 02 06 10 98 02 06 10 98 02 06 10 98 02 06 10
T-cell depleting Perc
ent
Cyclosporine
Tacrolimus
Calcineurin inhibitors (at tx) Anti-metabolites (at transplant) mTOR inhibitors
Year
Azathioprine
Mycophenolate
At transplant 1 year post-tx
At transplant 1 year post-tx
Steroids
IL2-RA
None
Induction agents
HR 7.13 Immunosuppression use among pediatric heart transplant recipientsOne-year post-transplant data for mTOR inhibitors and steroids limited to patients alive with graft function one year post-transplant. One-year post-transplant data are not reported for 1998 transplant recipients, as follow-up data were very sparse.
Year
91 95 99 03 07 09
Prob
abili
ty o
f gra
ft fa
ilure
0.0
0.2
0.4
0.6
6 mo. 1 yr
3 yrs
5 years
10 years
HR 7.14 Graft failure among pediatric heart transplant recipients
Cox proportional hazards model reporting probability, adjusting for age, sex, and race.
0
5
10
15
20
Year
91-9293-94
95-9697-98
99-0001-02
03-0405-06
07-0809-10
Half-
life
(in y
ears
)
Deceased donor
Deceased donor (1-year conditional survival)
HR 7.15 Half-lives for pediatric heart transplant recipients
Estimated graft half-lives and conditional half-lives. Half-lives are interpreted as the estimated median survival of grafts from the time of trans-plant. Conditional half-lives are interpreted as the estimated median survival of grafts which survive the first year.
0 6 12 18 240
10
20
30
40
Months post-transplant
Perc
ent
HR 7.16 Incidence of first acute rejection among pediatric patients receiving a heart transplant in 2005–2010
Acute rejection defined as a record of acute or hyperacute rejection, or a record of an anti-rejection drug being administered on either the Transplant Recipient Registration form or the Transplant Recipient Follow-up Form. Only the first rejection event is counted, and patients are followed for acute rejection only until graft failure, death, or loss to follow-up. Cumulative incidence, defined as the probability of acute rejection at any time prior to the given time, is estimated using Kaplan-Meier methods.
pediatric transplant

146 OPTN & SRTR Annual Data Report 2011
Kans
as C
ity
Char
lotte
svill
e
Falls
Chu
rch
Char
lest
on
Spok
ane
Nash
ville
(2)
Dalla
s (4
)
Tem
ple
Aust
in
Hous
ton
(3)
San
Anto
nio
(2)
Roch
este
r
Cinc
inna
tiColu
mbu
s (2
)
Clev
elan
d (2
)He
rshe
y
Pitts
burg
h (3
)
San
Juan
Roch
este
r
Sain
t Lou
is (2
)
Jack
son
Durh
am
Chap
el H
ill
Om
aha
New
ark
Gran
d Ra
pids
Ann
Arbo
r
New
Orle
ans
(2)
Balti
mor
e (2
)
Bost
on (4
)
Gain
esvi
lle
Chic
ago
(3)
May
woo
d
Oak
Law
n
Jack
sonv
ille
Birm
ingh
am
Littl
e Ro
ck (2
)
Was
hing
ton
Orla
ndo
Indi
anap
olis
(2)
Hartf
ord
Sacr
amen
to
Tucs
on
Phoe
nix
(2)
San
Dieg
o (2
)
Lom
a Li
nda
Auro
ra (2
)
New
Hav
en
Tam
pa
Palo
Alto
Stan
ford
Min
neap
olis
(2)
New
Yor
k (2
)
Okl
ahom
a Ci
ty
Phila
d elp
hia
(5)
Rich
mon
d (2
)
Milw
auke
e (3
)M
adis
on
Los
Ange
les
(4)
Seat
tle (2
)
San
Fran
cisc
o (2
)
Mia
mi
Atla
nta
(3)
Galv
esto
n
Mur
ray
Salt
Lake
City
(2)
Iow
a Ci
ty
Portl
and
(2)
Valh
alla
Detr
oit (
2)
New
Bru
nsw
ick
Fort
Way
ne
Norfo
lkLo
uisv
ille
Win
ston
Sal
em
Char
lotte
Mem
phis
Bron
x
Lexi
ngto
n
HR 8.1 Centers performing adult heart transplants in 2011, within Donation Service Areas (DSAs)

heart 147
Kans
as C
ity
Char
lotte
svill
e
Falls
Chu
rch
Char
lest
on
Spok
ane
Nash
ville
Dalla
s (4
)
Hous
ton
(3)
San
Anto
nio
(2)
Roch
este
r
Cinc
inna
tiColu
mbu
s (2
)
Clev
elan
d (2
)He
rshe
y
Pitts
burg
h (2
)
San
Juan
Roch
este
r
Sain
t Lou
is (2
)
Jack
son
Durh
am
Chap
el H
ill
Om
aha
Ann
Arbo
r
New
Orle
ans
(2)
Balti
mor
e (2
)
Bost
on (3
)
Gain
esvi
lle
Chic
ago
(4)
May
woo
d
Oak
Law
n
Birm
ingh
am
Littl
e Ro
ck
Was
hing
ton
Orla
ndo
Indi
anap
olis
Hartf
ord
Tucs
on
Phoe
nix
(2)
San
Dieg
o
Lom
a Li
nda
Auro
ra (2
)
New
Hav
en
Tam
pa
Palo
Alto
Stan
ford
Holly
woo
d
Min
neap
olis
New
Yor
k (2
)
Okl
ahom
a Ci
ty
Phila
delp
hia
(2)
Rich
mon
d
Milw
auke
e (2
)M
adis
on
Los
Ange
les
(3)
Seat
tle (2
)
San
Fran
cisc
o (2
)
Mia
mi
Atla
nta
Galv
esto
n
Salt
Lake
City
Iow
a Ci
ty
Portl
and
Valh
alla
Detr
oit (
2)Ne
w B
runs
wic
k
Wilm
ingt
on
Loui
svill
e
Win
ston
Sal
em
Char
lotte
Sain
t Pet
ersb
urg
Bron
x
Lexi
ngto
n
HR 8.2 Centers performing pediatric heart transplants in 2011, within Donation Service Areas (DSAs)

148 OPTN & SRTR Annual Data Report 2011
Kans
as C
ity
Char
lotte
svill
e
Falls
Chu
rch
Char
lest
on
Spok
ane
Nash
ville
(2)
Dalla
s (4
)
Tem
ple
Aust
in
Hous
ton
(3)
San
Anto
nio
(2)
Roch
este
r
Cinc
inna
tiColu
mbu
s (2
)
Clev
elan
d (2
)He
rshe
y
Pitts
burg
h (3
)
San
Juan
Roch
este
r
Sain
t Lou
is (2
)
Jack
son
Durh
am
Chap
el H
ill
Om
aha
New
ark
Gran
d Ra
pids
Ann
Arbo
r
New
Orle
ans
(2)
Balti
mor
e (2
)
Bost
on (4
)
Gain
esvi
lle
Chic
ago
(3)
May
woo
d
Oak
Law
n
Jack
sonv
ille
Birm
ingh
am
Littl
e Ro
ck (2
)
Was
hing
ton
Orla
ndo
Indi
anap
olis
(2)
Hartf
ord
Sacr
amen
to
Tucs
on
Phoe
nix
(2)
San
Dieg
o (2
)
Lom
a Li
nda
Auro
ra (2
)
New
Hav
en
Tam
pa
Palo
Alto
Stan
ford
Min
neap
olis
(2)
New
Yor
k (2
)
Okl
ahom
a Ci
ty
Phila
d elp
hia
(5)
Rich
mon
d (2
)
Milw
auke
e (3
)M
adis
on
Los
Ange
les
(4)
Seat
tle (2
)
San
Fran
cisc
o (2
)
Mia
mi
Atla
nta
(3)
Galv
esto
n
Mur
ray
Salt
Lake
City
(2)
Iow
a Ci
ty
Portl
and
(2)
Valh
alla
Detr
oit (
2)
New
Bru
nsw
ick
Fort
Way
ne
Norfo
lkLo
uisv
ille
Win
ston
Sal
em
Char
lotte
Mem
phis
Bron
x
Lexi
ngto
n
HR 8.3 Centers performing adult heart transplants in 2011, within OPTN regions


![Pancreas chapter, 2012 SRTR & OPTN Annual Data ReportThe pancreas donor risk index [2] steadily decreased over the past decade. The donor-specific components of the pancreas donor](https://img.pdfslide.us/doc/110x75/5f4033f781c9014957733d76/pancreas-chapter-2012-srtr-optn-annual-data-report-the-pancreas-donor-risk.jpg)