Embed Size (px)
Citation preview
©2014 The Applied Research Company. All Rights Reserved. Past performance is not indicative of future results. Futures and options trading involves risk. NFA #0192833
Quant Research on Futures Options
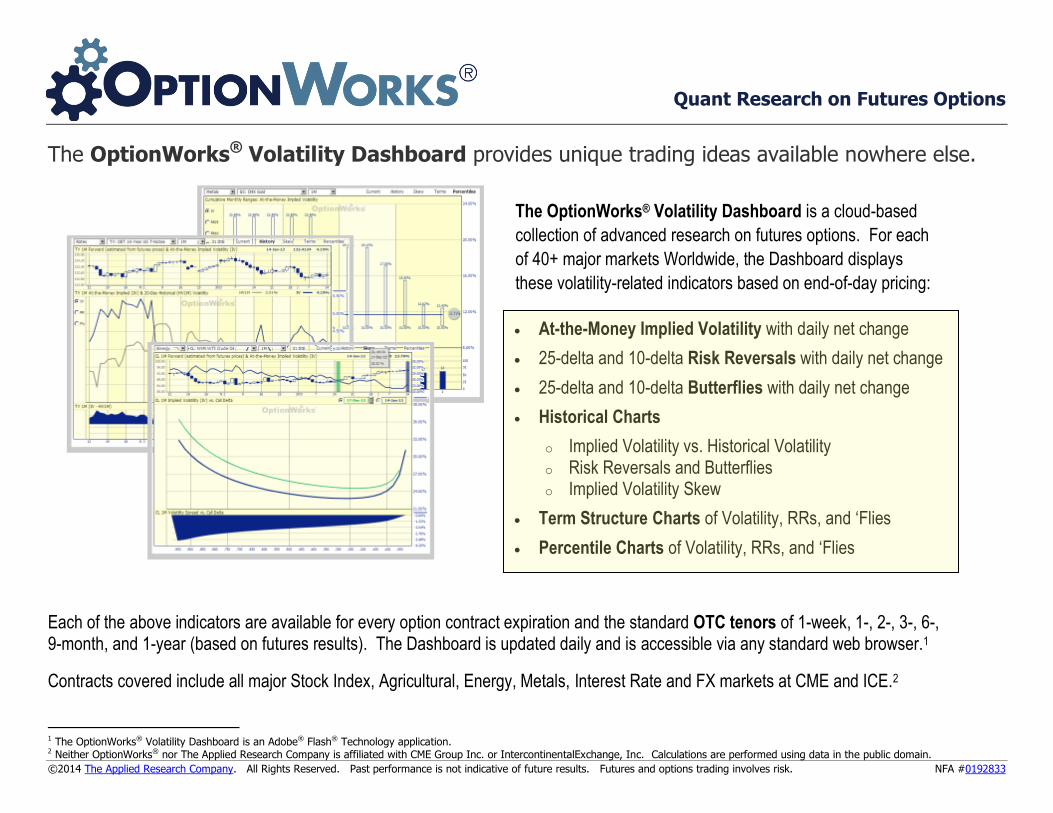
The OptionWorks® Volatility Dashboard provides unique trading ideas available nowhere else.
The OptionWorks® Volatility Dashboard is a cloud-based
collection of advanced research on futures options. For each
of 40+ major markets Worldwide, the Dashboard displays
these volatility-related indicators based on end-of-day pricing:
At-the-Money Implied Volatility with daily net change
25-delta and 10-delta Risk Reversals with daily net change
25-delta and 10-delta Butterflies with daily net change
Historical Charts
o Implied Volatility vs. Historical Volatility o Risk Reversals and Butterflies o Implied Volatility Skew
Term Structure Charts of Volatility, RRs, and ‘Flies
Percentile Charts of Volatility, RRs, and ‘Flies
Each of the above indicators are available for every option contract expiration and the standard OTC tenors of 1-week, 1-, 2-, 3-, 6-, 9-month, and 1-year (based on futures results). The Dashboard is updated daily and is accessible via any standard web browser.1
Contracts covered include all major Stock Index, Agricultural, Energy, Metals, Interest Rate and FX markets at CME and ICE.2
1 The OptionWorks® Volatility Dashboard is an Adobe® Flash® Technology application. 2 Neither OptionWorks® nor The Applied Research Company is affiliated with CME Group Inc. or IntercontinentalExchange, Inc. Calculations are performed using data in the public domain. .
Daily Strategy Report www.OptionWorks.com
©2014 The Applied Research Company. All Rights Reserved. Past performance is not indicative of future results. Futures and options trading involves risk. NFA #0192833
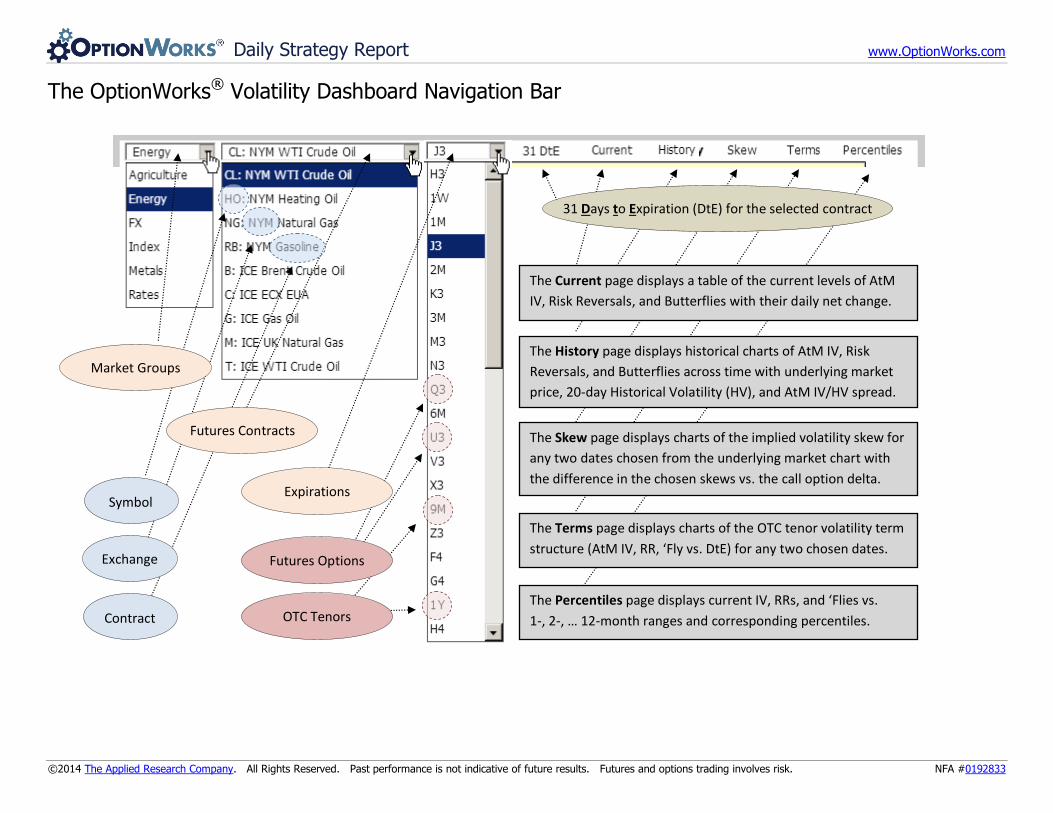
How the OptionWorks® Volatility Dashboard provides option market insight for trading decisions.
OptionWorks® displays various results centered around Implied Volatility (IV). Market volatility is one of the factors that influence option prices. The implied volatility of an option is that level of the underlying market volatility that makes the option worth its current price. Changes in implied volatility drive changes in option prices, and often occur independently of moves in the underlying market price.
The OptionWorks® Volatility Dashboard provides answers to three basic questions regarding any potential option trade:
1. Compared to historical levels, are current option prices relatively cheap or expensive?
The At-the-Money Implied Volatility (AtM IV) is a measure of the option market’s expectation of how much the underlying market will rise and fall in the future. The comparison of recent AtM IV to past levels shows whether options are currently cheap or expensive. For each option contract, OptionWorks® charts AtM IV over time, displays monthly ranges and range percentiles.
2. Are puts currently expensive relative to calls, or vice versa?
The Risk Reversal (RR) is the difference between the call IV and the put IV for options having the same delta. The RR describes the “tilt” in the volatility skew and is a measure of the option market’s demand for puts vs. calls. The comparison of recent RRs to past levels shows if the premium of puts over calls (or vice versa) is cheap or expensive. For each option contract, OptionWorks® charts 25- and 10-delta RRs over time, displays monthly ranges and range percentiles.
3. Are out-of-the-money (OtM) options expensive relative to at-the-money (AtM) options?
The Butterfly (‘Fly) is the average IV of a call and a put having the same delta less half the AtM IV. The ‘Fly describes the “height” of the volatility skew and is a measure of the option market’s demand for OtM vs. AtM options. The comparison of recent ‘Flies to past levels shows if OtM options are cheap or expensive relative to AtM options. For each option contract, OptionWorks® charts 25- and 10-delta ‘Flies over time, displays monthly ranges and range percentiles.
In addition to AtM IV, RRs and ‘Flies for each traded option contract, OptionWorks® displays these results for the standard OTC tenors of 1-week, 1-, 2-, 3-, 6-, 9-month, and 1-year (based on futures results). Historical charts of the implied volatility skew are also available.
Daily Strategy Report www.OptionWorks.com
©2014 The Applied Research Company. All Rights Reserved. Past performance is not indicative of future results. Futures and options trading involves risk. NFA #0192833
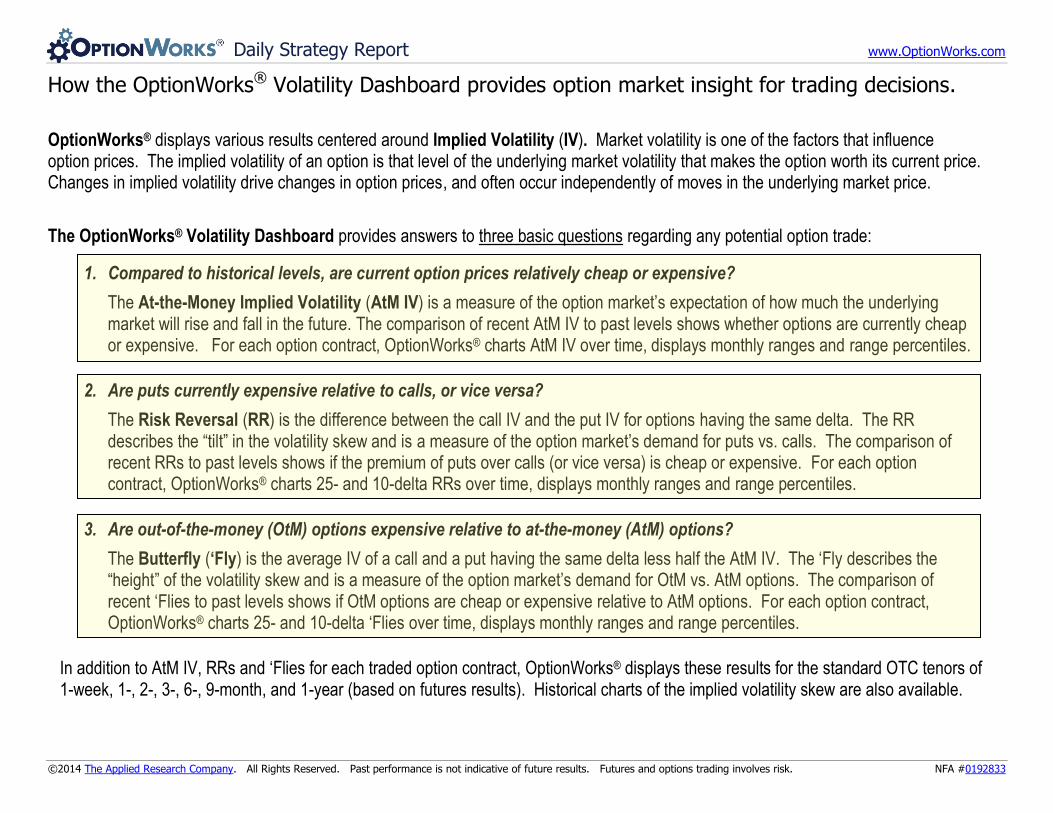
The OptionWorks® Volatility Dashboard Navigation Bar
Futures Contracts
Contract
Exchange
Symbol
Futures Contracts
Market Groups
Expirations
Futures Options
OTC Tenors The Percentiles page displays current IV, RRs, and ‘Flies vs.
1-, 2-, … 12-month ranges and corresponding percentiles.
The Terms page displays charts of the OTC tenor volatility term
structure (AtM IV, RR, ‘Fly vs. DtE) for any two chosen dates.
The Skew page displays charts of the implied volatility skew for
any two dates chosen from the underlying market chart with
the difference in the chosen skews vs. the call option delta.
The History page displays historical charts of AtM IV, Risk
Reversals, and Butterflies across time with underlying market
price, 20-day Historical Volatility (HV), and AtM IV/HV spread.
The Current page displays a table of the current levels of AtM
IV, Risk Reversals, and Butterflies with their daily net change.
31 Days to Expiration (DtE) for the selected contract
Daily Strategy Report www.OptionWorks.com
©2014 The Applied Research Company. All Rights Reserved. Past performance is not indicative of future results. Futures and options trading involves risk. NFA #0192833
The OptionWorks® Volatility Dashboard Current
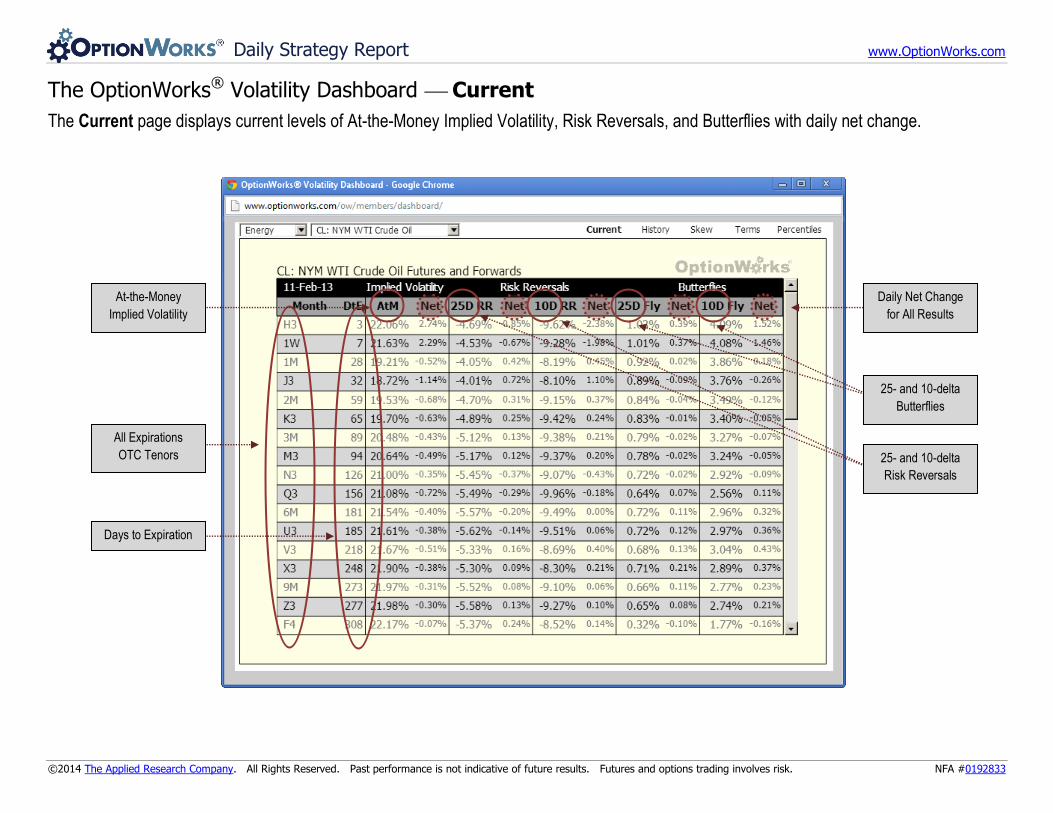
The Current page displays current levels of At-the-Money Implied Volatility, Risk Reversals, and Butterflies with daily net change.
At-the-Money
Implied Volatility
Days to Expiration
All Expirations
OTC Tenors 25- and 10-delta
Risk Reversals
25- and 10-delta
Butterflies
Daily Net Change
for All Results
Daily Strategy Report www.OptionWorks.com
©2014 The Applied Research Company. All Rights Reserved. Past performance is not indicative of future results. Futures and options trading involves risk. NFA #0192833
The OptionWorks® Volatility Dashboard History
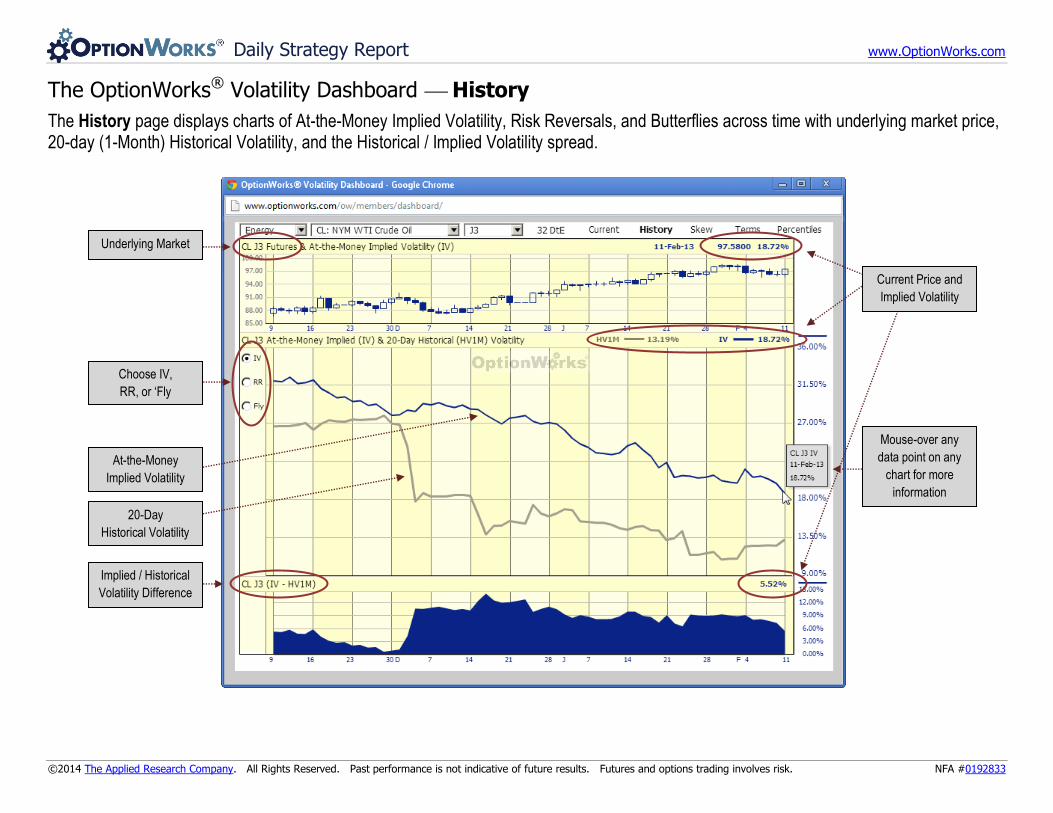
The History page displays charts of At-the-Money Implied Volatility, Risk Reversals, and Butterflies across time with underlying market price, 20-day (1-Month) Historical Volatility, and the Historical / Implied Volatility spread.
Underlying Market
Choose IV,
RR, or ‘Fly
At-the-Money
Implied Volatility
20-Day
Historical Volatility
Implied / Historical
Volatility Difference
Current Price and
Implied Volatility
Mouse-over any
data point on any
chart for more
information
Daily Strategy Report www.OptionWorks.com
©2014 The Applied Research Company. All Rights Reserved. Past performance is not indicative of future results. Futures and options trading involves risk. NFA #0192833
The OptionWorks® Volatility Dashboard Skew
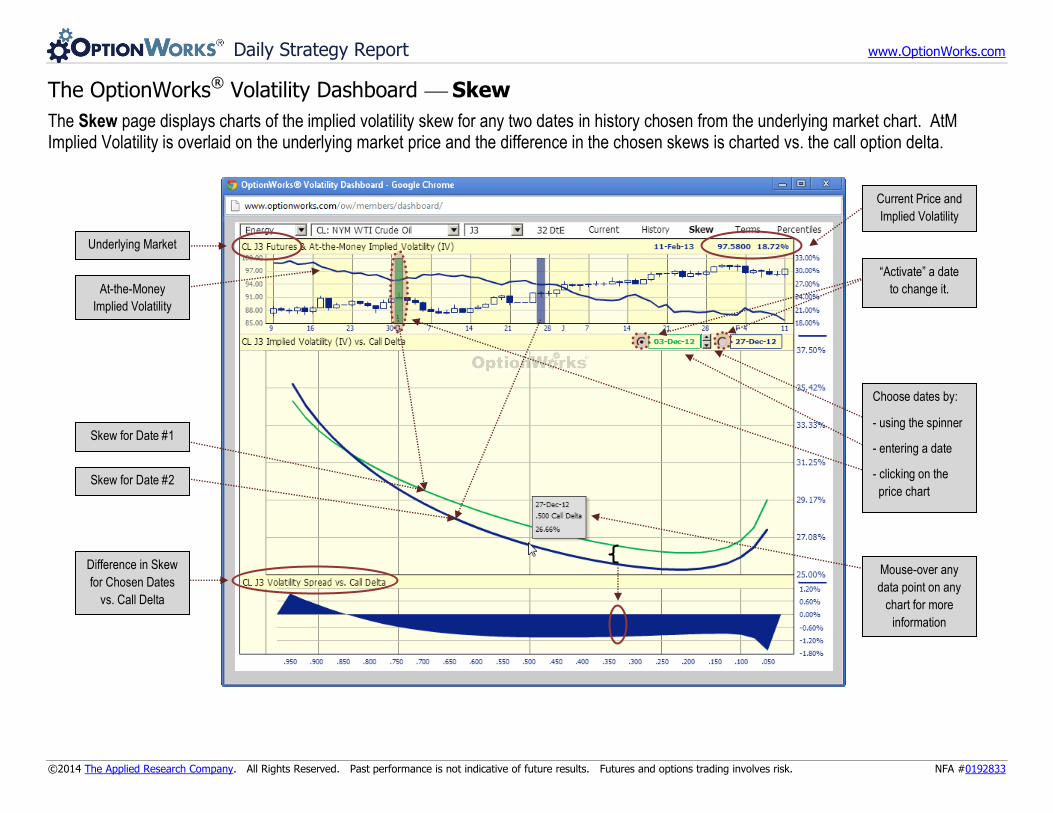
The Skew page displays charts of the implied volatility skew for any two dates in history chosen from the underlying market chart. AtM Implied Volatility is overlaid on the underlying market price and the difference in the chosen skews is charted vs. the call option delta.
Underlying Market
At-the-Money
Implied Volatility
Skew for Date #1
Skew for Date #2
Difference in Skew
for Chosen Dates
vs. Call Delta
Current Price and
Implied Volatility
“Activate” a date
to change it.
spinner
Choose dates by:
- using the spinner
- entering a date
- clicking on the
price chart
Mouse-over any
data point on any
chart for more
information
Daily Strategy Report www.OptionWorks.com
©2014 The Applied Research Company. All Rights Reserved. Past performance is not indicative of future results. Futures and options trading involves risk. NFA #0192833
The OptionWorks® Volatility Dashboard Terms
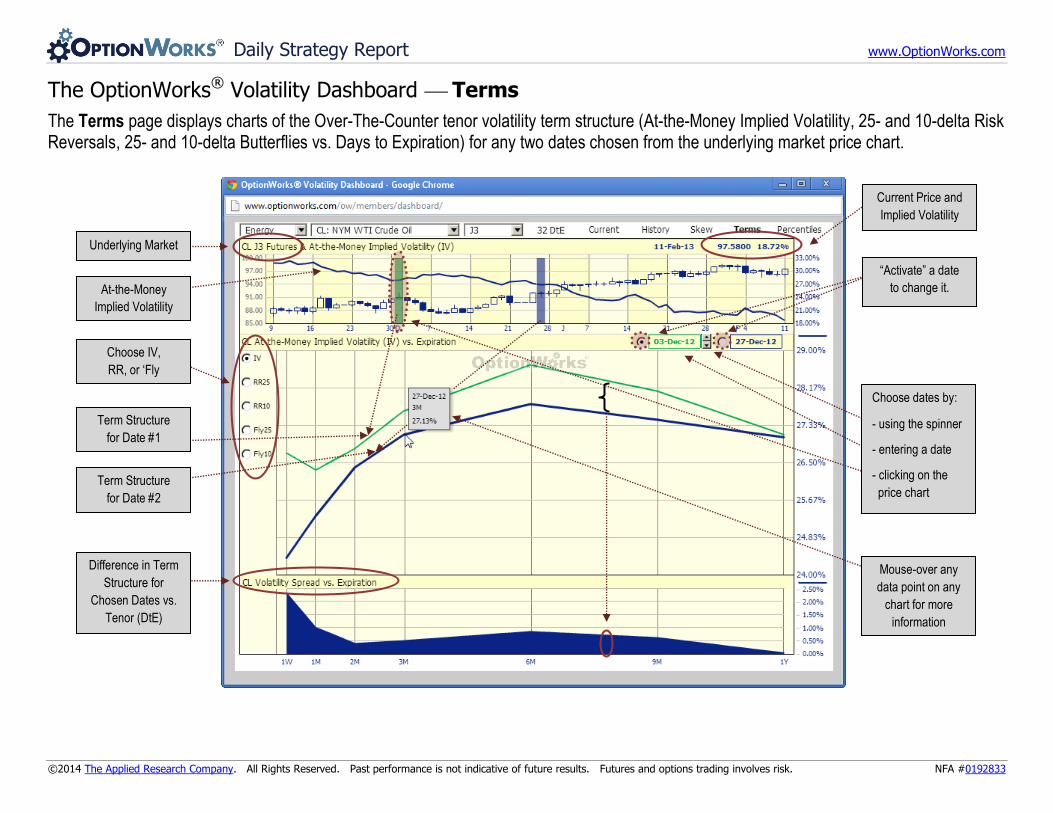
The Terms page displays charts of the Over-The-Counter tenor volatility term structure (At-the-Money Implied Volatility, 25- and 10-delta Risk Reversals, 25- and 10-delta Butterflies vs. Days to Expiration) for any two dates chosen from the underlying market price chart.
Underlying Market
At-the-Money
Implied Volatility
Term Structure
for Date #1
Term Structure
for Date #2
Difference in Term
Structure for
Chosen Dates vs.
Tenor (DtE)
Mouse-over any
data point on any
chart for more
information
Choose IV,
RR, or ‘Fly
Current Price and
Implied Volatility
“Activate” a date
to change it.
spinner
Choose dates by:
- using the spinner
- entering a date
- clicking on the
price chart
Daily Strategy Report www.OptionWorks.com
©2014 The Applied Research Company. All Rights Reserved. Past performance is not indicative of future results. Futures and options trading involves risk. NFA #0192833
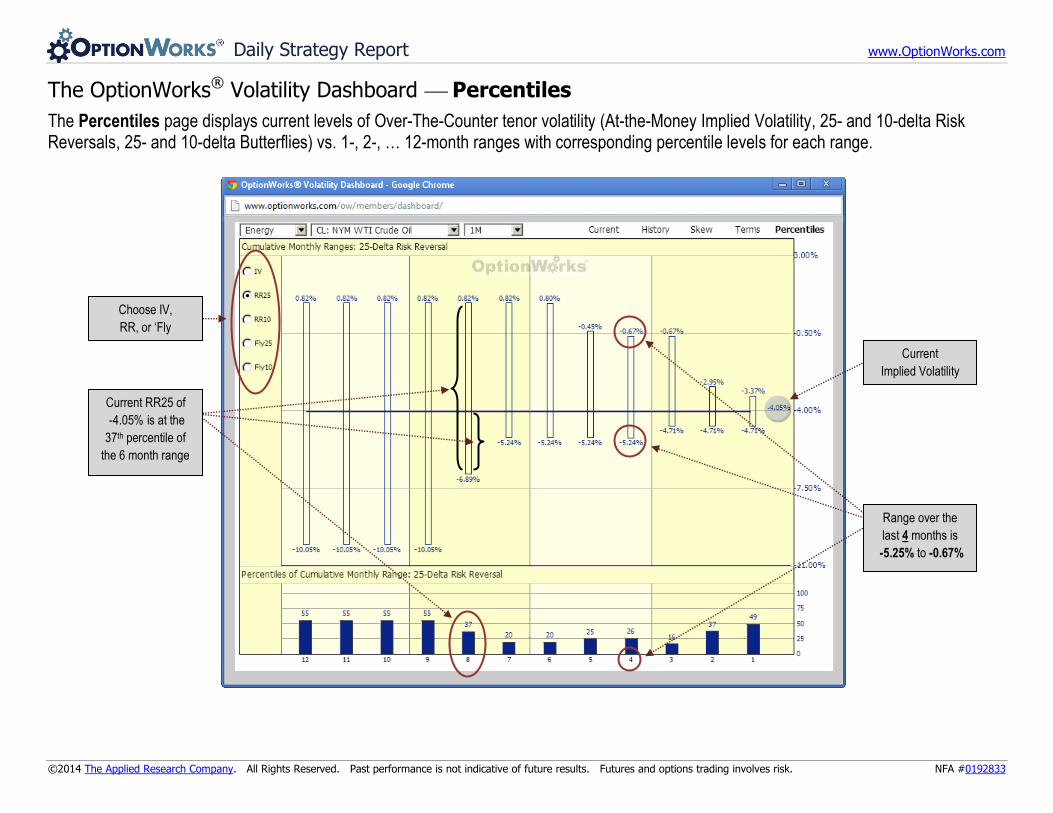
The OptionWorks® Volatility Dashboard Percentiles
The Percentiles page displays current levels of Over-The-Counter tenor volatility (At-the-Money Implied Volatility, 25- and 10-delta Risk Reversals, 25- and 10-delta Butterflies) vs. 1-, 2-, … 12-month ranges with corresponding percentile levels for each range.
Choose IV,
RR, or ‘Fly
Current
Implied Volatility
Range over the
last 4 months is
-5.25% to -0.67%
Current RR25 of
-4.05% is at the
37th percentile of
the 6 month range
Daily Strategy Report www.OptionWorks.com
©2014 The Applied Research Company. All Rights Reserved. Past performance is not indicative of future results. Futures and options trading involves risk. NFA #0192833
OptionWorks® is a product of
The Applied Research Company 53 West Jackson Boulevard Suite #337 Chicago, IL 60604-3608 USA www.AppliedResearch.Com [email protected]
Monadnock Building