Embed Size (px)
Citation preview

Options and recommendations to
meet the RED transport target
–
APPENDICES
29/05/2014
Author
Element Energy Limited

2
Appendix A. List of consulted organisations
Appendix B. The case of NRMMs
Appendix C. Powertrain pathway summary
Appendix D. UK transport demand
Appendix E. Supply of fuels
Appendix F. Cost assumptions for fuels and electricity
Appendix G. WTW GHG emission savings of fuels
Appendix H. Other model assumptions
Appendix I. Detailed RED scenario analysis
Appendix J. Scenario characterisation
Appendix K. Other sensitivities
This document is issued alongside the main report ‘Options and recommendations to
meet the RED transport target’; it compiles the Appendix that provides modelling
assumptions and more detailed outputs.

3
Appendix A. List of organisations part of the Steering Group and
consulted organisations
List of interviewed stakeholders and members of Steering Group per topic
Fuel producers and suppliers Infrastructure OEMs / supplier
Liquid fuels
[ethanol, FAME,
fossil fuels]
• British Sugar (ethanol)
• Ensus (ethanol)
• INEOS bio (ethanol, FAME)
• Renewable Energy Association (biofuel
producers)
• UKPIA • SMMT
• Iveco
• BP (obligated supplier)
• Greenergy Fuels (obligated supplier)
• Shell (obligated supplier)
Gaseous fuels
[natural gas, bio-
methane, LPG]
• Gasrec (bio-LNG)
• UKPLG (LPG)
• CNG Services (CNG and CBM projects)
• Gas Bus Alliance (CBM)
• The Steering Group (SG) was chaired by the LowCVP and comprised representatives from the DfT and
from the following organisations: British Sugar , CNG Services, RAC Foundation, REA, SMMT, UKLPG,
UKPIA. The UKPIA, SMMT and REA gathered feedback on the analysis findings from their members.
• The table below shows the SG members from the industry, along with consulted industry stakeholders.
Some participants were consulted twice (at the start of the consultation process for inputs validation and
at the end to discuss findings)

4
Appendix A. List of consulted organisations
Appendix B. The case of NRMMs
Appendix C. Powertrain pathway summary
Appendix D. UK transport demand
Appendix E. Supply of fuels
Appendix F. Cost assumptions for fuels and electricity
Appendix G. WTW GHG emission savings of fuels
Appendix H. Other model assumptions
Appendix I. Detailed RED scenario analysis
Appendix J. Scenario characterisation
Appendix K. Other sensitivities
5
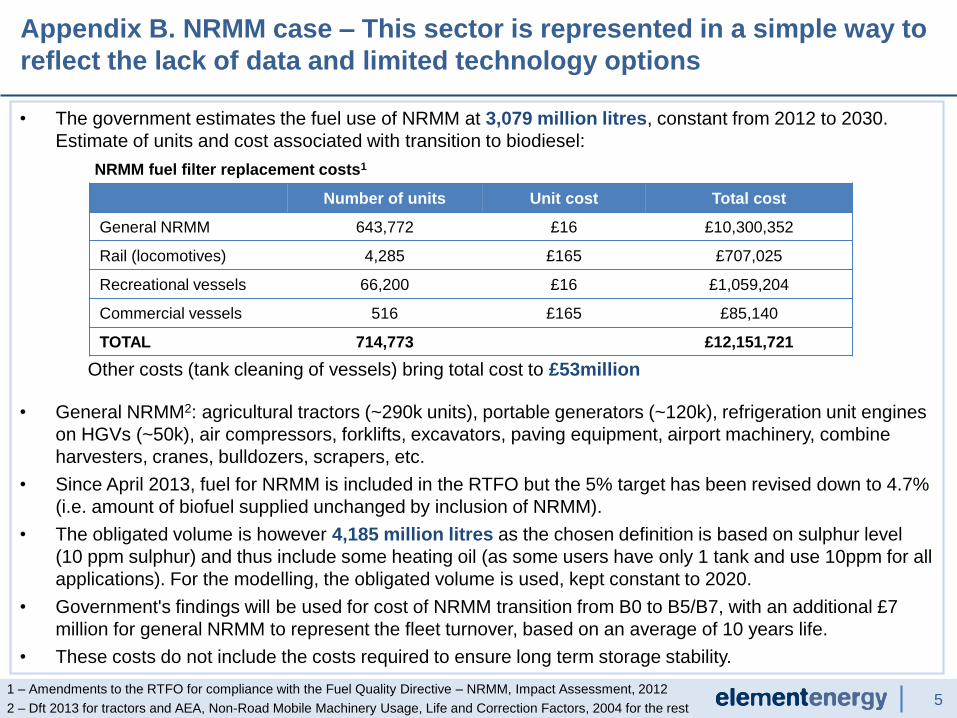
• The government estimates the fuel use of NRMM at 3,079 million litres, constant from 2012 to 2030.
Estimate of units and cost associated with transition to biodiesel:
Other costs (tank cleaning of vessels) bring total cost to £53million
• General NRMM2: agricultural tractors (~290k units), portable generators (~120k), refrigeration unit engines
on HGVs (~50k), air compressors, forklifts, excavators, paving equipment, airport machinery, combine
harvesters, cranes, bulldozers, scrapers, etc.
• Since April 2013, fuel for NRMM is included in the RTFO but the 5% target has been revised down to 4.7%
(i.e. amount of biofuel supplied unchanged by inclusion of NRMM).
• The obligated volume is however 4,185 million litres as the chosen definition is based on sulphur level
(10 ppm sulphur) and thus include some heating oil (as some users have only 1 tank and use 10ppm for all
applications). For the modelling, the obligated volume is used, kept constant to 2020.
• Government's findings will be used for cost of NRMM transition from B0 to B5/B7, with an additional £7
million for general NRMM to represent the fleet turnover, based on an average of 10 years life.
• These costs do not include the costs required to ensure long term storage stability.
Appendix B. NRMM case – This sector is represented in a simple way to
reflect the lack of data and limited technology options
1 – Amendments to the RTFO for compliance with the Fuel Quality Directive – NRMM, Impact Assessment, 2012
2 – Dft 2013 for tractors and AEA, Non-Road Mobile Machinery Usage, Life and Correction Factors, 2004 for the rest
Number of units Unit cost Total cost
General NRMM 643,772 £16 £10,300,352
Rail (locomotives) 4,285 £165 £707,025
Recreational vessels 66,200 £16 £1,059,204
Commercial vessels 516 £165 £85,140
TOTAL 714,773 £12,151,721
NRMM fuel filter replacement costs1

6
Appendix A. List of consulted organisations
Appendix B. The case of NRMMs
Appendix C. Powertrain pathway summary
Appendix D. UK transport demand
Appendix E. Supply of fuels
Appendix F. Cost assumptions for fuels and electricity
Appendix G. WTW GHG emission savings of fuels
Appendix H. Other model assumptions
Appendix I. Detailed RED scenario analysis
Appendix J. Scenario characterisation
Appendix K. Other sensitivities
C1. Summary
C2. Car powertrain pathways
C3. Van powertrain pathways
C4. HGV powertrain pathways
C5. Bus powertrain pathways
7
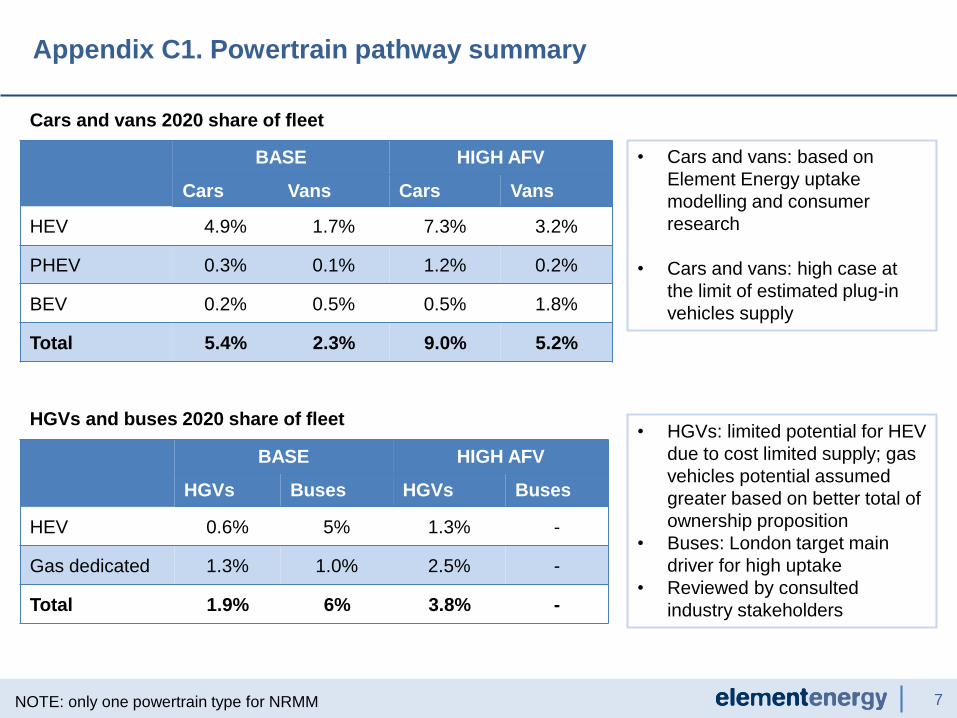
BASE HIGH AFV
Cars Vans Cars Vans
HEV 4.9% 1.7% 7.3% 3.2%
PHEV 0.3% 0.1% 1.2% 0.2%
BEV 0.2% 0.5% 0.5% 1.8%
Total 5.4% 2.3% 9.0% 5.2%
Appendix C1. Powertrain pathway summary
NOTE: only one powertrain type for NRMM
BASE HIGH AFV
HGVs Buses HGVs Buses
HEV 0.6% 5% 1.3% -
Gas dedicated 1.3% 1.0% 2.5% -
Total 1.9% 6% 3.8% -
• Cars and vans: based on
Element Energy uptake
modelling and consumer
research
• Cars and vans: high case at
the limit of estimated plug-in
vehicles supply
• HGVs: limited potential for HEV
due to cost limited supply; gas
vehicles potential assumed
greater based on better total of
ownership proposition
• Buses: London target main
driver for high uptake
• Reviewed by consulted
industry stakeholders
HGVs and buses 2020 share of fleet
Cars and vans 2020 share of fleet
8AFV: Alternative Fuel Vehicle
BASE PATHWAY
Market share of powertrains
HIGH AFV PATHWAY
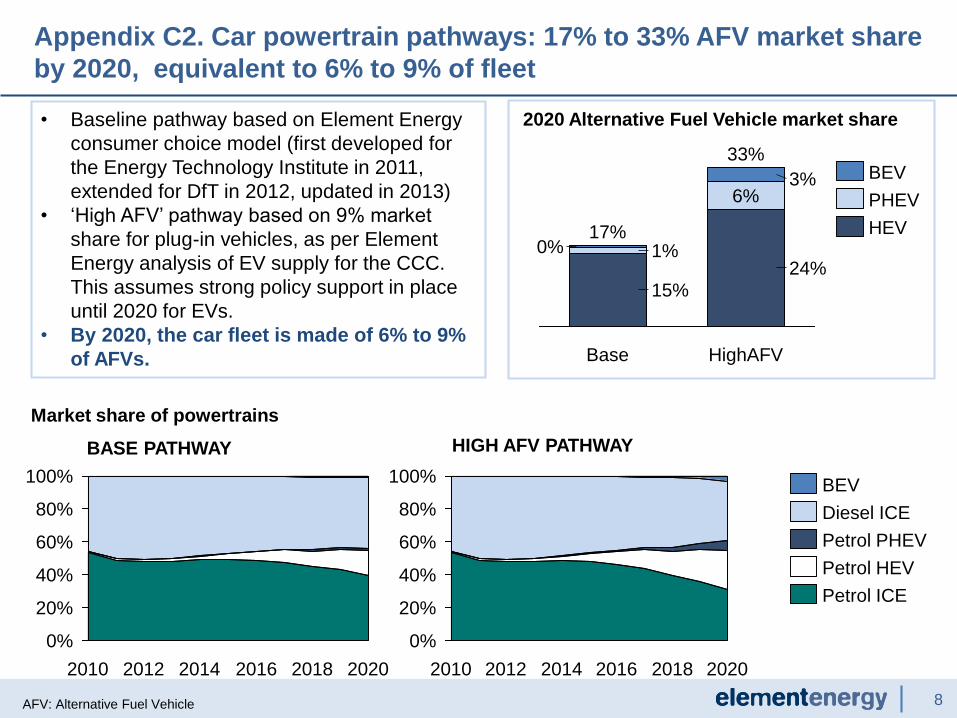
• Baseline pathway based on Element Energy
consumer choice model (first developed for
the Energy Technology Institute in 2011,
extended for DfT in 2012, updated in 2013)
• ‘High AFV’ pathway based on 9% market
share for plug-in vehicles, as per Element
Energy analysis of EV supply for the CCC.
This assumes strong policy support in place
until 2020 for EVs.
• By 2020, the car fleet is made of 6% to 9%
of AFVs.
2020 Alternative Fuel Vehicle market share
24%
6%3%
Base
17%
15%
1%0%
HighAFV
33%
HEV
PHEV
BEV
100%
80%
60%
40%
20%
0%
202020182016201420122010
Petrol ICE
Petrol HEV
Petrol PHEV
Diesel ICE
BEV
0%
20%
80%
40%
60%
100%
2010 2012 20162014 2018 2020
Appendix C2. Car powertrain pathways: 17% to 33% AFV market share
by 2020, equivalent to 6% to 9% of fleet

9
BASE PATHWAY
Market share of powertrains
HIGH AFV PATHWAY
• Pathways based on Element Energy study
for DfT of van fleet managers’ willingness to
pay for EVs and supply of AFV.
• No PHEV van currently on the market, supply
starting in 2015 at earliest.
• The market share of AFV doubles in the AFV
case compared to base case – high case
assumes high supply and policy support
• By 2020, the van fleet is made of 2% to 5%
of AFVs.
2020 Alternative Fuel Vehicle market share
HighAFV
15%
10%5%
1%
4%
Base
4%
0%1%
HEV
PHEV
BEV
100%
95%
90%
85%
0%
2018201420122010 2016 2020
Diesel ICE
BEV
Diesel HEV
Diesel PHEV
Petrol ICE
95%
100%
90%
0%
202020182016201420122010
Appendix C3. Van powertrain pathways: 5% to 15% AFV market share
by 2020, translating into 2% to 5% of fleet
101 - When will hybrid technologies dominate the heavy-duty vehicle market? Forecasting Using Innovation Diffusion
Models; Jesper Brauer, Master of Science thesis, 2011 2 – Alternative Fuel Data Centre, US DoE
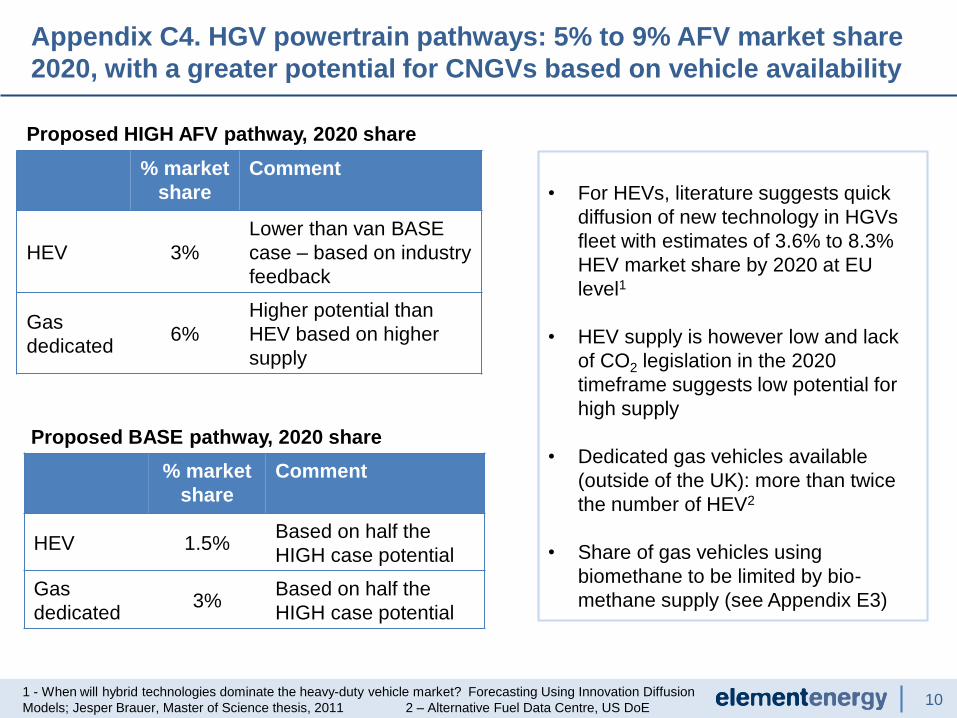
• For HEVs, literature suggests quick
diffusion of new technology in HGVs
fleet with estimates of 3.6% to 8.3%
HEV market share by 2020 at EU
level1
• HEV supply is however low and lack
of CO2 legislation in the 2020
timeframe suggests low potential for
high supply
• Dedicated gas vehicles available
(outside of the UK): more than twice
the number of HEV2
• Share of gas vehicles using
biomethane to be limited by bio-
methane supply (see Appendix E3)
% market
share
Comment
HEV 3%
Lower than van BASE
case – based on industry
feedback
Gas
dedicated6%
Higher potential than
HEV based on higher
supply
Proposed HIGH AFV pathway, 2020 share
Proposed BASE pathway, 2020 share
% market
share
Comment
HEV 1.5%Based on half the
HIGH case potential
Gas
dedicated3%
Based on half the
HIGH case potential
Appendix C4. HGV powertrain pathways: 5% to 9% AFV market share
2020, with a greater potential for CNGVs based on vehicle availability

11
Proposed BASE pathway, 2020 share
HEVs
• Already over 300 HEV buses in London alone (~0.2% UK fleet)
• London Mayor target for 2020: 100% of London to be hybrids.
• London bus fleet ~10% UK fleet. Assuming London meets its target, UK bus fleet will have a
minimum of 10% HEVs.
• Proposed pathway assumes 2% market share for HEV outside London, based on industry
feedback
Dedicated gas buses
• 60 gas buses in operation (<0.05% UK fleet)
• Potential assessed as higher than for HEV (once Bus Green Fund is terminated) outside London
based on payback time
% market
share
Comment
HEV 13%Based on London buying 100% and other cities/buyers 2%
HEVs
Gas dedicated 3% Based on industry feedback
Appendix C5. Bus powertrain pathway: based on small contribution to
overall transport energy use, only 1 powertrain pathway developed
12
Appendix A. List of consulted organisations
Appendix B. The case of NRMMs
Appendix C. Powertrain pathway summary
Appendix D. UK transport demand
Appendix E. Supply of fuels
Appendix F. Cost assumptions for fuels and electricity
Appendix G. WTW GHG emission savings of fuels
Appendix H. Other model assumptions
Appendix I. Detailed RED scenario analysis
Appendix J. Scenario characterisation
Appendix K. Other sensitivities

13
Appendix D. Transport demand - 2020
Modelling of the transport demand
• Extensive fuel input database and powertrain
pathways based on EE analysis and reviewed
by industry
• Stock turnover, fleet size and vehicle travelled
as per DfT published data and projections
• Improvement of new vehicle MJ/km as per
Ricardo-AEA for the CCC (2012)
• NRMM energy demand set constant, based on
current obligated volume (4.18 billion l, 151 PJ)
that also covers some heating applications.
UK transport energy demand, PJ Energy demand, PJ
2020 transport demand:
• Equivalent to 14.2 billion l petrol and 32.7
billion l diesel, overall 1,640 PJ (4% less
than 2010)
• Gas demand modest:
• 110 kt (5 PJ) in base case
• 203 kt (9.3 PJ) in HighAFV case
• Electricity demand very modest:
• 304 GWh (1.1 PJ) in base case
• 1,014 GWh (3.6 PJ) in HighAFV case
Liquid fuel demand, billion l
Reminder: Under the ‘HighAFV’ case, there is a greater uptake alternative powertrains (HEV, PHEV and
BEV for cars and vans; HEV and dedicated gas for HGVs and buses)
0
500
1,500
2,000
1,000
2020
1,640
2010
1,710
Buses
NRMMs
Vans
Cars
HGVs
500
1,000
2,000
1,500
0
Base
1,6301,640
High AFV
Diesel
Gas
Elec
Petrol40
30
20
0
10
50
Base High AFV
Diesel
Petrol
14
Appendix A. List of consulted organisations
Appendix B. The case of NRMMs
Appendix C. Powertrain pathway summary
Appendix D. UK transport demand
Appendix E. Supply of fuels
Appendix F. Cost assumptions for fuels and electricity
Appendix G. WTW GHG emission savings of fuels
Appendix H. Other model assumptions
Appendix I. Detailed RED scenario analysis
Appendix J. Scenario characterisation
Appendix K. Other sensitivities
E1. Supply of ethanol 2G
E2. Supply of drop-in diesel
E3. Supply of bio-methane
E4. Supply of FAME
15
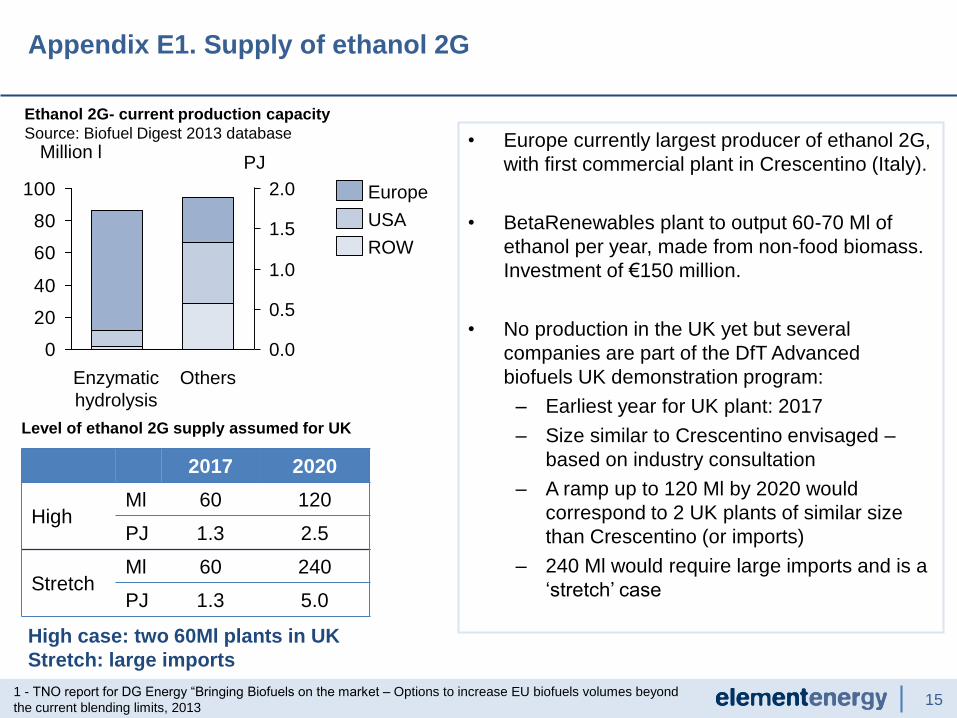
• Europe currently largest producer of ethanol 2G,
with first commercial plant in Crescentino (Italy).
• BetaRenewables plant to output 60-70 Ml of
ethanol per year, made from non-food biomass.
Investment of €150 million.
• No production in the UK yet but several
companies are part of the DfT Advanced
biofuels UK demonstration program:
– Earliest year for UK plant: 2017
– Size similar to Crescentino envisaged –
based on industry consultation
– A ramp up to 120 Ml by 2020 would
correspond to 2 UK plants of similar size
than Crescentino (or imports)
– 240 Ml would require large imports and is a
‘stretch’ case
Appendix E1. Supply of ethanol 2G
1 - TNO report for DG Energy “Bringing Biofuels on the market – Options to increase EU biofuels volumes beyond
the current blending limits, 2013
Ethanol 2G- current production capacity
Source: Biofuel Digest 2013 database
2017 2020
HighMl 60 120
PJ 1.3 2.5
StretchMl 60 240
PJ 1.3 5.0
Level of ethanol 2G supply assumed for UK
High case: two 60Ml plants in UK
Stretch: large imports
0
20
40
60
80
100
0.0
1.0
0.5
1.5
2.0
OthersEnzymatic
hydrolysis
Million lPJ
Europe
USA
ROW
16
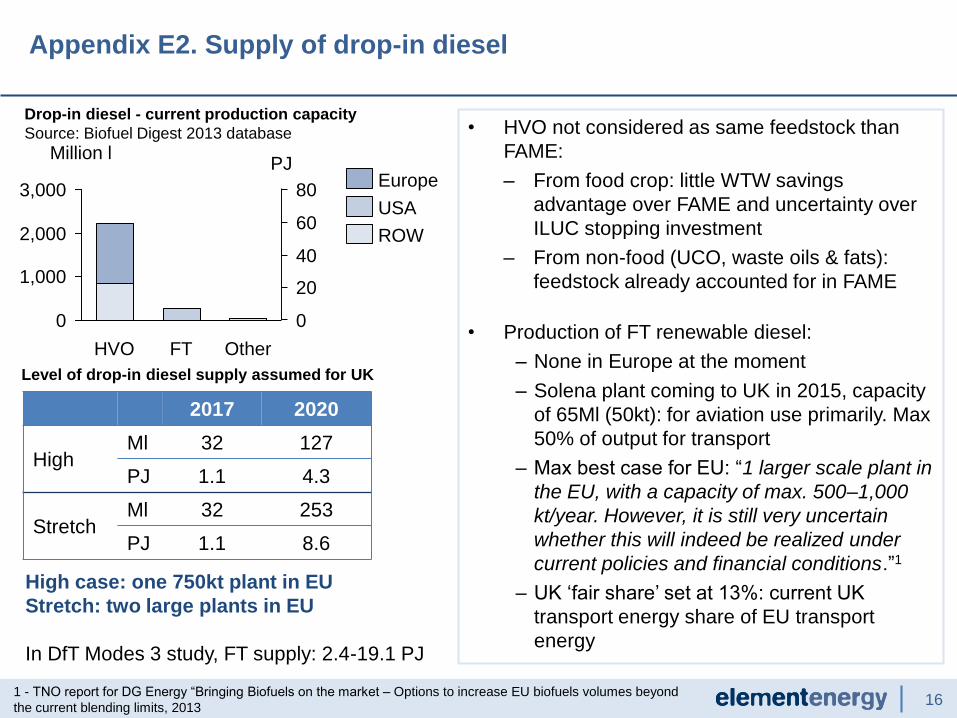
• HVO not considered as same feedstock than
FAME:
– From food crop: little WTW savings
advantage over FAME and uncertainty over
ILUC stopping investment
– From non-food (UCO, waste oils & fats):
feedstock already accounted for in FAME
• Production of FT renewable diesel:
– None in Europe at the moment
– Solena plant coming to UK in 2015, capacity
of 65Ml (50kt): for aviation use primarily. Max
50% of output for transport
– Max best case for EU: “1 larger scale plant in
the EU, with a capacity of max. 500–1,000
kt/year. However, it is still very uncertain
whether this will indeed be realized under
current policies and financial conditions.”1
– UK ‘fair share’ set at 13%: current UK
transport energy share of EU transport
energy
Appendix E2. Supply of drop-in diesel
1 - TNO report for DG Energy “Bringing Biofuels on the market – Options to increase EU biofuels volumes beyond
the current blending limits, 2013
Drop-in diesel - current production capacity
Source: Biofuel Digest 2013 database
2017 2020
HighMl 32 127
PJ 1.1 4.3
StretchMl 32 253
PJ 1.1 8.6
Level of drop-in diesel supply assumed for UK
High case: one 750kt plant in EU
Stretch: two large plants in EU
In DfT Modes 3 study, FT supply: 2.4-19.1 PJ
20
80
60
3,000
40
0
2,000
1,000
0
PJMillion l
OtherFTHVO
Europe
USA
ROW
17
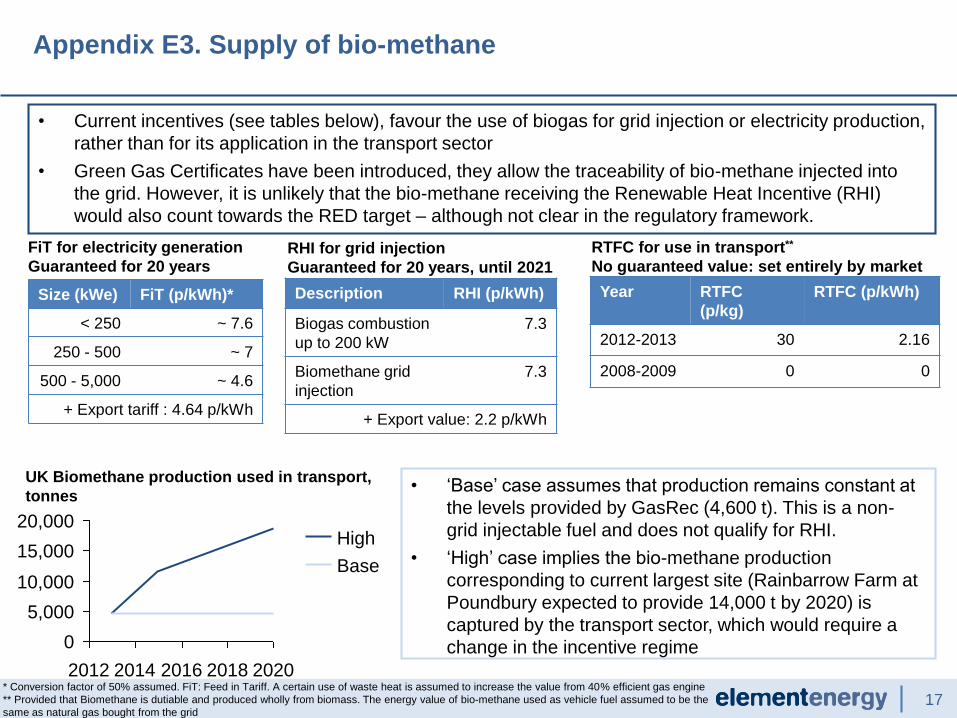
Appendix E3. Supply of bio-methane
* Conversion factor of 50% assumed. FiT: Feed in Tariff. A certain use of waste heat is assumed to increase the value from 40% efficient gas engine
** Provided that Biomethane is dutiable and produced wholly from biomass. The energy value of bio-methane used as vehicle fuel assumed to be the
same as natural gas bought from the grid
FiT for electricity generation
Guaranteed for 20 years
Size (kWe) FiT (p/kWh)*
< 250 ~ 7.6
250 - 500 ~ 7
500 - 5,000 ~ 4.6
+ Export tariff : 4.64 p/kWh
RHI for grid injection
Guaranteed for 20 years, until 2021
RTFC for use in transport**
No guaranteed value: set entirely by market
Year RTFC
(p/kg)
RTFC (p/kWh)
2012-2013 30 2.16
2008-2009 0 0
• Current incentives (see tables below), favour the use of biogas for grid injection or electricity production,
rather than for its application in the transport sector
• Green Gas Certificates have been introduced, they allow the traceability of bio-methane injected into
the grid. However, it is unlikely that the bio-methane receiving the Renewable Heat Incentive (RHI)
would also count towards the RED target – although not clear in the regulatory framework.
UK Biomethane production used in transport,
tonnes• ‘Base’ case assumes that production remains constant at
the levels provided by GasRec (4,600 t). This is a non-
grid injectable fuel and does not qualify for RHI.
• ‘High’ case implies the bio-methane production
corresponding to current largest site (Rainbarrow Farm at
Poundbury expected to provide 14,000 t by 2020) is
captured by the transport sector, which would require a
change in the incentive regime
2020201820162014
20,000
15,000
10,000
5,000
0
2012
High
Base
Description RHI (p/kWh)
Biogas combustion
up to 200 kW
7.3
Biomethane grid
injection
7.3
+ Export value: 2.2 p/kWh

18
Appendix E4. Supply of FAME
FAME use in the UK per feedstock type, as per RTFO reports years 1-6
• For the last three years, UCO and
tallow have been the main feedstock
for the production of FAME used in
the UK
• In the last RTFO report, new waste
sources other than UCO and tallow
(i.e. brown grease, palm oil mill
effluent and spent bleached earth)
were reported
• Although their contribution is still
negligible (~2%of total FAME), this
trend reflects the effect of the double
accounting rules for biofuel coming
from waste streams2.0%
2.0%
2010/112009/10 2011/12
100%
16.0%
2012/13
80.0%
2013/142008/9
Other, food crop
Other, waste oilsTallow
UCO
19
Appendix A. List of consulted organisations
Appendix B. The case of NRMMs
Appendix C. Powertrain pathway summary
Appendix D. UK transport demand
Appendix E. Supply of fuels
Appendix F. Cost assumptions for fuels and electricity
Appendix G. WTW GHG emission savings of fuels
Appendix H. Other model assumptions
Appendix I. Detailed RED scenario analysis
Appendix J. Scenario characterisation
Appendix K. Other sensitivities

20
Appendix F. Cost assumptions for fuels and electricity (p/L) (1/2)
*LBM and LNG cost set equal to CBM and CNG
Fuel Current 2020 Comments
FAME 72 79
(central)
75 (low)
93 (high)
Central price in line with industry feedback, reflecting expectations of feedstock costs
(oil / animal protein) increasing and tightening of sustainability criteria creating a
supply pressure on ‘good’ biodiesel.
BTL 93 (from
2017)
82
73
93
Based on IEA roadmap and checked by industry; will require volume production, i.e.
investment support and certainty
Diesel 58 65 DECC central projections (DECC, 2012)
E1G 48 48
42
51
Central price to stay constant, in line with industry feedback and in line with a very
slight decrease in costs 2011-2020 as shown in DfT IA
E2G 99 (from
2017)
59
25
99
• Central price, as per literature and approved by industry
• Low price, based on prices reported for Crescentino plant by NNFCC
Petrol 52 59 DECC central projections (DECC, 2012)
Biomethane* 83 83 • Current value based on cost premium on CNG as per Paterson et al, 2011 (38%)
• Assume cost stays constant
Natural gas* 60 77 • Current values as in Ricardo, 2013
• 2020: increases equivalent to industrial gas prices increase, as DECC
Electricity 14 19 DECC central projections (DECC,2012)
Fuel cost (excl. tax) in p/l (p/kg for gas; p/kWh for electricity). 2010 GBP

21
Appendix F. Cost assumptions for fuels and electricity (p/MJ) (2/2)
*LBM and LNG cost set equal to CBM and CNG
Fuel Current 2020 Comments
FAME 2.2 2.4 (central)
2.3 (low)
2.8 (high)
Central price in line with industry feedback, reflecting expectations of feedstock
costs (oil / animal protein) increasing and tightening of sustainability criteria
creating a supply pressure on ‘good’ biodiesel.
BTL 2.7 (from
2017)
2.4
2.2
2.7
Based on IEA roadmap and checked by industry; will require volume production,
i.e. investment support and certainty
Diesel 1.60 1.85 DECC central projections (DECC, 2012)
E1G 2.3 2.3
2.0
2.4
Central price to stay constant, in line with industry feedback and in line with a very
slight decrease in costs 2011-2020 as shown in DfT IA
E2G 4.7 (from
2017)
2.8
1.2
4.7
• Central price, as per literature and approved by industry
• Low price, based on prices reported for Crescentino plant by NNFCC
Petrol 1.62 1.81 DECC central projections (DECC, 2012)
Biomethane* 1.8 1.8 • Current value based on cost premium on CNG as per Paterson et al, 2011
(38%)
• Assume cost stays constant
Natural gas* 1.3 1.3 • Current values as in Ricardo, 2013
• 2020: increases equivalent to industrial gas prices increase, as DECC
Electricity 3.9 5.3 DECC central projections (DECC,2012)
Fuel cost (excl. tax) in p/MJ. 2010 GBP

22
Appendix A. List of consulted organisations
Appendix B. The case of NRMMs
Appendix C. Powertrain pathway summary
Appendix D. UK transport demand
Appendix E. Supply of fuels
Appendix F. Cost assumptions for fuels and electricity
Appendix G. WTW GHG emission savings of fuels
Appendix H. Other model assumptions
Appendix I. Detailed RED scenario analysis
Appendix J. Scenario characterisation
Appendix K. Other sensitivities
G1. WTW GHG emission
savings assumptions
G2. Assumptions for CBM
G3. Assumptions for electricity
23
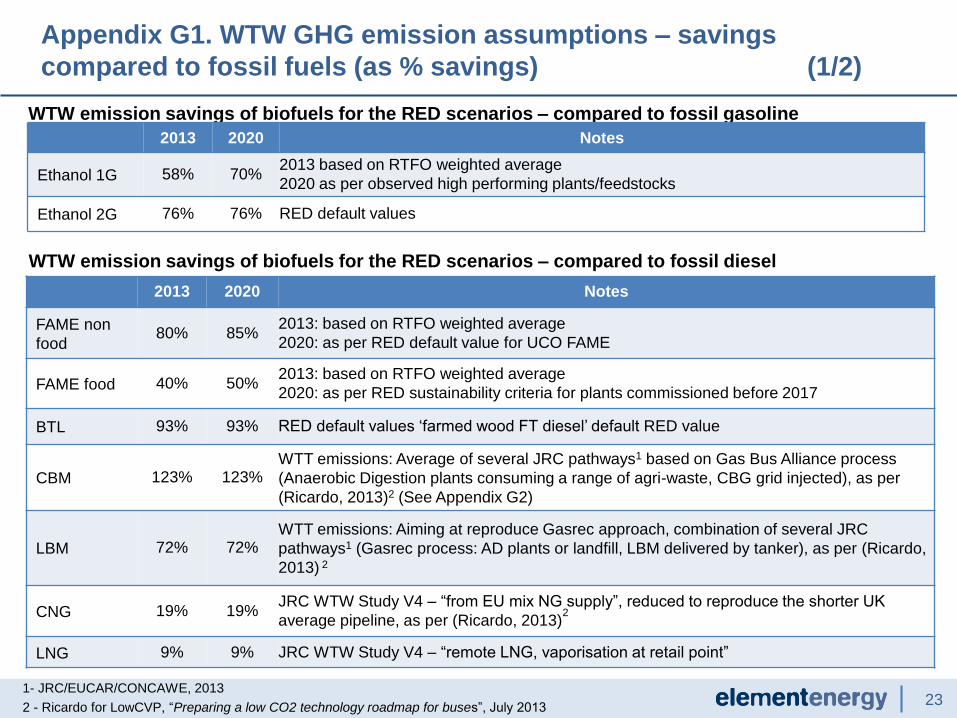
WTW emission savings of biofuels for the RED scenarios – compared to fossil gasoline
2013 2020 Notes
Ethanol 1G 58% 70%2013 based on RTFO weighted average
2020 as per observed high performing plants/feedstocks
Ethanol 2G 76% 76% RED default values
2013 2020 Notes
FAME non
food80% 85%
2013: based on RTFO weighted average
2020: as per RED default value for UCO FAME
FAME food 40% 50%2013: based on RTFO weighted average
2020: as per RED sustainability criteria for plants commissioned before 2017
BTL 93% 93% RED default values ‘farmed wood FT diesel’ default RED value
CBM 123% 123%WTT emissions: Average of several JRC pathways1 based on Gas Bus Alliance process
(Anaerobic Digestion plants consuming a range of agri-waste, CBG grid injected), as per
(Ricardo, 2013)2 (See Appendix G2)
LBM 72% 72%WTT emissions: Aiming at reproduce Gasrec approach, combination of several JRC
pathways1 (Gasrec process: AD plants or landfill, LBM delivered by tanker), as per (Ricardo,
2013) 2
CNG 19% 19%JRC WTW Study V4 – “from EU mix NG supply”, reduced to reproduce the shorter UK
average pipeline, as per (Ricardo, 2013)2
LNG 9% 9% JRC WTW Study V4 – “remote LNG, vaporisation at retail point”
WTW emission savings of biofuels for the RED scenarios – compared to fossil diesel
Appendix G1. WTW GHG emission assumptions – savings
compared to fossil fuels (as % savings) (1/2)
1- JRC/EUCAR/CONCAWE, 2013
2 - Ricardo for LowCVP, “Preparing a low CO2 technology roadmap for buses”, July 2013
24
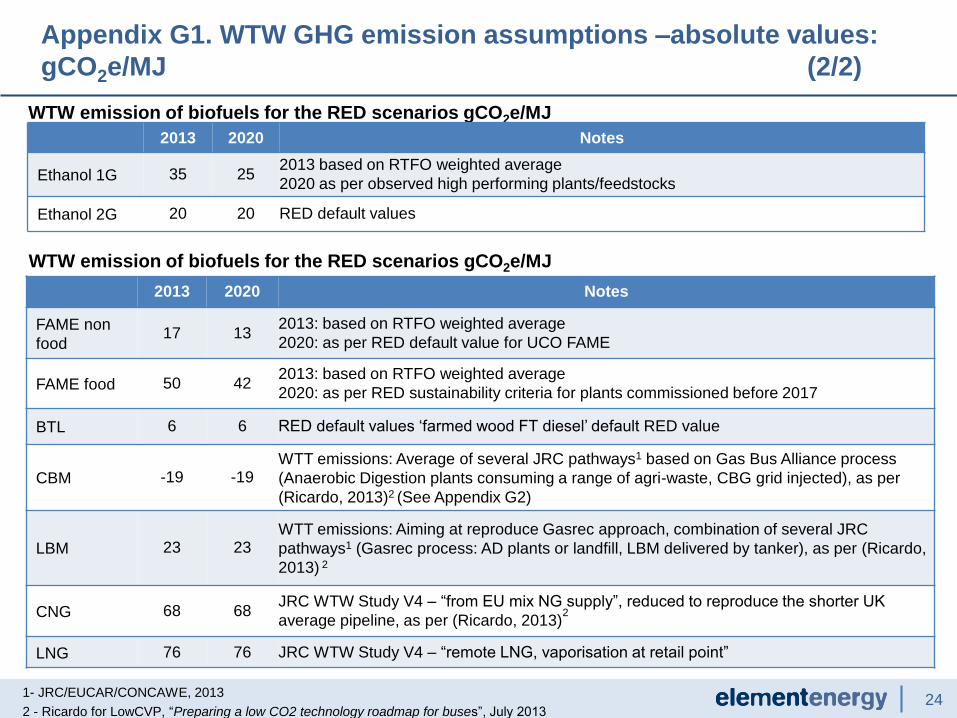
WTW emission of biofuels for the RED scenarios gCO2e/MJ
2013 2020 Notes
Ethanol 1G 35 252013 based on RTFO weighted average
2020 as per observed high performing plants/feedstocks
Ethanol 2G 20 20 RED default values
2013 2020 Notes
FAME non
food17 13
2013: based on RTFO weighted average
2020: as per RED default value for UCO FAME
FAME food 50 422013: based on RTFO weighted average
2020: as per RED sustainability criteria for plants commissioned before 2017
BTL 6 6 RED default values ‘farmed wood FT diesel’ default RED value
CBM -19 -19WTT emissions: Average of several JRC pathways1 based on Gas Bus Alliance process
(Anaerobic Digestion plants consuming a range of agri-waste, CBG grid injected), as per
(Ricardo, 2013)2 (See Appendix G2)
LBM 23 23WTT emissions: Aiming at reproduce Gasrec approach, combination of several JRC
pathways1 (Gasrec process: AD plants or landfill, LBM delivered by tanker), as per (Ricardo,
2013) 2
CNG 68 68JRC WTW Study V4 – “from EU mix NG supply”, reduced to reproduce the shorter UK
average pipeline, as per (Ricardo, 2013)2
LNG 76 76 JRC WTW Study V4 – “remote LNG, vaporisation at retail point”
WTW emission of biofuels for the RED scenarios gCO2e/MJ
Appendix G1. WTW GHG emission assumptions –absolute values:
gCO2e/MJ (2/2)
1- JRC/EUCAR/CONCAWE, 2013
2 - Ricardo for LowCVP, “Preparing a low CO2 technology roadmap for buses”, July 2013

25
WTT emissions (as per Ricardo 20131)
• In the UK there are currently two main pathways for CBG production as transport fuel:
− Gas Bus Alliance (GBA) process, with anaerobic digestion plants fed by a range of
agricultural waste, CBG grid injected
− Gasrec process, through anaerobic digestion plants or landfill, and LBM delivered by
tanker
• However, these pathways are not equivalent to those identified by CONCAWE
• For the GBA-advocated approach, because of the feedstock used, it is logical to average
OWGC2, OWGC3 & OWGC5, giving -75.7 gCO2eq/MJ
TTW emissions (as per JRC/EUCAR/CONCAWE,20132)
• Assumed to be equal for CNG, CBM, LNG and LBM, at 56.2 gCO2e/MJ
Appendix G2. Assumptions for CBM WTW savings
Summary of the WTT emissions2 – gCO2e/MJ
CONCAWE pathway Process WTT (gCO2e/MJ)
OWCG1 Municipal waste to CBG -39.5
OWCG2 Liquid manure to CBG -140.6
OWCG3 Dry manure to CBG -54.9
OWCG4 Whole wheat plant to CBG -34.8
OWCG5 Double cropped maize + barley to CBG -31.5
1 - Ricardo for LowCVP, “Preparing a low CO2 technology roadmap for buses”, July 2013
2- JRC/EUCAR/CONCAWE, 2013

26
Appendix G3. Assumptions for electricity: share of renewable
electricity and grid carbon intensity
Share of electricity generation from renewables1
UK electricity emission factors2
• Share of renewable electricity based on EU
share, measured two years before the year in
question (RED Art. 3 (4c))3, i.e. for 2020, share
of 2018 counts (31%)
• As per RED rules, energy from electricity is
multiplied by a factor of 2.5, both in the
numerator and denominator
• Grid carbon intensity based on DECC
projections, for calculation of WTW emissions2010 2012 2014 2016 2018 2020
30%
20%
40%
10%
0%
EU 27
UK
31%
238
0
200
400
600
2010 2012 2014 2016 2018 2020
gCO2e/kWh
1 – For UK, DECC Updated Energy & Emissions Projections -
October 2012. Central scenario
For EU, ECN Renewable energy projections in the
National Renewable Actions Plans of the European MS, 2011
2 – DECC appraisal guidance September 2013
3 – ‘’for the calculation of the contribution from electricity
produced from renewable sources Member States may
choose to use either the average share of electricity from
renewable energy sources in the Community or the share of
electricity from renewable energy sources in their own country
as measured two years before the year in question

27
Appendix A. List of consulted organisations
Appendix B. The case of NRMMs
Appendix C. Powertrain pathway summary
Appendix D. UK transport demand
Appendix E. Supply of fuels
Appendix F. Cost assumptions for fuels and electricity
Appendix G. WTW GHG emission savings of fuels
Appendix H. Other model assumptions
Appendix I. Detailed RED scenario analysis
Appendix J. Scenario characterisation
Appendix K. Other sensitivities
H1. Existing stock
H2. Future car fleet
H3. Travel trends
H4. Cost and MJ/km of new
vehicles
H5. New vehicle compatibility
assumptions

28
Appendix H1. Other model assumptions: existing stock
DRDNI: Department for Regional Development Northern Ireland ; NI: Northern Ireland
0%
20%
40%
60%
80%
100%
0 5 10 15 20 25 30
Year since registration
Cars
Vans
HGVs
Buses
Survival rate of vehicles • Survival rates based on Dft GB
data (tables VEH0211, VEH0411,
VEH0511, VEH0611)
• Adjusted to reproduce stock as
reported in Dft series (tables
VEH0203, VEH0403, VEH0503,
VEH0603)
• Data from DRDNI for Northern
Ireland used to create UK stock
• Vehicle km based on Dft data
(TRA0101), adjusted for NI
based on NI/GB stock ratio
• DECC Energy Consumption UK
data series (Mtoe per fuel per
vehicle class) used to calibrate
fleet MJ/km
Cars Vans HGVs Buses
Stock 3.1% 2.6% 5.1% 1.7%
Sales 4.3% 4.0% 8.5% 5%
% NI adds to GB stock and sales, 2007-2011 average
Cars Vans HGVs Buses
Years 12.5 11.5 9.0 13.5
Average lifetime of vehicles – derived from survival rates
29
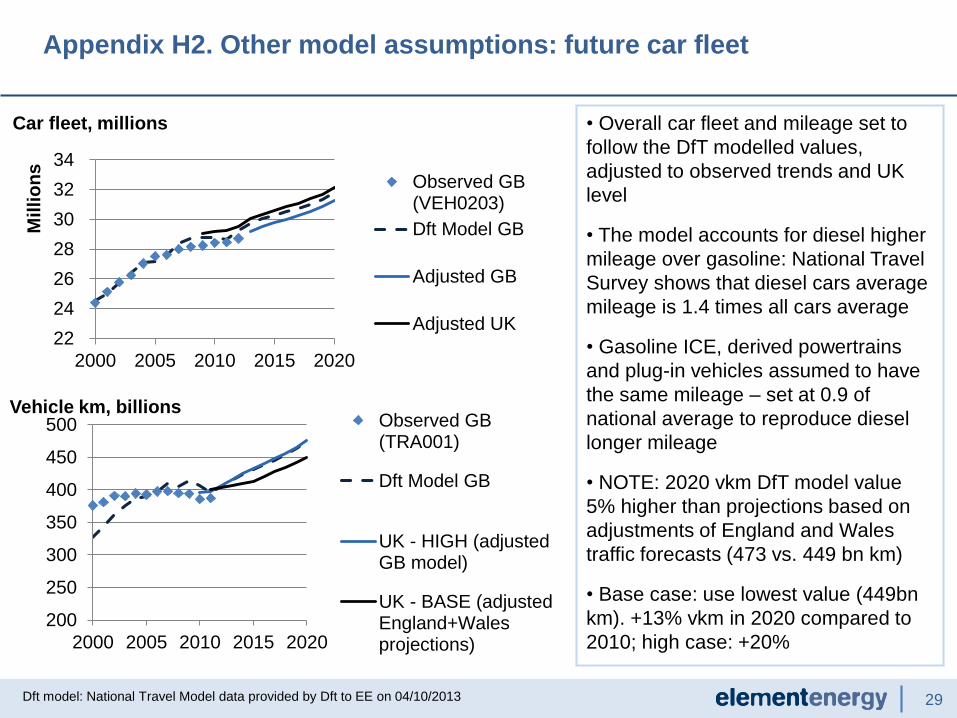
Appendix H2. Other model assumptions: future car fleet
Dft model: National Travel Model data provided by Dft to EE on 04/10/2013
22
24
26
28
30
32
34
2000 2005 2010 2015 2020
Mil
lio
ns
Observed GB(VEH0203)
Dft Model GB
Adjusted GB
Adjusted UK
Car fleet, millions
200
250
300
350
400
450
500
2000 2005 2010 2015 2020
Observed GB(TRA001)
Dft Model GB
UK - HIGH (adjustedGB model)
UK - BASE (adjustedEngland+Walesprojections)
Vehicle km, billions
• Overall car fleet and mileage set to
follow the DfT modelled values,
adjusted to observed trends and UK
level
• The model accounts for diesel higher
mileage over gasoline: National Travel
Survey shows that diesel cars average
mileage is 1.4 times all cars average
• Gasoline ICE, derived powertrains
and plug-in vehicles assumed to have
the same mileage – set at 0.9 of
national average to reproduce diesel
longer mileage
• NOTE: 2020 vkm DfT model value
5% higher than projections based on
adjustments of England and Wales
traffic forecasts (473 vs. 449 bn km)
• Base case: use lowest value (449bn
km). +13% vkm in 2020 compared to
2010; high case: +20%
30
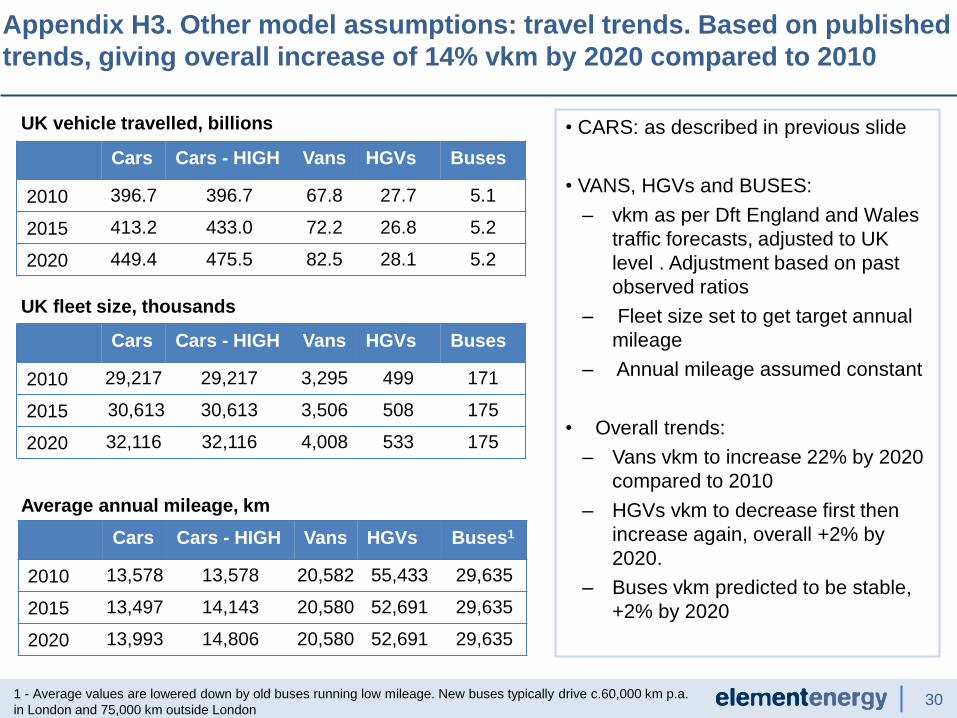
Appendix H3. Other model assumptions: travel trends. Based on published
trends, giving overall increase of 14% vkm by 2020 compared to 2010
1 - Average values are lowered down by old buses running low mileage. New buses typically drive c.60,000 km p.a.
in London and 75,000 km outside London
UK vehicle travelled, billions
UK fleet size, thousands
• CARS: as described in previous slide
• VANS, HGVs and BUSES:
– vkm as per Dft England and Wales
traffic forecasts, adjusted to UK
level . Adjustment based on past
observed ratios
– Fleet size set to get target annual
mileage
– Annual mileage assumed constant
• Overall trends:
– Vans vkm to increase 22% by 2020
compared to 2010
– HGVs vkm to decrease first then
increase again, overall +2% by
2020.
– Buses vkm predicted to be stable,
+2% by 2020
Average annual mileage, km
Cars Cars - HIGH Vans HGVs Buses
2010 396.7 396.7 67.8 27.7 5.1
2015 413.2 433.0 72.2 26.8 5.2
2020 449.4 475.5 82.5 28.1 5.2
Cars Cars - HIGH Vans HGVs Buses
2010 29,217 29,217 3,295 499 171
2015 30,613 30,613 3,506 508 175
2020 32,116 32,116 4,008 533 175
Cars Cars - HIGH Vans HGVs Buses1
2010 13,578 13,578 20,582 55,433 29,635
2015 13,497 14,143 20,580 52,691 29,635
2020 13,993 14,806 20,580 52,691 29,635
31
Appendix H4. Other model assumptions: cost of new vehicles,
MJ/km of new vehicles
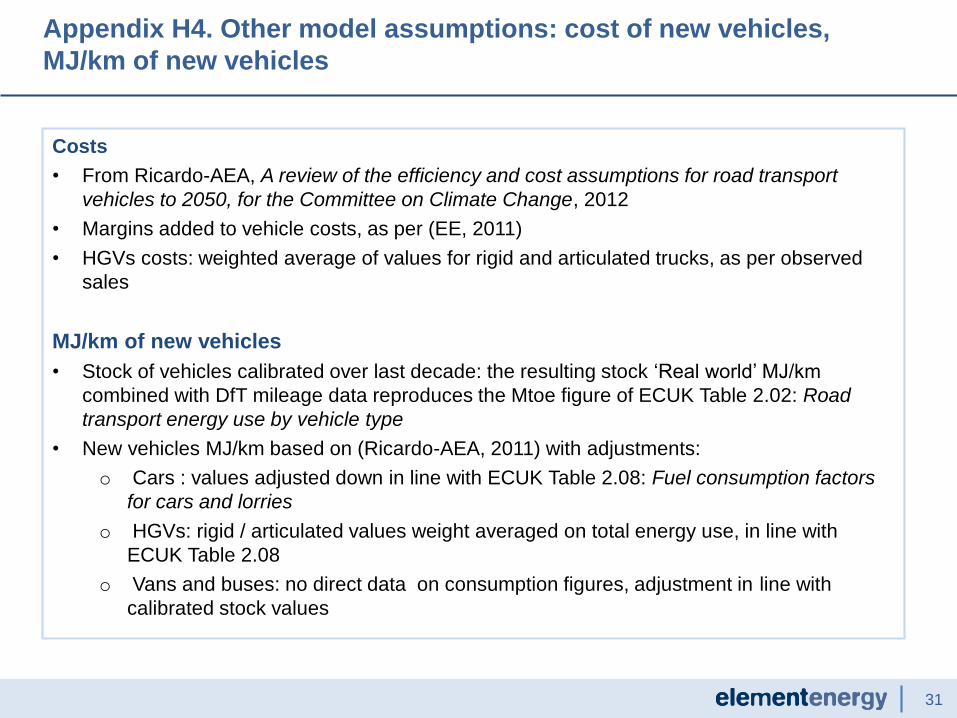
Costs
• From Ricardo-AEA, A review of the efficiency and cost assumptions for road transport
vehicles to 2050, for the Committee on Climate Change, 2012
• Margins added to vehicle costs, as per (EE, 2011)
• HGVs costs: weighted average of values for rigid and articulated trucks, as per observed
sales
MJ/km of new vehicles
• Stock of vehicles calibrated over last decade: the resulting stock ‘Real world’ MJ/km
combined with DfT mileage data reproduces the Mtoe figure of ECUK Table 2.02: Road
transport energy use by vehicle type
• New vehicles MJ/km based on (Ricardo-AEA, 2011) with adjustments:
o Cars : values adjusted down in line with ECUK Table 2.08: Fuel consumption factors
for cars and lorries
o HGVs: rigid / articulated values weight averaged on total energy use, in line with
ECUK Table 2.08
o Vans and buses: no direct data on consumption figures, adjustment in line with
calibrated stock values
32
Appendix H5. New vehicle compatibility assumptions for high biodiesel
blends and existing stock compatibility
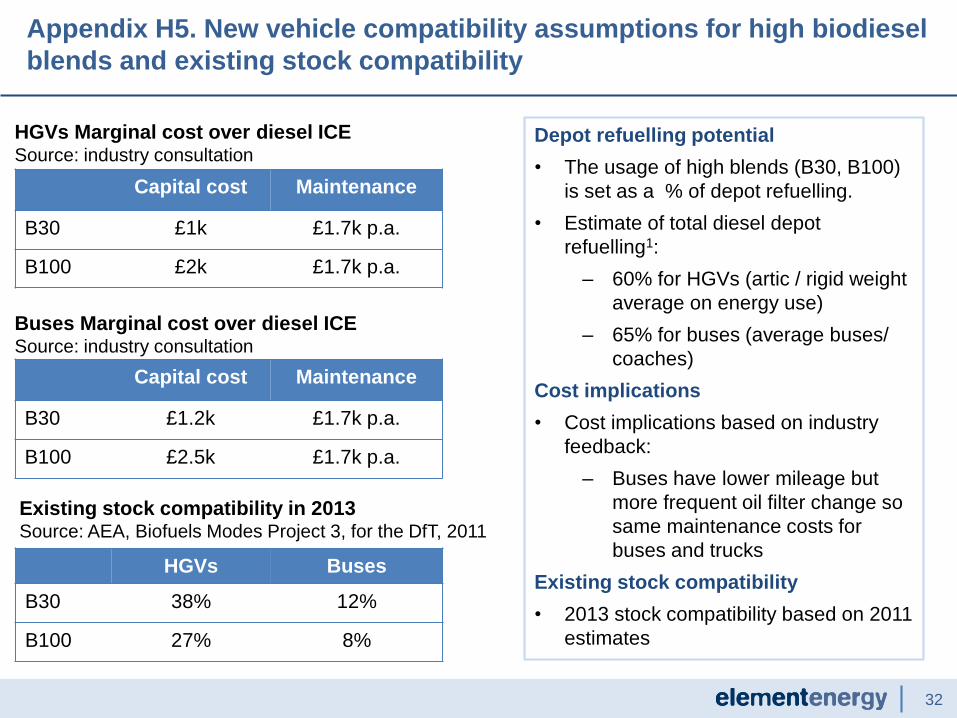
Depot refuelling potential
• The usage of high blends (B30, B100)
is set as a % of depot refuelling.
• Estimate of total diesel depot
refuelling1:
– 60% for HGVs (artic / rigid weight
average on energy use)
– 65% for buses (average buses/
coaches)
Cost implications
• Cost implications based on industry
feedback:
– Buses have lower mileage but
more frequent oil filter change so
same maintenance costs for
buses and trucks
Existing stock compatibility
• 2013 stock compatibility based on 2011
estimates
Capital cost Maintenance
B30 £1k £1.7k p.a.
B100 £2k £1.7k p.a.
HGVs Marginal cost over diesel ICE Source: industry consultation
Buses Marginal cost over diesel ICE Source: industry consultation
Capital cost Maintenance
B30 £1.2k £1.7k p.a.
B100 £2.5k £1.7k p.a.
HGVs Buses
B30 38% 12%
B100 27% 8%
Existing stock compatibility in 2013Source: AEA, Biofuels Modes Project 3, for the DfT, 2011

33
Appendix A. List of consulted organisations
Appendix B. The case of NRMMs
Appendix C. Powertrain pathway summary
Appendix D. UK transport demand
Appendix E. Supply of fuels
Appendix F. Cost assumptions for fuels and electricity
Appendix G. WTW GHG emission savings of fuels
Appendix H. Other model assumptions
Appendix I. Detailed RED scenario analysis
Appendix J. Scenario characterisation
Appendix K. Other sensitivities
I1. E10&B7 scenario
I2. Depot scenario focus
I3. High blends at forecourts
I4. New blends introduction at
forecourts & E85 deployment
I5. The case of ILUC factors
34
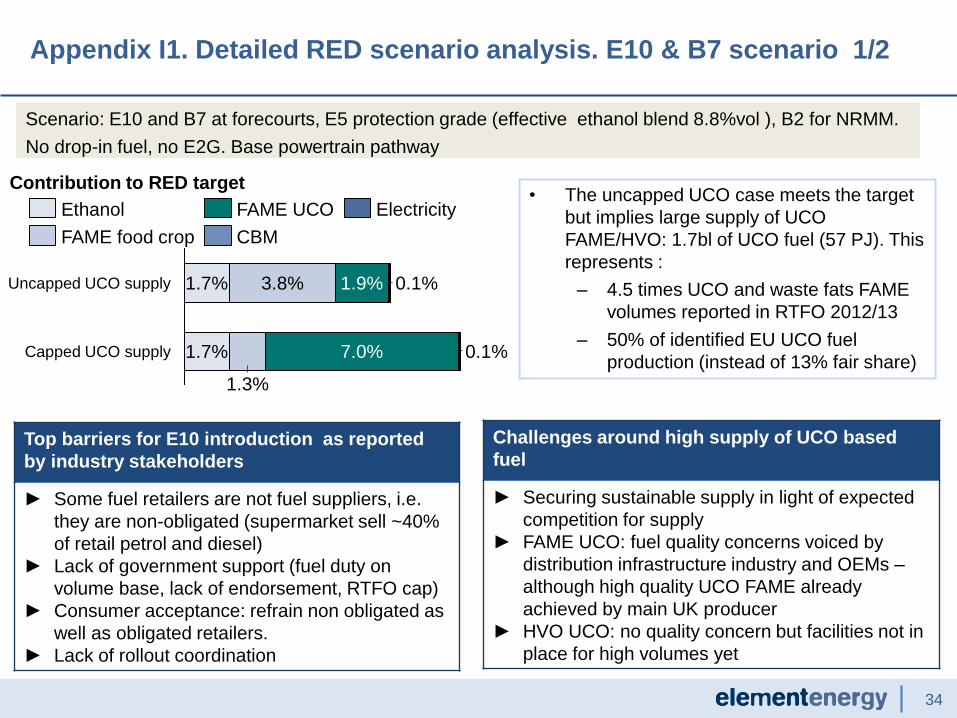
Appendix I1. Detailed RED scenario analysis. E10 & B7 scenario 1/2
• The uncapped UCO case meets the target
but implies large supply of UCO
FAME/HVO: 1.7bl of UCO fuel (57 PJ). This
represents :
– 4.5 times UCO and waste fats FAME
volumes reported in RTFO 2012/13
– 50% of identified EU UCO fuel
production (instead of 13% fair share)
Contribution to RED target
Scenario: E10 and B7 at forecourts, E5 protection grade (effective ethanol blend 8.8%vol ), B2 for NRMM.
No drop-in fuel, no E2G. Base powertrain pathway
Top barriers for E10 introduction as reported
by industry stakeholders
► Some fuel retailers are not fuel suppliers, i.e.
they are non-obligated (supermarket sell ~40%
of retail petrol and diesel)
► Lack of government support (fuel duty on
volume base, lack of endorsement, RTFO cap)
► Consumer acceptance: refrain non obligated as
well as obligated retailers.
► Lack of rollout coordination
Challenges around high supply of UCO based
fuel
► Securing sustainable supply in light of expected
competition for supply
► FAME UCO: fuel quality concerns voiced by
distribution infrastructure industry and OEMs –
although high quality UCO FAME already
achieved by main UK producer
► HVO UCO: no quality concern but facilities not in
place for high volumes yet
Capped UCO supply 1.7%
1.3%
7.0% 0.1%
Uncapped UCO supply 1.7% 3.8% 1.9% 0.1%
CBM
ElectricityFAME UCO
FAME food crop
Ethanol

35
UCO supply limited at 450 Ml. Two levers considered:
► Double counting fuels (E2G, BTL drop-in diesel) ► High AFV powertrain pathway
• Not possible to meet the target in E10&B7
scenario (if UCO cap exists) without
exceeding the ‘Stretch’ supply limits for
E2G and BTL or Alternative Fuel Vehicle
uptake.
• Negligible contribution of HighAFV to the
target, while remarkably increasing costs as
£/GJ and £/tCO2e (bottom graph).
Options to meet the 10% target: increase of
double counting fuels beyond Stretch supply
EITHER for E2G :
► 1 billion litres of E2G (23 PJ) – 1.4 times E1G
supplied to UK in 2012/13
OR for BTL :
► 500 million litres of BTL fuel (17.5 PJ) – giving
effective blend of 8.8%vol of renewable fuel in
diesel
► Values 4.5 and 2 times higher than the
Stretch supply caps. BTL more cost effective
Cost effectiveness comparison
% renewable energy under RED
HighAFV pathway
7,5%
9%
0,1%
‘Stretch’ supply
(E2G and BTL)
8.9%
1,4%
E10 & B7 No
E2G, no BTL.
Base pathway
0
5
10
15
20
0
100
200
300
Stretch’ supply
(E2G and BTL)
HighAFV pathwayE10 & B7
No E2G, no BTL
Base pathway
£/GJ £/tCO2e
£/GJ £/tCO2e
Appendix I1. Detailed RED scenario analysis. E10 & B7 scenario 2/2

36Reminder of assumptions: 60% HVGs refuel at depot, 65% of buses refuel at depot.
1 – Source: UKPIA
• The 10% RED target can be met:
– With 10% depot refuelling vehicles
using B30 and twice the Stretch
supply BTL (535 Ml); or
– With 10% depot refuelling vehicles
using B100 and 1.2 times the
Stretch supply of BTL (309 Ml); or
– With 36% depot refuelling vehicles
using B30 and High BTL.
• Use of FAME food crop: 2-2.5 billion l
• Most cost-effective combination:
– 10% uptake of B30 among depot
fleet
– 535 ml BTL (18.2 PJ)
– 7.6 £/GJ and 98 £/tCO2e
• Past biodiesel incentives achieved less
than 10% uptake among depot refuel1.
Assumptions of 10% and 36% uptake
are therefore ambitious.
Scenario: E10 and B7 at forecourts, E5 protection grade (effective ethanol blend 8.8%vol), B2 for NRMM. Base
powertrain pathway. Levers: share of depot refuelling HGVs and buses using B30 or B100; supply of BTL diesel
Cost effectiveness comparison
Contribution to RED target
36% B30 at depot
Stretch supply
0,1%
1,9%1,7%
10% B100 at depot
No E2G, 10.5 PJ BTL
10% B30 at depot
No E2G, 18.2 PJ BTL2,2%
5,1%
4,1%
1,7%
1,4% 4,9% 1,9% 1,7%
0,2%
1,9% 1,3%
0,1%
OtherFAME UCOFAME food cropEthanol E2G / BTL
0
5
10
0
50
100
150
10% B30 at
depot - No
E2G, 18.2
PJ BTL
36% B30 at
depot -
Stretch supply
10% B100
at depot -
No E2G,
10.5 PJ BTL
£/tCO2e£/GJ
£/tCO2e
£/GJ
Appendix I2. Detailed RED scenario analysis. Depot scenario focus

37
• Earliest possible introduction of E20 or B10
compatible vehicles is 2019 – meaning
very low % of 2020 fleet would be
compatible.
• As a consequence, E20 or B10 on their
own cannot meet the 10% target and need
unrealistic supply of drop-in fuel.
• The case of E85 presents more realistic
options:
– 10% of pumps supplying E85 by
2020. Stretch supply for E2G. BTL 0.8
Stretch supply. Effective petrol blend:
E14.4
– 10% of pumps supplying E85 by
2020. High supply for E2G. Stretch
BTL supply. Effective petrol blend:
E15
– 13.5% of pumps supplying E85 by
2020. High supply for E2G, BTL.
Sales of E85 cars escalating to 1.3 m
by 2020.
Cost effectiveness comparison
E85 case - contribution to RED target
Scenario: E10 and B7 at forecourts, E5 protection
grade, B2 for NRMM. Base powertrain pathway.
Cases investigated: E20, E85 and B10
Extra lever: supply of E2G and BTL diesel
E20: earliest car sales in 2019. Assumed 40% of cars sold in 2019 are E20 compatible, 50% in 2020. Same timeline
for B10. E85: See appendix I4 (next slide)
13.5% E85 supply.
High E2G and BTL3,4% 3,8% 1,9% 0,8%
0,1%
10% E85 supply.
High E2G. BTL stretch2,9% 3,8% 1,9% 1,4%
0,1%
10% E85 supply.
Stretch E2G.
BTL below stretch (7PJ)2,7% 3,8% 1,9% 1,5%
0,1%
Other
E2G / BTL
FAME UCO
FAME food crop
Ethanol
0
2
4
6
0
50
100
£/tCO2e£/GJ
10% E85 supply.
High E2G. BTL
above stretch
10% E85 supply.
Stretch E2G. BTL
below stretch
£/tCO2e
£/GJ
Appendix I3. Detailed RED scenario analysis. High blends at forecourts
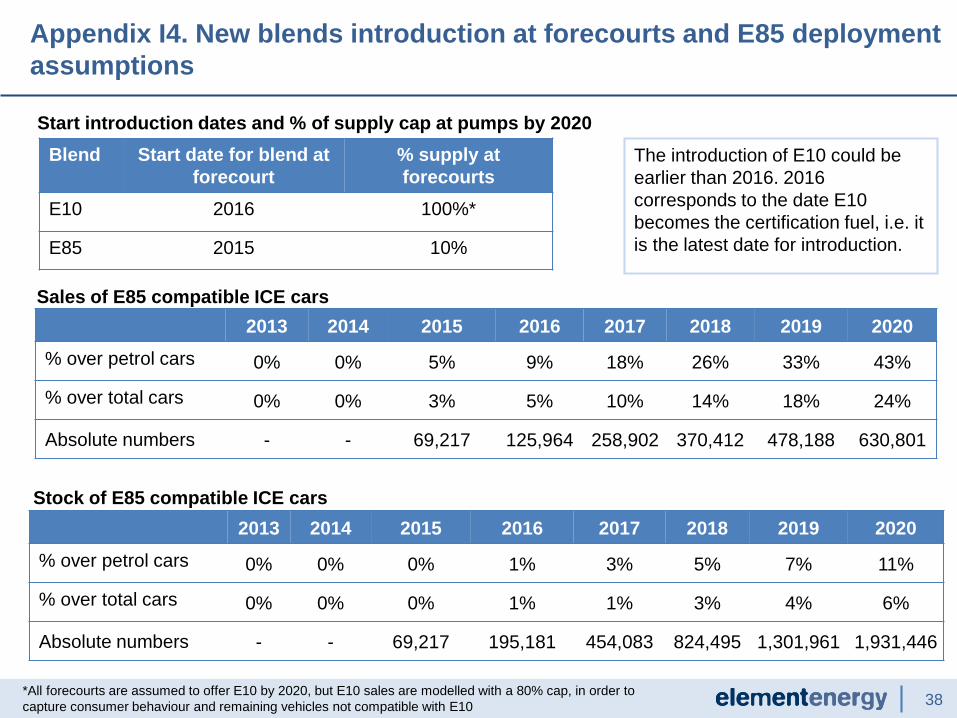
38
Blend Start date for blend at
forecourt
% supply at
forecourts
E10 2016 100%*
E85 2015 10%
2013 2014 2015 2016 2017 2018 2019 2020
% over petrol cars 0% 0% 5% 9% 18% 26% 33% 43%
% over total cars 0% 0% 3% 5% 10% 14% 18% 24%
Absolute numbers - - 69,217 125,964 258,902 370,412 478,188 630,801
Sales of E85 compatible ICE cars
2013 2014 2015 2016 2017 2018 2019 2020
% over petrol cars 0% 0% 0% 1% 3% 5% 7% 11%
% over total cars 0% 0% 0% 1% 1% 3% 4% 6%
Absolute numbers - - 69,217 195,181 454,083 824,495 1,301,961 1,931,446
Stock of E85 compatible ICE cars
Start introduction dates and % of supply cap at pumps by 2020
Appendix I4. New blends introduction at forecourts and E85 deployment
assumptions
*All forecourts are assumed to offer E10 by 2020, but E10 sales are modelled with a 80% cap, in order to
capture consumer behaviour and remaining vehicles not compatible with E10
The introduction of E10 could be
earlier than 2016. 2016
corresponds to the date E10
becomes the certification fuel, i.e. it
is the latest date for introduction.

391- Source: COM(2012) 595 final
Comparison of annual WTW emissions, MtCO2e
• The inclusion of ILUC factors implies additional
cumulative absolute emissions of 1.5- 4.5
MtCO2e in 2020, and of 20-30 MtCO2e in total
2014-2020 WTW cumulative emissions (2-3%
of total cumulative emissions)
Fuel ILUC
factor 12013 inc.
ILUC
2020 inc.
ILUC
Petrol and
Diesel
E1G 13 48 38 83.8
Crop
FAME
55 105 97 83.8
WTW emissions (‘central scenario’) and ILUC
contributions for E1G and FAME food (gCO2e/MJ)
• The savings of the scenarios compared to the
baseline are almost eliminated when ILUC
factors are included (reductions of 2014-2020
WTW cumulative savings by 70-98%)
Comparison of 2020 total WTW emissions, MtCO2e
ILUC factors as proposed by the EC in
20121 make the WTW emissions of FAME
food higher than diesel
0
136
134
132
138
2020 -
E10&B7 case
2013 2020 - Base
(E5&B5)
-2,1%
-0,1%
2020 - B30
scenario
ILUCNO ILUC136
0
134
132
130130
Depot&E85
134
E85
134
130
DepotB30
135
131
E10&B7
132
131
ILUCNO ILUC
Appendix I5. Detailed RED scenario analysis. The case of ILUC factors

40
Appendix A. List of consulted organisations
Appendix B. The case of NRMMs
Appendix C. Powertrain pathway summary
Appendix D. UK transport demand
Appendix E. Supply of fuels
Appendix F. Cost assumptions for fuels and electricity
Appendix G. WTW GHG emission savings of fuels
Appendix H. Other model assumptions
Appendix I. Detailed RED scenario analysis
Appendix J. Scenario characterisation
Appendix K. Other sensitivities
41
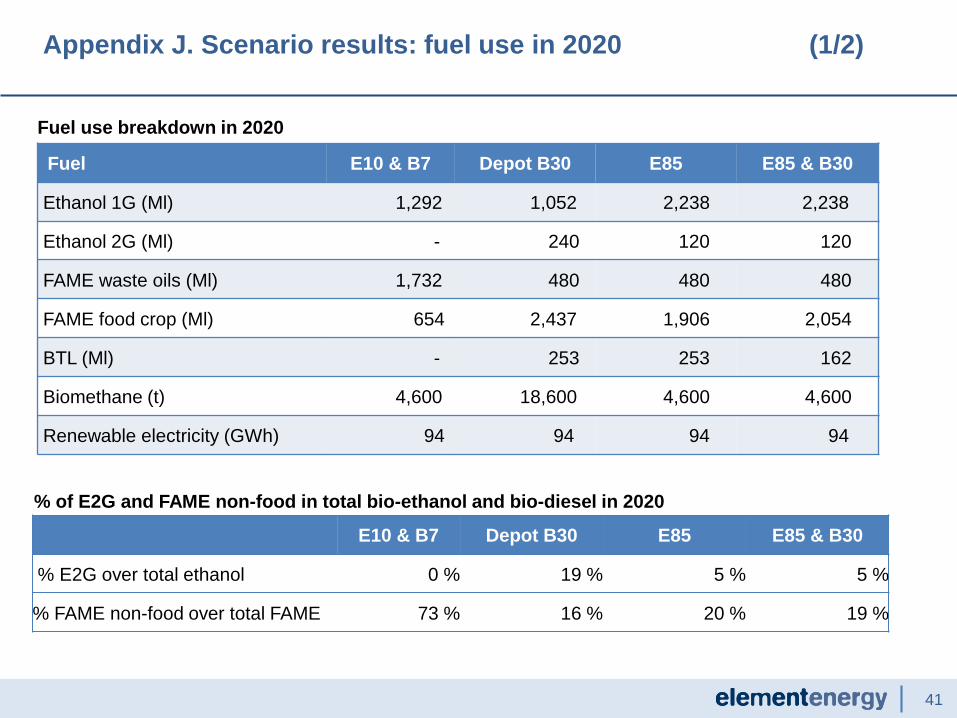
Appendix J. Scenario results: fuel use in 2020 (1/2)
Fuel E10 & B7 Depot B30 E85 E85 & B30
Ethanol 1G (Ml) 1,292 1,052 2,238 2,238
Ethanol 2G (Ml) - 240 120 120
FAME waste oils (Ml) 1,732 480 480 480
FAME food crop (Ml) 654 2,437 1,906 2,054
BTL (Ml) - 253 253 162
Biomethane (t) 4,600 18,600 4,600 4,600
Renewable electricity (GWh) 94 94 94 94
E10 & B7 Depot B30 E85 E85 & B30
% E2G over total ethanol 0 % 19 % 5 % 5 %
% FAME non-food over total FAME 73 % 16 % 20 % 19 %
Fuel use breakdown in 2020
% of E2G and FAME non-food in total bio-ethanol and bio-diesel in 2020
42
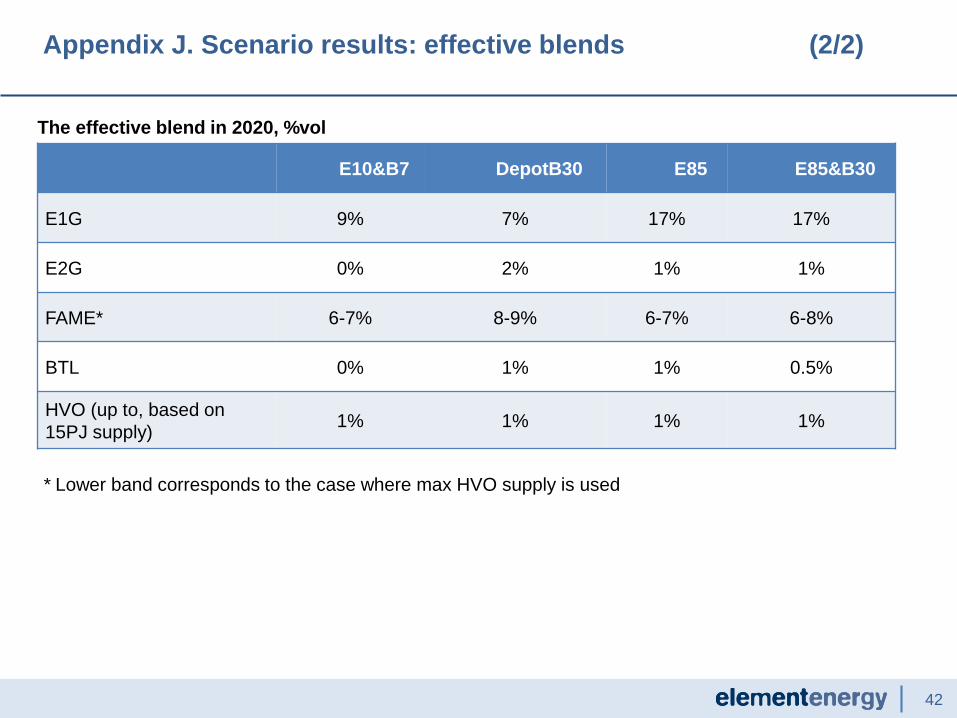
Appendix J. Scenario results: effective blends (2/2)
E10&B7 DepotB30 E85 E85&B30
E1G 9% 7% 17% 17%
E2G 0% 2% 1% 1%
FAME* 6-7% 8-9% 6-7% 6-8%
BTL 0% 1% 1% 0.5%
HVO (up to, based on
15PJ supply)1% 1% 1% 1%
The effective blend in 2020, %vol
* Lower band corresponds to the case where max HVO supply is used
43
Appendix A. List of consulted organisations
Appendix B. The case of NRMMs
Appendix C. Powertrain pathway summary
Appendix D. UK transport demand
Appendix E. Supply of fuels
Appendix F. Cost assumptions for fuels and electricity
Appendix G. WTW GHG emission savings of fuels
Appendix H. Other model assumptions
Appendix I. Detailed RED scenario analysis
Appendix J. Scenario characterisation
Appendix K. Other sensitivities
44
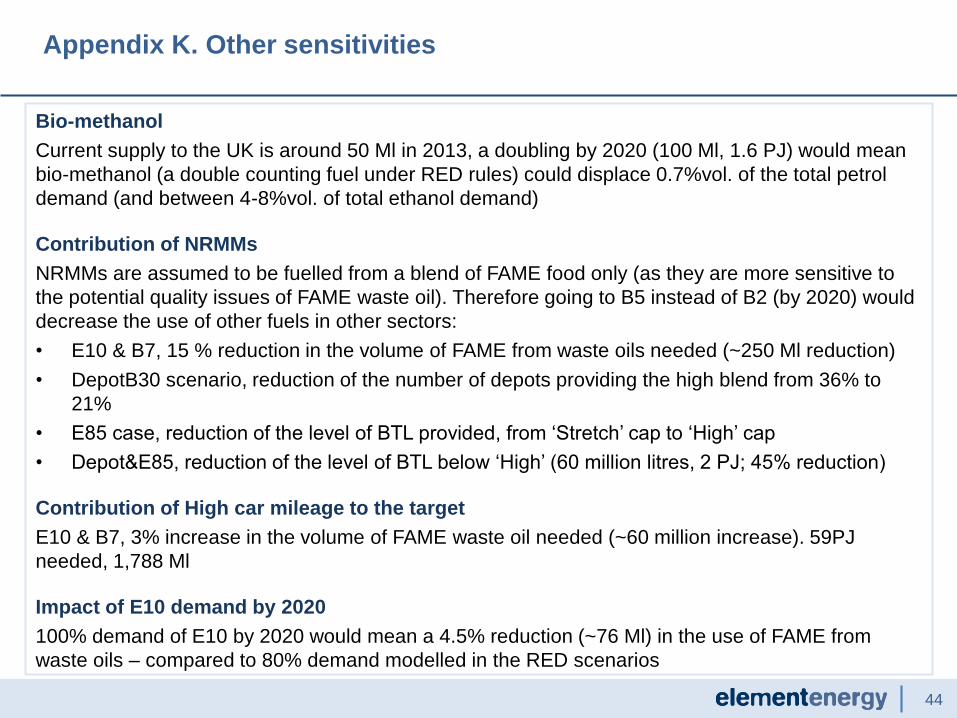
Bio-methanol
Current supply to the UK is around 50 Ml in 2013, a doubling by 2020 (100 Ml, 1.6 PJ) would mean
bio-methanol (a double counting fuel under RED rules) could displace 0.7%vol. of the total petrol
demand (and between 4-8%vol. of total ethanol demand)
Contribution of NRMMs
NRMMs are assumed to be fuelled from a blend of FAME food only (as they are more sensitive to
the potential quality issues of FAME waste oil). Therefore going to B5 instead of B2 (by 2020) would
decrease the use of other fuels in other sectors:
• E10 & B7, 15 % reduction in the volume of FAME from waste oils needed (~250 Ml reduction)
• DepotB30 scenario, reduction of the number of depots providing the high blend from 36% to
21%
• E85 case, reduction of the level of BTL provided, from ‘Stretch’ cap to ‘High’ cap
• Depot&E85, reduction of the level of BTL below ‘High’ (60 million litres, 2 PJ; 45% reduction)
Contribution of High car mileage to the target
E10 & B7, 3% increase in the volume of FAME waste oil needed (~60 million increase). 59PJ
needed, 1,788 Ml
Impact of E10 demand by 2020
100% demand of E10 by 2020 would mean a 4.5% reduction (~76 Ml) in the use of FAME from
waste oils – compared to 80% demand modelled in the RED scenarios
Appendix K. Other sensitivities