Embed Size (px)
Citation preview

The Chartist Actual Cash AccountSTATUS AS OF 10/7/21
Editors: Dan Sullivan & Steve Mais | October 7, 2021
STOCK NO OF PURCHASE PURCHASE CURRENT GAIN %FUND SYMBOL SHARES DATE PRICE PRICE (LOSS) CHANGEALLSTATE CORPORATION ALL 52 9/7/12 38.51 127.34 4,619 230.7AMAZON COM INC AMZN 8 9/7/12 256.77 3302.43 24,365 1,186.1SPDR DOW JONES DIA 185 6/3/16 177.98 347.65 31,389 95.3SPDR DOW JONES DIA 559 8/19/20 278.68 347.65 38,554 24.7EBAY INC EBAY 41 9/7/12 19.28 74.17 2,250 284.7EQUINIX INC NEW EQIX 10 9/7/12 201.22 766.49 5,653 280.9HOME DEPOT INC HD 36 9/7/12 57.44 337.48 10,081 487.5ISHARES RUSSELL 1000 IWB 825 8/19/20 189.02 246.99 47,825 30.7ISHARES RUSSELL 2000 IWM 500 8/19/20 156.94 223.26 33,160 42.3SPDR S&P MIDCAP 400 MDY 220 8/19/20 354.28 492.85 30,485 39.1PAYPAL PYPL 41 9/7/12 29.81 263.54 9,583 784.1INVESCO QQQ TRUST QQQ 834 6/21/19 188.63 362.97 145,400 92.4SPDR S&P 500 SPY 321 6/3/16 210.32 438.65 73,294 108.6SPDR S&P 500 SPY 849 7/21/20 326.48 438.65 95,232 34.4SPDR S&P 500 SPY 460 8/19/20 339.11 438.65 45,788 29.4TRUIST FINANCIAL TFC 97 9/7/12 21.35 60.52 3,799 183.5T J X COS INC TJX 88 9/7/12 22.99 64.98 3,695 182.6
Above are all the open positions in the Chartist long-term managed account. On each and every trade, actual cash is deployed. Copies of the complete Track Record are available upon request. Whenever the Chartist makes recommendations concerning this account, they are placed on our Hotline at approximately 3:00 PM West Coast Time. The Actual Cash Account is NOT hypothetical. It is the personal account of Dan Sullivan. We do not act on behalf of ourselves or the Actual Cash Account until the day after our Hotline is acti-vated, this gives everyone ample time to accept or reject the advice placed on the Hotline. The Chartist does have discretionary managed accounts who may buy or sell the same securities listed in our publication before or after they are recommended on our newsletter or Hotlines. The performance results of the Actual Cash Account are presented gross of advisory fees. Officers, employees, affiliates and clients of The Chartist, Inc. may have positions in securities and may make additional purchases or sales.
CURRENT STOCK VALUE $1,778,561 MONEY MARKET FUNDS $41,020TOTAL COST $1,173,324 TOTAL PROFITS $605,237
P.O. Box 758, Seal Beach, CA 90740 | 800-942-4278 | www.thechartist.com
SUPPORT HOLDSToday’s rally was impressive especially in the early going. At one point, the Dow was sporting a 550 point gain buoyed by a truce in the debt ceiling standoff. On top of that, jobless benefits declined last week by the most in three months. Most indices finish well off their highs but still manage to post impressive gains. Since yesterday’s intraday lows, the market as measured by the benchmark S&P 500 has tacked on a 2.5% gain and, in the process, successfully tested key support in evidence at its September 20th intraday lows.
The Dow also successfully tested support and added 900 points or 2.6% over the same time frame. The price action of the Russell 2000, S&P Midcap Index and Value Line Geometric was equally impressive. All three of these key indices have now moved back above their respective 50 day moving averages. In fact, the Russell 2000 and Value Line Geometric managed to move back above both their 200 and 50 day lines in today’s session.
The Nasdaq has also rallied back; however, it is still the weakest of the key indices. It was the only one of the aforementioned that took out its September 20th intraday lows on a closing basis. The Nasdaq 100 has traced
Celebrating 52 YearsPublishedSince 1969
�eChartistReal Money Portfolios... Nothing Hypothetical
�eChartistPublished since 1969
�eChartistPublished Since 1969
option A
option B
ACCESS CODECURRENT: 8383
2
out a similar pattern. Despite the rally, our near-term indicators are inconclusive. But looking further out, our models remain in a highly bullish mode. Our advice for investors who are following our Real Money accounts is to stay fully invested.
Question: So far, so good. Your so-called key support area is holding, but what happens next? Do you think it will continue to hold?
Answer: It could, but we suspect it will be broken. This could potentially set up a test of the various 200 day moving averages. We feel it is going to take a heavily oversold condition to turn this market around. The last time our overbought/oversold indicator was heavily oversold was on July 19th.
This indicator is based on the 19-day exponential moving average of the Value Line Geometric. When the index closes 3% or more below its 19 day line, the market by our definition is in a heavily oversold condition. It is interesting to note that the July 19th reading of 4.17% marked the exact lows of the pullback that was in effect at the time. This is not an unusual occurrence. Over the years we have observed that the first heavily oversold reading often marks the exact lows of the sell off.
Question: So, you are looking for a heavily oversold reading that in turn will mark the bottom of this pullback?
Answer: This is a distinct possibility; however, in this business there are no guarantees. As always, we take it one day at a time. In our opinion, the main concern that
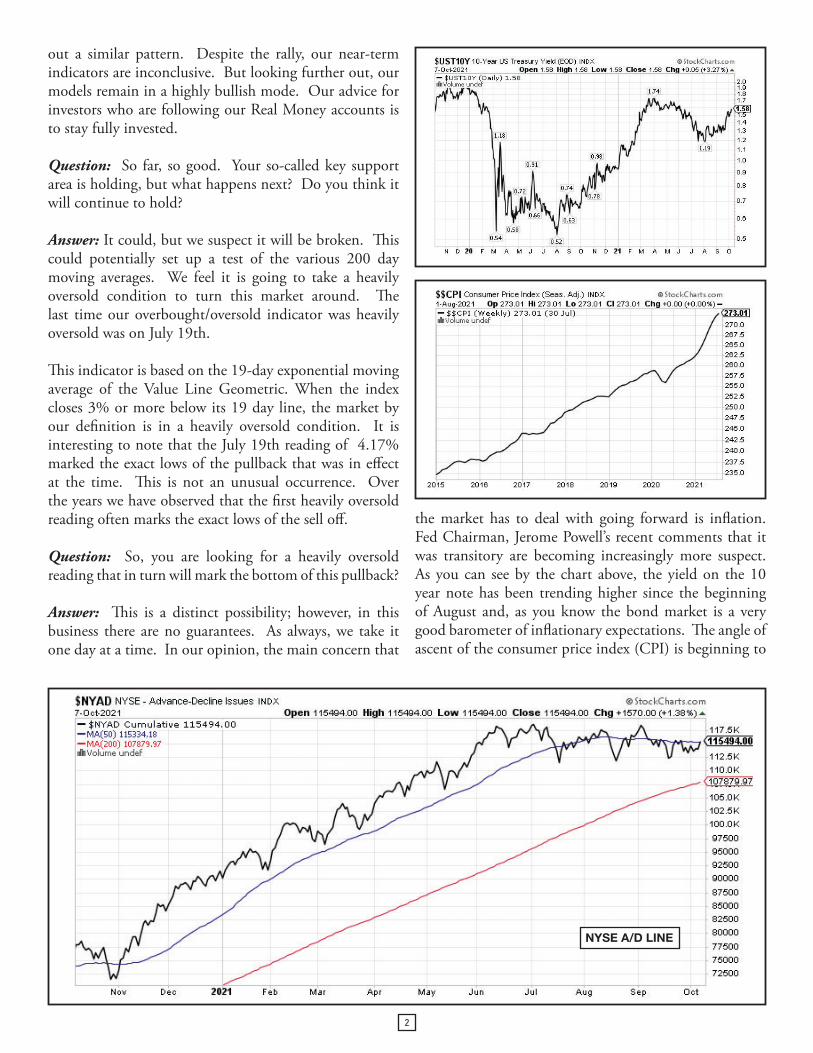
the market has to deal with going forward is inflation. Fed Chairman, Jerome Powell’s recent comments that it was transitory are becoming increasingly more suspect. As you can see by the chart above, the yield on the 10 year note has been trending higher since the beginning of August and, as you know the bond market is a very good barometer of inflationary expectations. The angle of ascent of the consumer price index (CPI) is beginning to
NYSE A/D LINE

3
steepen. But the most dramatic of all has been the jump in the CPI over the last several months.
The producer piece index measures price changes before they reach consumers which makes it an earlier prediction of inflation than the CPI. If you want further evidence of inflation, the light crude oil continuous contract clocked in today at 78.30 a barrel. That’s the highest level since 2014. Inflation is definitely the major part of the wall of worry that the market has to climb.
RELATIVE STRENGTH SPOTLIGHT
Paycom Software Inc (PAYC) currently holds down the #18 spot in our ratings. It provides a cloud-based human capital management (HCM) software solution delivered as Software-as-a-Service (SaaS). The Company provides functionality and data analytics that businesses need to manage the complete employment life cycle from recruitment to retirement. The Company’s applications streamline client processes and provide clients and their employees with the ability to directly access and manage administrative processes, including applications that identify candidates, on-board employees, manage time
and labor, administer payroll deductions and benefits, manage performance, terminate employees and administer post-termination health benefits, such as COBRA. The Company’s solution allows clients to analyze employee information to make business decisions.
The stock has been in a strong uptrend since its mid-May lows. It has traded above its 50 and 200-day moving averages since July 20. It gapped higher on August 4, after reporting better-than-expected second quarter earnings. The company posted revenue of $242.1 million, up 33.3% from a year ago. Earnings rose 56% to $0.97 per share, beating the consensus estimate of $0.83 per share. Shares currently trades near all-time highs.
Datadog Inc (DDOG) enters our ratings this week at the #20 position. It provides monitoring and analytics platform for developers, information technology (IT) operations teams and business users in the cloud age. Its Software-as-a-Service (SaaS) platform integrates and automates infrastructure monitoring, application performance monitoring and log management to provide real-time observability of its customers’ entire technology stack. Datadog is used by organizations of all sizes and across a range of industries to enable digital transformation and cloud migration, drive collaboration among development, operations and business teams, understand user behavior and track key business metrics.
The stock has more than doubled since its May 6, intra-day low at 69.73 to its current price at 145.00. It moved above its 50 and 200-day lines mid-June and remains comfortably above these areas. Second-quarter earnings and revenue topped estimates. Earnings rose 80% to an adjusted 9 cents per share from the same period a year earlier. Revenue jumped 67% to $233.5 million.

4
Above are all the open positions in the Chartist long-term managed account. On each and every trade, actual cash is deployed. Copies of the complete Track Record are available upon request. Whenever the Chartist makes recommendations concerning this account, they are placed on our Hotline at approximately 3:00 PM West Coast Time. The Actual Cash Account is NOT hypothetical. It is the personal account of Dan Sullivan. We do not act on behalf of ourselves or the Actual Cash Account until the day after our Hotline is activated, this gives everyone ample time to accept or reject the advice placed on the Hotline. The Chartist does have discretionary managed accounts who may buy or sell the same securities listed in our publication before or after they are recommended on our newsletter or Hotlines. The performance results of the Actual Cash Account are presented gross of advisory fees. Officers, employees, affiliates and clients of The Chartist, Inc. may have positions in securities and may make additional purchases or sales
COPYRIGHT NOTICE: Copyright © The Chartist, Inc. All rights reserved. All materials contained herein are protected by United States copyright law and have been created, authored and prepared by The Chartist, Inc., unless otherwise indicated. Any reproduction, distribution or transmittal of the materials herein is prohibited and The Chartist, Inc. will pursue all available legal remedies against violators. Furthermore, any distribution, reproduction or transmittal of information or materials derived through a subscription to The Chartist services, BY A SUBSCRIBER TO A NON-SUBSCRIBER, is STRICTLY PROHIBITED. The Chartist, Inc. does not claim copyright as to any quoted material included herein and attributed to a third party. Copyright, trademark and other proprietary notices may not be altered or removed.
Dan’s Aggressive Account
SELECTED QUOTES
Ned Davis Research; Joseph F. Kalish, Chief Global Macro Strategist;
Veneta Dimitrova, Senior U.S. Economist; www.ndr.com
For the past five months or so, our major macro theme has been “More than transitory?” The idea here is that inflation would linger longer than so-called base effects and would surprise investors and policymakers alike. Since then, both groups have moved closer to our view.
Supply chain disruptions and shortages are now
apparent. These include energy (natural gas, coal, and oil), semiconductors (which impacts vehicles and other durable goods), shipping and warehousing (ports, truck drivers, air freight, etc.), and drought (which impacts hydropower and agriculture). Our view has been these disruptions and shortages are mostly temporary, but that it could take several months to several quarters to resolve themselves. Measures of supply chain bottlenecks from the ISM show conditions may be getting “less bad,” as shown on the chart.
Although a large majority of policymakers see higher inflation as a risk, they don’t seem overly worried. And
STOCK NO OF PURCHASE PURCHASE AMOUNT CURRENT CURRENT GAIN %FUND SYMBOL SHARES DATE PRICE INVESTED PRICE VALUE (LOSS) CHANGEABBOTT LABORATORIES ABT 188 08/13/12 31.75 5,969 117.91 22,167 16,198 271.4ALLSTATE CORPORATION ALL 633 08/13/12 37.98 24,041 127.34 80,606 56,565 235.3AMGEN INCORPORATED AMGN 150 08/13/12 82.38 12,357 209.12 31,368 19,011 153.8SPDR DOW JONES DIA 903 06/03/16 177.98 160,716 347.63 313,910 153,194 95.3SPDR DOW JONES DIA 3,520 08/19/20 278.68 980,954 347.63 1,223,658 242,704 24.7EBAY INC EBAY 526 08/13/12 17.31 9,105 74.17 39,013 29,908 328.5EQUINIX INC NEW EQIX 133 08/13/12 183.57 24,415 766.49 101,943 77,528 317.5HOME DEPOT INC HD 210 09/07/12 57.41 12,056 337.48 70,871 58,815 487.8ISHARES RUSSELL 1000 IWB 5,200 08/19/20 189.02 982,904 246.99 1,284,348 301,444 30.7ISHARES RUSSELL 2000 IWM 3,145 08/19/20 156.94 493,576 223.26 702,153 208,576 42.3SPDR S&P MIDCAP 400 MDY 1,385 08/19/20 354.28 490,678 492.85 682,597 191,919 39.1PAYPAL PYPL 526 08/13/12 26.77 14,081 263.54 138,622 124,541 884.5INVESCO QQQ TRUST QQQ 5,745 06/21/19 188.63 1,083,679 362.97 2,085,263 1,001,583 92.4SPDR S&P 500 SPY 1,523 06/03/16 210.32 320,317 438.66 668,079 347,762 108.6SPDR S&P 500 SPY 5,280 07/21/20 326.48 1,723,814 438.66 2,316,125 592,310 34.4SPDR S&P 500 SPY 2,900 08/19/20 339.11 983,419 438.66 1,272,114 288,695 29.4TRUIST FINANCIAL TFC 572 09/07/12 21.33 12,201 60.52 34,617 22,417 183.7T J X COS INC TJX 1,078 08/13/12 22.20 23,932 64.98 70,048 46,117 192.7VISA INC CL A V 385 08/13/12 32.17 12,385 230.55 88,762 76,376 616.7 7,370,600 11,226,264 3,855,665 52.3%
BEGINNING VALUE 10/09/07 $5,000,000 MONEY MARKET FUNDS $212,047 MARGIN BALANCE $0 NET CURRENT VALUE $11,438,311 TOTAL PROFITS $6,438,311 % RETURN 128.77%

5
PURCHASE PURCHASE CURRENT PERCENT MENTALFUND SYMBOL DATE *PRICE PRICE PROFIT STOP
Trader’s Portfolio
ALCOA AA 09/03/21 47.03 47.05 0.04 41.35ADOBE INC ADBE 09/03/21 SOLD 9/29 @ 585.45 LOSS -11.9% AMERICAN EXPRESS AXP 06/03/21 163.68 174.29 6.48 144.32BLACKSTONE BX 09/03/21 128.31 115.28 -10.16 110.74CAPITAL ONE COF 03/12/21 133.95 167.88 25.33 142.00EMERSON ELECTRIC EMR 06/03/21 97.31 97.34 0.03 85.80GOLDMAN SACHS GS 06/03/21 382.25 390.62 2.19 337.00INTUIT INTU 06/03/21 439.50 537.73 22.35 484.46INTUITIVE SURGICAL* ISRG 09/03/21 357.10 338.34 -5.25 318.08MGM RESORTS MGM 04/09/21 42.00 44.77 6.60 35.57CLOUDFARE INC NET 09/03/21 SOLD 9/29 @ 115.07 LOSS -10.4% SERVICENOW INC NOW 09/03/21 660.00 637.92 -3.35 566.99NVIDIA NVDA 06/03/21 167.00 210.75 26.20 187.62ORACLE CORP ORCL 06/03/21 79.80 92.31 15.68 75.90PAYCOM SOFTWARE PAYC 09/03/21 498.00 511.69 2.75 444.84ATLASSIAN CORP TEAM 09/03/21 376.04 392.98 4.50 342.12
why should they be? One of their favorite inflation indicators, the trimmed-mean PCE Price Index, shows the y/y change exactly at 2.0%.
And the latest comprehensive measure of inflation expectations showed levels close to the Fed’s target of 2.0%. The reading for Q3 is likely to be little changed. Moreover, in addition to well-anchored inflation expectations, the factors that drove disinflation over the past 20 years or so are still in place:
• Technology/Innovation • Competition/Globalization • Aging demographics • High debt levels
Our biggest concern has been that temporary shortages might be replaced by more persistent pressures resulting in a sudden surge in inflation expectations that would warrant a policy response. Nowhere is this more evident than in housing. Although the housing deficit has shrunk this year as household formations dried up, rent and owners’ equivalent rent should add to inflationary pressures as formations normalize in a post-pandemic recovery.
Our biggest worry is that imbalances in the supply of and demand for labor put upward pressure on compensation, which eventually feeds into core inflation. We are hopeful that productivity gains will help contain unit labor costs. But if we are wrong, inflation expectations could jump. The Fed would need to respond verbally and then by action with either larger or more frequent rate hikes, thereby tightening financial conditions.
The Elliott Wave Financial Forecast; Steven Hochberg and
Peter Kendall, Editors; www.elliottwave.comThe Chinese government is also targeting highly successful individuals. The roster of “disappearing” corporate titans continues to grow, as does the fame of those making an appearance on it. Last November, EWFF observed the sudden turbulence encountered by Jack Ma, whom Bloomberg calls “the most famous business executive China has ever produced.” Based, in part, on the treatment of the Alibaba and Ant Group founder, as well as the abrupt cancellation of Ant’s initial public offering, the November 2020 EWFF concluded, “The curtain is coming down on the permissiveness of a long bull market. The heavy hand of China’s government will take a toll.” Ma has hardly been seen since. According to an August profile in The Wall Street Journal, Ma’s mistake
The above recommendations are for short- or intermediate-term Traders. Mental Stops are deployed on all recommendations. When a stock drops below its mental stop and stays under on a closing basis, it should be sold the next day. = Raise Mental Stops = Adjusted For Split*
*ISRG-3 for 1 split adjusted purchase price and mental stop

6
was behaving “too much like an American entrepreneur.” Then there’s the case of Huarong Asset Management, a distressed lender we talked about in August. The Communist Party has since decided to bail out Huarong, but the company’s chairman, Lai Xiaoping, was not so fortunate. On August 30, Bloomberg reported that Lai, once known as China’s “God of Wealth,” was executed back in January. When it comes to punishing success, there’s nothing quite like executing the “God of Wealth.”
According to an essay written with the implicit approval of Chinese propaganda authorities, the purpose of the “reforms” now underway is “to correct the uncontrolled growth of capital.” In the name of “controlling growth,” Chinese authorities are clearly willing to do almost anything. In early September, China’s National Radio and Television Administration said it will establish a “correct beauty standard” and ban “vulgar internet celebrities.” Headlines call the latest censorship drive, China’s “Pop Culture Purge.” China’s media regulator called for a “Boycott of ‘Sissy Idols’ and ‘Overlay Entertaining’ Entertainers.”
David C. Jennett’s Investment Letter; Money Forecast Letter; www.moneyforecastletter.com/about-us/
J. Powell started his four-year term as Fed Chair in February 2018. That means the current president can now nominate somebody else to replace him when his term ends in February 2022. The speculation has already begun regarding a possible replacement for Mr. Powell.
This process of choosing a new Fed Chair is where I fear the threat to the Fed’s independence begins. I can’t help but compare it to the dysfunctional way this country now chooses Justices for the Supreme Court. As you know, members of the Supreme Court enjoy lifetime appointments. The Founders believed court members with a lifetime appointment would not cave to popular passions that were too often injurious to the freedoms the Constitution seeks to protect.We all know what a partisan nightmare the confirmation process has become for the Supreme Court. If we are not very careful, we could find ourselves entangled in a similarly hideous process regarding the selection of the Chair of the Board of Governors of the Federal Reserve System.
If you want to see what that future might look like, I urge
you to Google Senator Elizabeth Warren’s (D-MA) recent questioning of Chair Powell before the Senate Banking Committee. Mrs. Warren has never been a big fan of Mr. Powell. In true Progressive fashion, Senator Warren wants a Fed Chair that will become an ally in her quest to remake American society. Her vitriolic attack on Chair Powell (she labeled him a “dangerous man” and vowed to oppose his renomination as Fed Chair) seems particularly odd. The Fed Board of Governors has never had a leader more eager to promote social justice here in America. The fact that one of the leading lights of America’s Progressive movement is unsatisfied with Mr. Powell’s efforts makes you wonder just what the Progressives want from the Fed.
Actually, we have some idea of what the progressives want from the Fed; it’s known in academic circles as Modern Monetary Theory. Simply put, MMT is the practice of having the Federal Reserve “print” new money to fund new federal government social programs. Of course, any student of history knows there is nothing “modern” about this idea.
Pursuant to SEC Regulations, we are required to offer subscribers who paid $200.00 or more to The Chartist during the past twelve months a copy of our ADV Form, Part 2 (free of charge). This form, which is filed with the SEC annually, provides general information about The Chartist and its services.

7
ATLASSIAN CORPORATION PLC TEAM 392.98 - - 98.998B 2.12 47.39 38.72% 3.48%Designs, develops, licenses, and maintains various software products worldwide.
NVIDIA CORPORATION NVDA 210.75 75.48 0.08% 525.189B 4.68 23.98 16.07% -2.65%Operates as a visual computing company worldwide.
CAPITAL ONE FINANCIAL CORP COF 167.88 6.7 0.60% 74.894B 17.61 2.45 7.89% 2.48%Operates as the financial services holding company.
SNAP INC. SNAP 76.28 - - 120.607B 0.8 36.09 16.30% 2.52%Operates as a camera company in the United States and internationally.
MODERNA, INC. MRNA 309.36 36.55 - 124.872B 27.1 17.79 15.54% -22.96%A biotechnology company, develops therapeutics and vaccines.
INTUIT INC. INTU 537.73 71.13 0.44% 146.85B 12.93 15.24 11.61% -3.38%Provides financial management and compliance products and services.
TESLA, INC. TSLA 793.61 418.35 - 795.015B 7.22 18.99 16.76% 6.83%Designs, develops, manufactures, leases, and sells electric vehicles, and energy generation and storage systems.
SHOPIFY INC. SHOP 1,398.50 71.84 - 174.492B 7.27 45.28 3.62% -4.42%Provides a cloud-based multi-channel commerce platform for small and medium-sized businesses.
PAYPAL HOLDINGS, INC. PYPL 263.54 64.29 - 309.667B 5.84 12.99 -2.97% -4.50%Operates as a technology platform and digital payments company that enables digital and mobile payments.
THE GOLDMAN SACHS GROUP, INC. GS 390.62 7.17 1.29% 131.677B 38.03 2.39 5.01% -1.92%Provides range of financial services for corporations, financial institutions, governments, and individuals worldwide.
INTUITIVE SURGICAL, INC. ISRG 338.34 75.79 - 120.778B 5.52 23.39 6.91% -1.93%Designs, develops, manufactures, and markets da Vinci surgical systems.
IAC/INTERACTIVECORP IAC 141.93 11.19 0.26% 12.665B -1.14 3.75 -2.62% 7.49%Operates as a media and internet company worldwide.
DISCOVER FINANCIAL SERVICES DFS 127.28 8.15 1.39% 38.116B 12.57 3.51 7.81% 1.22%Operates as a digital banking and payment services company in the United States.
AUTOZONE, INC. AZO 1,683.73 17.69 - 35.591B 109.05 2.43 10.56% 4.48%Retails and distributes automotive replacement parts and accessories.
ORACLE CORPORATION ORCL 92.31 19.56 1.23% 252.347B 5.16 6.18 11.60% 3.69%Provides products and services that address enterprise information technology environments worldwide.
CHIPOTLE MEXICAN GRILL, INC. CMG 1,846.67 89.86 - 51.882B 33.64 7.58 14.06% -2.19%Owns and operates Chipotle Mexican Grill restaurants.
SERVICENOW, INC. NOW 637.92 750.49 - 126.372B 7.23 24.44 15.06% -0.02%Provides enterprise cloud computing solutions.
PAYCOM SOFTWARE, INC. PAYC 511.69 176.57 - 30.75B 5.59 33 27.45% 5.03%Provides cloud-based human capital management (HCM) solution delivered as software-as-a-service for small to mid-sized companies.
TRAILING 200 50 LAST TRAILING ANNUAL MARKET EPS EST. PRICE/ DMA DMANAME SYMBOL PRICE P/E DIV YIELD CAP NEXT YEAR SALES CHG % CHG %
• 1
• 2
• 4
• 3
• 5
• 6
• 7
• 8
• 9
•10
•11
•12
•13
•14
•15
•16
•17
•18
Relative Strength Ratings

8
Actual performance results of the Actual Cash Account represent the performance of one continuous account managed by The Chartist, Inc. (“The Chartist”). The perfor-mance results reflect the reinvestment of dividends and other account earnings, and are net of applicable account transaction and custodial charges. Past performance may not be indicative of future results and the performance of a specific individual client or newsletter subscriber’s account may vary substantially from the performance results. No current or prospective client or subscriber should assume that future performance will be profitable, equal the performance results reflected above, or that any of the above holdings (or the account) is suitable for his/her individual situation. All performance results have been compiled solely by The Chartist, are unaudited, and have not been independently verified. Information pertaining to The Chartist’s investment advisory operations, services, and fees is set forth in The Chartist’s current written disclosure statement, a copy of which is available from The Chartist upon request.
If the subscriber were to become a managed account of The Chartist to manage a portfolio similar to the Actual Cash Account, performance would be reduced by 1.25% annually, reflecting the maximum investment management fee that would have been charged by The Chartist under its current managed accounts fee schedule. For reasons including variances in actual account holdings, variances in the investment management fee incurred, market fluctuation, the date on which a client engaged The Chartist’s managed account services, and any account contributions or withdrawals, the performance of a specific client’s account may vary substantially from the above indicated results.
SUBSCRIPTION RATES: $290.00 FOR 1 YEAR, $530.00 FOR 2 YEARS OR $770.00 FOR 3 YEARS 800-786-8916
CHARTIST MANAGED STOCK ACCOUNTSFor information about our money management services, please give our office a call at 800-786-8916
and ask for Steve Mais. The minimum account size is $100,000.00 per account.
SYM=Stock’s ticker tape symbol. EXCH=Exchange the stock is traded on (A=AMEX) (N=NYSE) (O=NASDAQ). LAST=Closing price as of publication date. P/E Ratio=Current stock price divided by trailing annual earnings per share. YIELD=Current yield based upon the current price and the total dividends over the past 12 months. MKT CAP=calculated by multiplying the Last Trade by the current number of shares outstanding. EPS EST (CURRENT YEAR)=The estimated annual earnings for the current fiscal year. EPS EST (NEXT YEAR)=The estimated annual earnings for the next fiscal year. PCT FROM 200d MA=% above/below 200 day moving average. PCT FROM 50d MA=% above/below 50 day moving average.
Stocks which are added to the Relative Strength Ratings are not buy recommendations. Conversely, stocks that are deleted from the ratings are not sell recommendations. Basically, the ratings can be thought of as our watchlist. The Relative Strength Ratings represent our way of tracking high relative strength stocks. By high relative strength, we are referring to stocks that are significantly stronger than the overall market, as of the day of publication of the newsletter. These are the stocks we are currently monitoring and are potential buy candidates.
ADDITIONS DELETIONSORACLE CORP. (ORCL)PAYCOM (PAYC)EOG RESOURCES (EOG)DATADOG (DDOG)
MARATHON PETRO (MPC)AMERICAN EXPRESS (AXP)MGM RESORTS (MGM)WELLS FARGO (WFC)
CARVANA (CVNA)DOCUSIGN (DOCU)CLEVELAND CLIFFS (CLF)DEXCOM (DXCM)
CROWDSTRIKE (CRWD)KOHLS (KSS)MERCADOLIBRE (MELI)ADOBE SYSTEMS (ADBE)
EOG RESOURCES, INC. EOG 85.79 26.49 1.82% 50.089B 8.38 3.63 12.82% 17.76%Explores for, develops, produces, and markets crude oil, and natural gas and natural gas liquids.
DATADOG, INC. DDOG 142.1 - - 44.053B 0.4 57.64 31.78% 2.27%Provides monitoring and analytics platform for developers, information technology operations teams, and business users in the cloud.
ALIGN TECHNOLOGY, INC. ALGN 661.41 75.39 - 52.342B 13.26 15.07 5.03% -5.58%Designs, manufactures, and markets Invisalign clear aligners and iTero intraoral scanners.
TARGET CORPORATION TGT 229.82 18.34 1.20% 112.161B 12.92 1.12 -1.06% -5.24%Operates as a general merchandise retailer in the United States.
AMERICAN EXPRESS COMPANY AXP 174.29 20.27 0.99% 138.462B 9.39 3.63 8.20% 5.38%Provides charge and credit payment card products, and travel-related services worldwide.
MARATHON PETROLEUM CORP MPC 63.5 5.38 3.69% 40.526B 3.23 0.46 9.58% 7.24%Engages in refining, marketing, retailing, and transporting petroleum products primarily in the United States.
MGM RESORTS INTERNATIONAL MGM 44.77 - 0.02% 21.574B 0.53 3.44 9.27% 5.60%Owns and operates casino, hotel, and entertainment resorts in the United States and Macau.
WELLS FARGO & COMPANY WFC 47.76 12.79 0.84% 196.122B 3.61 2.57 5.77% 2.41%A leading financial services company.
TRAILING 200 50 LAST TRAILING ANNUAL MARKET EPS EST. PRICE/ DMA DMANAME SYMBOL PRICE P/E DIV YIELD CAP NEXT YEAR SALES CHG % CHG %
•19
•20
•22
• 21
•23
•24
•25
•26

9
Published by The ChartistAsset ManagementRegistered Investment Advisors5122 Katella Avenue, Suite 200Los Alamitos, CA 90720562.596.2385
Contact Information For The Chartist Newsletter
Technical Questions:Email: [email protected]: www.thechartist.com
For PersonalizedInvestment ManagementContact Steve MaisEmail: [email protected]: 800.942.4278Web: www.thechartist.com
�eChartistReal Money Portfolios... Nothing Hypothetical
�eChartistPublished since 1969
�eChartistPublished Since 1969
option A
option B