Embed Size (px)
Citation preview

Optimum lens aperture in phase-shiftingspeckle interferometric setups for maximum accuracyof phase measurement
Thomas Maack, Richard Kowarschik, and Gunther Notni
Negative exponentially distributed intensities of speckle fields seem unfavorable in terms of precisionmetrology, if interferometric setups are involved with a saturable photodetector and an analog-to-digitalconverter that imposes a finite resolution. By spatial integration, extended detector apertures modifythe intensity distribution toward a less awkward function. However, because the detector aperture alsointegrates over points of rapidly changing speckle phases, this is done at the expense of a lower modu-lation of measured intensity during phase shift. An optimum set of parameters is calculated here,consisting of values for the lens aperture, the mean speckle intensity, and the beam ratio. The remain-ing phase-measurement error assumes its minimum of 10.6 mrad when the space–bandwidth product ofthe lens–detector system ~thus concerning the lens aperture! is 0.31, the mean speckle intensity is 1y11of the saturation intensity, and the reference intensity is four times higher than the mean speckleintensity. The 90° phase-shift algorithms with either three, four, or five frames turned out to be quitepowerful, even with interference signals of rather poor modulation. Not needing a very small lensaperture is interesting, because stopping down the lens is a trade-off with the limited power of the laser.© 1997 Optical Society of America
Key words: Lens, aperture, pupil, phase shift, phase step, speckle interferometry, phase measure-ment, accuracy.
1. Introduction
For phase-shifting speckle interferometric setups em-ploying finite-size photodetectors, it has been sug-gested1,2 that the optically rough surface be imagedthrough an appropriate lens aperture so as to matchthe speckle size to the detector size. That is meantto reasonably resolve the speckle interferogram ~i.e.,the speckled image of the object plus the smooth ref-erence beam! and to create a well-modulated inter-ference signal while shifting the reference phase. Ifthe interference signal did not provide sufficient mod-ulation, the analog-to-digital ~AyD! conversion mightintroduce a large error in the calculated phase.
In practice, this rule of thumb works reasonably
R. Kowarschik is with the Friedrich-Schiller-Universitat Jena,Institut fur Angewandte Optik, Max-Wien-Platz 1, 07743 Jena,Germany. T. Maack and G. Notni are with the Fraunhofer-Institut fur Angewandte Optik und Feinmechanik, Schillerstrasse1, 07745 Jena, Germany.
Received 26 November 1996; revised manuscript received 25February 1997.
0003-6935y97y256217-08$10.00y0© 1997 Optical Society of America
well but does not exactly consider the effect of thesaturation intensity of the photodetector and the usu-ally employed AyD converter on the accuracy of thecalculated phase. For such a setup, authors3–6 haveinvestigated how the mean speckle and the referenceintensities ought to be adjusted with respect to thesaturation intensity either to obtain a minimumstandard deviation of the calculated phase or to en-sure that at least the bad points are rejected. Therepoint detectors were assumed, and thus the resultshold only for fully resolved speckle interferogramsconsisting of speckle fields with negative exponentialintensity distributions.
In conjunction with an experimental interferomet-ric setup, the properties of a negative exponentialspeckle field are contrary to the requirements of pre-cision metrology. If the speckle interferograms wereperfectly resolved, many of the image points weresubject either to low modulation and hence poor res-olution by the AyD converter or to intensity clippingby the saturation effect of the photodetector. How-ever, this situation provides the maximum intensitymodulation during the phase shift at the residualpoints. In contrast, along with the integration effectof the extended active detector area, an increase of
1 September 1997 y Vol. 36, No. 25 y APPLIED OPTICS 6217

the lens aperture renders the distribution of the mea-sured intensity of the contributing speckle field moresuitable, because the probability of encountering ei-ther no intensity or very high intensity decreasesrapidly with spatial intensity integration. Never-theless, integration reduces the intensity modulationduring the phase shift.
It can be presumed that minimizing the aperture ofthe imaging lens may not be helpful in any case andan optimum can be found instead. Still, this willdepend on the size of the detector aperture and thelaser wavelength. The lens aperture does not onlydetermine the speckle size but also the portion oflight captured by the lens. Because the laser light isnot only limited but also undergoes scattering at therough surface, it is interesting to know how far thelens aperture can be increased in the case of insuffi-cient speckle intensity without inflicting an excessiveerror on the results of the phase calculations, causedby a reduced intensity modulation and, as a conse-quence, poor resolution by the AyD converter.
In speckle interferometry we distinguish betweenspeckle-pattern interferometry and phase-shiftingspeckle interferometry. Because we study the influ-ences of the setup and evaluate the accuracy of thephase measurement, we expect the results to dependstrongly on the instrumentation and on the methodused. A fine paper on parameter optimization inelectronic speckle-pattern interferometry is pre-sented by Slettemoen.7 It describes general ideasabout the optimization of speckle interferometric set-ups, but because of the different conditions here, theresults cannot necessarily be compared.
2. Theory
The camera of the considered interferometric setup isequipped with an imaging lens that has a variableaperture and with a photodetector of finite activearea ~or an array of corresponding photodetectors!.We take the camera to show linear gain and thephotodetectors to have a constant sensitivity acrosstheir apertures. The speckle interferograms neededfor the phase-measurement algorithm are formed bysuperposition of the speckle field and a smooth refer-ence beam, where the latter is constant across thefield of view. Both of them are fully polarized withdirections of polarization collinear to each other.The speckle phase is obtained with a 90° temporalphase-measurement algorithm8–10 that uses eitherfour frames,
wmeas 5 arctanSI4 2 I2
I1 2 I3D , (1)
or five frames,
wmeas 5 arctanF 2~I2 2 I4!
2I3 2 I5 2 I1G . (2)
These techniques shift the reference phase N timesand measure the interference signal In ~n 5 1, . . . , N!after each of the shifts. The number of phase shifts
6218 APPLIED OPTICS y Vol. 36, No. 25 y 1 September 1997
is N $ 3, and each step introduces a 90° shift. Itbecomes obvious from Eqs. ~1! and ~2! that, as far asdigitized data are concerned, using five frames doesnot improve the accuracy. The phase of I5 differsfrom that of I1 by 2p, and thus Eq. ~2! turns into Eq.~1!. The analysis is based on the four-frame tech-nique, but the results still hold for setups with thefive-frame technique employed. To make the numer-ical results applicable to setups as they are usuallyused today, we assume an 8-bit digitization depth.
We distinguish between various kinds of noise.Electronic noise is not discussed because it is statis-tically independent of the optical signal. We assumestatistical phase variations of little influence, for theerror-compensating capabilities of phase-shift algo-rithms change when one or more of the intensitiessaturate during some interval of phase. We pointedthis out in Ref. 3, but here this restriction is of far lessimportance. Also in Ref. 3 we showed that errorscaused by phase decorrelation are statistically inde-pendent of phase-measurement errors that are intro-duced by the camera. We therefore consider onlycontributions to the phase-measurement accuracythat stem from the average speckle size in conjunc-tion with a saturable finite-size photodetector and anAyD converter, whereas speckle-size-dependent deco-rrelation effects are left out of the analysis.
In the following equations, Is is the speckle inten-sity, Ir is the reference intensity, It is the saturationintensity of the detector, and I is the intensity of thespeckle interferogram. They can be expressed interms of the mean speckle intensity ^Is&,
Is 5 s^Is&,
Ir 5 r^Is&,
It 5 t^Is&, (3)
where r is the so-called beam ratio, and we call 1yt themodulation of the camera. Here s and r are dimen-sionless numbers of measured values but are referredto as intensities.
The following analysis relies on the theory we pre-sented in Ref. 3. There we showed that in phase-shifting speckle interferometry, the variance sF
2 ofthe camera-induced phase-measurement error of thephase difference F 5 w1 2 w2 can be basically foundby taking the double of the corresponding variance,sw
2, of either of two phase frames w1 or w2. We ob-tain sw
2 from the bivariate error, Dw~w, s!. Afterweighting the square of Dw~w, s! with the probabilitydensity function ~PDF! of the speckle intensities s, weintegrate it over all possible values of w and s.Therefore, we must take now the PDF of integratedspeckle instead. It is interesting to note that, for theanalysis, we need the PDF of the speckle field, andnot that of the speckle interferogram. The secondmodification of the theory presented in Ref. 3 is at-tributed to the fact that the intensity modulation ofthe speckle interferogram during the phase shift willdrop with the integrating effect of the detector aper-ture. What we later call the contrast of intensity

modulation refers to the spectrum of spatial frequen-cies of the speckle interferogram, but nonetheless itcan be derived from the spatial frequencies of thespeckle field. A lower contrast of intensity modula-tion introduces an increasing phase-measurement er-ror, because the AyD conversion influences themeasurement result by digitization errors.
The PDF of a speckle field becomes, with integratedspeckles,11
ps~s! 5 5mmsm21 exp~2ms!
G~m!0
for
for
s $ 0
s , 0,(4)
where
1m
5 **2`
1`
Sb~x, y!uma~x, y!u2 dxdy (5)
and G~m! is the gamma function of argument m rang-ing from one to infinity. Here Sb~x, y! is the normal-ized autocorrelation function,
Sb~x, y! 51
4bx byS1 2
uxu2bx
DS1 2uyu2by
Dfor uxu # 2bx and uyu # 2by, (6)
of the weighting function
(b5 H1
0in the aperture
outside the aperture (7)
of the rectangular detector aperture with full widths2bx and 2by. Here x and y are spatial coordinates ofthe coordinate system, whose origin is coincidentwith the center of the detector aperture ~Fig. 1!.Normalization of function f ~x, y! means that the con-dition
**2`
1`
f ~x, y!dxdy 5 1 (8)
is met. Here ma of Eq. ~5! is called the complex co-herence factor of the speckle field, and it represents
Fig. 1. Schematic of the setup. The lens aperture creates a sub-jective speckle pattern of the rough object surface in the detectorplane. The point of divergence of the reference beam ~not depict-ed! is assumed to coincide with the center of the lens aperture.
the Fourier transform of the lens aperture. For acircular lens aperture with intensity transmittance
(a5 H1
0in the aperture
outside the aperture, (9)
the squared modulus of the complex coherence factor is
umau2 5
4J12S2p
l
adR D
S2p
l
adR D2 , (10)
where J1 is the Bessel function of the first kind of orderone, l is the laser wavelength, a is the radius of the lensaperture, R is its distance from the image plane, and
d2 5 x2 1 y2. (11)
Equation ~10! can also be perceived as the intensitypoint-spread function of the lens. The speckle sizerefers to the radius of the first zero of umau2; m can beinterpreted as the number of speckle correlation cellswithin the detector aperture.
Dainty12 derived the equivalent of Eq. ~5! in thefrequency domain by using quadratic filter theory.There, Sb reflects the autocorrelation of the lensaperture and ma is the Fourier transform of thedetector aperture. An expression similar to Dain-ty’s comes in later on. If the speckle field were theimage of some coherently illuminated object, therms signal-to-noise ratio of the measurement of in-tegrated speckle intensities would be representedby =m, and the standard deviation would be ^Is&y=m. In the limiting case of m3 1, Eq. ~4! becomesthe usual negative exponential PDF of perfectly re-solved speckles, and, as m 3 `, it approaches aGaussian with decreasing linewidth. In both ofthese approaches a white-noise input ~i.e., if the cor-relation area of the wave at the rough surface issufficiently small11! has been assumed. In fact Eq. ~4!is an approximate PDF, but an exact density functionwas discussed by Scribot.13 The exact formula is,unfortunately, not easily evaluated by analyticalmeans, but Eq. ~4! serves as a good substitute.
The interference law is
I 5 Ir 1 Is 1 2nÎIr Is cos~w!, (12)
where the amplitude of the last term describes theintensity modulation during the phase shift, and n isthe contrast of intensity modulation. ~Contrast, asused here in terms of interferometry, is not to beconfused with the rms intensity variation in specklefields, as used in speckle statistics.! The contrast ofintensity modulation can be composed of the powerspectral density of the speckle field and the spectralfilter function of the detector aperture to give
n 5 **2`
1`
Sa~j, h!umb~j, h!udjdh, (13)
1 September 1997 y Vol. 36, No. 25 y APPLIED OPTICS 6219
where j and h are frequency coordinates of the lensaperture plane. Equation ~13! somewhat resemblesDainty’s expression12 for 1ym. Here Sa is the nor-malized autocorrelation function
Sa~j, h! 58
p2V2 FarccosSv
VD 2
v
VÎ1 2 Sv
VD2G (14)
of the lens aperture with an intensity transmittanceaccording to Eq. ~9!, where
v2 5 j2 1 h2, (15)
V 5a
lR. (16)
Basically, V is the radius of the lens aperture in thefrequency domain and thus the cut-off spatial fre-quency of the lens, but it differs by a factor of 1y2 fromthe known expression. If a reference beam is coaxi-ally added to the speckle-forming cone, the specklesize of the interferogram is going to increase. Thespeckle size approximately doubles if the referencebeam is chosen to be sufficiently strong.14 This as-sumption is valid because the beam ratio will turnout to well exceed the value of one. However, if thereference beam is not well aligned, the speckle inter-ferogram becomes modulated by an additional high-frequency fringe pattern. Without that, Eq. ~14!reflects both the modulation transfer function or fre-quency response function of the aberration-free lensfor the case of an incoherent well-focused object ~cf.Ref. 15! and the normalized power spectral density ofan imaged speckle pattern. Figure 2 shows a plot ofEq. ~14!. McKechnie16 has given an experimentalproof of Eq. ~10! and ~14! for a free-space geometry.
Fig. 2. Autocorrelation function Sap2V2y8 of a circular lens ap-erture as a function of the spatial frequency, which is given in unitsof V ~V is the frequency corresponding to the radius of the apertureand is identical with the cutoff frequency of the lens!. The com-plete representation is obtained by rotation of the curve about theordinate axis.
6220 APPLIED OPTICS y Vol. 36, No. 25 y 1 September 1997
Here mb is the Fourier transform of the weightingfunction ~8! of the detector aperture according to
mb 5sin~2pbxj!
2pbxj
sin~2pbyh!
2pbyh. (17)
Of course, mb is similar to the complex degree of co-herence g12 ~cf. Ref. 15! for light from an extendedincoherent quasi-monochromatic source of corre-sponding dimensions.
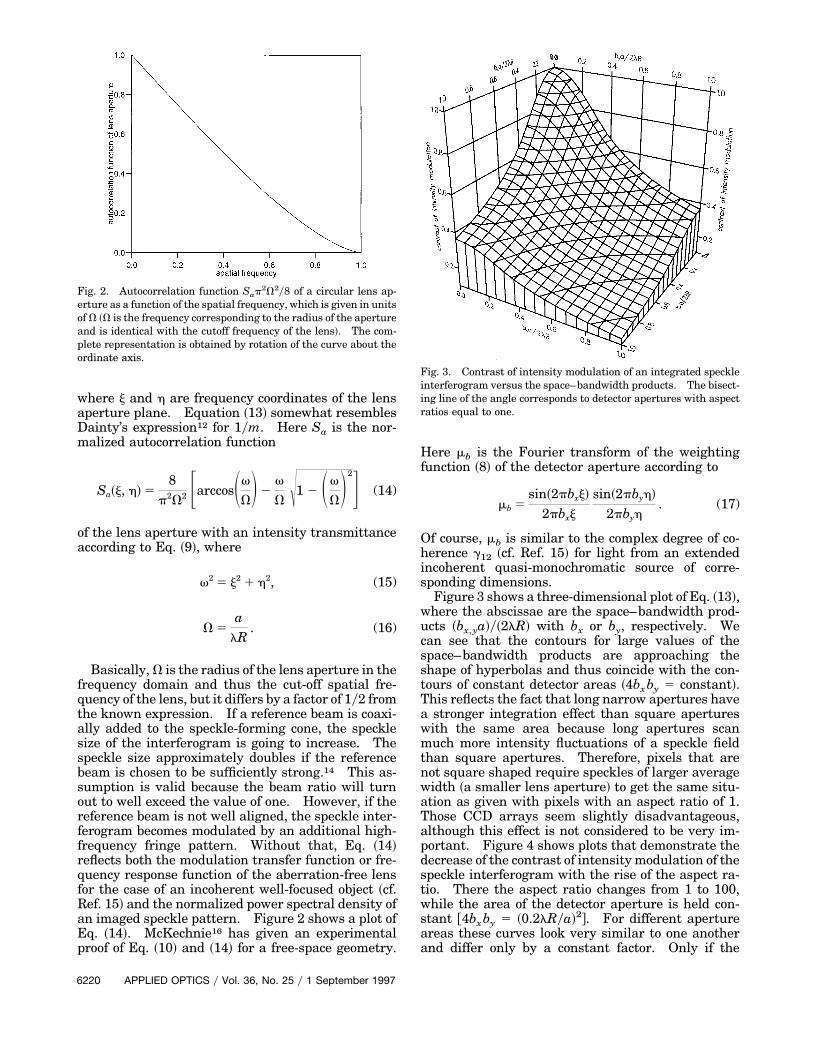
Figure 3 shows a three-dimensional plot of Eq. ~13!,where the abscissae are the space–bandwidth prod-ucts ~bx,ya!y~2lR! with bx or by, respectively. Wecan see that the contours for large values of thespace–bandwidth products are approaching theshape of hyperbolas and thus coincide with the con-tours of constant detector areas ~4bxby 5 constant!.This reflects the fact that long narrow apertures havea stronger integration effect than square apertureswith the same area because long apertures scanmuch more intensity fluctuations of a speckle fieldthan square apertures. Therefore, pixels that arenot square shaped require speckles of larger averagewidth ~a smaller lens aperture! to get the same situ-ation as given with pixels with an aspect ratio of 1.Those CCD arrays seem slightly disadvantageous,although this effect is not considered to be very im-portant. Figure 4 shows plots that demonstrate thedecrease of the contrast of intensity modulation of thespeckle interferogram with the rise of the aspect ra-tio. There the aspect ratio changes from 1 to 100,while the area of the detector aperture is held con-stant @4bxby 5 ~0.2lRya!2#. For different apertureareas these curves look very similar to one anotherand differ only by a constant factor. Only if the
Fig. 3. Contrast of intensity modulation of an integrated speckleinterferogram versus the space–bandwidth products. The bisect-ing line of the angle corresponds to detector apertures with aspectratios equal to one.

aperture areas are made very small, the contrast ofintensity modulation remains almost unity for abroad range of aspect ratios, and the correspondingcurves become increasingly flat.
3. Results of the Theory
The modifications concerning the intensity PDF andthe contrast of intensity modulation can now be in-troduced in the analysis of Ref. 3. In this paper, thevariances of phase frames w1 and w2 were shown to beequal, and the variance sF
2 of phase difference F was
sF2 5 2sw
2. (18)
Here sw2 is based on calculations concerning the
cases of saturated and unresolved interference sig-nals, as well as on an expression for the case of re-solved but digitized signals.17
Three parameters are to be optimized. These arethe modulation of the camera 1yt ~advising us how toadjust the mean speckle intensity with respect to the
Fig. 4. ~a! Contrast of intensity modulation of an integratedspeckle interferogram along the line of constant active detectorarea 4bxby 5 ~0.2lRya!2. The curve starts at an aspect ratio ofone. ~b! Enlarged detail of ~a!.
saturation of the camera!, the beam ratio r ~telling usto provide r times the mean speckle intensity of ref-erence intensity!, and the space–bandwidth products~bxa!y~2lR! and ~bya!y~2lR!. Because the aspect ra-tios of most detector apertures are almost unity,square detector apertures with bx 5 by 5 b are as-sumed here. The optimum set of values for theseparameters is obtained by numerical evaluation ofthe modified theory of Ref. 3. The minimum stan-dard deviation of
sF 5 10.6 mrad (19)
of the resulting phase F 5 w1 2 w2 is found, if thespace–bandwidth product is
ba2lR
5 0.31, (20)
the saturation intensity exceeds the mean speckleintensity by a factor of
t 5 11.0 (21)
~compared with t0 5 17.2 of a point detector with azero space–bandwidth product; cf. Ref. 3!, and thebeam ratio is
r 5 4.0 (22)
~compared with r0 5 5.7; cf. Ref. 3!. Equation ~5!then gives
m 5 2.6 (23)
and, with Eq. ~13!, the overall contrast of intensitymodulation can be calculated to be
n 5 0.56. (24)
This means that somewhat fewer than two speck-les of average width have to be incident inside a fulldetector aperture, and the contrast of intensity mod-ulation is reduced to approximately half of the con-trast of a point detector. However, the expression ofEq. ~20! is more meaningful, for all the parametersused there are easily accessible in the experiment.Figure 5 shows two plots of Eq. ~4!. One plot is for aspeckle pattern according to the optimum set of pa-rameters, and one is for a second speckle pattern thatis fully resolved. For a speckle interferometer withl 5 0.633 mm and a detector array with pixels ofdimension 10 mm 3 10 mm, the appropriate ratio2ayR would be 6.3. Compared with the case of apoint detector ~i.e., a true arrangement of a finite-sizedetector aperture and a very small lens aperture!, thechanges of the optimum mean speckle intensity andreference intensity become evident, if one bears inmind that by speckle integration the intensity PDF ofa coherently illuminated object with a rough surfacebecomes similar to that of one with an opticallysmooth surface, as would be found in classical inter-ferometry. There, for best results, one would adjustthe object intensity to 1y4 of the saturation intensity~tc 5 4! and the reference intensity to be equal to the
1 September 1997 y Vol. 36, No. 25 y APPLIED OPTICS 6221

object intensity ~rc 5 1!. If the lens aperture is fur-ther increased, the values tc and rc are thus consid-ered the limiting values for t and r, respectively.The need for a 50% rise of speckle intensity ~comparetc with t! is easily made up for by the fact of lessintensity blocked out by the far bigger lens aperture.
The total variance sF2 is largely determined by
those points where the interference signal neithersaturates nor where its modulation is completely un-resolved. This contribution amounts to 89% of sF
2.Eleven percent of the total is due to detector elementsin which the signal saturates during some interval ofthe shifted phase. Obviously, the case of an unre-solved signal can be left out entirely of the errorconsiderations. From this, we can conclude that thisresult also holds for a three-frame algorithm. Ifmere digitization errors are considered, the phasevariance is the same for this technique.17
Creath1,2 suggested matching the speckle size andthe pixel size, which means that m 5 1.9 and v 50.67. Creath’s result has been obtained without spe-cifically taking into consideration the effect of theactual phase-shift algorithm and the number of digi-tization levels. In spite of this very good correspon-dence of different approaches, we find that the lensaperture need not be stopped down so far.
The improving effect of spatial integration of speckleintensities on the standard deviation of the phase doesnot only come from fewer points with either no or veryhigh speckle intensities. It can also be attributed tothe finite size of the detector aperture that it makes thePDF of the speckle field more similar to that of thereference field. If a negative exponential speckle fieldand a smooth reference beam were superimposed, themean visibility @i.e., the integral of the visibility2=IrIsy~Ir 1 Is! over Is, weighted with the negativeexponential PDF of Is# of such a speckle interferogramwould turn out to be not more than 0.87, whereas thereference intensity would be found to be 0.67 times the
Fig. 5. Plots of the PDF’s of Eq. ~4! for two different specklepatterns, where the exponential one represents the situation of afully resolved pattern and the other one depicts the case of anintegrated pattern with ~ba!y~2lR! 5 0.31.
6222 APPLIED OPTICS y Vol. 36, No. 25 y 1 September 1997
mean speckle intensity. But if the visibility wereweighted with the Gamma distribution of Is @Eq. ~4!#and with m variable, of course, the PDF of Eq. ~4!would become a delta peak, and the beam ratio wouldapproach unity, while the mean visibility would as-sume a value of one. Thus, if in the experiment aspace–bandwidth product is chosen smaller than inEq. ~19!, the speckle PDF would broaden and changedtoward a negative exponential. First, an increase ofthe total standard deviation of phase F would becaused by a mismatch of the PDF’s of the correspond-ing fields. Second, the portion of both low and highspeckle intensities would rise and the finite number ofdigitization levels and the effect of saturation wouldalso cause increasing errors. Although a space–bandwidth product greater than in Eq. ~19! would fur-ther narrow the PDF of the speckle field, the reductionof the contrast of intensity modulation of Eq. ~13!would spoil this effect.
If other error sources were present ~e.g., fluctua-tions of the reference phase or electronic noise of theamplifier!, additional errors might exceed those cal-culated above. Because the squares of their stan-dard deviations add, they may undermine the errorsdepending on the joint effect of the AyD converter andthe saturation. It is then interesting to know howfar the optimum set of parameters may be violatedwithout introducing a noticeable error. In Fig. 6,the minimum of sF seems to follow a straight line~approximately given by t 5 5.2 1 1.46 r!, separatinga slope of moderately increasing error and anotherone, showing an extremely rapid rise of error withdeparture from the optimum. However, in case ofdoubt, the user should decide in favor of little meanspeckle intensity and little reference intensity, for theerror by an excessive interference signal is muchstronger than that by a poorly modulated one. If
Fig. 6. Contour plot of standard deviation sF of the difference Fof speckle phases w1 and w2 with ~ba!y~2lR! 5 0.31. The x axis isthe beam ratio r and the y axis is the number of times the photo-detector’s saturation intensity exceeds the mean speckle intensity.The latter is identical with t, which is the inverse of the modulationof the camera. The contours are labeled with the correspondingstandard deviations given in milliradians.

there cannot be sufficient light captured from theobject in the experiment, the lack of speckle intensitycan partly be compensated for by an increase of thereference intensity. This will usually be possible, be-cause the light split from the laser beam to serve as thereference beam is in most applications much less thanthe remaining light to illuminate the scattering object.
4. Computer Simulation of the Results
The statistics of intensity and phase of a speckle fieldcan be described by the phenomenon of randomwalk.11 The computer simulation of a random walkconsists of summing up a very large number of com-plex phasors with random amplitudes and phases.The whole of those individual sums represents aspeckle field with the known statistics of speckles.The requirement of an extremely large number ofelementary phasors to form a single speckle is not assevere as that in the investigation of resolved specklefields, because the PDF is smoothed by the integra-tion effect of the detector aperture anyway.
To provide uniformly distributed numbers in therange between zero and one, the random function ofthe computer is used. They are added to give realnumbers whose statistics obey a centered and nor-malized Gaussian. These numbers represent theamplitude deviation of the rough surface from thesmooth object contour, where the rms parameter rq ofthe surface can be arbitrarily chosen. The phase ofan elementary phasor used during the formation ofone speckle of the field is calculated from the surfaceamplitude and the wavelength. The computer alsosupplies the random numbers for the real amplitudesof the elementary phasors. This array of complexamplitudes is convolved with the amplitude point-spread function ma of Eq. ~10!, where the specklespread is already included, which will come in afterthe reference beam is added. For the convolution, thepoint-spread function is used as far as the eighth zeroon either side of the sinc function. This is extremelyimportant at points of high speckle intensity. Thisprocedure is suited to simulate a field of imaged speck-les and must be repeated for each turn if any param-eter is changed ~e.g., wavelength or object position!.
To calculate a single frame w1 or w2 of specklephases, we derive the phase-shifted interferogramsI1, . . . , I4 from the first frame of complex speckleamplitudes by superposing it with those of the phase-shifted smooth reference beam. The strength of thereference beam has been taken from the mean of thespeckle intensities, as calculated beforehand. De-pending on the average speckle size and the activedetector area, the interference intensities at the meshpoints inside the square area are incoherently addedto introduce the integration effect of the detector ap-erture on the speckle interferogram. To find the ap-propriate number of mesh points per pixel to beintegrated over, we increase their number while wemonitor the standard deviation of the intensities.
According to the mean speckle intensity, the refer-ence intensity, and the saturation intensity, the inter-ference signal is suitably scaled and undergoes
digitization by the round function of the computer. Ifthe scaled interference signal exceeds the value of themaximum digitization depth, its value is replaced by255. These arrays of integral numbers are then usedto calculate the first phase frame according to Eq. ~1!.For the phase modulo 2p to be determined, the signs ofthe numerator and the denominator are looked at andthe calculated phase is offset accordingly. To simu-late a speckle interferometer we decided on a two-wavelength setup, because for plane objects withouttilt, the speckle size only affects the accuracy of thephase calculation and does not introduce additionaldecorrelation ~cf. Ref. 18!. During a second run thisprocedure is repeated with a changed optical wave-length. The two phase frames are then subtracted togive the result of the measurement. For the theory ithas been supposed that, for the output of the individ-ual phase frames, they are not subject to digitization.If this were not the case, the phase frames would un-dergo another error with a standard deviation of 7.1mrad each, if the same digitization depth were pre-sumed as above. After phase subtraction, the phasedifference would be provided with an additional rmserror of 10.0 mrad. Because most image processorsuse lookup tables for the output phase, the square ofthis error has to be added to the total variance.
Twenty camera lines of 512 pixels each are assumed,and each line is individually analyzed to obtain infor-mation about the mean and the variance of phase vari-ance sF
2. A flat but rough surface is assumed. Theomission of a surface tilt does not mean a lack of gen-erality. It simply separates the detector- andconverter-dependent errors to be discussed from thosethat are due to the influence of finite lateral resolutionon the resulting phase.18 The speckle interferogramsare computed for a set of parameters, where the opticallaser wavelength is 1 mm, the effective wavelength is100 mm, and the rms surface roughness is 1 mm.This set ensures that the original speckle pattern isfully developed and that the influence of phase decor-relation ~0.41 mrad!, caused by surface roughness andeffective wavelength, does not significantly contributeto the total variance of phase difference F.
The evaluation of the simulated lines gives theresults of Table 1. The standard deviation of sF ismuch less than it is in the case of a fully developedspeckle pattern and a point detector. These simula-
Table 1. Comparison of Theoretical and Computer-Simulated Resultsa
Space–BandwidthProduct
~ba!y~2lR!
Standard Deviation sF ofPhase Difference F
~mrad!
Theory Simulation
0 25.1 23.9 6 13.70.15 14.4 21.4 6 7.20.31 10.6 12.3 6 3.20.62 13.3 15.2 6 2.3
aThe geometrical parameters of the space–bandwidth productsare explained by Fig. 1. It is assumed that the intensities areadjusted according to Eqs. ~21! and ~22!.
1 September 1997 y Vol. 36, No. 25 y APPLIED OPTICS 6223

tion results agree reasonably well with the theoreti-cal ones. The decrease of standard deviation ofcomputer-simulated sF along with the increase ofspace–bandwidth product ~i.e., decrease of averagespeckle width! is caused by the fact that the linewidthof the speckle intensity PDF becomes smaller, andtherefore the intensity modulation in the speckle in-terferograms gather about some value that is deter-mined by the reference intensity and the meanspeckle intensity. It can also be observed that whileincreasing the effect of spatial intensity integration,the mean speckle intensity tends toward 1y4 of thesaturation intensity, and the beam ratio approachesthe value of one. Clearly, this is the limiting case ofclassical interferometry, where both reference beamand object beam are smooth.
5. Conclusions
There is no need to resolve a speckle pattern fully inspeckle interferometry, because the negative expo-nential probability density function of speckle inten-sities may cause unnecessary and excessive error. Areal experimental setup is assumed that employs asolid-state photodetector ~or an array of it! with amaximum detectable intensity ~saturation! and, forthe purpose of data processing, an analog-to-digitalconverter with an 8-bit digitization depth.
Error resulting from digitization errors by poor in-tensity modulation and detector saturation can beavoided by speckle integration by means of an ex-tended active area of the detector element. How-ever, this procedure is a trade-off with the contrast ofintensity modulation. An optimum is found inwhich the remaining phase-measurement error is10.6 mrad. This situation can be adjusted by select-ing a lens aperture according to the best space–bandwidth product ~ba!y~2lR! of 0.31, choosing themean speckle intensity to be 1y11 of the saturationintensity, and choosing the reference intensity to befour times the mean speckle intensity. It can also beconcluded that the 90° phase-shift algorithm witheither three, four or five frames turned out to be quitepowerful, even with interference signals of ratherpoor contrast of intensity modulation.
Again, it has to be clearly pointed out that the re-sults above only concern that portion of phase varianceof a speckle interferometric measurement that is ex-clusively determined by the photodetector and the AyDconverter in the way that all errors discussed here aredue to intensity clipping or digitization. If any of theother error sources ~such as phase decorrelation! alsodepends on the speckle size, the minimum phase errorhas to be sought anew. As there is a large variety ofapplications of speckle interferometry and also manyways of phase evaluation, finding a result that holdsfor all of them is extremely difficult. As a way toreduce the effect of phase decorrelation, small specklesizes may also be derived from the theory, e.g., by Ref.2 and Ref. 18, for the cases of a speckle interferometricmeasurement of object deformation and for two-wavelength speckle interferometry, respectively.
The results above need not hold necessarily for
6224 APPLIED OPTICS y Vol. 36, No. 25 y 1 September 1997
speckle-pattern correlograms, where mere intensitypatterns are subtracted. The results are yet consid-ered coincident with optimum parameters of thosespeckle interferometric setups in which the leastpoints to be rejected method is aimed at instead of amaximum phase-measurement accuracy technique.
All the analytical results are confirmed by com-puter simulation of a two-wavelength speckle inter-ferometer. The optimum parameters of a realexperimental setup are used for the simulation, andthe standard deviation sF of the resulting phase dif-ference F 5 w1 2 w2 is obtained to be 12.3 6 3.2 mrad,where the analysis gives 10.6 mrad.
References1. K. Creath, “Phase-shifting speckle interferometry,” Appl. Opt.
24, 3053–3058 ~1985!.2. K. Creath, “Phase-shifting speckle interferometry,” in Speck-
les, H. Arsenault, ed., Proc. SPIE 556, 337–346 ~1985!.3. T. Maack and R. Kowarschik, “Camera influence on the phase-
measurement accuracy of a phase-shifting speckle interferom-eter,” Appl. Opt. 35, 3514–3524 ~1996!.
4. M. Lehmann, “Optimization of wavefield intensities in phase-shifting speckle interferometry,” Opt. Commun. 118, 199–206~1995!.
5. G. Å. Slettemoen and J. C. Wyant, “Maximal fraction of ac-ceptable measurements in phase-shifting speckle interferom-etry: a theoretical study,” J. Opt. Soc. Am. A 3, 210–214~1986!.
6. G. Å. Slettemoen, “Electronic speckle pattern interferometricsystem based on a speckle reference beam,” Appl. Opt. 19,616–623 ~1980!.
7. G. Å. Slettemoen, “General analysis of fringe contrast in elec-tronic speckle pattern interferometry,” Opt. Acta 26, 313–327~1979!.
8. J. E. Greivenkamp and J. H. Bruning, “Phase shifting inter-ferometer,” in Optical Shop Testing, D. Malacara, ed. ~Wiley,New York, 1992!, pp. 501–598.
9. K. Creath, “Phase-measurement interferometry techniques,”in Progress in Optics XXVI, E. Wolf, ed. ~North-Holland, Am-sterdam, 1988!, pp. 349–393.
10. K. Creath, “Temporal phase measurement techniques,” in In-terferogram Analysis, D. W. Robinson and G. T. Reid, eds.~Institute of Publishing, Bristol, UK, 1993!, pp. 94–140.
11. J. W. Goodman, “Statistical properties of speckle patterns,” inLaser Speckle and Related Phenomena, J. C. Dainty, ed.~Springer-Verlag, Berlin, 1984!, pp. 9–76.
12. J. C. Dainty, “Some statistical properties of random specklepatterns in coherent and partially coherent illumination,” Opt.Acta 17, 761–772 ~1970!.
13. A. A. Scribot, “First-order probability density function ofspeckle measured with a finite aperture,” Opt. Commun. 11,238–241 ~1974!.
14. A. E. Ennos, “Speckle interferometry,” in Laser Speckle andRelated Phenomena, J. C. Dainty, ed. ~Springer-Verlag, Berlin,1984!, pp. 203–253.
15. M. Born and E. Wolf, Principles of Optics ~Pergamon, Oxford,1993!.
16. T. S. McKechnie, “Measurement of some second order statis-tical properties of speckle,” Optik 39, 258–276 ~1974!.
17. C. P. Brophy, “Effect of intensity cross correlation on the com-puted phase of phase-shifting interferometry,” J. Opt. Soc. Am.A 7, 537–541 ~1990!.
18. U. Vry and A. F. Fercher, “Higher-order statistical propertiesof speckle fields and their application to rough-surface inter-ferometry,” J. Opt. Soc. Am. A 3, 988–1000 ~1986!.