Embed Size (px)
Citation preview

PLEA2013 - 29th Conference, Sustainable Architecture for a Renewable Future, Munich, Germany 10-12 September 2013
Optimum Gradual Glazing in Atria for Optimized Daylight
Performance in the Adjacent Spaces
MIGUEL ANGEL JUAREZ DE LEON1, BENSON LAU2 1University of Nottingham, Nottingham, UK 2 University of Nottingham, Nottingham, UK
ABSTRACT: A gradual increase in the glazing area of the an atrium’s walls from the upper to the bottom storeys will enhance the daylight performance of the adjacent spaces in atria buildings [19,21]. The improvement is achieved by balancing the available light in the different storey levels of the atrium with different window sizes in each storey. However, the dimensions for the precise glazing proportions for optimizing the daylight performance in the adjacent spaces of atriums have not been well researched. Through computational studies, this paper is an attempt to define appropriate glazing dimensions for providing optimum daylight levels at different levels of an atrium. The research findings indicated that the gradual fenestration strategy can help achieve desirable light levels in the adjoining spaces of the atrium. The research methodology and testing procedures adopted in this research give new insights into the exploration of the relationship between glazing proportion and daylight illuminance in the adjacent spaces at different level inside an atrium. Keywords: daylight performance, atria, adjacent spaces, gradual glazing
INTRODUCTION The daylight performance of buildings may be enhanced by the incorporation of an atrium space into the design. As a result, atria may reduce the energy consumed by artificial lighting and improve visual comfort for the building’s occupants. However, these potential benefits may be achieved only with an appropriate atrium design. Generally, the light levels in the building are sufficiently high in the atrium spaces. However, proving natural light into the adjoining spaces is more challenging. Previous investigations had confirmed that high levels of light are found near the atrium’s roof [2,13]. However, the light levels rapidly fade, and they become significantly less in the bottom of the atrium. This contrast in the light levels contributes to the difficulty in the effective illumination of the adjoining spaces of an atrium. A gradual increase in the area of glazing from the upper to the lower levels on the walls of an atrium may balance the quantity of light in the adjacent space of the different floor levels. Smaller windows in the upper levels will decrease the amount of light entering to the adjacent spaces in top storeys, and at the same time this will allow more light to bounce towards the lower levels. There is a need of a study that will contribute to the correct designing of the glazing dimensions for the different levels in the atrium. The aim of this paper is to fill this gap and contribute to define the gradual glazing optimum proportions. ASSUMPTIONS Atria buildings drastically vary in height, shape, and proportion. The daylight performance of an atrium bulding is directly related to these factors. In this paper a
five storey square shaped atrium was used to conduct the research. The dimensions of the atrium (Fig. 1) were taken from previous studies performed [18]. This particular atrium was selected due to its potential to reflect light in the lower adjoining spaces. Furthermore, “the proportions of the atrium (16m x 16m x 20m) in relation to its adjoining spaces (depth of 12 m) are representative of the building stock. This makes the study useful in terms of understanding the impact of facades on daylight behaviour in a typical atrium building [18].” The atrium space is covered with a glazing roof system.
Figure 1: Section of the model used for this resarch showing its main dimenstions
The space of interest in this study is the area directly
lit by the atrium. This criterion was used to define the adjacent space. As a result, there are four adjacent spaces per storey (Fig. 2). However, the distribution of light will be symmetrical throughout the model since the C.I.E. standard overcast sky was assumed for this experiment. Thus, identical results will be obtained from each of the adjacent spaces located in the same storey

regardless of its orientation, geographical location, and daytime. Therefore, it is necessary to analyse the daylight performance of only one of the adjacent spaces. It is also important to mention that the corners of the atrium building are excluded of this research.
Figure 2: Delimitation of adjacent space in atrium.
It was also assumed that the windows from the atrium will provide appropriate illumination six meters away from the atrium wall. Therefore, a six meter analysis grid was used for the daylight calculation (Table 1). The height of the horizontal grid was set to 0.85 meters above from the floor since this height has been “agreed internationally…as an average working height [11].”
Table 1: Dimension and number of nodes of the Analyis Gird.
A definition of the optimum daylight performance of the adjacent space is necessary before starting with the glazing proportion’s experimentation. The primary purpose of the gradual glazing strategy is to balance the quantity of light in the adjacent spaces. Therefore the criterion to be considered for the definition of the optimum daylight performance is the distribution of the quantity of light between the floors. For this study, the optimum distribution is assumed to be achieved when an equal amount of light quantity is obtained through the different floor levels. The Average Daylight Factor (ADF) will be used to quantify the light entering the adjacent space from the atrium.
A line graph (Fig. 3)may be used to illustrate the hypothetical case in which the optimum distribution of light is achieved in the different adjacent spaces of a five storey square atrium. The graph compares the ADF in each storey with two different glazing distributions. The first line shows the ADF of the adjacent spaces of an atrium with windows of the same size in every level (even distribution of the glazing). Since the light levels
in the top floors of the adjacent are higher than at the bottom the line in the graph describes a constant decrease through the different levels. The second line in Figure 3 represents the ADF corresponding to an atrium with constantly increasing windows sizesin each storey (gradual glazing). In this line, the ADF in the adjacent spaces of the different atrium storeys maintains a constant value. This balance in the light levels is achieved through the gradual glazing strategy.
Figure 3: Optimum distribution of light in adjacent spaces.
METHODOLOGY The assumed atrium building was digitally modelled with the CAD software AutoCAD. Then, this digital model was exported to the software Ecotect. The Ecotect interface was used to assign the reflectance values to the surfaces of the model (Table 2). The daylight simulation calculations were performed with Radiance. Table 2: Dimension and number of nodes of the Analyis Gird.
A series of related daylighting studies were performed with the computer model. Three stides were performed in total for this research. The ultimate objective of these experiments was to find the glazing proportions that may achieve the optimum distribution of light quantity in the adjacent spaces of the different storey levels. The result of the first study constituted the starting point for the second study. Likewise, the results from the second study were the beginning of the third and final study. FIRST STUDY The first study consisted of a parametric investigation conducted to obtain an equal ADF in the adjacent space of the uppermost and the lowest storeys. The most contrasting levels of light in the atrium are found between the top floor and lowest floor. In the lowest floor more light is needed. Therefore, the walls must
Axis Size (M) Number of Nodes
x 16.00 32
y 6.00 12
Grid Properties
0%
2%
4%
6%
8%
10%
12%
5 4 3 2 1
AD
F A
dja
cen
t S
pa
ces
Storeys
Gradual Glazing
Even Distribution
Surface Reflectance
Atrium`s Wall 0.85Exterior Walls 0.60
Adjacent Space Walls 0.60Atrium´s Floor 0.75
Adjacent Space Floor 0.40Adjacent Space`s Ceiling 0.85
Surface Reflectance Values

have the greatest amount of glazing. The size of the glazing in the first storey was of 3.00 meters height, and 15.48 meters long. The total area for this window (46.44M2), is considered as the 100% proportion for this experiment. The size of the window in the upper floor was the variable modified during the experimentation. The size of the window in the fifth storey is related as a percentage of the window at the first storey. A wide range of parametric proportions were tested at first: 10% 30% 50% 70% 90% (Figure 4). It is important to mention that only the windows in the first and fifth storey were included for this experiment. The ADF was the quantitative figure used to compare the amount of light between the different parametric cases. The aim of this experiment is to find
the proportion of glazing in the fifth floor in which the difference between the ADF of the adjacent space in the fifth and first storey is minimized the most. Figure 4: Variable window sizes at the 5th storey
The results of the first parametric study showed that the minimum difference between the lowest and the top floor may be found by using a glazing percentage between 30% and 50% in the top floor. Then, a refined parametric study wasconducted by adding a second set of window sizes. The new tested variable values were: 30%, 35% and 45%. The following graph (Fig 5) shows the ADF difference between the fifth floor and the first floor of all the parametric cases. From the graph, it is clear that the lowest difference in ADF is obtained by using an opening of 40% in the top floor and 100% in the bottom. In this case, the ADF was of 2.38% in the 5th storey and 2.48% in the 1st storey. Thus, there was only a 0.1% difference. These window proportions were used as the starting point for the second experiment.
Figure 5: ADF difference in parametric study.
SECOND STUDY Windows were added to the reaming levels in the second study. Let us remember that the result of the first experimentation, in which the fifth floor had a proportion of 40%, was used as the starting point of the second part of the methodology. To define the proportion of the reaming three storeys (2nd 3rd and 4th), a constant increment was applied to the area of glazing in order to get a 100% in the fifth storey. The constant increment for each storey may be mathematically described with the simple linear formula:40+4X=100.When solved, this equation determines a 15.00% increment for each level (Fig. 6).
Figure 6: Linear increment of Glazing
The ADF of the adjacent space of every level was calculated using a daylight simulation (Table 3). A reasonable similitude was found between the ADF in the adjacent spaces of all the storey levels. However, the ADFs in the adjacent space from the second to the fifth storey were higher than the one obtained in the first floor. Therefore, it is necessary to decrease the size of the glazing in these levels in order to optimize the daylight performance. This also suggests that a linear increment is not the optimum distribution pattern for the glazing increment. In order to refine the distribution of the quantity of light, the proportions of the glazing in the atrium walls must be changed. The problem to solve is to find a logical principle that may be used to determine the proportions for the glazing.
Table 3: Dimension and number of nodes of the Analyis Gird.
0
0.5
1
1.5
2
2.5
3
10% 30% 35% 40% 45% 50% 70% 90%
DIF
FE
RE
NC
E I
N A
DF
(%
)
Percentage of size opening for the Upper Level
Opening (%) ADF (%) Difference
Storey 5 40.00% 2.01% 0.21%
Storey 4 55.00% 2.29% 0.49%
Storey 3 70.00% 2.45% 0.65%
Storey 2 85.00% 2.11% 0.31%
Storey 1 100.00% 1.80% 0.00%
ADF (%) of Linear Distribution
THIRD STUDY
The proposal of the third study is that an optimum proportion for the glazing of the atrium walls will be obtained by relating the size of each window to the available light in the different levels of the atrium. It was possible to estimate the amount of light in the different levels of the atrium by using a vertical grid parallel to the atrium wall in the computer model. The grid was located 100 mm apart from the wall of the adjoining space. The grid measured approx. 16 meters (width) and 20 meters (height)(Fig. 7).
Figure 7: Section of model showing vertical analyis grid.
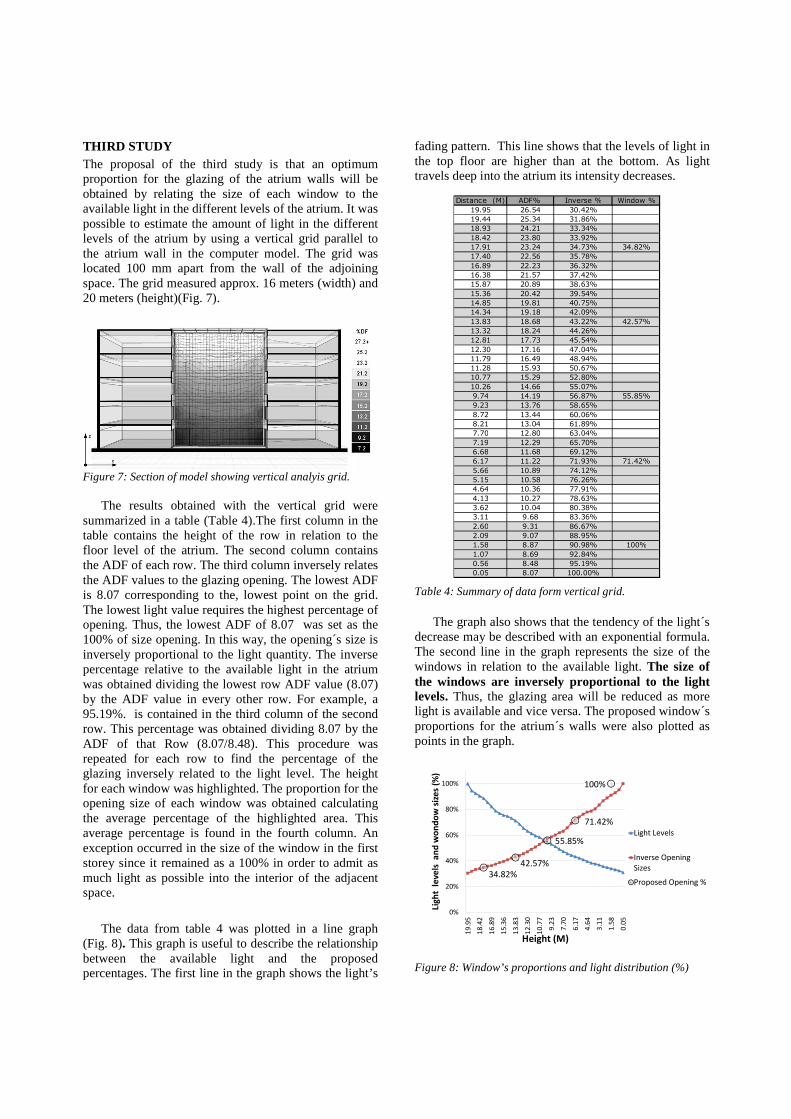
The results obtained with the vertical grid were summarized in a table (Table 4).The first column in the table contains the height of the row in relation to the floor level of the atrium. The second column contains the ADF of each row. The third column inversely relates the ADF values to the glazing opening. The lowest ADF is 8.07 corresponding to the, lowest point on the grid. The lowest light value requires the highest percentage of opening. Thus, the lowest ADF of 8.07 was set as the 100% of size opening. In this way, the opening´s size is inversely proportional to the light quantity. The inverse percentage relative to the available light in the atrium was obtained dividing the lowest row ADF value (8.07) by the ADF value in every other row. For example, a 95.19%. is contained in the third column of the second row. This percentage was obtained dividing 8.07 by the ADF of that Row (8.07/8.48). This procedure was repeated for each row to find the percentage of the glazing inversely related to the light level. The height for each window was highlighted. The proportion for the opening size of each window was obtained calculating the average percentage of the highlighted area. This average percentage is found in the fourth column. An exception occurred in the size of the window in the first storey since it remained as a 100% in order to admit as much light as possible into the interior of the adjacent space.
The data from table 4 was plotted in a line graph (Fig. 8). This graph is useful to describe the relationship between the available light and the proposed percentages. The first line in the graph shows the light’s
fading pattern. This line shows that the levels of light in the top floor are higher than at the bottom. As light travels deep into the atrium its intensity decreases.
Table 4: Summary of data form vertical grid.
The graph also shows that the tendency of the light´s decrease may be described with an exponential formula. The second line in the graph represents the size of the windows in relation to the available light. The size of the windows are inversely proportional to the light levels. Thus, the glazing area will be reduced as more light is available and vice versa. The proposed window´s proportions for the atrium´s walls were also plotted as points in the graph.
Figure 8: Window’s proportions and light distribution (%)
Distance (M) ADF% Inverse % Window %
19.95 26.54 30.42%
19.44 25.34 31.86%
18.93 24.21 33.34%
18.42 23.80 33.92%
17.91 23.24 34.73% 34.82%
17.40 22.56 35.78%
16.89 22.23 36.32%
16.38 21.57 37.42%
15.87 20.89 38.63%
15.36 20.42 39.54%
14.85 19.81 40.75%
14.34 19.18 42.09%
13.83 18.68 43.22% 42.57%
13.32 18.24 44.26%
12.81 17.73 45.54%
12.30 17.16 47.04%
11.79 16.49 48.94%
11.28 15.93 50.67%
10.77 15.29 52.80%
10.26 14.66 55.07%
9.74 14.19 56.87% 55.85%
9.23 13.76 58.65%
8.72 13.44 60.06%
8.21 13.04 61.89%
7.70 12.80 63.04%
7.19 12.29 65.70%
6.68 11.68 69.12%
6.17 11.22 71.93% 71.42%
5.66 10.89 74.12%
5.15 10.58 76.26%
4.64 10.36 77.91%
4.13 10.27 78.63%
3.62 10.04 80.38%
3.11 9.68 83.36%
2.60 9.31 86.67%
2.09 9.07 88.95%
1.58 8.87 90.98% 100%
1.07 8.69 92.84%
0.56 8.48 95.19%
0.05 8.07 100.00%
34.82%
42.57%
55.85%
71.42%
100%
0%
20%
40%
60%
80%
100%
19
.95
18
.42
16
.89
15
.36
13
.83
12
.30
10
.77
9.2
3
7.7
0
6.1
7
4.6
4
3.1
1
1.5
8
0.0
5
Lig
ht
le
ve
ls a
nd
wo
nd
ow
siz
es
(%)
Height (M)
Light Levels
Inverse Opening
Sizes
Proposed Opening %

From these results the glazing proportions were derived. The proportions have a slow increase in openings on the higher floors followed by a steep increase in openings on the lower floors. Thus, the increment is gradually increasing in a ratio inversely proportional to the available light. The curve tendency for the glazing increment may be approximately describe by the exponential formula y=0.25e0.26x . Figure 9: Window’s proportions related to light level.
A new computer model was built with the glazing proportions with the exponential increase. A daylight simulation was again performed using RADIANCE. The parameters were the same as in the second study. The ADF and the corresponding difference with respect to the adjacent space in the lowest storey were obtained (Table 5).
Table 5: Results from model with exponential increment in glazing.
An average of the area of glazing of the exponential distribution was calculated to build a new model with an even distribution of glazing. The following formula was used to obtain the required percentage.
In this way, the atrium’s model had a 61% proportion of glazing in each storey. Finally the ADF of this model was obtained in order to compare the ADF of the different options investigated in this research. (Fig. 10).
Figure 10: ADF in adjacent spaces comparison between atrium models with different glazing proportions.
Figure 10 compares the ADF in the adjacent space obtained in the different storeys with different glazing proportions in the atrium’s wall. The first line corresponds to the proportion of glazing that was constant in every storey. It shows a constant decrement in the light levels as light travels to the lower storeys. The second line corresponds to the ADFs obtained with an exponential increment of the glazing from top to bottom. The third line shows the ADF of a linear increment of the glazing. The graph shows that the ADF in the adjacent spaces obtained from the linear distribution and the exponential distribution showed a greater similitude through the different storeys than the even distribution of glazing. However, there are differences in the results between the exponential and linear proportions.
The ADF values are closer to each other in the exponential fenestration than the ADF of the linear proportions. Therefore, the ADF results of the exponential model are more similar to the hypothetical graph that shows the optimum distribution of light (Fig. 3). Therefore, the optimum distribution of light between the adjacent spaces of different floors –for this particular atrium building- was obtained by inversely relating the size of the windows to the light available in the atrium. CONCLUSIONS The optimum distribution of light into the adjacent spaces in the different levels was obtained by relating the available light in the atrium to the window´s proportions. The relationship between the windows and the available light in the atrium is inversely proportional. In this particular case, the exact proportions were derived from an exponential increment of the atrium’s fenestration. However, these specific glazing proportions exclusively correspond to the atrium’s model and the criterion of optimum distribution adopted for the study. A change in the atrium’s characteristics will result in a change in the available light, and therefore a new glazing proportion would be needed.
Opening (%) ADF (%) Difference
Storey 5 35.00% 1.79% -0.07%
Storey 4 43.00% 1.93% 0.07%
Storey 3 55.00% 1.89% 0.03%
Storey 2 72.00% 2.09% 0.23%
Storey 1 100.00% 1.86% 0.00%
ADF (%) Exponential Distribution
(35%+43%+55%+72%+100%)=
5 61%
1.00
1.50
2.00
2.50
3.00
3.50
5 4 3 2 1
AD
F %
Storey
Even
Distirbution of
Glazing
Exponential
Distribution of
Glazing
Linear
Distribution of
Glazing

Likewise, a new proportion of windows would be needed if a different optimum criterion is adopted. Nevertheless, the criterion used for this research is applicable in atrium building design since it increases the daylight available in the lower levels of the atrium and balances the light levels between inside the adjacent spaces in different heights.
A similar methodology to the one used in this
research may be follow to determine the glazing proportions for atria buildings with different characteristics and/or optimum criterion than the ones adopted for this study. The first step for doing so is to identify the atrium´s main characteristics. The atrium geometry, dimensions, number of storeys, roofing system, surface´s reflectance s etc. must be known, or defined. The second step is to determine the optimum daylight parameters according to the design criteria. The desired illumination levels should be linked to the function on the different adjacent spaces. The third step is to investigate the available light in the atrium. One option to achieve this is by modelling a computer model that will enable the performance of daylight simulation studies. Finally, the available light in the atrium must be related with the desired light criteria in the adjacent space in order to determine the size window for each level. This procedure may be applied to determine the glazing proportions in atria buildings in which the gradual glazing strategy is feasible.
FURTHER RESEARCH
It is advisable to perform a study that incorporates the light introduced to the adjacent spaces from the exterior windows. The interaction of these different sources of light could be better understood with this research.
REFERENCES 1. Aschenhoug, O. 1986. Daylight Design for Glazed Spaces. Proceedings from The International Daylighting Conference 2, Long Beach, CA, November, 237-243.BELL, J.A.M. BURT, W., 1995 Designing Buildings for Daylight, Building Research Establishment, Watford,. 2. Baker, N Fanchitti A. Steemers, K 1993, Daylighting in Architecture a European reference book, James & James, London 3. Baker, N. Steemers, K 2000, Energy and Environment in Architecture A Technical Design Guide, E&F Spoon, London and New York 4. Baker, N. Steemers, K 2002, Daylight Design of Buildings, James & James, London 5. BS 8206-2:2008Lighting for buildings –Part 2: Code of practice for daylighting 6. BS EN 12665:2011 Light and lighting -Basic terms and criteria For Specifying Lighting Requirements 7. Bednar, M. 1986. The New Atrium. McGraw Hill, New York.
8. Chadwell, R. 1997, The RADIANCE Lighting Simulation and Rendering System http://radsite.lbl.gov/radiance/framew.html (Consulted Sept 2011) 9. Ease Education of architects on solar energy and ecology. Sun Spaces and Atria, Secion 2.2 www.cenerg.ensmp.fr/ease/sunspace_overheads.pdf (Consulted on Sept. 2011) 10. Evoy M. 1994, External Components,Longman Group Limited, Essex. 11. Hopkinson, R.G., PETHERBRIDGE P., LONGMORE J. 1966, Daylighting, Heinemann London. 12. Lau, B., & DUAN, Z. 2008, The Daylight Benefit conferred upon Adjoining Rooms by Specular Surfaces in Top-Lit Atria Architectural Science Review, 51(3), 204-211. 13. Littlefair, P J, MA, PhD, CEng, MCIBSE and M E Aizlewood, BSc, MSc,1998 Daylight in Atrium Buildings. Construction Research Communications Ltd, Watford. 14. Mabb, J. (2008). Modification of Atrium Design To Improve Performance, VDM VerlagDr. Muller. 15. Moon, P. and SPENCER, D.E. (1942) Illumination from a Non Unifrom Sky IllumEngng, 37 707 16. Pan Liu (2004) Study of the Influence of Atrium Faccades Fenestration on Daylightinf in its Adjoining Spaces 17. Paterson, M. (2011) Structural Glass Facades and Enclousures John Wiley & Sons Inc. 18. Samant, (2011) Unpublished Thesis 19. Saxon, R. (1986). Atrium Buildings: Development and Design (2nd Ed). London: Architectural Press. 20. Sokolay, S. (1996) Solar Geometry, Plea, The University of Queensland Brisbane 21. Reinne, D, FOROUTAN, P, 1998, Environmental Design Guide for Naturally Ventilated and Daylit Offices, Construction Research Communications Ltd, Watford