Embed Size (px)
Citation preview
Optimizing Your Payables Mix:
A Guide to Maximizing Automation & Financial Return in AP Andrea Eaton
Paymode-X from Bottomline Technologies, Inc.
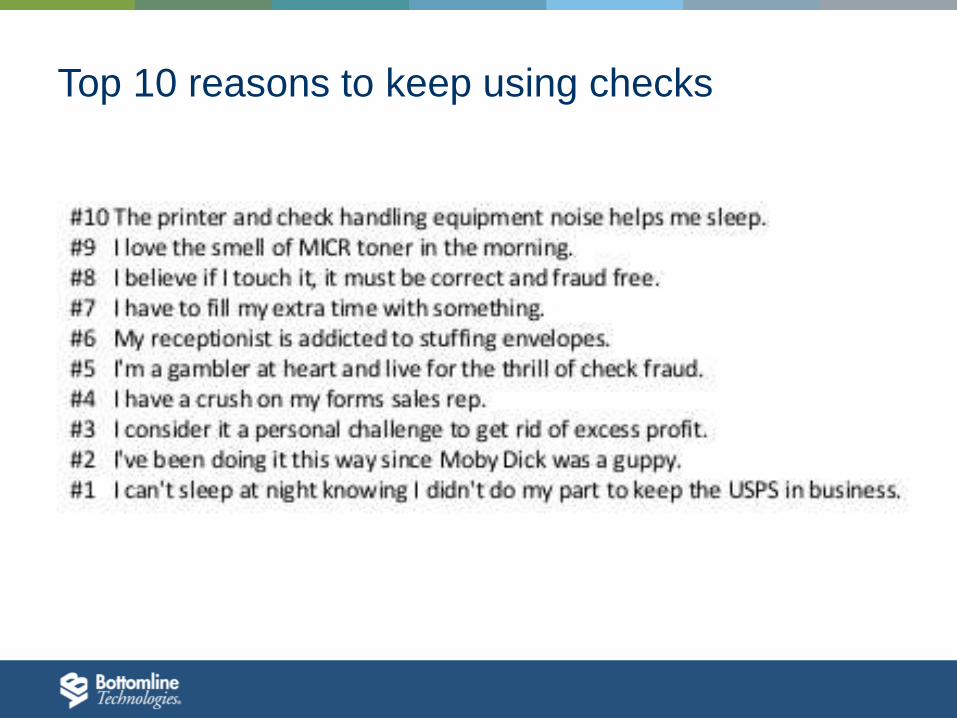
Top 10 reasons to keep using checks
Agenda
• Payments in 2014: Bottomline’s study
• Opportunities and trends in AP
• Considerations for maximizing financial and
efficiency gains
• A checklist for your organization
• Q&A
Payments in 2014
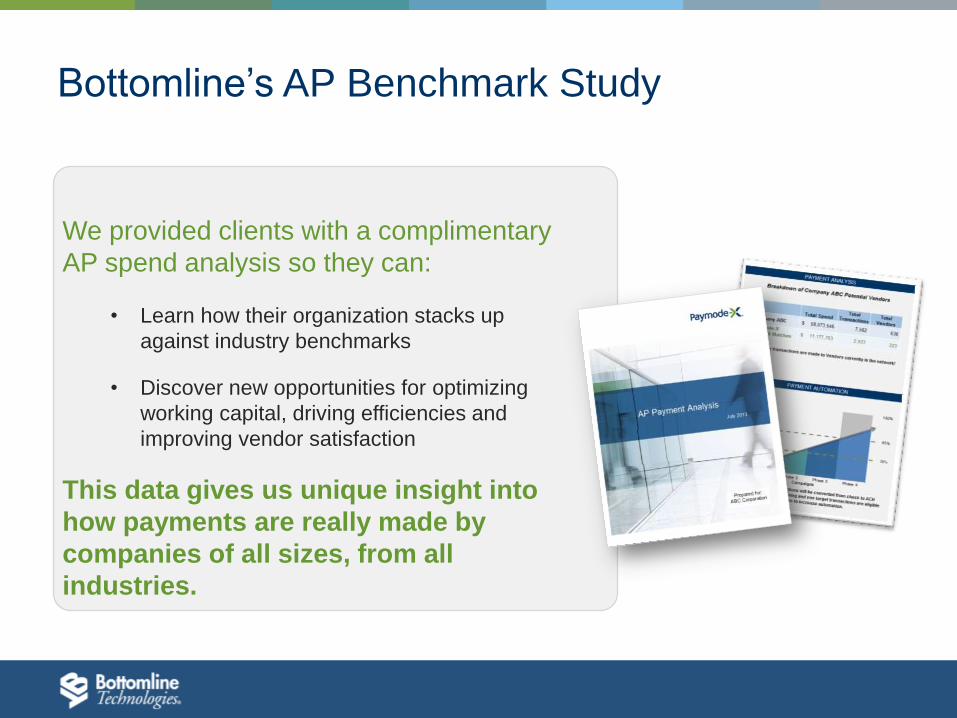
Bottomline’s AP Benchmark Study
We provided clients with a complimentary
AP spend analysis so they can:
• Learn how their organization stacks up
against industry benchmarks
• Discover new opportunities for optimizing
working capital, driving efficiencies and
improving vendor satisfaction
This data gives us unique insight into
how payments are really made by
companies of all sizes, from all
industries.
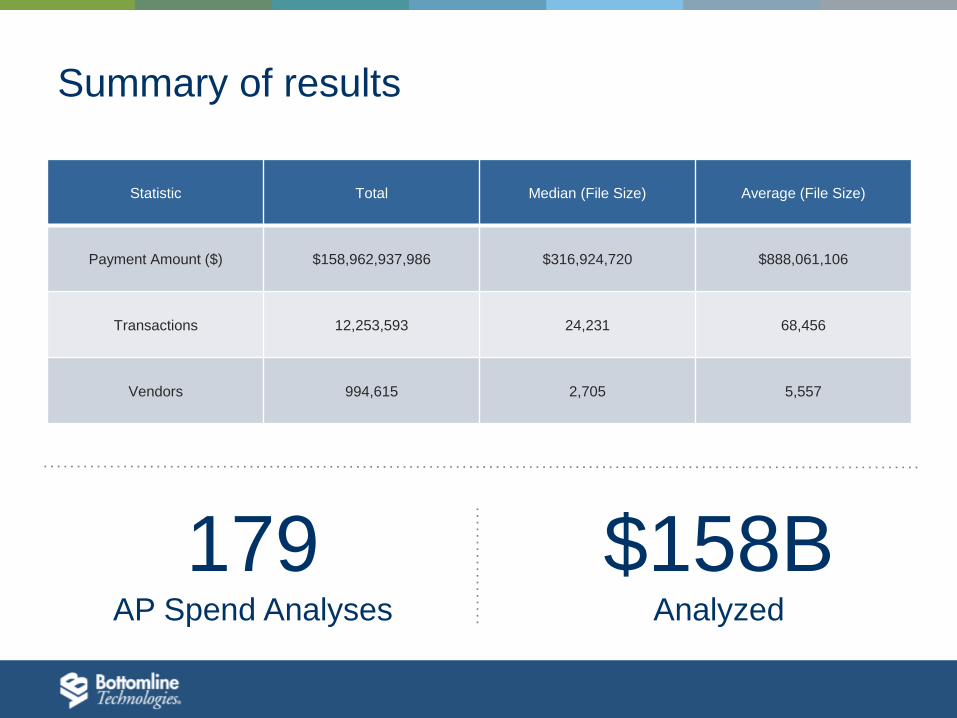
Summary of results
Statistic Total Median (File Size) Average (File Size)
Payment Amount ($) $158,962,937,986 $316,924,720 $888,061,106
Transactions 12,253,593 24,231 68,456
Vendors 994,615 2,705 5,557
$158B Analyzed
179 AP Spend Analyses
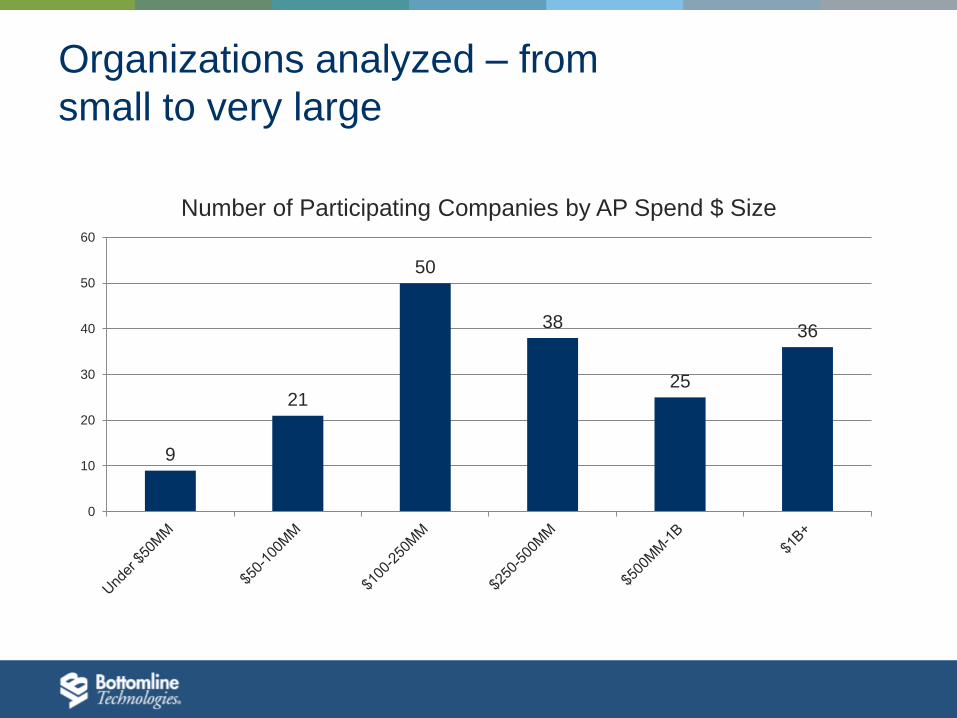
Organizations analyzed – from
small to very large
9
21
50
38
25
36
0
10
20
30
40
50
60
Number of Participating Companies by AP Spend $ Size
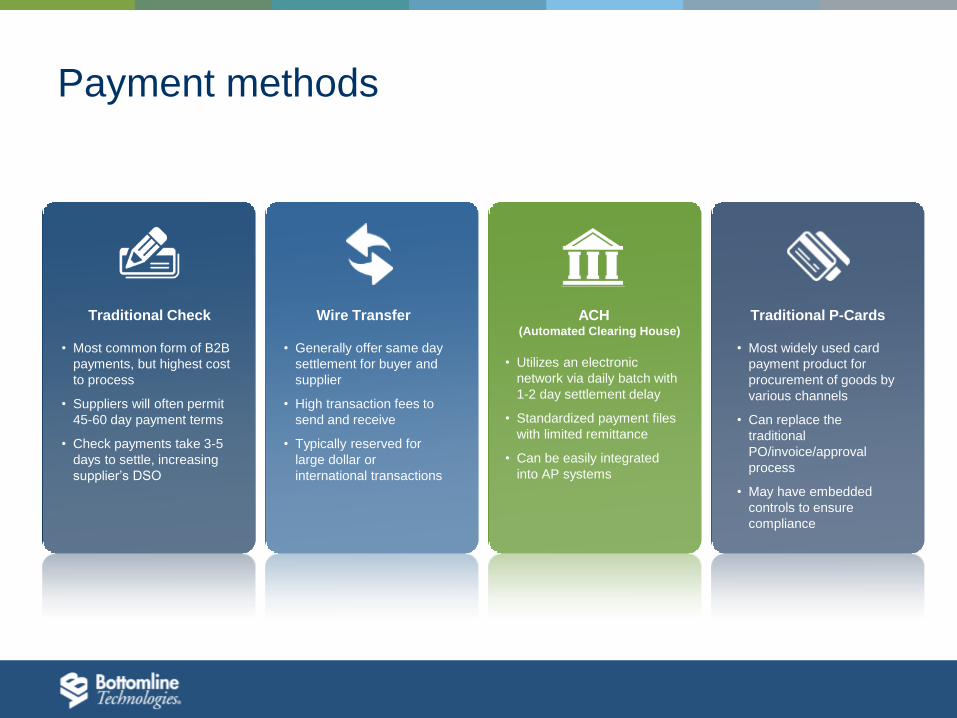
Payment methods
ACH (Automated Clearing House)
• Utilizes an electronic
network via daily batch with
1-2 day settlement delay
• Standardized payment files
with limited remittance
• Can be easily integrated
into AP systems
Wire Transfer
• Generally offer same day
settlement for buyer and
supplier
• High transaction fees to
send and receive
• Typically reserved for
large dollar or
international transactions
Traditional Check
• Most common form of B2B
payments, but highest cost
to process
• Suppliers will often permit
45-60 day payment terms
• Check payments take 3-5
days to settle, increasing
supplier’s DSO
Traditional P-Cards
• Most widely used card
payment product for
procurement of goods by
various channels
• Can replace the
traditional
PO/invoice/approval
process
• May have embedded
controls to ensure
compliance
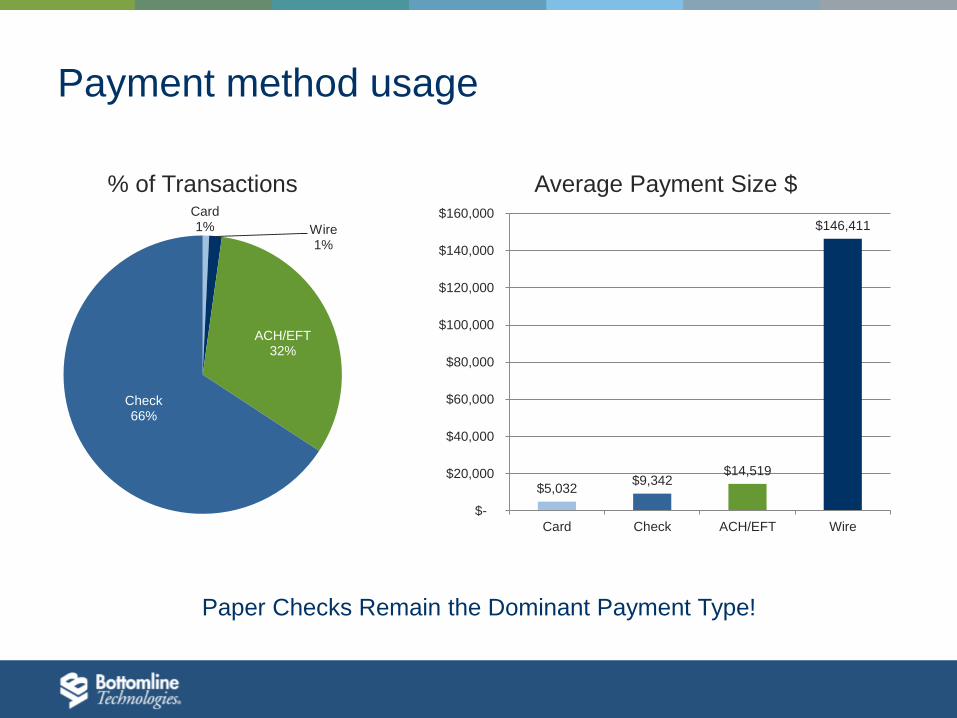
Payment method usage
$5,032 $9,342
$14,519
$146,411
$-
$20,000
$40,000
$60,000
$80,000
$100,000
$120,000
$140,000
$160,000
Card Check ACH/EFT Wire
Average Payment Size $ Card 1% Wire
1%
ACH/EFT 32%
Check 66%
% of Transactions
Paper Checks Remain the Dominant Payment Type!
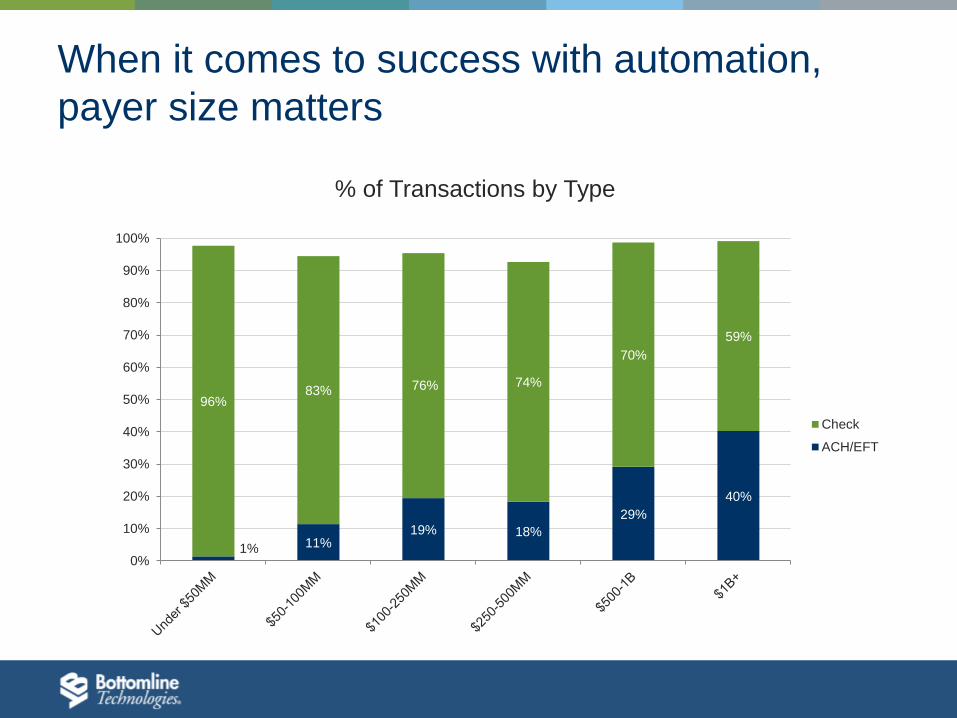
When it comes to success with automation,
payer size matters
1% 11% 19% 18%
29%
40%
96% 83% 76% 74%
70%
59%
0%
10%
20%
30%
40%
50%
60%
70%
80%
90%
100%
Check
ACH/EFT
% of Transactions by Type
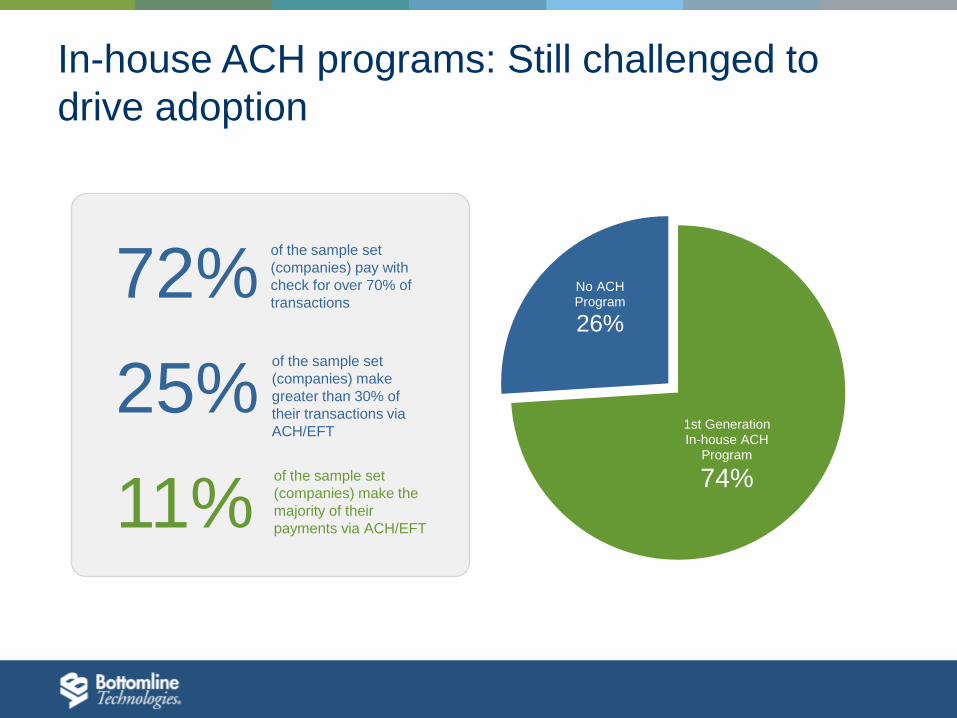
In-house ACH programs: Still challenged to
drive adoption
1st Generation In-house ACH
Program
74%
No ACH Program
26%
72%
25%
11%
of the sample set
(companies) pay with
check for over 70% of
transactions
of the sample set
(companies) make
greater than 30% of
their transactions via
ACH/EFT
of the sample set
(companies) make the
majority of their
payments via ACH/EFT
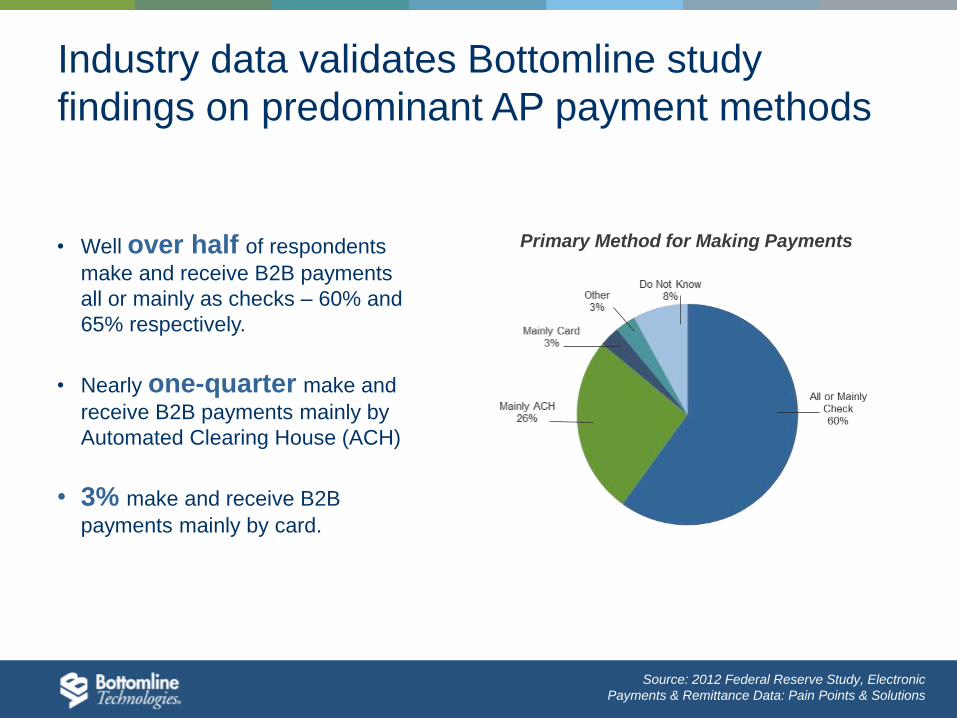
Industry data validates Bottomline study
findings on predominant AP payment methods
Source: 2012 Federal Reserve Study, Electronic
Payments & Remittance Data: Pain Points & Solutions
Primary Method for Making Payments • Well over half of respondents
make and receive B2B payments
all or mainly as checks – 60% and
65% respectively.
• Nearly one-quarter make and
receive B2B payments mainly by
Automated Clearing House (ACH)
• 3% make and receive B2B
payments mainly by card.
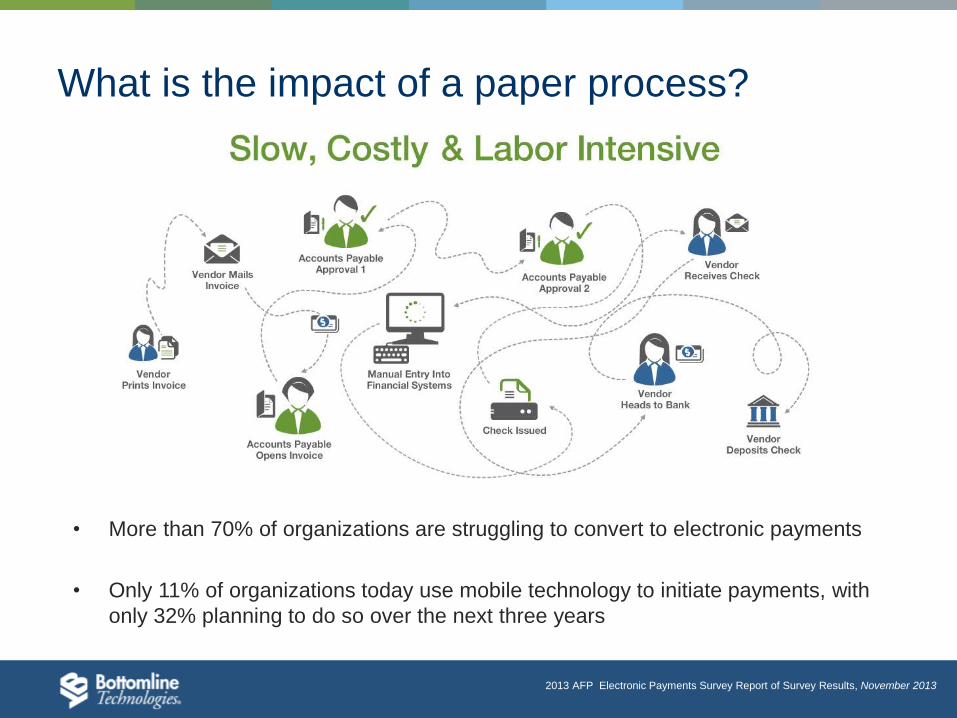
What is the impact of a paper process?
• More than 70% of organizations are struggling to convert to electronic payments
• Only 11% of organizations today use mobile technology to initiate payments, with
only 32% planning to do so over the next three years
2013 AFP Electronic Payments Survey Report of Survey Results, November 2013
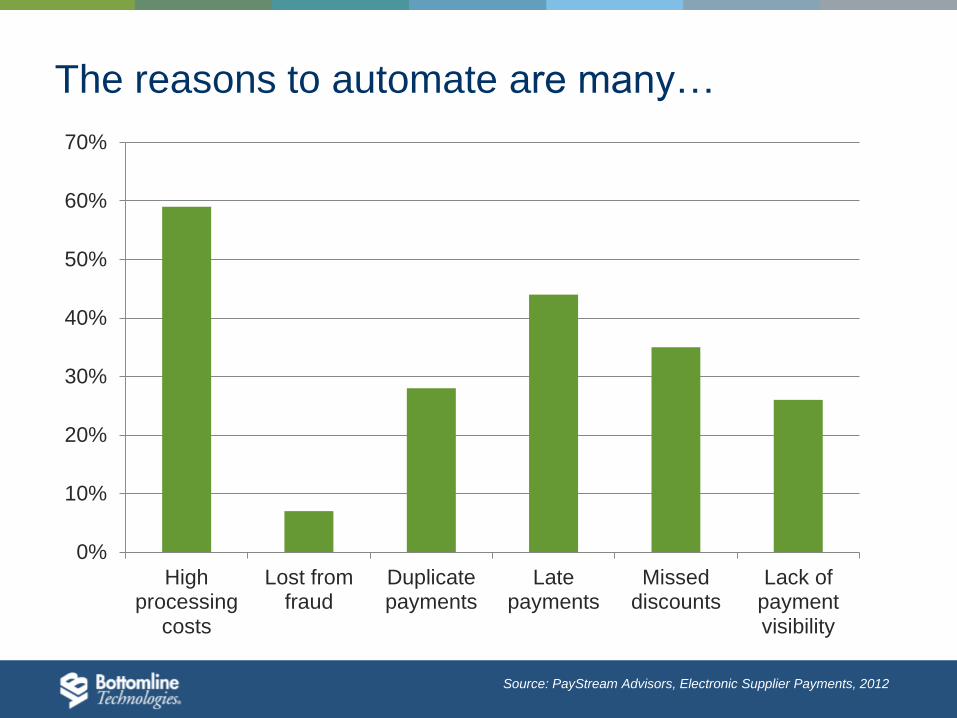
The reasons to automate are many…
0%
10%
20%
30%
40%
50%
60%
70%
Highprocessing
costs
Lost fromfraud
Duplicatepayments
Latepayments
Misseddiscounts
Lack ofpaymentvisibility
Source: PayStream Advisors, Electronic Supplier Payments, 2012
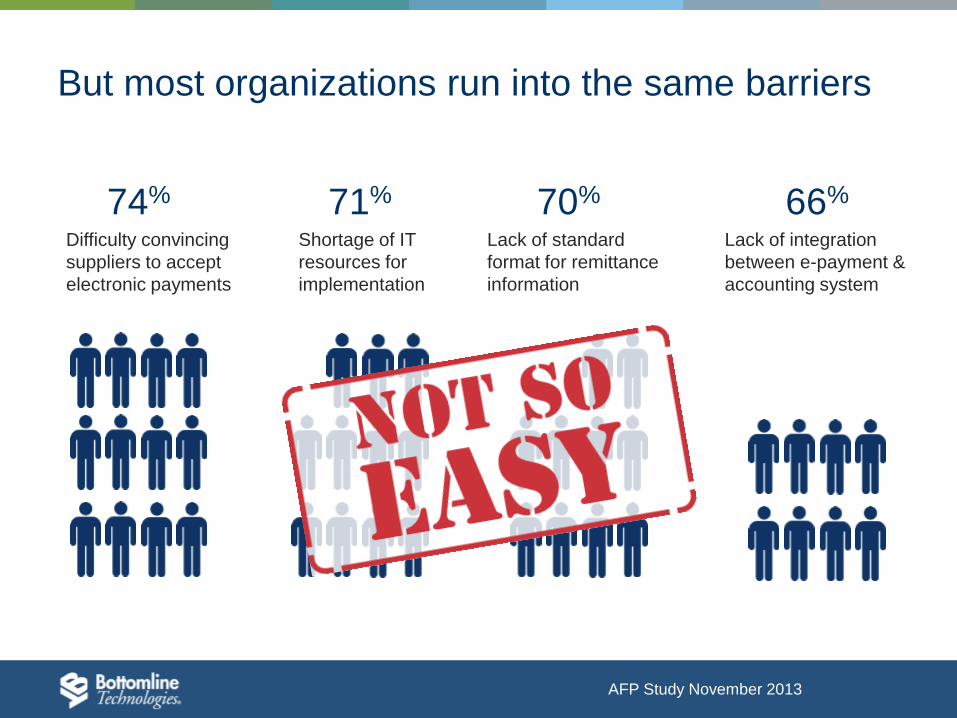
But most organizations run into the same barriers
Difficulty convincing
suppliers to accept
electronic payments
Shortage of IT
resources for
implementation
Lack of standard
format for remittance
information
Lack of integration
between e-payment &
accounting system
74% 71% 70% 66%
AFP Study November 2013
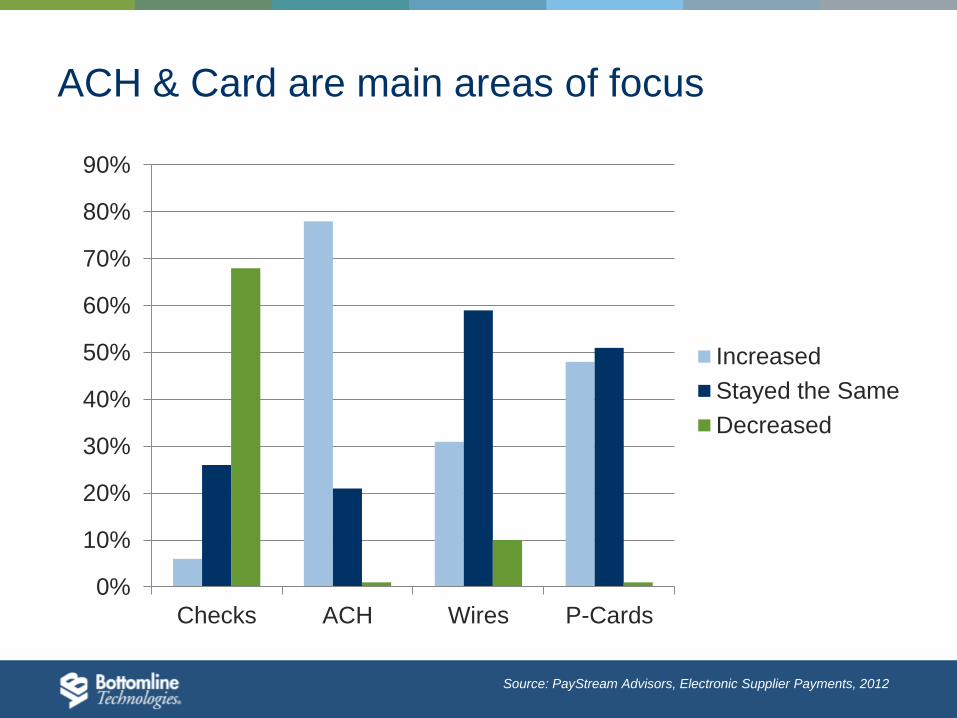
ACH & Card are main areas of focus
0%
10%
20%
30%
40%
50%
60%
70%
80%
90%
Checks ACH Wires P-Cards
Increased
Stayed the Same
Decreased
Source: PayStream Advisors, Electronic Supplier Payments, 2012
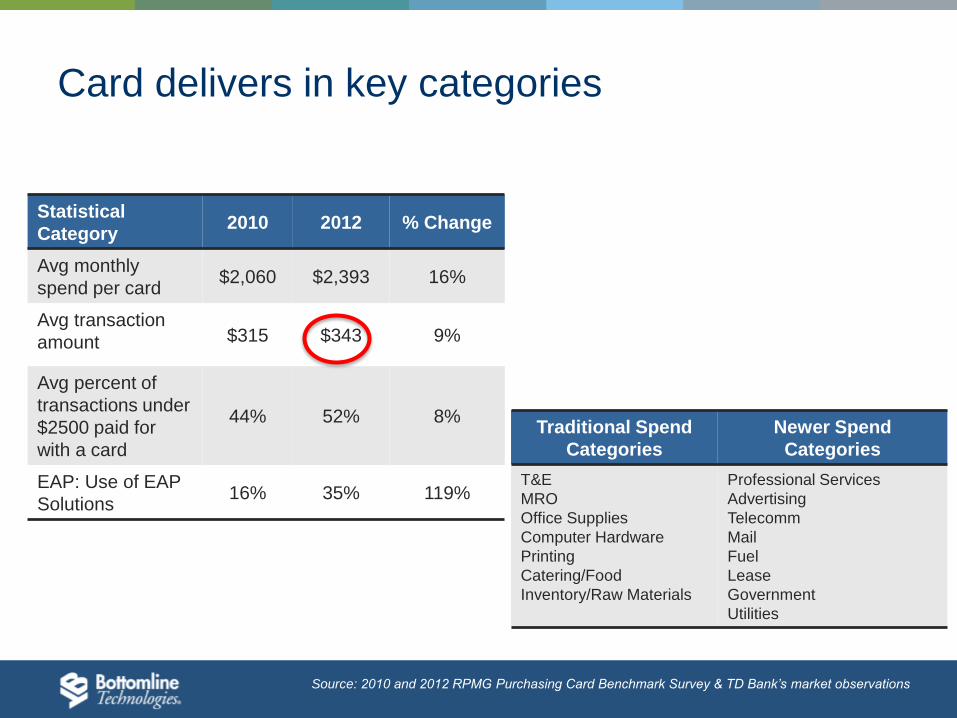
Card delivers in key categories
Statistical
Category 2010 2012 % Change
Avg monthly
spend per card $2,060 $2,393 16%
Avg transaction
amount $315 $343 9%
Avg percent of
transactions under
$2500 paid for
with a card
44% 52% 8%
EAP: Use of EAP
Solutions 16% 35% 119%
Traditional Spend
Categories
Newer Spend
Categories
T&E
MRO
Office Supplies
Computer Hardware
Printing
Catering/Food
Inventory/Raw Materials
Professional Services
Advertising
Telecomm
Fuel
Lease
Government
Utilities
Source: 2010 and 2012 RPMG Purchasing Card Benchmark Survey & TD Bank’s market observations
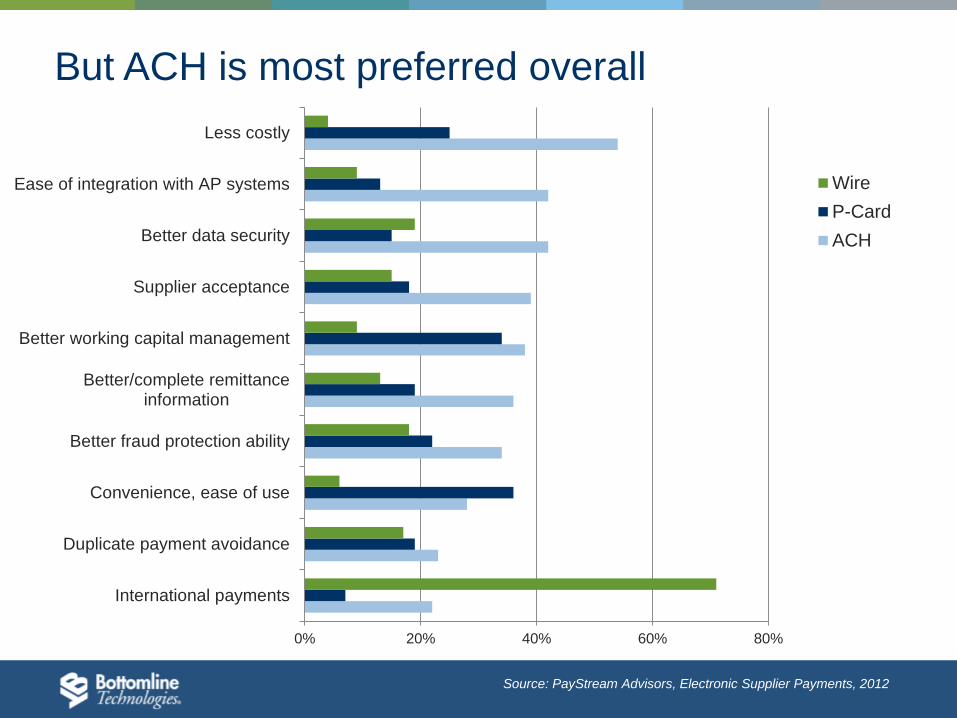
0% 20% 40% 60% 80%
International payments
Duplicate payment avoidance
Convenience, ease of use
Better fraud protection ability
Better/complete remittanceinformation
Better working capital management
Supplier acceptance
Better data security
Ease of integration with AP systems
Less costly
Wire
P-Card
ACH
But ACH is most preferred overall
Source: PayStream Advisors, Electronic Supplier Payments, 2012

Opportunities & Trends in AP
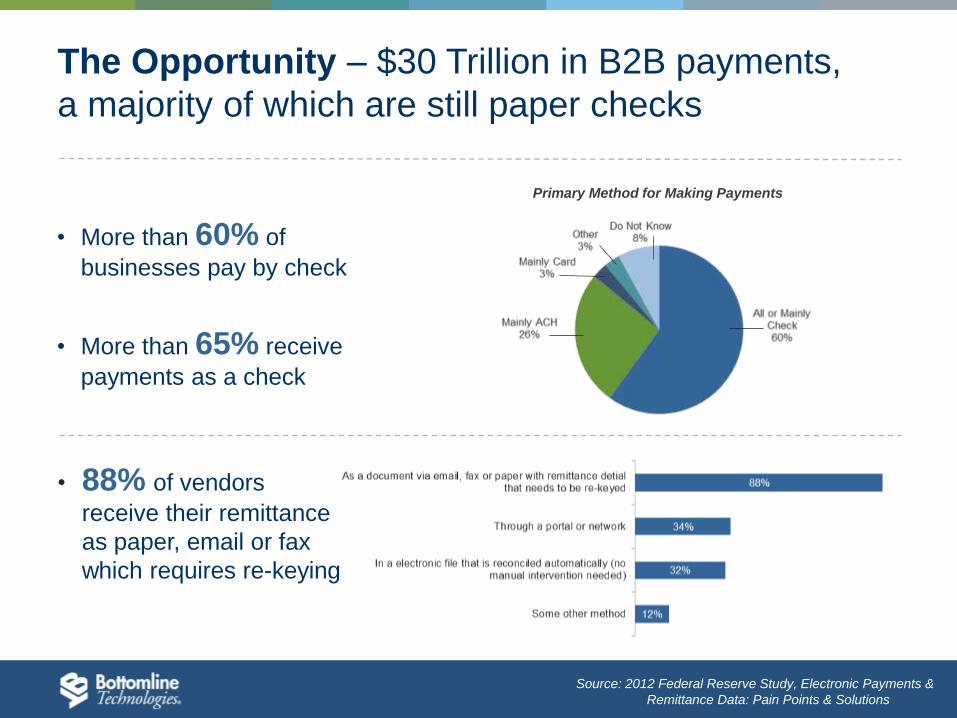
The Opportunity – $30 Trillion in B2B payments,
a majority of which are still paper checks
• More than 60% of
businesses pay by check
• More than 65% receive
payments as a check
Source: 2012 Federal Reserve Study, Electronic Payments &
Remittance Data: Pain Points & Solutions
Primary Method for Making Payments
• 88% of vendors
receive their remittance
as paper, email or fax
which requires re-keying
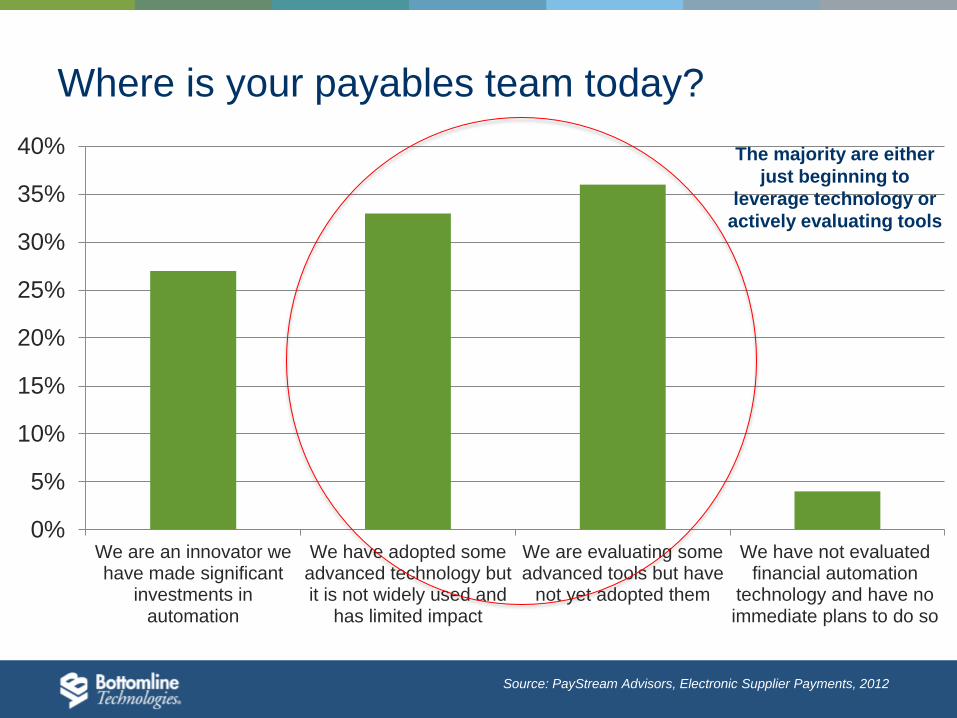
Where is your payables team today?
0%
5%
10%
15%
20%
25%
30%
35%
40%
We are an innovator wehave made significant
investments inautomation
We have adopted someadvanced technology butit is not widely used and
has limited impact
We are evaluating someadvanced tools but have
not yet adopted them
We have not evaluatedfinancial automation
technology and have noimmediate plans to do so
The majority are either
just beginning to
leverage technology or
actively evaluating tools
Source: PayStream Advisors, Electronic Supplier Payments, 2012
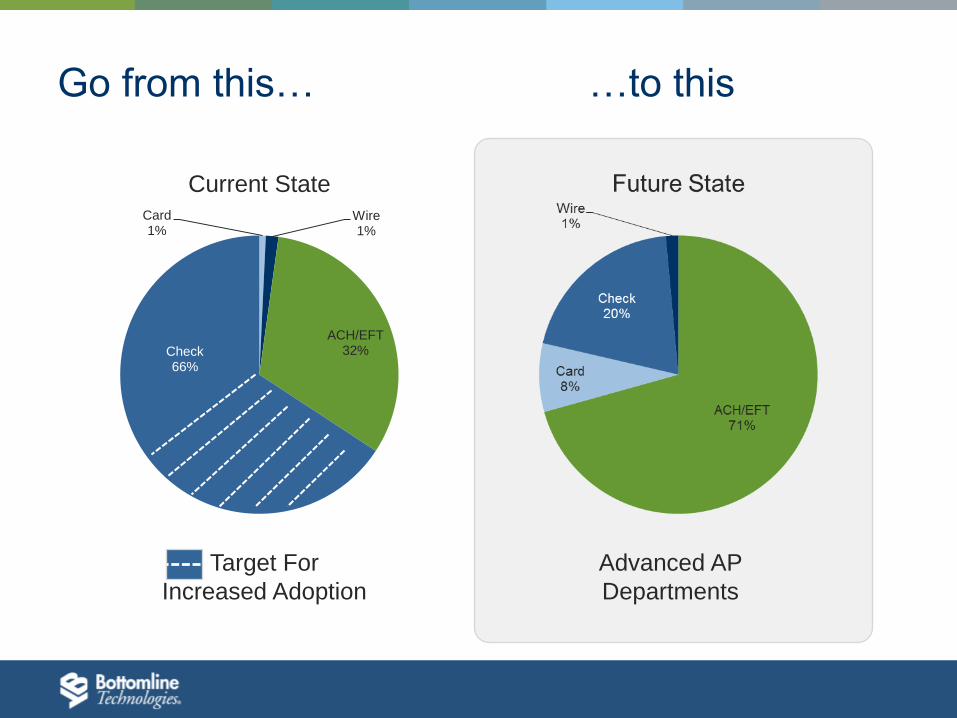
Go from this… …to this
Card 1%
Wire 1%
ACH/EFT 32% Check
66%
Current State
Advanced AP
Departments
Target For
Increased Adoption
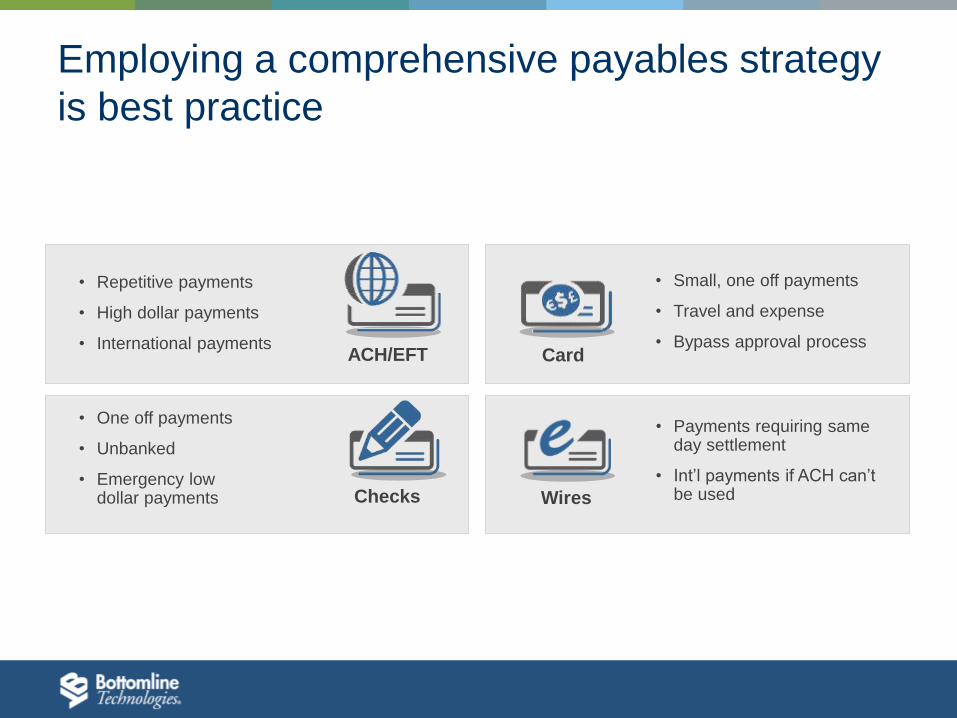
Employing a comprehensive payables strategy
is best practice
• One off payments
• Unbanked
• Emergency low dollar payments
• Repetitive payments
• High dollar payments
• International payments
• Payments requiring same day settlement
• Int’l payments if ACH can’t be used
Card ACH/EFT
Wires
• Small, one off payments
• Travel and expense
• Bypass approval process
Checks
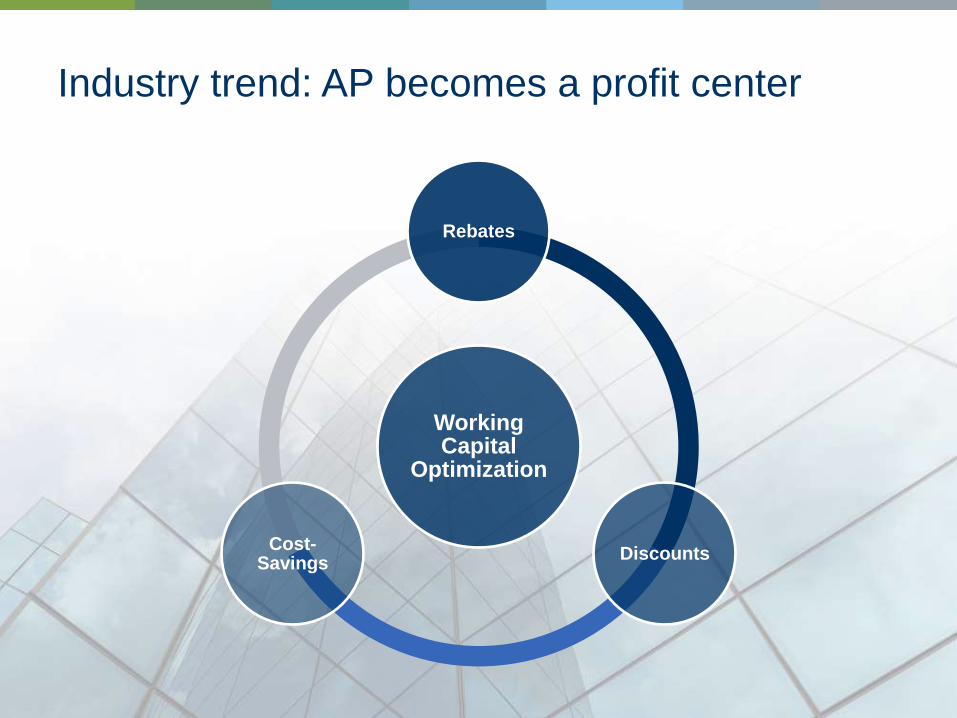
Industry trend: AP becomes a profit center
Working Capital
Optimization
Rebates
Discounts Cost-
Savings
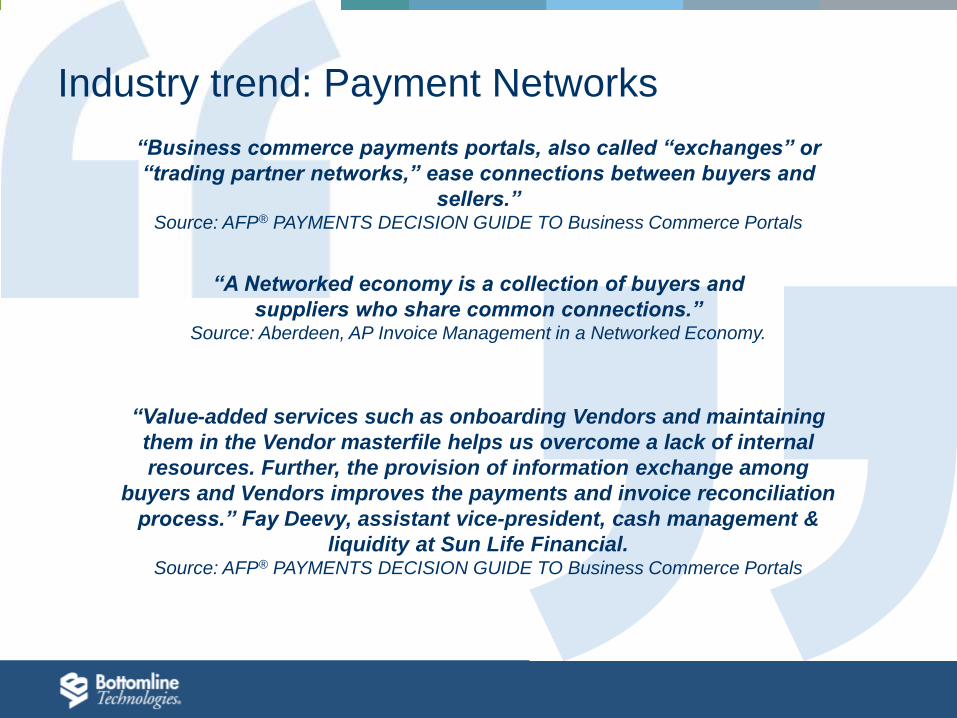
“Business commerce payments portals, also called “exchanges” or
“trading partner networks,” ease connections between buyers and
sellers.” Source: AFP® PAYMENTS DECISION GUIDE TO Business Commerce Portals
“A Networked economy is a collection of buyers and
suppliers who share common connections.” Source: Aberdeen, AP Invoice Management in a Networked Economy.
“Value-added services such as onboarding Vendors and maintaining
them in the Vendor masterfile helps us overcome a lack of internal
resources. Further, the provision of information exchange among
buyers and Vendors improves the payments and invoice reconciliation
process.” Fay Deevy, assistant vice-president, cash management &
liquidity at Sun Life Financial. Source: AFP® PAYMENTS DECISION GUIDE TO Business Commerce Portals
Industry trend: Payment Networks
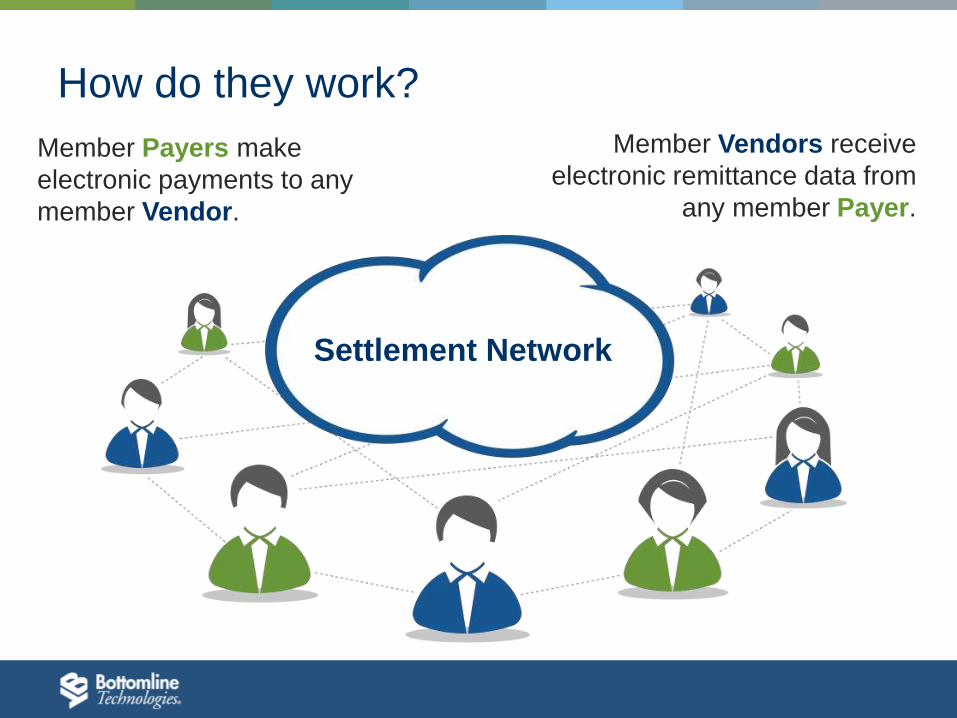
Member Payers make
electronic payments to any
member Vendor.
Member Vendors receive
electronic remittance data from
any member Payer.
Settlement Network
How do they work?
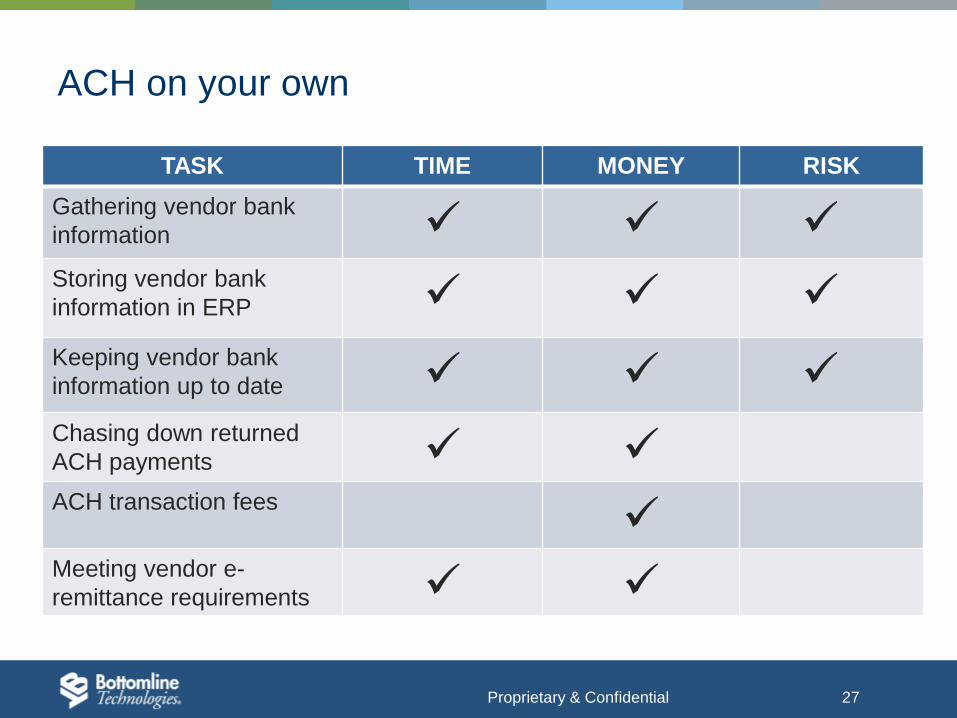
ACH on your own
TASK TIME MONEY RISK
Gathering vendor bank
information Storing vendor bank
information in ERP Keeping vendor bank
information up to date Chasing down returned
ACH payments ACH transaction fees
Meeting vendor e-
remittance requirements
Proprietary & Confidential 27
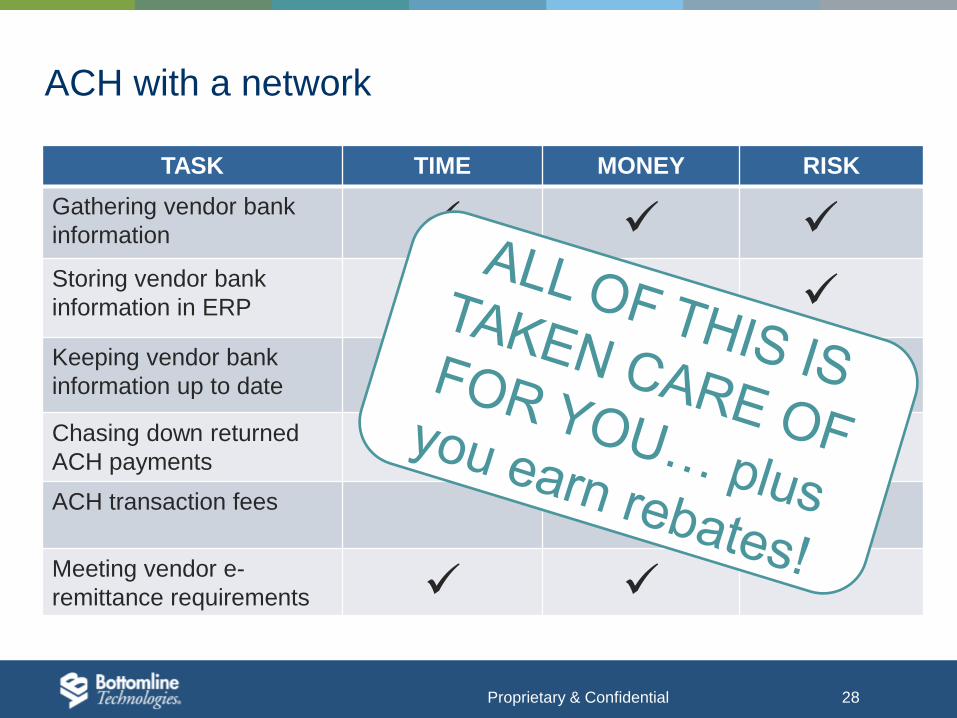
ACH with a network
TASK TIME MONEY RISK
Gathering vendor bank
information Storing vendor bank
information in ERP Keeping vendor bank
information up to date Chasing down returned
ACH payments ACH transaction fees
Meeting vendor e-
remittance requirements
Proprietary & Confidential 28
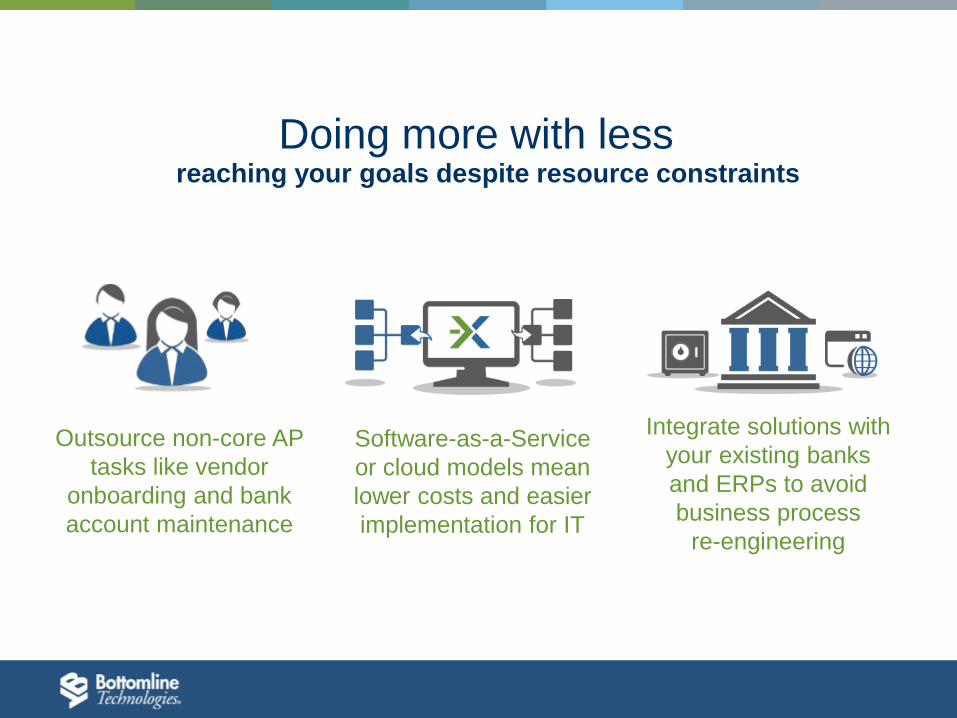
Software-as-a-Service
or cloud models mean
lower costs and easier
implementation for IT
Integrate solutions with
your existing banks
and ERPs to avoid
business process
re-engineering
Outsource non-core AP
tasks like vendor
onboarding and bank
account maintenance
reaching your goals despite resource constraints
Doing more with less
What are network members experiencing?
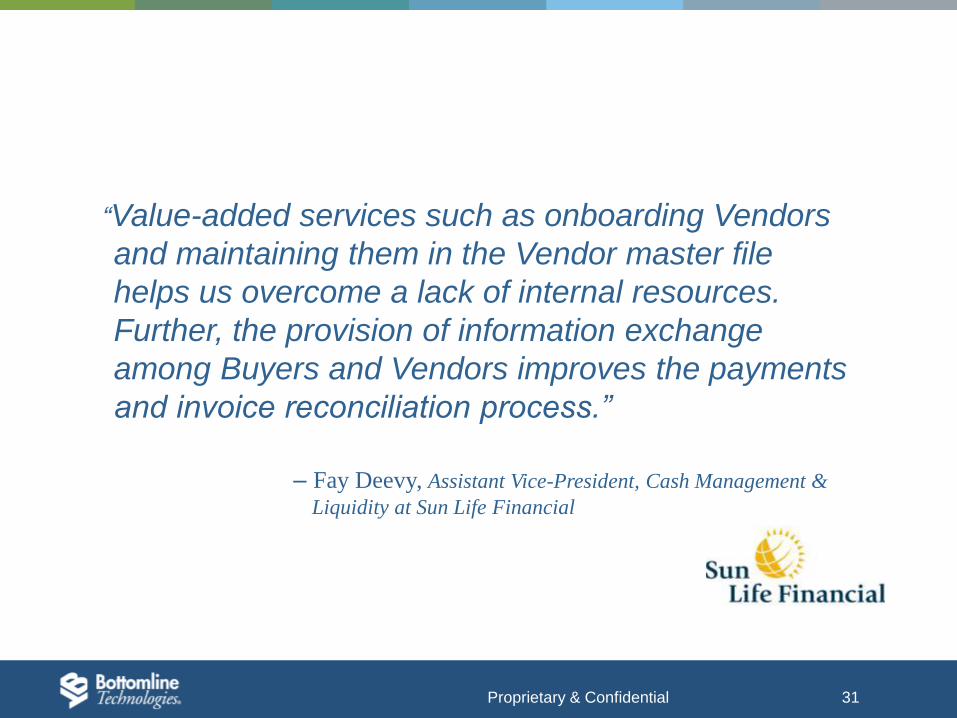
“Value-added services such as onboarding Vendors
and maintaining them in the Vendor master file
helps us overcome a lack of internal resources.
Further, the provision of information exchange
among Buyers and Vendors improves the payments
and invoice reconciliation process.”
– Fay Deevy, Assistant Vice-President, Cash Management &
Liquidity at Sun Life Financial
Proprietary & Confidential 31
“Eliminating the full time responsibility of housing bank
information and easy installation are things that
attracted us.”
– Mary Clark, Director AP at Glimcher Realty Trust
Proprietary & Confidential 32
Proprietary & Confidential 33
“We had been receiving ACH payments through the network for
a while and knew it to be a valuable service from a vendor’s
perspective. This was a key factor that led us to choosing it as
the means to convert our own AP checks to electronic
payments.
Our vendor onboarding campaign is now under way and is
exactly what we wanted. We’re moving away from paper at a
controlled pace.. it’s very exciting!”
– Shelly Whiting, Director of Accounting at
Compass Minerals
Maximize financial and efficiency gains
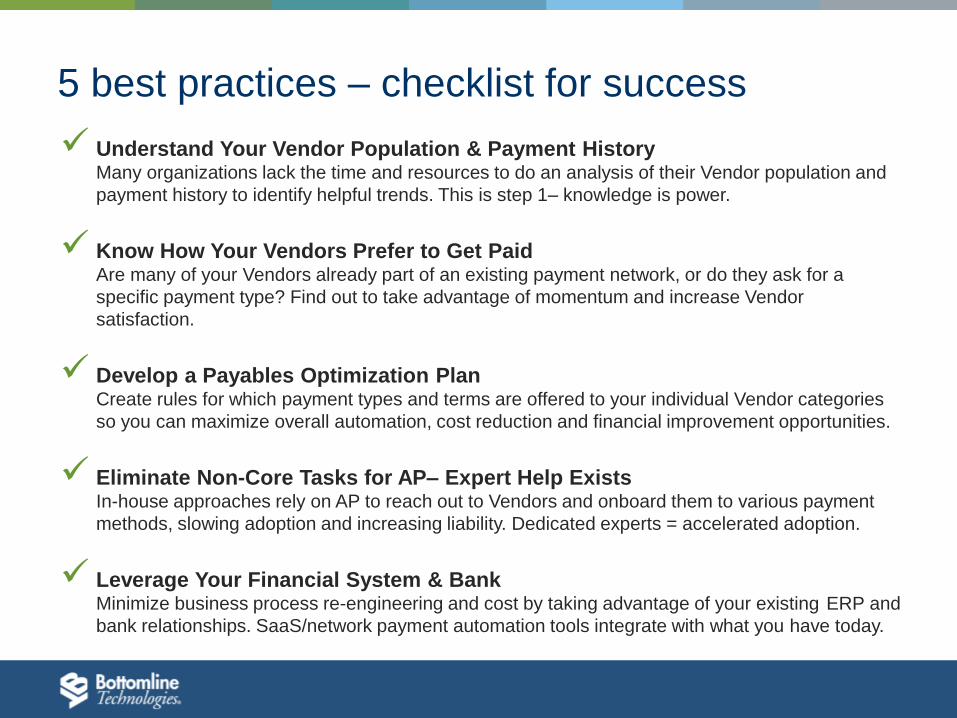
5 best practices – checklist for success
Understand Your Vendor Population & Payment History Many organizations lack the time and resources to do an analysis of their Vendor population and
payment history to identify helpful trends. This is step 1– knowledge is power.
Know How Your Vendors Prefer to Get Paid Are many of your Vendors already part of an existing payment network, or do they ask for a
specific payment type? Find out to take advantage of momentum and increase Vendor
satisfaction.
Develop a Payables Optimization Plan
Create rules for which payment types and terms are offered to your individual Vendor categories
so you can maximize overall automation, cost reduction and financial improvement opportunities.
Eliminate Non-Core Tasks for AP– Expert Help Exists In-house approaches rely on AP to reach out to Vendors and onboard them to various payment
methods, slowing adoption and increasing liability. Dedicated experts = accelerated adoption.
Leverage Your Financial System & Bank
Minimize business process re-engineering and cost by taking advantage of your existing ERP and
bank relationships. SaaS/network payment automation tools integrate with what you have today.
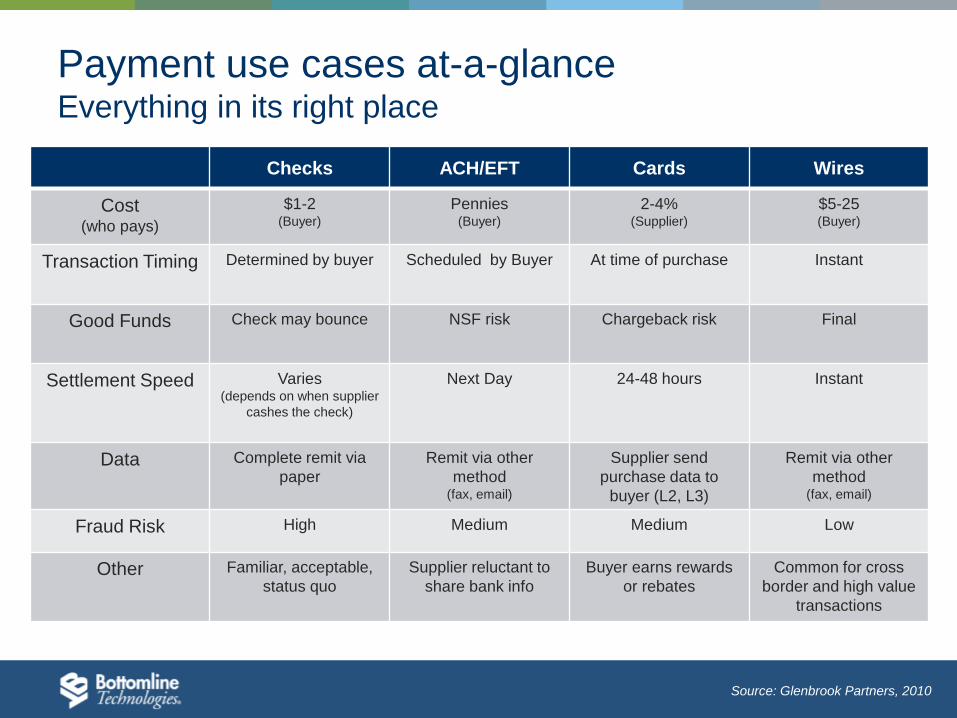
Checks ACH/EFT Cards Wires
Cost (who pays)
$1-2 (Buyer)
Pennies (Buyer)
2-4% (Supplier)
$5-25 (Buyer)
Transaction Timing Determined by buyer Scheduled by Buyer At time of purchase Instant
Good Funds Check may bounce NSF risk Chargeback risk Final
Settlement Speed Varies (depends on when supplier
cashes the check)
Next Day 24-48 hours Instant
Data Complete remit via
paper
Remit via other
method (fax, email)
Supplier send
purchase data to
buyer (L2, L3)
Remit via other
method (fax, email)
Fraud Risk High Medium Medium Low
Other Familiar, acceptable,
status quo
Supplier reluctant to
share bank info
Buyer earns rewards
or rebates
Common for cross
border and high value
transactions
Source: Glenbrook Partners, 2010
Payment use cases at-a-glance Everything in its right place
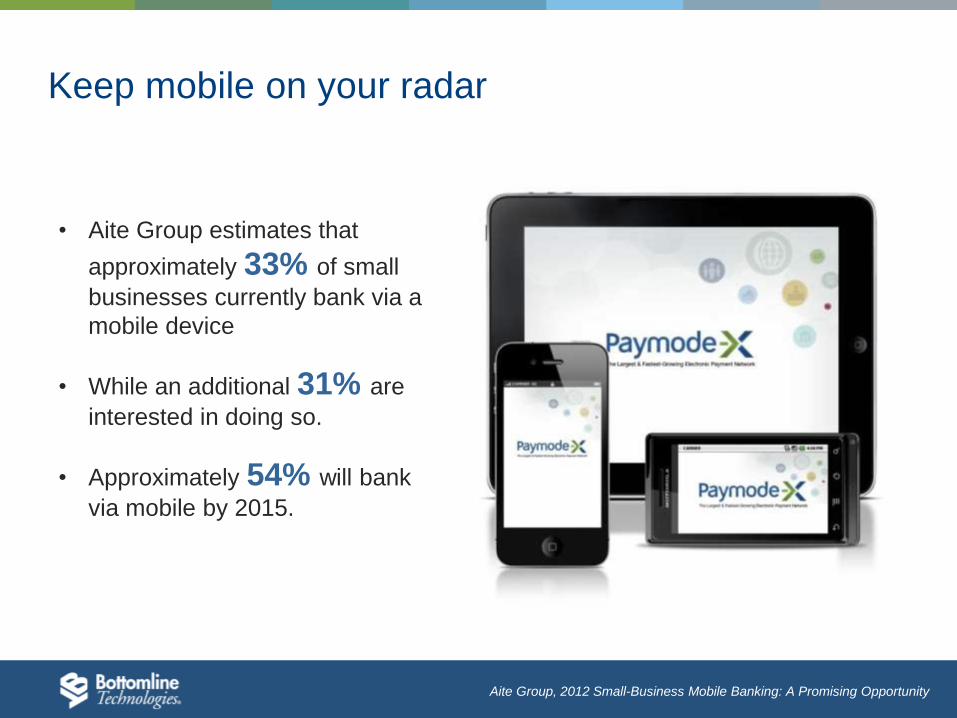
• Aite Group estimates that
approximately 33% of small
businesses currently bank via a
mobile device
• While an additional 31% are
interested in doing so.
• Approximately 54% will bank
via mobile by 2015.
Keep mobile on your radar
Aite Group, 2012 Small-Business Mobile Banking: A Promising Opportunity

Questions?
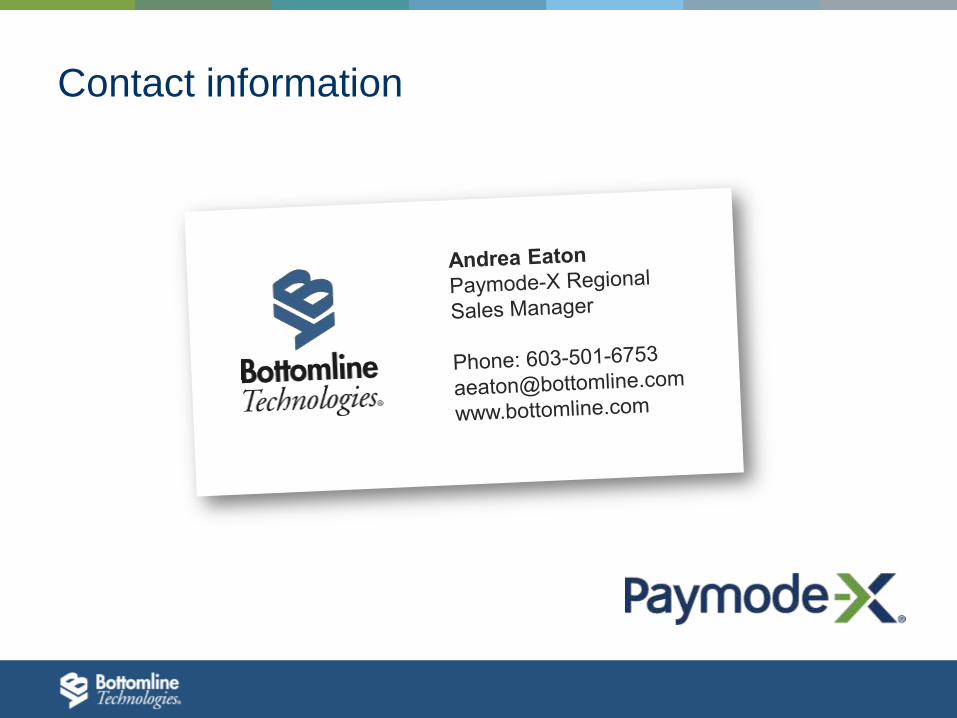
Contact information