Embed Size (px)
Citation preview

Draft
OPTIMIZING THE SELECTION OF SUSTAINABILITY
MEASURES TO MINIMIZE LIFE-CYCLE COST OF EXISTING
BUILDINGS
Journal: Canadian Journal of Civil Engineering
Manuscript ID cjce-2015-0179.R1
Manuscript Type: Article
Date Submitted by the Author: 12-Aug-2015
Complete List of Authors: Abdallah, Moatassem; University of Colorado Denver, Civil Engineering
El-Rayes, Khaled; University of Illinois at Urbana-Champaign, Civil and Environmental Engineering Liu, Liang; University of Illinois at Urbana-Champaign, Civil and Environmental Engineering
Keyword: buildings < Construction, Optimization, Life-cycle Cost, Sustainability, Upgrade Measures
https://mc06.manuscriptcentral.com/cjce-pubs
Canadian Journal of Civil Engineering

Draft
1
OPTIMIZING THE SELECTION OF SUSTAINABILITY MEASURES TO MINIMIZE LIFE-CYCLE COST OF EXISTING BUILDINGS
Moatassem Abdallah a,b, *, Khaled El-Rayes c, Liang Liu c a Department of Civil Engineering, University of Colorado Denver, Denver, CO 80222, United States b Department of Structural Engineering, Cairo University, Egypt,
c Department of Civil and Environmental Engineering, University of Illinois at Urbana–Champaign, Urbana, IL 61801, United States
* Corresponding author. E-mail addresses: [email protected] (M. Abdallah), [email protected] (K. El-Rayes), and [email protected] (L. Liu)
Page 1 of 44
https://mc06.manuscriptcentral.com/cjce-pubs
Canadian Journal of Civil Engineering

Draft
2
Abstract:
Buildings have significant impacts on the environment and economy as they were
reported by the World Business Council for Sustainable Development in 2009 to account for
40% of the global energy consumption. Building owners are increasingly seeking to integrate
sustainability and green measures in their buildings to minimize energy and water consumption
as well as life-cycle cost. Due to the large number of feasible combinations of sustainability
measures, decision makers are often faced with a challenging task that requires them to identify
an optimal set of upgrade measures to minimize the building life-cycle cost. This paper presents
a model for optimizing the selection of building upgrade measures to minimize the life-cycle cost
of existing buildings while complying with owner-specified requirements for building operational
performance and budget constraints. The optimization model accounts for initial upgrade cost,
operational cost and saving, escalation in utility costs, maintenance cost, replacement cost, and
salvage value of building fixtures and equipment, and renewable energy systems. A case study
of a rest area building in the state of Illinois in the United States was analyzed to illustrate the
unique capabilities of the developed optimization model. The main findings of this analysis
illustrate the capabilities of the model in identifying optimal building upgrade measures to
achieve the highest savings of building life-cycle cost within a user-specified upgrade budget;
and generating practical and detailed recommendations on replacing building fixtures and
equipment and installing renewable energy systems.
Keywords: Optimization; existing buildings; energy consumption; life-cycle cost; upgrade
measures; sustainability.
Page 2 of 44
https://mc06.manuscriptcentral.com/cjce-pubs
Canadian Journal of Civil Engineering

Draft
3
INTRODUCTION:
Buildings have significant impacts on the environment and economy as they were
reported by the World Business Council for Sustainable Development in 2009 to account for
40% of the global energy consumption (WBCSD 2009). The same study reported that 80% of
the total energy use of buildings is consumed during their operational life while 20% is
consumed during their construction and demolition in six of the world’s largest economic regions
(Brazil, China, EU, India, Japan and USA) (WBCSD 2009). This highlights the importance of
minimizing energy consumption in existing buildings by integrating green and sustainable
building measures such as motion sensors, ground source heat pumps, photovoltaic systems,
and water saving toilets. Although the integration of these green measures in existing buildings
requires additional investments and costs; they are capable of providing significant savings in
the life-cycle cost of buildings due to their impact on reducing energy and water consumption as
well as building maintenance costs. Due to the large number and combinations of sustainability
measures that can be installed in existing buildings, building owners and managers are often
faced with a challenging task to select an optimal set of sustainable measures to upgrade their
buildings while complying with the limited budget and the existing conditions of their buildings.
This highlights the need for developing an optimization model which is capable of selecting
optimal sustainable building measures from a set of feasible alternatives based on the allocated
upgrade budget and the operational performance of buildings.
Several studies have been conducted to analyze and evaluate the performance of
implementing various sustainable measures in buildings. These studies analyzed energy and
cost savings that can be achieved by installing motion sensors in commercial buildings
(VonNeida, Maniccia, and Tweed 2001); energy savings and performance of energy efficient
lighting in buildings and streets (Henderson 2009; Ryckaert et al. 2012; Lippert 2009; Roberts
2010; Narendran and Gu 2005); feasibility of installing photovoltaic systems and wind power
turbines to generate renewable energy at building sites (Matthews, Cicas, and Aguirre 2004;
Page 3 of 44
https://mc06.manuscriptcentral.com/cjce-pubs
Canadian Journal of Civil Engineering

Draft
4
Chapman and Wiczkowski 2009; James et al. 2011); energy and cost savings of energy efficient
HVAC systems and ground source heat pumps in buildings (Bloomquist 2003; Bloomquist 2001;
Chiasson 2006; Long Ni et al. 2011; Blumsack, Brownson, and Witmer 2009); water savings of
water efficient plumbing fixtures in buildings (GAO 2000). Other research studies focused on
developing optimization models and decision support systems for improving the performance of
existing and new buildings, including optimizing structural and architecture aspects, and the
envelope design of new buildings (Fialho, Hamadi, and Schoenauer 2011; Tuhus-Dubrow and
Krarti 2010; Bichiou and Krarti 2011); evaluating existing building conditions and identifying
optimal decisions of building renovations (O’Donnell et al. 2005; Simmons et al. 2013; Brandt
and Rasmussen 2002; Kaklauskas, Zavadskas, and Raslanas 2005; Juan, Gao, and Wang
2010; Zhang et al. 2013); and optimizing the selection of existing building upgrade decisions to
minimize LEED certification costs (Bastian 2011). Despite the significant contributions of these
studies, there is no reported research that focused on optimizing the selection of sustainability
measures, including light systems, motion sensors, HVAC systems, water heaters, hand dryers,
vending machines and refrigerators, water coolers and PCs, solar PV systems, water faucets,
urinals, and toilets in order to minimize the life-cycle cost of existing buildings while complying
with specified upgrade budgets and building operational performance that specify the required
levels of lighting, space heating and cooling, and water heating. Furthermore, there is no
reported studies that considered the aforementioned list of sustainability measures
simultaneously and accounted for all components of their life-cycle cost including initial upgrade
costs, annual energy and water costs, escalation in utility costs, annual maintenance and repair
costs, replacement costs, electricity savings due to the generation of renewable electricity, and
the salvage value. The aforementioned list of sustainability measures are integrated in the
optimization model to represent the most common feasible upgrade measures for existing
buildings that do not require major reconstruction or renovation of the building envelope while
enabling significant reduction in the building life-cycle cost.
Page 4 of 44
https://mc06.manuscriptcentral.com/cjce-pubs
Canadian Journal of Civil Engineering

Draft
5
OBJECTIVE
The objective of this paper is to present an optimization model that is capable of
selecting building sustainable measures to minimize the life-cycle cost of existing buildings while
maintaining buildings operational performance and complying with an available upgrade budget.
The objective of this model is to support building owners of residential and commercial building
in their ongoing efforts to identify the required upgrade measures to minimize the life-cycle cost
of their existing buildings by reducing the annual energy, water, maintenance, and replacement
costs. The optimization model is developed in three main phases: (i) formulation phase which
formulates the model decision variables, objective function and constraints; (ii) implementation
phase which implements the model using Genetic Algorithms and identifies its input and output
data using a database of building sustainability measures; and (iii) performance evaluation
phase which analyzes and refines the performance of the optimization model using a case study
of an existing public building, as shown in Figure 1. The following sections describe these three
development phases.
FORMULATION PHASE
The decision variables of the developed optimization model are designed to represent
the most common upgrade measures for existing buildings without requiring major
reconstruction or renovation of its building envelope while enabling significant reduction in the
building life-cycle cost. This covers feasible alternatives for upgrading building fixtures and
equipment and the use of renewable energy systems, including combinations of lighting bulbs
and fixtures, motion sensors, HVAC equipment, water heaters, hand dryers, vending machines
and refrigerators, water coolers and PCs, solar panels, solar inverters, water faucets, urinals,
toilets, and percentage of renewable energy that can be generated at the building site to offset
its electricity demand. These building upgrade measures are represented by two types of
Page 5 of 44
https://mc06.manuscriptcentral.com/cjce-pubs
Canadian Journal of Civil Engineering

Draft
6
decision variables: (1) ��� which is an integer decision variable representing the selection of
building fixture or equipment �� in building location � such as a specific building room or space
from a set of feasible alternatives; and (2) ��� which is a real decision variable representing the
percentage of annual renewable energy to the annual building energy demand that need to be
generated at the building site, as shown in Figure 2. The � values of the decision variables ���
depend on the number of locations where a fixture or equipment j is located in the building, and
the values of � depend on the type of the building fixture or equipment, as shown in Figure 2.
For example, ��� represent a combination of light fixture and bulbs at room or space # 10 of the
building.
The objective function of the developed optimization model is designed to minimize the
Life-Cycle Costs (LCC) of existing buildings which is calculated by summing up the LCC of all
building fixtures, equipment, and sustainability measures; as shown in Equation (1), Equation
(2), and Equation (3). The LCC of a building fixture or equipment can be calculated by summing
up all its costs during the study period of the building (Fuller and Petersen 1996), including initial
costs, annual energy and water costs, annual maintenance and repair costs, replacement costs,
electricity savings due to the generation of renewable electricity, and salvage value, as shown in
Figure 3. The initial costs include any capital investment for upgrading the building with
sustainable measures that include purchase and installation costs. The energy and water costs
are calculated based on energy and water consumption, utility rates, and price projection. The
electricity consumption of lighting, hand dryers, vending machines, refrigerators, PCs, and water
coolers are calculated based on the characteristics of the energy devices and operational
schedule and usage of the building. For example, the energy consumption of hand dryers is
calculated based on capacity of the hand dryer, average drying time according to the
manufacturer, and number of uses per day, as shown in Equation (4). The energy consumption
of the HVAC systems and water heaters are calculated in the model using the QUick Energy
Page 6 of 44
https://mc06.manuscriptcentral.com/cjce-pubs
Canadian Journal of Civil Engineering

Draft
7
Simulation Tool “eQUEST” (USDOE 2013). The water consumption of the building is calculated
based on the characteristics of the plumbing fixtures, type of building, and number of occupants.
Maintenance and repair costs are calculated based on available guidelines, such as the Facility
Maintenance and Repair Cost Reference (Whitestone Research 2013). Replacement costs are
calculated based on the purchase and installation costs of building fixtures or equipment and
estimated life of the building fixture or equipment. The salvage value is estimated based on the
remaining value of the building fixture or equipment at the end of its life (Fuller and Petersen
1996). In order to calculate the LCC of existing buildings, all the aforementioned costs of
building fixtures, equipment, and sustainable measures are converted to present worth based
on discount/interest rate. This discount/interest rate can be determined based on the investor’s
rate of return.
��� = ���������� ∗ �����
���
�
���+��������� , ���� �
�
��� Equation (1)
Where: ��� : is building life-cycle cost, �� is number of locations of building fixture or
equipment ��; �������� is LCC of building fixture or equipment ��� which include upgrade costs,
annual energy and water costs, escalation in utility costs, maintenance costs, replacement
costs, and salvage value, as shown in Equation (2); and ��� is number of fixtures of equipment �
at location �; �������� , ���� �is life life-cycle cost of photovoltaic system at building roof (� = 1) or
on the ground (� = 2) which include upgrade costs, maintenance costs, replacement costs,
annual electricity savings, and salvage value, as shown in Equation (3).
�������� = ������� + ������� ∗ ! +�"�#����� ∗ $"#�
#��−�&'#����� ∗ &$#
�
#��∀�
= 1)*10. Equation (2)
Page 7 of 44
https://mc06.manuscriptcentral.com/cjce-pubs
Canadian Journal of Civil Engineering

Draft
8
Where: ������� is upgrade cost of building fixture or equipment ���; ������� is annual operational
cost of building fixture or equipment ��� which include energy or water costs and maintenance
costs; ! is present worth factor of an arithmetic gradient series which can be calculated based
on annual interest rate, escalation rate in utility bills, and number of years of the study period;
"������ is replacement cost of building fixture or equipment ��� ; $"# is present worth of the
future replacement cost - of building fixture or equipment ��� which depends on its expected
future replacement time and the annual interest rate; R is total number of replacements that
depends on the expected service life of the building fixture or equipment in years and the
duration of the study period n in years; &'����� is salvage value of building fixture or equipment
���; and $&# is present worth of the building fixture or equipment salvage value which can be
calculated based on annual interest rate and number of years of the study period.
�������� , ���� � = �������� , ���� � + ������� , ���� � ∗ ! +�"�#����� � ∗ $"#�
#��
+�"�#����� � ∗ $"#�
#��−�&'#����� � ∗ &$#
�
#��−�&'#����� � ∗ &$#
�
#��
− .&����� , ���� � ∗ !
Equation (3)
Where: ������� , ���� �, ������� , ���� �, "������ �, "������ �, &'����� �, /�0&'����� � are upgrade cost,
operational cost, replacement cost of solar panels, replacement cost of inverters, salvage value
of solar panels, and salvage value of solar inverters, respectively; .&����� , ���� � is electricity
savings of photovoltaic system �.
12.� = ∑ 4��5� � ∗ 2��5� � ∗ � 2 ∗ 365�5�=1 Equation (4)
Page 8 of 44
https://mc06.manuscriptcentral.com/cjce-pubs
Canadian Journal of Civil Engineering

Draft
9
Where: 12.�: is hand dryers electricity consumption in Kilowatt-hour, �� is number of locations
of hand dryers, 4��8�� electricity consumption in kilowatts of hand dryer �8 at location � of the
building, 2��8��is average drying time in hours of hand dryer �8� , � 2 is number of uses per
day, and 365 is the number of days per year to calculate the annual energy consumption of
hand dryers.
In order to ensure that the developed optimization model is providing feasible and
practical solutions, four types of optimization constraints were integrated: (i) upgrade budget
constraint, (ii) operational performance constraint, (iii) photovoltaic system constraints, and (iv)
decision variables constraint. The upgrade budget constraint is integrated in the model to
ensure that the upgrade cost of replacing existing building fixtures and equipment or installing
renewable energy systems do not exceed the available upgrade budget, as shown in Equation
(5).
�� ≤ ∑ ∑ ������� ∗ ��� + ∑ �������� , ���� ����������
���� Equation (5)
Where:��: is building upgrade costs.
The operational performance constraint is integrated in the model to ensure that the
operational performance of the building is maintained after performing replacements of building
fixtures and equipment such as light levels in lumens output per fixture, space heating capacity
in KBTUs, space cooling capacity in tons, and water heating capacity in gallons. The developed
model is also designed to provide flexibility to decision makers by allowing them to identify a
predefined reduction in the existing building performance. For example, the optimization model
maintains the cooling and heating performance of buildings or allowing a predefined reduction
by allowing the replacement of HVAC equipment with equivalent or reduced cooling and heating
capacities, as shown in Equation (6) and Equation (7). Similarly, the optimization model is
Page 9 of 44
https://mc06.manuscriptcentral.com/cjce-pubs
Canadian Journal of Civil Engineering

Draft
10
designed to maintain similar performance or allow a predefined reduction from the existing
operational performance for interior lighting, exterior lighting, and water heaters. It should be
that these predefined reductions, if any, should be carefully analyzed and specified by the user
to ensure that the building performance after completing the building upgrade will satisfy all its
operational requirements. For example, if the user specify that the allowed percentage reduction
of the HVAC system cooling capacity is 10%, then the model will consider all HVAC systems
that provide 90% or more cooling capacity than the capacity of the existing HVAC system as
feasible alternatives without verifying whether they are capable of satisfying the required
building cooling loads or not.
∑ �**:��.;�� ∗ (1 − R>) ≥ �**:�(�;� )�@��� Equation (6)
∑ 1A/)�(.;�) ∗ (1 − RB) ≥ 1A/)�(�;� )�@��� Equation (7)
Where: �**:�(.;�) is the cooling capacity of existing HVAC system .; at location � of the
building, R>: is the allowed percentage reduction of the HVAC .;� cooling capacity, �**:�(�;� ) is
the cooling capacity of the possible replacement for the HVAC system .; with �; at location � of
the building, 1A/)��.;�� is the heating capacity of existing HVAC system .; at location � of the
building, RB: is the allowed percentage reduction of the HVAC .;� heating capacity, and
1A/)�(�;� ) is the heating capacity of the possible replacement for the HVAC system .; with �; at location � of the building.
The photovoltaic system constraints are integrated in the model to comply with the
design requirements of the grid connected photovoltaic system. For example, the model
integrates a constraint to ensure that the selected components of the photovoltaic systems are
capable of generating the specified percentage of renewable energy ��� that can be generated
at the building site, as shown in Equation (8). Similarly, other constraints were integrated in the
Page 10 of 44
https://mc06.manuscriptcentral.com/cjce-pubs
Canadian Journal of Civil Engineering

Draft
11
model to comply with the design requirements of the photovoltaic system, including the required
number and area of parallel and series panels, and number of inverters. It should be noted that
the model is designed to enable decision makers to consider two photovoltaic systems which
can be placed on building roof (� = 1) and/or on the ground (� = 2).
��� ∗ .� ≤�� !2&D�,E ∗ 2E ∗ F����� � ∗ n��� ∗ )E,HIIJ ∗ 0 ∗ A�,HIKJ ∗��
E��F
�
���∗ 10LM Equation (8)
Where: .� is building annual electricity consumption in Kwh, !2&D�,E is average daily solar
insolation in month N at location � of the building based on the tilt and orientation angle of solar
panels and location of the building in peak sun hours which can be calculated based on
available online tools such as National Renewable Energy Laboratory and GAISMA (NREL
2010; GIASMA 2014), 2E is number of days per month N, F����� � is energy production of single
solar panel ���� at location � of the building in watts, n��� is number of solar panels at location � of
the building, )E,HIIJ is derating factor of the daily temperature effect in month N for solar panel
���� , on the electricity production of solar panels ���� , d is derating factor of the dirt and snow
effect on the electricity production of solar panels, A�,HIKJ is derating factor of the inverter
efficiency ���� for converting DC current to AC current at location � of the building, F is derating
factor of DC and AC wiring in a PV system, 2 is number of photovoltaic systems at the building
site, and 10LM is a conversion factor that converts the generated renewable electricity from wh
to Kwh.
The decision variables constraints are integrated in the model to set the boundaries of all
the decision variables. ��� decision variables are set with a lower bound of one to represent the
first feasible alternative for the fixture or equipment at location � of the building, and an upper
bound to represent the total number of alternatives at location � of the building. For example, if
the model database (see implementation section) includes 1500 alternatives of light fixtures, X�Q
Page 11 of 44
https://mc06.manuscriptcentral.com/cjce-pubs
Canadian Journal of Civil Engineering

Draft
12
is set with a lower bound of one to represent the first alternative light fixture at location i, and
upper bound of 1500 to represent that there are 1500 alternative light fixtures at location i of the
building. Any value between 1 and 1500 identifies a unique light fixture alternative that the
model can select and analyze its performance during the optimization computations.
IMPLEMENTATION PHASE
The implementation of the developed optimization model was performed in three main
steps: (i) performing the optimization computations using genetic algorithms; (ii) specifying the
model input and output data; and (iii) creating databases for building fixtures, equipment, and
components of renewable energy systems, as shown in Figure 4.
The computations of the developed optimization model are performed using Genetic
Algorithms (GAs) due to its capability of (1) modeling non-linearity and step changes in the
objective function and constraints of the model, (2) identifying optimal solutions for this type of
problem in a reasonable computational time, and (3) efficiently modeling this specific
optimization problem with the least number of decision variables and constraints even for large
buildings and databases (Aytug and Koehler 1996; Greenhalgh and Marshall 2000; Pendharkar
and Koehler 2007; Goldberg 1989). The developed optimization model uses the commercial
software Evolver add-on for MS Excel to perform the GA computations. MS Excel VBA is used
to manage and coordinate between Evolver and eQUEST to identify the optimal solution of the
problem.
The model is designed to perform replacements of building fixtures and equipment with
more energy and water efficient devices. The solution process starts by searching for feasible
replacements of HVAC equipment and water heaters from an integrated database in the model,
as shown in Figure 4. This process searches for and extracts all feasible alternatives of HVAC
equipment and water heaters from the database that have capacities within a specified range of
1 to 1.1 of the existing capacities of the building equipment. It should be noted that, the model
assumes that the existing HVAC systems satisfy the building needs of space heating and
Page 12 of 44
https://mc06.manuscriptcentral.com/cjce-pubs
Canadian Journal of Civil Engineering

Draft
13
cooling. After identifying those feasible replacements, input files are generated automatically by
the developed optimization model for eQuest based on the identified feasible alternatives for
HVAC systems and water heaters. eQuest is used to run all these input files to calculate the
energy consumption of the building for all its feasible replacements, which are then stored in a
database where it can be recalled and used during the optimization process. It should be noted
that the generated input files of eQuest are created with the energy loads of all the other
existing fixtures such as lighting and hand dryers loads to account for the interaction of building
systems in calculating the energy consumption of the building. Furthermore, the calculation of
energy consumption for all feasible HVAC systems and water heaters are performed before GA
computations to significantly reduce the computation time of the model, as shown in Figure 4.
The optimization computational time is significantly reduced by executing three simulation runs
of each feasible HVAC system, one run including the existing building systems, another run with
the most efficient light systems, and a third run with the most efficient loads of other devices and
equipment. During the optimization computations, the energy consumption of the HVAC system
can be calculated approximately based on the selected building systems and the three
aforementioned simulation runs. The difference between the approximation and exact results
during the calculation of the energy consumption of the HVAC systems were found to be less
1% in the analyzed case study. Accordingly, the computational time of the model is significantly
reduced as it can retrieve the energy consumption of the HVAC systems and water heaters from
the model database rather than running eQuest for each possible solution during the GA
computations.
The GA computations in the model start by generating a population of random solutions
by replacing all the existing fixtures and equipment with feasible alternatives from the model
databases. The fitness of these solutions is evaluated based on the building life-cycle cost and
model constraints. Solutions that satisfy all the model constraints and achieve low building life-
cycle cost are identified as solutions with high fitness values. On the other hand, solutions that
Page 13 of 44
https://mc06.manuscriptcentral.com/cjce-pubs
Canadian Journal of Civil Engineering

Draft
14
do not satisfy the model constraints or have high building life-cycle cost are identified as
infeasible solutions or solutions with low fitness values, respectively. Solutions with high fitness
values are ranked and sorted based on their building life-cycle cost. The GA operators of
selection, cross over, and mutations are then applied and a new set of solutions are generated
with potential for lower life-cycle cost. This process is iteratively repeated until a predefined
number of iterations is completed or no further improvements is achieved within a predefined
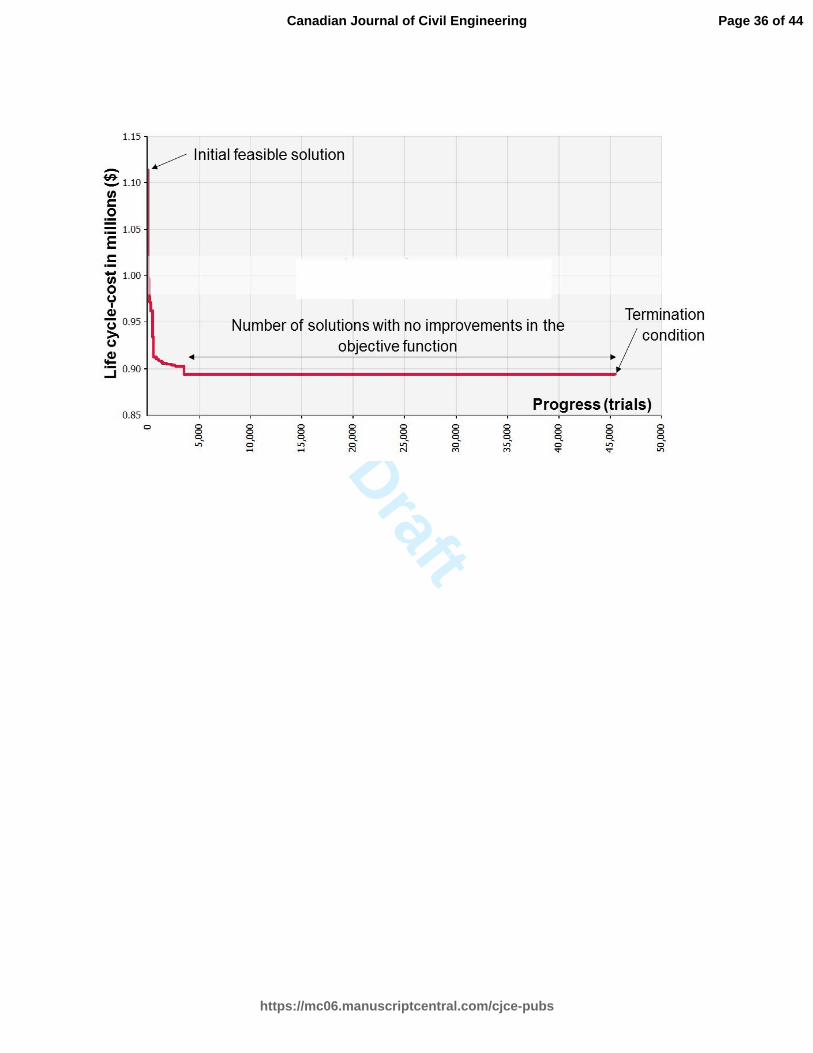
number of iterations, as shown in Figure 5. It should be noted that, the initial population of the
problem and the termination condition are crucial to identify the optimal solution of the problem
in a reasonable computational time where they can be specified based on the length of the GA
string. The length of the GA string (S) can be identified based on the number of building
decision variables and feasible building fixtures and equipment. It should be noted that, the
identification of GA parameters (population size, crossover rate, mutation rate, and iterations)
that leads to the optimal solution of the problem in the shortest computational time is
challenging, however, existing literature recommends that minimum population size and number
of iterations should be 2S /1.4 and 2S, respectively (Thierens, Goldberg, and Pereira 1998;
Reed, Minsker, and Goldberg 2000).
The developed optimization model was implemented in a spreadsheet environment to
facilitate the input of all necessary data and the generation of results and action reports. The
input data of the developed model are designed to include (i) building characteristics such as
geometry, location, building envelop and interior construction, doors and windows, allocation of
building activities, visitation rate, and building operational schedule; (ii) selection of building
fixtures and equipment from the model databases; (iii) billing rates for electricity, gas and water
consumption in $/Kwh, $/therm, and $/gallon, respectively; and (iv) study period, annual
discount rate and escalation in utility rates, as shown in Figure 4. The developed model is
designed to allow decision makers to select building fixtures and equipment from the created
databases to facilitate and minimize building input data where the model analyzes the
Page 14 of 44
https://mc06.manuscriptcentral.com/cjce-pubs
Canadian Journal of Civil Engineering

Draft
15
replacement of these fixtures and equipment during the optimization process. The output results
of the developed optimization model is designed to include (i) building life-cycle cost,
operational costs, and building annual energy and water consumption before and after
minimizing the life-cycle cost of the building, (ii) upgrade costs and payback period after
minimizing the life-cycle cost of the building, and (iii) action report which includes detailed
recommendations for replacing existing building fixtures and equipment based on the results of
the optimization model, as shown in Figure 4.
The developed optimization model is integrated with several databases that include
products of building fixtures, equipment, components of renewable energy systems. These
databases include general product data, cost data, energy and water characteristics data, and
physical characteristics of exterior lighting fixtures and bulbs, interior lighting fixtures and bulbs,
motion sensors, hand dryers, HVAC equipment, water heaters, vending machines and
refrigerators, general devices such as PCs and water coolers, solar panels, solar inverters,
water faucets, urinals, and toilets. For example, the general product characteristics, cost data,
energy characteristics, and physical properties of 10 interior light bulbs in the lighting database
of the developed model are shown in Figure 6. Furthermore, the general product characteristics,
cost data, energy characteristics of 6 solar panels and 8 inverters that are used in the case
study are shown in Figure 7 and Figure 8, respectively. The products of building fixtures and
equipment and their costs in the integrated databases are collected from manufacturers and
retailers. The installation costs of these building fixtures and equipment were calculated using
RSMeans building construction cost data (RSMeans 2013). The model is designed to perform
replacement for the existing building fixtures and equipment with sustainable measures from the
integrated databases. It should be noted that, the developed optimization model and its
databases are designed with the flexibility of integrating new and updated sustainability
measures. This illustrates the practicality of the model and its capability to continuously
Page 15 of 44
https://mc06.manuscriptcentral.com/cjce-pubs
Canadian Journal of Civil Engineering

Draft
16
minimize the life-cycle cost of existing buildings as upgrade budgets are secured and more
sustainable measures become available in the market.
PERFORMANCE EVALUATION PHASE
A case study of an existing highway rest area building was analyzed to illustrate the use
of the developed optimization model, demonstrate its newly developed optimization capabilities,
and evaluate its performance. Built in 1980, the analyzed building has a total area of 3,570
square feet with approximately 840 thousand annual visitors according to a statistical analysis
that was conducted in 2009. The rest area building includes lobby, women’s bathroom, men’s
bathroom, mechanical room, storage room, travel information desk, and technician office. The
building has also a parking lot for visitors that accommodate cars and semi-trucks, and a large
landscaped area and outdoor picnic tables. The building equipment and systems that have the
highest share of its operational costs include interior and exterior lighting, HVAC system, water
heater, hand dryers, vending machines, water coolers, personal computers, surveillance
system, water faucets, urinals, and toilets. This case study was selected to evaluate the model
performance due to its high operational and life-cycle cost that are caused by its inefficient
energy and water fixtures, its continuous operational schedule throughout the year, and its high
visitation rates.
In order to minimize the life-cycle cost of this building using the developed model, its
required input data were identified and provided to the model, as shown in Figure 4. This input
data was obtained from the building drawings and from a site visit of the building to identify (i)
the types of services provided by the rest area; (ii) the conditions and characteristics of its
appliances and fixtures; and (iii) potential savings and energy-efficiency measures that can be
implemented in the building. A sample of the input data that summarizes the main building
characteristics is shown in Table 1. The electricity, gas, and water billing rates as well as the
discount rate are inputted in the model based on the obtained energy and water bills of the
previous year and average discount rates, as shown in Table 2. The input data of building
Page 16 of 44
https://mc06.manuscriptcentral.com/cjce-pubs
Canadian Journal of Civil Engineering

Draft
17
fixtures and equipment were identified based on the data collected during the site visit and by
selecting these fixtures and equipment from the model databases, as shown in Table 3. These
databases include all the needed data by the decision maker to select building fixtures and
equipment, and the required data by the model to perform the optimization computations. The
owner-specified requirements of the building operational performance allowed 5% reduction in
the fixtures light levels and no reduction in the capacities of the HVAC system and water heater.
The rest area building was modeled with 42 decision variables that resulted in a search space of
7.3*1030. This search space represents all possible combinations of the available alternatives in
this case study and can be calculated by multiplying the number of available alternatives As of
each of these 42 decision variables (s) by each other, as shown in Equation (9). The number of
available alternatives As depends on the type of decision variable. For example, the number of
alternatives As for the light fixtures and the hand dryers decision variables in this case study was
1800 and 10, respectively.
&A/-Tℎ&V/TA = W !XX�;�
X�� Equation (9)
The developed model was used to optimize the building upgrade decisions for the rest
area building to minimize its life-cycle cost for a study period of 40 years while considering
various upgrade budgets that ranged from $10K to $125K. The developed model was able to
identify the minimum life-cycle cost for all the specified upgrade budgets, as shown in Figure 9.
For example for the specified upgrade budget of $25,000, the model identified a minimum life-
cycle cost of $746,032 with annual savings of $15,365, and payback period of 1.61 year, as
shown in Figure 9 for solution (a). Based on the results of the model for various upgrade
budgets, the model was able to select building upgrade measures that achieve the highest
savings of building life-cycle cost within the least specified upgrade budget (i.e. $10K). As the
upgrade budget increases, the model selected additional measures that can further reduce the
life-cycle cost of the building, as shown in Figure 9. The population size that was used to
Page 17 of 44
https://mc06.manuscriptcentral.com/cjce-pubs
Canadian Journal of Civil Engineering

Draft
18
perform the optimization computations is 300 with 0.3 and 0.6 crossover and mutation rates,
respectively. The model was set to terminate the optimization computations when 40,000 trials
are reached with no improvements in the model objective function. The computations of the
model were performed using a Personal Computer (PC) with Intel Core(TM) 2 Duo 2.93 GHz
processor and 4GB RAM. Each simulation run required 30 seconds to be called and completed.
The total computational time of the optimization and simulation for solution (a) was 4 hours and
5 minutes, including a total of 45,500 trials with only 19,208 valid trials. The optimal solution was
identified 30 minutes after starting the optimization and then the model spent 3 hours and 35
minutes to search for better solution before terminating the computations, as shown in Figure 5.
Each trail of the optimization required 0.31 seconds to be completed, and therefore the brute
force exhaustive search will require 0.31*7.3*1030 sec. (2.7*1025 days). This highlights the
efficiency and effectiveness of the developed optimization model that was able to identify
optimal solution (a) for this case study (see Figure 5) in 4 hours and 5 minutes compared to the
exhaustive search time that is estimated to take 2.7*1025 days or 7.3*1022 years.
The optimization model also provides the capability of generating an action report that
provides detailed recommendations on the building fixtures and equipment. The report also
identifies the fixtures and equipment that need to be replaced or the renewable energy systems
that need to be installed based on the optimization results. For example, the model provided
detailed recommendations for replacing existing light bulbs and fixtures as well as plumbing
fixtures, as shown in Table 4 and Table 5, respectively. Furthermore, the model is designed to
show a comparison of building energy and water cost before and after minimizing the building
life-cycle cost, as shown in Figure 10. It should be noted that the model did not recommend
replacements of exterior lighting bulbs and fixtures as the available alternatives in the databases
cannot provide the required lumen level with lower energy consumption. Similarly, the model did
Page 18 of 44
https://mc06.manuscriptcentral.com/cjce-pubs
Canadian Journal of Civil Engineering

Draft
19
not recommend replacements for water faucets as the existing faucets have the lowest
discharge rate in the model database.
Limitations and Future Work
The present optimization model in this study is designed to support building owners in
their ongoing efforts to identify the required upgrade measures to minimize the life-cycle cost of
existing buildings by reducing the annual energy, water, maintenance, and replacement costs.
The present model is designed for buildings that needs to remain in use and operational during
the upgrade period and therefore the model focuses on optimizing the selection of upgrade
measures that do not require major renovation or reconstruction of existing buildings that may
disrupt its ongoing operation. Accordingly, the upgrade measures in the present model are
limited to light systems, motion sensors, HVAC systems, water heaters, hand dryers, vending
machines and refrigerators, water coolers and PCs, solar PV systems, water faucets, urinals,
and toilets. Future expansion of the model may consider other types of buildings that permit
disruption of its ongoing use and operation. For this type of buildings, future expansion of the
model can consider additional upgrade measures such as building envelope, windows and
doors, solar water heaters, and solar tube lighting. Furthermore, the developed optimization
model focuses on optimizing the life-cycle cost of existing buildings. Future expansion of the
model can extend its scope to include optimizing the life-cycle cost of new buildings.
SUMMARY AND CONCLUSIONS
An optimization model was developed to enable the selection of an optimal set of
sustainability measures for existing buildings in order to minimize their life-cycle cost while
complying with the limited availability of upgrade budgets. The model is designed to identify this
optimal set of sustainability measures from feasible alternatives that include renewable energy
systems such as solar panels, energy efficient equipment and systems such as LED lighting
and efficient HVAC systems, and water-saving plumbing fixtures such as efficient faucets and
toilets. The model minimizes building life-cycle costs, including sustainability measures upgrade
Page 19 of 44
https://mc06.manuscriptcentral.com/cjce-pubs
Canadian Journal of Civil Engineering

Draft
20
costs, energy and water costs, escalation in utility costs, maintenance costs, replacement costs,
annual savings due to generated electricity from renewable energy systems, and salvage
values. The initial investment, maintenance, and replacement costs of building fixtures and
equipment are obtained from an expandable database that includes all the required data such
as available options of sustainable measures on the market. The model calculates the energy
costs of the HVAC systems and water heaters in the building using an energy simulation
program (eQuest) and utility rates. It also calculates the electricity cost of building fixtures such
as lighting, hand dryers, vending machines, personal computers, and water coolers based on
the characteristics of these fixtures, their operational schedule, and utility rate.
The optimization computations in the model were performed using Genetic Algorithms
(GA) due to the non-linearity of the objective function and constraints. The optimization model
was implemented in a spreadsheet environment to facilitate the input of all necessary data and
the generation of results and action reports. An application example of an existing rest area
building was analyzed to evaluate the performance of the developed model. The results of this
analysis illustrated that model was able to identify an optimal set of sustainability for each of the
specified upgrade budgets that ranged from $10K to $125K. The model is designed to provide
the optimization results in a graphical and tabular format which include: (i) life-cycle costs,
operational costs, upgrade costs, and payback period; (ii) recommendations for replacing
existing building fixtures and equipment based on the optimization results, and (iii) building
energy and water cost before and after optimizing the building performance. The developed
model is capable of minimizing the life-cycle cost of existing residential and commercial
buildings at any location. The model is designed to account for the location of the building based
on the weather conditions that can be integrated in eQuest energy simulation software. The new
and unique capabilities of the developed model demonstrate a new integrated approach that will
be useful to building owners and managers in their ongoing efforts to reduce the life-cycle cost
of existing buildings and minimize their energy and water consumption. The primary contribution
Page 20 of 44
https://mc06.manuscriptcentral.com/cjce-pubs
Canadian Journal of Civil Engineering

Draft
21
of this research is its new methodology for optimizing the selection of building upgrade
measures to minimize the life-cycle cost of existing buildings while complying with owner-
specified requirements for building operational performance and budget constraints. Future
expansion of the model and more in-depth analysis are needed to further study the impact of (1)
integrating additional upgrade measures for existing buildings such as building envelope,
windows and doors; and (2) optimizing the design of new buildings.
Page 21 of 44
https://mc06.manuscriptcentral.com/cjce-pubs
Canadian Journal of Civil Engineering

Draft
22
REFERENCES
Aytug, Haldun, and Gary J. Koehler. 1996. “Stopping Criteria for Finite Length Genetic Algorithms.” INFORMS Journal on Computing 8 (2). INFORMS: 183–191. doi:10.1287/ijoc.8.2.183.
Bastian, Nathaniel D. 2011. “Optimizing Army Sustainability at Fort Bragg: A Case Study Connecting Life-Cycle Cost Analysis with Leadership in Energy and Environmental Design for Existing Buildings.” Engineering Management Journal 23 (2): 42–53.
Bichiou, Youssef, and Moncef Krarti. 2011. “Optimization of Envelope and HVAC Systems Selection for Residential Buildings.” Energy and Buildings 43 (12): 3373–3382. http://www.sciencedirect.com/science/article/pii/S0378778811003811.
Bloomquist, R Gordon. 2001. “The Economics of Geothermal Heat Pump Systems for Commercial and Institutional Buildings.” In International Scientific Conference “Geothermal
Energy in Underground Mines,” 25–40. Ustroñ, Poland. https://www.geothermal-library.org/index.php?mode=pubs&action=view&record=8000188.
Bloomquist, R.Gordon. 2003. “Geothermal Space Heating.” Geothermics 32 (4–6): 513–526. doi:http://dx.doi.org/10.1016/j.geothermics.2003.06.001.
Blumsack, S., J. Brownson, and L. Witmer. 2009. “Efficiency, Economic and Environmental Assessment of Ground Source Heat Pumps in Central Pennsylvania.” In 2009 42nd Hawaii
International Conference on System Sciences, 1–7. IEEE. doi:10.1109/HICSS.2009.179.
Brandt, E., and M.H. Rasmussen. 2002. “Assessment of Building Conditions.” Energy and
Buildings 34 (2): 121–125. doi:10.1016/S0378-7788(01)00102-5.
Chapman, Patrick, and Piotr Wiczkowski. 2009. Wind-Powered Electrical Systems-Highway
Rest Areas, Weigh Stations, and Team Section Buildings. Urbana. Urbana: Illinois Center for Transportation. http://128.174.2.147/publications/report files/FHWA-ICT-09-034.pdf.
Chiasson, Andrew. 2006. Life-Cycle Cost Study of a Geothermal Heat Pump System. Klamath Falls, OR, USA: Geo-Heat Center, Oregon Institute of Technology. http://geoheat.oit.edu/toa/toa1task2.pdf.
Fialho, Álvaro, Youssef Hamadi, and Marc Schoenauer. 2011. “Optimizing Architectural and Structural Aspects of Buildings towards Higher Energy Efficiency.” In GECCO 2011
Workshop on GreenIT Evolutionary Computation. http://hal.inria.fr/inria-00591930.
Fuller, S. K., and S. R. Petersen. 1996. Life-Cycle Costing Manual for the Federal Energy
Management Program. Edited by S. R. Fuller, S. K.; Petersen. 1995th ed. Gaithersburg, MD: National Institute of Standards and Technology (NIST). http://fire.nist.gov/bfrlpubs/build96/art121.html.
GAO. 2000. Water-Efficient Plumbing Fixtures Reduce Water Consumption and Wastewater
Flows. Washington, D.C. http://www.gao.gov/products/RCED-00-232.
Page 22 of 44
https://mc06.manuscriptcentral.com/cjce-pubs
Canadian Journal of Civil Engineering

Draft
23
GIASMA. 2014. “Solar Energy and Surface Meteorology.” GIASMA. http://www.gaisma.com/en/.
Goldberg, DE. 1989. Genetic Algorithms in Search, Optimization, and Machine Learning. New York: Addison-Wesley Longman Publishing Co., Inc. http://is-this-book-good.info/wp-content/uploads/pdfs/Genetic Algorithms in Search Optimization and Machine Learning by David E Goldberg - Great Start To Your Journey In Genetic Algorithms.pdf.
Greenhalgh, David, and Stephen Marshall. 2000. “Convergence Criteria for Genetic Algorithms.” SIAM Journal on Computing 30 (1). Society for Industrial and Applied Mathematics: 269–282. doi:10.1137/S009753979732565X.
Henderson, Robert. 2009. “LED Street Lighting.” LED Street Lighting. http://www.progress-energy.com/assets/www/docs/home/LED-streetlight-test-project-report.pdf.
James, Ted, Alan Goodrich, Michael Woodhouse, Robert Margolis, and Sean Ong. 2011. Building-Integrated Photovoltaics ( BIPV ) in the Residential Sector : An Analysis of
Installed Rooftop System Prices. Golden, Colorado, USA. http://www.nrel.gov/docs/fy12osti/53103.pdf.
Juan, Yi-Kai, Peng Gao, and Jie Wang. 2010. “A Hybrid Decision Support System for Sustainable Office Building Renovation and Energy Performance Improvement.” Energy
and Buildings 42 (3): 290–297. doi:10.1016/j.enbuild.2009.09.006.
Kaklauskas, Arturas, Edmundas Kazimieras Zavadskas, and Saulius Raslanas. 2005. “Multivariant Design and Multiple Criteria Analysis of Building Refurbishments.” Energy and
Buildings 37 (4): 361–372. doi:10.1016/j.enbuild.2004.07.005.
Lippert, John. 2009. “Induction Lighting: An Old Lighting Technology Made New Again.” ENERGY. http://energy.gov/energysaver/articles/induction-lighting-old-lighting-technology-made-new-again.
Long Ni, Wei Song, Fancheng Zeng, and Yang Yao. 2011. “Energy Saving and Economic Analyses of Design Heating Load Ratio of Ground Source Heat Pump with Gas Boiler as Auxiliary Heat Source.” In 2011 International Conference on Electric Technology and Civil
Engineering (ICETCE), 1197–1200. IEEE. doi:10.1109/ICETCE.2011.5775205.
Matthews, HS, Gyorgyi Cicas, and JL Aguirre. 2004. “Economic and Environmental Evaluation of Residential Fixed Solar Photovoltaic Systems in the United States.” Journal of
Infrastructure Systems, no. September: 105–110. http://ascelibrary.org/doi/abs/10.1061/(ASCE)1076-0342(2004)10:3(105).
Narendran, N., and Y. Gu. 20k05. “Life of LED-Based White Light Sources.” Journal of Display
Technology 1 (1): 167–171. doi:10.1109/JDT.2005.852510.
NREL. 2010. “National Solar Radiation Data Base.” National Renewable Energy Laboratory. http://rredc.nrel.gov/solar/old_data/nsrdb/.
O’Donnell, J., E. Morrissey, M. Keane, and B. O Gallachoir. 2005. “Reducing Building Operational Cost through Environmental Effectiveness Ratios.” In Ninth International
Page 23 of 44
https://mc06.manuscriptcentral.com/cjce-pubs
Canadian Journal of Civil Engineering

Draft
24
IBPSA Conference, 883–890. Montréal, Canada.
Pendharkar, Parag C., and Gary J. Koehler. 2007. “A General Steady State Distribution Based Stopping Criteria for Finite Length Genetic Algorithms.” European Journal of Operational
Research 176 (3): 1436–1451. doi:10.1016/j.ejor.2005.10.050.
Reed, Patrick, Barbara Minsker, and David E. Goldberg. 2000. “Designing a Competent Simple Genetic Algorithm for Search and Optimization.” Water Resources Research 36 (12): 3757–3761. doi:10.1029/2000WR900231.
Roberts, By L Michael. 2010. “Magnetic Induction Lights vs. LED Lights.” Indulux Technologies Inc. http://www.induluxtech.com/Induction Lights Vs LED Lights - InduLuxTech.pdf.
RSMeans. 2013. RSMeans Building Construction Cost Data. Edited by Philip R. Waier. 70th ed. RSMeans.
Ryckaert, W.R., K.A.G. Smet, I.A.A. Roelandts, M. Van Gils, and P. Hanselaer. 2012. “Linear LED Tubes versus Fluorescent Lamps: An Evaluation.” Energy and Buildings 49: 429–436. http://www.sciencedirect.com/science/article/pii/S037877881200134X.
Simmons, Brian, Matthias H Y Tan, C F Jeff Wu, Youngdong Yu, and Godfried Augenbroe. 2013. “Finding the Cost-Optimal Mix of Building Energy Technologies That Satisfies a Set Operational Energy Reduction Target.” In 13th Conference of International Building
Performance Simulation Association, 1852–1859. Chambéry, France.
Thierens, D., D.E. Goldberg, and A.G. Pereira. 1998. “Domino Convergence, Drift, and the Temporal-Salience Structure of Problems.” 1998 IEEE International Conference on
Evolutionary Computation Proceedings. IEEE World Congress on Computational
Intelligence. IEEE, 535–540. doi:10.1109/ICEC.1998.700085.
Tuhus-Dubrow, Daniel, and Moncef Krarti. 2010. “Genetic-Algorithm Based Approach to Optimize Building Envelope Design for Residential Buildings.” Building and Environment 45 (7). Elsevier Ltd: 1574–1581. doi:10.1016/j.buildenv.2010.01.005.
USDOE. 2013. “The QUick Energy Simulation Tool.” eQuest. U.S. Department of Energy. http://www.doe2.com/equest/.
VonNeida, Bill, Dorene Maniccia, and Allan Tweed. 2001. “An Analysis of the Energy and Cost Savings Potential of Occupancy Sensors for Commercial Lighting Systems.” Journal of the
Illuminating Engineering Society 30 (2): 111–125.
WBCSD. 2009. Energy Efficiency in Buildings – Transforming the Market. The World Business Council for Sustainable Development. http://www.wbcsd.org/transformingthemarketeeb.aspx.
Whitestone Research. 2013. Facility Maintenance and Repair Cost Reference 2013-2014. 18th Editi. Washington, DC: Whitestone Research, The Global Standard in Facility Cost Forecasting. http://secure.whitestoneresearch.com/products/view/FAC-MAR-2013-2014-PDF.
Page 24 of 44
https://mc06.manuscriptcentral.com/cjce-pubs
Canadian Journal of Civil Engineering

Draft
25
Zhang, Rui, Fei Liu, Angela Schoergendorfer, Youngdeok Hwang, Young M Lee, and Jane L Snowdon. 2013. “Optimal Selection of Building Components Using Sequential Design via Statistical Surrogate Models.” In 13th Conference of International Building Performance
Simulation Association, 2584–2592. Chambéry, France.
Page 25 of 44
https://mc06.manuscriptcentral.com/cjce-pubs
Canadian Journal of Civil Engineering

Draft
26
Table 1. Sample input data of building characteristics
Description Building characteristics
Building area 3575 square feet
Building envelop (roof surfaces)
Wood advanced frame 24’’ with dark brown shingles roofing and R-19 batt.
Building envelop (above grade walls)
8’’ CMU with brick exterior finishing, perlite filling, and R-6 wd furred insulation.
Building infiltration 1.36 ACH for perimeter and core*
Building interior construction Lay-in acoustic tiles flooring with R-19 batt, wood standard framing with no board insulation, and mass interior walls.
Doors
7’ X 6’ air-lock entry with single bronze 1/8in. glass in the north side of the building, 7’X6’ door with single 1/8in bronze glass in the south side of the building, and two 7’X6’ opaque doors with steel hollow core.
Windows 30% single bronze 1/8in glass in north, east, and west sides of the building.
Building operation schedule 24 hours
Allocation of building activities 31.9% lobby, 6.8% office, 13.1% mechanical and electrical room, 26.6% rest rooms, 12.2% storage, and 9.4% retail sales.
Temperature set and airflow 68⁰F cooling, and 72⁰F heating, and minimum design flow of 0.5 cfm/ft2.
*Average value identified based on onsite exhaust fan measurements, average infiltration rate of building entrances, and reported energy bills.
Page 26 of 44
https://mc06.manuscriptcentral.com/cjce-pubs
Canadian Journal of Civil Engineering

Draft
27
Table 2. Building utility and discount rates
Description Rate
Average electricity billing rate 0.1 $/KWH Average gas billing rate 0.94 $/therm Average water billing rate 0.01 $/Gallon Discount rate 2% Escalation in electricity rates 0.7%* Escalation in natural gas rates 1.6%*
*(U.S. Energy Information Administration 2013)
Page 27 of 44
https://mc06.manuscriptcentral.com/cjce-pubs
Canadian Journal of Civil Engineering

Draft
28
Table 3. Sample input data of building fixtures and equipment
Building fixture or
equipment
Input Data
Decision
variable
original
value
Location
Feasible
Alternati
ves Description
Number of
fixtures or
equipment
Working
hours
per day
��� = 1
Men’s bathroom – Set 2
1 Square fluorescent fixture with 2 T12 U-shaped lamps of 34 Watts and 2279 lumens
4 24 2
Square fluorescent fixture with 2 T8 U-shaped lamps of 28 Watts and 2265 lumens
… ….
17
Square fluorescent fixture with 2 T8 U-shaped lamps of 40 Watts and 3050 lumens
… ….
�;� = 1
Building HVAC
System # 1
(cooling 3.5 ton & heating
100 KBTUs)
1 Electric HVAC system (EER 8.9, COP 2)
2 24
2 Ground-source heat pump (EER 16, COP 4)
3 Gas Energy Star rated HVAC system (EER 12.6, AFUE 0.95)
4 Electric Energy Star rated HVAC system (EER 12.6, COP 3)
�8� = 1
Building water heater
(60 gallons)
1 Gas Water heater (TE 0.8)
1 24
2 Energy-star rated gas water heater (TE 0.90)
3 Energy-star rated electrical water heater (EF 2.4)
4 On-demand gas water heater (EF 0.9)
�Y� = 1
Men’s bathroom
– hand dryers
1 Hand dryer - 2300 Watts and 30 sec drying time
4 Per use 2
Hand dryer - 1100 Watts and 12 second drying time
3 Hand dryer - 1100 Watts and 15 second drying time
… ….
���� = 1 Women’s bathroom - toilets
1 Electronic flushing toilet with 3.5 gallons per flush
10 Per use 2 Electronic flushing toilet with 1.6 gallons per flush
3 Electronic flushing toilet with 1.28 gallons per flush
Page 28 of 44
https://mc06.manuscriptcentral.com/cjce-pubs
Canadian Journal of Civil Engineering

Draft
29
Table 4 Recommended replacements of interior lighting bulbs for solution (a)
Solution Room Recommended Replacements
��� = 10 Men's bathroom set # 1
Replace 12 existing T12 U-shaped lamps of 34 Watts, 2279 lumens, and 18,000 hours life expectance with 12 T8 U-shaped lamps of 32 Watts, 2253 lumens, and 30,000 hours life expectancy.
��� = 56 Men's bathroom set # 2
Replace 16 existing longitudinal T12 lamps of 34 Watts, 2279 lumens, and 20,000 hours life expectancy with 16 longitudinal T8 lamps of 25 Watts, 2280 lumens, and 40,000 hours life expectancy.
��M = 10 Women's bathroom set # 1 Same recommendation at men’s bathroom set # 1
��; = 56 Women's bathroom set # 2 Same recommendation at men’s bathroom set # 2
��8 = 10 Family bathroom Same recommendation at men’s bathroom set # 1 for 2 T12 U-shaped lamps
��Z = 1 Mechanical room set # 1 Keep existing light bulb
��Y = 56 Mechanical room set # 2
Same recommendation at men’s bathroom set # 2 for 6 longitudinal T12 lamps
��[ = 37 Travel information room set # 1
Replace 4 existing longitudinal T12 lamps of 20 Watts, 1200 lumens, and 18,000 hours life expectancy with longitudinal T5 lamps of 14 Watts, 1269 lumens, and 20,000 hours life expectancy.
��\ = 54 Travel information room set # 2
Replace 10 existing longitudinal T12 lamps of 25 Watts, 1950, 18,000 hours life expectancy with longitudinal T8 lamps of 25 Watts, 2280 lumens, and 40,000 hours life expectancy.
��� = 9 Lobby set # 1
Replace 36 existing T12 U-shaped lamps of 34 Watts, 2279 lumens, and 18,000 hours life expectance with T8 U-shaped lamps of 28 Watts, 2380 lumens, and 30,000 hours life expectancy.
���� = 56 Storage 1 Same recommendation at men’s bathroom set # 2 for 2 longitudinal T12 lamps
���� = 56 Storage 2 Same recommendation at men’s bathroom set # 2 for 2 longitudinal T12 lamps
Page 29 of 44
https://mc06.manuscriptcentral.com/cjce-pubs
Canadian Journal of Civil Engineering

Draft
30
Table 5 Recommended replacements of plumbing fixtures for solution (a)
Solution Room Fixture Recommended Replacements
��� = 1 Men's bathroom Faucet Keep existing water faucets
���� = 2 Men's bathroom Urinal Replace existing urinal with electronic flush urinal of 0.125 gallons per flush
���� = 3 Men's bathroom Toilet Replace existing water toilets with Electronic flushing toilet of 1.28 gallons per flush
��� = 1 Women’s bathroom Faucet Keep existing water faucets
���� = 3 Women’s bathroom Toilet Replace existing water toilets with Electronic flushing toilet of 1.28 gallons per flush
��M = 1 Family bathroom Faucet Keep existing water faucets
���M = 3 Family bathroom Toilet Replace existing water toilets with Electronic flushing toilet of 1.28 gallons per flush
Page 30 of 44
https://mc06.manuscriptcentral.com/cjce-pubs
Canadian Journal of Civil Engineering

Draft
31
List of Figures
Figure 1. Optimization Model Development Phases
Figure 2. Decision Variables Chromosome
Figure 3. LCC of building fixture, equipment, or sustainability measure ���
Figure 4. Model implementation
Figure 5. Progress of the optimization computations and the termination condition
Figure 6. Sample database for interior light bulbs
Figure 7. Sample database for solar panels
Figure 8. Sample database for solar inverters
Figure 9. Results of minimizing life-cycle cost of the rest area building
Figure 10. Energy cost of the rest area building before and after minimizing life-cycle cost for
solution (a)
Page 31 of 44
https://mc06.manuscriptcentral.com/cjce-pubs
Canadian Journal of Civil Engineering

Draft
Page 32 of 44
https://mc06.manuscriptcentral.com/cjce-pubs
Canadian Journal of Civil Engineering

Draft
Page 33 of 44
https://mc06.manuscriptcentral.com/cjce-pubs
Canadian Journal of Civil Engineering

Draft
Page 34 of 44
https://mc06.manuscriptcentral.com/cjce-pubs
Canadian Journal of Civil Engineering

Draft
Page 35 of 44
https://mc06.manuscriptcentral.com/cjce-pubs
Canadian Journal of Civil Engineering
Draft
Page 36 of 44
https://mc06.manuscriptcentral.com/cjce-pubs
Canadian Journal of Civil Engineering

Draft
Page 37 of 44
https://mc06.manuscriptcentral.com/cjce-pubs
Canadian Journal of Civil Engineering

Draft
Time
ID Brand name Model #Life
(years)
Solar panel
cost ($)
Maintenance
cost ($)
Nominal
Maximum
Power (Pmax)
Efficiency
Maximum
power
voltage(Vpm)
Maximum power
current(Ipm)
Open circuit
voltage(Voc)
Short circuit
current (Isc)
Short circuit
current (Isc)
Optimal cell
arrangement in
series
Optimal cell
arrangement in
parallel (%/⁰C)
Temperature
coefficient Pmax
(%/⁰C)
Temperature
coefficient Voc
(%/⁰C)
Normal
operating cell
temperature (⁰C)
Temperature
coefficient Isc
1 Sharp ND-240QCJ 30 $288 $0 250 15.54% 30.1 8.3 37.2 8.87 7.19 6 10 -0.43% -0.34% 45 0.07%
2 CSI CS6P-235PX 30 $186 $0 235 14.61% 29.8 7.9 36.9 8.46 7.19 6 10 -0.43% -0.34% 45 0.07%
3 Canadian Solar CS6P-245P 30 $228 $0 245 15.23% 30 8.17 37.1 8.74 7.19 6 10 -0.43% -0.34% 45 0.07%
4 CSI CS6P-250P 30 $238 $0 250 15.54% 30.1 8.3 37.2 8.87 7.19 6 10 -0.43% -0.34% 45 0.07%
5 Hyundai HiS-255MG 30 $245 $0 255 15.80% 30.8 8.3 37.7 8.8 7.19 6 10 -0.45% -0.33% 46 0.03%
6 Canadian Solar CS6P 250M 30 $393 $0 250 15.54% 30.4 8.22 37.5 8.74 7.19 6 10 -0.45% -0.35% 46 0.06%
Solar Panels Characteristics
Product Characteristics Cost Energy Characteristics
Page 38 of 44
https://mc06.manuscriptcentral.com/cjce-pubs
Canadian Journal of Civil Engineering

Draft
Time
Invertor
ID #
Invertor bran
nameInvertor Model #
Life
(years)
Invertor
cost ($)
Maintenance
cost ($)
Minimum
recommended
power (Wp) (watt)
Average
inverter
power (watt)
Maximum
recommened power
(Wp) (watt)
MPPT minimum
range (v)
MPPT
maximum
range (v)
Maximum
input voltage
range (v)
Maximum
usable input
current
Nominal
output
power
Nominal output
current for 110v
or 240v
Power
factor
CEC efficiency at
110v or 240v
Max. continous
output voltages
(volt)
Maximum
efficiency (%)
Consumption
during
standby (w)
Consumption
during
operation (w)
1 Sharp N.A. 20 $4,110 $0 8500 10000 11500 230 500 600 46.7 9995 240 1 0.95 240 96% 1 22
2 AE 100TX 20 $40,508 $0 0 7800 83333 295 600 267 75000 91 0.99 0.955 600 97% 0 0
3 Enphase M215-60-2LL-S22 25 $194 $0 0 240 260 22 36 45 10.5 215 0.9 0.95 0.96 240 96% 0.046 0
4 Power One PVI-12.0-I-OUTD-S1 20 $3,909 $0 0 12000 13200 250 470 520 50 13134 16 0.995 0.97 528 97% 0 0
5 Enphase M215-60-2LL-S23 (Tyco) 25 $129 $0 0 240 260 22 36 45 10.5 215 0.9 0.95 0.96 240 96% 0.046 0
6 Power One PVI10.0-I-OUTD-S1 20 $3,791 $0 0 10000 11000 220 470 520 48 10945 14 0.995 0.97 528 97% 0 0
7 Power One Trio-27.6-TL-OUTD-S1 20 $6,416 $0 0 27600 30000 520 800 1000 61.8 27600 36 0.995 0.975 538 98% 0 0
8 SMA ST42 Inverter 20 $20,775 $0 0 48000 52500 250 480 600 180 42000 101 0.99 0.995 277 97% 0 0
Energy Characteristics
Invertor Characteristics
Product Characteristics Cost
Page 39 of 44
https://mc06.manuscriptcentral.com/cjce-pubs
Canadian Journal of Civil Engineering

Draft
Page 40 of 44
https://mc06.manuscriptcentral.com/cjce-pubs
Canadian Journal of Civil Engineering

Draft
Page 41 of 44
https://mc06.manuscriptcentral.com/cjce-pubs
Canadian Journal of Civil Engineering

Draft
1
Appendix 1: Notation
����: building life-cycle cost, �� is number of locations of building fixture or equipment ��.
�������: LCC of building fixture or equipment ��
� which include upgrade costs, annual energy
and water costs, escalation in utility costs, maintenance costs, replacement costs, and
salvage value.
��: number of fixtures of equipment � at location �.
����� � , � �
� is life life-cycle cost of photovoltaic system at building roof (� = 1) or on the
ground (� = 2) which include upgrade costs, maintenance costs, replacement costs,
annual electricity savings, and salvage value.
������ is upgrade cost of building fixture or equipment ��
�.
������ is annual operational cost of building fixture or equipment ��
� which include energy or
water costs and maintenance costs.
�� is present worth factor of an arithmetic gradient series which can be calculated based on
annual interest rate, escalation rate in utility bills, and number of years of the study
period.
������ is replacement cost of building fixture or equipment ��
�.
���� is present worth of the future replacement cost � of building fixture or equipment ��� which
depends on its expected future replacement time and the annual interest rate.
R is total number of replacements that depends on the expected service life of the building
fixture or equipment in years and the duration of the study period n in years.
������ is salvage value of building fixture or equipment ��
�.
Page 42 of 44
https://mc06.manuscriptcentral.com/cjce-pubs
Canadian Journal of Civil Engineering
Draft
2
���� is present worth of the building fixture or equipment salvage value which can be calculated
based on annual interest rate and number of years of the study period.
���� � , � �
� , ���� � , � �
� , ���� � , ���� �
� , ���� � , � ���� �
� upgrade cost, operational
cost, replacement cost of solar panels, replacement cost of inverters, salvage value of
solar panels, and salvage value of solar inverters, respectively.
!��� � , � �
� is electricity savings of photovoltaic system �.
"#!�: hand dryers electricity consumption in Kilowatt-hour.
��: number of locations of hand dryers.
$��%�: electricity consumption in kilowatts of hand dryer �% at location � of the building.
#��%�:average drying time in hours of hand dryer �%
� .
��#: number of uses per day.
365: the number of days per year to calculate the annual energy consumption of hand dryers.
���: building upgrade costs.
�''(��!)�: the cooling capacity of existing HVAC system !) at location � of the building.
R+: the allowed percentage reduction of the HVAC !)� cooling capacity.
�''(�(�)� ): the cooling capacity of the possible replacement for the HVAC system !) with �) at
location � of the building.
"-�.��!)�: the heating capacity of existing HVAC system !) at location � of the building.
R/: the allowed percentage reduction of the HVAC !)� heating capacity.
"-�.�(�)� ): the heating capacity of the possible replacement for the HVAC system !) with �) at
location � of the building.
�!�: building annual electricity consumption in Kwh.
�#�0�,1: average daily solar insolation in month 2 at location � of the building based on the tilt
and orientation angle of solar panels and location of the building in peak sun hours.
#1: number of days per month 2.
Page 43 of 44
https://mc06.manuscriptcentral.com/cjce-pubs
Canadian Journal of Civil Engineering

Draft
3
3�� � : energy production of single solar panel �
� at location � of the building in watts.
n � : number of solar panels at location � of the building.
.1,5667 : derating factor of the daily temperature effect in month 2 for solar panel �
� , on the
electricity production of solar panels � � .
d: derating factor of the dirt and snow effect on the electricity production of solar panels.
-�,5697 : derating factor of the inverter efficiency � �� for converting DC current to AC current at
location � of the building.
3: derating factor of DC and AC wiring in a PV system.
Page 44 of 44
https://mc06.manuscriptcentral.com/cjce-pubs
Canadian Journal of Civil Engineering