Embed Size (px)
Citation preview
Universidade de Lisboa
Faculdade de Ciências
Departamento de Biologia Animal
Optimizing the dietary protein:lipid ratio on meagre (Argyrosomus regius): effects on
growth and lipid deposition
João Paulo Cardoso Lopes Fernandes
Dissertação
Mestrado em Ecologia Marinha
2013

Universidade de Lisboa
Faculdade de Ciências
Departamento de Biologia Animal
Optimizing the dietary protein:lipid ratio on meagre (Argyrosomus regius): effects on
growth and lipid deposition
João Paulo Cardoso Lopes Fernandes
Dissertação
Mestrado em Ecologia Marinha
Orientadores:
Prof. Doutor Luís F. C. Narciso
Doutor Pedro Pousão Ferreira
2013
I
ACKNOWLEDGEMENTS
Este trabalho não seria possível sem a preciosa ajuda das pessoas que se seguem, e a quem estou profundamente agradecido:
- Ao meu orientador interno, Professor Doutor Luís Narciso (FCUL), pelo
acompanhamento exaustivo ao longo do meu percurso académico, e disponibilidade em ser meu orientador;
- Ao meu orientador externo, Doutor Pedro Pousão (IPMA – Instituto Português do Mar e da Atmosfera, I.P.), que se mostrou disponível para me receber em Olhão, e que me acompanhou durante o meu percurso na EPPO – Estação Piloto de Piscicultura de Olhão;
- À Doutora Laura Ribeiro (EPPO), pela sua incansável assistência no desenrolar deste trabalho, desde o início até ao final;
- Ao Doutor Jorge Dias e à SPAROS, Lda, pelo fornecimento das rações usadas neste ensaio, bem como dos conhecimentos necessários para compreender os mecanismos inerentes aos processos alimentares;
- À Marisa Barata (EPPO), pela ajuda constante e incansável que me forneceu durante todo o ensaio;
- À Nédia Remália e ao Miguel Sáenz (EPPO), pelo seu companheirismo nesta fase tão importante da minha vida, e que me permitiu passar os dias sempre a sorrir;
- A todo o staff essencial ao funcionamento da EPPO, e que direta e
indiretamente, estiveram envolvidos neste ensaio; - À Doutora Narcisa Bandarra (IPMA), por me aceitar no laboratório do IPMA e
por me transmitir os conhecimentos necessários para desenvolver o trabalho analítico essencial a esta tese;
- À Joana Coutinho (IPMA), pela contante assistência laboratorial e esclarecimentos técnico-científicos apropriados;
- À D. Júlia Ferreira e à Oksana (IPMA), pela ajuda e apoio laboratorial, mesmo quando tudo parecia correr menos bem;
- À Mafalda e ao Gabriel, por me acompanharem no IPMA, sempre com boa disposição, e a rir das situações caricatas que surgiam;
- À Professora Doutora Isabel Domingos (FCUL), pela sua incansável persistência a coordenar o mestrado de Ecologia Marinha, e sempre a motivar os seus alunos para serem os melhores;
- Ao Professor Doutor José Lino Costa (FCUL), pela sua preciosa ajuda e disponibilidade;
- A todos os meus colegas de faculdade, desde o primeiro até último ano, que me acompanharam neste percurso fantástico;
- A todos os meus amigos, em especial ao João, Miguel e Zé, que tanto me ajudaram a ter motivação nos momentos em que começava a perder o rumo;
- Finalmente, e não menos importante, à minha família, por me tornar naquilo que sou hoje, e à minha sobrinha, Beatriz, para que um dia cresça a saber que a ciência em Portugal é possível, mesmo com escassos recursos, mas com muita vontade e prazer.
Todo o trabalho prático necessário à elaboração desta tese de mestrado foi
realizado na EPPO – Estação Piloto de Piscicultura de Olhão, parte integrante do IPMA, a quem eu agradeço toda a disponibilidade em me receber e tornar este trabalho possível.
II
RESUMO
A aquicultura é um dos tipos mais modernos de agricultura praticada no Mundo,
sendo uma das respostas para a crescente demanda por produtos de origem animal e
seus derivados. Devido à baixa diversidade de espécies produzidas na Europa, surgiu
a necessidade de diversificar os produtos atualmente produzidos, com a
implementação de novas espécies passíveis de serem criadas a um nível industrial.
Nesse contexto, foi proposta a implementação da criação e produção de corvina
(Argyrosomus regius), por apresentar características necessárias a uma produção
sustentável: requisitos biológicos facilmente atingíveis (crescimento, fecundidade e
criação em cativeiro), requisitos tecnológicos (índice de conversão apropriado, ciclo de
vida bem conhecido) e requisitos de mercado (penetração de mercado, alto valor
comercial e disponibilidade anual), que, em conjunto com um custo de produção
reduzido, podem competir com as espécies já cultivadas.
A corvina faz parte da família Sciaenidae, sendo uma das maiores famílias de
peixes roncadores, incluindo 270 espécies dentro de 70 géneros. São peixes
roncadores, porque emitem sons durante a época de desova. Possuem uma ampla
distribuição entre as regiões temperadas e tropicais do Mundo, incluindo Portugal, de
Norte a Sul. Atualmente já existem sete espécies cultivadas a nível comercial e/ou
experimental, das quais a corvina faz parte. A corvina é um peixe teleósteo, sendo um
dos maiores membros da família Sciaenidae. Pode crescer mais de 180 cm de
comprimento total e peso superior a 50 kg. Tem uma ampla distribuição, estando
presente nos mares Mediterrâneo e Negro, na costa Atlântica da Europa e costa oeste
africana, onde vivem em estuários e águas costeiras, próximo do fundo ou perto da
superfície (profundidades variam de 15 a 200 m). A qualidade da carne é de alto valor
nutricional, dando origem ao seu nome latino regius, para qualidade “real” da sua
carne. O ciclo de vida já está fechado, com muitas “hatcheries” espalhadas por toda a
Europa, sendo a engorda feita com sucesso em jaulas ou tanques (prática realizada
nos países do Mediterrâneo, como Grécia, França, Itália, Espanha e Egito). Apesar
das técnicas para as diferentes fases de criação estarem bem estabelecidas, a
produção ainda não atingiu o seu potencial pleno, principalmente devido aos
protocolos alimentares, uma vez que estes são os mesmos utilizados em outras
espécies, com requisitos bem conhecidos em termos de nutrientes. É um peixe
carnívoro, que, com a alimentação apropriada, consegue atingir 1 kg em menos de um
ano (cultivo em jaulas), pelo que um rácio proteína:lípido apropriado será a resposta
para esse elevado crescimento.
Relativamente à formulação de uma dieta apropriada, o valor de proteína
alimentar deverá ser superior a 45%, e o valor de lípidos não superior a 17%, em
termos de ração total. Os aminoácidos e os ácidos gordos essenciais fornecidos nas
rações permitem criar balanços energéticos que irão sustentar o rápido crescimento da
corvina. Os ácidos gordos são colocados nas rações através de óleos de peixe, que
contêm ácidos gordos saturados, monoinsaturados e polinsaturados, sendo estes
últimos aqueles que possuem efeitos benéficos para o ser humano – ómega-3. Os
ácidos eicosapentaenóico (EPA) e docosahexaenóico (DHA) são os principais ácidos
gordos fornecidos pelos óleos de peixe, e essenciais a todos os peixes. Hidratos de
carbono são utilizados na formulação das rações, servindo como uma fonte de uso
III
limitada para produção de energia, bem como para dar forma e estabilidade às rações.
Minerais e vitaminas também são introduzidos nas rações, para suplementar
deficiências a esse nível.
Para averiguar quais os níveis ótimos de proteínas e lípidos a incluir nas rações
de corvina, e averiguar como esses nutrientes são utilizados, foi realizado um ensaio
experimental, com duração total de 12 semanas.
Cinco dietas isoenergéticas (21,92±0,57 MJ/kg) (média±desvpad) foram criadas,
com variações nos níveis de proteína (44% e 50%) e lípidos (12%, 15% e 18%), sendo
denominadas de 44L15, 44L18, 50L12, 50L15 e 50L18. O ensaio decorreu desde
Setembro/2011 a Dezembro/2011 (63 dias), com um número inicial de 945 peixes
(63,66±2,78 g), distribuídos aleatoriamente por 15 tanques de fibra de vidro (volume
total de 1500L), em grupos triplicados. Os peixes foram aclimatados durante uma
semana, e o ensaio começou posteriormente. Os peixes eram alimentados
diariamente, às 9h00 e às 16h (dias de semana) e às 9h e às 13h (fins de semana),
sendo a alimentação feita à mão, ad libitum (até à saciação).
Foram realizadas quatro amostragens: uma inicial, duas intermédias, e uma final.
Em todas houve verificação do peso corporal e tamanho, sendo que na final foram
sacrificados 12 peixes, dos quais 6 foram usados para a análise corporal proximal, e
outros 6 para análise do conteúdo lipídico das amostras de músculo e fígado (lípidos
totais e perfil de ácidos gordos). A análise estatística foi realizada com recurso ao
software STATISTICA 11.0, onde os dados foram sujeitos à análise de variância
(ANOVA), com p <0,05 e quando normalidade e homocedasticidade eram cumpridas.
Caso contrário, testes não paramétricos – análise de variância Kruskal-Wallis – eram
realizados para averiguar diferenças.
No geral, e tendo em conta os parâmetros de crescimento calculados, a dieta
50L18 apresentou o melhor desempenho, quando comparada com as outras dietas,
uma vez que possui os níveis desejados de proteína e de lípidos, com proteína > 45%
e lípidos ≈ 17%. Por outro lado, a alimentação 50L12 teve o pior desempenho,
principalmente por causa dos baixos níveis de lipídios na dieta. As taxas de SGR (taxa
de crescimento específico) devem ser maiores do que 1% / dia, situação alcançada
com as dietas 50L15 e 50L18 que possuíam os SGR mais elevados, de 0,99±0,04 e
1,21±0,00, respetivamente. Dentro do grupo com 50% de proteína, a dieta 50L18
apresentou a maior Taxa de Crescimento Diário (DGI): 1,78±0,03 %, a maior Eficiência
da Ração (FE): 0,97±0,04, e o maior Rácio de Eficiência Proteica (PER): 2,33±0,09,
possuindo o menor valor médio de Rácio de Conversão Alimentar (FCR): 1,04±0,04. O
valor de DGI obtido é devido aos elevados valores de proteína e lípido presentes na
ração, que acabaram por se refletir num peso final superior aos outros tratamentos. O
valor de PER está relacionado com valores elevados de FE, bem como de peso final
elevado, situação que se confirmou com esta dieta, visto que os peixes que cresceram
mais foram aqueles que se alimentaram mais. O FCR ao ser mais baixo que nas
outras dietas indica que, com a mesma quantidade de alimento, a conversão da dieta
50L18 em elementos bio disponíveis é feita com maior eficácia. A dieta 50L18 também
foi aquela que apresentou os valores médios mais elevados para a retenção de
proteína (42,24±2,50 %) e energia (26,98±0,47 %), bem como para os valores médios
de ganho diário de nitrogénio (N) (334,56±8,26 mg/kg/dia) e energia (0,71±0,04
kJ/kg/dia). Com estes valores, fica confirmado que dietas com valores aproximados de
IV
50% proteína são essenciais para o crescimento da corvina. A dieta 50L12 apresentou
o pior valor de ganho diário de energia (0,51±0,16 kJ/kg/dia), o que indica que não
será apropriada para o cultivo de corvina, inclusive por apresentar uma retenção de
lípidos (17,65±13,01 %) bastante inferior aos outros tratamentos.
Relativamente à composição proximal dos peixes alimentados com cada dieta
experimental, em termos de matéria seca, a dieta 44L18 foi a que apresentou o menor
valor médio de proteína (64,97±2,32 %) em oposição à dieta 50L12 (69,94±3,11 %),
sendo o valor de lípidos o que mais influencia o valor de proteína presente. A dieta
50L12 apresentou o menos valor médio de lípidos (16,78±2,86 %), sendo ainda menos
do que o inicial (19,63±0,14 %), o que indica a má performance desta dieta. Em
termos de matéria fresca, as dietas do grupo de 50% proteína possuíram melhor
performance que a dieta 44L18, sendo que esta, numa base de matéria fresca de
lípidos e de energia, obteve os valores médios mais elevados (6,53±0,94 % e
6,44±0,29 % respetivamente), visto possuir uma elevada concentração de lípidos e um
valor mais reduzido de proteína.
Em termos de deposição lipídica, o conteúdo lipídico do fígado foi maior no
tratamento 50L18 do que no 50L12 (63,11±3,98 % vs. 53,01±7,61 %), mas semelhante
ao tratamento 44L18 (58,26 ± 10,05 %). Os valores de lípidos musculares não são
significativamente diferentes entre os cinco tratamentos, possuindo um valor médio de
2,3 %. O perfil de ácidos gordos (AG) dos diferentes tratamentos não exibe diferenças
significativas, possuindo valores médios de AG saturados ≈32%, AG monoinsaturados
≈20%, de AG polinsaturados ≈43% e a relação (n-3)/(n-6) ≈4,2, sendo valores muito
bons. Estes resultados, juntamente com os baixos índices aterogénico e
trombogénico, prova que a corvina é uma excelente fonte de ómega-3, essenciais
param uma condição cardíaca saudável.
Não obstante que a proteína é o ingrediente mais caro na formulação de rações,
uma dieta apropriada para a criação de corvina a um nível comercial deverá possuir
aproximadamente 50% de conteúdo proteico, e possuir entre 15 a 18% de conteúdo
lipídico, sendo estes valores uma boa abordagem para uma dieta ideal que poderia
maximizar o crescimento e baixar custos.
Palavras-chave: Argyrosomus regius; Rácio proteína:lípido; Crescimento; Perfil
lipídico; Ácidos gordos polinsaturados.
V
ABSTRACT
This study investigates the effects of dietary lipid and protein levels in the growth,
feed utilization and body composition of meagre (Argyrosomus regius). Triplicate
groups of 945 juvenile fish (63,66±2,78 g average weight±SD) were fed for 63 days five
isoenergetic diets (21,79±0,17 kJ) containing 44 and 50% of crude protein, and 12, 15
and 18% of crude lipids, named 44L15, 44L18, 50L12, 50L15 and 50L18. Mean values
of fishes fed diet 50L18 were significantly higher than all other treatments, regarding
final body weight (136,09±1,00 g), specific growth rate (1,21±0,00 %), daily growth
index (1,78±0,03 %) and protein efficiency ratio (2,33±0,09), with the %crude protein in
the feed to affect the last to parameters. Voluntary feed index of fish was affected by
the %crude lipid in the feed, with diet 44L18 to have significantly higher values
(1,28±0,11 %) than diets 44L15 and 50L12. Fish fed diet 50L18 had significantly higher
values of food conversion ratio (1,04±0,04) than all diets, except diet 50L12. The
retention of dry matter and protein had significant differences, with diet 50L18 to have
the highest values (27,60±0,98 % and 42,24±2,50 %, respectively), and to also
possess the highest daily gain of nitrogen and energy. No significant differences were
found in the values of lipid and energy retention, and in the daily gain of lipid.
Significant differences were found between the mean lipid deposition on liver, but not
on the muscle samples. The fatty acid profile was not significantly different between
treatments, and neither were the Atherogenicity and Thrombogenicity indexes. Overall,
the results indicated that the best growth performance was observed in fishes fed the
50L18 diet, but with excessive mesenteric fat deposition in the abdominal wall. In
conclusion, meagre feeds should have around 50% crude protein and between 15 to
18% crude lipid.
Keywords: Argyrosomus regius; Ratio protein:lipid; Growth; Lipid profile;
Polyunsaturated fatty acids.
VI
INDEX
ACKNOWLEDGEMENTS I
RESUMO II
ABSTRACT V
INDEX VI
1 INTRODUCTION 1
1.1 Aquaculture - present situation and trends: 1
1.2 The Sciaenidae family: 2
1.2.1 Japanese croaker (Argyrosomus japonicus) (Temminck and Schlegel, 1843): 3
1.2.2 Brown meagre (Sciaena umbra) (Linnaeus, 1758): 3
1.2.3 Red drum (Sciaenops ocellatus) (Linnaeus, 1766): 4
1.2.4 Meagre (Argyrosomus regius) (Asso, 1801): 4
1.3 Nutritional requirements of meagre: 7
1.3.1 Macronutrients 8
1.3.1.1 Proteins: 8
1.3.1.2 Lipids: 9
1.3.1.2.1 Fish oils: 10
1.3.1.2.2 Fatty acids: 10
1.3.1.2.3 Saturated fatty acids: 12
1.3.1.2.4 Monoenoic fatty acids: 12
1.3.1.2.5 Methylene-interrupted polyunsaturated acids: 12
1.3.1.3 Carbohydrates: 16
1.3.2 Micronutrients: 16
1.3.2.1 Vitamins: 16
1.3.2.2 Minerals: 18
1.4 OBJECTIVES: 19
2 MATERIALS AND METHODS 19
2.1 Experimental diets: 19
2.2 Experimental fish and feeding trial: 21
2.3 Sampling methods: 21
2.4 Analytical methods 22
2.4.1 Proximate analysis of diets and fish tissues 22
2.4.2 Growth performance 22
2.4.3 Total lipids 24
VII
2.4.3.1 Fatty acid profile 24
2.5 Statistical analysis 25
3 RESULTS 26
3.1 Proximate analysis of diets 26
3.2 Proximate analysis of whole body composition 26
3.3 Growth performance 28
3.4 Nutrient retention and gain 31
3.5 Total lipids 33
3.6 Fatty acid profile 34
3.7 Feeding behavior 38
4 DISCUSSION 38
5 CONCLUSION 41
6 REFERENCES 42
1
1 INTRODUCTION
1.1 Aquaculture - present situation and trends:
Aquaculture is one of the most modern types of farming practiced in the World. It
started around 2000-1000 B.C., with the Chinese being the first ones to put the knowledge
into practice (Rabanal, 1988). Nowadays, due to the huge increase in human population,
demand for animal products and its derivates is increasing drastically, where aquaculture
represents one of the most important forms of supplying the World with food. In 2002, China
was the world biggest producer of aquaculture products, in spite of the majority where
freshwater products (Brugère and Ridler, 2004), followed by India and Indonesia. It’s
noteworthy that the main producers are found in Asia, and not the developed countries.
These countries produce low value fish rather than high value finfish (Brugère and Ridler,
2004), which is accordingly with the low income of the population. In 2008, the aquaculture
industry accounted for 45,7 % of the world’s fish food production for human consumption
(FAO, 2012), almost half of the world needs, which demonstrates the great growing potential
of this industry.
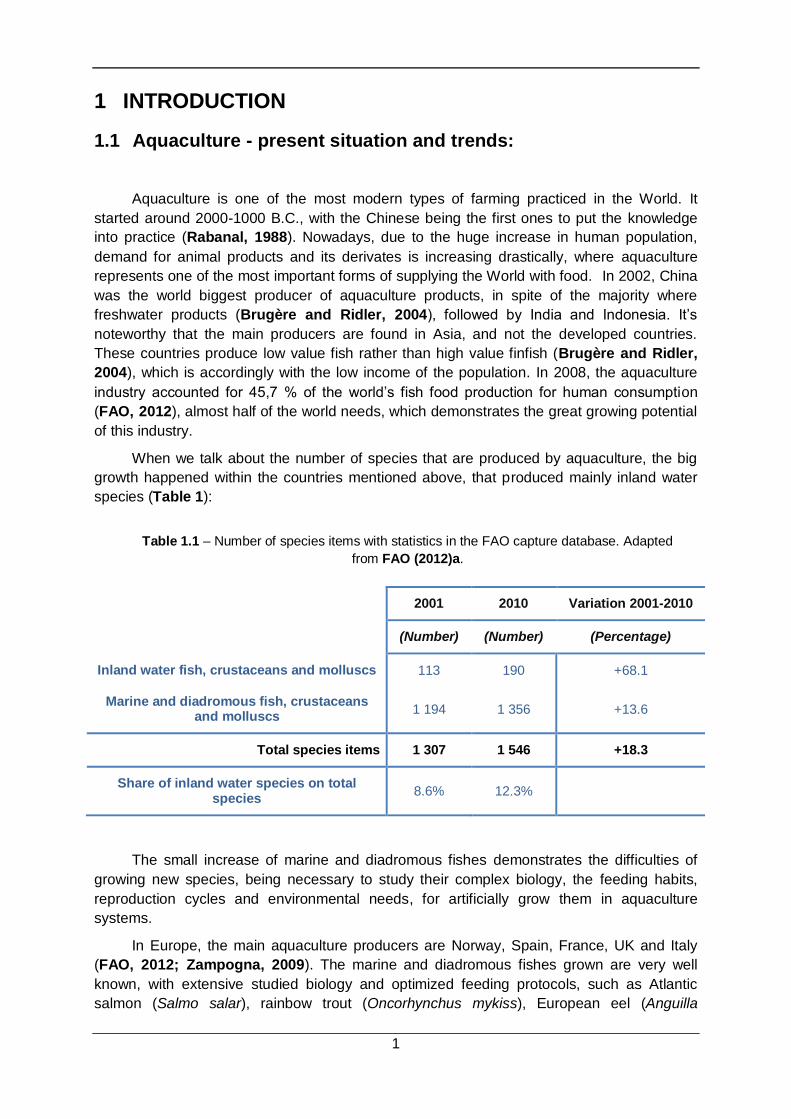
When we talk about the number of species that are produced by aquaculture, the big
growth happened within the countries mentioned above, that produced mainly inland water
species (Table 1):
Table 1.1 – Number of species items with statistics in the FAO capture database. Adapted
from FAO (2012)a.
2001 2010 Variation 2001-2010
(Number) (Number) (Percentage)
Inland water fish, crustaceans and molluscs 113 190 +68.1
Marine and diadromous fish, crustaceans and molluscs
1 194 1 356 +13.6
Total species items 1 307 1 546 +18.3
Share of inland water species on total species
8.6% 12.3%
The small increase of marine and diadromous fishes demonstrates the difficulties of
growing new species, being necessary to study their complex biology, the feeding habits,
reproduction cycles and environmental needs, for artificially grow them in aquaculture
systems.
In Europe, the main aquaculture producers are Norway, Spain, France, UK and Italy
(FAO, 2012; Zampogna, 2009). The marine and diadromous fishes grown are very well
known, with extensive studied biology and optimized feeding protocols, such as Atlantic
salmon (Salmo salar), rainbow trout (Oncorhynchus mykiss), European eel (Anguilla
2
anguilla), gilthead seabream (Sparus aurata) and European seabass (Dicentrarchus labrax)
(Zampogna, 2009). Due to the relative small diversity of marine fishes grown in Europe,
there are proposals of trying to introduce new species in the commercial circuit of
aquaculture (Quéméner, 2002; Roo et al., 2010; Chatzifotis et al., 2011), preferably ones
that comply with biological (growth, fecundity and growing in captivity), technological
(appropriate conversion index, life cycle well known) and market (decline in commercial
catches, market breadth, high commercial value and annual availability) favorable
characteristics, that, together with a reduced production cost, can compete with the species
already cultivated (Iglesias and Sánchez, 2008; FAO, 2012).
1.2 The Sciaenidae family:
The Sciaenidae is among the largest families of sonic fishes, including 270 species
within 70 genera (Chao, 1986). They are sonic fishes, because they emit sounds during the
spawning season (primarily), composed of bursts of knocking, drumming or crocking sounds
(Jiménez et al., 2005; Ueng et al., 2007; Cárdenas, 2010). With a wide distribution among
the temperate and tropical regions of the world (Jiménez et al., 2005), the great
representation of the sciaenids occurs in the Indo-Pacific region, with around 65 species
(Leis and Trnski, 1989), in the Caribbean, with 17 genera (Randall, 1983), and the
temperate waters of the Atlantic and Pacific oceans – 2 species are present in the Amazon
basin and 5 within the Mediterranean sea (Fischer, Bauchot and Schneider, 1987).
According to Cárdenas (2010) and references there in, there are seven species
being farmed in a commercial and/or experimental level:
Japanese meagre (Argyrosomus japonicus) (Temminck and Schlegel, 1843) in
Australia (Silberschneider and Gray, 2008), South Africa (Bernatzeder and Britz,
2007; Musson, 2009), and Taiwan (Ueng et al., 2007);
Corvina drum (Cilus gilberti) (Abbott, 1899) in Chile (Aburto, 2005; Augsburguer,
2006; Cárdenas et al., 2009);
White croaker (Micropogonias funieri) (Demarest, 1823) in Uruguay (García-Alonso
and Vizziano, 2004);
Brown meagre (Sciaena umbra) (Linnaeus, 1758) in Greece (Chatzifotis et al.,
2006) and Turkey (Claki et al., 2006);
Red drum (Sciaenops ocellatus) (Linnaeus, 1766) in China (Xu et al., 2007),
European Union (Henderson-Arzapalo, 1995; Holt, 2000), Ecuador (Rajoy, 2003),
Israel, Martinique (Dao, 2003; Gardes et al., 2000; Soletchnik et al., 1989), Mexico
(García-Ortega and Lazo, 2004; Goffings, 2010) and Taiwan (Liao and Chang,
2001);
Shi drum (Umbrina cirrosa) (Linnaeus, 1758) in Cyprus (Mylonas et al., 2000),
Spain (Arizcun et al., 2009), Greece (Mylonas et al., 2004), Italy (Barbaro et al.,
2002) and Turkey (Basaran et al., 2009);
Meagre (Argyrosomus regius) (Asso, 1801) in Spain (Mateos, 2007), Egypt, France,
Italy, Morocco and Turkey (Jiménez et al., 2005).
3
1.2.1 Japanese croaker (Argyrosomus japonicus) (Temminck and
Schlegel, 1843):
A. japonicus is a widely distributed sciaenid fish, being present in the waters of South
and Central Australia, from Queensland until Western Australia, where it is known as mulloway, from Hong Kong northwards along the Chinese coast to southern Korea and Japan, and is found in the northern Indian Ocean, from Pakistan to the northwest coast of India (Griffiths and Heemstra, 1995; Bernatzeder et al., 2010). It is also present in the
African southeast coast, from Cape of Good Hope to southern Mozambique, where it is known as dusky kob (Griffiths and Heemstra, 1995; Jiménez et al., 2005), living until 30 years old and 2 meters of total length (Jiménez et al., 2005). In Taiwan, fishermen from the
Penghu Archipelago culture this species in saltwater net cages, where the maturation occurs at the 5-6 years of age and body length of 70-80 cm, with A. japonicus starting to emit sounds at the age of 6 months (Ueng et al., 2007). Adults spawn in the near-shore marine
environment (until depths of approximately 100 m) and early juveniles (>20 mm TL) recruit into estuaries and migrate to the upper reaches where salinity ranges between 0 and 5 ppm. Early juveniles (<150 mm TL) appear to be restricted to the upper reaches, whereas larger juveniles (>150 mm TL) migrate into the middle and lower reaches of estuaries, into the surf zone and eventually out to sea (Griffiths, 1996; Bernatzeder et al., 2010).
The commercial production started in 1992, in the state of New South Wales (Australia) and since then a large number of fingerlings were successfully produced using pond fertilization techniques (Jiménez et al., 2005). According to the NSW Fisheries (2003),
between 2001 and 2002, were produced 120.000 fingerlings, with a unit price of 0.56 euro (Jiménez et al., 2005). A. japonicus grows at a very good rate in floating cages, around the
Sydney area, attaining a size of 45 cm (around 1,1kg) after 26 months of feeding, at environmental temperature, but the commercial size is between 500 and 700 grams (Jiménez et al., 2005).
1.2.2 Brown meagre (Sciaena umbra) (Linnaeus, 1758):
Brown meagre is a demersal species living at depths of 0 to 200 m, with a wide
distribution in the Mediterranean Sea, Black Sea and eastern Atlantic Ocean (Chao, 1986). It
exhibits nocturnal behavior and occupies bottom caves and sea beds covered with
vegetation (Chatzifotis et al., 2006; Cakli et al., 2006). Growth is considerably repressed
during low temperatures in winter but accelerated from spring until autumn when the water
temperature rises. Females grow faster than males. The sexually mature fish spawn from
May to July producing pelagic eggs. Feeding is reduced during gonad maturation and brown
meagre may use as an energy source hepatic lipid reserves accumulated during the sexual
resting period (Chatzifotis et al., 2006; Cakli et al., 2006).
Turkey is the fourth largest producer of farmed fish in the Mediterranean region, having
in 2007, a fishery production of 772,471 tons and an aquaculture production of 140,021 tons,
being the biggest producer of the 4 Candidate Countries to the EU (Zampogna, 2009).
Aquaculture of new commercial species, like common dentex, sharpsnout seabream, brown
meagre and red sea bream, began in 2000 with few farms and is still a successful activity
(Cakli et al., 2006). The culture of brown meagre, which is being done in small-size
operations, is a new pilot activity. For that reason, no studies about the quality of wild of
cultured forms of this species exist in Turkey (Cakli et al., 2006). The species Sciaena
4
umbra has great potential for aquaculture in Turkey and Greece, where the Aegean
aquaculture industry is looking for alternative species to culture in sea cages. According to
fish sellers, brown meagre obtains high prices because it is one of the preferred fish in
Turkey (Cakli et al., 2006). Knowledge of the nutritional requirements of brown meagre is
scarce and the only available information refers to its dietary habits in the wild, but its
nutritional requirements are similar with the other Sciaenidae species (Chatzifotis et al.,
2006; Cakli et al., 2006).
1.2.3 Red drum (Sciaenops ocellatus) (Linnaeus, 1766):
The distribution of red drum ranges from Cape Cod in the north-western Atlantic Ocean
to Tuxpan, Mexico in the Gulf of Mexico. Red drum or redfish (as this species is also
commonly known), usually inhabit coastal and estuarine waters. They have a characteristic
red-orange color that can vary from grey to red-bronze and one or more black spots near the
base of the caudal fin. Red drum are eurythermal and euryhaline, carnivorous and of
considerable commercial value (Lazo et al., 2010). Early juveniles feed primarily on bottom-
dwelling invertebrates and later stages feed on fish, shrimp and crabs (Jiménez et al.,
2005). Juveniles are found in bays and estuaries until sexually mature, except in their more
northerly range, where they move offshore or south in the winter to warmer waters. Red
drums are not tolerant to cold temperatures and death results below 10°C (Lazo et al.,
2010). Sexually mature adults of 3–5 years of age (4–5 kg) migrate to offshore waters and
spawning takes place in shallow coastal waters during the evening from August to
November. The maximum age documented is 56 years (1250 mm fork length, FL) for males
and 52 years (1346 mm FL) for females (Lazo et al., 2010).
Its aquaculture started in the 70’s, when the adults of this species were induced for the
breeding in captivity, with the manipulation of the photoperiod and temperature, and the
concomitant development of the larval rearing (Jiménez et al., 2005), being the first of the
Sciaenidae to be farmed in a commercial way. This species adapts easily to captivity, laying
eggs in laboratory conditions, without the use of hormones, mainly due to good acceptance
of artificial feeds and fast grow out, reaching 500 g within 9 months (Jiménez et al., 2005).
The production is made in several states along the Gulf of Mexico and south-eastern Atlantic
in the USA, as well as in Taiwan, China, Mexico and several other countries in Latin America
(Lazo et al., 2010).
1.2.4 Meagre (Argyrosomus regius) (Asso, 1801):
Meagre, Argyrosomus regius (Asso, 1801) is a teleost fish species that belongs to the
Sciaenidae family, being one of its largest members (Chao, 1986). Can grow more than 180
cm in total length and weight more than 50 kg (Quéméner, 2002; Prista et al., 2009). Has a
wide distribution, being present in the Mediterranean and Black seas, Atlantic coast of
Europe and west coast of Africa, living in inshore or coastal waters, close to the bottom or
near the surface (range depths from 15 to 200 m) (Cabral and Ohmert, 2001; Poli et al.,
2003; El-Shebly et al., 2007). For a few years that it’s being proposed as a candidate for the
5
Mediterranean aquaculture diversification (Quéméner, 2002; El-Shebly et al., 2007;
Chatzifotis et al., 2011), due to its fast growth, flesh quality and high nutritional value (regius
for royal quality of flesh) (Poli et al., 2003; Piccolo et al., 2008; Chatzifotis et al., 2011).
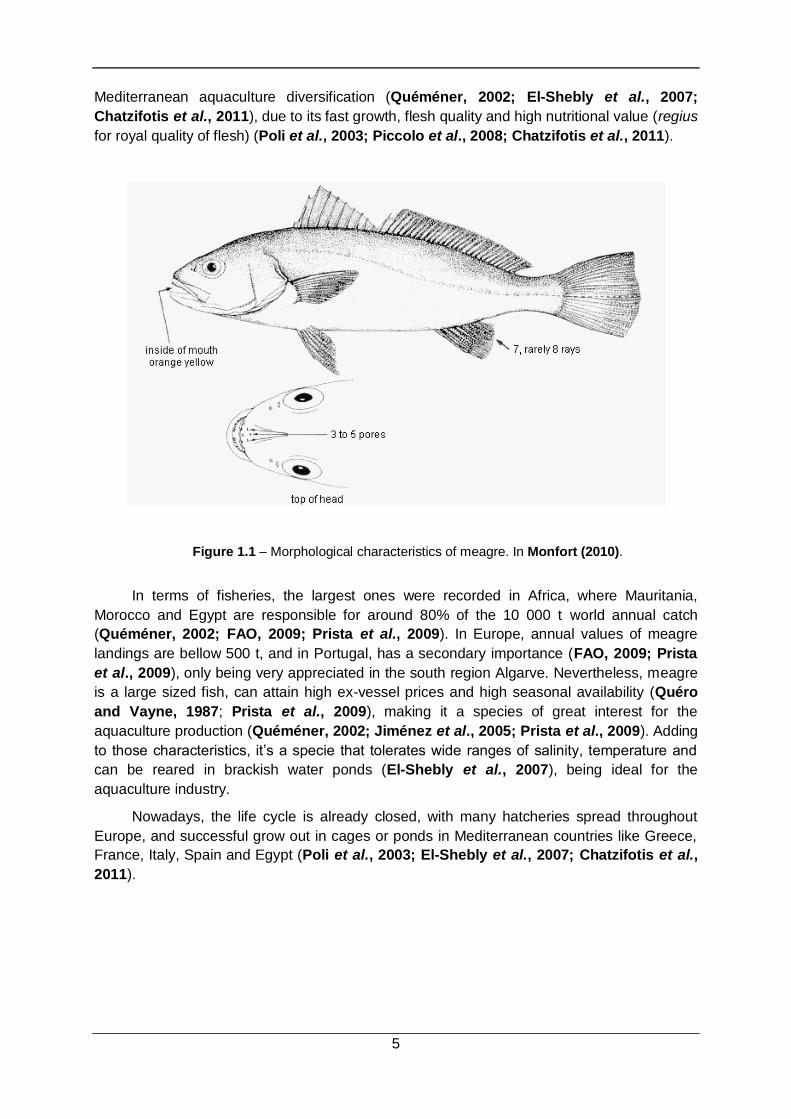
Figure 1.1 – Morphological characteristics of meagre. In Monfort (2010).
In terms of fisheries, the largest ones were recorded in Africa, where Mauritania,
Morocco and Egypt are responsible for around 80% of the 10 000 t world annual catch
(Quéméner, 2002; FAO, 2009; Prista et al., 2009). In Europe, annual values of meagre
landings are bellow 500 t, and in Portugal, has a secondary importance (FAO, 2009; Prista
et al., 2009), only being very appreciated in the south region Algarve. Nevertheless, meagre
is a large sized fish, can attain high ex-vessel prices and high seasonal availability (Quéro
and Vayne, 1987; Prista et al., 2009), making it a species of great interest for the
aquaculture production (Quéméner, 2002; Jiménez et al., 2005; Prista et al., 2009). Adding
to those characteristics, it’s a specie that tolerates wide ranges of salinity, temperature and
can be reared in brackish water ponds (El-Shebly et al., 2007), being ideal for the
aquaculture industry.
Nowadays, the life cycle is already closed, with many hatcheries spread throughout
Europe, and successful grow out in cages or ponds in Mediterranean countries like Greece,
France, Italy, Spain and Egypt (Poli et al., 2003; El-Shebly et al., 2007; Chatzifotis et al.,
2011).
6
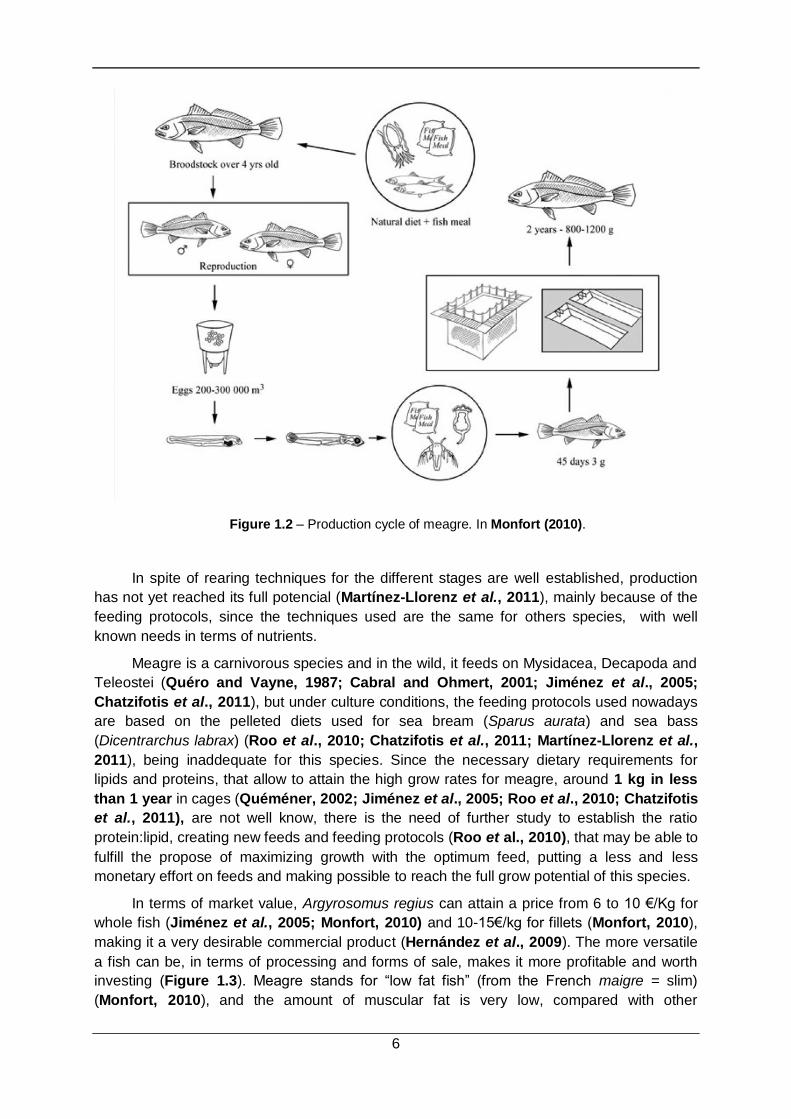
Figure 1.2 – Production cycle of meagre. In Monfort (2010).
In spite of rearing techniques for the different stages are well established, production
has not yet reached its full potencial (Martínez-Llorenz et al., 2011), mainly because of the
feeding protocols, since the techniques used are the same for others species, with well
known needs in terms of nutrients.
Meagre is a carnivorous species and in the wild, it feeds on Mysidacea, Decapoda and
Teleostei (Quéro and Vayne, 1987; Cabral and Ohmert, 2001; Jiménez et al., 2005;
Chatzifotis et al., 2011), but under culture conditions, the feeding protocols used nowadays
are based on the pelleted diets used for sea bream (Sparus aurata) and sea bass
(Dicentrarchus labrax) (Roo et al., 2010; Chatzifotis et al., 2011; Martínez-Llorenz et al.,
2011), being inaddequate for this species. Since the necessary dietary requirements for
lipids and proteins, that allow to attain the high grow rates for meagre, around 1 kg in less
than 1 year in cages (Quéméner, 2002; Jiménez et al., 2005; Roo et al., 2010; Chatzifotis
et al., 2011), are not well know, there is the need of further study to establish the ratio
protein:lipid, creating new feeds and feeding protocols (Roo et al., 2010), that may be able to
fulfill the propose of maximizing growth with the optimum feed, putting a less and less
monetary effort on feeds and making possible to reach the full grow potential of this species.
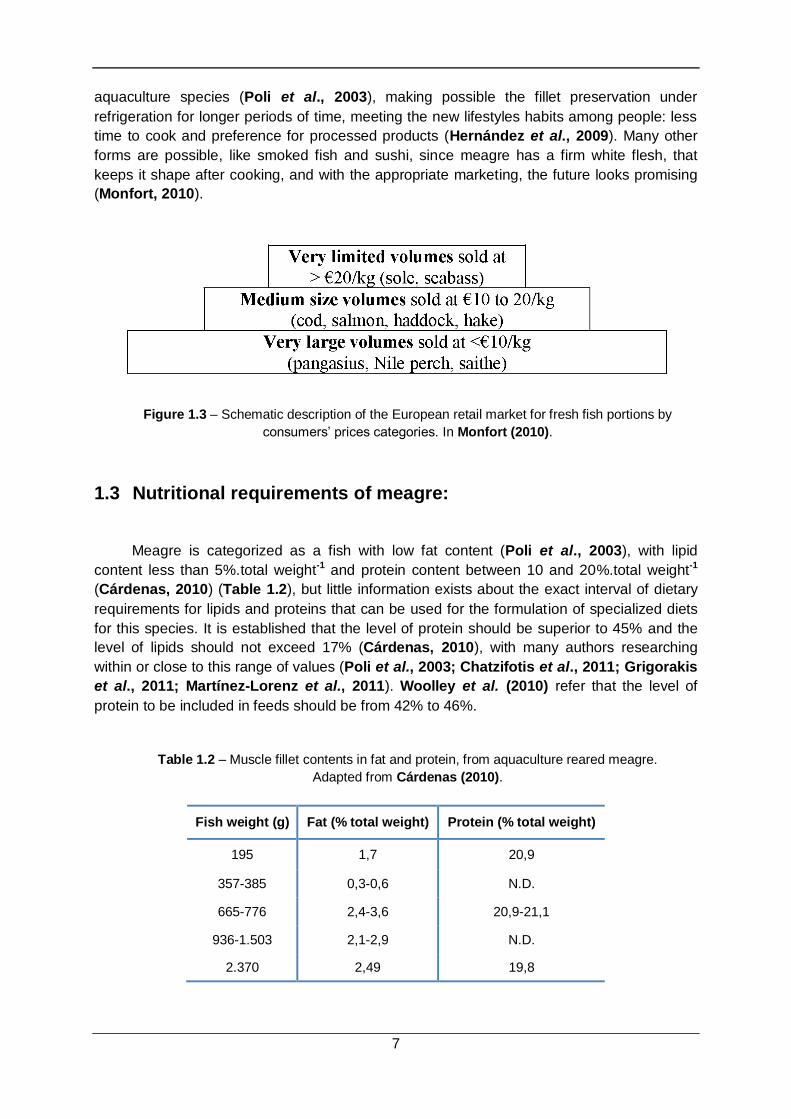
In terms of market value, Argyrosomus regius can attain a price from 6 to 10 €/Kg for
whole fish (Jiménez et al., 2005; Monfort, 2010) and 10-15€/kg for fillets (Monfort, 2010),
making it a very desirable commercial product (Hernández et al., 2009). The more versatile
a fish can be, in terms of processing and forms of sale, makes it more profitable and worth
investing (Figure 1.3). Meagre stands for “low fat fish” (from the French maigre = slim)
(Monfort, 2010), and the amount of muscular fat is very low, compared with other
7
aquaculture species (Poli et al., 2003), making possible the fillet preservation under
refrigeration for longer periods of time, meeting the new lifestyles habits among people: less
time to cook and preference for processed products (Hernández et al., 2009). Many other
forms are possible, like smoked fish and sushi, since meagre has a firm white flesh, that
keeps it shape after cooking, and with the appropriate marketing, the future looks promising
(Monfort, 2010).
Figure 1.3 – Schematic description of the European retail market for fresh fish portions by
consumers’ prices categories. In Monfort (2010).
1.3 Nutritional requirements of meagre:
Meagre is categorized as a fish with low fat content (Poli et al., 2003), with lipid
content less than 5%.total weight-1 and protein content between 10 and 20%.total weight-1
(Cárdenas, 2010) (Table 1.2), but little information exists about the exact interval of dietary
requirements for lipids and proteins that can be used for the formulation of specialized diets
for this species. It is established that the level of protein should be superior to 45% and the
level of lipids should not exceed 17% (Cárdenas, 2010), with many authors researching
within or close to this range of values (Poli et al., 2003; Chatzifotis et al., 2011; Grigorakis
et al., 2011; Martínez-Lorenz et al., 2011). Woolley et al. (2010) refer that the level of
protein to be included in feeds should be from 42% to 46%.
Table 1.2 – Muscle fillet contents in fat and protein, from aquaculture reared meagre.
Adapted from Cárdenas (2010).
Fish weight (g) Fat (% total weight) Protein (% total weight)
195 1,7 20,9
357-385 0,3-0,6 N.D.
665-776 2,4-3,6 20,9-21,1
936-1.503 2,1-2,9 N.D.
2.370 2,49 19,8
8
These macronutrients provide the required energy, the essential amino acids and the
essential fatty acids for growth (Chatzifotis et al., 2011). Their relative inclusion in diets
determines fish growth and the economic performance of aqua feeds, as the proper energy
to protein ratio in the diet contributes to the effective utilization of dietary proteins, through
the protein sparing effect on fish (Watanabe, 1982; Chatzifotis et al., 2011). The level of
dietary lipids that fish can use is limited, and beyond the point of optimal lipid intake, growth
may be retarded, due to reduction in feed consumption, and body fat may increase, affecting
the carcass quality (Chatzifotis et al., 2011). The lipids are mainly supplied through the
inclusion of fish oils that contain the necessary amount of fatty acids.
1.3.1 Macronutrients
1.3.1.1 Proteins:
Proteins are the most abundant compounds in living organisms and have fundamental
roles in all biological processes. They are organic molecules that contain carbon, hydrogen,
oxygen, nitrogen and frequently sulfur. The basic composition of most proteins is very
similar, with varying percentages of its components: 50-55% carbon, 20-23% oxygen, 15-
18% nitrogen, 6-8% hydrogen, and from 0 to 4% sulfur (Jobling, 1995), being composed of
up to 20 α-amino acids linked into chains by peptide bonds. The chains are cross-linked by
disulfide bridges, hydrogen bonds, and Van der Waals forces (NRC, 1993). The amino acid
content of proteins, particularly feed proteins, may differ markedly, so the protein nutritional
quality derives from the content, proportion and availability of amino acids (Becker, 2007).
In the context of animal feeding, protein generally refers to crude protein (CP); that is,
N × 6.25, a definition based on the assumption that proteins contain 16% N. The requirement
for dietary protein has two components:
1. a need for indispensable amino acids that the fish cannot synthesize either at all
or at a rate commensurate with its need for protein deposition or commensurate
with the synthesis of a variety of other compounds with metabolic functions and
2. a supply of either dispensable amino acids or sufficient amino nitrogen to enable
the fish to synthesize them.
Insofar as synthesis of dispensable amino acids requires expenditure of energy,
feeding dietary proteins that most nearly meet the needs of fish for both indispensable and
dispensable amino acids, will result in the most efficient growth by the fish (Thoman et al.,
1999; Chatzifotis et al., 2011). Dietary protein constitutes one of the primary nutrient costs
of the feed and is the initial source of nitrogen waste products entering a culture system.
Consequently, optimization of dietary protein levels along with increasing nutrient retention
by the fish could reduce nitrogen loading and positively influence production costs (Mohanta
et al., 2007), both from an economical and an environmental perspective. To minimize feed
costs, it is important to optimize both dietary protein level and utilization by the fish (Thoman
et al., 1999), and include carbohydrates and lipids.
The amount of protein to be included in a fish diet is influenced by protein to energy
ratio (P:E), protein digestibility and amount of non-protein energy in the diet (NRC, 1993;
Mohanta et al., 2007). When insufficient non-protein energy is available in the feed, dietary
9
protein is delaminated in the body to supply energy rather than being used for tissue growth
and protein synthesis. The liver plays a major role in directing the various nutrients to specific
organs and tissues to be metabolized for energy (Li et al., 2012). The same basic metabolic
pathways for converting amino acids, carbohydrates and lipid into energy have been
observed in fish as in terrestrial animals (NRC, 1993). It is preferable for dietary
carbohydrates or lipid to be metabolized for energy so that protein (amino acids) can be used
for tissue synthesis. To ensure this, there must be a proper balance of dietary protein to
energy to optimize fish growth and lean tissue accretion. Energy-to-protein ratios ranging
from 8 to 10 kcal of digestible energy/g (DE/g) of protein (33 to 42 kJ/g) are optimal for
various fish species (Gatlin III, 2010).
Considering this, much research has been conducted to investigate the protein-sparing
potential of lipids and carbohydrates in fish diets. In their natural environment, fish have
limited access to carbohydrates and are better adapted both at digestive and metabolic
levels to utilize protein and lipids than carbohydrates as energy sources (Li et al., 2012). So,
a supplementation of lipids rather than carbohydrates as a non-protein energy source is
generally a more effective method to increase dietary energy level because lipids are energy-
dense nutrients and are readily metabolized by fish (NRC, 1993). In meagre, the protein-
sparing effect can be investigated through the optimization of the dietary ratio protein:lipid.
1.3.1.2 Lipids:
Lipids constitute a heterogenic family of compounds with diverse structures. Their
common and defining feature is their insolubility in water and solubility in organic solvents
(ether, acetone, mixture of chloroform-alcohol). The terms "fats" and "oils" are used to define
mixtures of lipids, respectively solids or liquids at room temperature (Nelson and Cox,
2004).
The lipids present in teleost fish species may be divided into two major groups: the
phospholipids and the triglycerides (Gunstone et al., 2007). The phospholipids make up the
integral structure of the unit membranes in the cells; thus, they are often called structural
lipids. The triglycerides are lipids used for storage of energy in fat depots, usually within
special fat cells surrounded by a phospholipid membrane and a rather weak collagen
network, being formed by the combining of glycerol with three molecules of fatty acids. The
triglycerides are often termed depot fat. A few fish have wax esters as part of their depot fats
(Huss, 1995).
The phospholipids are all contained in membrane structures, including the outer cell
membrane, the endoplasmic reticulum and other intracellular tubule systems, as well as
membranes of the organelles like mitochondria. In addition to phospholipids, the membranes
also contain cholesterol, contributing to the membrane rigidity. In lean fish muscle cholesterol
may be found in a quantity of about 6 % of the total lipids (Huss, 1995; Chatzifotis et al.,
2010). The fat cells making up the lipid depots in fatty species are typically located in the
subcutaneous tissue, in the belly flap muscle and in the muscles moving the fins and tail
(Huss, 1995).
Fat depots are also typically found spread throughout the muscle structure. The
concentration of fat cells appears to be highest close to the myocommata and in the region
10
between the light and dark muscle (Huss, 1995). The dark muscle contains some
triglycerides inside the muscle cells even in lean fish, as this muscle is able to metabolize
lipids directly as energy. The corresponding light muscle cells are dependent on glycogen as
a source of energy for the anaerobic metabolism (Huss, 1995; Chatzifotis et al., 2010). To
best fulfill the needs in lipids for optimal development and growth, oils derived from fish are
used.
1.3.1.2.1 Fish oils:
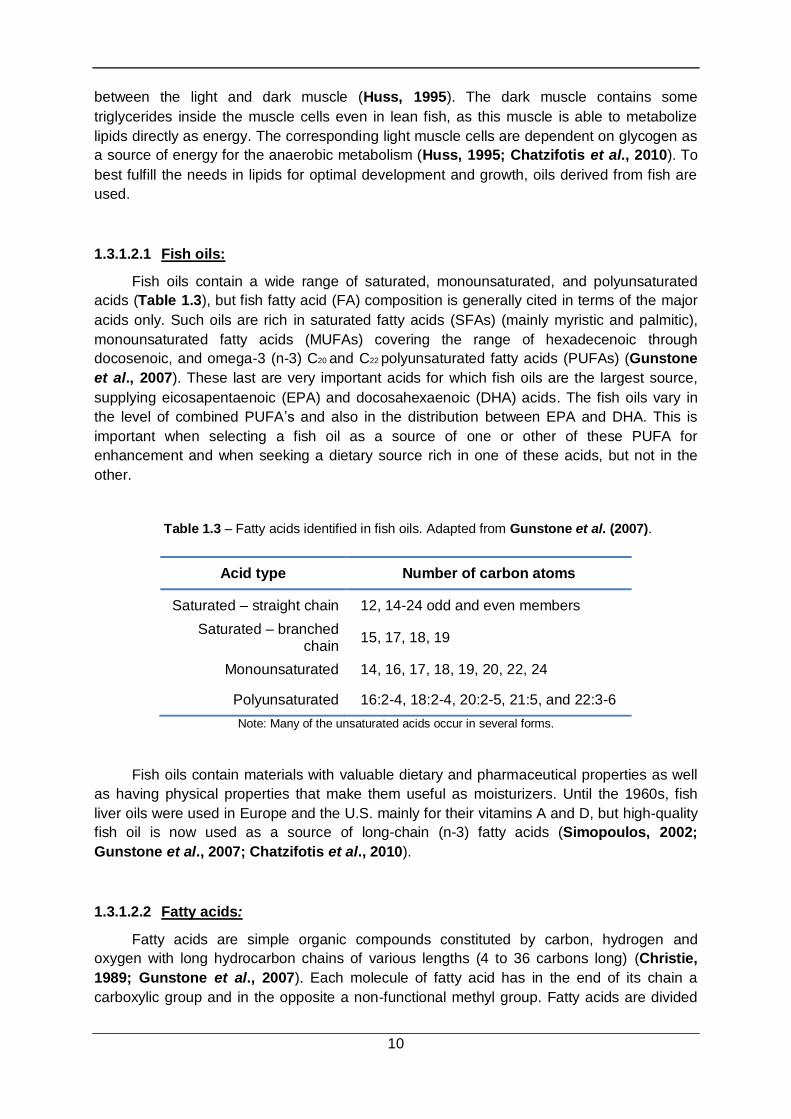
Fish oils contain a wide range of saturated, monounsaturated, and polyunsaturated
acids (Table 1.3), but fish fatty acid (FA) composition is generally cited in terms of the major
acids only. Such oils are rich in saturated fatty acids (SFAs) (mainly myristic and palmitic),
monounsaturated fatty acids (MUFAs) covering the range of hexadecenoic through
docosenoic, and omega-3 (n-3) C20 and C22 polyunsaturated fatty acids (PUFAs) (Gunstone
et al., 2007). These last are very important acids for which fish oils are the largest source,
supplying eicosapentaenoic (EPA) and docosahexaenoic (DHA) acids. The fish oils vary in
the level of combined PUFA’s and also in the distribution between EPA and DHA. This is
important when selecting a fish oil as a source of one or other of these PUFA for
enhancement and when seeking a dietary source rich in one of these acids, but not in the
other.
Table 1.3 – Fatty acids identified in fish oils. Adapted from Gunstone et al. (2007).
Acid type Number of carbon atoms
Saturated – straight chain 12, 14-24 odd and even members
Saturated – branched chain
15, 17, 18, 19
Monounsaturated 14, 16, 17, 18, 19, 20, 22, 24
Polyunsaturated 16:2-4, 18:2-4, 20:2-5, 21:5, and 22:3-6
Note: Many of the unsaturated acids occur in several forms.
Fish oils contain materials with valuable dietary and pharmaceutical properties as well
as having physical properties that make them useful as moisturizers. Until the 1960s, fish
liver oils were used in Europe and the U.S. mainly for their vitamins A and D, but high-quality
fish oil is now used as a source of long-chain (n-3) fatty acids (Simopoulos, 2002;
Gunstone et al., 2007; Chatzifotis et al., 2010).
1.3.1.2.2 Fatty acids:
Fatty acids are simple organic compounds constituted by carbon, hydrogen and
oxygen with long hydrocarbon chains of various lengths (4 to 36 carbons long) (Christie,
1989; Gunstone et al., 2007). Each molecule of fatty acid has in the end of its chain a
carboxylic group and in the opposite a non-functional methyl group. Fatty acids are divided
11
into groups according to chain length, number, position and configuration of their double
bonds, and the occurrence of additional functional groups along the chains (Christie, 1989).
Fatty acids systematic name is derived from the name of its parent hydrocarbon substituting
the end e with oic. For example, the C18 saturated fatty acid is called octadecanoic acid since
the parent hydrocarbon is octadecane. A C18 fatty acid with one double bond is called
octadecenoic acid; with two double bounds ("di"), octadecadienoic acid; with three double
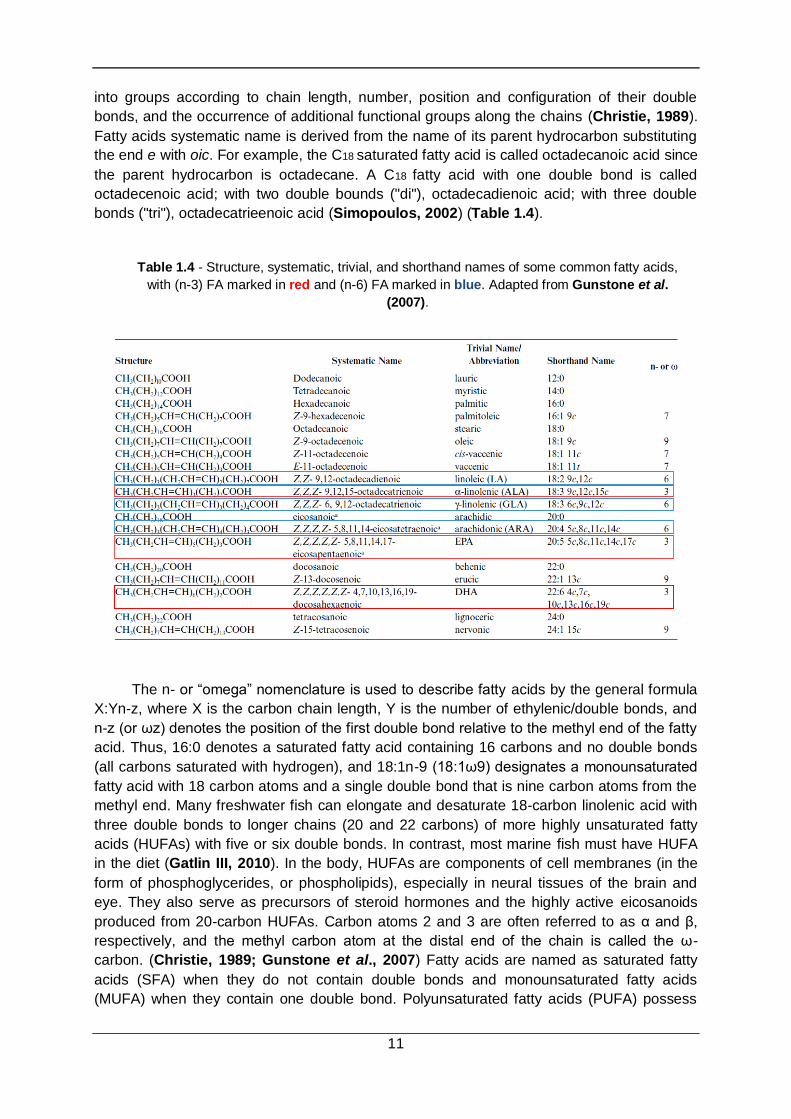
bonds ("tri"), octadecatrieenoic acid (Simopoulos, 2002) (Table 1.4).
Table 1.4 - Structure, systematic, trivial, and shorthand names of some common fatty acids,
with (n-3) FA marked in red and (n-6) FA marked in blue. Adapted from Gunstone et al.
(2007).
The n- or “omega” nomenclature is used to describe fatty acids by the general formula
X:Yn-z, where X is the carbon chain length, Y is the number of ethylenic/double bonds, and
n-z (or ωz) denotes the position of the first double bond relative to the methyl end of the fatty
acid. Thus, 16:0 denotes a saturated fatty acid containing 16 carbons and no double bonds
(all carbons saturated with hydrogen), and 18:1n-9 (18:1ω9) designates a monounsaturated
fatty acid with 18 carbon atoms and a single double bond that is nine carbon atoms from the
methyl end. Many freshwater fish can elongate and desaturate 18-carbon linolenic acid with
three double bonds to longer chains (20 and 22 carbons) of more highly unsaturated fatty
acids (HUFAs) with five or six double bonds. In contrast, most marine fish must have HUFA
in the diet (Gatlin III, 2010). In the body, HUFAs are components of cell membranes (in the
form of phosphoglycerides, or phospholipids), especially in neural tissues of the brain and
eye. They also serve as precursors of steroid hormones and the highly active eicosanoids
produced from 20-carbon HUFAs. Carbon atoms 2 and 3 are often referred to as α and β,
respectively, and the methyl carbon atom at the distal end of the chain is called the ω-
carbon. (Christie, 1989; Gunstone et al., 2007) Fatty acids are named as saturated fatty
acids (SFA) when they do not contain double bonds and monounsaturated fatty acids
(MUFA) when they contain one double bond. Polyunsaturated fatty acids (PUFA) possess
12
more than one double bond. Many may be present at levels exceeding 10%: SFAs (14:0,
16:0), MUFAs (16:1, 18:1, 20:1, 22:1) and (n-3) PUFAs (20:5, 22:6). Many minor fatty acids
are also present (Gunstone et al., 2007).
1.3.1.2.3 Saturated fatty acids:
SFAs form a homologous series of monocarboxylic acids (CnH2n+1COOH). Naturally
occurring saturated acids are mainly of even chain length between C4 and C24. Odd chain
acids are usually minor or trace components of plant and animal lipids (Christie, 1989).
Palmitic acid (16:0) is the most abundant and widespread natural SFA, present in plants,
animals, and microorganisms. Levels of 20 to 30% are common in animal lipids, 10 to 40% in
seed oils (Das, 2006). Stearic acid (18:0) is also ubiquitous, usually at low levels, but is
abundant in cocoa butter (around 34%) and some animal fats, e.g., lard (5 to 24%) and beef
tallow (6 to 40%) (Gunstone et al., 2007).
1.3.1.2.4 Monoenoic fatty acids:
Straight-chain, cis-monoenoic acids with an even number of carbons are common
constituents of many lipids and commodity oils. Trans- monoenes are rare components of
natural oils and fats. The cis (Z) double bond is usually inserted by a Δ9-desaturase enzyme
into preformed saturated acids; this may be followed by two-carbon chain extension at the
carboxyl end. Starting with 16:0, this results in (n-7) monoenes, while desaturation of 18:0
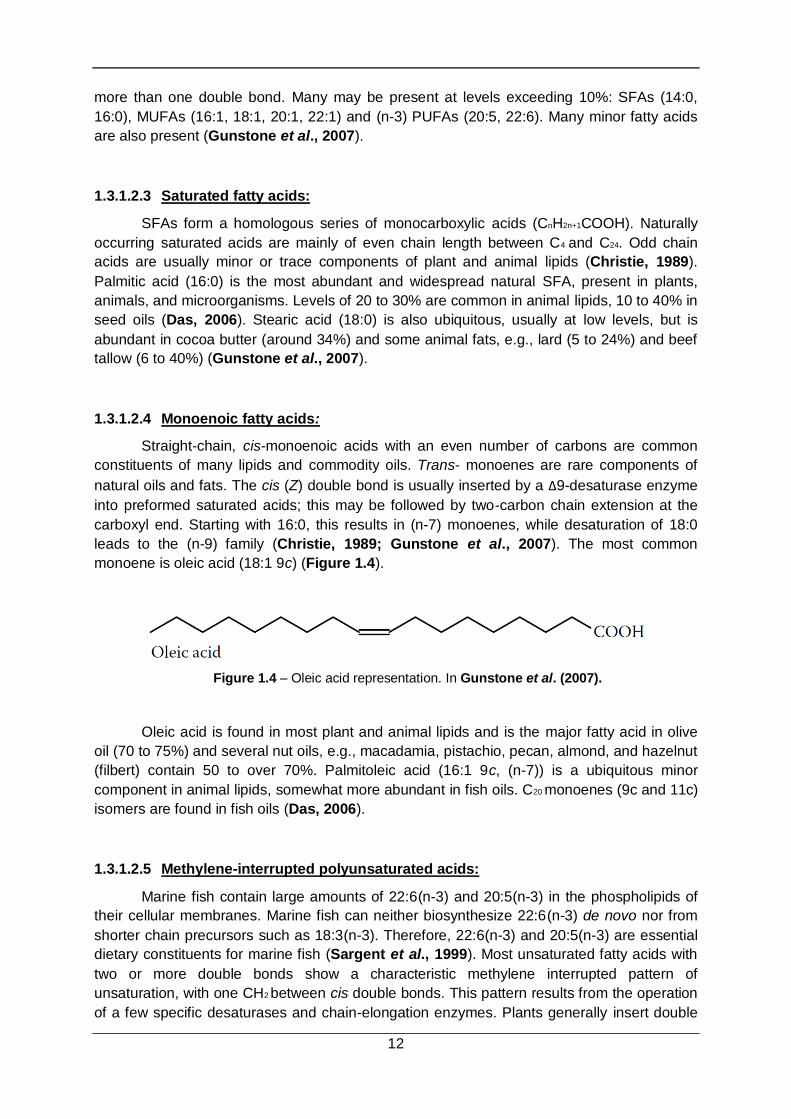
leads to the (n-9) family (Christie, 1989; Gunstone et al., 2007). The most common
monoene is oleic acid (18:1 9c) (Figure 1.4).
Figure 1.4 – Oleic acid representation. In Gunstone et al. (2007).
Oleic acid is found in most plant and animal lipids and is the major fatty acid in olive
oil (70 to 75%) and several nut oils, e.g., macadamia, pistachio, pecan, almond, and hazelnut
(filbert) contain 50 to over 70%. Palmitoleic acid (16:1 9c, (n-7)) is a ubiquitous minor
component in animal lipids, somewhat more abundant in fish oils. C20 monoenes (9c and 11c)
isomers are found in fish oils (Das, 2006).
1.3.1.2.5 Methylene-interrupted polyunsaturated acids:
Marine fish contain large amounts of 22:6(n-3) and 20:5(n-3) in the phospholipids of
their cellular membranes. Marine fish can neither biosynthesize 22:6(n-3) de novo nor from
shorter chain precursors such as 18:3(n-3). Therefore, 22:6(n-3) and 20:5(n-3) are essential
dietary constituents for marine fish (Sargent et al., 1999). Most unsaturated fatty acids with
two or more double bonds show a characteristic methylene interrupted pattern of
unsaturation, with one CH2 between cis double bonds. This pattern results from the operation
of a few specific desaturases and chain-elongation enzymes. Plants generally insert double
13
bonds at the Δ9, Δ12, and Δ15 positions in C18 fatty acids, giving (n-9), (n-6), and (n-3)
compounds, respectively (Das, 2006). Animals can also insert double bonds at the Δ9
position, but not at Δ12 or Δ15; instead, further double bonds are introduced between the
carboxyl group and the Δ9 position by Δ5 and Δ6 desaturase enzymes and the chain can
then be extended in two carbon units at the carboxyl end of the molecule (Gunstone et al.,
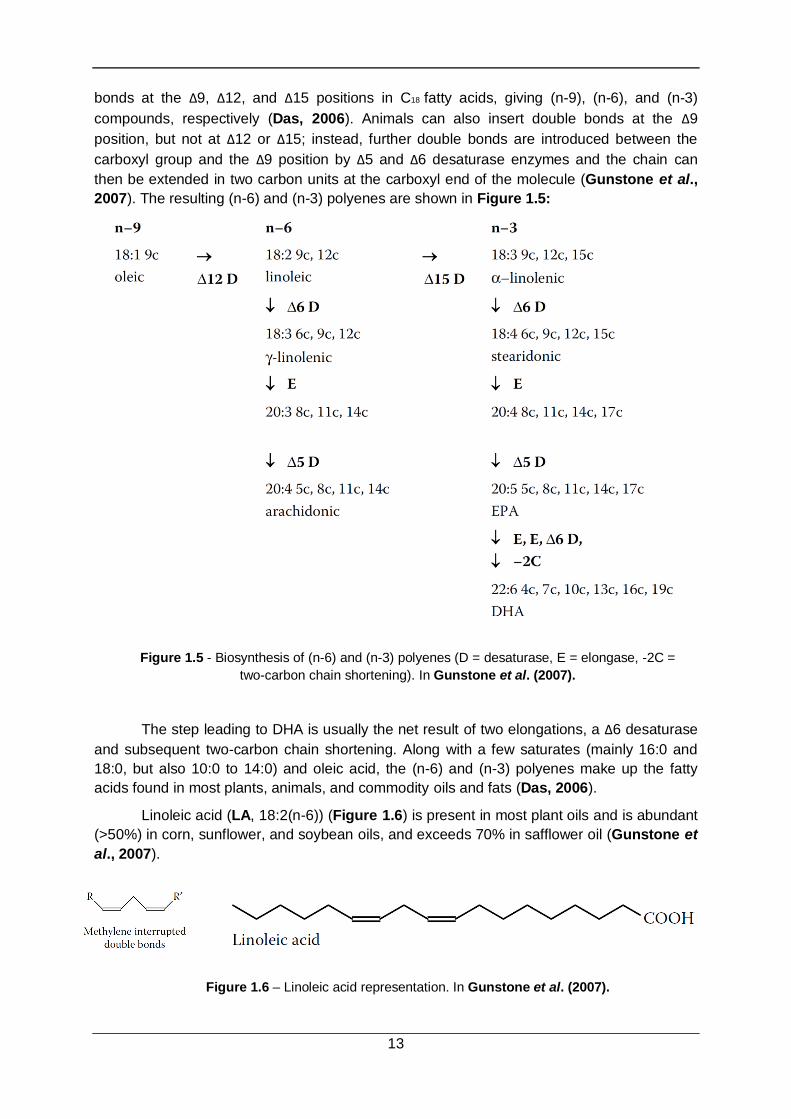
2007). The resulting (n-6) and (n-3) polyenes are shown in Figure 1.5:
Figure 1.5 - Biosynthesis of (n-6) and (n-3) polyenes (D = desaturase, E = elongase, -2C =
two-carbon chain shortening). In Gunstone et al. (2007).
The step leading to DHA is usually the net result of two elongations, a Δ6 desaturase
and subsequent two-carbon chain shortening. Along with a few saturates (mainly 16:0 and
18:0, but also 10:0 to 14:0) and oleic acid, the (n-6) and (n-3) polyenes make up the fatty
acids found in most plants, animals, and commodity oils and fats (Das, 2006).
Linoleic acid (LA, 18:2(n-6)) (Figure 1.6) is present in most plant oils and is abundant
(>50%) in corn, sunflower, and soybean oils, and exceeds 70% in safflower oil (Gunstone et
al., 2007).
Figure 1.6 – Linoleic acid representation. In Gunstone et al. (2007).
14
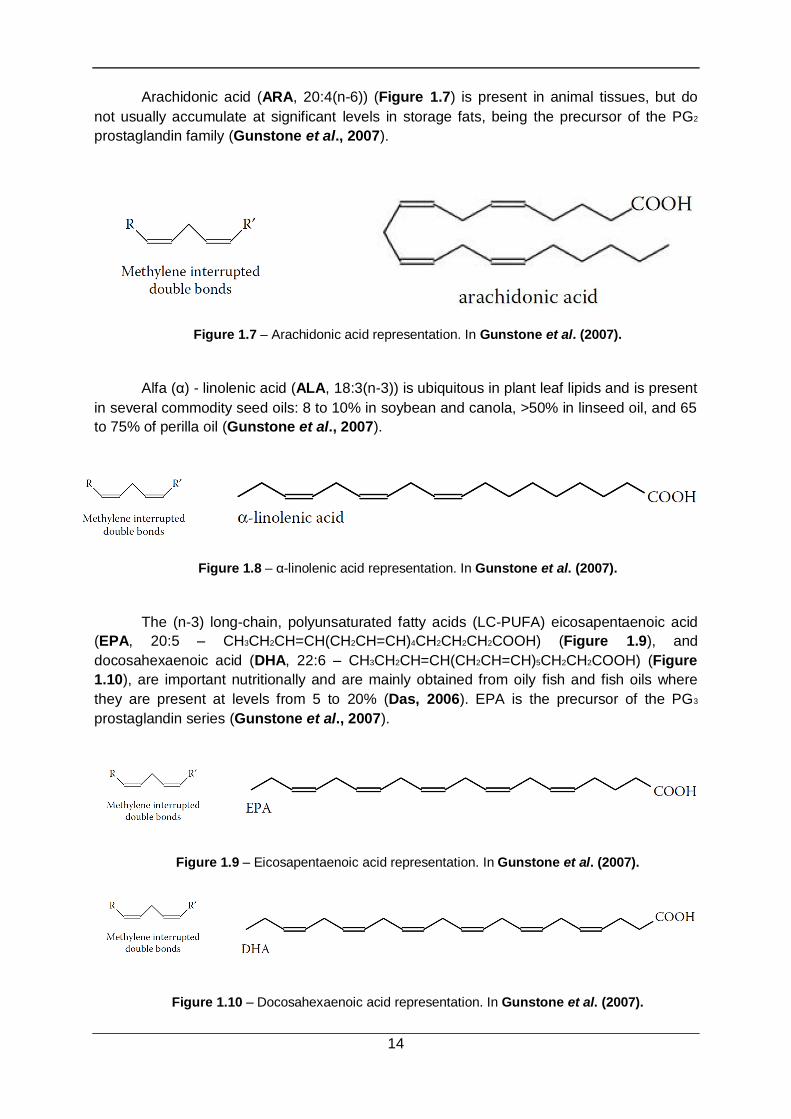
Arachidonic acid (ARA, 20:4(n-6)) (Figure 1.7) is present in animal tissues, but do
not usually accumulate at significant levels in storage fats, being the precursor of the PG2
prostaglandin family (Gunstone et al., 2007).
Figure 1.7 – Arachidonic acid representation. In Gunstone et al. (2007).
Alfa (α) - linolenic acid (ALA, 18:3(n-3)) is ubiquitous in plant leaf lipids and is present
in several commodity seed oils: 8 to 10% in soybean and canola, >50% in linseed oil, and 65
to 75% of perilla oil (Gunstone et al., 2007).
Figure 1.8 – α-linolenic acid representation. In Gunstone et al. (2007).
The (n-3) long-chain, polyunsaturated fatty acids (LC-PUFA) eicosapentaenoic acid
(EPA, 20:5 – CH3CH2CH=CH(CH2CH=CH)4CH2CH2CH2COOH) (Figure 1.9), and
docosahexaenoic acid (DHA, 22:6 – CH3CH2CH=CH(CH2CH=CH)5CH2CH2COOH) (Figure
1.10), are important nutritionally and are mainly obtained from oily fish and fish oils where
they are present at levels from 5 to 20% (Das, 2006). EPA is the precursor of the PG3
prostaglandin series (Gunstone et al., 2007).
Figure 1.9 – Eicosapentaenoic acid representation. In Gunstone et al. (2007).
Figure 1.10 – Docosahexaenoic acid representation. In Gunstone et al. (2007).
15
Sometimes the total level of (n-3) EPA and DHA is important and on other occasions it
is desirable to have high concentrations of only one of them. Sometimes it is desirable to
have these acids at higher concentrations than is provided naturally or to enrich one of them
at the expense of the other. Alternatively, it may be desired to incorporate one or both of
them into an oil rich in medium-chain acids (Das, 2006; Gunstone et al., 2007). The
American Heart Association recommends combined intakes of EPA and DHA of 1 g/day for
patients with known coronary heart disease (CHD) and 0.5 g/day for individuals without
known CHD (Simopoulos, 2002; Das, 2006; Gunstone et al., 2007). The characteristic fatty
acids of the fat of fish possess antithrombotic and anti-inflammatory characteristics, justifying
a lower prevalence of cardiovascular diseases in fish-eating populations (Simopoulos, 2002;
Das, 2006). In human nutrition, FA such as LA and ALA are regarded as essential since they
cannot be synthesized by the organism. In marine fish, these fatty acids constitute only
around 2 % of the total lipids, which is a small percentage compared with many vegetable
oils (Simopoulos, 2002). However, fish oils contain other PUFAs which are "essential" to
prevent skin diseases in the same way as LA and ARA (Das, 2006). As members of the
linolenic acid family (first double bond in the third position, (n-3) counted from the terminal
methyl group), they will also have neurological benefits in growing children (Huss, 1995;
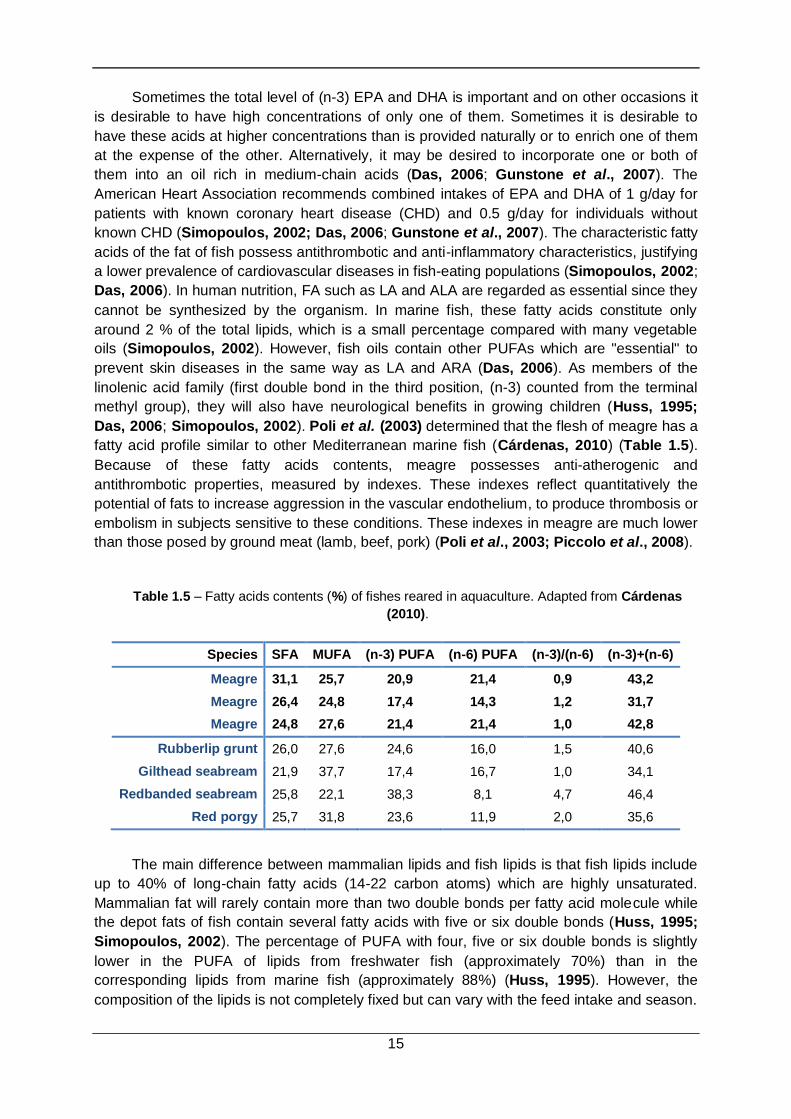
Das, 2006; Simopoulos, 2002). Poli et al. (2003) determined that the flesh of meagre has a
fatty acid profile similar to other Mediterranean marine fish (Cárdenas, 2010) (Table 1.5).
Because of these fatty acids contents, meagre possesses anti-atherogenic and
antithrombotic properties, measured by indexes. These indexes reflect quantitatively the
potential of fats to increase aggression in the vascular endothelium, to produce thrombosis or
embolism in subjects sensitive to these conditions. These indexes in meagre are much lower
than those posed by ground meat (lamb, beef, pork) (Poli et al., 2003; Piccolo et al., 2008).
Table 1.5 – Fatty acids contents (%) of fishes reared in aquaculture. Adapted from Cárdenas
(2010).
Species SFA MUFA (n-3) PUFA (n-6) PUFA (n-3)/(n-6) (n-3)+(n-6)
Meagre 31,1 25,7 20,9 21,4 0,9 43,2
Meagre 26,4 24,8 17,4 14,3 1,2 31,7
Meagre 24,8 27,6 21,4 21,4 1,0 42,8
Rubberlip grunt 26,0 27,6 24,6 16,0 1,5 40,6
Gilthead seabream 21,9 37,7 17,4 16,7 1,0 34,1
Redbanded seabream 25,8 22,1 38,3 8,1 4,7 46,4
Red porgy 25,7 31,8 23,6 11,9 2,0 35,6
The main difference between mammalian lipids and fish lipids is that fish lipids include
up to 40% of long-chain fatty acids (14-22 carbon atoms) which are highly unsaturated.
Mammalian fat will rarely contain more than two double bonds per fatty acid molecule while
the depot fats of fish contain several fatty acids with five or six double bonds (Huss, 1995;
Simopoulos, 2002). The percentage of PUFA with four, five or six double bonds is slightly
lower in the PUFA of lipids from freshwater fish (approximately 70%) than in the
corresponding lipids from marine fish (approximately 88%) (Huss, 1995). However, the
composition of the lipids is not completely fixed but can vary with the feed intake and season.
16
Maintaining high levels of (n-3) PUFA, as well as low levels of (n-6) fatty acids, in farmed
fish, is considered desirable to provide a high nutritional value product for human
consumption (Das, 2006; Martins et al., 2007).
1.3.1.3 Carbohydrates:
Carnivorous species, such as meagre, are very efficient using dietary protein and lipid
for energy but less efficient at using dietary carbohydrates (Li et al., 2012). The feeds that
carnivorous species eat contain little carbohydrate, so they use this nutrient less efficiently.
Fish do not have a specific dietary requirement for carbohydrates, but including these
compounds in diets is an inexpensive source of energy (Gatlin III, 2010). Carbohydrates
may serve as precursors for the dispensable amino acids and nucleic acids, which are
metabolic intermediates necessary for growth (NRC, 1993). The ability of fish to utilize
dietary carbohydrates for energy varies considerably; many carnivorous species use them
less efficiently than do herbivorous and omnivorous species. Some carbohydrates are
deposited in the form of glycogen in tissues such as liver and muscle, where it is a ready
source of energy. Some dietary carbohydrates are converted to lipid and deposited in the
body for energy (NRC, 1993; Gatlin III, 2010). Since fish can’t digest complex carbohydrates
(cellulose and other fibrous carbohydrates), the amount of crude fiber in fish feeds is usually
less than 7% of the diet, to limit the amount of undigested material entering the culture
system. Cereal grains serve as inexpensive sources of carbohydrates for warm-water fish,
but their use in cold-water fish feeds is limited (NRC, 1993).
Soluble carbohydrates such as starch are primary energy reserves found in seeds,
tubers and other plant structures. Animal tissues such as liver and muscle contain small
concentrations of soluble carbohydrate in the form of glycogen, which is structurally similar to
starch (Gatlin III, 2010). This glycogen reserve can be rapidly mobilized when the body
needs glucose. Prepared feeds for carnivorous fish usually contain less than 20% soluble
carbohydrate, while feeds for omnivorous species usually contain 25 to 45%. In addition to
being a source of energy, starch in fish feeds also gives pellets integrity and stability and
makes them less dense (NRC, 1993). Because carbohydrates are the least expensive
source of dietary energy, the maximum tolerable concentration should be used with regard to
the fish species.
1.3.2 Micronutrients:
1.3.2.1 Vitamins:
Fifteen vitamins are essential for terrestrial animals and for several fish species that
have been examined to date (Table 1.6).
17
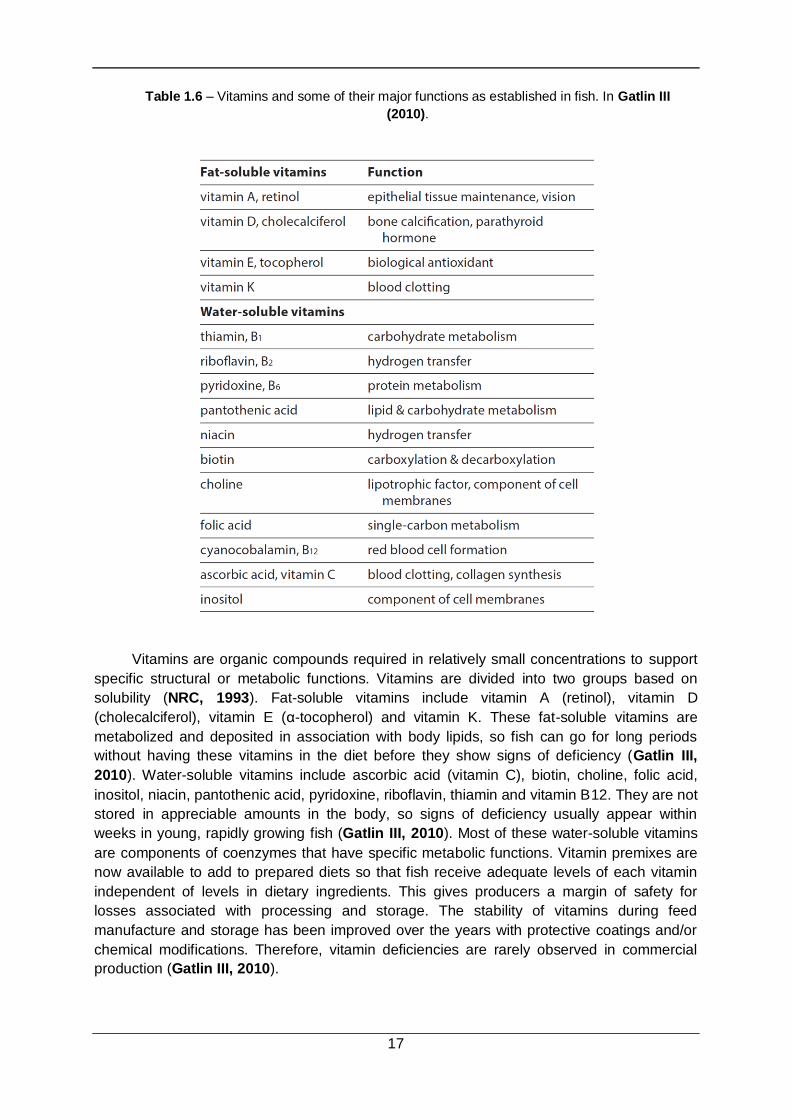
Table 1.6 – Vitamins and some of their major functions as established in fish. In Gatlin III
(2010).
Vitamins are organic compounds required in relatively small concentrations to support
specific structural or metabolic functions. Vitamins are divided into two groups based on
solubility (NRC, 1993). Fat-soluble vitamins include vitamin A (retinol), vitamin D
(cholecalciferol), vitamin E (α-tocopherol) and vitamin K. These fat-soluble vitamins are
metabolized and deposited in association with body lipids, so fish can go for long periods
without having these vitamins in the diet before they show signs of deficiency (Gatlin III,
2010). Water-soluble vitamins include ascorbic acid (vitamin C), biotin, choline, folic acid,
inositol, niacin, pantothenic acid, pyridoxine, riboflavin, thiamin and vitamin B12. They are not
stored in appreciable amounts in the body, so signs of deficiency usually appear within
weeks in young, rapidly growing fish (Gatlin III, 2010). Most of these water-soluble vitamins
are components of coenzymes that have specific metabolic functions. Vitamin premixes are
now available to add to prepared diets so that fish receive adequate levels of each vitamin
independent of levels in dietary ingredients. This gives producers a margin of safety for
losses associated with processing and storage. The stability of vitamins during feed
manufacture and storage has been improved over the years with protective coatings and/or
chemical modifications. Therefore, vitamin deficiencies are rarely observed in commercial
production (Gatlin III, 2010).
18
1.3.2.2 Minerals:
Minerals consist of inorganic elements the body requires for various purposes. Fish
require the same minerals as terrestrial animals for tissue formation, osmoregulation and
other metabolic functions. However, dissolved minerals in the water may satisfy some of the
metabolic requirements of fish (Gatlin III, 2010). Minerals are typically classified as either
macro- or microminerals, based on the quantities required in the diet and stored in the body.
Macrominerals are calcium, phosphorus, magnesium, chloride, sodium, potassium and
sulfur. Dietary deficiencies of most macrominerals have been difficult to produce in fish
because of the uptake of waterborne ions by the gills (Gatlin III, 2010). However, it is known
that phosphorus is the most critical macromineral in fish diets because there is little
phosphorus in water. Because excreted phosphorus influences the eutrophication of water,
much research has been focused on phosphorus nutrition with the aim of minimizing
phosphorus excretion (NRC, 1993; Li et al., 2012) Phosphorus is a major constituent of hard
tissues such as bone and scales and is also present in various biochemicals. Impaired
growth and feed efficiency, as well as reduced tissue mineralization and impaired skeletal
formation in juvenile fish, are common symptoms when fish have diets deficient in
phosphorus (Gatlin III, 2010). Chloride, sodium and potassium are important electrolytes
involved in osmoregulation and the acid–base balance in the body. These minerals are usu-
ally abundant in water and practical feedstuffs. Magnesium is involved in intra- and
extracellular homeostasis and in cellular respiration (Gatlin III, 2010). It also is abundant in
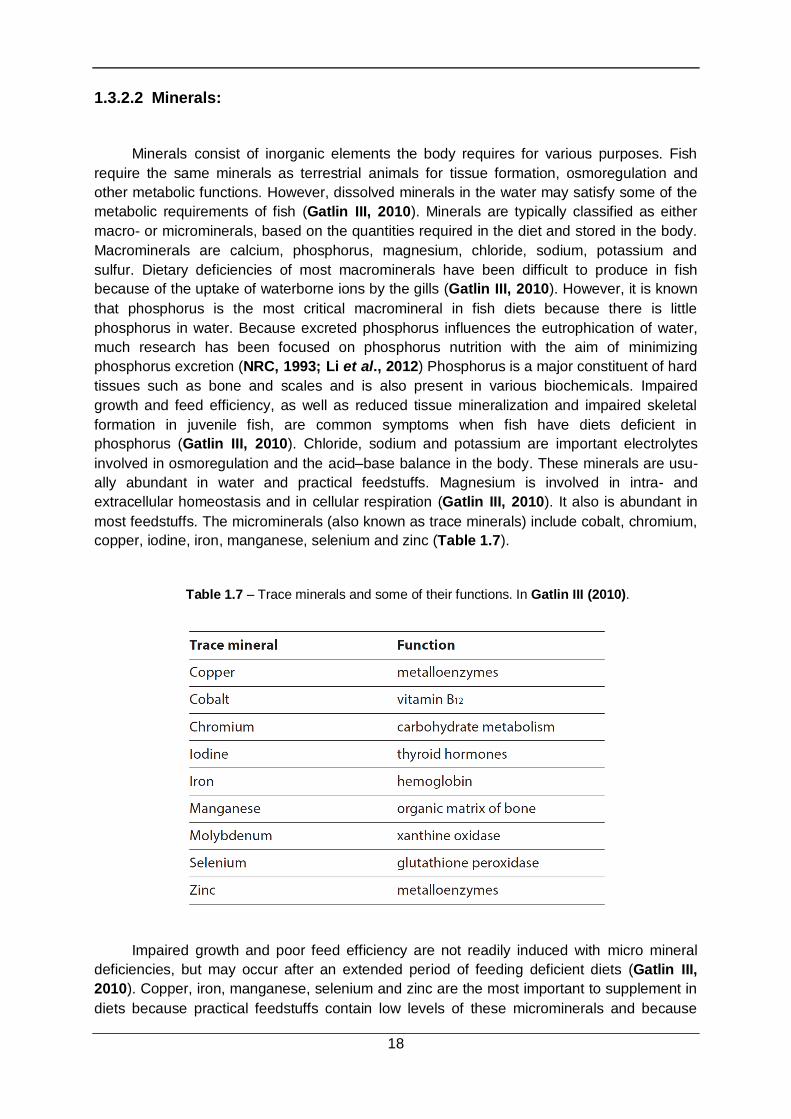
most feedstuffs. The microminerals (also known as trace minerals) include cobalt, chromium,
copper, iodine, iron, manganese, selenium and zinc (Table 1.7).
Table 1.7 – Trace minerals and some of their functions. In Gatlin III (2010).
Impaired growth and poor feed efficiency are not readily induced with micro mineral
deficiencies, but may occur after an extended period of feeding deficient diets (Gatlin III,
2010). Copper, iron, manganese, selenium and zinc are the most important to supplement in
diets because practical feedstuffs contain low levels of these microminerals and because

19
interactions with other dietary components may reduce their bioavailability (Gatlin III, 2010).
Although it is not usually necessary to supplement practical diets with other microminerals,
an inexpensive trace mineral premix can be added to nutritionally complete diets to ensure
an adequate trace mineral content.
1.4 OBJECTIVES:
Nowadays, there are no specific feeds for meagre. A 12 weeks feeding trial was
undertaken to assess the effect of controlled dietary changes in terms of protein:lipid ratios
on the growth performance, nutrient utilization and whole-body composition of juvenile
meagre. Moreover, the effect of the various dietary treatments on fat deposition (liver and
muscle) and the fillet fatty acid profile was also characterized.
2 MATERIALS AND METHODS
2.1 Experimental diets:
Five isoenergetic (21.92±0.57 MJ/kg mean gross energy) extruded diets were
formulated by SPAROS, Lda. (Loulé, Portugal), a commercial feed company, to provide two
dietary protein levels of 44% and 50%, and three dietary lipid levels of 12%, 15% and 18%.
According to those levels, the feeds were named 44L15, 44L18, 50L12, 50L15 and 50L18,
with first number being %crude protein and second number %crude fat. Ingredients and
proximate composition (Table 2.1) of the experimental diets were assessed by SPAROS,
Lda.
Table 2.1 - Formulation and proximate composition of the experimental diets. By SPAROS,
Lda.
44L15 44L18 50L12 50L15 50L18
Ingredients: % % % % %
Fishmeal LT (Peruvian) 22,00 22,00 22,00 22,00 22,00
Fishmeal 60/9 15,00 15,00 15,00 15,00 15,00
CPSP 90 3,00 3,00 5,00 5,00 5,00
Squid meal 3,00 3,00 5,00 5,00 5,00
Corn gluten 6,00 6,00 8,50 9,00 10,00
Soybean meal 48 9,00 10,00 13,00 13,00 14,00
Wheat meal 19,00 15,80 15,00 11,80 8,50
Pea bran 10,60 9,80 7,80 7,50 5,50
Fish oil 9,70 12,70 6,00 9,00 12,30
Vitamin & Mineral Premix 1 1,00 1,00 1,00 1,00 1,00
Dicalcium phosphate (DCP) 1,20 1,20 1,20 1,20 1,20
Binder (Kilseghur) 0,50 0,50 0,50 0,50 0,50
TOTAL 100,00 100,00 100,00 100,00 100,00
20
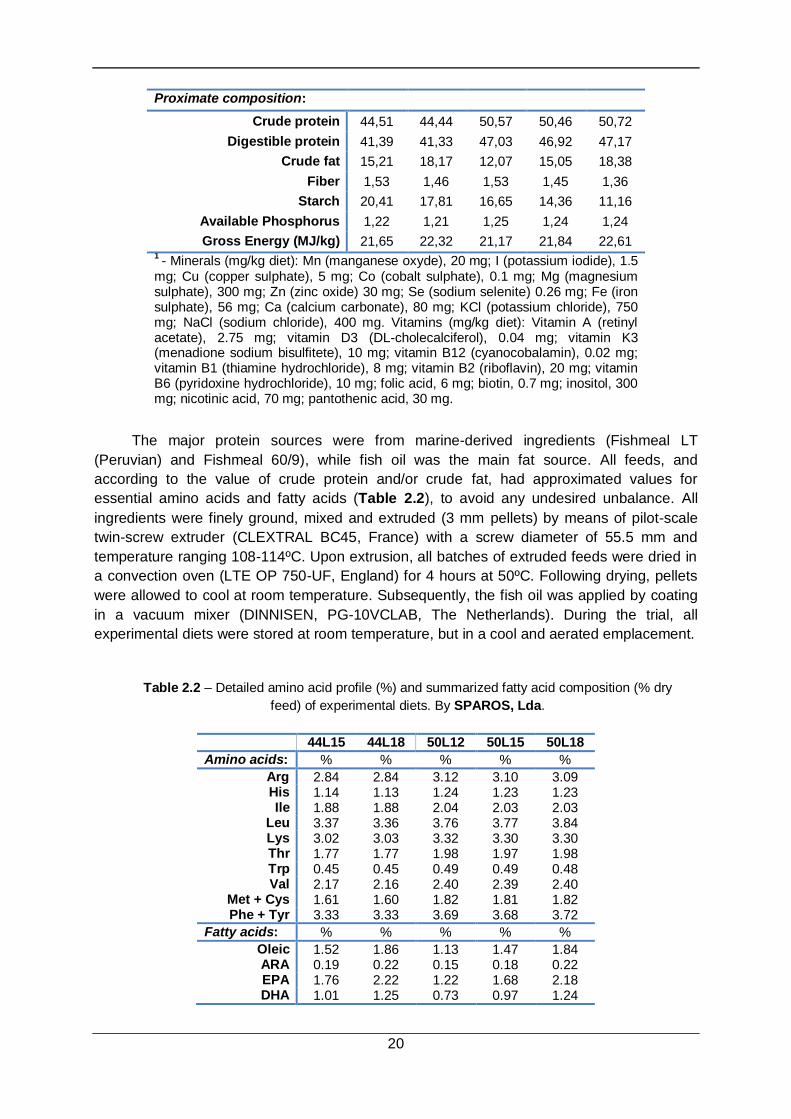
Proximate composition:
Crude protein 44,51 44,44 50,57 50,46 50,72
Digestible protein 41,39 41,33 47,03 46,92 47,17
Crude fat 15,21 18,17 12,07 15,05 18,38
Fiber 1,53 1,46 1,53 1,45 1,36
Starch 20,41 17,81 16,65 14,36 11,16
Available Phosphorus 1,22 1,21 1,25 1,24 1,24
Gross Energy (MJ/kg) 21,65 22,32 21,17 21,84 22,61 1 - Minerals (mg/kg diet): Mn (manganese oxyde), 20 mg; I (potassium iodide), 1.5
mg; Cu (copper sulphate), 5 mg; Co (cobalt sulphate), 0.1 mg; Mg (magnesium sulphate), 300 mg; Zn (zinc oxide) 30 mg; Se (sodium selenite) 0.26 mg; Fe (iron sulphate), 56 mg; Ca (calcium carbonate), 80 mg; KCl (potassium chloride), 750 mg; NaCl (sodium chloride), 400 mg. Vitamins (mg/kg diet): Vitamin A (retinyl acetate), 2.75 mg; vitamin D3 (DL-cholecalciferol), 0.04 mg; vitamin K3 (menadione sodium bisulfitete), 10 mg; vitamin B12 (cyanocobalamin), 0.02 mg; vitamin B1 (thiamine hydrochloride), 8 mg; vitamin B2 (riboflavin), 20 mg; vitamin B6 (pyridoxine hydrochloride), 10 mg; folic acid, 6 mg; biotin, 0.7 mg; inositol, 300 mg; nicotinic acid, 70 mg; pantothenic acid, 30 mg.
The major protein sources were from marine-derived ingredients (Fishmeal LT
(Peruvian) and Fishmeal 60/9), while fish oil was the main fat source. All feeds, and
according to the value of crude protein and/or crude fat, had approximated values for
essential amino acids and fatty acids (Table 2.2), to avoid any undesired unbalance. All
ingredients were finely ground, mixed and extruded (3 mm pellets) by means of pilot-scale
twin-screw extruder (CLEXTRAL BC45, France) with a screw diameter of 55.5 mm and
temperature ranging 108-114ºC. Upon extrusion, all batches of extruded feeds were dried in
a convection oven (LTE OP 750-UF, England) for 4 hours at 50ºC. Following drying, pellets
were allowed to cool at room temperature. Subsequently, the fish oil was applied by coating
in a vacuum mixer (DINNISEN, PG-10VCLAB, The Netherlands). During the trial, all
experimental diets were stored at room temperature, but in a cool and aerated emplacement.
Table 2.2 – Detailed amino acid profile (%) and summarized fatty acid composition (% dry
feed) of experimental diets. By SPAROS, Lda.
44L15 44L18 50L12 50L15 50L18
Amino acids: % % % % %
Arg 2.84 2.84 3.12 3.10 3.09 His 1.14 1.13 1.24 1.23 1.23 Ile 1.88 1.88 2.04 2.03 2.03
Leu 3.37 3.36 3.76 3.77 3.84 Lys 3.02 3.03 3.32 3.30 3.30 Thr 1.77 1.77 1.98 1.97 1.98 Trp 0.45 0.45 0.49 0.49 0.48 Val 2.17 2.16 2.40 2.39 2.40
Met + Cys 1.61 1.60 1.82 1.81 1.82 Phe + Tyr 3.33 3.33 3.69 3.68 3.72
Fatty acids: % % % % %
Oleic 1.52 1.86 1.13 1.47 1.84 ARA 0.19 0.22 0.15 0.18 0.22 EPA 1.76 2.22 1.22 1.68 2.18 DHA 1.01 1.25 0.73 0.97 1.24
21
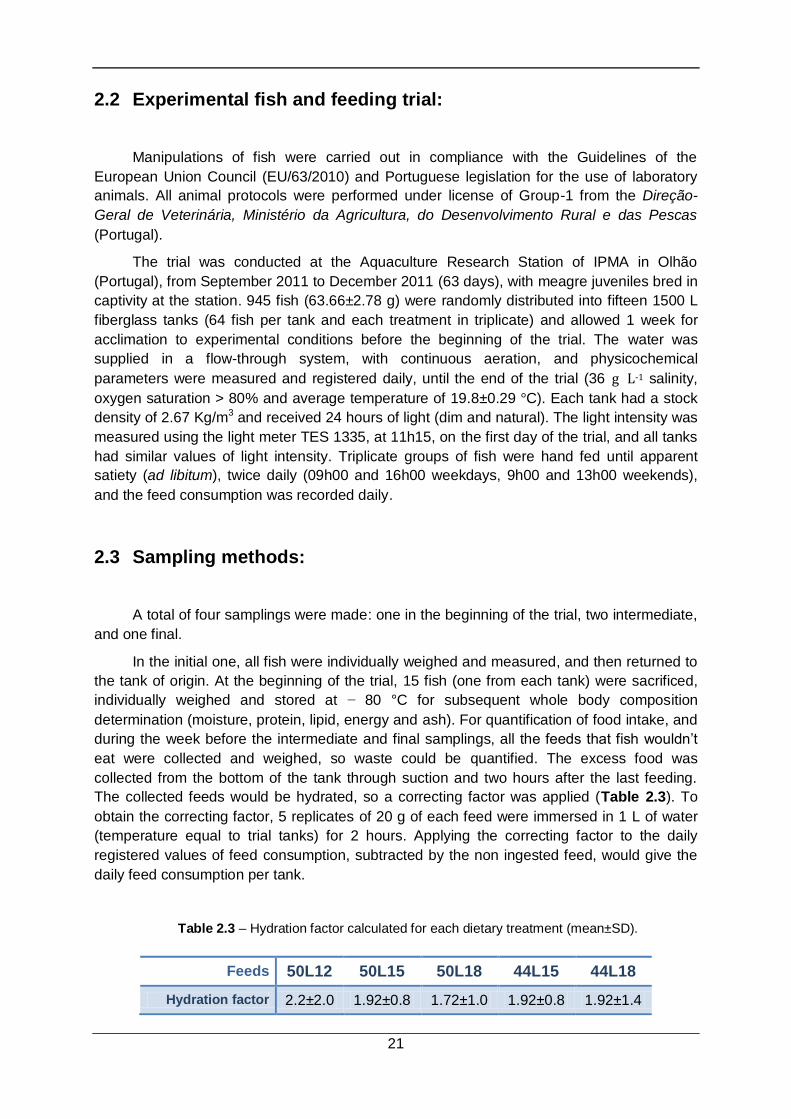
2.2 Experimental fish and feeding trial:
Manipulations of fish were carried out in compliance with the Guidelines of the
European Union Council (EU/63/2010) and Portuguese legislation for the use of laboratory
animals. All animal protocols were performed under license of Group-1 from the Direção-
Geral de Veterinária, Ministério da Agricultura, do Desenvolvimento Rural e das Pescas
(Portugal).
The trial was conducted at the Aquaculture Research Station of IPMA in Olhão
(Portugal), from September 2011 to December 2011 (63 days), with meagre juveniles bred in
captivity at the station. 945 fish (63.66±2.78 g) were randomly distributed into fifteen 1500 L
fiberglass tanks (64 fish per tank and each treatment in triplicate) and allowed 1 week for
acclimation to experimental conditions before the beginning of the trial. The water was
supplied in a flow-through system, with continuous aeration, and physicochemical
parameters were measured and registered daily, until the end of the trial (36 g L-1 salinity,
oxygen saturation > 80% and average temperature of 19.8±0.29 °C). Each tank had a stock
density of 2.67 Kg/m3 and received 24 hours of light (dim and natural). The light intensity was
measured using the light meter TES 1335, at 11h15, on the first day of the trial, and all tanks
had similar values of light intensity. Triplicate groups of fish were hand fed until apparent
satiety (ad libitum), twice daily (09h00 and 16h00 weekdays, 9h00 and 13h00 weekends),
and the feed consumption was recorded daily.
2.3 Sampling methods:
A total of four samplings were made: one in the beginning of the trial, two intermediate,
and one final.
In the initial one, all fish were individually weighed and measured, and then returned to
the tank of origin. At the beginning of the trial, 15 fish (one from each tank) were sacrificed,
individually weighed and stored at − 80 °C for subsequent whole body composition
determination (moisture, protein, lipid, energy and ash). For quantification of food intake, and
during the week before the intermediate and final samplings, all the feeds that fish wouldn’t
eat were collected and weighed, so waste could be quantified. The excess food was
collected from the bottom of the tank through suction and two hours after the last feeding.
The collected feeds would be hydrated, so a correcting factor was applied (Table 2.3). To
obtain the correcting factor, 5 replicates of 20 g of each feed were immersed in 1 L of water
(temperature equal to trial tanks) for 2 hours. Applying the correcting factor to the daily
registered values of feed consumption, subtracted by the non ingested feed, would give the
daily feed consumption per tank.
Table 2.3 – Hydration factor calculated for each dietary treatment (mean±SD).
Feeds 50L12 50L15 50L18 44L15 44L18
Hydration factor 2.2±2.0 1.92±0.8 1.72±1.0 1.92±0.8 1.92±1.4
22
After the week where collection of hydrated feeds took place and prior to the
intermediate samples, fish were fasted for 24 h, and then, in groups of 10 from each tank,
they were counted and weighed individually, and then returned to the tank of origin.
At the end of the trial and after the fast of 24 h, twelve fish from each tank were
randomly chosen and anesthetized with 2-phenoxyethanol (0,15 ml.L-1). All 12 fish were
sacrificed, measured and weighed individually (bench scale Kern & Sohn Gmbh, model ITB
35K1IP, readout 1 g). From those 12 fish, six were stored at -20 °C for whole body
composition; from the other six fish, liver and viscera weights were recorded for
hepatosomatic and visceral index determination, and frozen at -80 °C, such as muscle fillet
samples (area from head to pelvic fin). To avoid the oxidation of the lipid content in the
samples of liver, viscera and muscle, and since they will be used for determination of the lipid
content and fatty acid composition profile, all were lyophilized during 48h (Heto PowerDry
LL3000).
2.4 Analytical methods
2.4.1 Proximate analysis of diets and fish tissues
For determination of the proximate chemical composition of the experimental diets and
freeze-dried whole body of fish the following procedures were used: dry matter by drying at
105 °C, for 24 h in a P-Selecta 207 oven; ash by combustion at 550 °C for 12 h in a muffle
furnace; crude protein (N×6.25) by the Kjeldahl method after acid digestion; crude fat after
petroleum ether extraction by the Soxhlet method and a SOXTEC System HT6 extractor;
gross energy in an adiabatic bomb calorimeter (Werke C2000, IKA, Staufen, Germany).
Amino acids profiles of diets were obtained after hydrolysis in 6 M HCL at 108 °C over 24 h
in nitrogen-flushed glass vials. A Waters Pico-Tag reversed phase HPLC system, using
norleucine as an internal standard, was used. The resulting chromatograms were analyzed
with Breeze software (Waters, USA). Tryptophan was not analyzed since it is destroyed by
acid hydrolysis, while glutamine and asparagine are converted to glutamate and aspartate,
respectively, during acid hydrolysis.
2.4.2 Growth performance
Biological evaluation of feed ingredients and finished feeds involves feeding fish and
analyzing some aspect of fish performance and/or diet digestibility. Therefore, several
indices should be calculated, to assess the performance of feeds, their retention in the
carcass, and the values of nutrients that fish gain through the trial. At the end of the trial, to
assess the performance of feeds, indices were calculated – Specific Growth Rate (SGR),
Feed Conversion Ratio (FCR), Protein Efficiency Ratio (PER), and Voluntary Feed Index
(VFI) – retention, in which the deposition of a nutrient in the carcass over a short time is
measured, and gain, was calculated for protein, fat and energy.
Accurate prediction of the growth potential of a fish stock, under given husbandry
conditions, is an inevitable prerequisite to estimate the energy or feed requirement (e.g.,
23
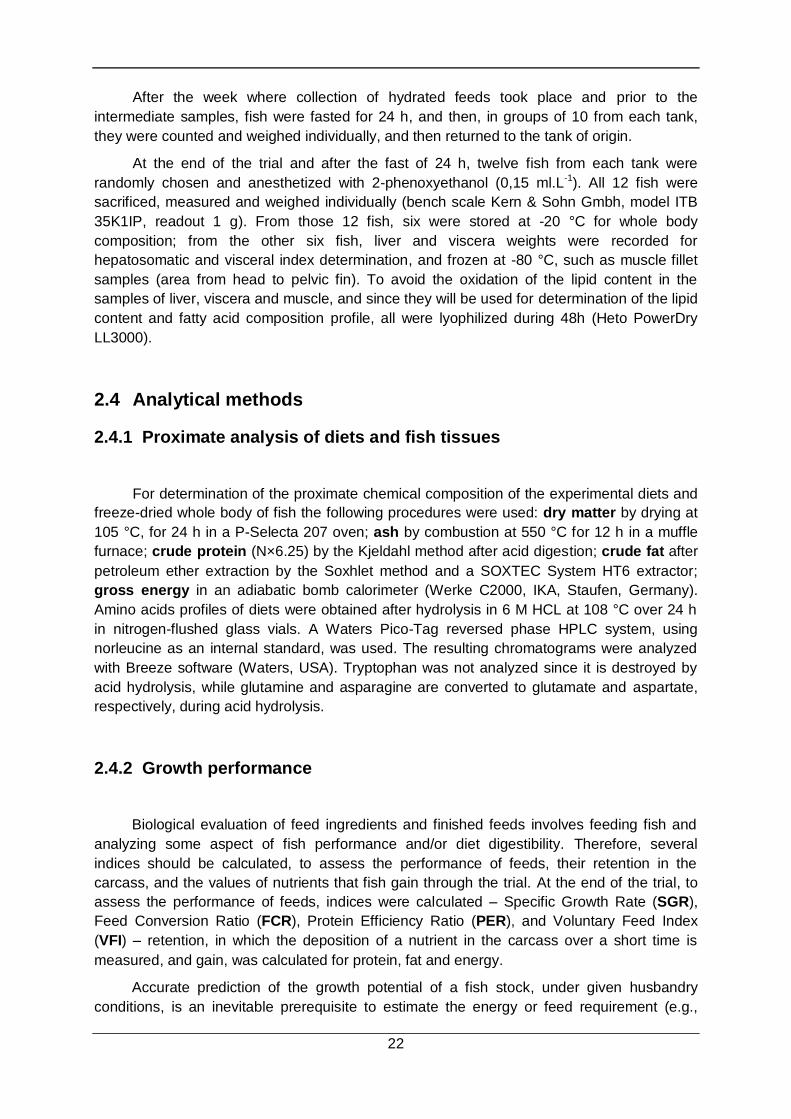
weekly ration). The formula most commonly used for fish growth rate expression is the
instantaneous growth rate, known as the Specific Growth Rate, which is based on the
natural logarithm of body weight, and can be used to compare growth on a daily basis:
In this formula, FBW is the final mean body weight (g); IBW, the initial mean body
weight (g); and D, the number of days. The SGR has been widely used by most biologists to
describe the growth rate of fish, being dependent on the IBW, with comparisons of growth
rates among groups made with similar IBW.
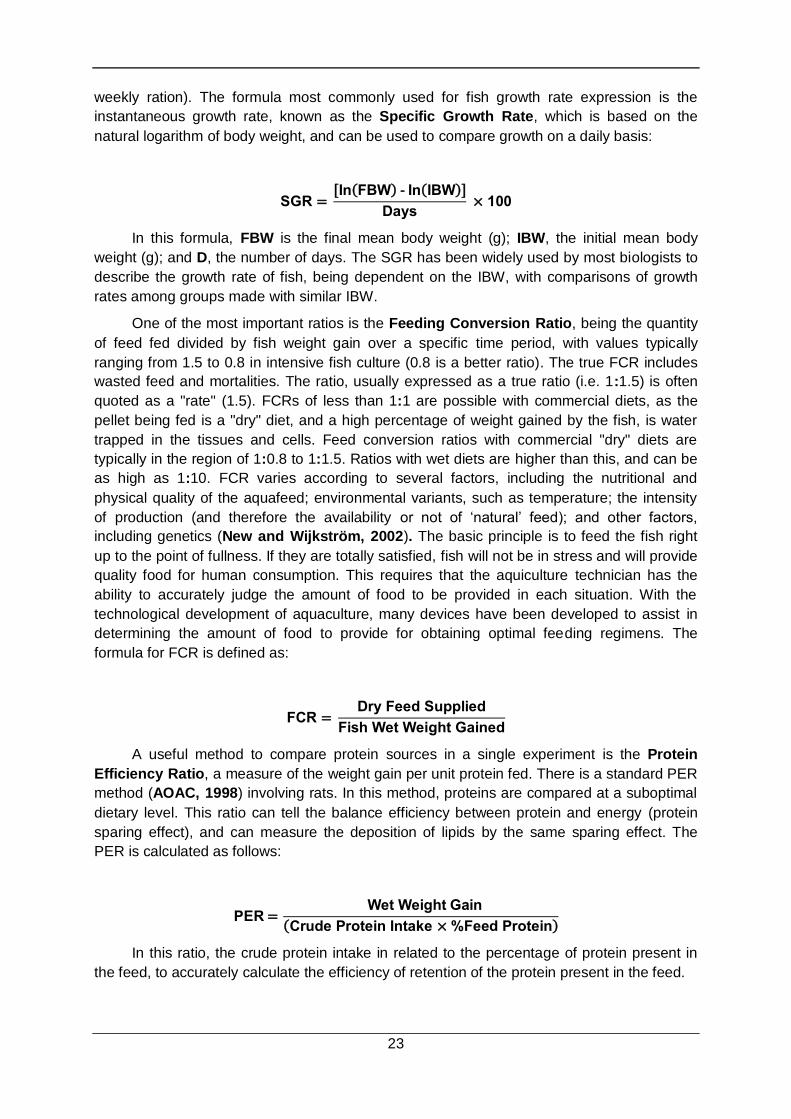
One of the most important ratios is the Feeding Conversion Ratio, being the quantity
of feed fed divided by fish weight gain over a specific time period, with values typically
ranging from 1.5 to 0.8 in intensive fish culture (0.8 is a better ratio). The true FCR includes
wasted feed and mortalities. The ratio, usually expressed as a true ratio (i.e. 1:1.5) is often
quoted as a "rate" (1.5). FCRs of less than 1:1 are possible with commercial diets, as the
pellet being fed is a "dry" diet, and a high percentage of weight gained by the fish, is water
trapped in the tissues and cells. Feed conversion ratios with commercial "dry" diets are
typically in the region of 1:0.8 to 1:1.5. Ratios with wet diets are higher than this, and can be
as high as 1:10. FCR varies according to several factors, including the nutritional and
physical quality of the aquafeed; environmental variants, such as temperature; the intensity
of production (and therefore the availability or not of ‘natural’ feed); and other factors,
including genetics (New and Wijkström, 2002). The basic principle is to feed the fish right
up to the point of fullness. If they are totally satisfied, fish will not be in stress and will provide
quality food for human consumption. This requires that the aquiculture technician has the
ability to accurately judge the amount of food to be provided in each situation. With the
technological development of aquaculture, many devices have been developed to assist in
determining the amount of food to provide for obtaining optimal feeding regimens. The
formula for FCR is defined as:
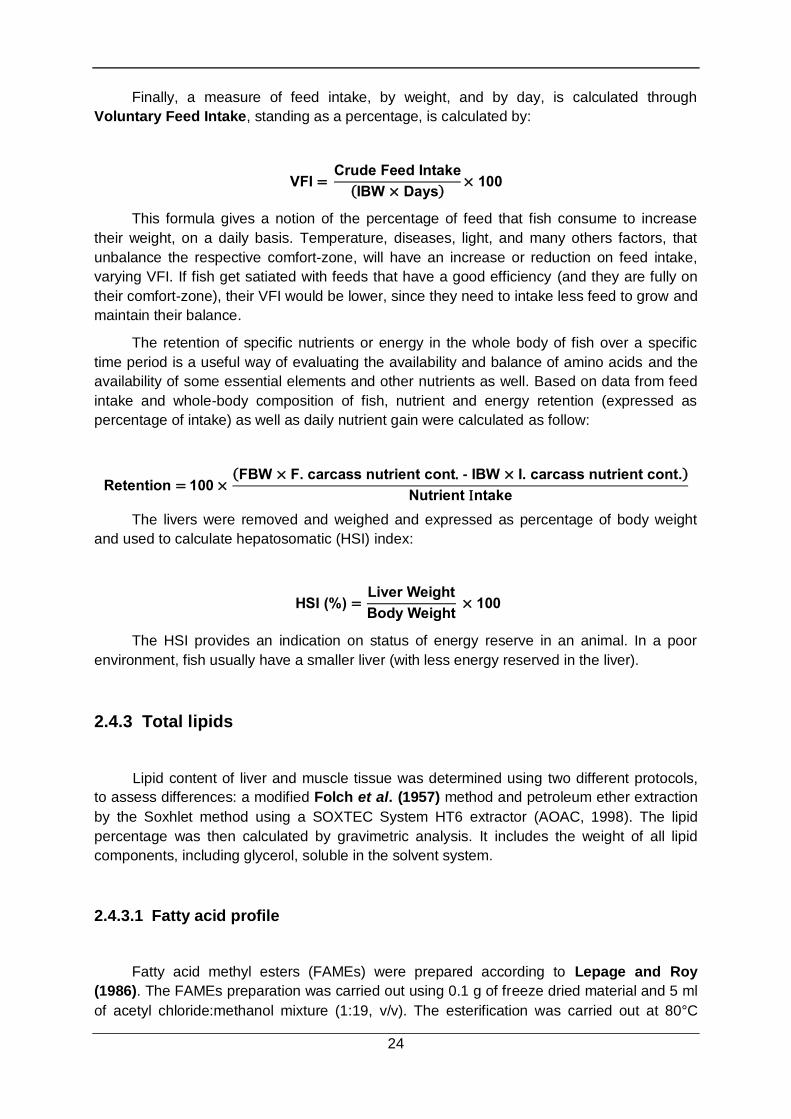
A useful method to compare protein sources in a single experiment is the Protein
Efficiency Ratio, a measure of the weight gain per unit protein fed. There is a standard PER
method (AOAC, 1998) involving rats. In this method, proteins are compared at a suboptimal
dietary level. This ratio can tell the balance efficiency between protein and energy (protein
sparing effect), and can measure the deposition of lipids by the same sparing effect. The
PER is calculated as follows:
In this ratio, the crude protein intake in related to the percentage of protein present in
the feed, to accurately calculate the efficiency of retention of the protein present in the feed.
24
Finally, a measure of feed intake, by weight, and by day, is calculated through
Voluntary Feed Intake, standing as a percentage, is calculated by:
This formula gives a notion of the percentage of feed that fish consume to increase
their weight, on a daily basis. Temperature, diseases, light, and many others factors, that
unbalance the respective comfort-zone, will have an increase or reduction on feed intake,
varying VFI. If fish get satiated with feeds that have a good efficiency (and they are fully on
their comfort-zone), their VFI would be lower, since they need to intake less feed to grow and
maintain their balance.
The retention of specific nutrients or energy in the whole body of fish over a specific
time period is a useful way of evaluating the availability and balance of amino acids and the
availability of some essential elements and other nutrients as well. Based on data from feed
intake and whole-body composition of fish, nutrient and energy retention (expressed as
percentage of intake) as well as daily nutrient gain were calculated as follow:
The livers were removed and weighed and expressed as percentage of body weight
and used to calculate hepatosomatic (HSI) index:
The HSI provides an indication on status of energy reserve in an animal. In a poor
environment, fish usually have a smaller liver (with less energy reserved in the liver).
2.4.3 Total lipids
Lipid content of liver and muscle tissue was determined using two different protocols,
to assess differences: a modified Folch et al. (1957) method and petroleum ether extraction
by the Soxhlet method using a SOXTEC System HT6 extractor (AOAC, 1998). The lipid
percentage was then calculated by gravimetric analysis. It includes the weight of all lipid
components, including glycerol, soluble in the solvent system.
2.4.3.1 Fatty acid profile
Fatty acid methyl esters (FAMEs) were prepared according to Lepage and Roy
(1986). The FAMEs preparation was carried out using 0.1 g of freeze dried material and 5 ml
of acetyl chloride:methanol mixture (1:19, v/v). The esterification was carried out at 80°C
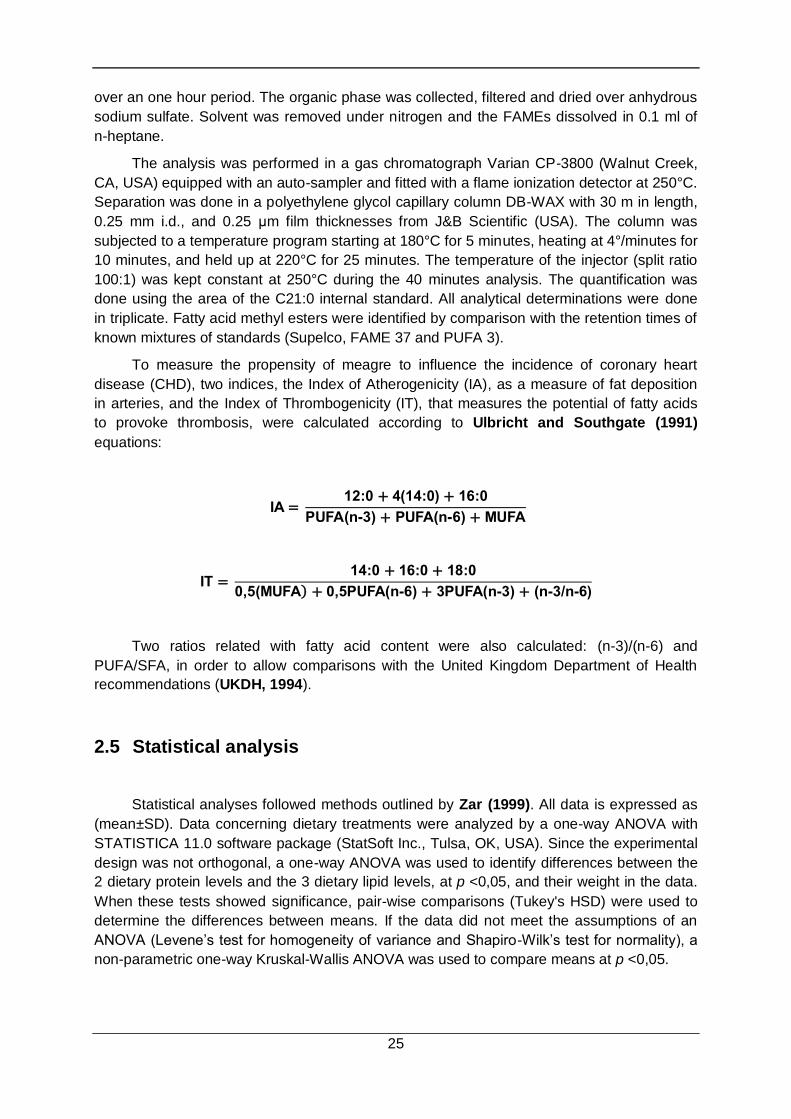
25
over an one hour period. The organic phase was collected, filtered and dried over anhydrous
sodium sulfate. Solvent was removed under nitrogen and the FAMEs dissolved in 0.1 ml of
n-heptane.
The analysis was performed in a gas chromatograph Varian CP-3800 (Walnut Creek,
CA, USA) equipped with an auto-sampler and fitted with a flame ionization detector at 250°C.
Separation was done in a polyethylene glycol capillary column DB-WAX with 30 m in length,
0.25 mm i.d., and 0.25 μm film thicknesses from J&B Scientific (USA). The column was
subjected to a temperature program starting at 180°C for 5 minutes, heating at 4°/minutes for
10 minutes, and held up at 220°C for 25 minutes. The temperature of the injector (split ratio
100:1) was kept constant at 250°C during the 40 minutes analysis. The quantification was
done using the area of the C21:0 internal standard. All analytical determinations were done
in triplicate. Fatty acid methyl esters were identified by comparison with the retention times of
known mixtures of standards (Supelco, FAME 37 and PUFA 3).
To measure the propensity of meagre to influence the incidence of coronary heart
disease (CHD), two indices, the Index of Atherogenicity (IA), as a measure of fat deposition
in arteries, and the Index of Thrombogenicity (IT), that measures the potential of fatty acids
to provoke thrombosis, were calculated according to Ulbricht and Southgate (1991)
equations:
Two ratios related with fatty acid content were also calculated: (n-3)/(n-6) and
PUFA/SFA, in order to allow comparisons with the United Kingdom Department of Health
recommendations (UKDH, 1994).
2.5 Statistical analysis
Statistical analyses followed methods outlined by Zar (1999). All data is expressed as
(mean±SD). Data concerning dietary treatments were analyzed by a one-way ANOVA with
STATISTICA 11.0 software package (StatSoft Inc., Tulsa, OK, USA). Since the experimental
design was not orthogonal, a one-way ANOVA was used to identify differences between the
2 dietary protein levels and the 3 dietary lipid levels, at p <0,05, and their weight in the data.
When these tests showed significance, pair-wise comparisons (Tukey's HSD) were used to
determine the differences between means. If the data did not meet the assumptions of an
ANOVA (Levene’s test for homogeneity of variance and Shapiro-Wilk’s test for normality), a
non-parametric one-way Kruskal-Wallis ANOVA was used to compare means at p <0,05.
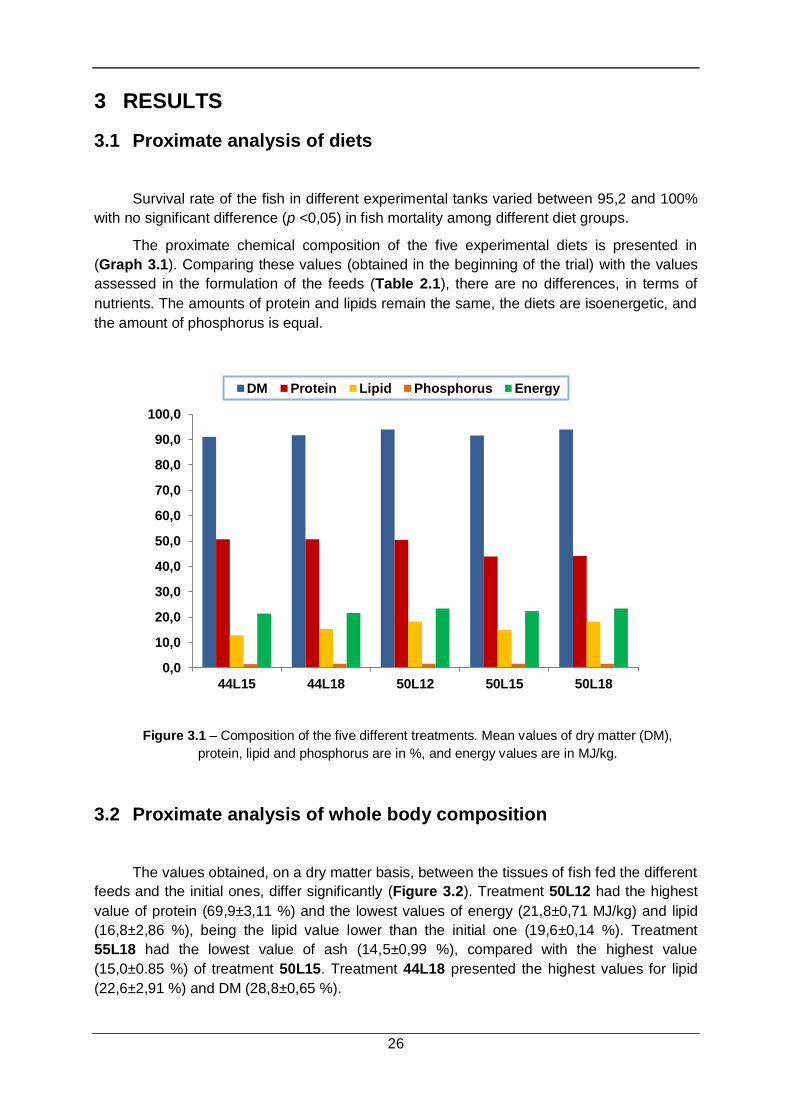
26
3 RESULTS
3.1 Proximate analysis of diets
Survival rate of the fish in different experimental tanks varied between 95,2 and 100%
with no significant difference (p <0,05) in fish mortality among different diet groups.
The proximate chemical composition of the five experimental diets is presented in
(Graph 3.1). Comparing these values (obtained in the beginning of the trial) with the values
assessed in the formulation of the feeds (Table 2.1), there are no differences, in terms of
nutrients. The amounts of protein and lipids remain the same, the diets are isoenergetic, and
the amount of phosphorus is equal.
Figure 3.1 – Composition of the five different treatments. Mean values of dry matter (DM),
protein, lipid and phosphorus are in %, and energy values are in MJ/kg.
3.2 Proximate analysis of whole body composition
The values obtained, on a dry matter basis, between the tissues of fish fed the different
feeds and the initial ones, differ significantly (Figure 3.2). Treatment 50L12 had the highest
value of protein (69,9±3,11 %) and the lowest values of energy (21,8±0,71 MJ/kg) and lipid
(16,8±2,86 %), being the lipid value lower than the initial one (19,6±0,14 %). Treatment
55L18 had the lowest value of ash (14,5±0,99 %), compared with the highest value
(15,0±0.85 %) of treatment 50L15. Treatment 44L18 presented the highest values for lipid
(22,6±2,91 %) and DM (28,8±0,65 %).
0,0
10,0
20,0
30,0
40,0
50,0
60,0
70,0
80,0
90,0
100,0
44L15 44L18 50L12 50L15 50L18
DM Protein Lipid Phosphorus Energy
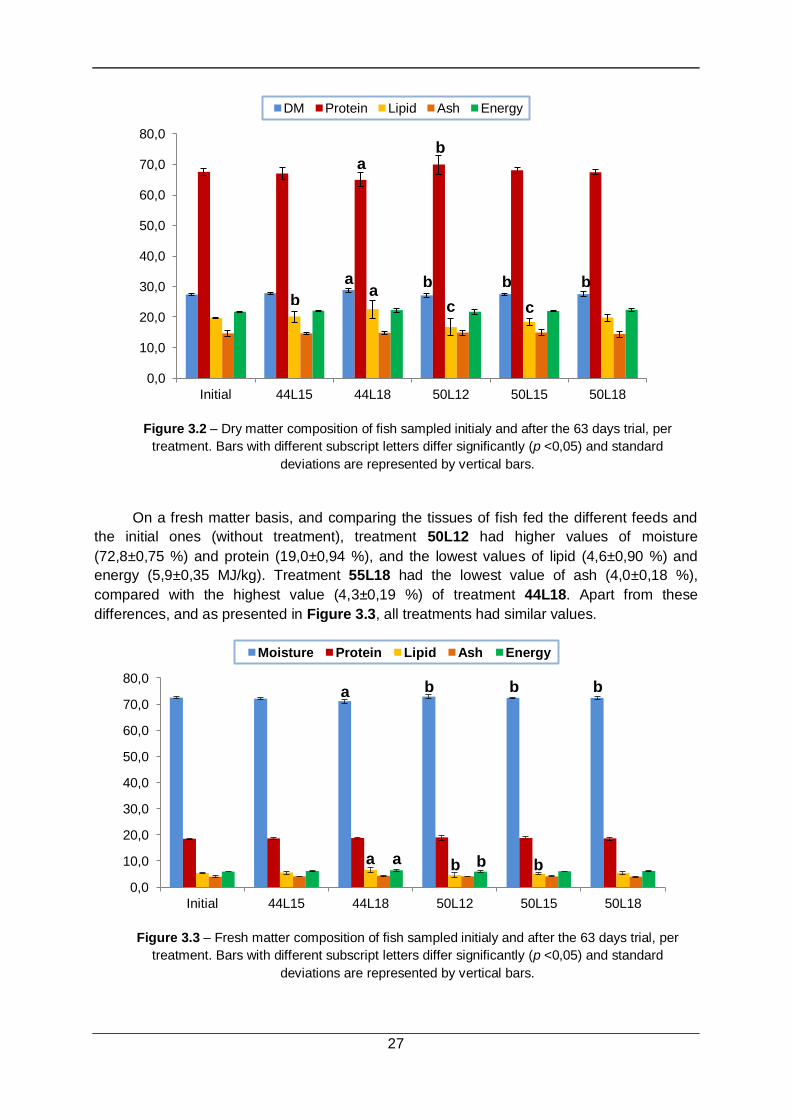
27
Figure 3.2 – Dry matter composition of fish sampled initialy and after the 63 days trial, per
treatment. Bars with different subscript letters differ significantly (p <0,05) and standard
deviations are represented by vertical bars.
On a fresh matter basis, and comparing the tissues of fish fed the different feeds and
the initial ones (without treatment), treatment 50L12 had higher values of moisture
(72,8±0,75 %) and protein (19,0±0,94 %), and the lowest values of lipid (4,6±0,90 %) and
energy (5,9±0,35 MJ/kg). Treatment 55L18 had the lowest value of ash (4,0±0,18 %),
compared with the highest value (4,3±0,19 %) of treatment 44L18. Apart from these
differences, and as presented in Figure 3.3, all treatments had similar values.
Figure 3.3 – Fresh matter composition of fish sampled initialy and after the 63 days trial, per
treatment. Bars with different subscript letters differ significantly (p <0,05) and standard
deviations are represented by vertical bars.
0,0
10,0
20,0
30,0
40,0
50,0
60,0
70,0
80,0
Initial 44L15 44L18 50L12 50L15 50L18
DM Protein Lipid Ash Energy
0,0
10,0
20,0
30,0
40,0
50,0
60,0
70,0
80,0
Initial 44L15 44L18 50L12 50L15 50L18
Moisture Protein Lipid Ash Energy
a
a a
a
a
a
b b
b
b b
c c
b
b b
b
b
b
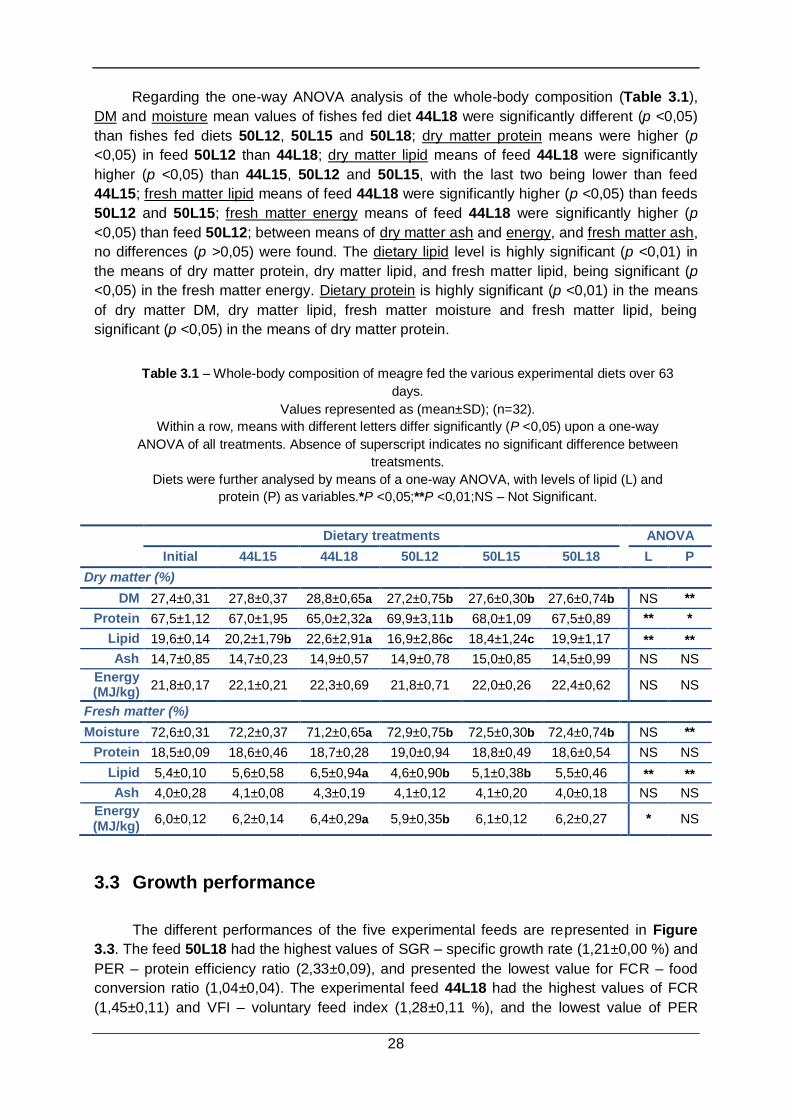
28
Regarding the one-way ANOVA analysis of the whole-body composition (Table 3.1),
DM and moisture mean values of fishes fed diet 44L18 were significantly different (p <0,05)
than fishes fed diets 50L12, 50L15 and 50L18; dry matter protein means were higher (p
<0,05) in feed 50L12 than 44L18; dry matter lipid means of feed 44L18 were significantly
higher (p <0,05) than 44L15, 50L12 and 50L15, with the last two being lower than feed
44L15; fresh matter lipid means of feed 44L18 were significantly higher (p <0,05) than feeds
50L12 and 50L15; fresh matter energy means of feed 44L18 were significantly higher (p
<0,05) than feed 50L12; between means of dry matter ash and energy, and fresh matter ash,
no differences (p >0,05) were found. The dietary lipid level is highly significant (p <0,01) in
the means of dry matter protein, dry matter lipid, and fresh matter lipid, being significant (p
<0,05) in the fresh matter energy. Dietary protein is highly significant (p <0,01) in the means
of dry matter DM, dry matter lipid, fresh matter moisture and fresh matter lipid, being
significant (p <0,05) in the means of dry matter protein.
Table 3.1 – Whole-body composition of meagre fed the various experimental diets over 63
days.
Values represented as (mean±SD); (n=32).
Within a row, means with different letters differ significantly (P <0,05) upon a one-way
ANOVA of all treatments. Absence of superscript indicates no significant difference between
treatsments.
Diets were further analysed by means of a one-way ANOVA, with levels of lipid (L) and
protein (P) as variables.*P <0,05;**P <0,01;NS – Not Significant.
3.3 Growth performance
The different performances of the five experimental feeds are represented in Figure
3.3. The feed 50L18 had the highest values of SGR – specific growth rate (1,21±0,00 %) and
PER – protein efficiency ratio (2,33±0,09), and presented the lowest value for FCR – food
conversion ratio (1,04±0,04). The experimental feed 44L18 had the highest values of FCR
(1,45±0,11) and VFI – voluntary feed index (1,28±0,11 %), and the lowest value of PER
Dietary treatments ANOVA
Initial 44L15 44L18 50L12 50L15 50L18 L P
Dry matter (%)
DM 27,4±0,31 27,8±0,37 28,8±0,65a 27,2±0,75b 27,6±0,30b 27,6±0,74b NS **
Protein 67,5±1,12 67,0±1,95 65,0±2,32a 69,9±3,11b 68,0±1,09 67,5±0,89 ** *
Lipid 19,6±0,14 20,2±1,79b 22,6±2,91a 16,9±2,86c 18,4±1,24c 19,9±1,17 ** **
Ash 14,7±0,85 14,7±0,23 14,9±0,57 14,9±0,78 15,0±0,85 14,5±0,99 NS NS
Energy (MJ/kg)
21,8±0,17 22,1±0,21 22,3±0,69 21,8±0,71 22,0±0,26 22,4±0,62 NS NS
Fresh matter (%)
Moisture 72,6±0,31 72,2±0,37 71,2±0,65a 72,9±0,75b 72,5±0,30b 72,4±0,74b NS **
Protein 18,5±0,09 18,6±0,46 18,7±0,28 19,0±0,94 18,8±0,49 18,6±0,54 NS NS
Lipid 5,4±0,10 5,6±0,58 6,5±0,94a 4,6±0,90b 5,1±0,38b 5,5±0,46 ** **
Ash 4,0±0,28 4,1±0,08 4,3±0,19 4,1±0,12 4,1±0,20 4,0±0,18 NS NS
Energy (MJ/kg)
6,0±0,12 6,2±0,14 6,4±0,29a 5,9±0,35b 6,1±0,12 6,2±0,27 * NS
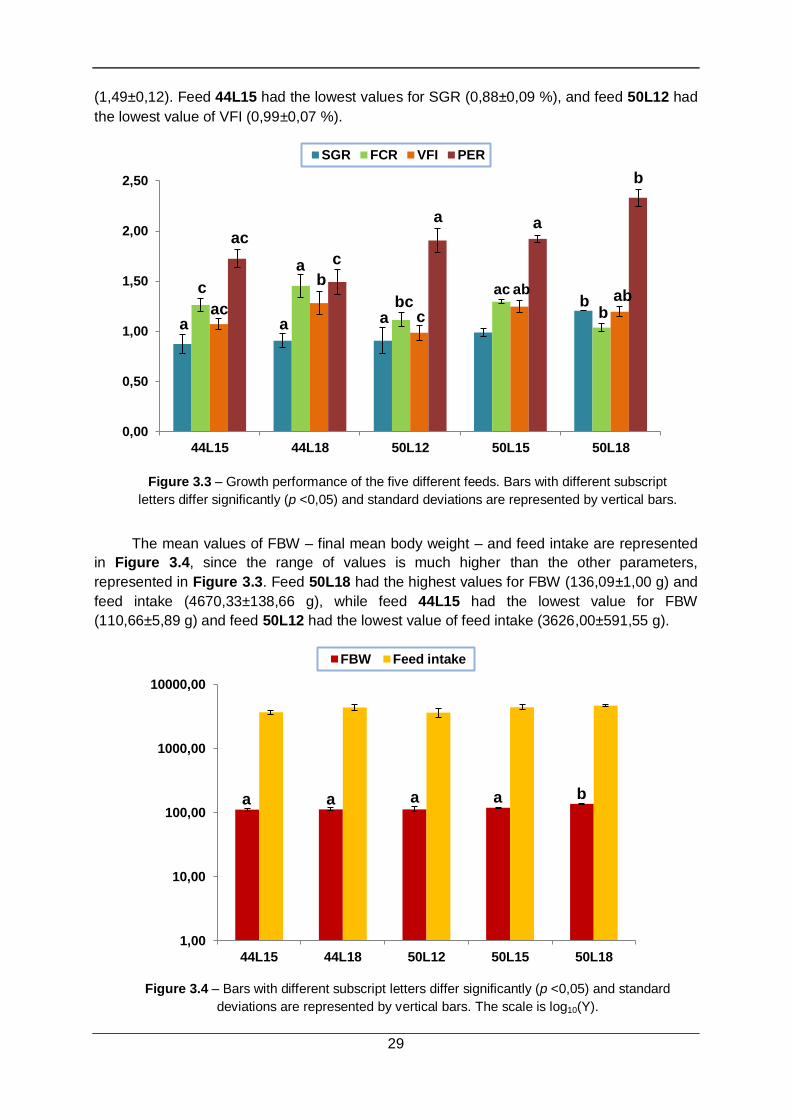
29
(1,49±0,12). Feed 44L15 had the lowest values for SGR (0,88±0,09 %), and feed 50L12 had
the lowest value of VFI (0,99±0,07 %).
Figure 3.3 – Growth performance of the five different feeds. Bars with different subscript
letters differ significantly (p <0,05) and standard deviations are represented by vertical bars.
The mean values of FBW – final mean body weight – and feed intake are represented
in Figure 3.4, since the range of values is much higher than the other parameters,
represented in Figure 3.3. Feed 50L18 had the highest values for FBW (136,09±1,00 g) and
feed intake (4670,33±138,66 g), while feed 44L15 had the lowest value for FBW
(110,66±5,89 g) and feed 50L12 had the lowest value of feed intake (3626,00±591,55 g).
Figure 3.4 – Bars with different subscript letters differ significantly (p <0,05) and standard
deviations are represented by vertical bars. The scale is log10(Y).
0,00
0,50
1,00
1,50
2,00
2,50
44L15 44L18 50L12 50L15 50L18
SGR FCR VFI PER
1,00
10,00
100,00
1000,00
10000,00
44L15 44L18 50L12 50L15 50L18
FBW Feed intake
a
a
a
a
a
a
c
a
b bc ac
b
ac
c
a a
b
ac
b
c
ab ab
a a a a b
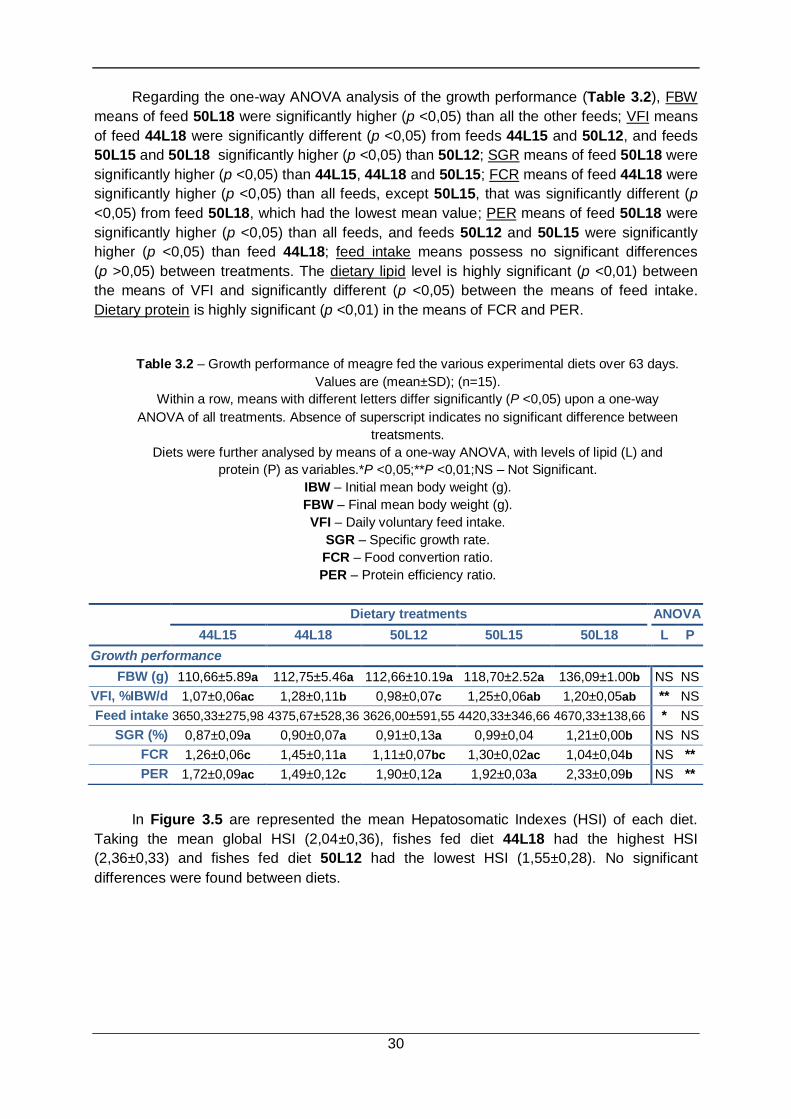
30
Regarding the one-way ANOVA analysis of the growth performance (Table 3.2), FBW
means of feed 50L18 were significantly higher (p <0,05) than all the other feeds; VFI means
of feed 44L18 were significantly different (p <0,05) from feeds 44L15 and 50L12, and feeds
50L15 and 50L18 significantly higher (p <0,05) than 50L12; SGR means of feed 50L18 were
significantly higher (p <0,05) than 44L15, 44L18 and 50L15; FCR means of feed 44L18 were
significantly higher (p <0,05) than all feeds, except 50L15, that was significantly different (p
<0,05) from feed 50L18, which had the lowest mean value; PER means of feed 50L18 were
significantly higher (p <0,05) than all feeds, and feeds 50L12 and 50L15 were significantly
higher (p <0,05) than feed 44L18; feed intake means possess no significant differences
(p >0,05) between treatments. The dietary lipid level is highly significant (p <0,01) between
the means of VFI and significantly different (p <0,05) between the means of feed intake.
Dietary protein is highly significant (p <0,01) in the means of FCR and PER.
Table 3.2 – Growth performance of meagre fed the various experimental diets over 63 days.
Values are (mean±SD); (n=15).
Within a row, means with different letters differ significantly (P <0,05) upon a one-way
ANOVA of all treatments. Absence of superscript indicates no significant difference between
treatsments.
Diets were further analysed by means of a one-way ANOVA, with levels of lipid (L) and
protein (P) as variables.*P <0,05;**P <0,01;NS – Not Significant.
IBW – Initial mean body weight (g).
FBW – Final mean body weight (g).
VFI – Daily voluntary feed intake.
SGR – Specific growth rate.
FCR – Food convertion ratio.
PER – Protein efficiency ratio.
In Figure 3.5 are represented the mean Hepatosomatic Indexes (HSI) of each diet.
Taking the mean global HSI (2,04±0,36), fishes fed diet 44L18 had the highest HSI
(2,36±0,33) and fishes fed diet 50L12 had the lowest HSI (1,55±0,28). No significant
differences were found between diets.
Dietary treatments ANOVA
44L15 44L18 50L12 50L15 50L18 L P
Growth performance
FBW (g) 110,66±5.89a 112,75±5.46a 112,66±10.19a 118,70±2.52a 136,09±1.00b NS NS
VFI, %IBW/d 1,07±0,06ac 1,28±0,11b 0,98±0,07c 1,25±0,06ab 1,20±0,05ab ** NS
Feed intake 3650,33±275,98 4375,67±528,36 3626,00±591,55 4420,33±346,66 4670,33±138,66 * NS
SGR (%) 0,87±0,09a 0,90±0,07a 0,91±0,13a 0,99±0,04 1,21±0,00b NS NS
FCR 1,26±0,06c 1,45±0,11a 1,11±0,07bc 1,30±0,02ac 1,04±0,04b NS **
PER 1,72±0,09ac 1,49±0,12c 1,90±0,12a 1,92±0,03a 2,33±0,09b NS **
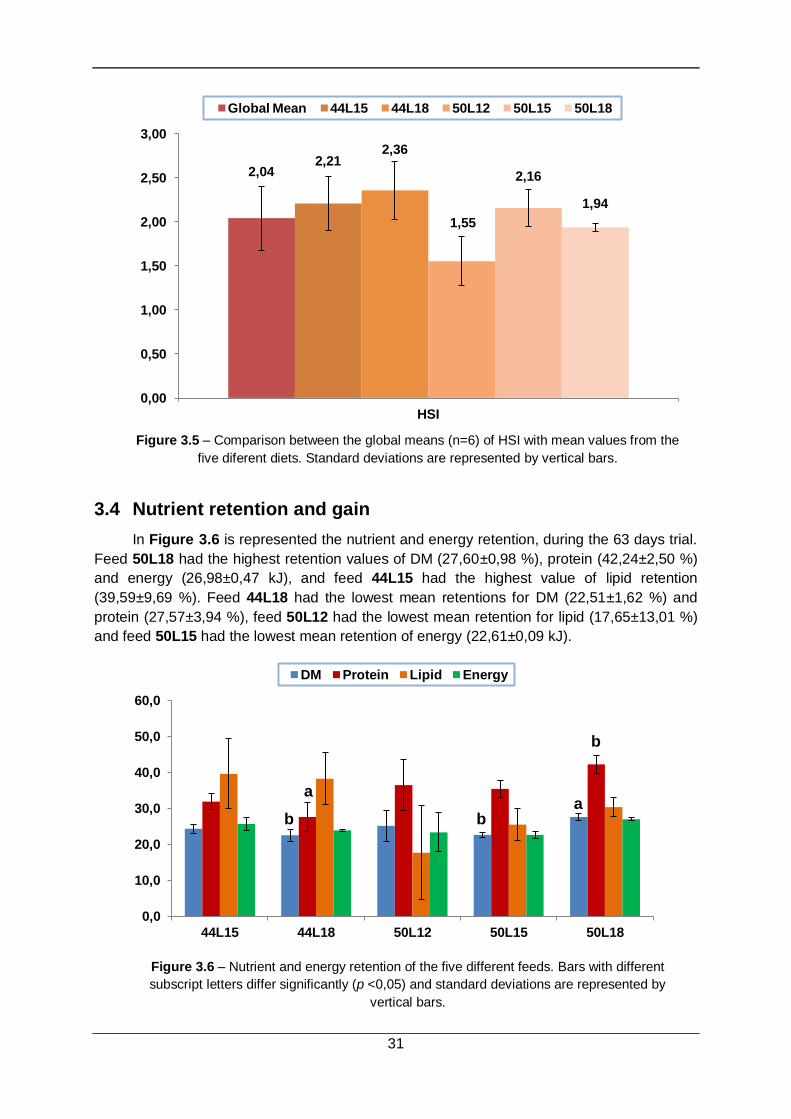
31
Figure 3.5 – Comparison between the global means (n=6) of HSI with mean values from the
five diferent diets. Standard deviations are represented by vertical bars.
3.4 Nutrient retention and gain
In Figure 3.6 is represented the nutrient and energy retention, during the 63 days trial.
Feed 50L18 had the highest retention values of DM (27,60±0,98 %), protein (42,24±2,50 %)
and energy (26,98±0,47 kJ), and feed 44L15 had the highest value of lipid retention
(39,59±9,69 %). Feed 44L18 had the lowest mean retentions for DM (22,51±1,62 %) and
protein (27,57±3,94 %), feed 50L12 had the lowest mean retention for lipid (17,65±13,01 %)
and feed 50L15 had the lowest mean retention of energy (22,61±0,09 kJ).
Figure 3.6 – Nutrient and energy retention of the five different feeds. Bars with different
subscript letters differ significantly (p <0,05) and standard deviations are represented by
vertical bars.
2,04 2,21
2,36
1,55
2,16
1,94
0,00
0,50
1,00
1,50
2,00
2,50
3,00
HSI
Global Mean 44L15 44L18 50L12 50L15 50L18
0,0
10,0
20,0
30,0
40,0
50,0
60,0
44L15 44L18 50L12 50L15 50L18
DM Protein Lipid Energy
b a
b
a
b
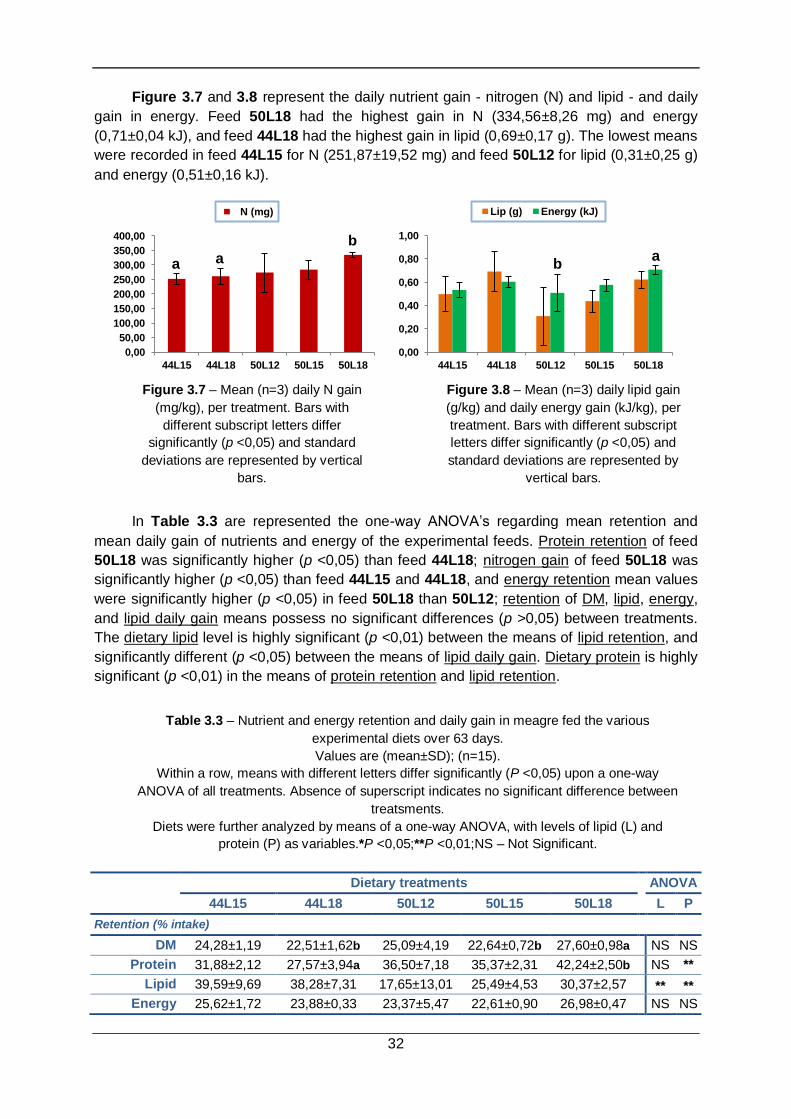
32
Figure 3.7 and 3.8 represent the daily nutrient gain - nitrogen (N) and lipid - and daily
gain in energy. Feed 50L18 had the highest gain in N (334,56±8,26 mg) and energy
(0,71±0,04 kJ), and feed 44L18 had the highest gain in lipid (0,69±0,17 g). The lowest means
were recorded in feed 44L15 for N (251,87±19,52 mg) and feed 50L12 for lipid (0,31±0,25 g)
and energy (0,51±0,16 kJ).
Figure 3.7 – Mean (n=3) daily N gain
(mg/kg), per treatment. Bars with
different subscript letters differ
significantly (p <0,05) and standard
deviations are represented by vertical
bars.
Figure 3.8 – Mean (n=3) daily lipid gain
(g/kg) and daily energy gain (kJ/kg), per
treatment. Bars with different subscript
letters differ significantly (p <0,05) and
standard deviations are represented by
vertical bars.
In Table 3.3 are represented the one-way ANOVA’s regarding mean retention and
mean daily gain of nutrients and energy of the experimental feeds. Protein retention of feed
50L18 was significantly higher (p <0,05) than feed 44L18; nitrogen gain of feed 50L18 was
significantly higher (p <0,05) than feed 44L15 and 44L18, and energy retention mean values
were significantly higher (p <0,05) in feed 50L18 than 50L12; retention of DM, lipid, energy,
and lipid daily gain means possess no significant differences (p >0,05) between treatments.
The dietary lipid level is highly significant (p <0,01) between the means of lipid retention, and
significantly different (p <0,05) between the means of lipid daily gain. Dietary protein is highly
significant (p <0,01) in the means of protein retention and lipid retention.
Table 3.3 – Nutrient and energy retention and daily gain in meagre fed the various
experimental diets over 63 days.
Values are (mean±SD); (n=15).
Within a row, means with different letters differ significantly (P <0,05) upon a one-way
ANOVA of all treatments. Absence of superscript indicates no significant difference between
treatsments.
Diets were further analyzed by means of a one-way ANOVA, with levels of lipid (L) and
protein (P) as variables.*P <0,05;**P <0,01;NS – Not Significant.
0,00
50,00
100,00
150,00
200,00
250,00
300,00
350,00
400,00
44L15 44L18 50L12 50L15 50L18
N (mg)
0,00
0,20
0,40
0,60
0,80
1,00
44L15 44L18 50L12 50L15 50L18
Lip (g) Energy (kJ)
Dietary treatments ANOVA
44L15 44L18 50L12 50L15 50L18 L P
Retention (% intake)
DM 24,28±1,19 22,51±1,62b 25,09±4,19 22,64±0,72b 27,60±0,98a NS NS
Protein 31,88±2,12 27,57±3,94a 36,50±7,18 35,37±2,31 42,24±2,50b NS **
Lipid 39,59±9,69 38,28±7,31 17,65±13,01 25,49±4,53 30,37±2,57 ** **
Energy 25,62±1,72 23,88±0,33 23,37±5,47 22,61±0,90 26,98±0,47 NS NS
a a
b a
b
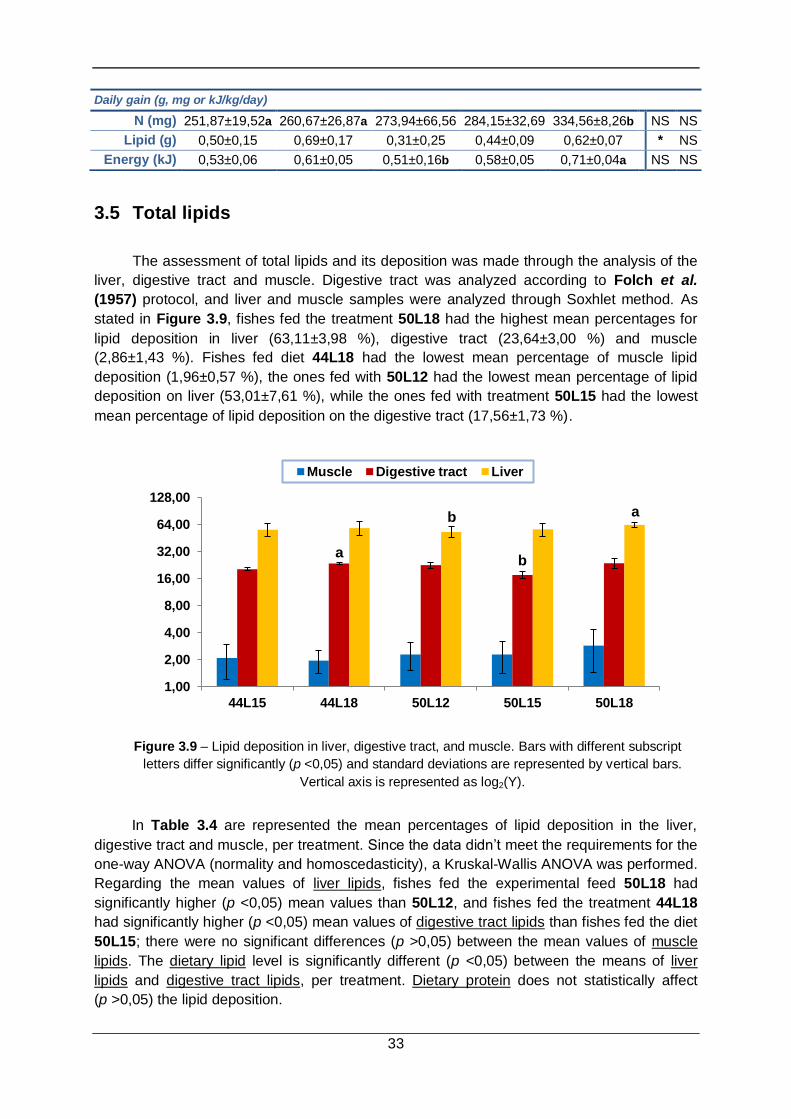
33
3.5 Total lipids
The assessment of total lipids and its deposition was made through the analysis of the
liver, digestive tract and muscle. Digestive tract was analyzed according to Folch et al.
(1957) protocol, and liver and muscle samples were analyzed through Soxhlet method. As
stated in Figure 3.9, fishes fed the treatment 50L18 had the highest mean percentages for
lipid deposition in liver (63,11±3,98 %), digestive tract (23,64±3,00 %) and muscle
(2,86±1,43 %). Fishes fed diet 44L18 had the lowest mean percentage of muscle lipid
deposition (1,96±0,57 %), the ones fed with 50L12 had the lowest mean percentage of lipid
deposition on liver (53,01±7,61 %), while the ones fed with treatment 50L15 had the lowest
mean percentage of lipid deposition on the digestive tract (17,56±1,73 %).
Figure 3.9 – Lipid deposition in liver, digestive tract, and muscle. Bars with different subscript
letters differ significantly (p <0,05) and standard deviations are represented by vertical bars.
Vertical axis is represented as log2(Y).
In Table 3.4 are represented the mean percentages of lipid deposition in the liver,
digestive tract and muscle, per treatment. Since the data didn’t meet the requirements for the
one-way ANOVA (normality and homoscedasticity), a Kruskal-Wallis ANOVA was performed.
Regarding the mean values of liver lipids, fishes fed the experimental feed 50L18 had
significantly higher (p <0,05) mean values than 50L12, and fishes fed the treatment 44L18
had significantly higher (p <0,05) mean values of digestive tract lipids than fishes fed the diet
50L15; there were no significant differences (p >0,05) between the mean values of muscle
lipids. The dietary lipid level is significantly different (p <0,05) between the means of liver
lipids and digestive tract lipids, per treatment. Dietary protein does not statistically affect
(p >0,05) the lipid deposition.
1,00
2,00
4,00
8,00
16,00
32,00
64,00
128,00
44L15 44L18 50L12 50L15 50L18
Muscle Digestive tract Liver
Daily gain (g, mg or kJ/kg/day)
N (mg) 251,87±19,52a 260,67±26,87a 273,94±66,56 284,15±32,69 334,56±8,26b NS NS
Lipid (g) 0,50±0,15 0,69±0,17 0,31±0,25 0,44±0,09 0,62±0,07 * NS
Energy (kJ) 0,53±0,06 0,61±0,05 0,51±0,16b 0,58±0,05 0,71±0,04a
NS NS
a
b
b
a
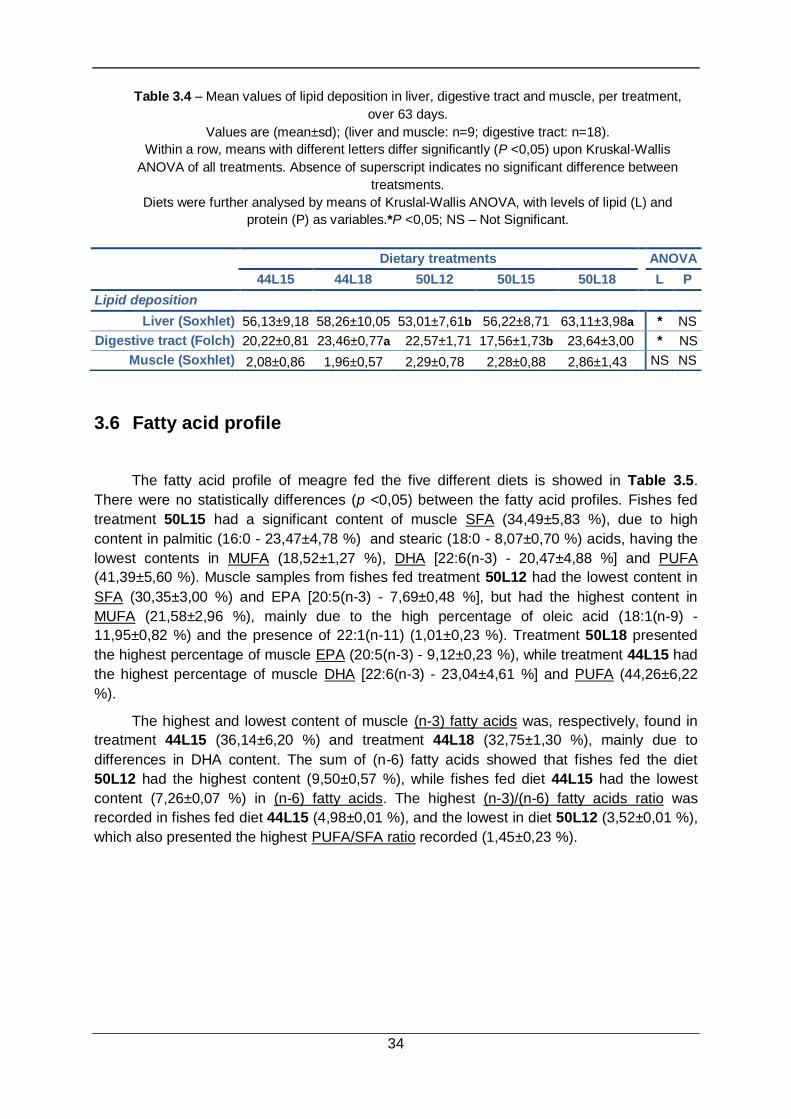
34
Table 3.4 – Mean values of lipid deposition in liver, digestive tract and muscle, per treatment,
over 63 days.
Values are (mean±sd); (liver and muscle: n=9; digestive tract: n=18).
Within a row, means with different letters differ significantly (P <0,05) upon Kruskal-Wallis
ANOVA of all treatments. Absence of superscript indicates no significant difference between
treatsments.
Diets were further analysed by means of Kruslal-Wallis ANOVA, with levels of lipid (L) and
protein (P) as variables.*P <0,05; NS – Not Significant.
3.6 Fatty acid profile
The fatty acid profile of meagre fed the five different diets is showed in Table 3.5.
There were no statistically differences (p <0,05) between the fatty acid profiles. Fishes fed
treatment 50L15 had a significant content of muscle SFA (34,49±5,83 %), due to high
content in palmitic (16:0 - 23,47±4,78 %) and stearic (18:0 - 8,07±0,70 %) acids, having the
lowest contents in MUFA (18,52±1,27 %), DHA [22:6(n-3) - 20,47±4,88 %] and PUFA
(41,39±5,60 %). Muscle samples from fishes fed treatment 50L12 had the lowest content in
SFA (30,35±3,00 %) and EPA [20:5(n-3) - 7,69±0,48 %], but had the highest content in
MUFA (21,58±2,96 %), mainly due to the high percentage of oleic acid (18:1(n-9) -
11,95±0,82 %) and the presence of 22:1(n-11) (1,01±0,23 %). Treatment 50L18 presented
the highest percentage of muscle EPA (20:5(n-3) - 9,12±0,23 %), while treatment 44L15 had
the highest percentage of muscle DHA [22:6(n-3) - 23,04±4,61 %] and PUFA (44,26±6,22
%).
The highest and lowest content of muscle (n-3) fatty acids was, respectively, found in
treatment 44L15 (36,14±6,20 %) and treatment 44L18 (32,75±1,30 %), mainly due to
differences in DHA content. The sum of (n-6) fatty acids showed that fishes fed the diet
50L12 had the highest content (9,50±0,57 %), while fishes fed diet 44L15 had the lowest
content (7,26±0,07 %) in (n-6) fatty acids. The highest (n-3)/(n-6) fatty acids ratio was
recorded in fishes fed diet 44L15 (4,98±0,01 %), and the lowest in diet 50L12 (3,52±0,01 %),
which also presented the highest PUFA/SFA ratio recorded (1,45±0,23 %).
Dietary treatments ANOVA
44L15 44L18 50L12 50L15 50L18 L P
Lipid deposition
Liver (Soxhlet) 56,13±9,18 58,26±10,05 53,01±7,61b 56,22±8,71 63,11±3,98a * NS
Digestive tract (Folch) 20,22±0,81 23,46±0,77a 22,57±1,71 17,56±1,73b 23,64±3,00 * NS
Muscle (Soxhlet) 2,08±0,86 1,96±0,57 2,29±0,78 2,28±0,88 2,86±1,43 NS NS
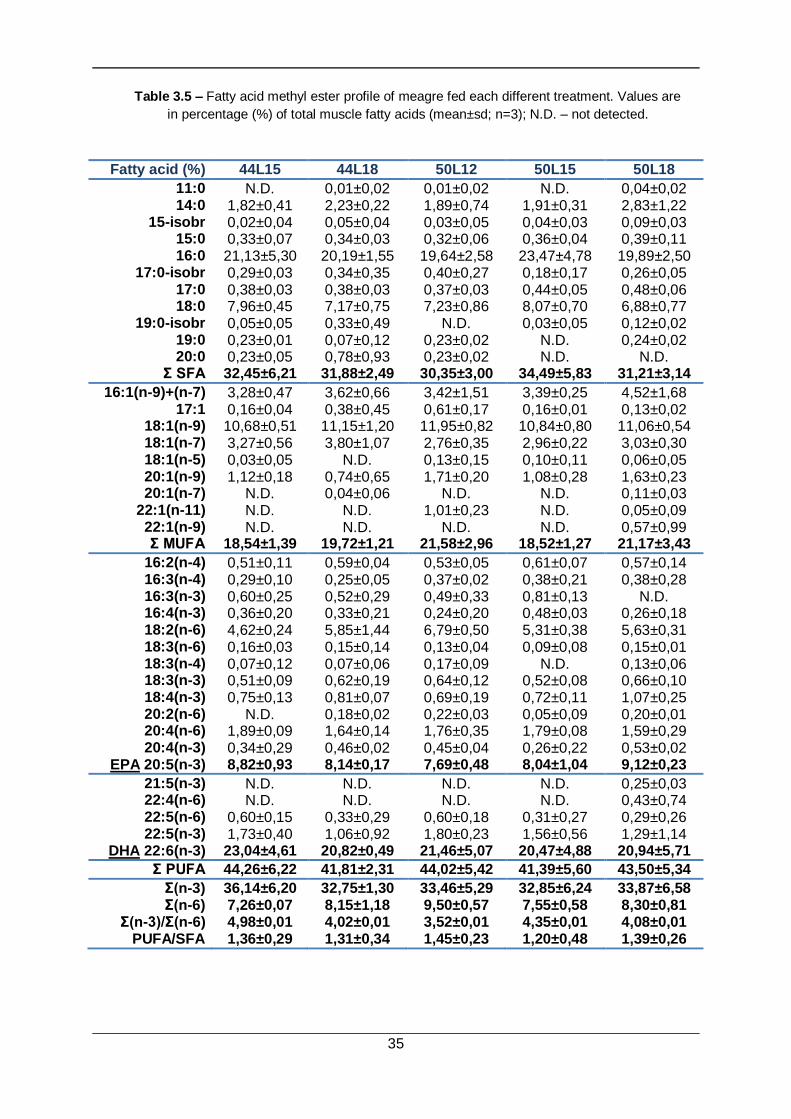
35
Table 3.5 – Fatty acid methyl ester profile of meagre fed each different treatment. Values are
in percentage (%) of total muscle fatty acids (mean±sd; n=3); N.D. – not detected.
Fatty acid (%) 44L15 44L18 50L12 50L15 50L18
11:0 N.D. 0,01±0,02 0,01±0,02 N.D. 0,04±0,02 14:0 1,82±0,41 2,23±0,22 1,89±0,74 1,91±0,31 2,83±1,22
15-isobr 0,02±0,04 0,05±0,04 0,03±0,05 0,04±0,03 0,09±0,03 15:0 0,33±0,07 0,34±0,03 0,32±0,06 0,36±0,04 0,39±0,11 16:0 21,13±5,30 20,19±1,55 19,64±2,58 23,47±4,78 19,89±2,50
17:0-isobr 0,29±0,03 0,34±0,35 0,40±0,27 0,18±0,17 0,26±0,05 17:0 0,38±0,03 0,38±0,03 0,37±0,03 0,44±0,05 0,48±0,06 18:0 7,96±0,45 7,17±0,75 7,23±0,86 8,07±0,70 6,88±0,77
19:0-isobr 0,05±0,05 0,33±0,49 N.D. 0,03±0,05 0,12±0,02 19:0 0,23±0,01 0,07±0,12 0,23±0,02 N.D. 0,24±0,02 20:0 0,23±0,05 0,78±0,93 0,23±0,02 N.D. N.D.
Σ 32,45±6,21 31,88±2,49 30,35±3,00 34,49±5,83 31,21±3,14
16:1(n-9)+(n-7) 3,28±0,47 3,62±0,66 3,42±1,51 3,39±0,25 4,52±1,68 17:1 0,16±0,04 0,38±0,45 0,61±0,17 0,16±0,01 0,13±0,02
18:1(n-9) 10,68±0,51 11,15±1,20 11,95±0,82 10,84±0,80 11,06±0,54 18:1(n-7) 3,27±0,56 3,80±1,07 2,76±0,35 2,96±0,22 3,03±0,30 18:1(n-5) 0,03±0,05 N.D. 0,13±0,15 0,10±0,11 0,06±0,05 20:1(n-9) 1,12±0,18 0,74±0,65 1,71±0,20 1,08±0,28 1,63±0,23 20:1(n-7) N.D. 0,04±0,06 N.D. N.D. 0,11±0,03
22:1(n-11) N.D. N.D. 1,01±0,23 N.D. 0,05±0,09 22:1(n-9) N.D. N.D. N.D. N.D. 0,57±0,99 Σ 18,54±1,39 19,72±1,21 21,58±2,96 18,52±1,27 21,17±3,43
16:2(n-4) 0,51±0,11 0,59±0,04 0,53±0,05 0,61±0,07 0,57±0,14 16:3(n-4) 0,29±0,10 0,25±0,05 0,37±0,02 0,38±0,21 0,38±0,28 16:3(n-3) 0,60±0,25 0,52±0,29 0,49±0,33 0,81±0,13 N.D. 16:4(n-3) 0,36±0,20 0,33±0,21 0,24±0,20 0,48±0,03 0,26±0,18 18:2(n-6) 4,62±0,24 5,85±1,44 6,79±0,50 5,31±0,38 5,63±0,31 18:3(n-6) 0,16±0,03 0,15±0,14 0,13±0,04 0,09±0,08 0,15±0,01 18:3(n-4) 0,07±0,12 0,07±0,06 0,17±0,09 N.D. 0,13±0,06 18:3(n-3) 0,51±0,09 0,62±0,19 0,64±0,12 0,52±0,08 0,66±0,10 18:4(n-3) 0,75±0,13 0,81±0,07 0,69±0,19 0,72±0,11 1,07±0,25 20:2(n-6) N.D. 0,18±0,02 0,22±0,03 0,05±0,09 0,20±0,01 20:4(n-6) 1,89±0,09 1,64±0,14 1,76±0,35 1,79±0,08 1,59±0,29 20:4(n-3) 0,34±0,29 0,46±0,02 0,45±0,04 0,26±0,22 0,53±0,02
EPA 20:5(n-3) 8,82±0,93 8,14±0,17 7,69±0,48 8,04±1,04 9,12±0,23
21:5(n-3) N.D. N.D. N.D. N.D. 0,25±0,03 22:4(n-6) N.D. N.D. N.D. N.D. 0,43±0,74 22:5(n-6) 0,60±0,15 0,33±0,29 0,60±0,18 0,31±0,27 0,29±0,26 22:5(n-3) 1,73±0,40 1,06±0,92 1,80±0,23 1,56±0,56 1,29±1,14
DHA 22:6(n-3) 23,04±4,61 20,82±0,49 21,46±5,07 20,47±4,88 20,94±5,71
Σ 44,26±6,22 41,81±2,31 44,02±5,42 41,39±5,60 43,50±5,34
Σ -3) 36,14±6,20 32,75±1,30 33,46±5,29 32,85±6,24 33,87±6,58 Σ -6) 7,26±0,07 8,15±1,18 9,50±0,57 7,55±0,58 8,30±0,81
Σ - Σ -6) 4,98±0,01 4,02±0,01 3,52±0,01 4,35±0,01 4,08±0,01 PUFA/SFA 1,36±0,29 1,31±0,34 1,45±0,23 1,20±0,48 1,39±0,26
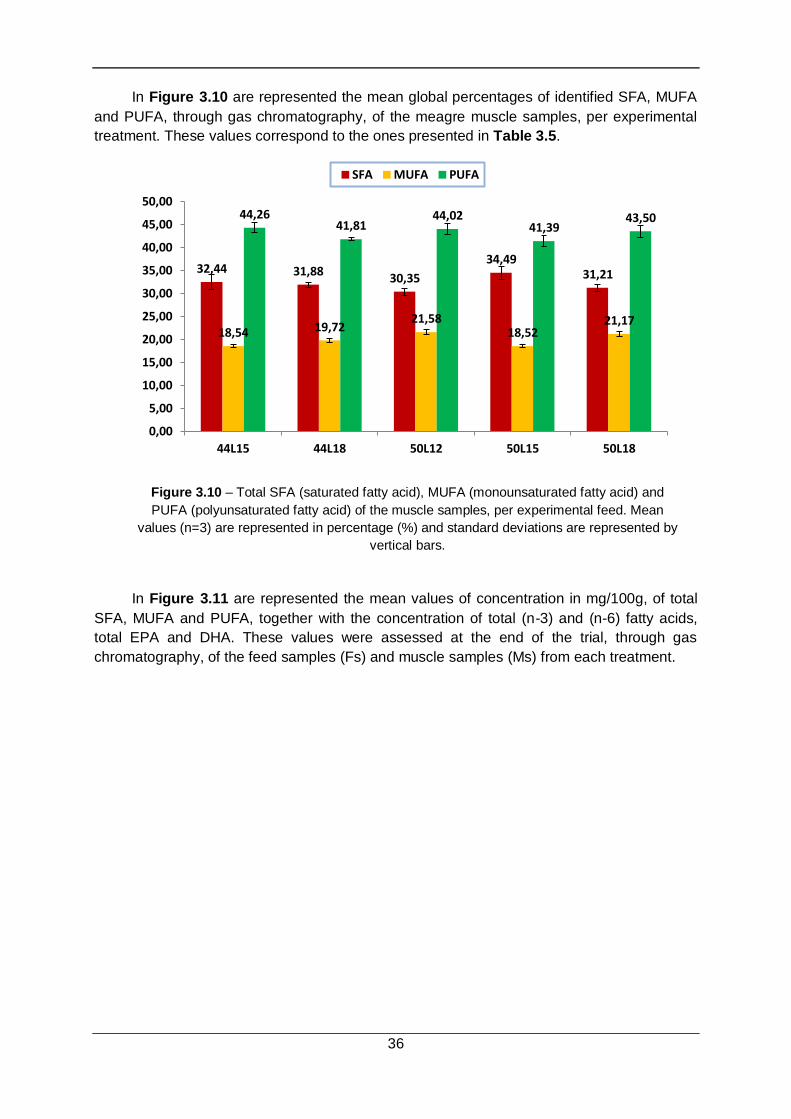
36
In Figure 3.10 are represented the mean global percentages of identified SFA, MUFA
and PUFA, through gas chromatography, of the meagre muscle samples, per experimental
treatment. These values correspond to the ones presented in Table 3.5.
Figure 3.10 – Total SFA (saturated fatty acid), MUFA (monounsaturated fatty acid) and
PUFA (polyunsaturated fatty acid) of the muscle samples, per experimental feed. Mean
values (n=3) are represented in percentage (%) and standard deviations are represented by
vertical bars.
In Figure 3.11 are represented the mean values of concentration in mg/100g, of total
SFA, MUFA and PUFA, together with the concentration of total (n-3) and (n-6) fatty acids,
total EPA and DHA. These values were assessed at the end of the trial, through gas
chromatography, of the feed samples (Fs) and muscle samples (Ms) from each treatment.
32,44 31,88 30,35
34,49 31,21
18,54 19,72 21,58
18,52 21,17
44,26 41,81
44,02 41,39
43,50
0,00
5,00
10,00
15,00
20,00
25,00
30,00
35,00
40,00
45,00
50,00
44L15 44L18 50L12 50L15 50L18
SFA MUFA PUFA
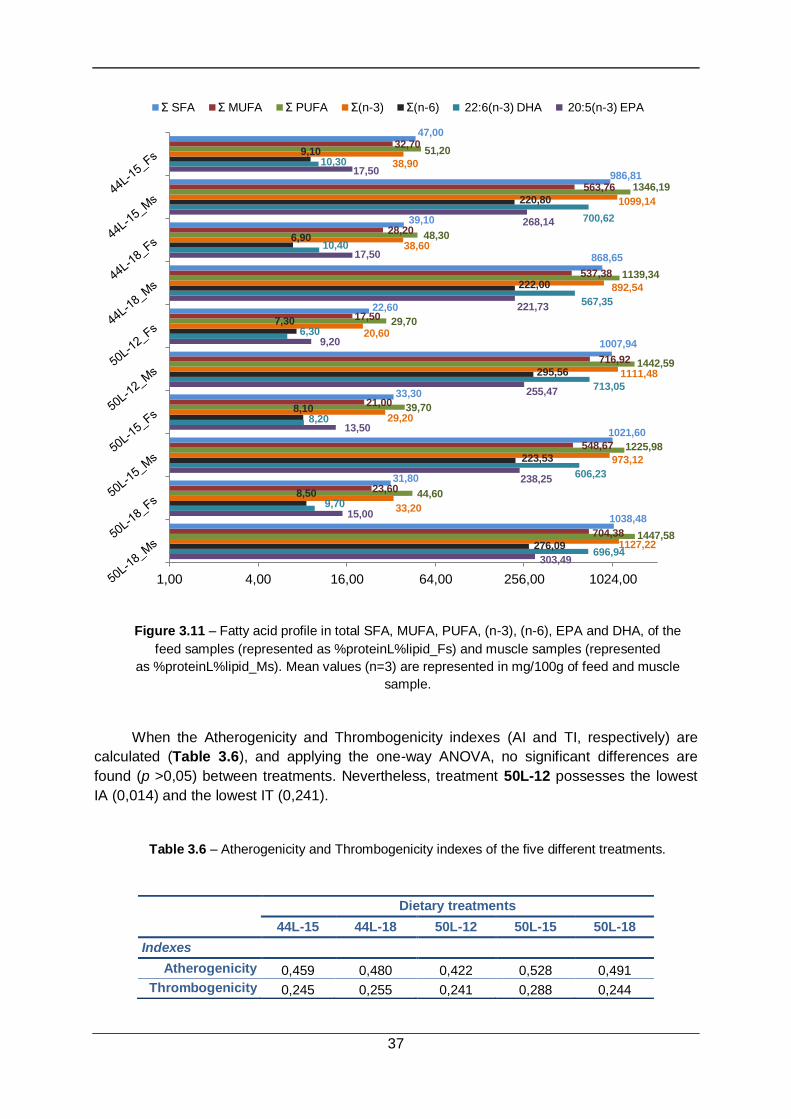
37
Figure 3.11 – Fatty acid profile in total SFA, MUFA, PUFA, (n-3), (n-6), EPA and DHA, of the
feed samples (represented as %proteinL%lipid_Fs) and muscle samples (represented
as %proteinL%lipid_Ms). Mean values (n=3) are represented in mg/100g of feed and muscle
sample.
When the Atherogenicity and Thrombogenicity indexes (AI and TI, respectively) are
calculated (Table 3.6), and applying the one-way ANOVA, no significant differences are
found (p >0,05) between treatments. Nevertheless, treatment 50L-12 possesses the lowest
IA (0,014) and the lowest IT (0,241).
Table 3.6 – Atherogenicity and Thrombogenicity indexes of the five different treatments.
303,49
15,00
238,25
13,50
255,47
9,20
221,73
17,50
268,14
17,50
696,94
9,70
606,23
8,20
713,05
6,30
567,35
10,40
700,62
10,30
276,09
8,50
223,53
8,10
295,56
7,30
222,00
6,90
220,80
9,10
1127,22
33,20
973,12
29,20
1111,48
20,60
892,54
38,60
1099,14
38,90
1447,58
44,60
1225,98
39,70
1442,59
29,70
1139,34
48,30
1346,19
51,20
704,38
23,60
548,67
21,00
716,92
17,50
537,38
28,20
563,76
32,70
1038,48
31,80
1021,60
33,30
1007,94
22,60
868,65
39,10
986,81
47,00
1,00 4,00 16,00 64,00 256,00 1024,00
Σ SFA Σ MUFA Σ PUFA Σ(n-3) Σ(n-6) 22:6(n-3) DHA 20:5(n-3) EPA
Dietary treatments
44L-15 44L-18 50L-12 50L-15 50L-18
Indexes
Atherogenicity 0,459 0,480 0,422 0,528 0,491
Thrombogenicity 0,245 0,255 0,241 0,288 0,244

38
3.7 Feeding behavior
Meagre adapts very easily to captivity, nevertheless, some measures had to be taken.
Since it gets “scared” with ease, each fiberglass tank was covered with protection nets
(Figure 3.12), to prevent fishes from jumping outside the tanks. They are sensitive to shades
and noises, and can get stressed with no difficult. Since meagre fish possesses a voracious
appetite, feeding follows a pattern. When feeds are on the top of the water, and after
hydration, they start to dive towards the bottom, meagre prefers to feed mostly in the middle,
and less preference for the bottom of the tank.
Figure 3.12 – Fiberglass tank with experimental fishes, and the safety net on top, to prevent
deaths.
4 DISCUSSION
There is a very limited knowledge on dietary nutrient requirements of meagre. The
assessment of a optimum dietary protein:lipid ratio is essential to maximize production output
and reduce costs. In a culture environment, the replication of wild conditions is made with
ease, but feeds still represent the most important variable. With low dietary protein available,
growth of meagre may be retarded, and with high content in dietary protein, feed will become
very expensive and nitrogenous waste would be produced (NRC, 1993). The same stands
for dietary lipids – deficiency makes the other nutrients (mainly protein) to be used for body
maintenance and energy production, retarding growth, while excess of lipids may result in
excessive fat deposition in visceral cavity and tissues. Many authors have found this
excessive lipid deposition when studying the Atlantic halibut (Hippoglossus hipoglossus)
(Martins et al., 2007), red drum (Sciaenops ocellata) (Craig et al., 1999), brown meagre
(Sciaena umbra) (Cakli et al., 2006; Chatzifotis et al., 2006) and dusky kob (Argyrosomus
japonicus) (Bernatzeder et al., 2010; Woolley et al., 2010).
Studies argue that sciaenids grow faster in cages than in tanks (Ortega and Gándara,
2007; Piccolo et al., 2008; Cárdenas, 2010; Chatzifotis et al., 2011), so growth
parameters must be calculated and compared, to assess the efficacy of treatments. In
39
general, feed 50L18 presented the best performance when compared with the other
treatments, since it is within the desired levels of dietary protein (DP) and dietary lipid (DL),
referred by Cárdenas (2010): DP>45% and DL≈17%. On the other way, feed 50L12 had the
worst performance, mainly because of the low levels of dietary lipids. The reference levels for
DP and DL were used in many studies (Chatzifotis et al., 2006; Woolley et al., 2010;
Chatzifotis et al., 2011; Martínez-Llorens et al., 2011). The compliance with those values
allows SGR rates to be higher than 1%/day, with feeds 50L15 and 50L18 showing the
highest SGR’s (0,99±0,04 and 1,21±0,00, respectively), which are comparable to the values
obtained by Woolley et al. (2010), Chatzifotis et al. (2011) and Martínez-Llorens et al.
(2011). Within the 50% DP group of treatments, 50L18 showed the highest PER (2,33±0,09),
and the lowest FCR (1.04±0,04), showing that high values of DP and DL makes meagre to
grow more (Chatzifotis et al., 2011), making the efficiency of feeds to be higher.
The increase of dietary lipid within the 50% DP group appears to have a spare protein
effect (Chatzifotis et al., 2011), but when analyzing the 44% DP group, it is notable that the
increase in dietary lipids (from 44L15 to 44L18) actually diminishes PER means values, so
the protein sparing effect by the increase of dietary lipids cannot be confirmed. High values
of PER are related with high values of feed efficiency and high weight increase (Thoman et
al., 1999), situation confirmed with treatments with 50% DP, when compared with 44% DP
treatments.
The values of FCR are correlated to the amount of food ingested versus the fish
weight. With similar amounts of ingested feed, treatment 50L18 allowed fishes to grow more,
and therefore, to present lower FCR than the other treatments. Chatzifotis et al. (2010) and
Martínez-Llorens et al. (2011) obtained similar results with feeds having the same values of
group 44% DP, having poor growth together with high feeding rates, making mean values of
FCR being higher than 1,38, which is according to the values obtained in this trial.
Finally, the high levels of dietary lipid inclusion make feeds more palatability acceptable
(Estévez et al., 2011), and that fact could be confirmed by the high VFI recorded in diets
44L18, 50L15 and 50L18.
The retention values of dry matter (DM), protein and energy were higher in fishes fed
treatment 50L18, accompanied by high daily gain mean values of nitrogen (N) and energy.
The high amount of protein present in the 50% DP group allowed fishes to retain more
protein than the 44% DP group, showing that feeds for meagre should have around 50% of
crude protein in their formulation (Chatzifotis et al., 2011), which also allows fishes to retain
more N per kg of body weight.
All feeds were isoenergetic, and retention of energy was not different among
treatments, with similar results being recorded by Woolley et al. (2010). On a daily gain
basis, diet 50L18 allowed fishes to gain more energy, opposite with diet 50L12, which
presented the lowest value (0,51±0,16 kJ) recorded. An absence of energy gain could be
interpreted as a diet poor in nutrients (especially dietary lipids) allied with a very low feed
intake.
The retention of dietary lipids was not statistically different among treatments, mainly
due to the big variation among the data set, but some approximations may be inferred. The
balance of dietary protein with dietary lipid in each diet influences the percentage of lipids
that are retained, showing that the level of 12% DL is not appropriated for meagre

40
(Chatzifotis et al., 2010; Chatzifotis et al., 2011), so diet 50L12 should not be used in
formulation of commercial feeds.
Similarly to what has been found in other cultured species, the proximate composition
of meagre is affected by endogenous factors such as fish size and exogenous factors such
as diet composition (Chatzifotis et al., 2011). On a whole body composition basis, and
regarding dry matter values, feeds 44L15 and 44L18 presented high mean values for DM,
mainly due to its lower content in DP, when compared with the 50% DP group.
The value of dry matter protein was lower with treatment 44L18, since the interaction
between an high level of DL and a low level of DP makes the levels of DP in fishes to be
lower. The dry matter lipid was higher in the 44% DP group, since both DP and DL levels
influence the amount of lipids present in fishes, with treatment 50L12 to have the lowest
mean values, mainly due to the low lipid retention recorded. Its value is even lower than the
initial one, what can be interpreted as the bad performance of this feed.
When on a fresh matter basis, moisture values of 50% DP group were higher than
44L18, mainly due to the low protein content in treatments 44% DP. Moisture and lipid values
tend to have an inverse correlation (Cakli et al., 2006), and that was notable in the level of
lipid in fishes fed diet 44L18 (6,53±0,94 %), opposing with fishes fed diet 50L12 (4,57±0,90
%), and when accounting moisture values, the ones of diet 50L12 (72,85±0,75 %) were
higher than 44L18 (71,16±0,65 %), being these values similar to ones obtained by
Chatzifotis et al. (2010).
Regarding energy levels, diet 44L18 presented higher value when compared with
50L12, mainly due to the different lipid content in the feeds, since high amounts of lipids
could be used as an energy resource (Chatzifotis et al., 2006). Values of ash and protein
were similar between all treatments, and in accordance with the study made by Chatzifotis
et al. (2010).
The lipid content of liver was higher in treatment 50L18 (63,11±3,98 %) than in
treatment 50L12 (53,01±7,61 %), but similar to treatment 44L18 (58,26±10,05 %). The
values of muscle lipid are not significant different between treatments, with an average value
of 2,3%. These values are much higher than the ones obtained with brown meagre and red
drum (Chatzifotis et al., 2006), regarding the lipid content of liver, but similar to the values
obtained for muscle fat, confirming that meagre is a low fat fish. These findings prove the
minor role of muscle as an energy depot, but liver still is the main energy central that fulfills
meagre energy needs. Nevertheless, when dissecting fishes from treatment 50L18, there
were fat mesenteric depots within the abdominal wall, so fat was being accumulated in two
places, and that it is not desirable.
The obtained digestive tract fat percentages, ranging from 17,56±1,73 (%) to
23,64±3,00 (%), were abnormal, and can only be due to errors in the dissection of the
viscera. Since the viscera does not represent a fat storage depot, no conclusions could be
made with the obtained data.
The HSI between treatments showed no differences, but the mean value was 2,45,
being higher than the ones obtained in the studies made by Piccolo et al. (2008) and
Chatzifotis et al. (2010), mainly due to the high lipid content of livers, but no correlation was
made between HSI and dietary nutrient levels (Woolley et al., 2006).
The fatty acid profile of the different treatments presented no significant differences, but
the mean values of SFA (≈32%), MUFA (≈20%), PUFA (≈43%) and the ratio (n-3)/(n-6)
41
(≈4.2), are in accordance to the values referred by Poli et al. (2003), Cárdenas (2010),
Grigorakis et al. (2011) and Martínez-Llorens et al. (2011). The values for the (n-3)/(n-6)
ratio in this trial are better than the ones obtained by Lenas and Nathanailides (2011), when
working with wild sea bass, with meagre presenting more omega-3. These findings, together
with the low AI and TI, proves that meagre is an excellent source of omega-3 fatty acids,
essential to a good heart condition and overall health benefits.
5 CONCLUSION
The main purpose of experimental trials within aquaculture is to create new techniques
and feeding protocols, minimizing costs and maximizing production. The five experimental
feeds had differences that may argue that some are not appropriate for the breading of
meagre. Feeds with low dietary lipid, such as diet 50L12 should not be used for meagre
aquaculture, since it doesn’t supply fishes with the necessary protein and lipids for a
optimum growth. Since the balance of dietary protein and dietary lipid is essential for an
optimum growth, diet 50L18 was the best one for the meagre growout, but its value of dietary
lipid should be rearranged, since some fishes would gain unwanted mesenteric fat. Diet
44L18 had a good performance, but its low level of dietary protein is a drawback for the
rearing of meagre. Diet 50L15 had similar values to diet 50L18, not possessing significant
differences, and without the problems with mesenteric fat deposition.
In a future study, diets should take in account the value of 50% dietary protein, and
values between 15% and 18% of dietary lipid. Nevertheless, protein is still the most
expensive ingredient when formulating feeds, but these values seem to be a good approach
for an optimum diet that could maximize meagre growth.
42
6 REFERENCES
AOAC, 1998. “Official Methods of Analysis, 16th ed., 4th revision”. Washington, DC:
Association of Official Analytical Chemistry.
Becker, E.W., 2007. “Micro-algae as a source of protein”. Biotechnology Advances 25: 207-
210 pp.
Belitz, H.D., Grosch, W. and Schieberle, P., 2009. “Food Chemistry”, 4th revised and
extended Edition. Springer Berlin Heidelberg.
Bernatzeder, A.K., Cowley, P.D. and Hecht, T., 2010. “Do juveniles of the estuarine-
dependent dusky kob, Argyrosomus japonicus, exhibit optimum growth indices at
reduced salinities?”. Estuarine, Coastal and Shelf Science 90: 111-115 pp.
Brugère, C. and Ridler, N., 2004. “Global Aquaculture Outlook In The Next Decades: An
Analysis of National Aquaculture Production Forecasts to 2030”. FAO, Rome.
Cabral, H. and Ohmert, B., 2001. “Diet of juvenile meagre, Argyrosomus regius, within the
Tagus estuary”. Cah. Biol. Mar. 42: 289-293 pp.
Cakli, S., Dincer, T., Cadun, A., Saka, S. and Firat, K., 2006. “Nutrient content comparison of
the new culture species brown meagre (Sciaena umbra)” Archiv für
Lebensmittelhygiene 57, Heft 5/6: 80–84 pp.
Cárdenas, S., 2010. “Acuicultura de Esciénidos en el Mundo. Curso sobre Avances de la
Acuicultura, Fundación de la Universidad de Málaga”. Vélez-Málaga, Málaga, Julio,
2009.
Chao, L.N., 1986. “Sciaenidae”. Fishes of the North-Eastern Atlantic and the Mediterranean.
P.J.P. Whitehead, M.L. Bauchot, J.C. Hureau, J. Nielsen & E. Tortonese editions, 865-
874 pp. UNESCO, Paris.
Chatzifotis, S., Villamor Martin-Prat, A., Limberis, N., Papandroulakis, N. and Divanach, P.,
2006. “First data on growth of cultured brown meagre Sciaena umbra using diets with
different protein and fat contents”. Fisheries Science 72: 83-88 pp.
Chatzifotis, S., Panagiotidou, M., Papaioannou, N., Pavlidis, M., Nengas, I. and Mylonas,
C.C., 2010. “Effect of dietary lipid levels on growth, feed utilization, body composition
and serum metabolites of meagre (Argyrosomus regius) juveniles”. Aquaculture 307:
65-70 pp.
Chatzifotis, S., Panagiotidou, M. and Divanach, P., 2011. “Effect of protein and lipid dietary
levels on the growth of juvenile meagre (Argyrosomus regius)”. Aquaculture
International Volume 20, Issue 1, 91-98 pp.
Christie, W.W., 1989. “Gas Chromatography and Lipids: A Practical Guide”. The Oily Press.
Bridgwater, Somerset.
Craig, S.R., Washburn, B.S. and Gatlin III, D.M., 1999. “Effects of dietary lipids on body
composition and liver function in juvenile red drum, Sciaenops ocellatus”. Fish
Physiology and Biochemistry 21: 249-255 pp.
Das, U.N., 2006. “Essential fatty acids: biochemistry, physiology and pathology”.
Biotechnology Journal 1: 420-439 pp.
43
El-Shebly, A.A., El-Kady, M.A.H., Hussin, A.B. and Hossain, Md.Y., 2007. “Preliminary
Observations on the Pond Culture of Meagre, Argyrosomus regius (Asso, 1801)
(Sciaenidae) in Egypt”. Journal of Fisheries and Aquatic Science 2 (5): 345-352 pp.
Estévez, A., Treviño, L., Kotzamanis, Y., Karacostas, I., Tort, L. and Gisbert, E. 2011.
“Effects of different levels of plant proteins on the ongrowing of meagre (Argyrosomus
regius) juveniles at low temperatures”. Aquaculture Nutrition 17: e572-e582 pp.
FAO, 2009. “Fish as feed inputs for aquaculture – Practices, sustainability and implications.”
FAO Fisheries and Aquaculture Technical Paper 518. FAO, Rome.
FAO, 2012. “Fishery and Aquaculture Statistics 2010 Yearbook”. FAO, Rome.
FAO, 2012a. “The State of World Fisheries and Aquaculture 2012”. FAO Fisheries and
Aquaculture Department. Rome.
Fischer, W., Bauchot, M.L. and Schneider, M., 1987. “Fiches FAO d’identification des
espéces pour les besoins de la pêche Mediterranée et mer Noire”. FAO Fishing Area
37, Volume II - Vertebrates: 761-1530 pp. FAO, Roma.
Folch, J., Lees, M. and Stanley G.H.S., 1957. “A simple method for the isolation and
purification of total lipides from animal tissues”. J. Biol. Chem., 226: 497 – 509 pp.
Gatlin III, D.M., 2010. “Principles of Fish Nutrition”. Southern Regional Aquaculture Center
(SRAC) Publication No. 5003, July 2010.
Griffiths, M.H. and Heemstra, P.C., 1995. “A contribution to the taxonomy of the marine fish
genus Argyrosomus (Perciformes: Sciaenidae), with descriptions of two new species
from southern Africa”. Ichthyological Bulletin 65. J.L.B. Smith Institute of Ichthyology.
Grigorakis, K., Fountoulaki, E., Vasilaki, A., Mittakos, I. and Nathanailides, C., 2011. “Lipid
quality and filleting yield of reared meagre (Argyrosomus regius)”. International Journal
of Food Science and Technology 46: 711-716 pp.
Gunstone, F.D., Harwood, J.L. and Dijkstra, A.J., 2007. “The Lipid Handbook”. 3th edition.
CRC Press,Taylor & Francis Goup. Boca Raton, FL.
Hernández, M.D., López, M.B., Álvarez, A., Ferrandini, E., García, B. and Garrido, M.D.,
2009. “Sensory, physical, chemical and microbiological changes in aquacultured
meagre (Argyrosomus regius) fillets during ice storage”. Food Chemistry 114: 237-245
pp.
Huss, H.H., 1995. “Quality and quality changes in fresh fish”. FAO Fisheries Technical Paper
– 348. FAO, Rome.
Iglesias, J. and Sánchez, F.J., 2008. “Nuevas espécies en acuicultura”. X Foro Ac. Rec. Mar.
Rías Gal: 177-184 pp.
Jiménez, M.T., Pastor, E., Grau, A., Alconchel, J.I., Sánchez, R. and Cárdenas, S., 2005.
“Revisión del cultivo de esciénidos en el mundo, com especial atención a la corvina
Argyrosomus regius (Asso, 1801)”. Bol. Inst Esp. Oceanogr. 21(1-4): 169-175 pp.
Jobling, M., 1995. “Fish Bioenergetics”. Chapman & Hall, London.
Lazo, J.P., Holt, J.G., Flauvel, C., Suquet, M. and Quéméner, L., 2010. “Finfish Aquaculture
Species Selection for Diversification – Chapter 18: Drum-fish or Croakers (Family:
Sciaenidae)”. CAB International. Oxfordshire, UK: 397-416 pp.
44
Leis, J.M. and Trnski, T., 1989.” The Larvae of Indo-Pacific Shorefishes”. New South Wales
University Press (Sydney) and University Press of Hawaii. Honolulu: 371 pp.
Lenas, D.S. and Nathanailides, C., 2011. “High content of n-6 fatty acids in the flesh of
farmed fish sea bass Dicentrarchus labrax L. and gilthead sea bream Sparus aurata L.:
implications for the human health”. International Aquatic Research 3: 181-187 pp.
Lepage, G. and Roy, C.C., 1986. “Direct transesterification of all classes of lipids in one-step
reaction”. Journal of Lipid Research 27: 114-119 pp.
Li, X., Jiang, Y., Liu, W. and Ge, X., 2012. “Protein-sparing effect of dietary lipid in practical
diets of blunt snout bream (Megalobrama amblycephala) fingerlings: effects on
digestive and metabolic responses”. Fish Physiol. Biochem. 38: 529-541 pp.
Martínez-Llorens, S., Espert, J., Moya, J., Cerdá, M.J. and Tomás Vidal, A., 2011. “Growth
and nutrient efficiency of meagre (Argyrosomus regius, Asso 1801) fed extruded diets
with different protein and lipid levels”. International Journal of Fisheries and
Aquaculture Vol. 3(10): 195-203 pp.
Martins, D.A., Valente, L.M.P. and Lal, S.P., 2007. “Effects of dietary lipid level on growth
and lipid utilization by juvenile Atlantic halibut (Hippoglossus hippoglossus, L.)”.
Aquaculture 263:150-158 pp.
Mohanta, K.N., Mohanty, S.N. and Jena, J.K., 2007. “Protein-sparing effect of carbohydrate
in silver barb, Puntius gonionotus fry”. Aquaculture Nutrition 13: 311-317 pp.
Monfort, M.C., 2010. “Present Market Situation and Prospects of Meagre (Argyrosomus
regius), as an Emerging Species in Mediterranean Aquaculture”. General Fisheries
Commission for the Mediterranean, Studies and Reviews No. 89. FAO, Rome.
New, M.B. and Wijkström, U.N., 2002. “Use of Fishmeal and Fish Oil in Aquafeeds: Further
Thoughts on the Fishmeal Trap”. FAO Fisheries Circular No. 975 FIPP/C975. FAO,
Roma.
Nelson, D.L., and Cox, M.M., 2004. “Lenhinger Principles of Biochemistry”, 4th edition. W.H.
Freeman.
NRC (National Research Council), 1993. “Nutrient Requirements of Fish”. National Academy
Press. Washington, D.C..
Ortega, A. and Gándara, F. de la, 2007. “Crescimiento de corvina (Argyrosomus regius) en
tanques”. XI Congreso Nacional de Acuicultura, Vigo.
Pastor, E., Grau, A., Massutí, E. and Sánchez-Madrid, A., 2002. “Preliminary results on
growth of meagre, Argyrosomus regius (Asso, 1801) in sea cages and indoor tanks”.
EAS Especial Publication 32: 422-423.
Piccolo, G., Bovera, F., De Riu, N., Marono, S., Salati, F., Cappuccinelli, R. and Moniello, G.,
2008. “Effect of two different protein/fat ratios of the diet on meagre (Argyrosomus
regius) traits”. Ital. J. Anim. Sci, Vol. 7: 363-371 pp.
Pirozzi, I., Booth, M.A. and Allan, G.L., 2010. “A factorial approach to deriving dietary
specifications and daily feed intake for mulloway, Argyrosomus japonicus, based on the
requirements for digestible protein and energy”. Aquaculture 302: 235-242 pp.
45
Prista, N., Costa, J.L., Costa, M.J., Jones, C.M., 2009. “Age determination in meagre
Argyrosomus regius”. Relatórios Científicos e Técnicos do Instituto de Investigação
das Pescas e do Mar, 49. IPIMAR, Lisboa.
Poli, B.M., Parisi, G., Mecatti, M., Lupi, P., Iurzan, F., Zampacavallo, G. and Gilmozzi, M.,
2001. “The meagre (Argyrosomus regius), a new species for Mediterranean
aquaculture: Morphological, merchantable and nutritional traits in a commercial wide
size-range”. EAS Special Publication 29: 209-210.
Poli, B.M., Parisi, G., Zampacavallo, G., Iurzan, F., Mecatti, M., Lupi, P. and Bonelli, A., 2003.
“Preliminary results on quality and quality changes in reared meagre (Argyrosomus
regius): body and fillet traits and freshness changes in refrigerated commercial-size
fish”. Aquaculture International 11: 301-311 pp.
Quéméner, L., 2002. “Le maigre commun (Argyrosomus regius). Biologie, pêche, marché et
potentiel aquacole”. Éditions Ifremer: 31pp. France.
Quéro, J.C. and Vayne, J.J., 1987. “Le Maigre, Argyrosomus regius (Asso, 1801) (Pisces,
Perciformes, Sciaenidae) du Golfe de Gascogne et des eaux plus septentrionales”.
Rev. Trav. Inst. Pêches marit. 49 (1 and 2): 35-66 pp.
Roo, J., Hernández-Cruz, C.M., Borrero, C., Schuchardt, D. and Fernández-Palacios, H.,
2010. “Effect of larval density and feeding sequence on meagre (Argyrosomus regius;
Asso, 1801) larval rearing”. Aquaculture 302: 82-88 pp.
Rabanal, H.R., 1988. “History of Aquaculture”. ASEAN/UNDP/FAO Regional Small-Scale
Coastal Fisheries Development Project. Manila, Philippines.
Randall, J. E., 1983. “Caribbean Reef Fishes”. 2nd edition. TFH Publications. Neptune City.
New Jersey: 350 pp.
Sargent, J., McEvoy, L., Estevez, A., Bell, G., Bell, M., Henderson, J. and Tocher, D., 1999.
“Lipid nutrition of marine fish during early development: current status and future
directions”. Aquaculture 179: 217-229 pp.
Simopoulos, A.P., 2002. “The importance of the ratio of omega-6/omega-3 essential fatty
acids”. Biomedicine & Pharmacotherapy 56: 365-379 pp.
Thoman, E.S., Davis, D.A. and Arnold, C.R., 1999. “Evaluation of growout diets with varying
protein and energy levels for red drum (Sciaenops ocellatus)”. Aquaculture 179: 343-
353 pp.
Ueng, J.P., Huang, B.Q. and Mok, H.K., 2007. “Sexual Differences in the Spawning Sounds
of the Japanese Croaker, Argyrosomus japonicus (Sciaenidae)”. Zoological Studies 46:
103-110 pp.
UKDH, 1994. “Reports on health and social subjects. Nº 46. Nutritional aspects of
cardiovascular disease”. UK Department of Health. HMSO, London, UK.
Ulbricht, T.L. and Southgate, D.A., 1991. “Coronary Heart Disease: seven dietary factors”.
Lancet 338: 985-992 pp.
Watanabe, T., 1982. “Lipid Nutrition in Fish”. Comparative Biochemistry and Physiology 73B:
3-15 pp.
46
Woolley, L.D., Jones, C.L.W. and Britz, P.J., 2010. “Effect of dietary protein to energy ratio
on growth and nitrogenous waste production of cultured dusky kob Argyrosomus
japonicus”. African Journal of Marine Science 32(3): 625-631 pp.
Zampogna, F., 2009. “Aquaculture Statistics – 2007”. Statistics in Focus-83/2009. Eurostat
Fisheries Statistics. European Commission.
Zar, J.H., 1999. “Biostatistical Analysis”, 4th edition. Prentice Hall, London.