Embed Size (px)
Citation preview
Optimizing Phosphorus Fertilization Ratesfor Soybeans Grown on Oxisols and Associated Entisols1
I. D. G. LlNS, F. R. COX, AND J. J. NlCHOLAIDES, III2
ABSTRACTAlthough soils vary considerably in their P sorption character-
istics, this factor is often not considered in a soil test interpretation.One soil property closely related to P sorption is clay content. Re-sidual P studies were conducted for 4 yr on three tropical soils ofsimilar clay mineralogy, two Oxisols of 63 and 27% clay, and aQuartzipsamment of 12% clay. The Mehlich 1 (1:10) extractable Plevel was described as a function of time, initial soil P level, and Pfertilization rate. One crop of soybeans [Glycine max (L.) Merr.]was grown each year and the yield related to extractable P, which,in turn, was related to the initial P soil level and P fertilization ratefor a period of 1 yr. Based on a soybean price of $0.23/kg and afertilizer P price of $1.23/kg, rates of P were calculated for each ofthe three soils that would maximize net returns for various initiallevels of extractable P. As these rates differed markedly with claycontent, a soil test interpretation was created by multiple regressionbased upon both Mehlich 1 extractable P concentration and claypercentage to predict a recommended rate of fertilizer phosphorus(R) as follows: R = 80 - 2.57(soil P) + 0.01386(clay)2 -0.003281(soil P)(clay2). This function should be applicable to manysoils with similar clay characteristics.
Additional Index Words: soil test, interpretation, calibration,sorption, clay, economic.
1 Paper no. 9801 of the Journal Series of North Carolina Agri-cultural Research Service, Raleigh, NC 27695-7601. This work waspartially supported by EMPAER (Agricultural and Livestock Re-search Enterprise of the state of Mato Grosso Do Sul), Brazil. Re-ceived 29 Mar. 1985. Approved 27 June 1985.2 EMBRAPA Fellow, Professor, and former Associate Professor,Soil Science Dep., NC State Univ., Raleigh, NC 27695-7619. Thirdauthor is now Associate Dean of the College of Agric., Director ofInt. Agric., Professor of Agronomy, and Assistant Vice Chancellorfor Res., Univ. of Illinois, Urbana, IL 61801.
Lins, I.D.G., F.R. Cox, and J.J. Nicholaides III. 1985. Optimizingphosphorus fertilization rates for soybeans grown on Oxisols andassociated Entisols. Soil Sci. Soc. Am. J. 49:1457-1460.
THE OBJECTIVE of a soil test interpretation is to beable to recommend the optimum rate of fertil-
izer. One philosophy of achieving this is to maintaina nutrient so that its extractable concentration is suf-ficient for maximum yield. This would be applicableonly if there is a measurable residual effect of the ele-ment applied. In order to compute the optimum rateof a given nutrient, three values are required: (i) theexisting extractable nutrient concentration in the soil,(ii) the concentration sufficient for maximum yield,and (iii) a buffer capacity factor indicating the changein soil nutrient concentration during the period perunit of nutrient applied. With the inclusion of eco-nomic considerations, the interpretation may be mod-ified to recommend the rate of fertilizer required tomaximize net returns.
The concentration of extractable P sufficient formaximum yield varies with soil properties. Cope andRouse (1973) stated that fine-textured, high cation ex-change capacity (CEC) soils would produce maximumyields at lower soil test P levels than coarser-textured,lower CEC ones. Similarly, Kamprath (1978) reportedthat the Mehlich 1 extractable (1:5) P critical levelsfor clayey and sandy Ultisols were 10 and 20 mg/kg,respectively. Although it is known that P sorption orfixation varies with several soil properties, there havebeen few attempts to incorporate this information into
1458 SOIL SCI. SOC. AM. J., VOL. 49, 1985
Table 1. Selected properties of the three soils prior to treatment.Clay
%632712
pH
4.94.65.2
Al
1.121.260.34
Ca + Mg
cmol(+)/dm'0.680.951.04
K
0.100.120.09
Al sat.
%595423
P
g/m>0.71.42.2
a soil test interpretation. Such data are needed to de-termine the optimum rate of fertilizer for specific soilconditions. A mathematical approach to this wasworked out by Cox and Lins (1984) for corn (Zeamays L.) grown on two Ultisols varying in clay con-tent. Their technique should be applicable for othercrops grown on other acid soils as well. The objectivesof the current study were to (i) refine the mathematicalapproach, and (ii) determine the fertilizer P rate re-quired for optimum yield of soybeans grown Oxisolsand associated Entisols as influenced by extractable Pconcentration and clay content.
PROCEDUREField and Lab Methods
Phosphorus studies were conducted at three sites in theCerrado area of Mato Grosso do Sul, Brazil. The soils were(i) a Typic Haplustox; clayey, kaolinitic, isohyperthermic,(ii) a Typic Haplustox; fine-loamy, siliceous, isohyper-thermic, and (iii) a Typic Quartzipsamment; isohyperth-ermic, coated. Clay contents of the surface horizons were63, 27, and 12%, respectively. Dolomitic limestone was ap-plied 90 d before establishing treatments to eliminate Altoxicity. Soil P levels were created by incorporating broad-cast triple superphosphate to supply P at rates of 0, 66, 132,and 264 kg/ha in four replications of a randomized completeblock design. One crop of soybeans [Glycine max L. Merr.)]was grown each year for 4 yr and grain yields determined.General fertilization for the first two crops in kg/ha included60 K, 2 Zn, 1 B, and 0.2 Mo. Only the K rate was continuedthereafter (Table 1).
At harvest, grain yields were determined and the soil sam-pled from each plot for analysis. Soil Al was extracted with1 MKC1 (1 soil/10 solution) and titrated to a bromthymolblue endpoint. Calcium and Mg were also determined on aportion of this extract by atomic absorption spectropho-tometry (Lin and Coleman, 1960). Soil P and K were ex-tracted with Mehlich 1, 0.05 MHC1 + 0.0125 MH2SO4, (1soil/10 solution) for 5 min and determined by spectropho-tometry and flame photometry, respectively. Soil pH wasdetermined in a 1:1 soil/water stirred suspension.
Mathematical ApproachExtractable soil P concentration (X) was expressed as a
function of the initial soil test level (X0), rate of fertilizerP(F), and time (T) at each site. The descriptive model de-veloped by Cox et al. (1981) was used with one modification.In their model, the immediate effect of fertilizer rate, F, onextractable soil P concentration is given for only one initialsoil test level, X0, by the following quadratic expression:
+ b2F*X = X0 + [1]where &, and b2 are coefficients describing the buffer capacityof the soil. This expression must be modified if one is toconsider other initial soil P concentrations. Two terms mustbe changed. The first is the intercept, X0, which is replacedby the selected initial P concentration, Xt. The second is theslope at the intercept, b\, which must be changed by a factor,E. This factor is the numerator of the solution of the quad-
Table 2. Coefficients or parameters for Eq. [1] and [2] for thethree soils varying in clay content.
Coefficient orparameter
ABC*eq*r6,6,k
63
27595508
0.45902.03.50.0210.00030.152
Clay(%)27
26644752
0.22575.56.20.2460.00060.383
12
19252751
0.13469.0
11.00.2560.00110.246
ratic equation for the new initial P concentration, Xt. It maybe calculated as follows:
E= - - 4b2 (X0 - [2]where sqr denotes the square-root function.
With these changes to facilitate use of the descriptive modelwith a time function included, the expression to predict ex-tractable P becomes:X = + + , + E) F
- Xeq] [3]where X^ is an equilibrium soil test level based on experi-ence and exp denotes the value of "e" to the power givenin the parentheses following. The data were fit to this modelusing the NLIN procedure for nonlinear models in SAS (SASInst., Inc., 1982).
A nonlinear model was also used to relate treatment meangrain yields (Y) to extractable soil P concentration (X) ateach site. The form selected was as follows:
Y = A - Bexp(-CX) [4]where A, B, and C are constants. The value of X was thenexpressed by Eq. [3] to give:7 = A ~ B exp {-CUeq + [Xi + (bi + E) F
+ 62^-*eq]exp(-fc7)}}. [5]Economic considerations are then inserted and net in-
come (AO calculated as follows:N = QY - SF [6]
where Q is the price of soybeans and S is the cost of fertilizerP. The yield, Y, in Eq. [6] is replaced by Eq. [5] to give:N = Q(A - B exp {-
+ b2F1 - Xe
Considering a time period of 1 yr (7"= 1), the derivativeof net income was taken with respect to fertilizer rate, F,and set equal to zero, as follows:
+ [X, + (b, + E) Fexp (-kT)}-SF. [7]
0 = QB exp-CU*, + [Xf + (bl + E)F+ b2F* - *eq] exp(- k)}}( -Q exp(-fc) [(6,+ E) + 2b2F] - S .
[8]Solution of this equation will give the fertilizer rate for
maximum net income for a given initial soil test level. Thiswas done with the data from each site for eight initial levelsbetween X0 and greater values up to where the effect of fer-tilizer rate became negligible. The 24 observations were thenevaluated by multiple regression so that the fertilizer ratefor maximum net income (R) was a function of initial soiltest level (soil P) and clay content (clay). The concept de-veloped by Cox and Lins (1984) in which the clay term is
LINS ET AL.: P FERTILIZATION RATES FOR SOYBEANS GROWN ON OXISOLS AND ENTISOLS 1459
O 1 2 3 4 0 1 2 3 4 O 1 2 3 4
Time (years)
Fig. 1. Change in extractable soil P concentration of three soils withtime after an application of (in ascending order) 0, 66, 132, and264 kg P/ha.
squared was used. This expression includes the interactionand may be written as follows:R = a + b (soil P) + c(clay)2 + (/(soil P)(clay)2. [9]
With this expression, the fertilizer P rate for maximumnet income becomes a continuous function of initial soil testlevel and clay content.
RESULTS AND DISCUSSIONThe initial effect of a given rate of P on the soil test
P concentration was greatest on the lowest clay con-tent soil and least on the one with the highest claycontent (Fig. 1). The data from each site fit a descrip-tive model (Eq. [3]) quite well with the coefficientsgiven in Table 2. The rate of continued decline in soilP with time is described by the coefficient k. Withthese Soils, the parameter does not appear related tothe bi value, as hypothesized by Cox et al. (1981), orto the,clay content.
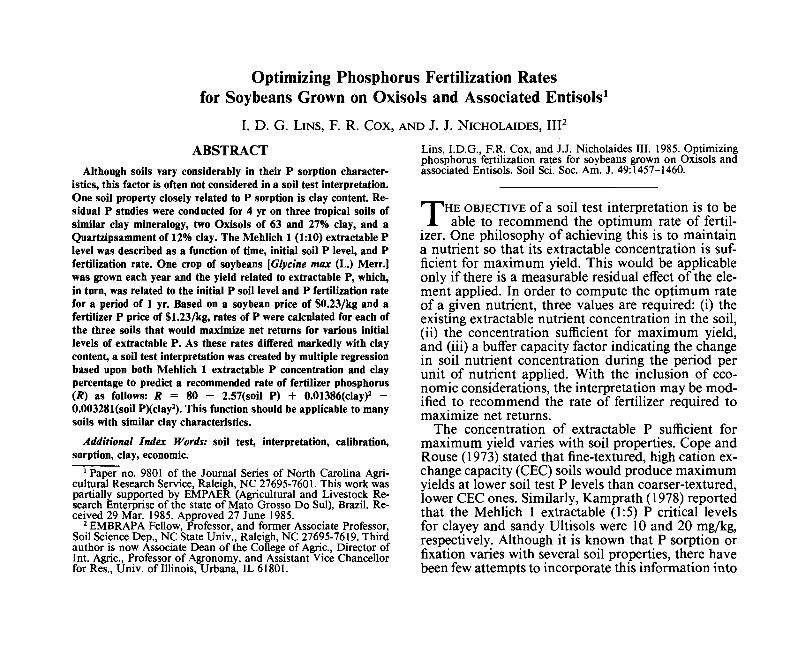
Soybean yields markedly increased with the initialincrease in concentration of extractable P at each ofthe three locations (Fig. 2). Coefficients for fitting thedata to an exponential function (Eq. [4]) were deter-mined and are given in Table 2. There is some vari-ation in the observed yields at the higher levels of soilP. Much of this is associated with the fact that thedata from 4 yr are shown and are not adjusted for ayear effect. Maximum yields were somewhat greaterfor the latter 2 yr of the study than for the first. Thiseffect could be removed by adjusting soybean yieldsto an average, but this would not really affect the func-tion derived, so it was not done.
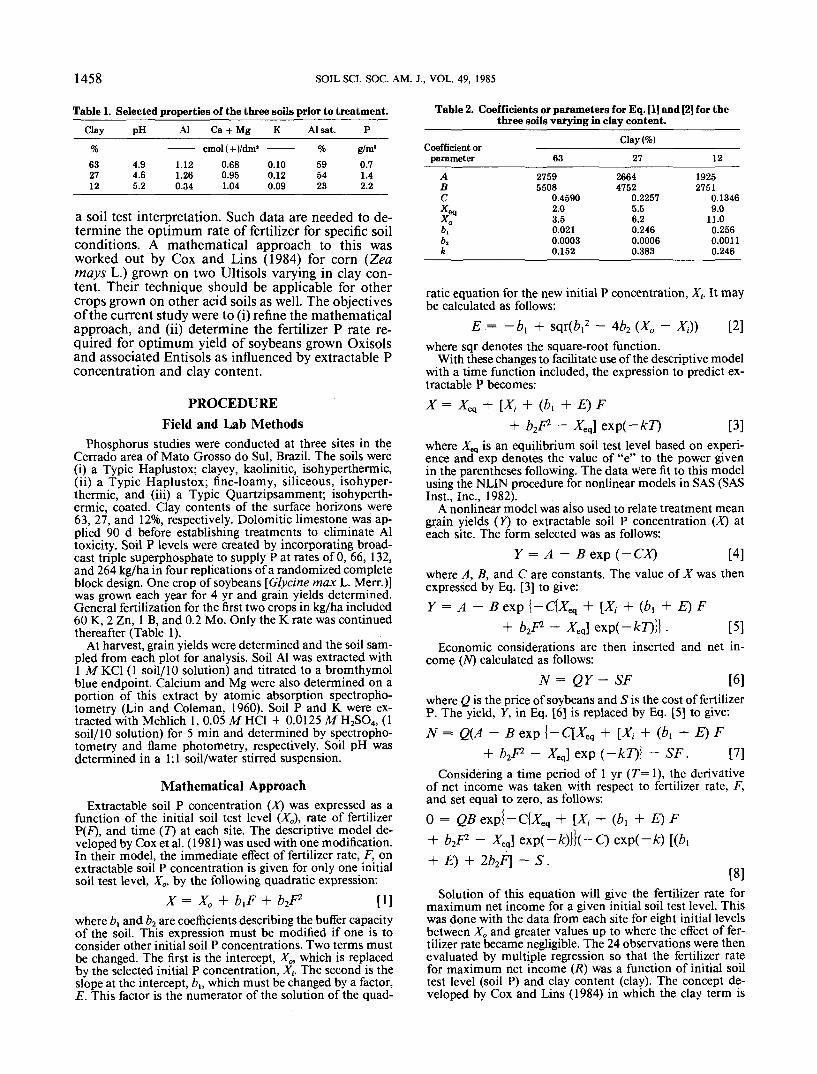
The fertilizer P rates to maximize net returns atvarious initial soil P levels for the three soils are shownby the calculated points in Fig. 3 for a soybean priceof $0.23/kg and a fertilizer P cost of $1.23/kg. For theclay soil, very high rates of P would be recommendedat very low soil P levels. The recommended rate de-creases rapidly with increasing soil P, however, andnone would be recommended if the extractable P con-centration exceeded 9 kg/ha. For the more sandy soils,a lower rate of P would be recommended at the verylow soil P levels, but some would continue to be rec-ommended until the extractable P concentration ex-ceeded about 25 kg/ha.
The modification in the quadratic function, Eq. [1],to consider other initial P concentrations has affectedthe relationship between fertilizer P rate and soil Pconcentration shown in Fig. 3. As viewed from theorigin, the response is slightly convex. Without thismodification, the response is definitely concave (Coxand Lins, 1984). Convex functions have been pro-posed before and are in use in North Carolina (Hat-
0/, clay 27°/. clay 12 •/. clay
'0 1O 2O 3O O 2O 4O 6O 8O 1OO O 4O 80 120 160Soil P (kg/ha)
Fig. 2. Yield of four crops of soybeans grown on three soils varyingin clay content in relation to extractable soil P concentration.
100
80
01 60
40
20
-63 °/o clay
0 4 8 12 16 2O 24Soil P (kg/ha)
Fig. 3. A soil test interpretation for P showing the calculated (points)and predicted (lines) optimum P rates for three soils varying insoil P and clay content for a soybean price of $0.23/kg and afertilizer P cost of $1.23/kg.
field and Hickey, 1983). The current response, how-ever, has such a small change in slope that a simplelinear function should suffice.
The calculated fertilizer rates for all three soils shownin Fig. 3 were then used to predict a recommendedrate based on both extractable P and clay content. Itwas found necessary to square the clay term in themultiple regression analysis, as had been noted pre-viously by Cox and Lins (1984). The equation to pre-dict the optimum rate (R) was as follows:R = 80 - 2.57(soil P) + 0.01386(clay)2
- 0.003281 (soil P)(clay)2. [10]The predicted rates from Eq. [10] are shown by the
lines in Fig. 3 for the three soils. In general, the pre-diction fits the calculated points well. For the clay andloamy sand soils, the predicted rate was slightly greaterthan that calculated at the highest soil P levels appli-cable to each. The opposite trend was observed withthe sandy clay loam, but these discrepancies were mi-nor.
Insertion of more stringent economic conditions,through higher fertilizer cost and/or lower soybeanprice, would have the effect of moving the resultsshown in Fig. 3 to the left. Less P would be recom-mended for a particular soil at a given initial soil Plevel. Also, the soil P concentration at which no fer-tilizer P would be recommended, one definition of thecritical level, would be reduced. By this definition, thecritical levels predicted by the lines shown in Fig. 3are 9, 18, and 27 kg P/ha for the 63, 27, and 12% claysoils, respectively.
Ulrich and Hills (1973) recommended establishingcritical levels at 90% of maximum yield. If this is donewith the data in Fig. 2, the comparative critical levelswould be 6.5, 13, and 20 kg P/ha for the three soils.Other approaches may also be applied to show the
1460 SOIL SCI. SOC. AM. J., VOL. 49, 1985
100
80I5> 60ura 400.
20
04 8 12 16 20 24Soil P (kg/ha)
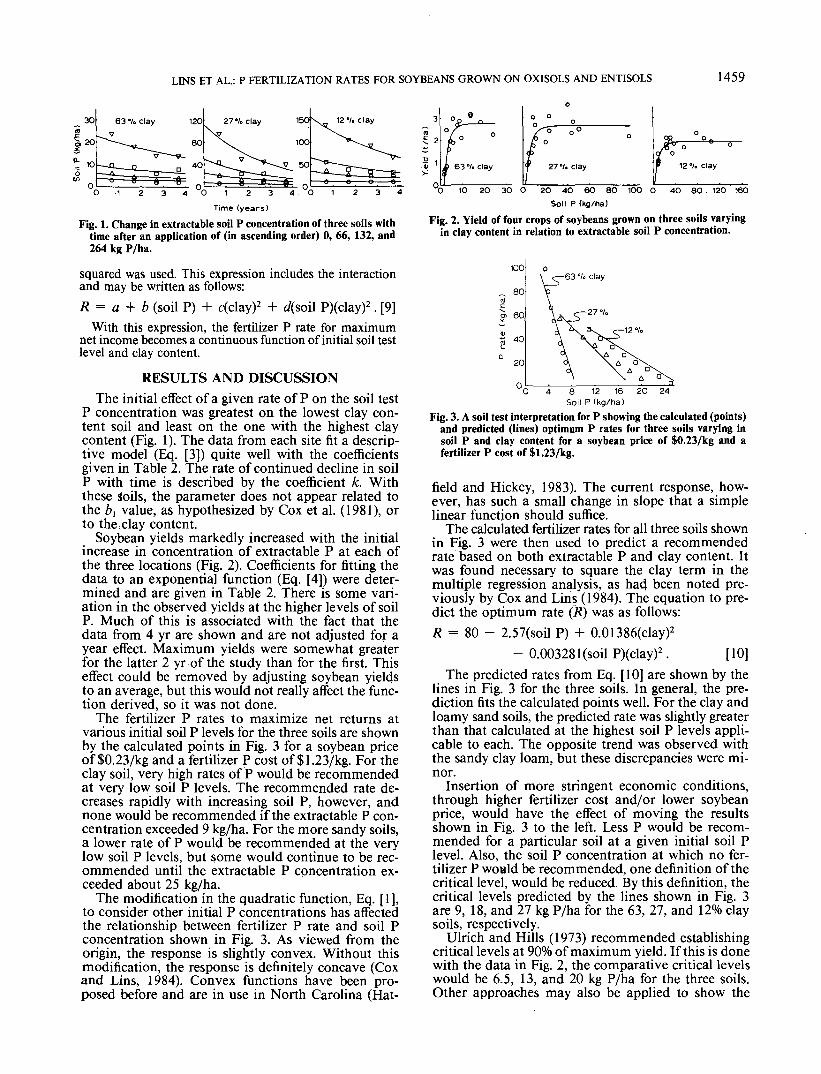
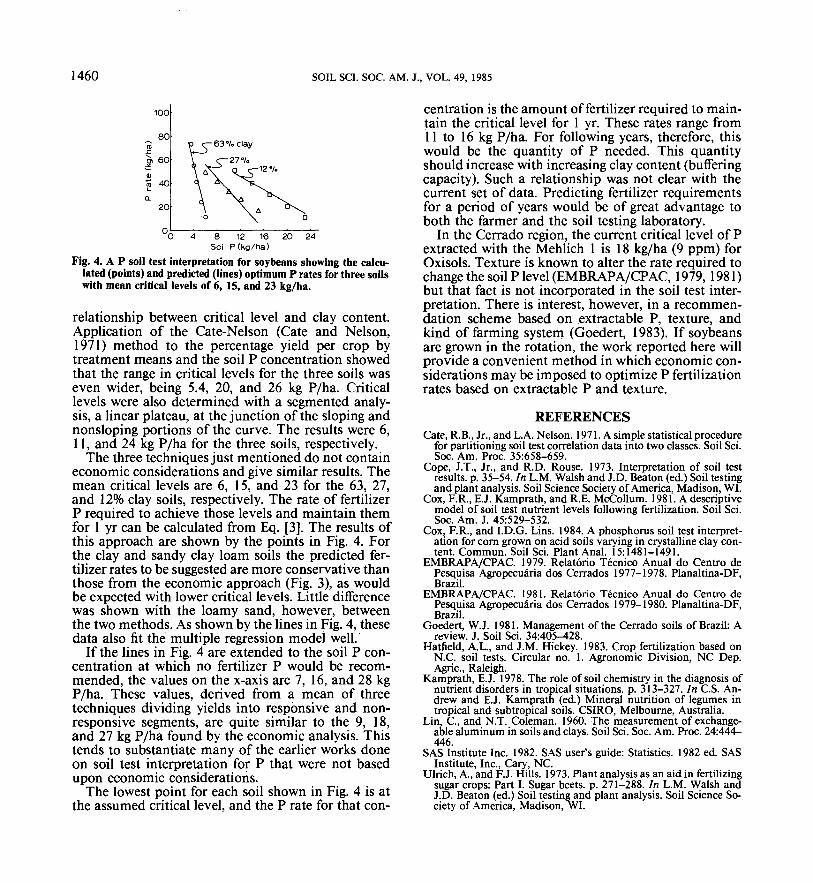
Fig. 4. A P soil test interpretation for soybeans showing the calcu-lated (points) and predicted (lines) optimum P rates for three soilswith mean critical levels of 6, IS, and 23 kg/ha.
relationship between critical level and clay content.Application of the Cate-Nelson (Gate and Nelson,1971) method to the percentage yield per crop bytreatment means and the soil P concentration showedthat the range in critical levels for the three soils waseven wider, being 5.4, 20, and 26 kg P/ha. Criticallevels were also determined with a segmented analy-sis, a linear plateau, at the junction of the sloping andnonsloping portions of the curve. The results were 6,11, and 24 kg P/ha for the three soils, respectively.
The three techniques just mentioned do not containeconomic considerations and give similar results. Themean critical levels are 6, 15, and 23 for the 63, 27,and 12% clay soils, respectively. The rate of fertilizerP required to achieve those levels and maintain themfor 1 yr can be calculated from Eq. [3]. The results ofthis approach are shown by the points in Fig. 4. Forthe clay and sandy clay loam soils the predicted fer-tilizer rates to be suggested are more conservative thanthose from the economic approach (Fig. 3), as wouldbe expected with lower critical levels. Little differencewas shown with the loamy sand, however, betweenthe two methods. As shown by the lines in Fig. 4, thesedata also fit the multiple regression model well.
If the lines in Fig. 4 are extended to the soil P con-centration at which no fertilizer P would be recom-mended, the values on the x-axis are 7, 16, and 28 kgP/ha. These values, derived from a mean of threetechniques dividing yields into responsive and non-responsive segments, are quite similar to the 9, 18,and 27 kg P/ha found by the economic analysis. Thistends to substantiate many of the earlier works doneon soil test interpretation for P that were not basedupon economic considerations.
The lowest point for each soil shown in Fig. 4 is atthe assumed critical level, and the P rate for that con-
centration is the amount of fertilizer required to main-tain the critical level for 1 yr. These rates range from11 to 16 kg P/ha. For following years, therefore, thiswould be the quantity of P needed. This quantityshould increase with increasing clay content (bufferingcapacity). Such a relationship was not clear with thecurrent set of data. Predicting fertilizer requirementsfor a period of years would be of great advantage toboth the farmer and the soil testing laboratory.
In the Cerrado region, the current critical level of Pextracted with the Mehlich 1 is 18 kg/ha (9 ppm) forOxisols. Texture is known to alter the rate required tochange the soil P level (EMBRAPA/CPAC, 1979, 1981)but that fact is not incorporated in the soil test inter-pretation. There is interest, however, in a recommen-dation scheme based on extractable P, texture, andkind of farming system (Goedert, 1983). If soybeansare grown in the rotation, the work reported here willprovide a convenient method in which economic con-siderations may be imposed to optimize P fertilizationrates based on extractable P and texture.