Embed Size (px)
Citation preview

1
Optimizing Mill Effectiveness Through Statistical Process Control (SPC) Kim “Will” Robinson, Ph.D., MBA President and Chief Solutions Officer Process Solutions Group Aurora, Colorado USA 80013 Author’s Business Phone: 01-770-375-1763, email: [email protected]
ABSTRACT
Statistical process control (SPC) is a powerful technique for improving customer satisfaction and mill productivity, while reducing product and process variability and waste. At its foundation, SPC identifies and controls meaningful variables, ensuring processes operate at their fullest potential for the long term.
In the 1980’s the U.S. paper industry attempted to adopt SPC, but most efforts quickly failed. The industry was ill-prepared to sustain it, because there weren’t enough leaders who fully understood SPC and were committed to this approach of continuous improvement for the long term. Corporate leadership and unwavering commitment to leading the charge for the benefit of the customer is the most important element in establishing SPC in an organization. Early efforts lacked that dedication and focus.
SPC identifies special causes, which are variations that happen occasionally and on which an investigator, can take action. Papermakers most often discover the underlying root causes in problems they encounter and eliminate the variation they cause. However, other problems elude skilled operators. Mill teams working together and trained in advanced analytical techniques and using SPC, become skilled in eliminating more challenging sources of variation. They prove effective in getting to root cause and eliminating these special causes. The challenge of process optimization becomes more simplified. The outcome is an increasingly consistent, high-quality product, which elevates customer satisfaction and loyalty.
The objective of this paper is to re-introduce SPC to a new generation of pulp and paper industry leaders, by highlighting SPC’s transformational benefits. Examples and tests will illustrate how this problem-solving method maximizes productivity by eliminating wasteful process variation. It also provides guidance in introducing SPC to an organization: setting realistic expectations, building the pioneering team, establishing systematic expansion, and maintaining momentum through visionary leadership.
Keywords: papermill, continuous improvement, statistical process control, control charts, variation, variability, paper machine, scanner, basis weight, Deming, control charts, analysis, leadership, customer, special, common causes, out-of-control
INTRODUCTION
While statistical process control (SPC) has a long and continuous history in manufacturing worldwide, it never gained momentum in the U.S. pulp and paper sector. If you worked in our industry in the 1980’s, you may have been part of a flurry of classroom and on-the-job training, which taught the fundamentals of SPC. These efforts petered out within 18 months, with just a few mill efforts persisting, as they understood the benefits.
Commentary on the ineffective U.S. industrial efforts to integrate SPC into manufacturing practices suggested common themes:
1. Leadership at the top of organizations gave approval but did not lead it. 2. In a haste to “do something,” the SPC investigation team, tasked to identify and resolve issues, quickly met
a resource limits due to lack of considering of how to sustain it on the plant floor.
2
3. Competing priorities. The fundamental reason to implement SPC is to benefit the customer. This singular focus was lacking because of other competing business metric priorities, such as production and profit targets, etc.
This paper elevates the focus on SPC for the benefit of the pulp and paper industry. As proponents of this method, we will show how to implement SPC in a logical and industry-sensitive way. Also, we will demonstrate the benefits to stakeholders and offer suggestions to make SPC sustainable for the long term. What SPC can do to benefit this industry is nothing short of astounding.
WHAT IS SPC?
SPC is a systematic method for identifying and tracking meaningful and actionable variation. When special variation arises, an immediate response identifies the upstream candidate causes, narrows the cause possibilities, and resolves the problem. This helps an operation attain optimal performance while delivering higher-quality products.
At the heart of SPC is the control and range charts developed by Walter Shewhart in the 1920’s at Bell Labs [1] and popularized when used by Edwards Deming [2] throughout post-war Japan during the 1950s and 60s. In assisting the Japanese, Deming intended develop manufacturing control processes to singularly benefit the manufacturer’s customer [3, 4]. SPC reduces variation in products and highlights new opportunities to make products even more consistent, which further elevates customer satisfaction and loyalty. This singular focus remains the dominant motive behind continuous improvement efforts in Japan.
SPC also reduces the sources of costly manufacturing “rework” and waste. Think of SPC as a method for “draining the swamp”: if one lowers water from a marshy area, it promotes the removal of dangerous creatures that depended on the water (mosquitos, alligators, etc.). Without transformational, long-term solutions - diverting the murky water from the marshland, forces a mill to sell into the off-grade market or re-pulp at a significant loss or suffer the consequences of delivering low-quality product to customers. However, finding effective solutions to mill issues reduces process variation, improving quality. In addition, using the above metaphor, draining the swamp also highlights new obstacles that were heretofore hidden, leading to opportunities for continuous improvement.
Sources of variation
There are two statistically significant sources of process variation: common cause and special cause variation. Common cause variation is generally small and comes from many sources. This variation represents a multitude of mostly continuous process variations such as: raw materials (pulp, voltage changes, climatic conditions, steam pressure, etc.), control devices (inherent error in consistency regulators, pressure transmitters, etc.), and manufacturing methods (operator variation in interpreting and practicing SOPs, decision delays, etc.).
What is “special” about “special causes”? Special cause variation is infrequent and appears when an influence upstream causes strong deviation from norm for the variable of interest. Think of ocean waves. They vary considerably, depending on ambient and climatic conditions. At their calmest, oceans may exhibit <1 ft. (30 cm) waves. However, in a severe storm, those waves could reach 40 ft. (~12 m). In our processes, four or five major factors likely contribute to 30 of the 40 ft. waves in our processes. Examples might include: frequently sticking dilution valves, low or high consistency entering due to difficulties with thick stock dilution entering stock prep, or up-stream temperature shocks due to adding appreciable fresh water, etc. The underlying causes are large and not constant, characterized as a “special” event on control charts. These events tend to stand out and this enables the investigator to determine what factors aligned upstream to cause the special shift in the process.
Confusion exists about special causes in a continuous process. The instances of detectable special cause variation, is that level of variation that exceeds 3 sigma limits, although it might be frequently experienced in a mill’s process. Constructing calculated control limits requires, at a minimum, 30 data points (recommended ~100 data points) from the process. Being “special” means that under normal circumstances, they don’t appear. Thus, the process, under most circumstances, is quite capable of running free of these sources of variation. It is very important to realize that special causes of variation only appear when a set of circumstances create them. That is why they are relatively easy to find and develop a non-capital solution. One only needs to look at contributing forces arising from the 4M’s: man,
3
machine, material, and method, Once the organization eliminates the few larger special causes that exists, they are well on their way to benefiting the customer.
When we substantially reduce the major sources of variation, we can recalculate and narrow the control limits. It is then that the less apparent sources of special cause variation begin to appear. Through the elimination of sources of previously major special causes of variability the narrower control limits. Now being able to see smaller special causes of variation, it is like the swamp metaphor mentioned earlier. Hidden rocks once submerged, become evident.
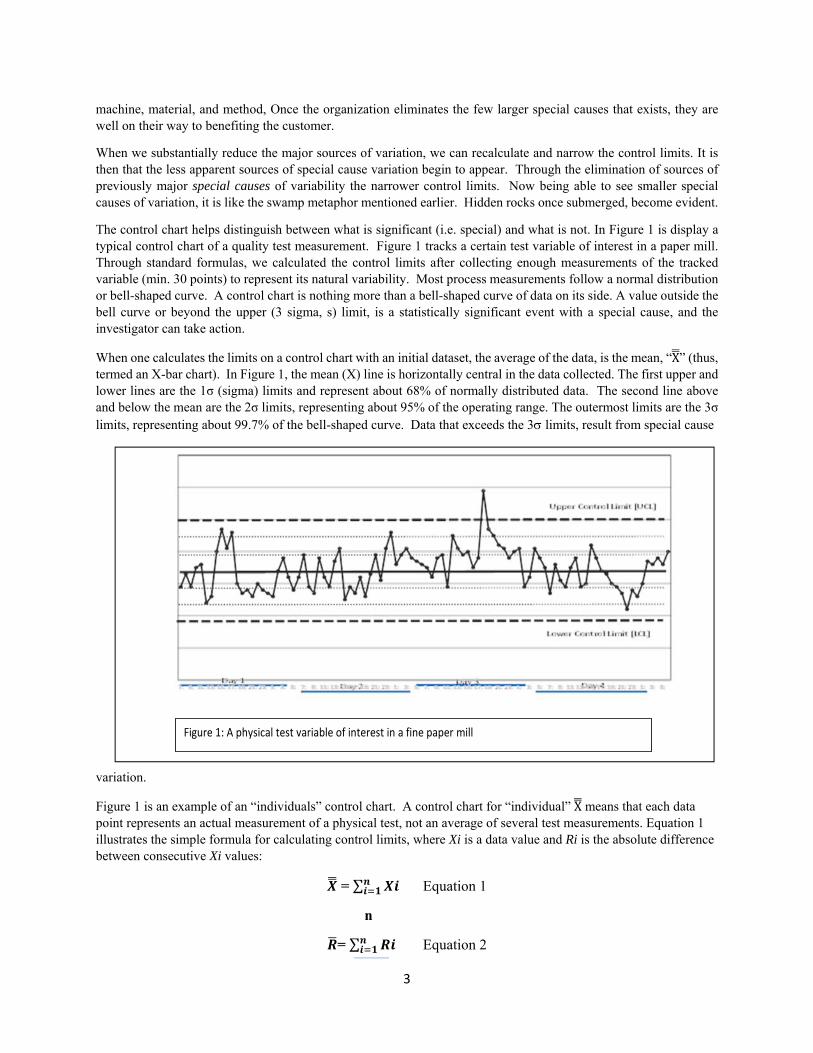
The control chart helps distinguish between what is significant (i.e. special) and what is not. In Figure 1 is display a typical control chart of a quality test measurement. Figure 1 tracks a certain test variable of interest in a paper mill. Through standard formulas, we calculated the control limits after collecting enough measurements of the tracked variable (min. 30 points) to represent its natural variability. Most process measurements follow a normal distribution or bell-shaped curve. A control chart is nothing more than a bell-shaped curve of data on its side. A value outside the bell curve or beyond the upper (3 sigma, s) limit, is a statistically significant event with a special cause, and the investigator can take action.
When one calculates the limits on a control chart with an initial dataset, the average of the data, is the mean, “X” (thus, termed an X-bar chart). In Figure 1, the mean (X) line is horizontally central in the data collected. The first upper and lower lines are the 1σ (sigma) limits and represent about 68% of normally distributed data. The second line above and below the mean are the 2σ limits, representing about 95% of the operating range. The outermost limits are the 3σ limits, representing about 99.7% of the bell-shaped curve. Data that exceeds the 3 limits, result from special cause
variation.
Figure 1 is an example of an “individuals” control chart. A control chart for “individual” X means that each data point represents an actual measurement of a physical test, not an average of several test measurements. Equation 1 illustrates the simple formula for calculating control limits, where Xi is a data value and Ri is the absolute difference between consecutive Xi values:
= ∑ Equation 1
n
= ∑ Equation 2
Figure 1: A physical test variable of interest in a fine paper mill

4
n-1
For control chart for individual X values: For control chart for running ranges:
UCLX = + 2.66 UCLR = 3.27
LCLX = - 2.66 LCLR = 0
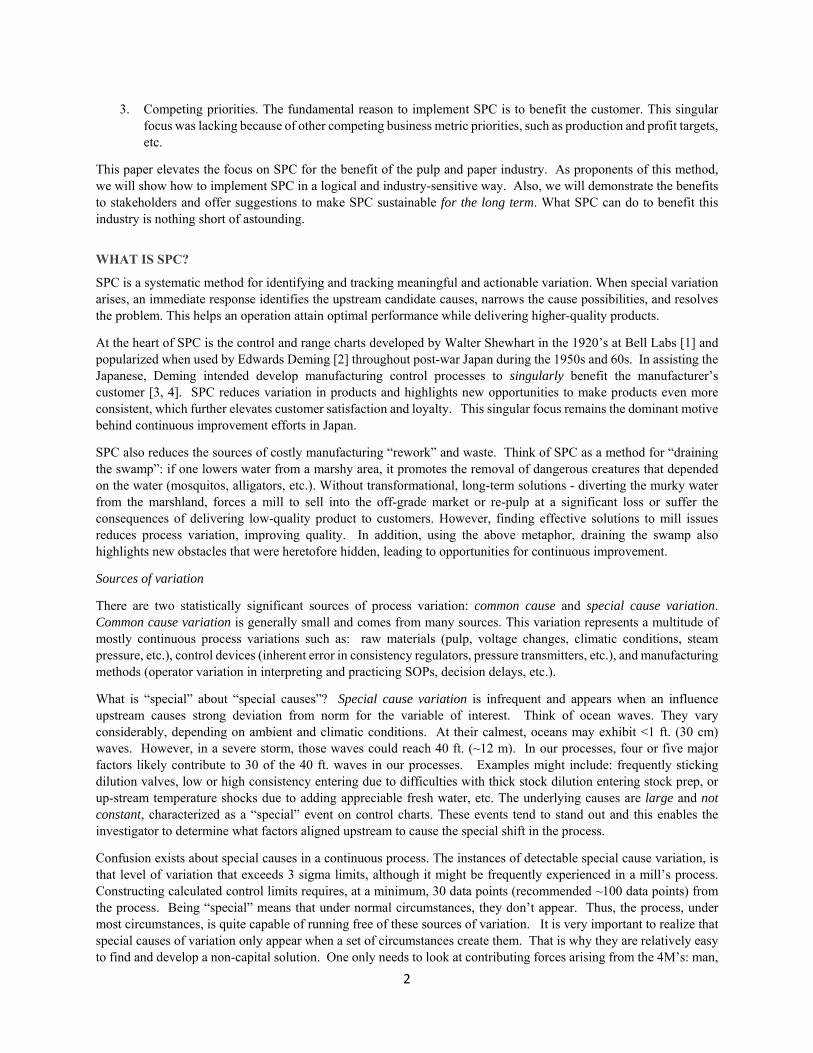
The other chart, equally important to X run charts, is a range chart. This chart detects rapid and unexpected differences from one data point to the next, based on historic data from the process or measurement. Figure 2 uses the same data in Figure 1 to examining the point-to-point change and the “range” between them (see equation 2) in an Rbarchart .
Control charts identify if a “special cause” is taking place. The five basic rules (out of 8) for identifying out-of-control situations are [5]:
Rule 1: One value outside the 3σ control limits Rule 2: Two out of three values between the 2σ and 3σ limits Rule 3: 4 of 5 consecutive points between one and two sigma limits Rule 4: Seven or more consecutive points on one or the other side of the mean Rule 5: Seven consecutive points trending up or down
Figure 2: Range chart of Figure 1’s data showing its physical test value’s upper control limit (UCL)

5
Figure 3 illustrates examples of each of these rules. While this is a brief overview of SPC, the metrics and methodologies are well established, and the conclusions drawn have a robust statistical foundation.
PAPER INDUSTRY IMPLEMENTATION STRATEGIES
The first step in initially integrating SPC methodology in a mill is creating a team of dedicated and vertically aligned employees, from mill operators to senior leadership. This team receives thorough training and preparation in SPC fundamentals.
The initial project should study an area of the operation that clearly benefits the customer. The mill team might choose a process variable or test specification to follow. If the team chooses a test specification, renewed training around that variable with the quality control testers should follow. This ensures all testers are getting the same results. It also increases understanding of the inherent variability in the test procedure. Start small, pick a variable that by the entire mill organization understands. [Note: There are suggestions for possible candidate variables to consideration later in the study.]
After solid success from a few projects, confidence using SPC will grow. The team will help integrate SPC in the remainder of the organization by training the next investigation groups until this shared approach is widespread throughout the mill.
USE OF CONTROL CHARTS
Tracking Variables
Figure 4: Control chart of 3 dry basis weight composites every 15 minutes

6
In a paper mill example, imagine wanting to track via a control chart, basis weight of SBS card stock at the reel. The initial step in the development of a control chart is accumulating 30+ test individuals or average values. In Figure 4, a plot of the average basis weight of three single CD scan showing how these basis weight varies with time. Our variable is a composite of 3 values. Every 5 minutes, the process collects a single scan averaged along with a similar scan at 10 minutes and again at 15 minutes. Each data point represents the average of 3 scans over 15 minutes with n=3.
For control chart for sub-group=3 X values: For control chart for sub-groups =3 running ranges:
UCLX = X + A2 , where A2 = 1.02 UCLR = D4 , where D4 = 2.57
LCLX = X - A2 LCLR = D3 , where D3 = 0
Using Control Charts
One day while using the control chart to track basis weight, the machine tender observed that at 15:30 (Figure 4), an upstream shift in some part of the process, manifested itself at the reel scanner. The process remained well within the control limits Rules surrounding SPC response, guides the operator to not intervene until the process is statistically out of control. About 17:00 a second upstream “event” created a rise in reel basis weight, resulting in an out-of-control point, requiring operator response and investigation. With possible operator intervention at 18:00 through the addition of water upstream, we observe a downward spiral in basis weight, resulting in additional out-of-control events. An investigation concluded that the downward excursion in basis weight was, in fact, due to operator intervention, overshooting dilution water needed.
In Figure 5, a range chart presents the mathematical difference between adjacent 15-minute composite measurements. Compared to the data that initially assisted the operations team to set up the control chart limits, the range chart data shows there are five out-of-control events, not just three different ones that the control chart identified. Figure 6 identifies the location of those corresponding range chart violations on the control chart. While this data suggests 6+
out-of-control events within 8 hours, many likely emanate from the same underlying root cause. [Note: This data represents a worse case example for illustration purposes.]What does the mill do now? The machine tender or team
Figure 5: Range chart of residual alkali values from Figure 4
0
1
2
3
4
5
6
7:00
7:30
8:00
8:30
9:00
9:30
10:00
10:30
11:00
11:30
12:00
12:30
13:00
13:30
14:00
14:30
15:00
15:30
16:00
16:30
17:00
17:30
18:00
18:30
19:00
19:30
20:00
20:30
21:00
21:30
22:00
22:30
23:00
23:30
0:00
0:30
1:00
1:30
2:00
2:30
3:00
3:30
4:00
4:30
5:00
5:30
6:00
6:30
Range Be
twen
Con
secutiv
e Ba
sis W
eight Measuremen
ts, gsm
UCL

7
leader alerts a SPC team member, preferably a player who already has familiarity with this part of the mill process. That team member notifies the whole team and then takes the lead on an investigation of the special cause of variability. By design, we “mirror” the special cause investigation process strikingly like the safety investigation process already at use in the mill (the SPC team designed the investigation format to reflect the safety process during their initial training).
Process Analysis
Prior to this day’s event, the SPC team previously strategized about principal upstream factors that could shift (+/-) basis weight to fast track their initial steps in the investigation. Being prepared, the team already knew the variables to track when a low or high process measurement exceeded limits or violated one of the 5 rules for control and range charts.
Event 1 (15:30): Didn’t by itself create an out-of-control event but may have led to a range chart violation at 16:30 or was the 16:30 excursion a standalone “event” (Figures 4-6).
Event 2: Was there a standalone event (high range value at 17:30 and beyond UCL at 18:00; Figures 4 & 5)? Was automated control suspended in favor of manual control by the operator during any and all events?
Check the DCS for supported and unsupported data (Figure 4). What does the period before 15:00 and after 0:45 tell us about the basis weight stability and process capability (Figure 6)?
Working with operators and management, the team works to first define the root cause and then develop a strategy to soften or eliminate this as a future problem. If several root cause possibilities exist, the team might attempt to re-create one of more possible root causes in a limited way by “pinging” the process for a short time with root-cause like excursions to test these results with the process at steady state.
As an encouragement to anyone wanting to implement SPC in their operations, using Pareto’s 80/20 Rule, experience
suggests there are somewhere around 4-to-5 special cause variables that, once identified, remove >50% of process variation. These initial investigations are essential to open the mill to measuring smaller quality excursions. Customers will begin to see the benefits in product consistency... without a word said.
PROPOSED HONEYMOON PERIOD WITH SPECIAL CAUSE VARIATION
SPC purists demand that all product exhibiting special cause variation is set aside to undergo reworking or discarding. In advance, we hesitantly suggest (with reservations) the mill initially commits to a “softer” scale up approach. If the
Figure 6: Combined control and range chart for out‐of‐control basis weight average scans

8
product exhibits special cause variation yet meets all customer specifications, it sells as “good” product for a specified period. However, because of a new found customer-focus, manufacturing now gives higher value to making a consistent product. Similarly, the root cause investigation pace is aggressive with the resolution of the upstream special cause completed in three to five working days. Again, the customer will shortly realize the benefit of a more consistent process while all the test specifications are in acceptable range.
During this honeymoon period, solving and eliminating large sources of variation will necessitate the mill recalculating control limits for both control and range charts given the then-current reduced level of variability. This continuous assault on variability reflects the mill’s commitment to continuous improvement.
The honeymoon period ends when either the average variation on a major process or test result, clearly defined as a realize quality-improvement of 70% a or a specified period (e.g. 120 days). The mills should expect that out-of-control events are occurring far less frequently. In the early honeymoon phase, the mill earned a “free-pass” on instances of special cause variation. Now, the mill enters a phase where they redefine the standards in how to respond to future special variations to personnel who must manage the SPC process. Therefore, clarity of leaderships communication by about how the organization now responds to out-of-control events leadership is critical.
The biggest problem with the “honeymoon” period is that it condones the mill’s acceptance with out-of-(statistical) control product during SPC’s infancy. Up to this time during the honeymoon period, the SPC effort had softer rules. Now it teeters on the edge, between future success or failure based upon the organization’s response to when future special cause variations occur. It is critical that mill meets special cause investigations with an urgent response reflecting continuous improvement so that SPC reflects a management sanctioned, new way of life.
In discrete parts manufacturing (i.e. car parts, computer parts, etc.), the “bad” parts are determined, pulled from the assembly line, and reworked (replaced as part of an assembly) or discarded. In a paper mill making, product that is in specification but statistically out-of-control, creates a dilemma. How does the organization maintain a sense of commitment to living within statistical control without repulping the affected product or some sort of meaningful consequences?
Creative solutions should reflect the organization’s leadership to maintain integrity around a set of clear, self-imposed “penalty” standards. Leadership commitment is all-important to creating the necessary cultural change that instills SPC methodology as part of the mill’s unwavering commitment. After the honeymoon period, the mill should work with a small select group of major external customers who understand the mill’s commitment to continuous improvement. Thus, for a period (e.g. 6 months) when product specifications are all met but the product is coincident with out-of-control events, both parties agree to a meaningful business concession (e.g. price concession) for the benefit of the customer. This gives the SPC team the drive to continue to aggressively pursue special causes of variation. This commitment to self-discipline will speak volumes to the mill’s organization.
KEY VARIABLE TO TRACK
What consumers like about continuous quality and what drives their purchasing decision is the consistency certain products provide. From famous examples of hamburgers to automobiles to electronics, consistency is critical. Can we wrap all forms of basis weight variability into one variable for the sake of our customer? We think so. Move forward to your paper mill (or final QC test, if you’re a market pulp mill).
The dry end machine scanner creates several machine direction (MD) and cross direction (CD) statistics at the completion of each reel. These describe the variability found in each direction within the reel. One might display these statistics or outputted to a data archive. This represents a singular set of measurements most meaningful to the customer. We have used these statistics to quickly reduce reel variability.
In Figure 7, a control chart of the MDL (machine direction long-term) statistic shows the initial data stability in a mill. There were suspicions that consistency swings from the stock prep area was a contributing cause in the mill’s struggle with quality.

9
The mill displayed the new scanner MDL statistic after each reel on a meter-wide, red LED display in both the mill’s machine room and stock prep area. While control limits with 30 data points provided some guidance, we planned to capture a longer set of baseline data over a 10-day period to assure ourselves that the control and range charts were robust. For the first time in their experience, the stock prep crew could visually assess reel by reel feedback from the machine’s dry-end scanner display and it immediately changed how they managed variability from stock prep.
When we accumulated enough base data and were ready to construct control charts, we already saw a reduction in the MD scanner statistic by 45% as shown in Figure 7. Since the mean values had shifted dramatically, it was necessary to collect even more data to reflect the new reduction in variability, a small price to pay for major improvements in sheet quality. Establishing new control limits, the mill went on to find other “special causes,” further improving converting quality along the way.
LEADERSHIP – THE ESSENTIAL CONTINUOUS IMPROVEMENT INGREDIENT
In the ‘80’s and ‘90’s Japanese leadership provided their commentary on early efforts by U.S. manufacturing firms when attempting to adopt the methodologies around SPC, lean manufacturing, etc. They responded that leadership drive to instill a singular customer focus was widely lacking. At best, they considered Western leadership “distracted” in our cultural approach to “try” quality, while not subordinating competing forces, such as normal measurements of business (e.g. quarterly profits, productivity, etc.). In reflecting on this dilemma, American, Edwards Deming often quoted Ronald Moen who said “Beware of conference-room promises.” [6]
It is the personal, unwavering, long-term commitment of the leadership of the organization, including the board, that will guide the organization on a sustainable quality path – where the journey never ends. Organizations must realize that a dramatic and sustained shift toward customer needs and welfare, are above all other priorities. Satisfying the customer is the business plan and all business activities rise to support it.
When an organization wants to use SPC to guide the quality of their customers’ products, they must:
1. Have the highest level of organizational leadership who fully understand, embrace, and visibly support SPC initiatives. Their passion must be evident and unwavering.
2. Feed off leadership’s passion and clarity of message. Stick to and defend the SPC process when other competing and compelling issues arise.
3. Demonstrate a unique focus to SPC initiatives. While one might think the damage would be minimal, short-term focuses, such as mill site productivity and other such competing traditional business measurements, must be subordinate to the support for and improvement of the process as already evidenced by SPC.
Figure 7: Control chart of dry-end scanner MD basis weight variability statistic for reels of paperboard

10
4. Adjust staff compensation formulas to value full SPC implementation and provide training for individual development.
5. Allow SPC to start in small, targeted areas, tracking variables meaningful to their customer’s success. 6. Allow interest in SPC to grow by word of mouth and through customer feedback. 7. Be quiet / no banners or claiming victory “parades”. Let your customer feedback, albeit delayed, be the wind
in the sails of expanding SPC.
CONCLUSION
It is time for a new generation of paper industry leaders to harness the time-tested power of SPC. Its effectiveness for improving a mill’s product quality leads to a new customer experience due to a yet unrecognized level of sheet quality. Embracing a comprehensive quality process like SPC requires extraordinary leadership to protect the implementation in its infancy and foster its progress for the long-term. SPC sparks employee engagement. The employees develop a higher level of process understanding and build life-long, critical problem-solving skills. Most reductions in variability do not require capital funds. Therefore, implementation of process improvements is rapid and at little cost.
Employing SPC generally takes a short time to see major reductions in special cause variability for both products and processes. Reductions in waste and the costs associated with them are the lasting benefit for both the mill and its customer.
ACKNOWLEDGMENT:
If anyone investigates the history of statistical process control (SPC), one immediately sees the giant, Dr. W. Edwards Deming, a descendant of Massachusetts’ pilgrims, growing up with deep rural Wyoming roots. He brought Walter Shewhart’s Bell Lab fundamental work on control and range charts, to life in a wider manufacturing world. His commitment, belief, and persistence in a yet unrecognized data-driven process, even after massive rejection by American corporations, demonstrated his unwavering example of the “scrappy” leadership we should all emulate. To him, we doff our hats, in respect and admiration. Thank you, Dr. Deming!
REFERENCES:
1. Deming, W. E., Out of the Crisis, MIT Center for Advanced Engineering Study (Press), Boston, Mass, USA (1986).
2. Kilian, C. S., The World of W. Edwards Deming (2nd Ed.), SPC Press, Inc., Knoxville, TN, USA (1992). 3. Liker, J. K., The Toyota Way, McGraw Hill, New York City, NY, USA (2004). 4. Walton, M., The Deming Management Method, Penguin Books, New York City, NY USA (1986). 5. McNeese, W., From: https://www.spcforexcel.com/knowledge/control-chart-basics/control-chart-rules-
interpretation, July 12, 2019. 6. Deming, W. E., Quote attributed to Moen, R. “Out of the Crisis, MIT Center for Advanced Engineering
Study (Press), Boston, Mass, USA (1986).

Optimizing Mill Effectiveness Through Statistical Process Control (SPC)
K. “Will” Robinson, Ph.D., MBAPresident
PROCESS SOLUTIONS GROUP

Common Paper Industry Improvements
Typical Paper Mill Types of Improvements
Process Tuning Solving Process Problems
Tighten Product Specs Recipe Driven Grades
Create Innovative Features Process Inefficiencies
Cap Projects /New Technologies

Common Paper Industry ImprovementsPaper Mill Improvement
Process Stability {$}
Process Savings ($)
Process Payback ROI ($$$)
Benefit Customer
(‐$$)
Reduced waste ($)
Waste & Niche Mkt (‐/+$)
Type of Improvement
Process Tuning
Process Inefficiencies
Cap Projects /New Technologies
Solving Process Problems
Tighten Product Specs
Recipe Driven Grades
Create Innovative Features

Common Paper Industry ImprovementsPaper Mill Improvement
Process Stability
Process Savings ($)
Process Payback ROI
Benefit Operations
Cost Mill
Reduced Waste
Waste & Niche Mkt
Customer’s Product View
Minimal / Undetectable
Minimal
Maybe Mkt Features
Return to Norm
Fix inadequacies of Product
Uniformity Order to Order
Customer Benefit
Type of Improvement
Process Tuning
Process Inefficiencies
Cap Projects /New Technologies
Solving Process Problems
Tighten Product Specs
Recipe Driven Grades
Create Innovative Features

Result of Paper Industry Improvements
Process Improvements
OVERWHELMINGLY benefit Mill ($$$)
Process Improvements
UNDERWHELMINGLY benefit Customer ($)
Product Improvements
Improves marketability ($)
Product Improvements
Product feature’s for our customer’s
customer ($$)
WE PRACTICE SPORADIC IMPROVEMENT, NOT CONTINUOUS IMPROVEMENT

Result of Paper Industry Improvements
WE PRACTICE SPORADIC IMPROVEMENT, NOT CONTINUOUS IMPROVEMENT
Name another recent industry that has flourished with this strategy?
There is a BETTER approach that will focus on our customer’s needsAND bring greater profitability to the Mill
BUT YOU CANNOT ASK: “WILL THE CUSTOMER PAY FOR IT?” (Wrong Q!)Let me explain…

History of Statistical Process Control [SPC] in the U.S.• Introduced in early 1980s & a flurry of initial response
• Plans of how to manage SPC were not thought out
• SPC largely formatted for “parts” mfg. NOT continuous process
• Leadership had not counted the cost
• Rapid disengagement
Source: Frankensteincoursework.x.fc2.com
+?=

What is
What is Statistical Process Control (SPC)?

SPCA systematic method for identifying and
eliminating meaningful and actionable variation

SPC BasicsFilter on variation
• Important to customers
• We can effect and eradicate
Two kinds of process variability: • Common cause
• Special cause
Data collection on one or a few important process variables:• Control chart
• Range chart
Fundamentally sound approach – world‐wide, across many industries

Tools Used in SPC

8
9
10
11
12
13
14
15
Upper Control Limit [UCL]
Day 1 Day 3
Typical Statistical Process Control Chart for Individuals
1
1
2
2
X
Day 2 Day 4
Lower Control Limit [LCL]

Day 2Day 3
Day 4
Upper Range Limit [URL]
Typical Statistical Process Range Chart for Individuals
7: 9: 11: 13: 15: 17: 19: 21: 23: 1: 3: 5: 7: 9: 11: 13: 15: 17: 19: 21: 23: 1: 3: 5: 7: 9: 11: 13: 15: 17: 19: 21: 23: 1: 3: 5: 7: 9: 11: 13: 15: 17: 19: 21: 23: 1: 3: 5:
Day 1

10
11
12
13
14
LCL
1
Rule 2: 2 of 3 Points in 3 range
Rule 4: 7 or more pointon one side of mean
Rule 3: 4 of 5 consecutive points between 1‐ 2 range
Rule 1: 1 point beyondupper or lower limit
Zones
A
B
Figure 3: Control Chart of Physical Test data illustrating 5 types of Out—of‐ Control Situations
UCL
1
2
2Rule 5: 7 or morepoints trending up or downA
C
B
When is Your Process Out of Control?

Applying SPC in Processes

Example: Continuous Digester Residual Effective Alkali Strength
Auto sampled at exit of cooking zone
Stream Sampling Rate: Each 5 minutes
Display Composite Rate: Each 15 minutes, n = 3
Graphic Source: www.yokogawa.com

12
14
16
18
20
22
24
26
28
30
32
Residual (Effective) Alkali Value g/l as NaO
H
8.5 hour lag time between whiteliquor addition and residual
alkali testing
UCL
LCL
Responding to a Special Cause Event on Control ChartMeasurement of Residual Alkali

Slide 17
WR1 Will Robinson, 4/11/2021

0
1
2
3
4
5
6
7
8
9
10
Ran
ge Between Consecutive Effective Alkali Tests
UCL
Out‐of‐ControlRange Chart
Points
No Out‐of‐Control found in a Range Chart of Same ProcessMeasurement of Residual Alkali

Where to begin SPC?
SPC Implementation

Candidate Mill Variable for Consideration
SPC starts with the customer!
Recommendation: Consider machine‐direction, dry‐end scanner statistics (MDL or MDS)
• Basis weight variability has the greatest impact on product uniformity
• MDL or MDS is process‐comprehensive measurement for each reel (MD Long [>10 min] or MD Short [>10 min] variance)

0
2
4
6
8
10
12Before operator
attention Stock prep operators responding to
scanner feedback
Machine Operators "Learning"further control
strategies
LED displayinstalled in
stock prep and machine areas of MDL scanner
statistic Reels Made
MDL Scan
nerStatistic
Machine operators joining thechallenge
Recycled Mill Example Using MDL Scanner Statistic BEFORE Starting SPC

The Essential Ingredient LEADERSHIP
• Driven by senior leadership • Responsible for the “system”
• The “system” is redesigned to serve the customer
• Trust in the process ‐ Continually focused and involved
• Defend against competing priorities
• Humility

Change is inevitable
Our industry’s reaction in 1980 has no bearings on our actions today
We are now competing on a world stage where we can no longer write the playbook
Those that continuously reduce their product’s variability will win Customer loyalty – make the customer successful
Ridding of “waste” – Customer and mill become more productive
Run more stably – Customer and mill become more profitable

The road to the future lays before us… and splits into three paths
Status QuoQuality “Lite”
Customer‐FocusedSPC

Journey Down the Center Path –embracing SPC as a customer‐driven process
Cultural change will be non‐negotiable [i.e. safety] The activities of most people in the organization will
change; safety disciplines are very similar Leadership will continue to hone the “system” and
operations will allow the “system” reduce variation for the customer
A never‐ending improvement, profitable and productive effort

The Road Our Industry must take, lays before us
•Will Customers pay for our efforts? ( to )
•We must become far‐more “customer‐centric”
• Leadership at all levels must embrace the process
•We must trust the process, keeping true to our path

Gateway to the Future
Our Future is SPC
You are invited to become part of it